Embed Size (px)
Citation preview
1
Article
Associations of maternal type 1 diabetes with childhood adiposity and metabolic health in the offspring: a
prospective cohort study
Anitha Pitchika1,2
, Manja Jolink1,2
, Christiane Winkler1–3
, Sandra Hummel1–3
, Nadine Hummel1,2
, Jan Krumsiek4,5
,
Gabi Kastenmüller6, Jennifer Raab
1,2, Olga Kordonouri
7, Anette-Gabriele Ziegler
1–3 and Andreas Beyerlein
1,2,4
1. Institute of Diabetes Research, Helmholtz Zentrum München, Munich-Neuherberg, Germany
2. Forschergruppe Diabetes, Technical University Munich, Klinikum rechts der Isar, Munich-Neuherberg,
Germany
3. Forschergruppe Diabetes e.V., Helmholtz Zentrum München, Munich-Neuherberg, Germany
4. Institute of Computational Biology, Helmholtz Zentrum München, Munich-Neuherberg, Germany
5. German Center for Diabetes Research (DZD), Munich-Neuherberg, Germany
6. Institute of Bioinformatics and Systems Biology, Helmholtz Zentrum München, Munich-Neuherberg, Germany
7. Kinder- und Jugendkrankenhaus AUF DER BULT, Hannover, Germany
Anette-Gabriele Ziegler and Andreas Beyerlein are joint senior authors.
Corresponding author: Anette-Gabriele Ziegler, Helmholtz Zentrum München – German Research Center for
Environmental Health, Institute of Diabetes Research, Ingolstädter Landstraße 1, 85764 Munich-Neuherberg,
Germany
email [email protected]
Received: 15 January 2018 / Accepted: 13 June 2018
2
Abstract
Aims/hypothesis Exposure to an intrauterine hyperglycaemic environment has been suggested to increase the
offspring’s later risk for being overweight or having metabolic abnormalities, but conclusive evidence for
pregnancies affected by maternal type 1 diabetes is still lacking. This study aims to analyse the relationship
between maternal type 1 diabetes and the offspring’s metabolic health and investigate whether birthweight and/or
changes in the offspring’s metabolome are in the potential pathway.
Methods We analysed data from 610 and 2169 offspring having a first-degree relative with type 1 diabetes from
the TEENDIAB and BABYDIAB/BABYDIET cohorts, respectively. Anthropometric and metabolic outcomes,
assessed longitudinally at 0.3-18 years of age, were compared between offspring of mothers with type 1 diabetes
and offspring of non-diabetic mothers but with fathers or siblings with type 1 diabetes using mixed regression
models. Non-targeted metabolomic measurements were carried out in 500 individuals from TEENDIAB and
analysed with maternal type 1 diabetes and offspring overweight.
Results The offspring of mothers with type 1 diabetes had a higher BMI SD score (SDS) and an increased risk for
being overweight than the offspring of non-diabetic mothers (e.g. OR for overweight status in TEENDIAB 2.40
[95% CI 1.41, 4.06]). Further, waist circumference SDS, fasting levels of glucose, insulin and C-peptide, and
insulin resistance and abdominal obesity were significantly increased in the offspring of mothers with type 1
diabetes, even when adjusted for potential confounders and birthweight. Metabolite patterns related to androgenic
steroids and branched-chain amino acids were found to be associated with offspring’s overweight status, but no
significant associations were observed between maternal type 1 diabetes and metabolite concentrations in the
offspring.
Conclusions/interpretation Maternal type 1 diabetes is associated with offspring’s overweight status and metabolic
health in later life, but this is unlikely to be caused by alterations in the offspring’s metabolome.
Keywords: Birthweight, Maternal type 1 diabetes, Offspring metabolic health, Offspring metabolome, Offspring
overweight
Abbreviations: BCAA: Branched-chain amino acid; DII: Dietary inflammatory index; SDS: Standard deviation
score

3
Tweet: Maternal #T1D is associated with excess weight and poor metabolic health in later life in offspring, but
unlikely to be caused by alterations in offspring #metabolome
Research in context
What is already known about this subject?
Intrauterine exposure to hyperglycaemia is likely to influence the offspring’s later risk for being
overweight or having metabolic abnormalities, but conclusive evidence for pregnancies affected by
maternal type 1 diabetes is still lacking
Most previous studies on maternal type 1 diabetes were cross-sectional in design, limited in sample size
and assessed children in different age groups; potential pathways were barely investigated
What is the key question?
Do offspring exposed to maternal type 1 diabetes in utero have an increased risk of being overweight or
having metabolic abnormalities later in life, and by which pathways?
What are the new findings?
Children exposed to maternal type 1 diabetes during pregnancy have a higher risk for being overweight
and worse metabolic health during childhood and adolescence, independent of relevant confounders such
as diet
While increased birthweight partly explains this association, changes in the offspring’s metabolomic
profile are unlikely to be in the causal pathway
How might this impact on clinical practice in the foreseeable future?
Although not yet recognised as a particular risk group, children whose mothers have type 1 diabetes seem
to need closer attention with respect to excess weight gain and metabolic risk in later life
4
Introduction
Obesity and excess weight in children and adolescents remain a major public health problem because it induces
other metabolic disorders, such as diabetes and cardiovascular disease [1]. A growing body of evidence supports
the concept of fuel-mediated teratogenesis, in which intrauterine exposure to hyperglycaemia leads to excess fetal
glucose and insulin, and thus overgrowth of the fetus [2]. These exposures during fetal life have been reported to
extend beyond the neonatal period and influence metabolic complications in later life.
Various studies have shown evidence associating gestational diabetes and type 2 diabetes with later
adiposity, increased BMI, insulin resistance, impaired glucose tolerance, higher cholesterol, hypertension and type
2 diabetes in the offspring [3-6], but less evidence exists to support a similar effect of maternal type 1 diabetes on
offspring health. However, it appears relevant to differentiate between type 1 diabetes, gestational diabetes and
type 2 diabetes, because the last two are associated with maternal obesity, while type 1 diabetes is not. Studies
which reported a positive association of maternal type 1 diabetes with BMI or metabolic outcomes in the offspring
[7-10] were cross-sectional in design and limited with respect to their sample size (n<600 in each). Furthermore,
two of these studies were based on children born as early as 1978-1985 [7] and 1982-1991 [10], respectively, when
diabetes care in pregnant women was probably less good than nowadays [11]. Previous analyses of our own data
indicated that children with non-diabetic and type 1 diabetic mothers follow different growth patterns [12, 13], and
also that a potential association between maternal type 1 diabetes and risk of being overweight in the offspring is
not independent of birthweight and breastfeeding duration [14].
Here, we analysed data from two prospective cohort studies containing over 2770 children of whom more
than 1,500 were exposed to maternal type 1 diabetes during pregnancy. A subset of 500 children were also
characterised for non-targeted metabolomics; these are of particular interest as recent studies have shown
significant associations between metabolic concentrations and childhood obesity [15-17], while the associations
between maternal type 1 diabetes and metabolic profile in the offspring have not yet been investigated. The aims of
this study were to investigate: (1) whether there are differences in anthropometric and metabolic outcomes between
offspring of mothers with type 1 diabetes and non-diabetic mothers; and (2) whether birthweight and/or changes in
the offspring’s metabolome may be in the potential pathway from maternal type 1 diabetes to later overweight and
poor metabolic health in the offspring.
Methods
Our analysis was based on the prospective German cohorts TEENDIAB and BABYDIAB/BABYDIET. These
cohorts include children with a familial background of type 1 diabetes and have already been combined for other
research questions [18, 19]. All parents gave written informed consent for participation. The studies were approved
by the ethical committees of the Technische Universität München (number 2149/08) and Hannover Medical
5
School (number 5644); the Bavarian General Medical Council (number 95357) and Ludwig-Maximilians
University (number 329/00), respectively.
TEENDIAB study
The TEENDIAB study is a prospective cohort study conducted in the cities of Munich and Hannover, Germany.
During 2009-2015, this study recruited 610 children aged 6-16 years who were resident in Germany and had at
least one parent or sibling with type 1 diabetes [20]. Children were followed, on average, every 6 months from 6 to
18 years of age until 2016.
Maternal characteristics and offspring measurements At the first visit, information on type 1 diabetes, smoking
status and education level of the parents as well as monthly family income was obtained via self-administered
questionnaire. Birthweight information was taken from health records collected during the well-baby preventive
health programme, which is routinely offered to all children in Germany. During each visit, weight was measured
digitally or using a beam scale with a precision of ± 100 g in light clothing. Height was measured using a
stadiometer with a precision of ± 1 mm. Waist circumference was measured using a measuring tape between the
pelvic crest and the lower ribs while breathing with a precision of ± 1 mm. Subscapular and triceps skinfold
thickness were measured three times using a caliper at the inferior angle of the right scapula and at the posterior
right upper arm, respectively, and were calculated as the average of the three measurements. Systolic and diastolic
blood pressure were calculated as the average of two measurements, made using the auscultatory or oscillometric
method and the upper arm, with the individual in a sitting position after 3-5 mins of rest. Tanner’s staging was
assessed by the study doctor or local paediatrician using validated questionnaires [21]. Venous blood samples were
collected to assess fasting blood glucose, insulin and C-peptide, and lipids (cholesterol and triacylglycerols). All
participants were asked to fast for at least 10 h before blood collection.
Dietary intake was assessed in 330 children during their first study visit using two different methods. In
268 children, Diet Interview Software for Health Examination Studies Junior (DISHES Junior; Robert Koch
Institute, Berlin, Germany), computer-assisted interview software, was used to assess retrospectively the
frequency, type and quantity of foods and beverages consumed in the last 4 weeks. In the remaining 62 children,
diet was assessed using a 3 day dietary record which was entered into PRODI (Nutri-Science, Stuttgart, Germany)
nutrition software. Both software packages are linked to the German Nutrient Database
(Bundeslebensmittelschluessel; Max Rubner Institut, Karlsruhe, Germany), which allows estimates to be made of
the average daily intake of energy, macronutrients and micronutrients.
Metabolomic profiling Non-targeted metabolomic profiling was performed on fasting serum samples taken from
500 children at the first visit using ultra high-performance liquid chromatography and mass spectrometry on the
Metabolon platform (Metabolon, Durham, NC, USA). All samples were stored at −80ºC prior to analysis.
Metabolites were identified following the metabolomics standardisation initiative guidelines [22]. Metabolites
were quantified as outlined previously [23]. A total of 575 metabolites were quantified, of which 239 were
6
unknown. Metabolites and samples which had more than 30% missing values were excluded, leaving a total of 441
metabolites, including 294 known and 147 unknown ones, and 485 samples. Metabolite concentrations in terms of
raw ion counts were normalised to account for run-day differences and log-transformed to bring them closer to a
normal distribution. Missing data were imputed using random forest imputation.
BABYDIAB/BABYDIET studies
The BABYDIAB and BABYDIET studies are two ongoing prospective studies of German birth cohorts; they
include 2441 children born between 1989 and 2006 with a first-degree relative with type 1 diabetes. During 1989-
2000, a total of 1650 offspring of individuals with type 1 diabetes were recruited for the BABYDIAB study.
During 2000-2006, 791 additional offspring or siblings of individuals with type 1 diabetes were screened in the
context of the BABYDIET study. Of those, 150 participated in the BABYDIET dietary intervention study
randomising the timing of first gluten exposure; the intervention had no effect on islet autoimmunity development
or on growth [24, 25]. Further details on the study design are described elsewhere [24, 26, 27]. Data from these
two cohorts were combined for longitudinal analyses of maternal type 1 diabetes and anthropometric outcomes in
the offspring.
Maternal characteristics and offspring measurements Information on the presence of type 1 diabetes within the
family (mother, father or sibling) and smoking status of the mother during pregnancy was obtained via self-
administered questionnaire. Height and weight measurements of the offspring were obtained from health records
from the well-baby preventive health programme visits, which were regularly conducted at birth and at the age of
3-10 days, 4-6 weeks and 3–4, 6–7, 10–12, 21–24, 46–48 and 60–64 months. Further height and weight
measurements were assessed during study visits, which were scheduled at birth, age 9 months and at 2, 5, 8, 11, 14,
17 and 20 years of age in BABYDIAB, as well as 3-monthly from birth until the age of 3 years, and yearly until
the age of 12 years in BABYDIET. These measurements were performed in the same way as described for the
TEENDIAB study. From the age of 8 years, Tanner’s staging was assessed by a paediatrician or trained staff using
validated questionnaires at every study visit.
Exclusions We excluded from our analysis the data from BABYDIAB/BABYDIET participants who had no
height and weight measurements (n=14), were lost to follow-up after 0.3 years of age (n=44), or who also
participated in the TEENDIAB study (n=214), leaving a final sample size of n=2169. We further excluded all
visits performed before 0.3 years of age because these measurements were likely to be highly correlated with
birthweight, which we wanted to investigate separately.
Statistical analysis
Height, weight, BMI, waist circumference, subscapular and triceps skinfold thickness and lipids were transformed
into age- and sex-specific SD scores (SDSs), and blood pressure into age-, sex- and height-specific SDSs
according to German reference values [28-30]. Overweight was defined as a BMI at or above an SDS of 1.31,
7
corresponding with the 90th percentile. For waist circumference SDS, the respective reference percentiles were
available for only participants aged between 11 and 18 years. Abdominal obesity was defined as a waist
circumference at or above the 90th percentile or the adult threshold of the International Diabetes Federation [31].
Birthweight was transformed into age- and sex-specific percentiles based on German reference values [32], and
categorised as small for gestational age (birthweight < 10th percentile), appropriate for gestational age (10–90th
percentile) or large for gestational age (> 90th percentile). Participants were classified as having high overall
metabolic risk at a certain visit when at least one SDS of BMI, waist, skinfold thickness, blood pressure or lipids
was greater than 1.5. Insulin resistance was estimated by HOMA-IR [33].
To adjust for potential confounders, categories of socioeconomic status (high, middle and low) were
calculated based on parental education and family income as described previously [34]. Energy intake was
adjusted for age and sex using the residual method [35]. Further, an energy-adjusted dietary inflammatory index
(DII) score was calculated based on 27 out of a possible 45 food variables as described elsewhere [36]. A positive
DII score indicates a pro-inflammatory diet, whereas a negative DII score indicates an anti-inflammatory diet.
Maternal type 1 diabetes and metabolic outcomes in the offspring In all our analyses, we compared offspring
of mothers with type 1 diabetes with offspring who had mothers without diabetes, but fathers or siblings with type
1 diabetes. We did this separately for TEENDIAB and BABYDIAB/BABYDIET because the studies differed in
the number of outcomes assessed and the timing of the respective measurements. First, anthropometric and
metabolic outcomes were visually compared at yearly time intervals between offspring of mothers with and
without type 1 diabetes. Second, linear and logistic mixed-effect models accounting for repeated observations
within individuals were performed. Fasting glucose, insulin and C-peptide as well as HOMA-IR were log-
transformed because of non-normal residuals in the respective linear models. Associations were analysed based on
stepwise adjustment. In the first model, we performed univariate analysis for all outcomes. Consistent with other
studies [8], we adjusted for age and sex (except for the SDS-corrected outcomes) as well as for Tanner’s staging in
the second model, and additionally for socioeconomic status and maternal smoking, which are known to be
potential risk factors for excess weight gain in childhood [37, 38]. In order to investigate whether birthweight was
in the causal pathway from maternal type 1 diabetes to overweight status and metabolic risk in the offspring,
birthweight was added as a categorical variable in the third model.
Sensitivity analyses As a first sensitivity analysis, we excluded all children who developed type 1 diabetes during
follow-up (8/610 in TEENDIAB and 100/2169 in BABYDIAB/BABYDIET), and reassessed the associations
between maternal type 1 diabetes and offspring metabolic outcomes. Second, we compared anthropometric
outcomes from the offspring of mothers with type 1 diabetes and fathers with type 1 diabetes separately from those
for offspring whose parents did not have type 1 diabetes to see whether parental genetic transmission may also be a
relevant factor in addition to intrauterine hyperglycaemia. Children who had both parents with type 1 diabetes were
not considered in this analysis. Third, we further investigated cross-sectional associations after adjustment for daily
8
energy intake and DII separately in two different models in addition to Tanner’s staging, socioeconomic status and
maternal smoking. Fourth, we analysed BMI, weight and height outcomes (not SDS transformed) by adding
interaction terms between maternal type 1 diabetes status and child’s age in the combined TEENDIAB and
BABYDIAB/BABYDIET cohort data to explore whether the association changed with increasing age.
Analyses of metabolomic profiles We further explored the extent to which the offspring’s metabolomic profile
may play a mediating role in the association between maternal type 1 diabetes and being overweight. First, we
examined associations between every single metabolite concentration and being overweight in the offspring
assessed at the same visit using logistic regression models. The Benjamini–Hochberg procedure was used to
control the false-discovery rate based on 441 tests in order to account for multiple comparisons. Further, principal
components analysis with varimax rotation was performed on the 441 log-transformed metabolites to consolidate
them into 15 principal components with eigenvalues > 5, which accounted for 43% of the variance in metabolites;
the associations between these 15 principal components and being overweight in the offspring were analysed.
Second, we investigated whether maternal type 1 diabetes was associated with principal components or metabolites
that were significant for overweight status, adjusted for age and sex. Third, associations between maternal type 1
diabetes and overweight status in the offspring were assessed after adjusting for metabolites or principal
components which were significantly associated with being overweight. In addition, metabolite concentrations
were categorised into 68 sub- and eight superpathways [23]. For each super- and subpathway, the mean of the
metabolites belonging to that particular pathway was calculated for all samples and associated with offspring
overweight status and maternal type 1 diabetes.
Results were reported as absolute change with 95% CI for SDS outcomes, per cent change with 95% CI for log-
transformed outcomes and as OR with 95% CI for risk of being overweight and having metabolic abnormalities
between offspring of type 1 diabetic and non-diabetic mothers. All analyses were carried out using SAS 9.4 (SAS
Institute, Cary, NC, USA) and R 3.4.1 (http://cran.r-project.org).
Results
The study participants in TEENDIAB and BABYDIAB/BABYDIET had a median follow-up of 3.0 and 10.7
years, respectively, which corresponds to a median of six follow-up visits (TEENDIAB range 1-13;
BABYDIAB/BABYDIET range 1-18) resulting in 3,583 and 13,235 observations in the TEENDIAB and
BABYDIAB/BABYDIET cohorts, including 257 (42%) and 1,287 (59%) children of mothers with type 1 diabetes,
respectively (Table 1). The age of enrolment and follow-up duration were not significantly different between
offspring of type 1 diabetic and non-diabetic mothers in either cohort (p>0.90 each; Mann–Whitney U test).
Maternal type 1 diabetes and metabolic outcomes in the offspring
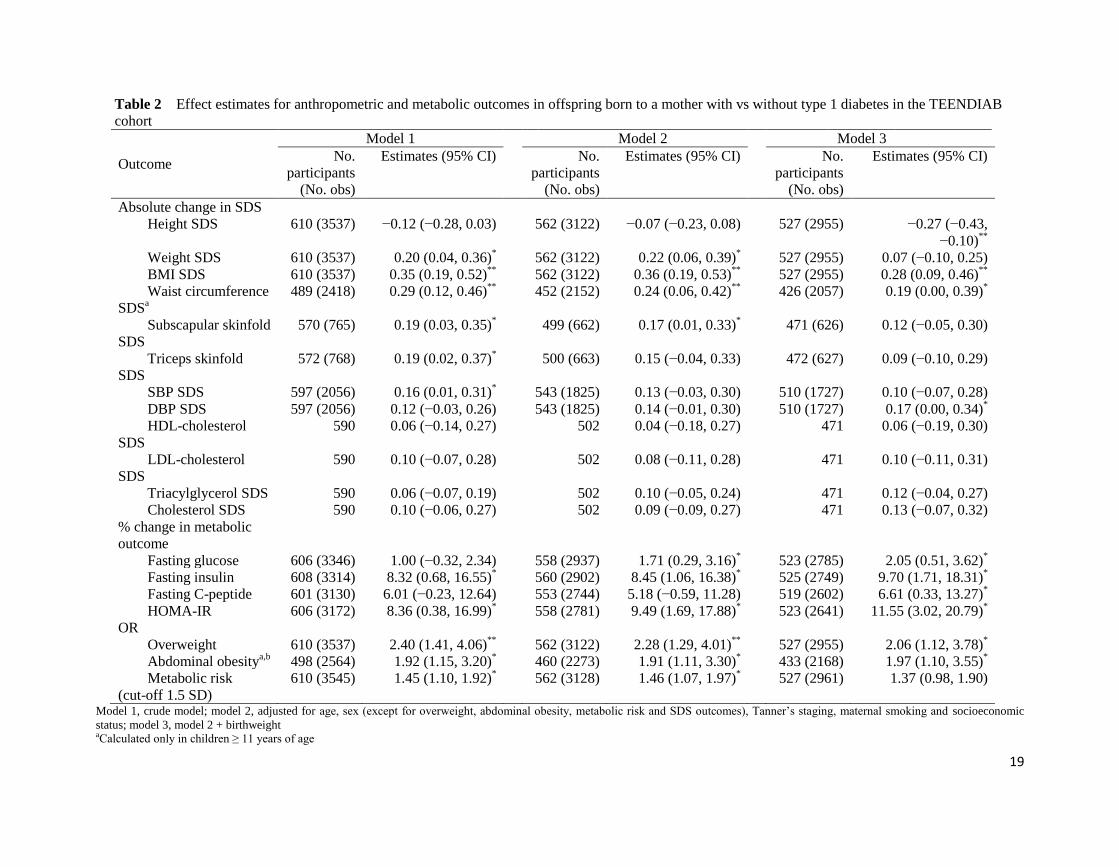
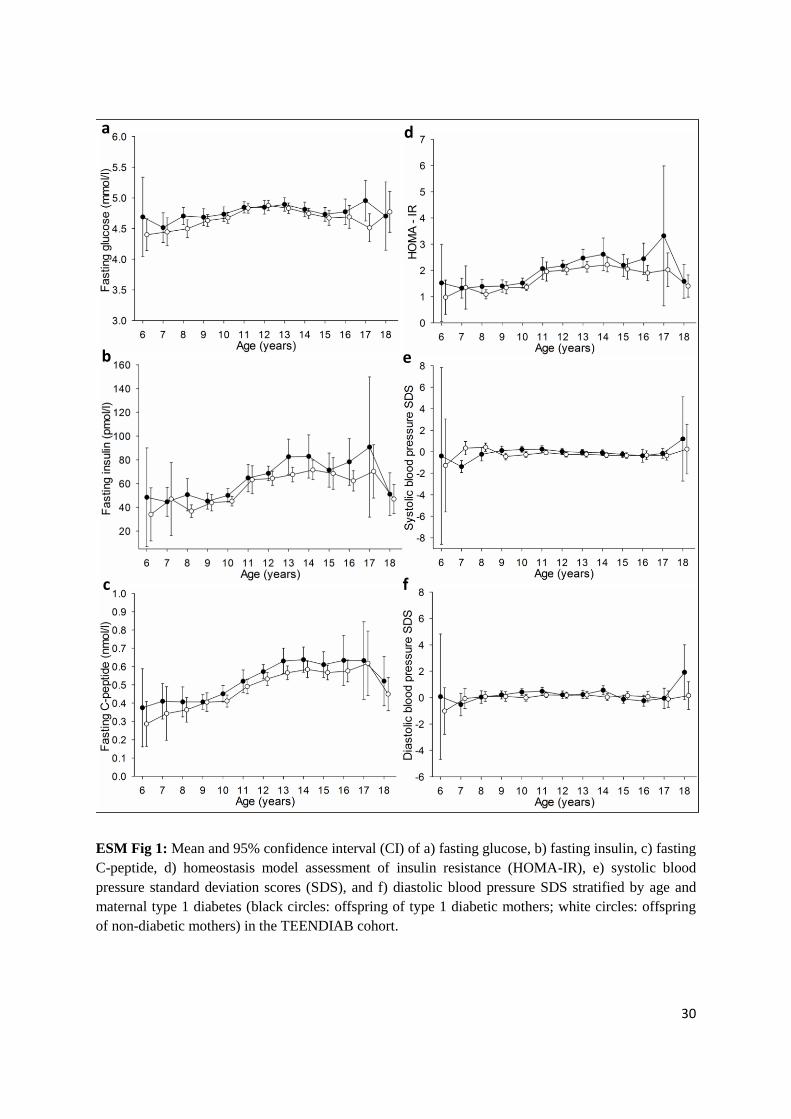
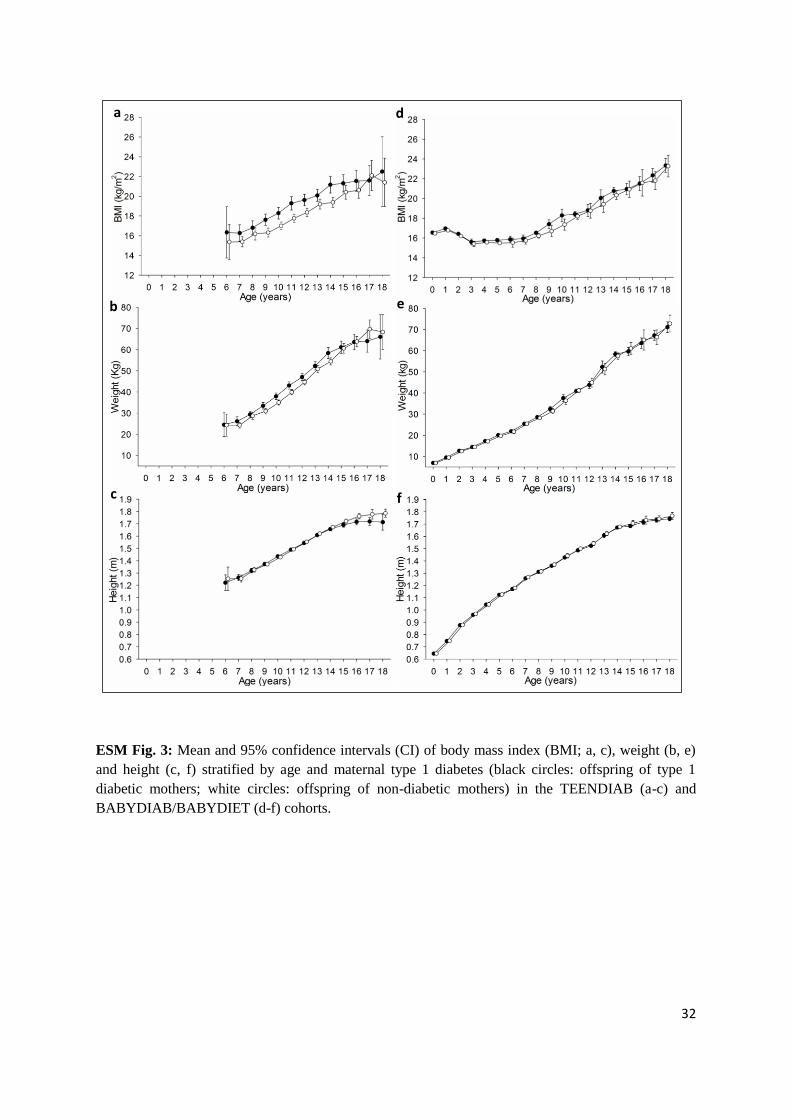
In TEENDIAB, we observed a pattern of higher BMI SDS, weight SDS, fasting levels of glucose, insulin and C-
peptide as well as insulin resistance, and of lower height SDS in offspring of mothers with type 1 diabetes in most
9
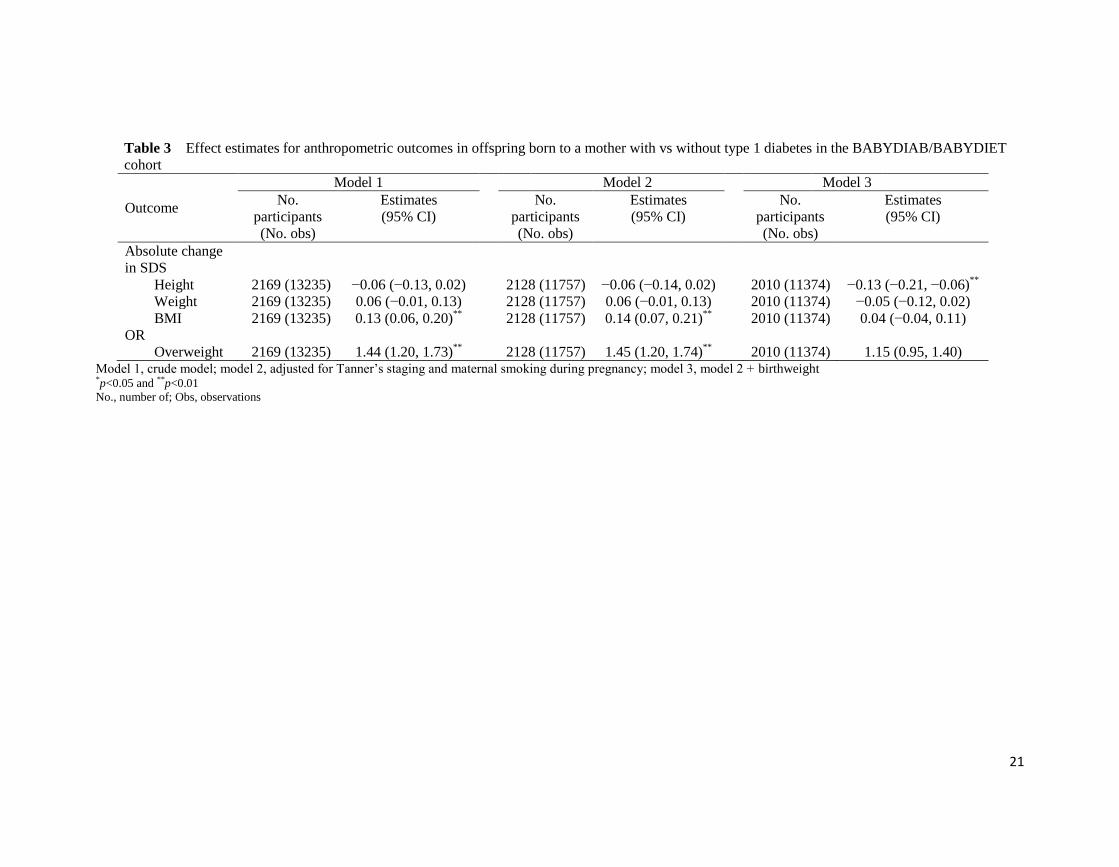
age groups (Fig. 1 and electronic supplementary material [ESM] Fig. 1). In BABYDIAB/BABYDIET, the
anthropometric associations were similar, but weaker and less consistent. However, in mixed models based on all
longitudinal measurements significant associations were observed in both cohorts: offspring of mothers with type 1
diabetes had a significantly higher BMI SDS (TEENDIAB 0.35 [95% CI 0.19, 0.52]; BABYDIAB/BABYDIET
0.13 [95% CI 0.06, 0.20], Tables 2 and 3) and increased risk for being overweight (TEENDIAB OR 2.40 [95% CI
1.41, 4.06]; BABYDIAB/BABYDIET OR 1.44 [95% CI 1.20, 1.73]) compared with offspring of non-diabetic
mothers. These associations did not change considerably when adjusted for Tanner’s staging, socioeconomic status
and maternal smoking. However, after further adjustment for birthweight, the observed associations were
attenuated in TEENDIAB and were no longer significant in BABYDIAB/BABYDIET, while the negative
associations for height SDS became stronger and significant in both cohorts. In TEENDIAB, weight SDS, waist
circumference SDS and subscapular and triceps skinfold thickness SDSs were also significantly higher in offspring
of mothers with type 1 diabetes compared with those whose mothers did not have type 1 diabetes, but only the
estimates for waist circumference SDS remained significant when adjusted for potential confounders and
birthweight. The offspring of type 1 diabetic mothers showed significantly increased abdominal obesity risk and
metabolic risk, as well as significantly increased levels of fasting insulin and HOMA-IR, independent of potential
confounders. Significant associations with fasting glucose and C-peptide were observed only after adjustment.
Systolic blood pressure SDS was slightly higher in children with type 1 diabetic mothers in unadjusted analyses
(+0.16 [95% CI +0.01, +0.31]), but not after adjustment, while no significant differences in lipids were observed
between offspring of mothers with or without type 1 diabetes in unadjusted or adjusted models. The observed
associations did not change considerably after excluding children who developed type 1 diabetes (data not shown).
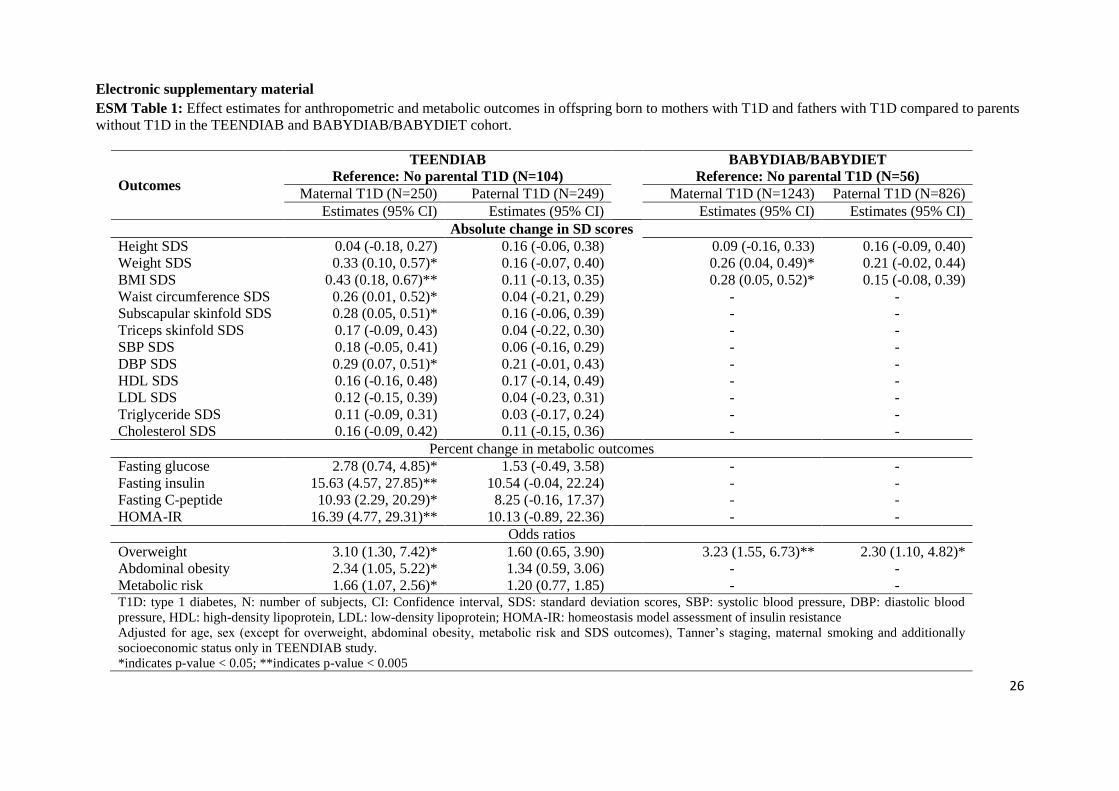
Also, the offspring of mothers with type 1 diabetes showed stronger anthropometric associations than offspring of
fathers with type 1 diabetes when compared with offspring without parents with type 1 diabetes (ESM Table 1).
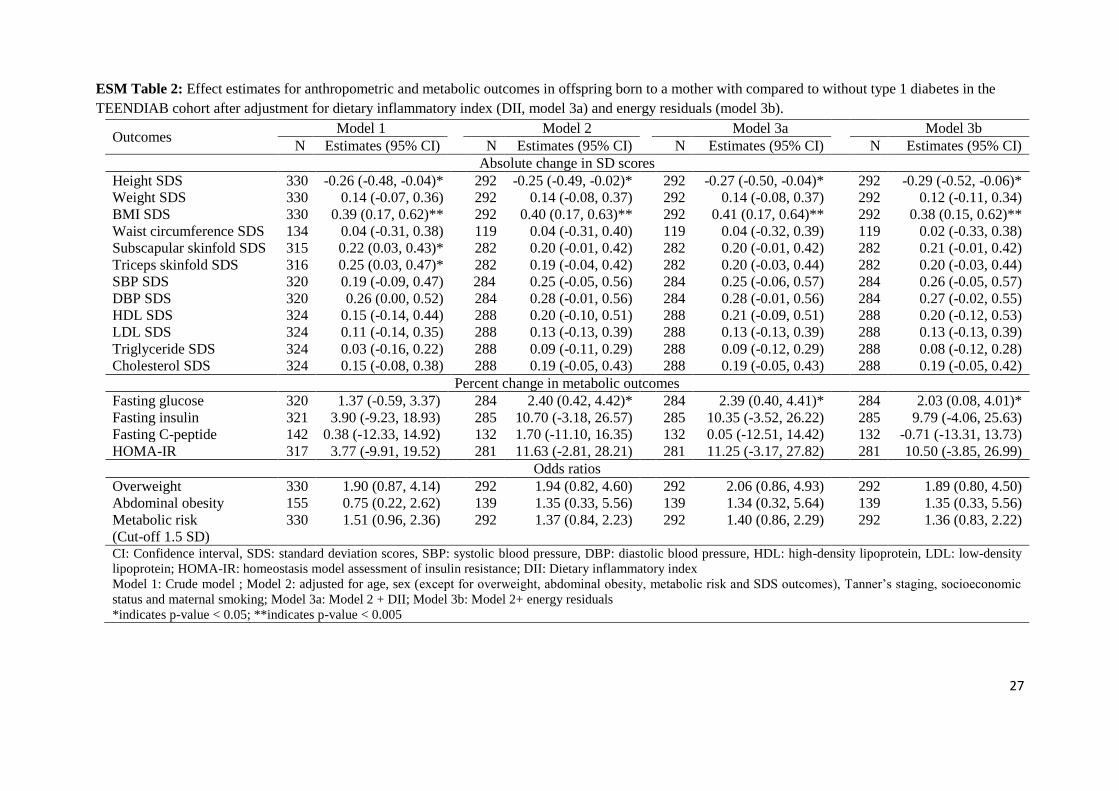
Our sensitivity analyses based on 330 children indicated that the associations were independent of total energy
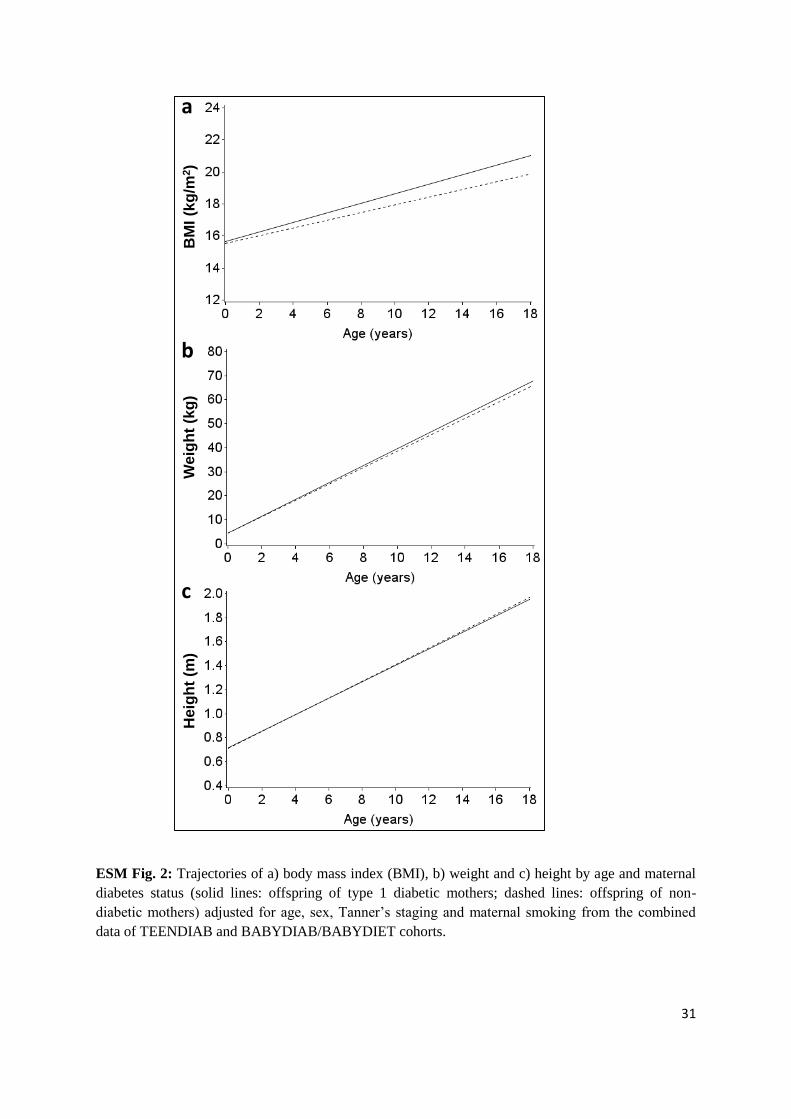
intake or DII (ESM Table 2). Further, we observed that as children got older, BMI and weight increased at a
greater rate in offspring of mothers with type 1 diabetes compared with offspring of non-diabetic mothers, whereas
height increased at a greater rate in offspring of non-diabetic mothers (ESM Fig. 2 and 3).
Analyses of metabolomic profiles
The metabolomics blood samples were taken at a median age of 10 years (range 6-16 years), and 48 individuals
(10%) were overweight at that time. Of the children included in the metabolomics analyses (n=485), 247 (51%)
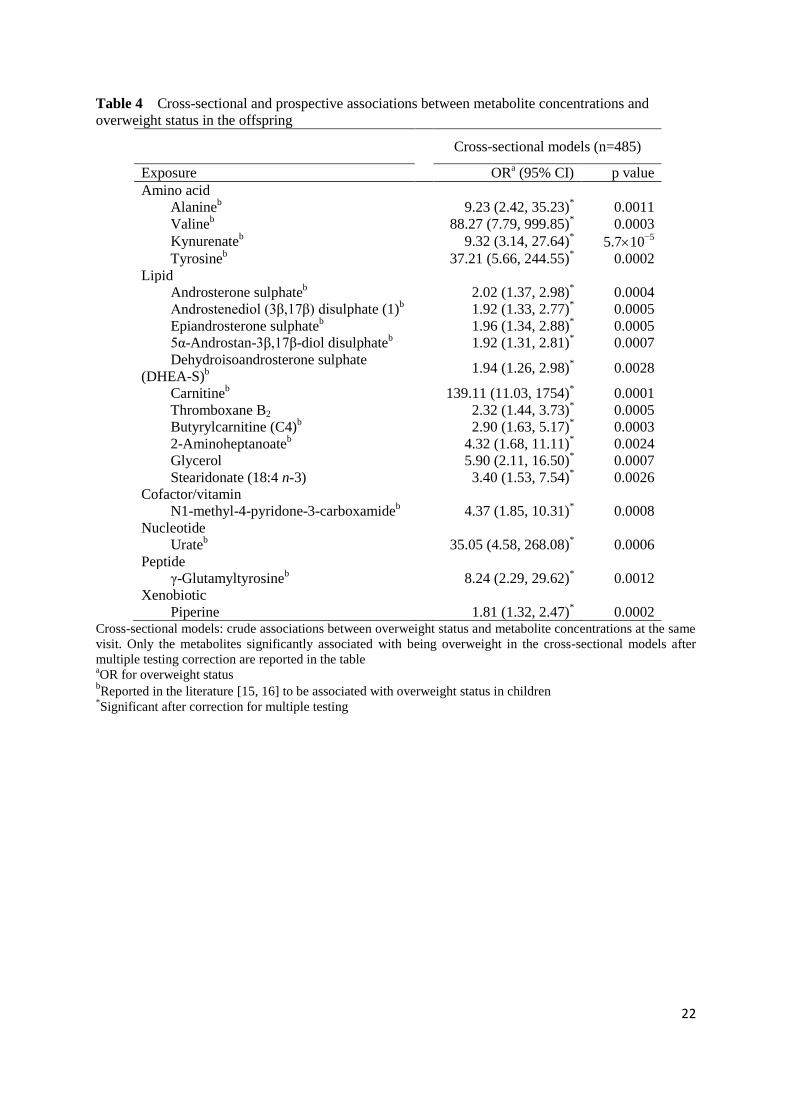
were male and 197 (41%) had mothers with type 1 diabetes. Of the 441 metabolites analysed, 28 showed
significant associations with being overweight after multiple testing correction, and 19 of these were of known
identity (Table 4). All these metabolites were upregulated in overweight individuals, including four metabolites
from the amino acid class (valine, kynurenate, tyrosine and alanine), 11 from the lipid class (androgenic steroids
such as androsterone sulphate, epiandrosterone sulphate, carnitine and the short-chain acyl-carnitine [butyryl
carnitine (C4)], glycerol, thromboxane B2, stearidonate and 2-aminoheptanoate), and four metabolites from other
10
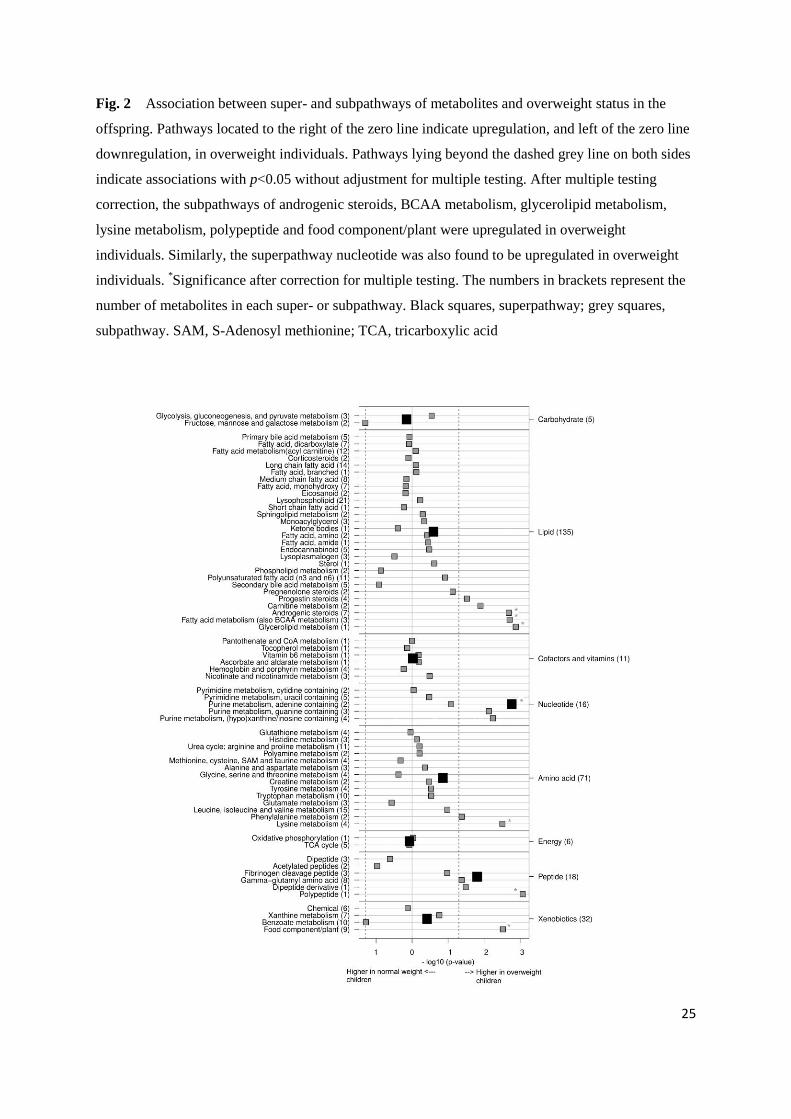
classes (N1-methyl-4-pyridone-3-carboxamide, urate, γ-glutamyltyrosine and piperine). At the pathway level,
several subpathways such as androgenic steroids and branched-chain amino acid (BCAA) metabolism were
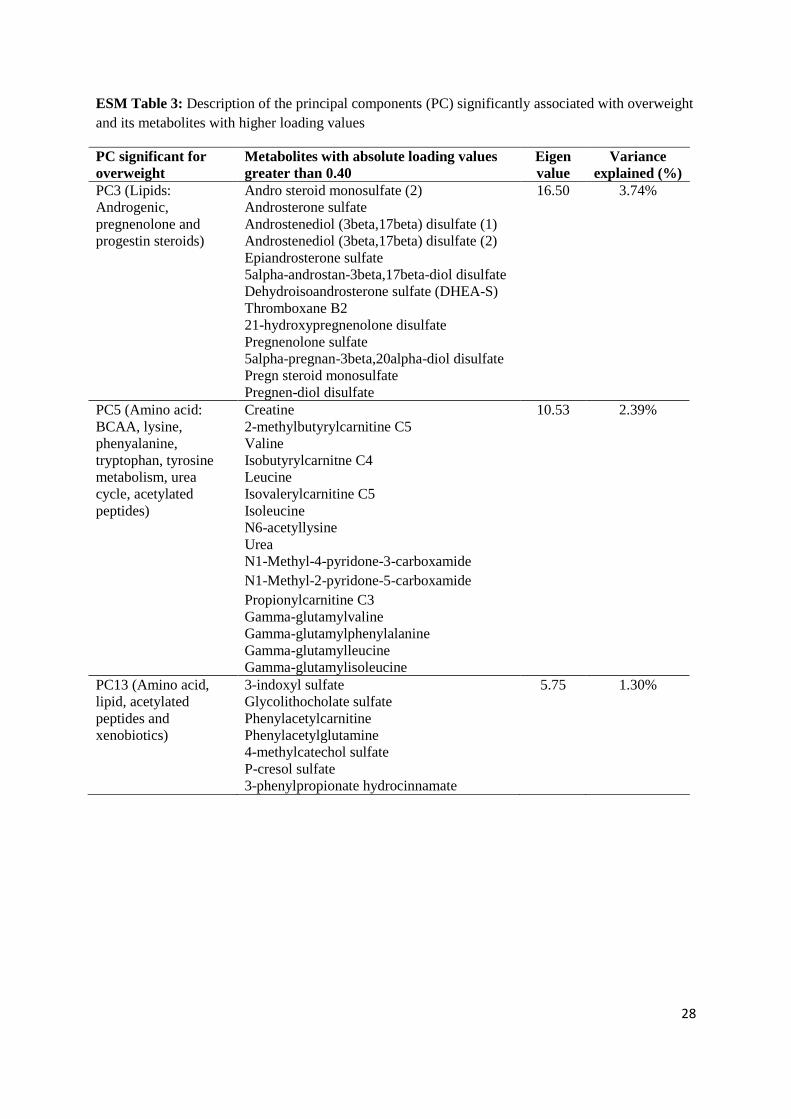
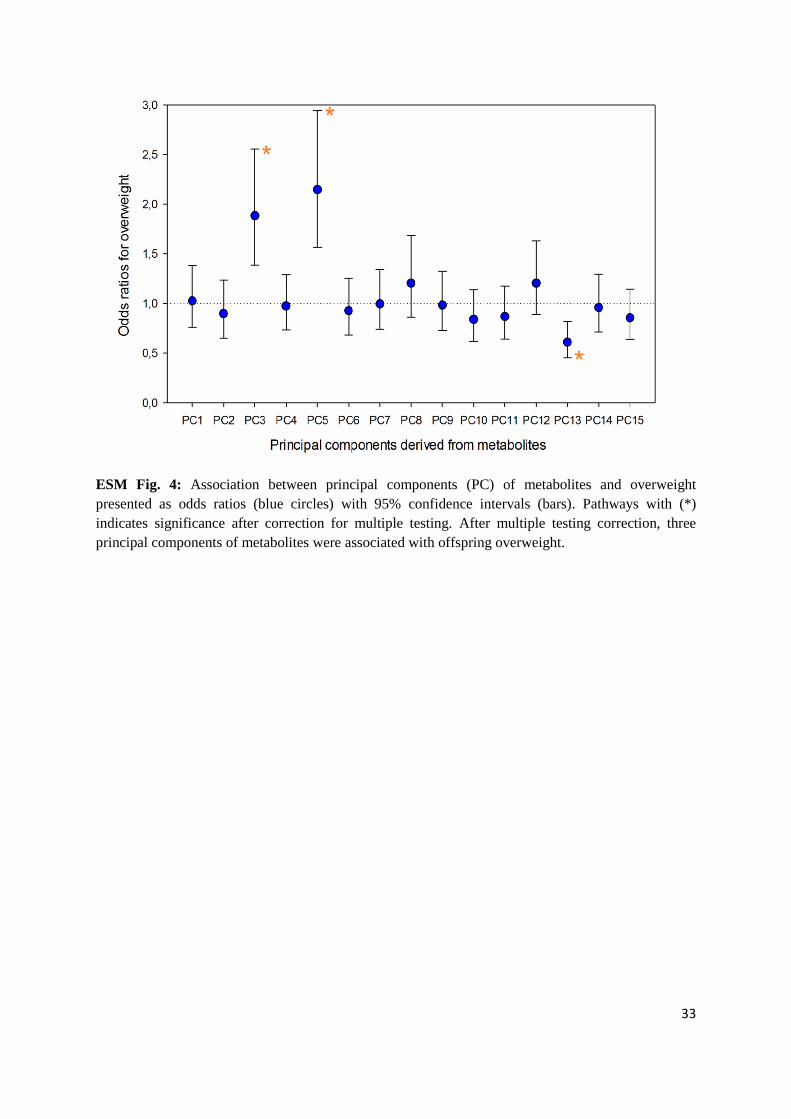
upregulated in overweight individuals, as was the superpathway nucleotide (Fig. 2). Similarly, three principal
components, characterised by androgenic steroids, BCAAs and related metabolites or composed of amino acid,
lipid and acetylated peptides, were associated with being overweight (ESM Fig. 4 and ESM Table 3). The principal
components related to androgenic steroids and BCAAs were also positively associated with HOMA-IR (p<0.0001
and p=0.002 respectively), fasting insulin (p<0.0001 and p=0.005) and fasting C-peptide (p=0.002 and p<0.0001).
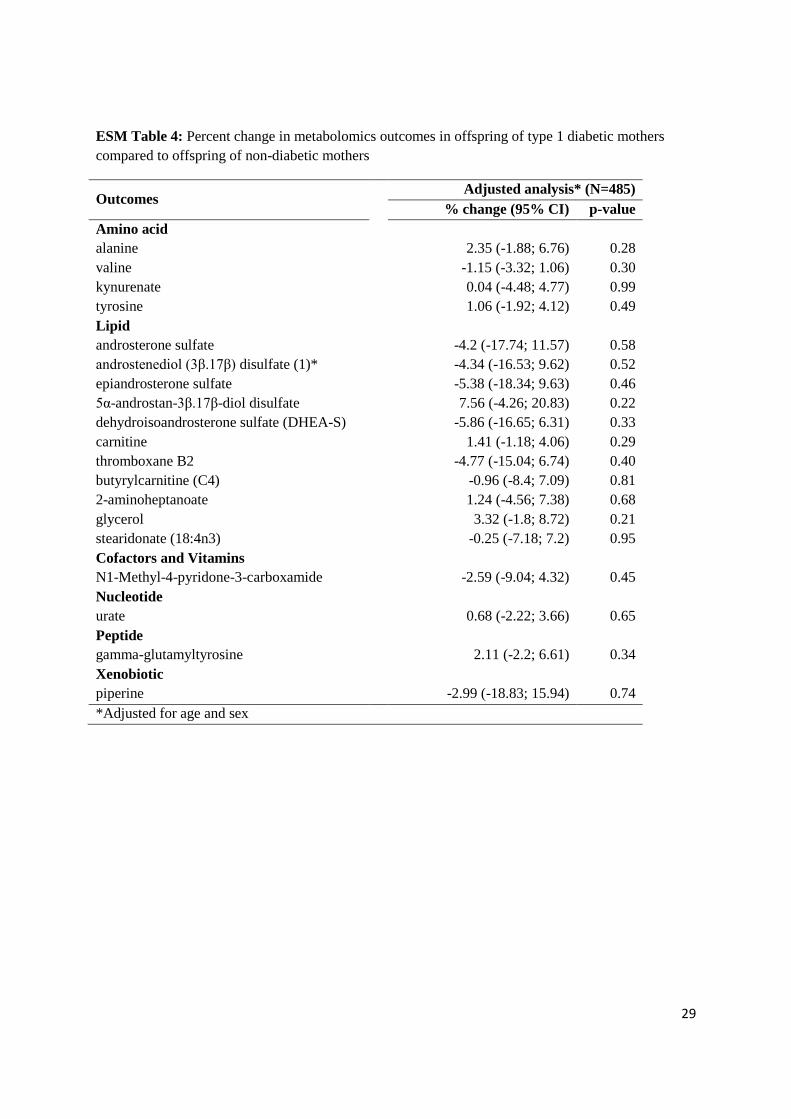
In contrast, there was no significant association of any metabolite with maternal type 1 diabetes when
corrected for multiple testing, and there was not even a significant association at the 5% level for any of the
metabolites found to be associated with being overweight (ESM Table 4). No significant associations were
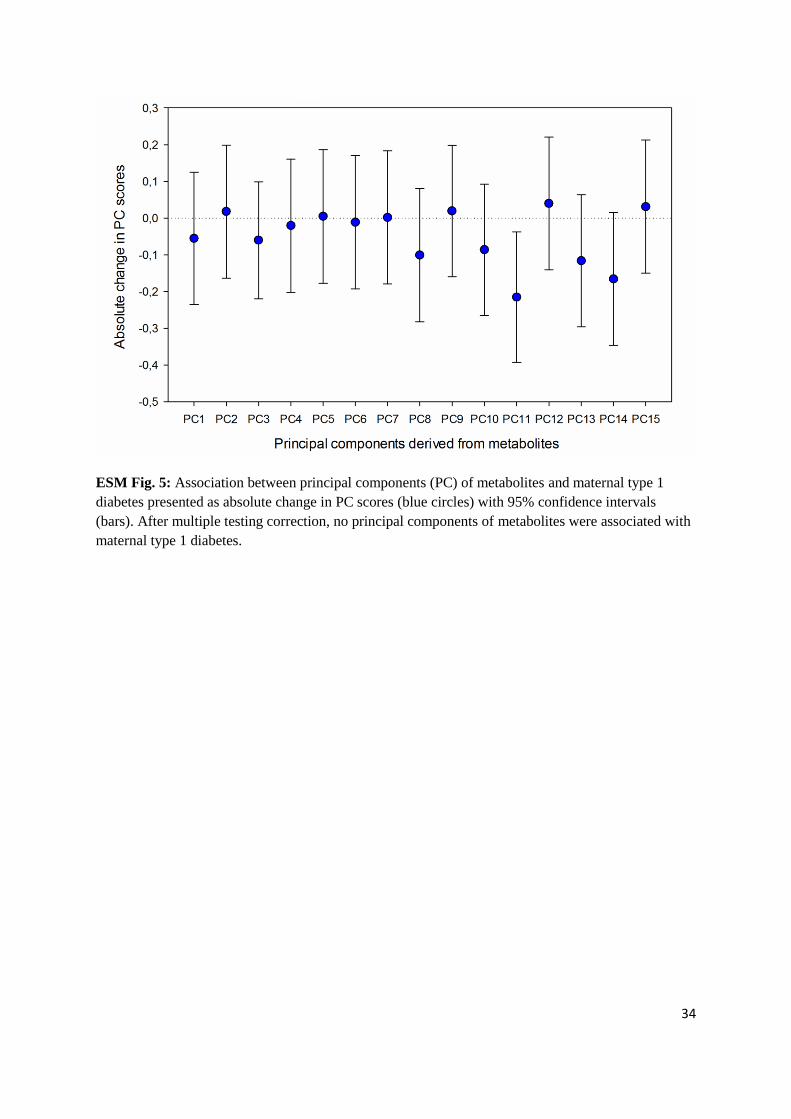
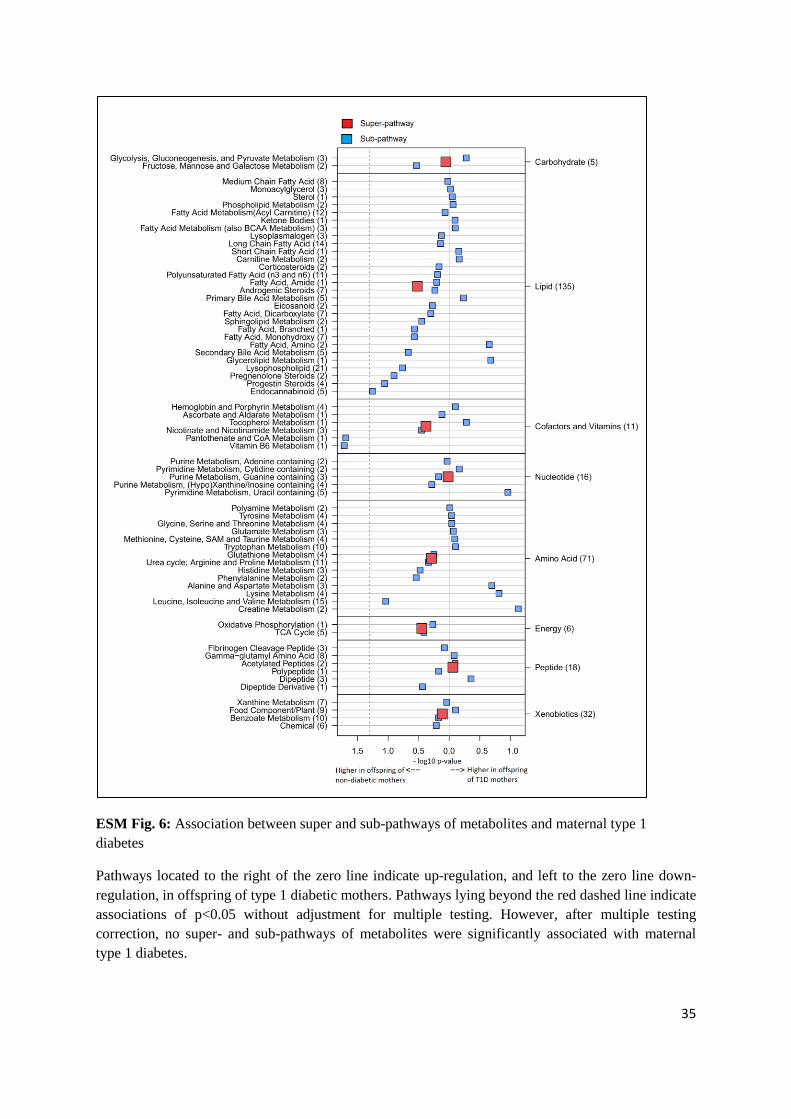
observed between maternal type 1 diabetes and any of the principal components (ESM Fig. 5) or super- and
subpathways (ESM Fig. 6) after correcting for multiple testing.
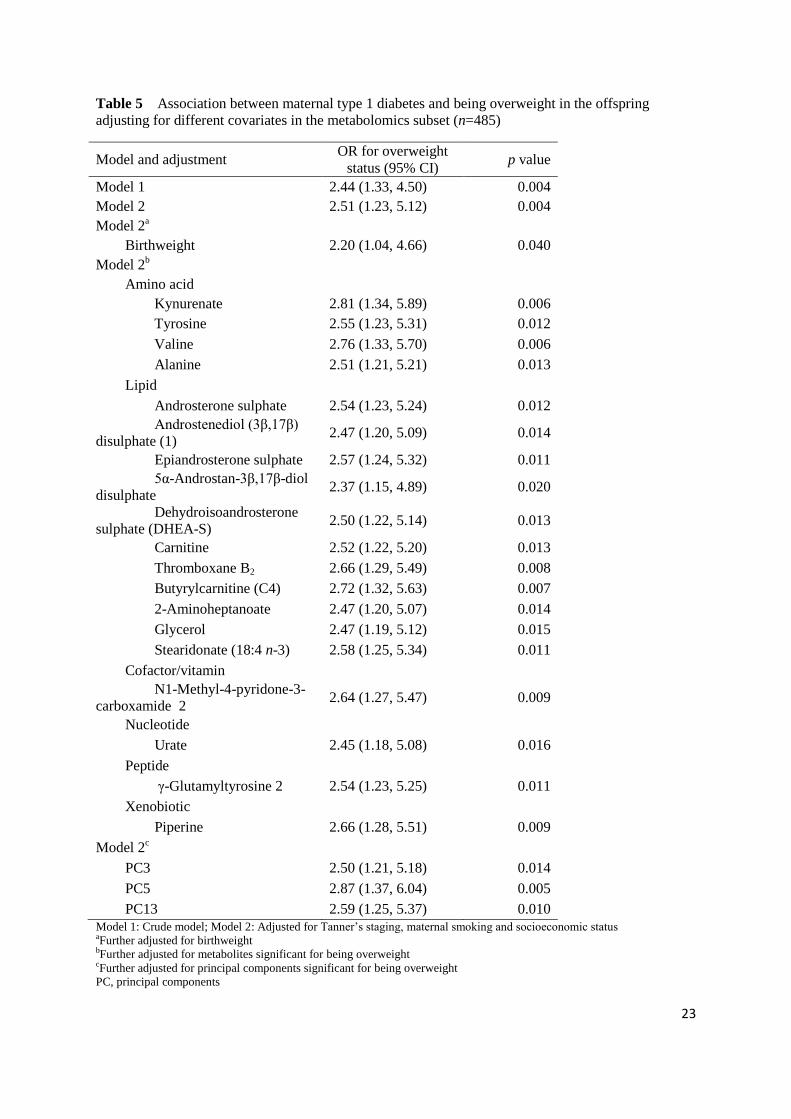
Further, the associations between maternal type 1 diabetes and offspring overweight status remained
significant and were not markedly attenuated after adjustment for any potentially relevant single metabolite
concentration or principal components (Table 5), indicating that none is in the causal pathway.
Discussion
Our findings suggest that the offspring of mothers with type 1 diabetes have a higher BMI and increased risk for
being overweight as well as increased insulin resistance compared with offspring of non-diabetic mothers. The
association between maternal type 1 diabetes and excess weight later in life could be substantially explained by
birthweight in our birth cohort data, but only partially in our TEENDIAB data, perhaps because these did not
include measurements before school age. Metabolic alterations, however, do not seem to be involved in the
pathway. Although some metabolic patterns were found to be associated with being overweight, no such
associations were observed with respect to maternal type 1 diabetes.
Previous studies that examined the offspring of mothers with type 1 diabetes reported similar findings with
respect to excess weight gain, the metabolic syndrome and related outcomes at different ages [7-10]. However, one
study [39] found that the prevalence of being overweight in 6–8-year-old offspring of mothers with type 1 diabetes
under adequate glycaemic control was similar to that in a reference population, potentially pointing to a possible
approach for the early prevention of excess weight gain in these children.
Our analysis indeed suggests that offspring of mothers with type 1 diabetes are more prone to worsening of
metabolic profile than offspring of fathers with type 1 diabetes when compared with offspring whose parents did
not have type 1 diabetes, thus providing evidence to support a potential role for intrauterine hyperglycaemia rather
than for parental genetic transmission. Previous analyses of the BABYDIAB data (without BABYDIET and with
much shorter follow-up than here) suggested that maternal type 1 diabetes may not be an independent predictor of
11
overweight status during childhood but associated factors such as birthweight may predispose individuals to risk of
being overweight [14]. Indeed, the associations between maternal type 1 diabetes and offspring overweight status
were attenuated by 62% after adjustment for birthweight in the BABYDIAB/BABYDIET study, but only by 10%
in the TEENDIAB study. Moreover, the effect estimates were generally weaker in BABYDIAB/BABYDIET
compared with TEENDIAB. We assume that these differences come from the different age structures in the
studies. The BABYDIAB/BABYDIET cohort followed children from birth, with most anthropometric
measurements taken during the preschool period, whereas recruitment started at a minimum age of 6 years in
TEENDIAB. Although both studies followed children until 18 years, anthropometric data were not available after
6 years of age for 30% of the BABYDIAB/BABYDIET participants. Birthweight is more strongly associated with
a child’s BMI in early childhood than later, which may explain the observed differences between the two studies. It
has also been suggested that maternal diabetes may have a delayed influence on the offspring’s adiposity that
increases with age [40, 41]. We consider it less likely that the differences observed between our two cohorts are
caused by different environmental conditions around the time of birth, as the median birth year in TEENDIAB was
2001 compared with 1997 for BABYDIAB/BABYDIET, and a significant association between maternal type 1
diabetes and offspring being overweight has been consistently observed in previous studies irrespective of when
the children were born [7-10].
Our findings are similar to previous studies on metabolomics and overweight status in children and
adolescents without a type 1 diabetes background. Of the 19 metabolite concentrations associated with being
overweight in our data, 16 have previously been reported in the literature [15, 16]. For example, our finding that
elevated androgenic steroids and BCAA-related metabolite pattern are associated with being overweight and
increased insulin resistance is consistent with other studies based on data from children without family history of
type 1 diabetes [15, 16]. Studies on the association of exposure to maternal diabetes and changes in the offspring’s
metabolome are rare. We are aware of only one study which found no significant associations of gestational
diabetes and offspring metabolites [16]. Similarly, we found no associations of maternal type 1 diabetes with
metabolite concentrations in the offspring. Nevertheless, we were able to identify differences between the
metabolomes of overweight and normal-weight children. It may be possible that these differences were observed
as an effect, rather than a cause, of being overweight, and hence are not in the causal pathway between maternal
type 1 diabetes and excess weight gain in offspring.
The main strength of our study is the prospective design with multiple follow-ups and the availability of a
wide range of anthropometric and metabolic outcomes in addition to metabolomics data. As we had data available
from two large study populations, we could validate the results for overweight status and BMI. Both cohorts were
based on children with a first-degree relative with type 1 diabetes, who were at increased risk of developing type 1
diabetes themselves, but otherwise healthy. Despite adjustment for some important covariates in our analyses, we
cannot rule out the possibility of unmeasured confounding in our study. In particular, we had no data on maternal
pre-pregnancy BMI, which is known to play a major confounding role with respect to childhood excess weight
12
gain. However, it should not be as relevant when comparing mothers with and without type 1 diabetes as it would
be in the context of other diabetes forms. While the mothers of all BABYDIAB/BABYDIET children had been
diagnosed with type 1 diabetes before the index pregnancy, we did not have this information available for the
TEENDIAB children. Although we therefore cannot rule out that a small number of the TEENDIAB children had
not been exposed to type 1 diabetes in utero, we believe that this is not a major concern as the onset of type 1
diabetes occurs most frequently at a young age and hence before women get pregnant for the first time. To our
knowledge, this is the first study examining the influence of the metabolomics profile on the association between
maternal type 1 diabetes and offspring overweight status. With 441 metabolites analysed in 485 children, and a
number of metabolites confirming previously reported associations with being overweight, we believe that the
missing associations between maternal type 1 diabetes and metabolites in our data are not likely to be false-
negative findings.
In summary, offspring of mothers with type 1 diabetes showed increased adiposity, insulin resistance,
fasting insulin and C-peptide compared with offspring of non-diabetic mothers. Certain metabolite concentrations
were positively associated with being overweight in the offspring. However, metabolic changes seem unlikely to
be in the causal pathway between maternal type 1 diabetes and excess weight in offspring, as this association could
not be explained by any of the potentially relevant metabolites.
Acknowledgements We thank L. Lachmann, C. Matzke, J. Stock, S. Krause, A. Knopff, F. Haupt, M. Pflüger, M.
Scholz, A. Gavrisan, S. Schneider, K. Remus, S. Biester (Bläsig), E. Sadeghian and A. Bokelmann for data
collection and expert technical assistance. We also thank all families participating in the BABYDIAB/BABYDIET
and TEENDIAB studies and also all paediatricians, diabetologists and family doctors in Germany for recruitment
and continuous support.
Data availability The datasets analysed during the current study are available from the corresponding author on
reasonable request.
Funding The work was supported by grants from the Competence Network for Diabetes Mellitus (Kompetenznetz
Diabetes Mellitus) funded by the Federal Ministry of Education and Research (FKZ 01GI0805-07), JDRF (JDRF-
No 17-2012-16, JDRF-No 2-SRA-2015-13-Q-R) and the European Union’s HORIZON 2020 research and
innovation programme (grant agreement number 633595 DynaHEALTH). This work was supported by iMed, the
Helmholtz Initiative on Personalized Medicine.
Duality of interest The authors declare that there is no duality of interest associated with this manuscript.
Contribution statement AP reviewed data, undertook statistical analysis, interpreted results and wrote the first
and final draft of the manuscript together with AB. MJ contributed to data management and statistical analysis and
reviewed the manuscript. CW, SH, NH, JR and OK acquired data and reviewed the manuscript. JK and GK

13
interpreted results and reviewed the manuscript. A-GZ is the principal investigator of the
BABYDIAB/BABYDIET and TEENDIAB studies, designed the studies and concept, interpreted the results and
critically reviewed the manuscript for intellectual content. All authors approved the final version of the manuscript.
A-GZ is the guarantor of this work.
14
References
[1] Eckel RH, Grundy SM, Zimmet PZ (2005) The metabolic syndrome. Lancet (London, England) 365: 1415-1428 [2] Freinkel N (1980) Banting Lecture 1980: of Pregnancy and Progeny. Diabetes 29: 1023 [3] Boerschmann H, Pfluger M, Henneberger L, Ziegler AG, Hummel S (2010) Prevalence and predictors of overweight and insulin resistance in offspring of mothers with gestational diabetes mellitus. Diabetes Care 33: 1845-1849 [4] Buinauskiene J, Baliutaviciene D, Zalinkevicius R (2004) Glucose tolerance of 2- to 5-yr-old offspring of diabetic mothers. Pediatric diabetes 5: 143-146 [5] Silverman BL, Metzger BE, Cho NH, Loeb CA (1995) Impaired glucose tolerance in adolescent offspring of diabetic mothers. Relationship to fetal hyperinsulinism. Diabetes Care 18: 611-617 [6] Manderson JG, Mullan B, Patterson CC, Hadden DR, Traub AI, McCance DR (2002) Cardiovascular and metabolic abnormalities in the offspring of diabetic pregnancy. Diabetologia 45: 991-996 [7] Clausen TD, Mathiesen ER, Hansen T, et al. (2009) Overweight and the metabolic syndrome in adult offspring of women with diet-treated gestational diabetes mellitus or type 1 diabetes. The Journal of clinical endocrinology and metabolism 94: 2464-2470 [8] Vlachova Z, Bytoft B, Knorr S, et al. (2015) Increased metabolic risk in adolescent offspring of mothers with type 1 diabetes: the EPICOM study. Diabetologia 58: 1454-1463 [9] Lindsay RS, Nelson SM, Walker JD, et al. (2010) Programming of Adiposity in Offspring of Mothers With Type 1 Diabetes at Age 7 Years. Diabetes Care 33: 1080-1085 [10] Weiss PA, Scholz HS, Haas J, Tamussino KF, Seissler J, Borkenstein MH (2000) Long-term follow-up of infants of mothers with type 1 diabetes: evidence for hereditary and nonhereditary transmission of diabetes and precursors. Diabetes Care 23: 905-911 [11] Beyerlein A, Von Kries R, Hummel M, et al. (2010) Improvement in pregnancy-related outcomes in the offspring of diabetic mothers in Bavaria, Germany, during 1987–2007. Diabetic Medicine 27: 1379-1384 [12] Beyerlein A, Thiering E, Pflueger M, et al. (2014) Early infant growth is associated with the risk of islet autoimmunity in genetically susceptible children. Pediatric diabetes 15: 534-542 [13] Yassouridis C, Leisch F, Winkler C, Ziegler AG, Beyerlein A (2017) Associations of growth patterns and islet autoimmunity in children with increased risk for type 1 diabetes: a functional analysis approach. Pediatric diabetes 18: 103-110 [14] Hummel S, Pfluger M, Kreichauf S, Hummel M, Ziegler AG (2009) Predictors of overweight during childhood in offspring of parents with type 1 diabetes. Diabetes Care 32: 921-925 [15] Butte NF, Liu Y, Zakeri IF, et al. (2015) Global metabolomic profiling targeting childhood obesity in the Hispanic population. The American journal of clinical nutrition 102: 256-267 [16] Perng W, Gillman MW, Fleisch AF, et al. (2014) Metabolomic profiles and childhood obesity. Obesity (Silver Spring, Md) 22: 2570-2578 [17] Wahl S, Yu Z, Kleber M, et al. (2012) Childhood obesity is associated with changes in the serum metabolite profile. Obesity facts 5: 660-670 [18] Raab J, Giannopoulou EZ, Schneider S, et al. (2014) Prevalence of vitamin D deficiency in pre-type 1 diabetes and its association with disease progression. Diabetologia 57: 902-908 [19] Raab J, Haupt F, Kordonouri O, et al. (2013) Continuous rise of insulin resistance before and after the onset of puberty in children at increased risk for type 1 diabetes - a cross-sectional analysis. Diabetes Metab Res Rev 29: 631-635 [20] Ziegler AG, Meier-Stiegen F, Winkler C, Bonifacio E, Teendiab Study Group (2012) Prospective evaluation of risk factors for the development of islet autoimmunity and type 1 diabetes during puberty--TEENDIAB: study design. Pediatric diabetes 13: 419-424 [21] Morris NM, Udry JR (1980) Validation of a self-administered instrument to assess stage of adolescent development. Journal of youth and adolescence 9: 271-280 [22] Sansone SA, Fan T, Goodacre R, et al. (2007) The metabolomics standards initiative. Nat Biotechnol 25: 846-848
15
[23] Krumsiek J, Mittelstrass K, Do KT, et al. (2015) Gender-specific pathway differences in the human serum metabolome. Metabolomics 11: 1815-1833 [24] Hummel S, Pflüger M, Hummel M, Bonifacio E, Ziegler A-G (2011) Primary Dietary Intervention Study to Reduce the Risk of Islet Autoimmunity in Children at Increased Risk for Type 1 Diabetes. Diabetes Care 34: 1301 [25] Beyerlein A, Chmiel R, Hummel S, Winkler C, Bonifacio E, Ziegler AG (2014) Timing of gluten introduction and islet autoimmunity in young children: updated results from the BABYDIET study. Diabetes care 37: e194-195 [26] Ziegler AG, Hummel M, Schenker M, Bonifacio E (1999) Autoantibody appearance and risk for development of childhood diabetes in offspring of parents with type 1 diabetes: the 2-year analysis of the German BABYDIAB Study. Diabetes 48: 460 [27] Hummel M, Bonifacio E, Schmid S, Walter M, Knopff A, Ziegler A (2004) Brief communication: Early appearance of islet autoantibodies predicts childhood type 1 diabetes in offspring of diabetic parents. Annals of Internal Medicine 140: 882-886 [28] Kromeyer-Hauschild K, Wabitsch M, Kunze D, et al. (2001) Perzentile für den Body-mass-Index für das Kindes- und Jugendalter unter Heranziehung verschiedener deutscher Stichproben. Monatsschrift Kinderheilkunde 149: 807-818 [29] Robert-Koch-Institut (2011) Referenzperzentile für anthropometrische Maßzahlen und Blutdruck aus der Studie zur Gesundheit von Kindern und Jugendlichen in Deutschland (KiGGS) 2003-2006. Beiträge zur Gesundheitsberichterstattung des Bundes Berlin: Robert Koch-Institut [30] Dathan-Stumpf A, Vogel M, Hiemisch A, et al. (2016) Pediatric reference data of serum lipids and prevalence of dyslipidemia: Results from a population-based cohort in Germany. Clinical biochemistry 49: 740-749 [31] Alberti KGMM, Zimmet P, Shaw J (2006) Metabolic syndrome—a new world-wide definition. A Consensus Statement from the International Diabetes Federation. Diabetic Medicine 23: 469-480 [32] Voigt M, Schneider KT, Jahrig K (1996) [Analysis of a 1992 birth sample in Germany. 1: New percentile values of the body weight of newborn infants]. Geburtshilfe und Frauenheilkunde 56: 550-558 [33] Matthews DR, Hosker JP, Rudenski AS, Naylor BA, Treacher DF, Turner RC (1985) Homeostasis model assessment: insulin resistance and beta-cell function from fasting plasma glucose and insulin concentrations in man. Diabetologia 28: 412-419 [34] Weber KS, Raab J, Haupt F, et al. (2014) Evaluating the diet of children at increased risk for type 1 diabetes: first results from the TEENDIAB study. Public health nutrition 18: 50-58 [35] Willett WC, Howe GR, Kushi LH (1997) Adjustment for total energy intake in epidemiologic studies. The American journal of clinical nutrition 65: 1220S-1228S; discussion 1229S-1231S [36] Shivappa N, Steck SE, Hurley TG, Hussey JR, Hebert JR (2014) Designing and developing a literature-derived, population-based dietary inflammatory index. Public health nutrition 17: 1689-1696 [37] Beyerlein A, Rückinger S, Toschke AM, Schaffrath Rosario A, von Kries R (2011) Is low birth weight in the causal pathway of the association between maternal smoking in pregnancy and higher BMI in the offspring? European journal of epidemiology 26: 413-420 [38] Wang Y, Lim H (2012) The global childhood obesity epidemic and the association between socio-economic status and childhood obesity. International review of psychiatry (Abingdon, England) 24: 176-188 [39] Rijpert M, Evers IM, de Vroede MA, de Valk HW, Heijnen CJ, Visser GH (2009) Risk factors for childhood overweight in offspring of type 1 diabetic women with adequate glycemic control during pregnancy: Nationwide follow-up study in the Netherlands. Diabetes Care 32: 2099-2104 [40] Silverman BL, Rizzo T, Green OC, et al. (1991) Long-term prospective evaluation of offspring of diabetic mothers. Diabetes 40 Suppl 2: 121-125 [41] Baptiste-Roberts K, Nicholson WK, Wang N-Y, Brancati FL (2012) Gestational Diabetes and Subsequent Growth Patterns of Offspring: The National Collaborative Perinatal Project. Maternal and child health journal 16: 125-132
16
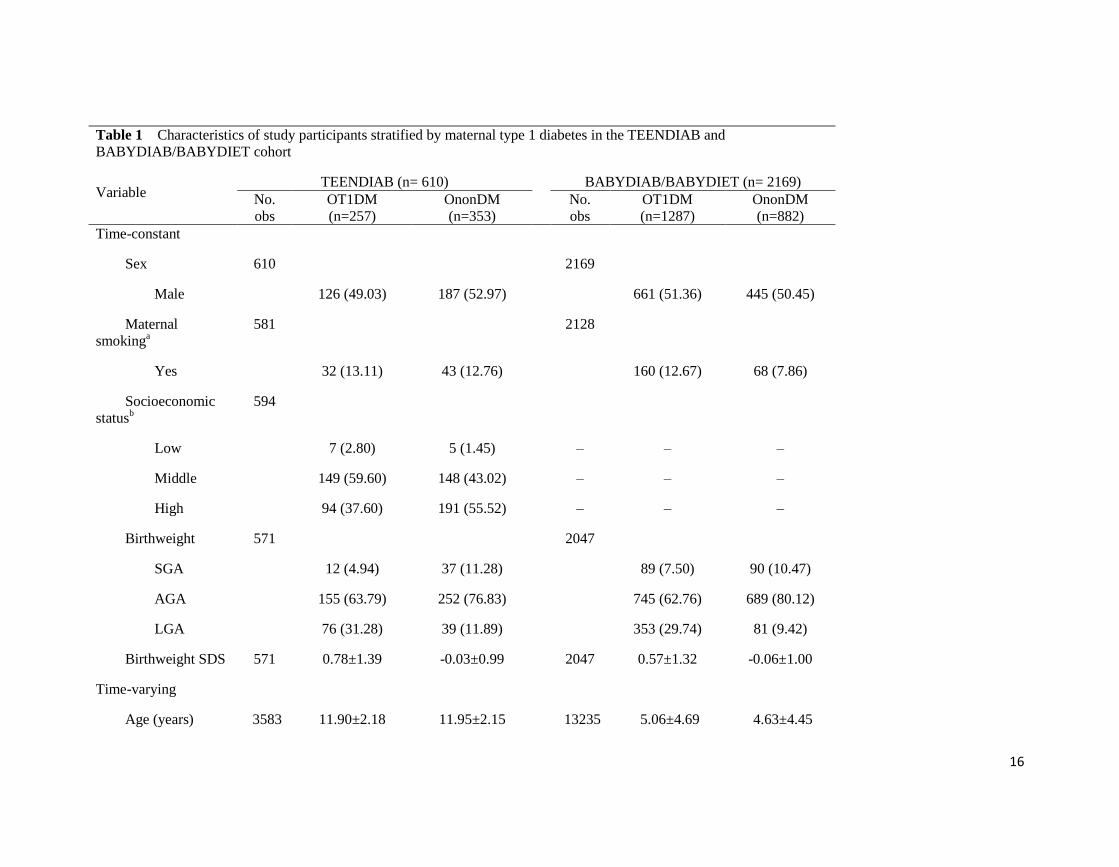
Table 1 Characteristics of study participants stratified by maternal type 1 diabetes in the TEENDIAB and
BABYDIAB/BABYDIET cohort
Variable TEENDIAB (n= 610) BABYDIAB/BABYDIET (n= 2169)
No.
obs
OT1DM
(n=257)
OnonDM
(n=353)
No.
obs
OT1DM
(n=1287)
OnonDM
(n=882)
Time-constant
Sex 610 2169
Male 126 (49.03) 187 (52.97) 661 (51.36) 445 (50.45)
Maternal
smokinga
581 2128
Yes 32 (13.11) 43 (12.76) 160 (12.67) 68 (7.86)
Socioeconomic
statusb
594
Low 7 (2.80) 5 (1.45) – – –
Middle 149 (59.60) 148 (43.02) – – –
High 94 (37.60) 191 (55.52) – – –
Birthweight 571 2047
SGA 12 (4.94) 37 (11.28) 89 (7.50) 90 (10.47)
AGA 155 (63.79) 252 (76.83) 745 (62.76) 689 (80.12)
LGA 76 (31.28) 39 (11.89) 353 (29.74) 81 (9.42)
Birthweight SDS 571 0.78±1.39 -0.03±0.99 2047 0.57±1.32 -0.06±1.00
Time-varying
Age (years) 3583 11.90±2.18 11.95±2.15 13235 5.06±4.69 4.63±4.45
17
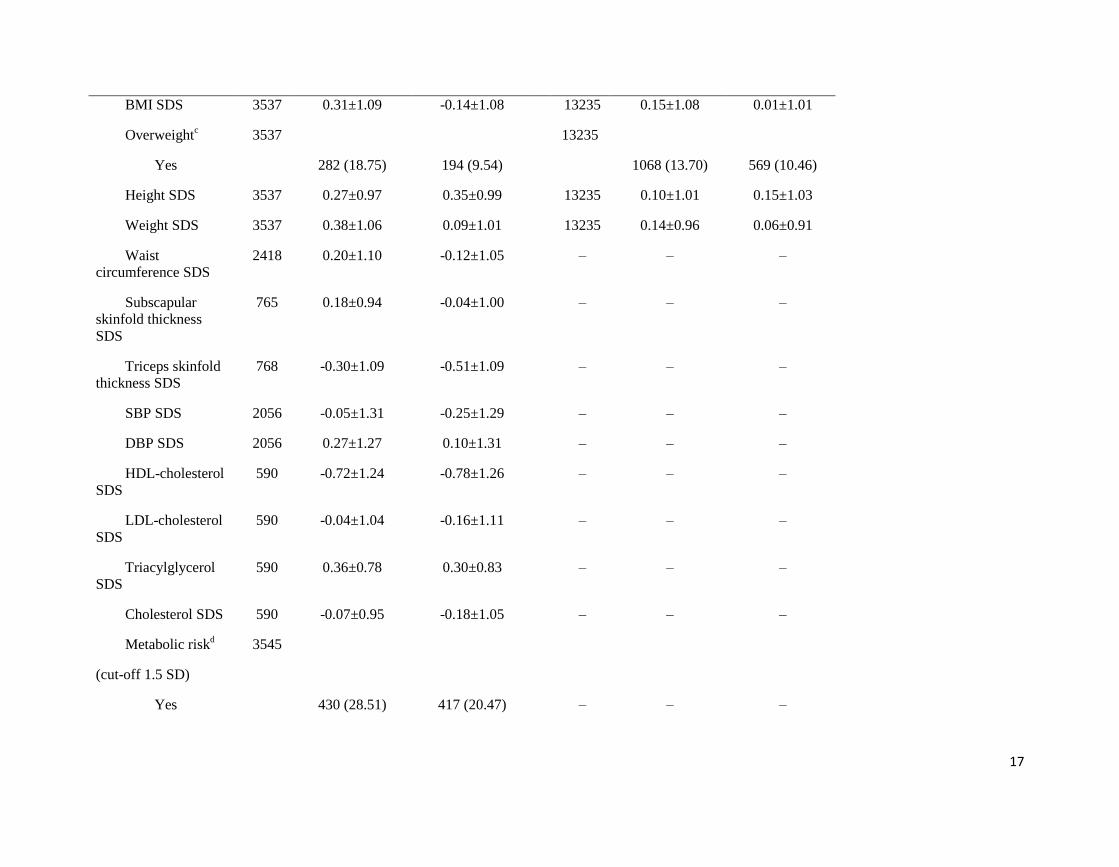
BMI SDS 3537 0.31±1.09 -0.14±1.08 13235 0.15±1.08 0.01±1.01
Overweightc 3537 13235
Yes 282 (18.75) 194 (9.54) 1068 (13.70) 569 (10.46)
Height SDS 3537 0.27±0.97 0.35±0.99 13235 0.10±1.01 0.15±1.03
Weight SDS 3537 0.38±1.06 0.09±1.01 13235 0.14±0.96 0.06±0.91
Waist
circumference SDS
2418 0.20±1.10 -0.12±1.05 – – –
Subscapular
skinfold thickness
SDS
765 0.18±0.94 -0.04±1.00 – – –
Triceps skinfold
thickness SDS
768 -0.30±1.09 -0.51±1.09 – – –
SBP SDS 2056 -0.05±1.31 -0.25±1.29 – – –
DBP SDS 2056 0.27±1.27 0.10±1.31 – – –
HDL-cholesterol
SDS
590 -0.72±1.24 -0.78±1.26 – – –
LDL-cholesterol
SDS
590 -0.04±1.04 -0.16±1.11 – – –
Triacylglycerol
SDS
590 0.36±0.78 0.30±0.83 – – –
Cholesterol SDS 590 -0.07±0.95 -0.18±1.05 – – –
Metabolic riskd
(cut-off 1.5 SD)
3545
Yes 430 (28.51) 417 (20.47) – – –
18
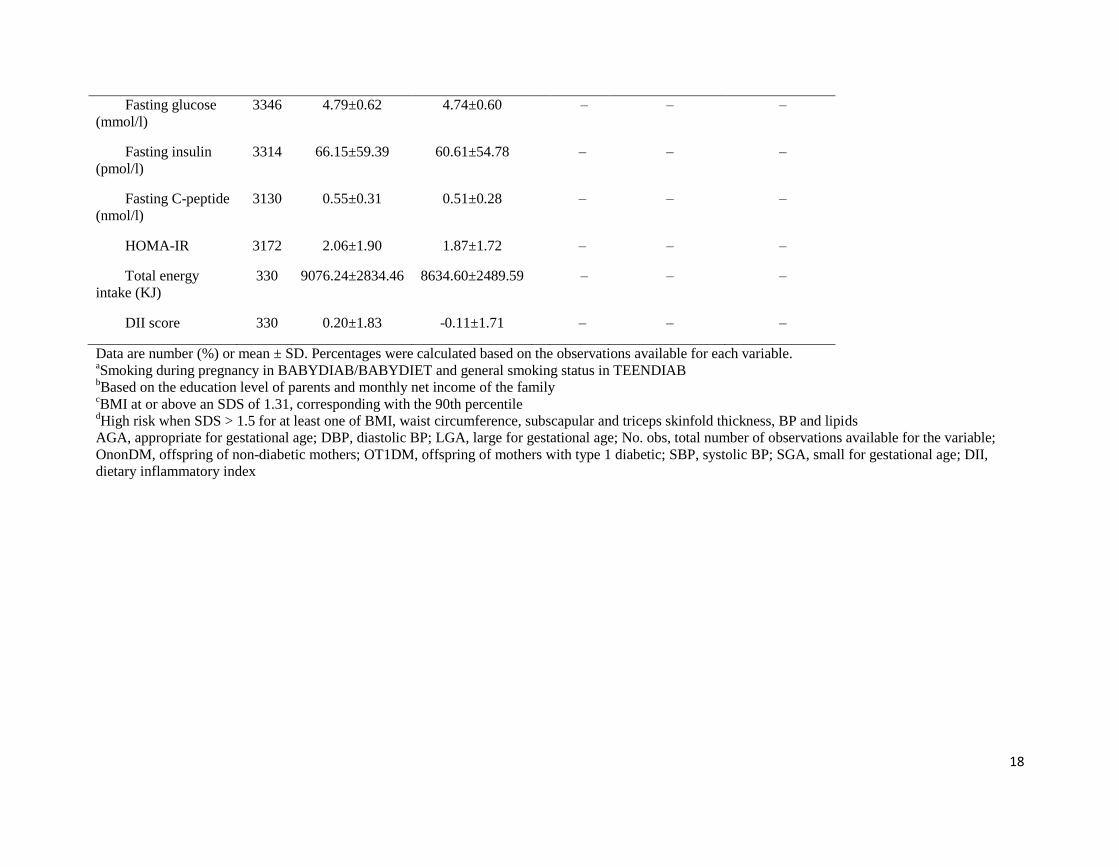
Fasting glucose
(mmol/l)
3346 4.79±0.62 4.74±0.60 – – –
Fasting insulin
(pmol/l)
3314 66.15±59.39 60.61±54.78 – – –
Fasting C-peptide
(nmol/l)
3130 0.55±0.31 0.51±0.28 – – –
HOMA-IR 3172 2.06±1.90 1.87±1.72 – – –
Total energy
intake (KJ)
330 9076.24±2834.46 8634.60±2489.59 – – –
DII score 330 0.20±1.83 -0.11±1.71 – – –
Data are number (%) or mean ± SD. Percentages were calculated based on the observations available for each variable. aSmoking during pregnancy in BABYDIAB/BABYDIET and general smoking status in TEENDIAB
bBased on the education level of parents and monthly net income of the family
cBMI at or above an SDS of 1.31, corresponding with the 90th percentile
dHigh risk when SDS > 1.5 for at least one of BMI, waist circumference, subscapular and triceps skinfold thickness, BP and lipids
AGA, appropriate for gestational age; DBP, diastolic BP; LGA, large for gestational age; No. obs, total number of observations available for the variable;
OnonDM, offspring of non-diabetic mothers; OT1DM, offspring of mothers with type 1 diabetic; SBP, systolic BP; SGA, small for gestational age; DII,
dietary inflammatory index
19
Table 2 Effect estimates for anthropometric and metabolic outcomes in offspring born to a mother with vs without type 1 diabetes in the TEENDIAB
cohort
Outcome
Model 1 Model 2 Model 3
No.
participants
(No. obs)
Estimates (95% CI) No.
participants
(No. obs)
Estimates (95% CI) No.
participants
(No. obs)
Estimates (95% CI)
Absolute change in SDS
Height SDS 610 (3537) −0.12 (−0.28, 0.03) 562 (3122) −0.07 (−0.23, 0.08) 527 (2955) −0.27 (−0.43,
−0.10)**
Weight SDS 610 (3537) 0.20 (0.04, 0.36)* 562 (3122) 0.22 (0.06, 0.39)
* 527 (2955) 0.07 (−0.10, 0.25)
BMI SDS 610 (3537) 0.35 (0.19, 0.52)**
562 (3122) 0.36 (0.19, 0.53)**
527 (2955) 0.28 (0.09, 0.46)**
Waist circumference
SDSa
489 (2418) 0.29 (0.12, 0.46)**
452 (2152) 0.24 (0.06, 0.42)**
426 (2057) 0.19 (0.00, 0.39)*
Subscapular skinfold
SDS
570 (765) 0.19 (0.03, 0.35)* 499 (662) 0.17 (0.01, 0.33)
* 471 (626) 0.12 (−0.05, 0.30)
Triceps skinfold
SDS
572 (768) 0.19 (0.02, 0.37)* 500 (663) 0.15 (−0.04, 0.33) 472 (627) 0.09 (−0.10, 0.29)
SBP SDS 597 (2056) 0.16 (0.01, 0.31)* 543 (1825) 0.13 (−0.03, 0.30) 510 (1727) 0.10 (−0.07, 0.28)
DBP SDS 597 (2056) 0.12 (−0.03, 0.26) 543 (1825) 0.14 (−0.01, 0.30) 510 (1727) 0.17 (0.00, 0.34)*
HDL-cholesterol
SDS
590 0.06 (−0.14, 0.27) 502 0.04 (−0.18, 0.27) 471 0.06 (−0.19, 0.30)
LDL-cholesterol
SDS
590 0.10 (−0.07, 0.28) 502 0.08 (−0.11, 0.28) 471 0.10 (−0.11, 0.31)
Triacylglycerol SDS 590 0.06 (−0.07, 0.19) 502 0.10 (−0.05, 0.24) 471 0.12 (−0.04, 0.27)
Cholesterol SDS 590 0.10 (−0.06, 0.27) 502 0.09 (−0.09, 0.27) 471 0.13 (−0.07, 0.32)
% change in metabolic
outcome
Fasting glucose 606 (3346) 1.00 (−0.32, 2.34) 558 (2937) 1.71 (0.29, 3.16)* 523 (2785) 2.05 (0.51, 3.62)
*
Fasting insulin 608 (3314) 8.32 (0.68, 16.55)* 560 (2902) 8.45 (1.06, 16.38)
* 525 (2749) 9.70 (1.71, 18.31)
*
Fasting C-peptide 601 (3130) 6.01 (−0.23, 12.64) 553 (2744) 5.18 (−0.59, 11.28) 519 (2602) 6.61 (0.33, 13.27)*
HOMA-IR 606 (3172) 8.36 (0.38, 16.99)* 558 (2781) 9.49 (1.69, 17.88)
* 523 (2641) 11.55 (3.02, 20.79)
*
OR
Overweight 610 (3537) 2.40 (1.41, 4.06)**
562 (3122) 2.28 (1.29, 4.01)**
527 (2955) 2.06 (1.12, 3.78)*
Abdominal obesitya,b
498 (2564) 1.92 (1.15, 3.20)* 460 (2273) 1.91 (1.11, 3.30)
* 433 (2168) 1.97 (1.10, 3.55)
*
Metabolic risk 610 (3545) 1.45 (1.10, 1.92)* 562 (3128) 1.46 (1.07, 1.97)
* 527 (2961) 1.37 (0.98, 1.90)
(cut-off 1.5 SD) Model 1, crude model; model 2, adjusted for age, sex (except for overweight, abdominal obesity, metabolic risk and SDS outcomes), Tanner’s staging, maternal smoking and socioeconomic
status; model 3, model 2 + birthweight aCalculated only in children ≥ 11 years of age

20
bWaist circumference ≥ 90th percentile or the adult threshold (International Diabetes Federation) cHigh risk when SDS > 1.5 for at least one of BMI, waist, subscapular and triceps skinfold thickness, blood pressure and lipids; otherwise defined as low risk *p<0.05 and **p<0.01
No., number of; Obs, observations (if different from number of participants)
21
Table 3 Effect estimates for anthropometric outcomes in offspring born to a mother with vs without type 1 diabetes in the BABYDIAB/BABYDIET
cohort
Outcome
Model 1 Model 2 Model 3
No.
participants
(No. obs)
Estimates
(95% CI)
No.
participants
(No. obs)
Estimates
(95% CI)
No.
participants
(No. obs)
Estimates
(95% CI)
Absolute change
in SDS
Height 2169 (13235) −0.06 (−0.13, 0.02) 2128 (11757) −0.06 (−0.14, 0.02) 2010 (11374) −0.13 (−0.21, −0.06)**
Weight 2169 (13235) 0.06 (−0.01, 0.13) 2128 (11757) 0.06 (−0.01, 0.13) 2010 (11374) −0.05 (−0.12, 0.02)
BMI 2169 (13235) 0.13 (0.06, 0.20)**
2128 (11757) 0.14 (0.07, 0.21)**
2010 (11374) 0.04 (−0.04, 0.11)
OR
Overweight 2169 (13235) 1.44 (1.20, 1.73)**
2128 (11757) 1.45 (1.20, 1.74)**
2010 (11374) 1.15 (0.95, 1.40) Model 1, crude model; model 2, adjusted for Tanner’s staging and maternal smoking during pregnancy; model 3, model 2 + birthweight *p<0.05 and **p<0.01
No., number of; Obs, observations
22
Table 4 Cross-sectional and prospective associations between metabolite concentrations and
overweight status in the offspring
Cross-sectional models (n=485)
Exposure ORa (95% CI) p value
Amino acid
Alanineb 9.23 (2.42, 35.23)
* 0.0011
Valineb 88.27 (7.79, 999.85)
* 0.0003
Kynurenateb 9.32 (3.14, 27.64)
* 5.710
−5
Tyrosineb 37.21 (5.66, 244.55)
* 0.0002
Lipid
Androsterone sulphateb 2.02 (1.37, 2.98)
* 0.0004
Androstenediol (3β,17β) disulphate (1)b 1.92 (1.33, 2.77)
* 0.0005
Epiandrosterone sulphateb 1.96 (1.34, 2.88)
* 0.0005
5α-Androstan-3β,17β-diol disulphateb 1.92 (1.31, 2.81)
* 0.0007
Dehydroisoandrosterone sulphate
(DHEA-S)b
1.94 (1.26, 2.98)* 0.0028
Carnitineb 139.11 (11.03, 1754)
* 0.0001
Thromboxane B2 2.32 (1.44, 3.73)* 0.0005
Butyrylcarnitine (C4)b 2.90 (1.63, 5.17)
* 0.0003
2-Aminoheptanoateb 4.32 (1.68, 11.11)
* 0.0024
Glycerol 5.90 (2.11, 16.50)* 0.0007
Stearidonate (18:4 n-3) 3.40 (1.53, 7.54)* 0.0026
Cofactor/vitamin
N1-methyl-4-pyridone-3-carboxamideb 4.37 (1.85, 10.31)
* 0.0008
Nucleotide
Urateb 35.05 (4.58, 268.08)
* 0.0006
Peptide
γ-Glutamyltyrosineb 8.24 (2.29, 29.62)
* 0.0012
Xenobiotic
Piperine 1.81 (1.32, 2.47)* 0.0002
Cross-sectional models: crude associations between overweight status and metabolite concentrations at the same
visit. Only the metabolites significantly associated with being overweight in the cross-sectional models after
multiple testing correction are reported in the table aOR for overweight status
bReported in the literature [15, 16] to be associated with overweight status in children
*Significant after correction for multiple testing
23
Table 5 Association between maternal type 1 diabetes and being overweight in the offspring
adjusting for different covariates in the metabolomics subset (n=485)
Model and adjustment OR for overweight
status (95% CI) p value
Model 1 2.44 (1.33, 4.50) 0.004
Model 2 2.51 (1.23, 5.12) 0.004
Model 2a
Birthweight 2.20 (1.04, 4.66) 0.040
Model 2b
Amino acid
Kynurenate 2.81 (1.34, 5.89) 0.006
Tyrosine 2.55 (1.23, 5.31) 0.012
Valine 2.76 (1.33, 5.70) 0.006
Alanine 2.51 (1.21, 5.21) 0.013
Lipid
Androsterone sulphate 2.54 (1.23, 5.24) 0.012
Androstenediol (3β,17β)
disulphate (1) 2.47 (1.20, 5.09) 0.014
Epiandrosterone sulphate 2.57 (1.24, 5.32) 0.011
5α-Androstan-3β,17β-diol
disulphate 2.37 (1.15, 4.89) 0.020
Dehydroisoandrosterone
sulphate (DHEA-S) 2.50 (1.22, 5.14) 0.013
Carnitine 2.52 (1.22, 5.20) 0.013
Thromboxane B2 2.66 (1.29, 5.49) 0.008
Butyrylcarnitine (C4) 2.72 (1.32, 5.63) 0.007
2-Aminoheptanoate 2.47 (1.20, 5.07) 0.014
Glycerol 2.47 (1.19, 5.12) 0.015
Stearidonate (18:4 n-3) 2.58 (1.25, 5.34) 0.011
Cofactor/vitamin
N1-Methyl-4-pyridone-3-
carboxamide 2 2.64 (1.27, 5.47) 0.009
Nucleotide
Urate 2.45 (1.18, 5.08) 0.016
Peptide
γ-Glutamyltyrosine 2 2.54 (1.23, 5.25) 0.011
Xenobiotic
Piperine 2.66 (1.28, 5.51) 0.009
Model 2c
PC3 2.50 (1.21, 5.18) 0.014
PC5 2.87 (1.37, 6.04) 0.005
PC13 2.59 (1.25, 5.37) 0.010
Model 1: Crude model; Model 2: Adjusted for Tanner’s staging, maternal smoking and socioeconomic status aFurther adjusted for birthweight bFurther adjusted for metabolites significant for being overweight cFurther adjusted for principal components significant for being overweight
PC, principal components

24
Figure legends
Fig. 1 Mean and 95% CI for BMI (a, d), weight (b, e) and height (c, f) SDSs stratified by age and
maternal type 1 diabetes in the TEENDIAB (a–c) and BABYDIAB/BABYDIET (d–f) cohorts. Black
circles, offspring of mothers with type 1 diabetes; white circles, offspring of non-diabetic mothers
25
Fig. 2 Association between super- and subpathways of metabolites and overweight status in the
offspring. Pathways located to the right of the zero line indicate upregulation, and left of the zero line
downregulation, in overweight individuals. Pathways lying beyond the dashed grey line on both sides
indicate associations with p<0.05 without adjustment for multiple testing. After multiple testing
correction, the subpathways of androgenic steroids, BCAA metabolism, glycerolipid metabolism,
lysine metabolism, polypeptide and food component/plant were upregulated in overweight
individuals. Similarly, the superpathway nucleotide was also found to be upregulated in overweight
individuals. *Significance after correction for multiple testing. The numbers in brackets represent the
number of metabolites in each super- or subpathway. Black squares, superpathway; grey squares,
subpathway. SAM, S-Adenosyl methionine; TCA, tricarboxylic acid
26
Electronic supplementary material
ESM Table 1: Effect estimates for anthropometric and metabolic outcomes in offspring born to mothers with T1D and fathers with T1D compared to parents
without T1D in the TEENDIAB and BABYDIAB/BABYDIET cohort.
Outcomes
TEENDIAB
Reference: No parental T1D (N=104)
BABYDIAB/BABYDIET
Reference: No parental T1D (N=56)
Maternal T1D (N=250) Paternal T1D (N=249) Maternal T1D (N=1243) Paternal T1D (N=826)
Estimates (95% CI) Estimates (95% CI) Estimates (95% CI) Estimates (95% CI)
Absolute change in SD scores
Height SDS 0.04 (-0.18, 0.27) 0.16 (-0.06, 0.38) 0.09 (-0.16, 0.33) 0.16 (-0.09, 0.40)
Weight SDS 0.33 (0.10, 0.57)* 0.16 (-0.07, 0.40) 0.26 (0.04, 0.49)* 0.21 (-0.02, 0.44)
BMI SDS 0.43 (0.18, 0.67)** 0.11 (-0.13, 0.35) 0.28 (0.05, 0.52)* 0.15 (-0.08, 0.39)
Waist circumference SDS 0.26 (0.01, 0.52)* 0.04 (-0.21, 0.29) - -
Subscapular skinfold SDS 0.28 (0.05, 0.51)* 0.16 (-0.06, 0.39) - -
Triceps skinfold SDS 0.17 (-0.09, 0.43) 0.04 (-0.22, 0.30) - -
SBP SDS 0.18 (-0.05, 0.41) 0.06 (-0.16, 0.29) - -
DBP SDS 0.29 (0.07, 0.51)* 0.21 (-0.01, 0.43) - -
HDL SDS 0.16 (-0.16, 0.48) 0.17 (-0.14, 0.49) - -
LDL SDS 0.12 (-0.15, 0.39) 0.04 (-0.23, 0.31) - -
Triglyceride SDS 0.11 (-0.09, 0.31) 0.03 (-0.17, 0.24) - -
Cholesterol SDS 0.16 (-0.09, 0.42) 0.11 (-0.15, 0.36) - -
Percent change in metabolic outcomes
Fasting glucose 2.78 (0.74, 4.85)* 1.53 (-0.49, 3.58) - -
Fasting insulin 15.63 (4.57, 27.85)** 10.54 (-0.04, 22.24) - -
Fasting C-peptide 10.93 (2.29, 20.29)* 8.25 (-0.16, 17.37) - -
HOMA-IR 16.39 (4.77, 29.31)** 10.13 (-0.89, 22.36) - -
Odds ratios
Overweight 3.10 (1.30, 7.42)* 1.60 (0.65, 3.90) 3.23 (1.55, 6.73)** 2.30 (1.10, 4.82)*
Abdominal obesity 2.34 (1.05, 5.22)* 1.34 (0.59, 3.06) - -
Metabolic risk 1.66 (1.07, 2.56)* 1.20 (0.77, 1.85) - - T1D: type 1 diabetes, N: number of subjects, CI: Confidence interval, SDS: standard deviation scores, SBP: systolic blood pressure, DBP: diastolic blood
pressure, HDL: high-density lipoprotein, LDL: low-density lipoprotein; HOMA-IR: homeostasis model assessment of insulin resistance
Adjusted for age, sex (except for overweight, abdominal obesity, metabolic risk and SDS outcomes), Tanner’s staging, maternal smoking and additionally
socioeconomic status only in TEENDIAB study.
*indicates p-value < 0.05; **indicates p-value < 0.005
27
ESM Table 2: Effect estimates for anthropometric and metabolic outcomes in offspring born to a mother with compared to without type 1 diabetes in the
TEENDIAB cohort after adjustment for dietary inflammatory index (DII, model 3a) and energy residuals (model 3b).
Outcomes Model 1 Model 2 Model 3a Model 3b
N Estimates (95% CI) N Estimates (95% CI) N Estimates (95% CI) N Estimates (95% CI)
Absolute change in SD scores
Height SDS 330 -0.26 (-0.48, -0.04)* 292 -0.25 (-0.49, -0.02)* 292 -0.27 (-0.50, -0.04)* 292 -0.29 (-0.52, -0.06)*
Weight SDS 330 0.14 (-0.07, 0.36) 292 0.14 (-0.08, 0.37) 292 0.14 (-0.08, 0.37) 292 0.12 (-0.11, 0.34)
BMI SDS 330 0.39 (0.17, 0.62)** 292 0.40 (0.17, 0.63)** 292 0.41 (0.17, 0.64)** 292 0.38 (0.15, 0.62)**
Waist circumference SDS 134 0.04 (-0.31, 0.38) 119 0.04 (-0.31, 0.40) 119 0.04 (-0.32, 0.39) 119 0.02 (-0.33, 0.38)
Subscapular skinfold SDS 315 0.22 (0.03, 0.43)* 282 0.20 (-0.01, 0.42) 282 0.20 (-0.01, 0.42) 282 0.21 (-0.01, 0.42)
Triceps skinfold SDS 316 0.25 (0.03, 0.47)* 282 0.19 (-0.04, 0.42) 282 0.20 (-0.03, 0.44) 282 0.20 (-0.03, 0.44)
SBP SDS 320 0.19 (-0.09, 0.47) 284 0.25 (-0.05, 0.56) 284 0.25 (-0.06, 0.57) 284 0.26 (-0.05, 0.57)
DBP SDS 320 0.26 (0.00, 0.52) 284 0.28 (-0.01, 0.56) 284 0.28 (-0.01, 0.56) 284 0.27 (-0.02, 0.55)
HDL SDS 324 0.15 (-0.14, 0.44) 288 0.20 (-0.10, 0.51) 288 0.21 (-0.09, 0.51) 288 0.20 (-0.12, 0.53)
LDL SDS 324 0.11 (-0.14, 0.35) 288 0.13 (-0.13, 0.39) 288 0.13 (-0.13, 0.39) 288 0.13 (-0.13, 0.39)
Triglyceride SDS 324 0.03 (-0.16, 0.22) 288 0.09 (-0.11, 0.29) 288 0.09 (-0.12, 0.29) 288 0.08 (-0.12, 0.28)
Cholesterol SDS 324 0.15 (-0.08, 0.38) 288 0.19 (-0.05, 0.43) 288 0.19 (-0.05, 0.43) 288 0.19 (-0.05, 0.42)
Percent change in metabolic outcomes
Fasting glucose 320 1.37 (-0.59, 3.37) 284 2.40 (0.42, 4.42)* 284 2.39 (0.40, 4.41)* 284 2.03 (0.08, 4.01)*
Fasting insulin 321 3.90 (-9.23, 18.93) 285 10.70 (-3.18, 26.57) 285 10.35 (-3.52, 26.22) 285 9.79 (-4.06, 25.63)
Fasting C-peptide 142 0.38 (-12.33, 14.92) 132 1.70 (-11.10, 16.35) 132 0.05 (-12.51, 14.42) 132 -0.71 (-13.31, 13.73)
HOMA-IR 317 3.77 (-9.91, 19.52) 281 11.63 (-2.81, 28.21) 281 11.25 (-3.17, 27.82) 281 10.50 (-3.85, 26.99)
Odds ratios
Overweight 330 1.90 (0.87, 4.14) 292 1.94 (0.82, 4.60) 292 2.06 (0.86, 4.93) 292 1.89 (0.80, 4.50)
Abdominal obesity 155 0.75 (0.22, 2.62) 139 1.35 (0.33, 5.56) 139 1.34 (0.32, 5.64) 139 1.35 (0.33, 5.56)
Metabolic risk 330 1.51 (0.96, 2.36) 292 1.37 (0.84, 2.23) 292 1.40 (0.86, 2.29) 292 1.36 (0.83, 2.22)
(Cut-off 1.5 SD) CI: Confidence interval, SDS: standard deviation scores, SBP: systolic blood pressure, DBP: diastolic blood pressure, HDL: high-density lipoprotein, LDL: low-density
lipoprotein; HOMA-IR: homeostasis model assessment of insulin resistance; DII: Dietary inflammatory index
Model 1: Crude model ; Model 2: adjusted for age, sex (except for overweight, abdominal obesity, metabolic risk and SDS outcomes), Tanner’s staging, socioeconomic
status and maternal smoking; Model 3a: Model 2 + DII; Model 3b: Model 2+ energy residuals
*indicates p-value < 0.05; **indicates p-value < 0.005
28
ESM Table 3: Description of the principal components (PC) significantly associated with overweight
and its metabolites with higher loading values
PC significant for
overweight
Metabolites with absolute loading values
greater than 0.40
Eigen
value
Variance
explained (%)
PC3 (Lipids:
Androgenic,
pregnenolone and
progestin steroids)
Andro steroid monosulfate (2)
Androsterone sulfate
Androstenediol (3beta,17beta) disulfate (1)
Androstenediol (3beta,17beta) disulfate (2)
Epiandrosterone sulfate
5alpha-androstan-3beta,17beta-diol disulfate
Dehydroisoandrosterone sulfate (DHEA-S)
Thromboxane B2
21-hydroxypregnenolone disulfate
Pregnenolone sulfate
5alpha-pregnan-3beta,20alpha-diol disulfate
Pregn steroid monosulfate
Pregnen-diol disulfate
16.50 3.74%
PC5 (Amino acid:
BCAA, lysine,
phenyalanine,
tryptophan, tyrosine
metabolism, urea
cycle, acetylated
peptides)
Creatine
2-methylbutyrylcarnitine C5
Valine
Isobutyrylcarnitne C4
Leucine
Isovalerylcarnitine C5
Isoleucine
N6-acetyllysine
Urea
N1-Methyl-4-pyridone-3-carboxamide
N1-Methyl-2-pyridone-5-carboxamide
Propionylcarnitine C3
Gamma-glutamylvaline
Gamma-glutamylphenylalanine
Gamma-glutamylleucine
Gamma-glutamylisoleucine
10.53 2.39%
PC13 (Amino acid,
lipid, acetylated
peptides and
xenobiotics)
3-indoxyl sulfate
Glycolithocholate sulfate
Phenylacetylcarnitine
Phenylacetylglutamine
4-methylcatechol sulfate
P-cresol sulfate
3-phenylpropionate hydrocinnamate
5.75 1.30%
29
ESM Table 4: Percent change in metabolomics outcomes in offspring of type 1 diabetic mothers
compared to offspring of non-diabetic mothers
Outcomes Adjusted analysis* (N=485)
% change (95% CI) p-value
Amino acid
alanine 2.35 (-1.88; 6.76) 0.28
valine -1.15 (-3.32; 1.06) 0.30
kynurenate 0.04 (-4.48; 4.77) 0.99
tyrosine 1.06 (-1.92; 4.12) 0.49
Lipid
androsterone sulfate -4.2 (-17.74; 11.57) 0.58
androstenediol (3β.17β) disulfate (1)* -4.34 (-16.53; 9.62) 0.52
epiandrosterone sulfate -5.38 (-18.34; 9.63) 0.46
5α-androstan-3β.17β-diol disulfate 7.56 (-4.26; 20.83) 0.22
dehydroisoandrosterone sulfate (DHEA-S) -5.86 (-16.65; 6.31) 0.33
carnitine 1.41 (-1.18; 4.06) 0.29
thromboxane B2 -4.77 (-15.04; 6.74) 0.40
butyrylcarnitine (C4) -0.96 (-8.4; 7.09) 0.81
2-aminoheptanoate 1.24 (-4.56; 7.38) 0.68
glycerol 3.32 (-1.8; 8.72) 0.21
stearidonate (18:4n3) -0.25 (-7.18; 7.2) 0.95
Cofactors and Vitamins
N1-Methyl-4-pyridone-3-carboxamide -2.59 (-9.04; 4.32) 0.45
Nucleotide
urate 0.68 (-2.22; 3.66) 0.65
Peptide
gamma-glutamyltyrosine 2.11 (-2.2; 6.61) 0.34
Xenobiotic
piperine -2.99 (-18.83; 15.94) 0.74
*Adjusted for age and sex
30
ESM Fig 1: Mean and 95% confidence interval (CI) of a) fasting glucose, b) fasting insulin, c) fasting
C-peptide, d) homeostasis model assessment of insulin resistance (HOMA-IR), e) systolic blood
pressure standard deviation scores (SDS), and f) diastolic blood pressure SDS stratified by age and
maternal type 1 diabetes (black circles: offspring of type 1 diabetic mothers; white circles: offspring
of non-diabetic mothers) in the TEENDIAB cohort.
a
b
c
e
d
f
31
ESM Fig. 2: Trajectories of a) body mass index (BMI), b) weight and c) height by age and maternal
diabetes status (solid lines: offspring of type 1 diabetic mothers; dashed lines: offspring of non-
diabetic mothers) adjusted for age, sex, Tanner’s staging and maternal smoking from the combined
data of TEENDIAB and BABYDIAB/BABYDIET cohorts.
a
b
c
Weig
ht
(kg
)B
MI
(kg
/m2)
He
igh
t (m
)
32
ESM Fig. 3: Mean and 95% confidence intervals (CI) of body mass index (BMI; a, c), weight (b, e)
and height (c, f) stratified by age and maternal type 1 diabetes (black circles: offspring of type 1
diabetic mothers; white circles: offspring of non-diabetic mothers) in the TEENDIAB (a-c) and
BABYDIAB/BABYDIET (d-f) cohorts.
a
b
c
e
d
f
33
ESM Fig. 4: Association between principal components (PC) of metabolites and overweight
presented as odds ratios (blue circles) with 95% confidence intervals (bars). Pathways with (*)
indicates significance after correction for multiple testing. After multiple testing correction, three
principal components of metabolites were associated with offspring overweight.
34
ESM Fig. 5: Association between principal components (PC) of metabolites and maternal type 1
diabetes presented as absolute change in PC scores (blue circles) with 95% confidence intervals
(bars). After multiple testing correction, no principal components of metabolites were associated with
maternal type 1 diabetes.
35
ESM Fig. 6: Association between super and sub-pathways of metabolites and maternal type 1
diabetes
Pathways located to the right of the zero line indicate up-regulation, and left to the zero line down-
regulation, in offspring of type 1 diabetic mothers. Pathways lying beyond the red dashed line indicate
associations of p<0.05 without adjustment for multiple testing. However, after multiple testing
correction, no super- and sub-pathways of metabolites were significantly associated with maternal
type 1 diabetes.