Embed Size (px)
Citation preview
Sustainability 2021, 13, 818. https://doi.org/10.3390/su13020818 www.mdpi.com/journal/sustainability
Article
Determinant Factors of Electricity Consumption
for a Malaysian Household Based on a Field Survey
Boni Sena 1, Sheikh Ahmad Zaki 1,*, Hom Bahadur Rijal 2, Jorge Alfredo Ardila‐Rey 3, Nelidya Md Yusoff 4,
Fitri Yakub 1, Mohammad Kholid Ridwan 5 and Firdaus Muhammad‐Sukki 6
1 Malaysia‐Japan International Institute of Technology, Universiti Teknologi Malaysia,
Kuala Lumpur 81310, Malaysia; [email protected] (B.S.); [email protected] (F.Y.) 2 Faculty of Environmental Studies, Tokyo City University, Yokohama 224‐8551, Japan; [email protected] 3 Department of Electrical Engineering, Universidad Técnica Federico Santa María,
Santiago de Chile 8940000, Chile; [email protected] 4 Razak Faculty of Technology and Informatics, Universiti Teknologi Malaysia,
Kuala Lumpur 81310, Malaysia; [email protected] 5 Faculty of Engineering, Gadjah Mada University, Yogyakarta 55281, Indonesia; [email protected] 6 School of Engineering & the Built Environment, Edinburgh Napier University, Merchiston Campus,
10 Colinton Road, Edinburgh EH10 5DT, UK; [email protected]
* Correspondence: [email protected]
Abstract: Electricity‐saving strategies are an essential solution to overcoming increasing global CO2
emission and electricity consumption problems; therefore, the determinant factors of electricity
consumption in households need to be assessed. Most previous studies were conducted in
developed countries of subtropical regions that had different household characteristic factors from
those in developing countries of tropical regions. A field survey was conducted on electricity
consumption for Malaysian households to investigate the factors affecting electricity consumption
that focused on technology perspective (building and appliance characteristics) and socio‐economic
perspective (socio‐demographics and occupant behaviour). To analyse the determinant factors of
electricity consumption, direct and indirect questionnaire surveys were conducted from November
2017 to January 2018 among 214 university students. Direct questionnaire surveys were performed
in order to obtain general information that is easily answered by respondents. On the other hand,
some questions such as electricity consumption and detailed information of appliances must be
confirmed by the respondents’ parents or other household members through an indirect
questionnaire survey. The results from multiple linear regression analyses of the survey responses
showed that appliance characteristic factors were the main variables influencing electricity
consumption and house characteristics were the least significant. Specifically, air conditioners,
fluorescent lamps, and flat‐screen TVs emerged as appliances with the most significant effect on
electricity consumption. Occupant behaviour factors had a more significant influence than socio‐
demographic factors. The findings in this study can be used by policymakers to develop electricity‐
saving strategies in Malaysia.
Keywords: appliance characteristic; determinant factors; electricity consumption; house
characteristic; occupant behaviour; socio‐demographic
1. Introduction
In recent years, energy consumption in Malaysia has seen a 20.7% contribution from
the residential sector [1]. The average electricity consumption for residential was 345 kWh
per month based on the survey of 348 samples in Malaysia [2]. The electricity
consumption for residential in Malaysia is expected to rise due to increasing appliance
ownership, economic improvement and changing lifestyle [3]. An electricity‐saving
strategy for the residential household is required to overcome these issues.
Citation: Sena, B.; Zaki, S.A.; Rijal,
H.B.; Ardila‐Rey, J.A.; Yusoff, N.M.;
Yakub, F.; Ridwan, M.K.;
Muhammad‐Sukki, F. Determinant
Factors of Electricity Consumption for
a Malaysian Household based on a
Field Survey. Sustainability 2021, 13,
818. https://doi.org/10.3390/su13020818
Received: 9 December 2020
Accepted: 11 January 2021
Published: 15 January 2021
Publisher’s Note: MDPI stays
neutral with regard to jurisdictional
claims in published maps and
institutional affiliations.
Copyright: © 2021 by the authors.
Licensee MDPI, Basel, Switzerland.
This article is an open access article
distributed under the terms and
conditions of the Creative Commons
Attribution (CC BY) license
(http://creativecommons.org/
licenses/by/4.0/).
Sustainability 2021, 13, 818 2 of 30
Developing an electricity‐saving strategy for residential households is challenging
due to different factors such as socio‐demographic factors, house characteristics,
appliance characteristics, and occupant behaviour. Those factors can be classified as
monthly income, education level, family composition, total floor area, house type,
appliance ownership, use of appliances and so on. Furthermore, the amount of electricity
consumed may be affected by complex interactions between these factors [4].
Kim [5] examined determinant factors of households in Korea from 2250 samples and
found that socio‐demographic factors, appliance characteristics, and occupant behaviour
had complex interactions with electricity consumption. Data confirmed that type of
cooling had a strong correlation with age and education level of household head, monthly
income, family composition, total floor area, and the number of people living in the
household. Chen et al. [6] conducted a field survey about residential energy consumption
in China from 642 households during winter and 838 households during the summer.
They found that the number of rooms, family size, age, number of air conditioners,
education level and air conditioning consumption showed intercorrelation with each
other. Shahi et al. [7] studied energy use in rural, semi‐urban, and urban areas of Nepal
from 442 households. They identified intercorrelated energy use between income,
occupation, family size, education level, and usage of LED lamps.
The assessment of the determinants of electricity consumption is needed in order to
find out which factors are significant contributors to electricity consumption in residential
households. These determinant factors can be divided into four general groups: socio‐
demographics [4,6,8], building characteristics [9–11], appliance characteristics [12–14],
and occupant behaviour in terms of using appliances [15–19].
1.1. Socio‐Demographic Factors
The effect of socio‐demographic factors on household electricity consumption has
been studied by many previous research studies. Jones and Lomas [20] studied
determinants of high electrical energy demand for residential dwellings in the UK from a
sample of 315. Higher annual income households showed more significant factors
affecting high electricity consumption than lower annual income households. The oldest
people in the home were responsible for less electricity consumption than younger people.
Chen et al. [6] conducted a field survey regarding residential energy consumption in
China from 642 households during winter and 838 households during summer; significant
factors affecting residential energy consumption were income, age of respondents, and
family composition. Similar findings were found by Hara et al. [8] who studied
determinant factors of residential electricity consumption in Japan based on a large‐scale
questionnaire. In a nutshell, previous investigations in temperate or so‐called subtropical,
hot and humid regions confirmed that the socio‐demographic factors emerged as factors
unaffected by climate. Socio‐demographic factors such as monthly income [4,8,15], the
number of household occupants [2,16,21], family composition [4,6,14,15,22], age of
household occupants [4,6,8], education level [18,23,24], and employment status [4] were
determined as significant factors influencing electricity consumption.
1.2. Building Characteristic Factors
Building characteristic factors showed different effects on household electricity
consumption. Tso and Yau [9] conducted a study of electricity consumption for residential
dwellings in Hong Kong with 1500 respondents. Some house characteristic factors were
found to be significant influencers of electricity consumption such as the type of house
and total floor space. Karatasou et al. [11] conducted a study to investigate the
determinants of high residential electricity consumption from 144 dwellings in Europe;
they found that the number of bedrooms showed a strong correlation with electricity
consumption. The total floor area and the age of the building were also significant
influencers of electricity consumption. Esmaeilimoakher et al. [10], who studied
determinants of electricity consumption for social housing in Western Australia from a

Sustainability 2021, 13, 818 3 of 30
sample of 17 households, obtained different results. They found that dwellings with larger
floor areas tended to use less electricity than those with smaller floor areas.
Some studies in temperate regions consider additional retrofits such as glazing
windows [25,26] and house insulation [11,25,26] as significant factors affecting electricity
consumption, as these help with extreme temperature management in hot and cold
seasons without consuming electricity. Other studies in hot and humid regions have
confirmed that floor area [12,18] and the number of rooms [12] are significant factors
affecting electricity consumption.
1.3. Appliances Characteristic Factors
According to previous studies, household appliances caused a significant impact on
electricity consumption. Ndiaye and Gabriel [13] studied determinant factors of electricity
consumption from 269 houses in Canada. The results showed that the type of air
conditioning (AC) and the number of incandescent lamps emerged as significant factors
affecting electricity consumption. Bedir et al. [14] and Bedir and Kara [27] reported on the
determinant factors of electricity consumption from 323 dwellings in the Netherlands.
Appliances such as entertainment appliances (televisions, computers, games consoles,
etc.), cooking appliances (coffee machines, electric kettles, microwave ovens, etc.), and
cleaning appliances (irons, vacuum cleaners, washing machines, etc.) were confirmed as
significant factors affecting electricity consumption. Azlina et al. [12], who studied factors
influencing the electricity consumption in Terengganu, Malaysia with a sample of 1561
respondents, obtained similar results. The number of air conditioning appliances, cooking
appliances (refrigerators, electric kettles), televisions, heaters, and vacuum cleaners
significantly contributed to electricity consumption.
Ownership of some appliances such as clothes dryers [9,14,21,23], heating systems
[18,26,28], and air conditioners [13,14,29] appeared as significant factors of electricity
consumption in temperate regions. These appliances are needed in regions with extreme
conditions such as hot, rainy, and cold climates that need heaters and coolers to maintain
the room temperature and clothes dryers to dry clothes. Fan ownership was not common
in temperate regions and was not a significant factor affecting electricity consumption [9].
Nevertheless, fan ownership emerged as a substantial factor in influencing electricity
consumption in hot and humid climates [12,18].
1.4. Occupant Behaviour Factors
Occupant behaviour showed various characteristics of household electricity
consumption. Ashouri et al. [29] confirmed that occupant behaviour significantly affected
energy consumption based on large datasets in Japan. Jones and Lomas [15] analysed
determinant factors of high electricity consumption for 183 dwellings in the UK to
examine occupant behaviour in the use of appliances. The duration of usage of some
appliances such as desktop computers, laptops, telephones, electric hobs, dishwashers,
washing machines, and electric showers emerged as significant factors affecting electricity
consumption. Similar findings were also confirmed by Huebner et al. [16], who studied
determinant factors of electricity consumption using a sample of 845 households in the
UK. The duration of usage of household appliances such as televisions, ovens, electric
grills, dishwashers, lighting, and dryers significantly affected the total electricity
consumption. Wijaya and Tezuka [18] investigated electricity consumption and the factors
driving it in residential homes using a sample of 200 households in Indonesia. Usage of
cooling, cooking, and entertainment and information devices significantly affected
electricity consumption.
Occupants in temperate regions showed different behaviour than those in hot and
humid regions. Steemers et al. [17] performed a study in the United States based on 4882
housing units and reported that occupants tended to consider outdoor temperatures while
using heating and air conditioning appliances. Pal et al. [30] also proved that the occupant
behaviour in using heating appliances affected the energy consumption from an office in
Sustainability 2021, 13, 818 4 of 30
France. In contrast, Kubota et al. [19] conducted a survey with 338 respondents on terrace
houses in Malaysia and found that occupants did not consider outdoor temperatures
while using air conditioning appliances. This was because Malaysia has hot and humid
weather conditions regularly and outdoor temperatures remain almost constant
throughout the year. Ranjbar et al. [31], who investigated 10 dwellings of low‐cost
apartments in Malaysia, obtained similar results; they confirmed a weak correlation
between outdoor air temperature and air conditioning usage.
Jaffar et al. [28] studied energy demand for residential buildings in Kuwait using 250
households and they found that most occupants set the temperature of air conditioning
between 20 °C and 22 °C. In other studies, Kubota et al. [19] reported that occupants in
Malaysia set the temperature between 20 °C and 21 °C based on a survey from 213
respondents. Hisham et al. [32] who performed field measurements on 19 dwellings
consisting of low‐cost apartments and one terraced house in Malaysia, found that the
temperature setting of air conditioning ranged from 16 °C to 28 °C.
Kim [5] discovered that the average operating time for air conditioners was 0.32
h/day in 2250 households in Korea. In contrast, Kubota et al. [19] found that the average
operating times for air conditioning appliances in Malaysia was 6 h/day. Zaki et al. [33]
studied 38 dwellings in Kuala Lumpur and found that the average operating times of air
conditioning appliances mostly ranged from 1 h/day to 6 h/day. Similarly, Aqilah et al.
[34] reported that the average operating times of air conditioning appliances in Kuala
Lumpur was almost 3 h/day.
1.5. Research Gaps and Objectives
Previous studies of determinant factors of electricity consumption have been mostly
conducted in developed countries in subtropical regions. There are few similar studies on
this topic in developing countries, especially in tropical regions where determinant factors
of electricity consumption might differ from those in developed countries due to different
socio‐economic levels, cultures, and climatic conditions. Data on factors affecting
electricity consumption are essential for tropical regions so that specific electricity‐saving
strategies can be established based on factors related to household characteristics.
For Malaysia, only Azlina et al. [12] examined a limited number of socio‐
demographic factors (marital status, monthly income, number of people living), house
characteristics (total floor area, number of bathrooms), occupant behaviour (attitudes
toward energy savings, environmental information), and appliance characteristics (air
conditioners, refrigerators, freezers, heaters, vacuums, rice cookers, kettles, irons, and
televisions). The current study improves knowledge and understanding by investigating
comprehensively additional factors of household characteristics. This study also aims to
determine a comprehensive set of determinant factors affecting electricity consumption in
Malaysian households. Its specific objectives are to use multiple linear regression analysis
to assess correlation significance amongst factors of household characteristics in terms of
electricity consumption.
2. Materials and Methods
2.1. Field Survey
Field questionnaire surveys were conducted on 214 volunteer students at the
Malaysia‐Japan International Institute of Technology (MJIIT), Universiti Teknologi
Malaysia (UTM), Kuala Lumpur from November 2017 to January 2018. The students
answered the survey questions referring to their family or parent’s house since most of
them were staying in the university dormitory at the time the survey was conducted. The
sample consisted of 113 males (52.8%) and 101 females (47.2%). The average age was 22
years old, with a standard deviation of 6 years. Family or parent houses of students were
in various states as shown in Figure 1. The total number of students who answered about
their house location was 179 (83.6%). Most of the surveyed houses were in Selangor
Sustainability 2021, 13, 818 5 of 30
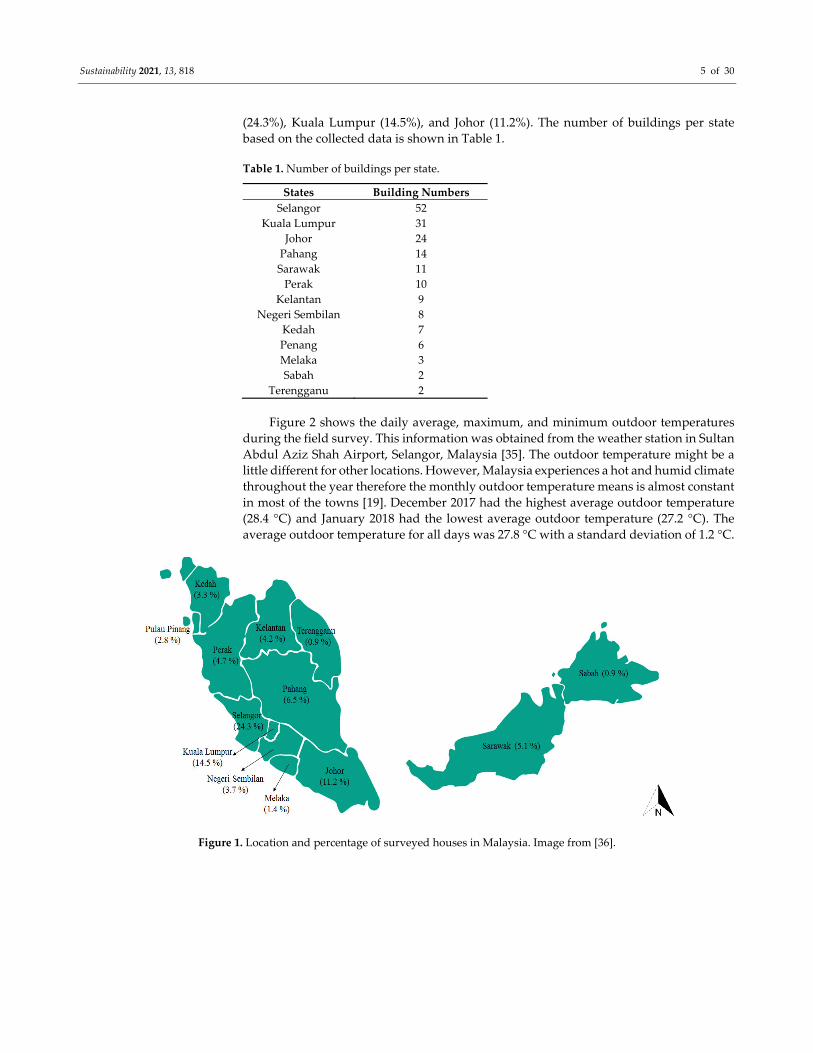
(24.3%), Kuala Lumpur (14.5%), and Johor (11.2%). The number of buildings per state
based on the collected data is shown in Table 1.
Table 1. Number of buildings per state.
States Building Numbers
Selangor 52
Kuala Lumpur 31
Johor 24
Pahang 14
Sarawak 11
Perak 10
Kelantan 9
Negeri Sembilan 8
Kedah 7
Penang 6
Melaka 3
Sabah 2
Terengganu 2
Figure 2 shows the daily average, maximum, and minimum outdoor temperatures
during the field survey. This information was obtained from the weather station in Sultan
Abdul Aziz Shah Airport, Selangor, Malaysia [35]. The outdoor temperature might be a
little different for other locations. However, Malaysia experiences a hot and humid climate
throughout the year therefore the monthly outdoor temperature means is almost constant
in most of the towns [19]. December 2017 had the highest average outdoor temperature
(28.4 °C) and January 2018 had the lowest average outdoor temperature (27.2 °C). The
average outdoor temperature for all days was 27.8 °C with a standard deviation of 1.2 °C.
Figure 1. Location and percentage of surveyed houses in Malaysia. Image from [36].

Sustainability 2021, 13, 818 6 of 30
Figure 2. Outdoor daily temperature from November 2017 to January 2018 [35].
2.2. Questionnaire Survey
The questionnaire survey was based on one developed by the Jyukanko Research
Institute (JRI) [37] and modified by the lead author to meet the objectives of this research.
The questionnaire was in English with a Malay translation. The questionnaire surveys
were divided into two stages such as direct and indirect. The direct questionnaire surveys
were conducted based on the appointed schedule between the lead author and
respondents. The surveys were performed by disseminating the questionnaire then all
respondents would fill up the questionnaire based on guidance from the lead author. The
lead author explained each question and used pictures in some difficult questions to ease
the respondents in their answers. After finishing the direct questionnaire survey, the lead
author would check the answer. The lead author would conduct an indirect questionnaire
survey in order to investigate some illogical questions or answers by confirming to the
respondent’s parents or other household members. The lead author used social media
apps so that the respondents could confirm unanswered questions and uncleared answers
with the person who knows best for the answer. After the family member informed the
required information, the respondent would give it to the lead author using social media
apps. If the lead author still found an invalid and incomplete answer on the questionnaire,
the author would contact the respondent using social media apps through an indirect
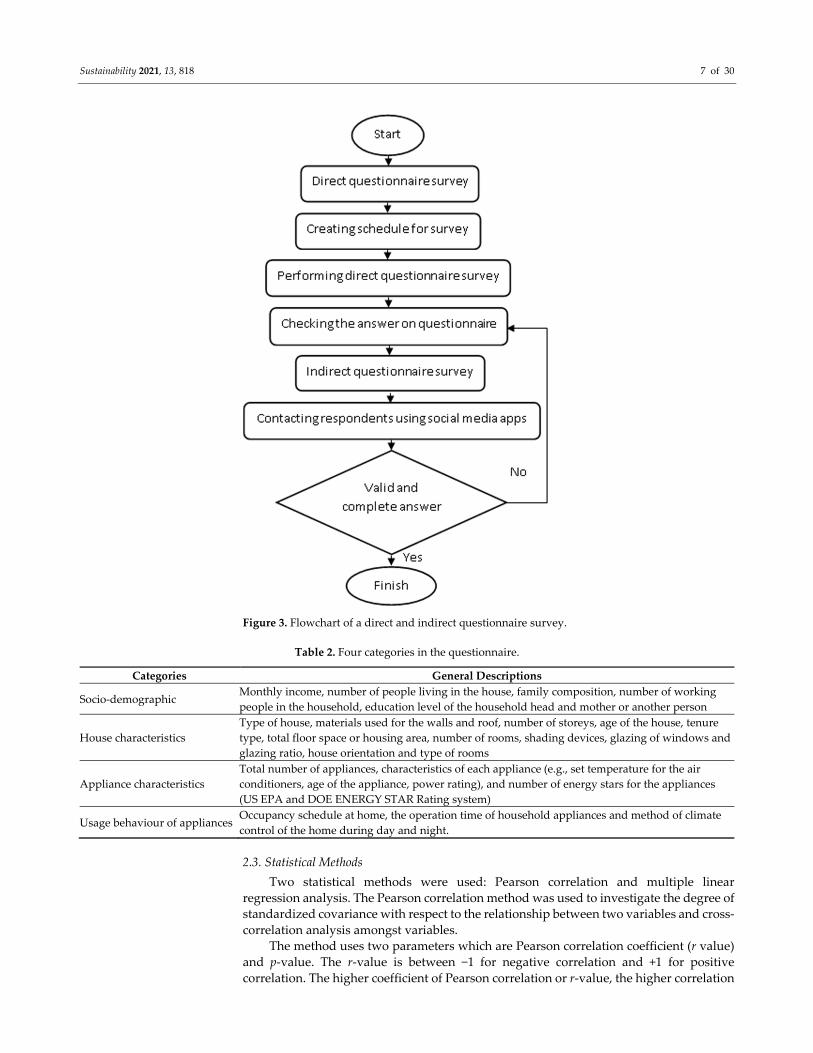
questionnaire survey and otherwise. Figure 3 shows the flowchart of a direct and indirect
questionnaire survey.
Electricity consumption values were obtained by collecting monthly electricity bills
from the respondents. The data of monthly electricity consumption were collected
between July 2017 and January 2018. Table 2 shows four categories in the questionnaire
with general descriptions for each factor. The number of energy stars for the appliances
refers to the standard of the United States Environmental Protection Agency and
Department of Energy (US EPA and DOE) rating system [38]. Tenure type means the
house was private ownership, rented house, or third‐party ownership. Education level
was interpreted as the education level for the household head, mother, or another person.
Some important questions and detailed descriptions for each factor are provided in
Appendixes A–C.
Sustainability 2021, 13, 818 7 of 30
Figure 3. Flowchart of a direct and indirect questionnaire survey.
Table 2. Four categories in the questionnaire.
Categories General Descriptions
Socio‐demographic Monthly income, number of people living in the house, family composition, number of working
people in the household, education level of the household head and mother or another person
House characteristics
Type of house, materials used for the walls and roof, number of storeys, age of the house, tenure
type, total floor space or housing area, number of rooms, shading devices, glazing of windows and
glazing ratio, house orientation and type of rooms
Appliance characteristics
Total number of appliances, characteristics of each appliance (e.g., set temperature for the air
conditioners, age of the appliance, power rating), and number of energy stars for the appliances
(US EPA and DOE ENERGY STAR Rating system)
Usage behaviour of appliances Occupancy schedule at home, the operation time of household appliances and method of climate
control of the home during day and night.
2.3. Statistical Methods
Two statistical methods were used: Pearson correlation and multiple linear
regression analysis. The Pearson correlation method was used to investigate the degree of
standardized covariance with respect to the relationship between two variables and cross‐
correlation analysis amongst variables.
The method uses two parameters which are Pearson correlation coefficient (r value)
and p‐value. The r‐value is between −1 for negative correlation and +1 for positive
correlation. The higher coefficient of Pearson correlation or r‐value, the higher correlation
Sustainability 2021, 13, 818 8 of 30
among observed variables. The measures of variability in one variable that is accounted
for by other variables or so‐called p‐values range from 0 to 1. The higher p‐value, the lower
significance of independent variable to the dependent variable and otherwise, the lower
p‐value (usually below 0.05 or 0.01), the more significance of independent variable to a
dependent variable [39]. The factors that had a significance (p ≤ 0.05) and a strong
correlation with electricity consumption were then used as the inputs in the multiple
linear regression analysis.
Multiple linear regression (MLR) was performed to assess the strength of the
relationship among datasets of independent variables or so‐called explanatory variables
and single output datasets of dependent variables. The method was used to investigate
determinant factors affecting electricity consumption because the variance of the
dependent variable, which was electricity consumption, can be explained by a set of
independent variables which were household characteristic factors as confirmed by
[18,22]. Equation (1) shows the general multiple linear regression model.
𝑦 𝑎 𝑥 𝑎 𝑥 ⋯ 𝑎 𝑥 𝑏 (1)
where x1 to xn are explanatory variables which consist of household characteristic factors
such as socio‐demographic, house characteristics, appliance characteristics, and occupant
behaviour. ai to an are regression coefficients, b is a constant regression coefficient, and y is
the electricity consumption. Similar to MLR, weighted regression is also performed to
investigate the relationship among variables by considering the amount of data in each
bin. There are four main parameters in the regression that are considered to interpret the
results such as regression coefficient (C), beta (β), p‐value and coefficient determination
(R2). The regression coefficient is used to measure how much the impact of explanatory
variables on the increase or decrease in electricity consumption. The higher coefficient,
the greater the number of electricity consumption or otherwise. Beta measures the
influence of the variables on the variance of electricity consumption. p‐value explains the
significance of the variables to the overall model. Coefficient determination (R2) measures
the variability of the output variable accounted for by the explanatory variables. Beta, p‐
value and R2 have a similar range from 0 to 1 which means that the higher those
parameters to 1, the stronger the influence, significance and variance of those parameters
to the model, respectively.
IBM SPSS version 23 was used as statistical software to analyze the dataset which
offered four methods of developing multiple linear regression: enter, forward, backward,
and stepwise. The stepwise method was selected as the preferred method because this
method generated multiple linear regression without a multicollinearity problem [39].
3. Results and Discussion
3.1. Overview of a Questionnaire Survey
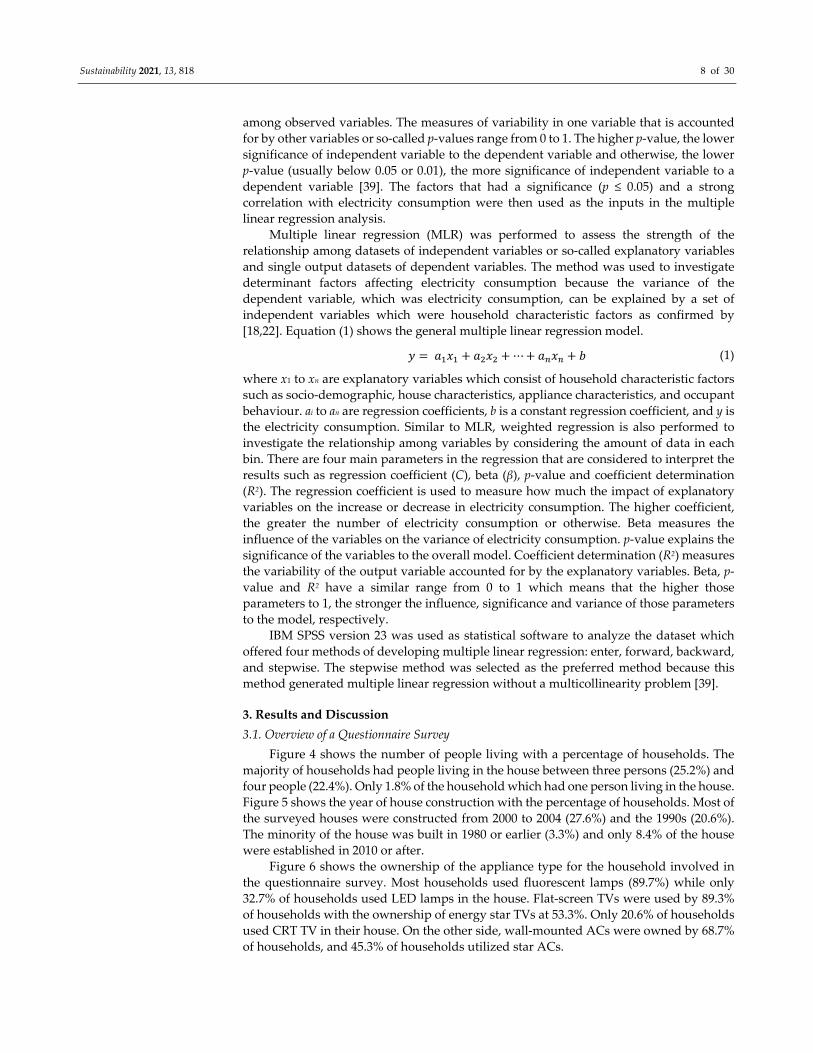
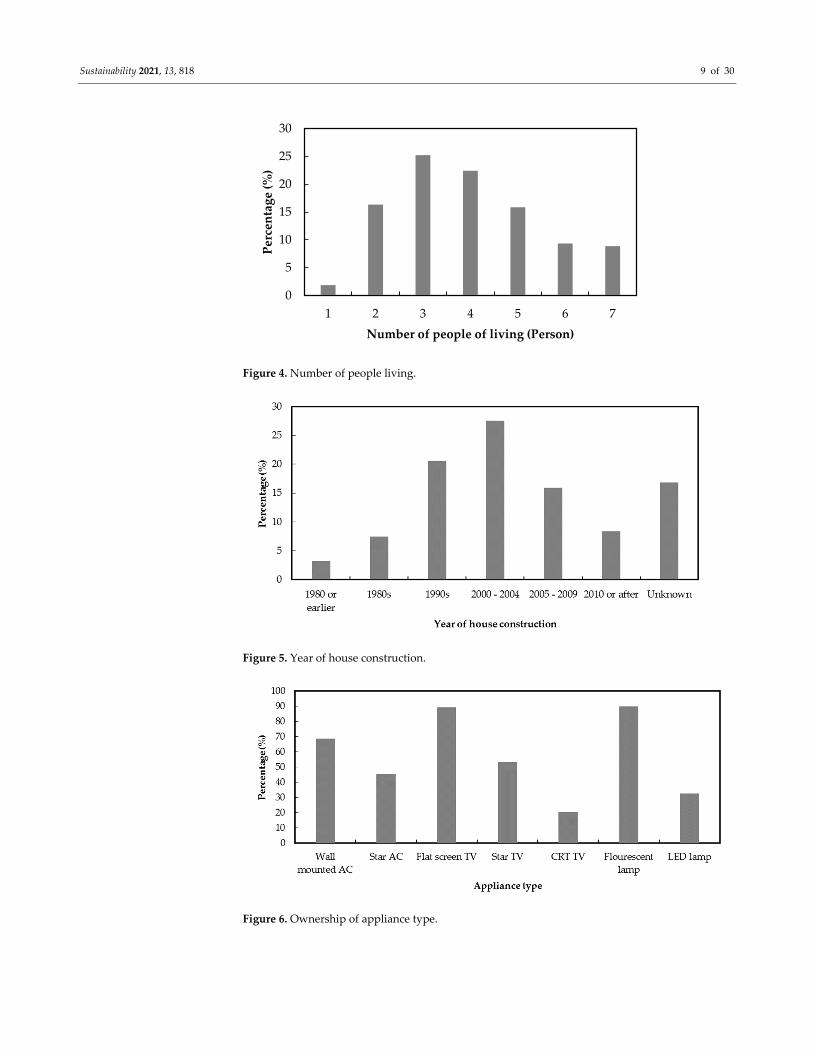
Figure 4 shows the number of people living with a percentage of households. The
majority of households had people living in the house between three persons (25.2%) and
four people (22.4%). Only 1.8% of the household which had one person living in the house.
Figure 5 shows the year of house construction with the percentage of households. Most of
the surveyed houses were constructed from 2000 to 2004 (27.6%) and the 1990s (20.6%).
The minority of the house was built in 1980 or earlier (3.3%) and only 8.4% of the house
were established in 2010 or after.
Figure 6 shows the ownership of the appliance type for the household involved in
the questionnaire survey. Most households used fluorescent lamps (89.7%) while only
32.7% of households used LED lamps in the house. Flat‐screen TVs were used by 89.3%
of households with the ownership of energy star TVs at 53.3%. Only 20.6% of households
used CRT TV in their house. On the other side, wall‐mounted ACs were owned by 68.7%
of households, and 45.3% of households utilized star ACs.
Sustainability 2021, 13, 818 9 of 30
Figure 4. Number of people living.
Figure 5. Year of house construction.
Figure 6. Ownership of appliance type.
0
5
10
15
20
25
30
1 2 3 4 5 6 7
Percentage (%)
Number of people of living (Person)

Sustainability 2021, 13, 818 10 of 30
3.2. Relationship between Household Characteristic Factors and Electricity Consumption
Table 3 shows only those household characteristic factors with significant and strong
correlations with electricity consumption according to the Pearson correlation analyses.
Monthly income, education level of the household head, and the number of household
members had a moderately significant correlation with electricity consumption. These
results were similar to those reported by Kim [5] and Chen et al. [6] except that family
composition was not found to be statistically significant in the current results, while Kim
[5] found that it was statistically significant.
The number of rooms had a moderately significant correlation which was similar to
findings from Jaffar et al. [28], while Chen et al. [6] found that the number of rooms was
not significantly correlated. Although Kim [5] found that the age of the building and
house type were significantly correlated, such factors did not show a significant
correlation in our study. The number of air conditioning units and the total number of
lamps had a significant correlation which was similar to findings from Chen et al. [6] and
Bedir and Kara [27].
Some appliances such as CD/DVD players, washing machines, vacuum cleaners,
incandescent lamps, freezers, irons, and hair dryers were not significantly correlated,
which differ from what Genjo et al. [40], Azlina et al. [12], and Bedir and Kara [27] found.
Usage of some appliances on weekdays and weekends such as entertainment, cooking,
and miscellaneous appliances were not significantly correlated with electricity
consumption. Bedir and Kara [27] also found that usage of entertainment and
miscellaneous appliances was not significantly correlated, however, they also found that
usage of cooking appliances was significantly correlated with electricity consumption.
Table 3. Pearson correlation between household characteristic factors and electricity consumption.
Household Characteristic Factors N r p
Monthly income 214 0.36 <0.001
Number of people in the household 214 0.22 0.001
Number of working people in the household 214 0.18 0.005
Education level of the household head 214 0.30 <0.001
Education level of the mother or other persons 214 0.14 0.022
Number of storeys 214 0.16 0.009
Total floor area 214 0.14 0.023
Number of rooms 214 0.31 <0.001
Number of windows 214 0.18 0.004
Number of fluorescent lamps 192 0.31 <0.001
Number of LED lamps 70 0.12 0.036
Number of lamps (all) 214 0.40 <0.001
Glazing ratio of north‐facing window(s) 214 0.16 0.010
Number of TV energy stars 114 0.20 0.002
Number of AC energy stars 97 0.26 <0.001
Number of kitchen hooks 99 0.13 0.030
Number of microwave ovens 150 0.16 0.009
Number of game consoles 65 0.19 0.004
Number of satellite TVs 157 0.23 0.001
Age of AC 147 0.32 <0.001
Power rating of AC 147 0.27 <0.001
Number of chargers—tablet 97 0.30 <0.001
Number of routers 133 0.29 <0.001
Number of hair dryers 86 0.24 0.001
Number of chargers—smartphone 213 0.27 <0.001
Number of water pumps 30 0.18 0.004
Age of refrigerator 214 0.20 0.002
Cubic capacity of refrigerator 214 0.19 0.003
Number of vacuum cleaners 168 0.30 <0.001

Sustainability 2021, 13, 818 11 of 30
Number of washing machines 210 0.12 0.039
Number of chargers—laptop 196 0.20 0.002
Number of flat screen TVs 191 0.36 <0.001
Number of CRT TVs 44 −0.13 0.031
Number of miscellaneous appliances 212 0.32 <0.001
Number of stand fans 167 −0.16 0.012
Number of ceiling fans 203 0.26 <0.001
Age of stand fan 167 −0.22 0.001
Number of standalone freezers 22 0.17 0.006
Number of water heaters 105 0.18 0.003
Number of wall‐mounted ACs 147 0.54 <0.001
Usage of AC on weekdays 138 0.23 0.001
Usage of AC on weekends 141 0.24 0.001
Set temperature of AC 148 0.27 <0.001
Speed setting of stand fan 168 −0.19 0.005
Usage of entertainment appliance on weekends 212 0.15 0.033
Usage of entertainment appliance on weekdays 211 0.19 0.005
Usage of miscellaneous appliance on weekdays 212 0.18 0.008
Usage of water dispenser on weekdays 76 0.18 0.010
Usage of charger—laptop on weekdays 152 0.2 0.004
Usage of router on weekdays 116 0.26 <0.001
Usage of hair dryer on weekdays 61 0.15 0.025
Usage of electric water heater on weekdays 93 0.18 0.008
Usage of hair dryer on weekends 60 0.15 0.030
Usage of electric water heater on weekends 94 0.15 0.032
Note: N: number of samples, r: Correlation coefficient, p: Significant value of regression coefficient.
3.3. Correlation Analysis for Set Temperature of Ac and Electricity Consumption
Figure 7 shows the set temperature of air conditioners variation with the percentage
of households. The majority of households set the temperature somewhere between 19.1
°C and 25 °C (68.4%). These findings were similar to those found by Jaffar et al. [28] and
Kubota et al. [19].
Figure 7. Set temperature of air conditioning unit.
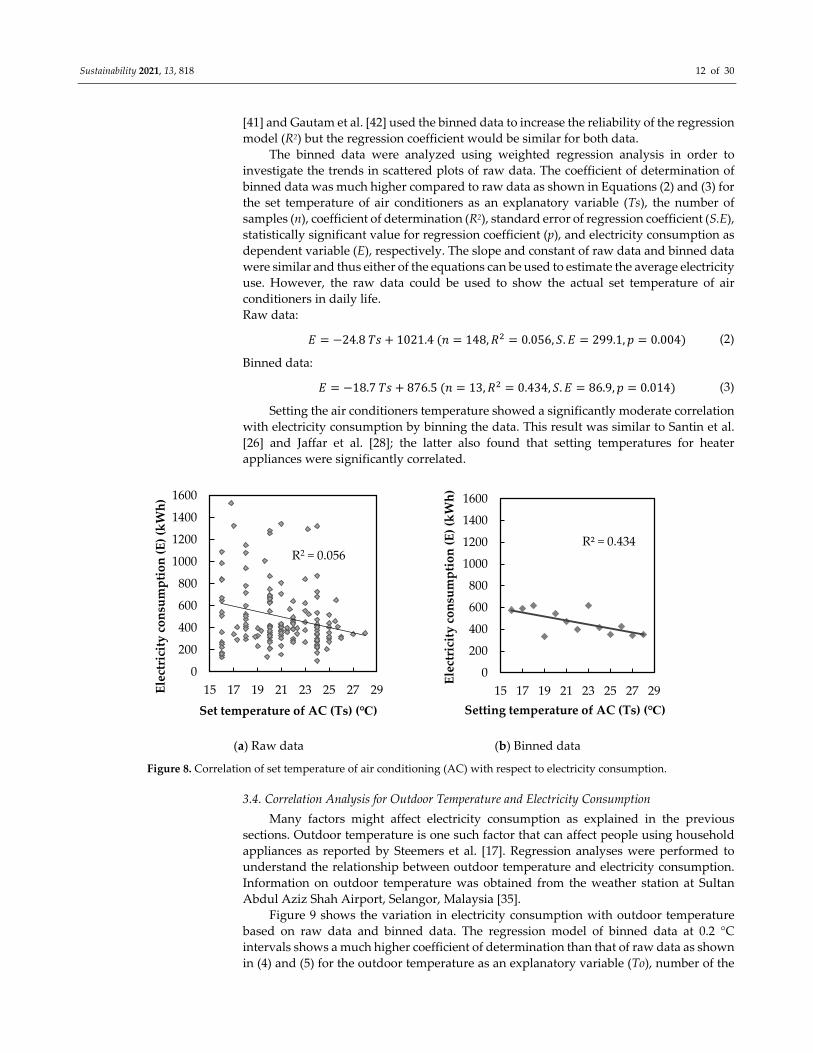
Figure 8 shows the correlation between the set temperature of air conditioners and
electricity consumption for raw data and binned data at 1 °C intervals. Raw data refer to
the observed data which were obtained in field survey and binned data proceed the
observed data into some group number of bins. Many researchers such as de Dear et al.
0
5
10
15
20
25
30
35
40
45
< 16 16 ‐ 19 19 ‐ 22 22 ‐ 25 > 25
Percentage (%)
Set temperature of AC (℃)
Sustainability 2021, 13, 818 12 of 30
[41] and Gautam et al. [42] used the binned data to increase the reliability of the regression
model (R2) but the regression coefficient would be similar for both data.
The binned data were analyzed using weighted regression analysis in order to
investigate the trends in scattered plots of raw data. The coefficient of determination of
binned data was much higher compared to raw data as shown in Equations (2) and (3) for
the set temperature of air conditioners as an explanatory variable (Ts), the number of
samples (n), coefficient of determination (R2), standard error of regression coefficient (S.E),
statistically significant value for regression coefficient (p), and electricity consumption as
dependent variable (E), respectively. The slope and constant of raw data and binned data
were similar and thus either of the equations can be used to estimate the average electricity
use. However, the raw data could be used to show the actual set temperature of air
conditioners in daily life.
Raw data:
𝐸 24.8 𝑇𝑠 1021.4 𝑛 148,𝑅 0.056, 𝑆.𝐸 299.1,𝑝 0.004 (2)
Binned data:
𝐸 18.7 𝑇𝑠 876.5 𝑛 13,𝑅 0.434, 𝑆.𝐸 86.9,𝑝 0.014 (3)
Setting the air conditioners temperature showed a significantly moderate correlation
with electricity consumption by binning the data. This result was similar to Santin et al.
[26] and Jaffar et al. [28]; the latter also found that setting temperatures for heater
appliances were significantly correlated.
(a) Raw data (b) Binned data
Figure 8. Correlation of set temperature of air conditioning (AC) with respect to electricity consumption.
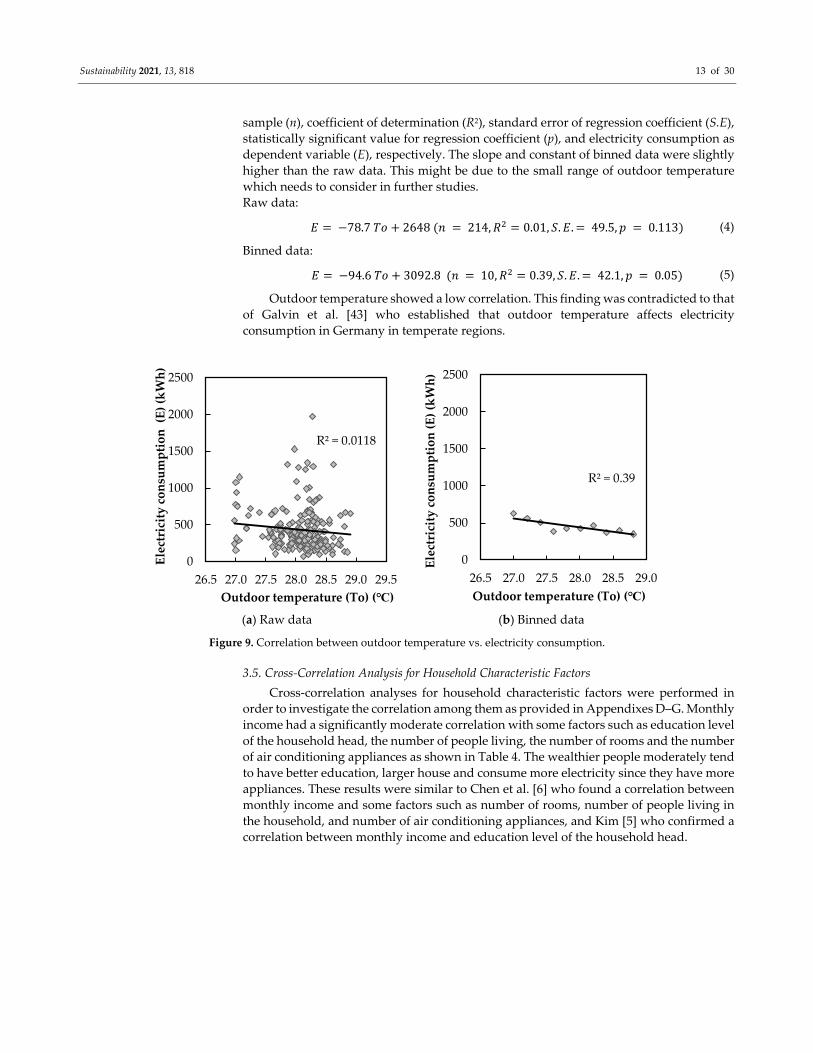
3.4. Correlation Analysis for Outdoor Temperature and Electricity Consumption
Many factors might affect electricity consumption as explained in the previous
sections. Outdoor temperature is one such factor that can affect people using household
appliances as reported by Steemers et al. [17]. Regression analyses were performed to
understand the relationship between outdoor temperature and electricity consumption.
Information on outdoor temperature was obtained from the weather station at Sultan
Abdul Aziz Shah Airport, Selangor, Malaysia [35].
Figure 9 shows the variation in electricity consumption with outdoor temperature
based on raw data and binned data. The regression model of binned data at 0.2 °C
intervals shows a much higher coefficient of determination than that of raw data as shown
in (4) and (5) for the outdoor temperature as an explanatory variable (To), number of the
0
200
400
600
800
1000
1200
1400
1600
15 17 19 21 23 25 27 29Electricity consumption (E) (kWh)
Set temperature of AC (Ts) (℃)
R2 = 0.056
0
200
400
600
800
1000
1200
1400
1600
15 17 19 21 23 25 27 29
Electricity consumption(E)(kWh)
Setting temperature of AC (Ts) (℃)
R² = 0.434
Sustainability 2021, 13, 818 13 of 30
sample (n), coefficient of determination (R2), standard error of regression coefficient (S.E),
statistically significant value for regression coefficient (p), and electricity consumption as
dependent variable (E), respectively. The slope and constant of binned data were slightly
higher than the raw data. This might be due to the small range of outdoor temperature
which needs to consider in further studies.
Raw data:
𝐸 78.7 𝑇𝑜 2648 𝑛 214,𝑅 0.01, 𝑆.𝐸. 49.5,𝑝 0.113 (4)
Binned data:
𝐸 94.6 𝑇𝑜 3092.8 𝑛 10,𝑅 0.39, 𝑆.𝐸. 42.1, 𝑝 0.05 (5)
Outdoor temperature showed a low correlation. This finding was contradicted to that
of Galvin et al. [43] who established that outdoor temperature affects electricity
consumption in Germany in temperate regions.
(a) Raw data (b) Binned data
Figure 9. Correlation between outdoor temperature vs. electricity consumption.
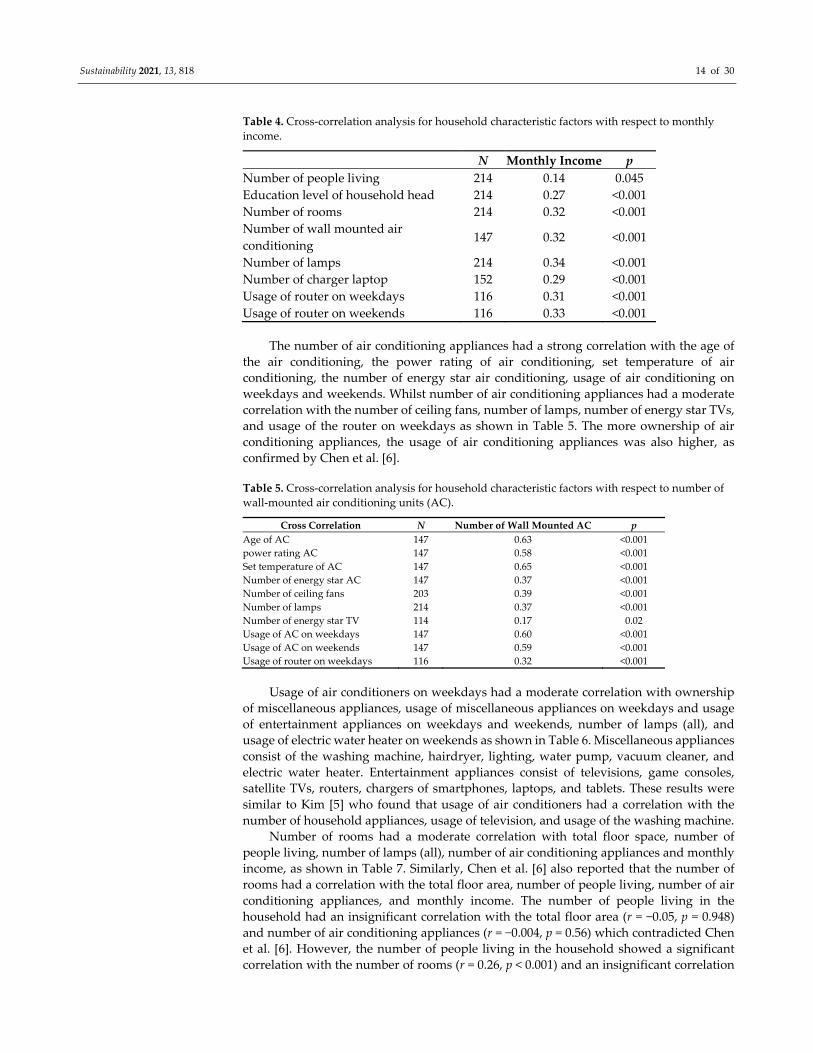
3.5. Cross‐Correlation Analysis for Household Characteristic Factors
Cross‐correlation analyses for household characteristic factors were performed in
order to investigate the correlation among them as provided in Appendixes D–G. Monthly
income had a significantly moderate correlation with some factors such as education level
of the household head, the number of people living, the number of rooms and the number
of air conditioning appliances as shown in Table 4. The wealthier people moderately tend
to have better education, larger house and consume more electricity since they have more
appliances. These results were similar to Chen et al. [6] who found a correlation between
monthly income and some factors such as number of rooms, number of people living in
the household, and number of air conditioning appliances, and Kim [5] who confirmed a
correlation between monthly income and education level of the household head.
R² = 0.0118
0
500
1000
1500
2000
2500
26.5 27.0 27.5 28.0 28.5 29.0 29.5
Electricity consumption (E) (kWh)
Outdoor temperature (To) (℃)
R² = 0.39
0
500
1000
1500
2000
2500
26.5 27.0 27.5 28.0 28.5 29.0
Electricity consumption (E) (kWh)
Outdoor temperature (To) (℃)
Sustainability 2021, 13, 818 14 of 30
Table 4. Cross‐correlation analysis for household characteristic factors with respect to monthly
income.
N Monthly Income p
Number of people living 214 0.14 0.045
Education level of household head 214 0.27 <0.001
Number of rooms 214 0.32 <0.001
Number of wall mounted air
conditioning 147 0.32 <0.001
Number of lamps 214 0.34 <0.001
Number of charger laptop 152 0.29 <0.001
Usage of router on weekdays 116 0.31 <0.001
Usage of router on weekends 116 0.33 <0.001
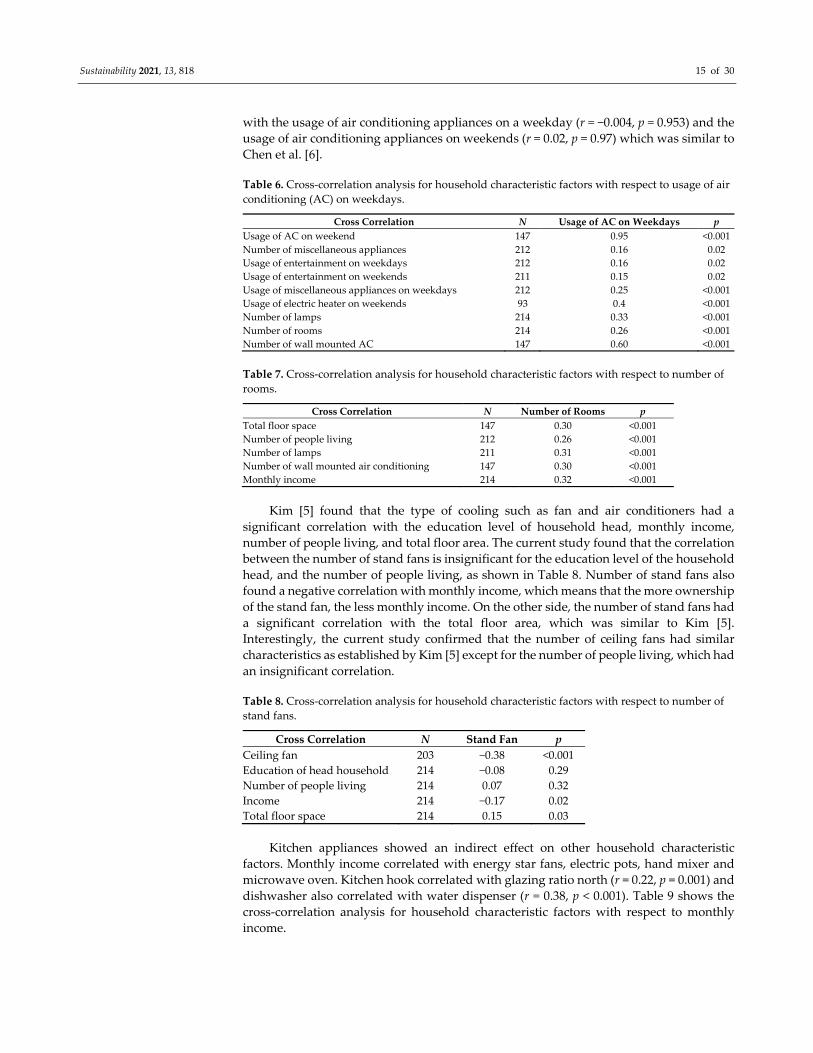
The number of air conditioning appliances had a strong correlation with the age of
the air conditioning, the power rating of air conditioning, set temperature of air
conditioning, the number of energy star air conditioning, usage of air conditioning on
weekdays and weekends. Whilst number of air conditioning appliances had a moderate
correlation with the number of ceiling fans, number of lamps, number of energy star TVs,
and usage of the router on weekdays as shown in Table 5. The more ownership of air
conditioning appliances, the usage of air conditioning appliances was also higher, as
confirmed by Chen et al. [6].
Table 5. Cross‐correlation analysis for household characteristic factors with respect to number of
wall‐mounted air conditioning units (AC).
Cross Correlation N Number of Wall Mounted AC p
Age of AC 147 0.63 <0.001
power rating AC 147 0.58 <0.001
Set temperature of AC 147 0.65 <0.001
Number of energy star AC 147 0.37 <0.001
Number of ceiling fans 203 0.39 <0.001
Number of lamps 214 0.37 <0.001
Number of energy star TV 114 0.17 0.02
Usage of AC on weekdays 147 0.60 <0.001
Usage of AC on weekends 147 0.59 <0.001
Usage of router on weekdays 116 0.32 <0.001
Usage of air conditioners on weekdays had a moderate correlation with ownership
of miscellaneous appliances, usage of miscellaneous appliances on weekdays and usage
of entertainment appliances on weekdays and weekends, number of lamps (all), and
usage of electric water heater on weekends as shown in Table 6. Miscellaneous appliances
consist of the washing machine, hairdryer, lighting, water pump, vacuum cleaner, and
electric water heater. Entertainment appliances consist of televisions, game consoles,
satellite TVs, routers, chargers of smartphones, laptops, and tablets. These results were
similar to Kim [5] who found that usage of air conditioners had a correlation with the
number of household appliances, usage of television, and usage of the washing machine.
Number of rooms had a moderate correlation with total floor space, number of
people living, number of lamps (all), number of air conditioning appliances and monthly
income, as shown in Table 7. Similarly, Chen et al. [6] also reported that the number of
rooms had a correlation with the total floor area, number of people living, number of air
conditioning appliances, and monthly income. The number of people living in the
household had an insignificant correlation with the total floor area (r = −0.05, p = 0.948)
and number of air conditioning appliances (r = −0.004, p = 0.56) which contradicted Chen
et al. [6]. However, the number of people living in the household showed a significant
correlation with the number of rooms (r = 0.26, p < 0.001) and an insignificant correlation
Sustainability 2021, 13, 818 15 of 30
with the usage of air conditioning appliances on a weekday (r = −0.004, p = 0.953) and the
usage of air conditioning appliances on weekends (r = 0.02, p = 0.97) which was similar to
Chen et al. [6].
Table 6. Cross‐correlation analysis for household characteristic factors with respect to usage of air
conditioning (AC) on weekdays.
Cross Correlation N Usage of AC on Weekdays p
Usage of AC on weekend 147 0.95 <0.001
Number of miscellaneous appliances 212 0.16 0.02
Usage of entertainment on weekdays 212 0.16 0.02
Usage of entertainment on weekends 211 0.15 0.02
Usage of miscellaneous appliances on weekdays 212 0.25 <0.001
Usage of electric heater on weekends 93 0.4 <0.001
Number of lamps 214 0.33 <0.001
Number of rooms 214 0.26 <0.001
Number of wall mounted AC 147 0.60 <0.001
Table 7. Cross‐correlation analysis for household characteristic factors with respect to number of
rooms.
Cross Correlation N Number of Rooms p
Total floor space 147 0.30 <0.001
Number of people living 212 0.26 <0.001
Number of lamps 211 0.31 <0.001
Number of wall mounted air conditioning 147 0.30 <0.001
Monthly income 214 0.32 <0.001
Kim [5] found that the type of cooling such as fan and air conditioners had a
significant correlation with the education level of household head, monthly income,
number of people living, and total floor area. The current study found that the correlation
between the number of stand fans is insignificant for the education level of the household
head, and the number of people living, as shown in Table 8. Number of stand fans also
found a negative correlation with monthly income, which means that the more ownership
of the stand fan, the less monthly income. On the other side, the number of stand fans had
a significant correlation with the total floor area, which was similar to Kim [5].
Interestingly, the current study confirmed that the number of ceiling fans had similar
characteristics as established by Kim [5] except for the number of people living, which had
an insignificant correlation.
Table 8. Cross‐correlation analysis for household characteristic factors with respect to number of
stand fans.
Cross Correlation N Stand Fan p
Ceiling fan 203 −0.38 <0.001
Education of head household 214 −0.08 0.29
Number of people living 214 0.07 0.32
Income 214 −0.17 0.02
Total floor space 214 0.15 0.03
Kitchen appliances showed an indirect effect on other household characteristic
factors. Monthly income correlated with energy star fans, electric pots, hand mixer and
microwave oven. Kitchen hook correlated with glazing ratio north (r = 0.22, p = 0.001) and
dishwasher also correlated with water dispenser (r = 0.38, p < 0.001). Table 9 shows the
cross‐correlation analysis for household characteristic factors with respect to monthly
income.

Sustainability 2021, 13, 818 16 of 30
Table 9. Cross‐correlation analysis for household characteristic factors with respect to monthly
income.
Cross Correlation N Monthly Income p
Energy star fans 192 0.15 0.03
Electric pots 114 0.22 0.001
Hand mixer 97 0.18 0.009
Microwave oven 150 0.16 0.02
Number of people living shows correlation with usage of entertainment on weekdays
(r = 0.18, p = 0.008), usage of entertainment on weekends (r = 0.14, p = 0.04). The findings
were similar to Domínguez‐Amarillo et al. [44] who found that the more people living in
the house, the more people use television and entertainment appliances. Silva et al. [45]
confirm that the correlation between building types with respect to occupant behaviour.
While Dziedzic et al. [46] found that profile of occupancy strongly correlated with the
usage of household appliances. Similar findings were also found in current study, type of
room shows correlation with respect to occupancy schedule in weekdays (r = 0.17, p = 0.01)
and occupancy schedule in weekend (r = 0.19, p = 0.006). Furthermore, glazing windows
correlated with usage of air conditioning on weekdays (r = 0.16, p = 0.02) and usage of air
conditioning on weekends (r = 0.15, p = 0.03).
3.6. Multiple Linear Regression Model Based on Household Characteristic Factors
Five multiple linear regression models were constructed in single, double combined
and triple combined models as shown in Figure 10. The single model consisted of
appliance characteristic factors. The double combined models consisted of socio‐
demographic and appliance characteristic factors, and occupant behaviour and appliance
characteristic factors. The triple combined model consisted of socio‐demographic,
appliance characteristic factors, and occupant behaviour in one model, and socio‐
demographic, house characteristic factors, and occupant behaviour in a second model.
The single model was developed based on appliance characteristic factors. The double
and triple combined model was built by combining the factors from each category on
household characteristic factors. The factors were selected based on two parameters such
as p (statistically significant value) and variance inflation factor (VIF). The factors which
had a p‐value of more than 0.05 and a VIF value of more than 3.3 were removed from the
models.
Figure 10. A framework of determinant factors of electricity consumption.
Sustainability 2021, 13, 818 17 of 30
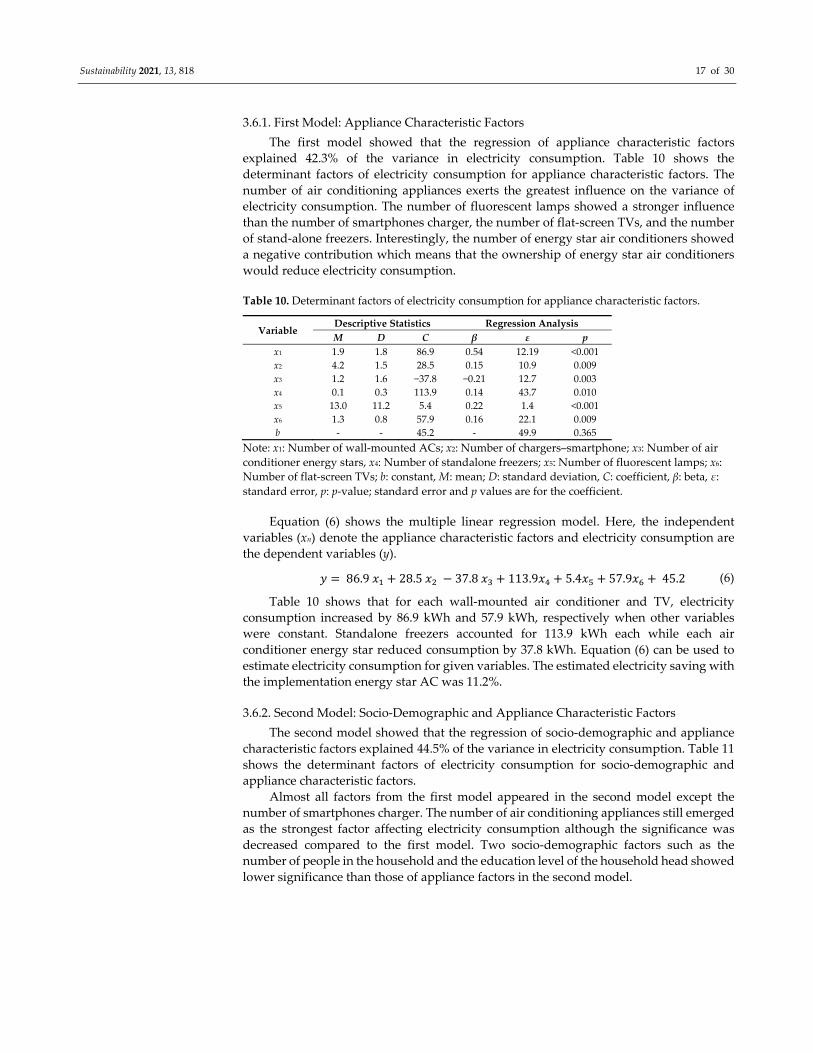
3.6.1. First Model: Appliance Characteristic Factors
The first model showed that the regression of appliance characteristic factors
explained 42.3% of the variance in electricity consumption. Table 10 shows the
determinant factors of electricity consumption for appliance characteristic factors. The
number of air conditioning appliances exerts the greatest influence on the variance of
electricity consumption. The number of fluorescent lamps showed a stronger influence
than the number of smartphones charger, the number of flat‐screen TVs, and the number
of stand‐alone freezers. Interestingly, the number of energy star air conditioners showed
a negative contribution which means that the ownership of energy star air conditioners
would reduce electricity consumption.
Table 10. Determinant factors of electricity consumption for appliance characteristic factors.
Variable Descriptive Statistics Regression Analysis
M D C β ε p
x1 1.9 1.8 86.9 0.54 12.19 <0.001
x2 4.2 1.5 28.5 0.15 10.9 0.009
x3 1.2 1.6 −37.8 −0.21 12.7 0.003
x4 0.1 0.3 113.9 0.14 43.7 0.010
x5 13.0 11.2 5.4 0.22 1.4 <0.001
x6 1.3 0.8 57.9 0.16 22.1 0.009
b ‐ ‐ 45.2 ‐ 49.9 0.365
Note: x1: Number of wall‐mounted ACs; x2: Number of chargers–smartphone; x3: Number of air
conditioner energy stars, x4: Number of standalone freezers; x5: Number of fluorescent lamps; x6:
Number of flat‐screen TVs; b: constant, M: mean; D: standard deviation, C: coefficient, β: beta, ε:
standard error, p: p‐value; standard error and p values are for the coefficient.
Equation (6) shows the multiple linear regression model. Here, the independent
variables (xn) denote the appliance characteristic factors and electricity consumption are
the dependent variables (y).
𝑦 86.9 𝑥 28.5 𝑥 37.8 𝑥 113.9𝑥 5.4𝑥 57.9𝑥 45.2 (6)
Table 10 shows that for each wall‐mounted air conditioner and TV, electricity
consumption increased by 86.9 kWh and 57.9 kWh, respectively when other variables
were constant. Standalone freezers accounted for 113.9 kWh each while each air
conditioner energy star reduced consumption by 37.8 kWh. Equation (6) can be used to
estimate electricity consumption for given variables. The estimated electricity saving with
the implementation energy star AC was 11.2%.
3.6.2. Second Model: Socio‐Demographic and Appliance Characteristic Factors
The second model showed that the regression of socio‐demographic and appliance
characteristic factors explained 44.5% of the variance in electricity consumption. Table 11
shows the determinant factors of electricity consumption for socio‐demographic and
appliance characteristic factors.
Almost all factors from the first model appeared in the second model except the
number of smartphones charger. The number of air conditioning appliances still emerged
as the strongest factor affecting electricity consumption although the significance was
decreased compared to the first model. Two socio‐demographic factors such as the
number of people in the household and the education level of the household head showed
lower significance than those of appliance factors in the second model.
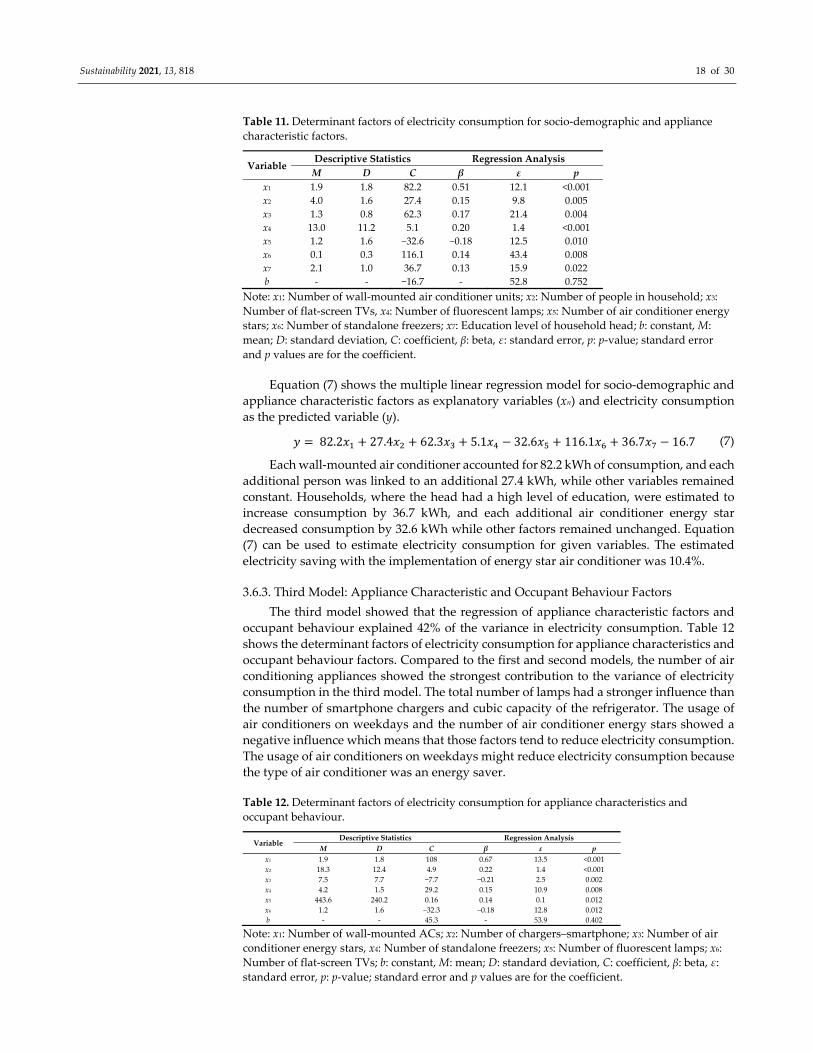
Sustainability 2021, 13, 818 18 of 30
Table 11. Determinant factors of electricity consumption for socio‐demographic and appliance
characteristic factors.
Variable Descriptive Statistics Regression Analysis
M D C β ε p
x1 1.9 1.8 82.2 0.51 12.1 <0.001
x2 4.0 1.6 27.4 0.15 9.8 0.005
x3 1.3 0.8 62.3 0.17 21.4 0.004
x4 13.0 11.2 5.1 0.20 1.4 <0.001
x5 1.2 1.6 −32.6 −0.18 12.5 0.010
x6 0.1 0.3 116.1 0.14 43.4 0.008
x7 2.1 1.0 36.7 0.13 15.9 0.022
b ‐ ‐ −16.7 ‐ 52.8 0.752
Note: x1: Number of wall‐mounted air conditioner units; x2: Number of people in household; x3:
Number of flat‐screen TVs, x4: Number of fluorescent lamps; x5: Number of air conditioner energy
stars; x6: Number of standalone freezers; x7: Education level of household head; b: constant, M:
mean; D: standard deviation, C: coefficient, β: beta, ε: standard error, p: p‐value; standard error
and p values are for the coefficient.
Equation (7) shows the multiple linear regression model for socio‐demographic and
appliance characteristic factors as explanatory variables (xn) and electricity consumption
as the predicted variable (y).
𝑦 82.2𝑥 27.4𝑥 62.3𝑥 5.1𝑥 32.6𝑥 116.1𝑥 36.7𝑥 16.7 (7)
Each wall‐mounted air conditioner accounted for 82.2 kWh of consumption, and each
additional person was linked to an additional 27.4 kWh, while other variables remained
constant. Households, where the head had a high level of education, were estimated to
increase consumption by 36.7 kWh, and each additional air conditioner energy star
decreased consumption by 32.6 kWh while other factors remained unchanged. Equation
(7) can be used to estimate electricity consumption for given variables. The estimated
electricity saving with the implementation of energy star air conditioner was 10.4%.
3.6.3. Third Model: Appliance Characteristic and Occupant Behaviour Factors
The third model showed that the regression of appliance characteristic factors and
occupant behaviour explained 42% of the variance in electricity consumption. Table 12
shows the determinant factors of electricity consumption for appliance characteristics and
occupant behaviour factors. Compared to the first and second models, the number of air
conditioning appliances showed the strongest contribution to the variance of electricity
consumption in the third model. The total number of lamps had a stronger influence than
the number of smartphone chargers and cubic capacity of the refrigerator. The usage of
air conditioners on weekdays and the number of air conditioner energy stars showed a
negative influence which means that those factors tend to reduce electricity consumption.
The usage of air conditioners on weekdays might reduce electricity consumption because
the type of air conditioner was an energy saver.
Table 12. Determinant factors of electricity consumption for appliance characteristics and
occupant behaviour.
Variable Descriptive Statistics Regression Analysis
M D C β ε p
x1 1.9 1.8 108 0.67 13.5 <0.001
x2 18.3 12.4 4.9 0.22 1.4 <0.001
x3 7.5 7.7 −7.7 −0.21 2.5 0.002
x4 4.2 1.5 29.2 0.15 10.9 0.008
x5 443.6 240.2 0.16 0.14 0.1 0.012
x6 1.2 1.6 −32.3 −0.18 12.8 0.012
b ‐ ‐ 45.3 ‐ 53.9 0.402
Note: x1: Number of wall‐mounted ACs; x2: Number of chargers–smartphone; x3: Number of air
conditioner energy stars, x4: Number of standalone freezers; x5: Number of fluorescent lamps; x6:
Number of flat‐screen TVs; b: constant, M: mean; D: standard deviation, C: coefficient, β: beta, ε:
standard error, p: p‐value; standard error and p values are for the coefficient.
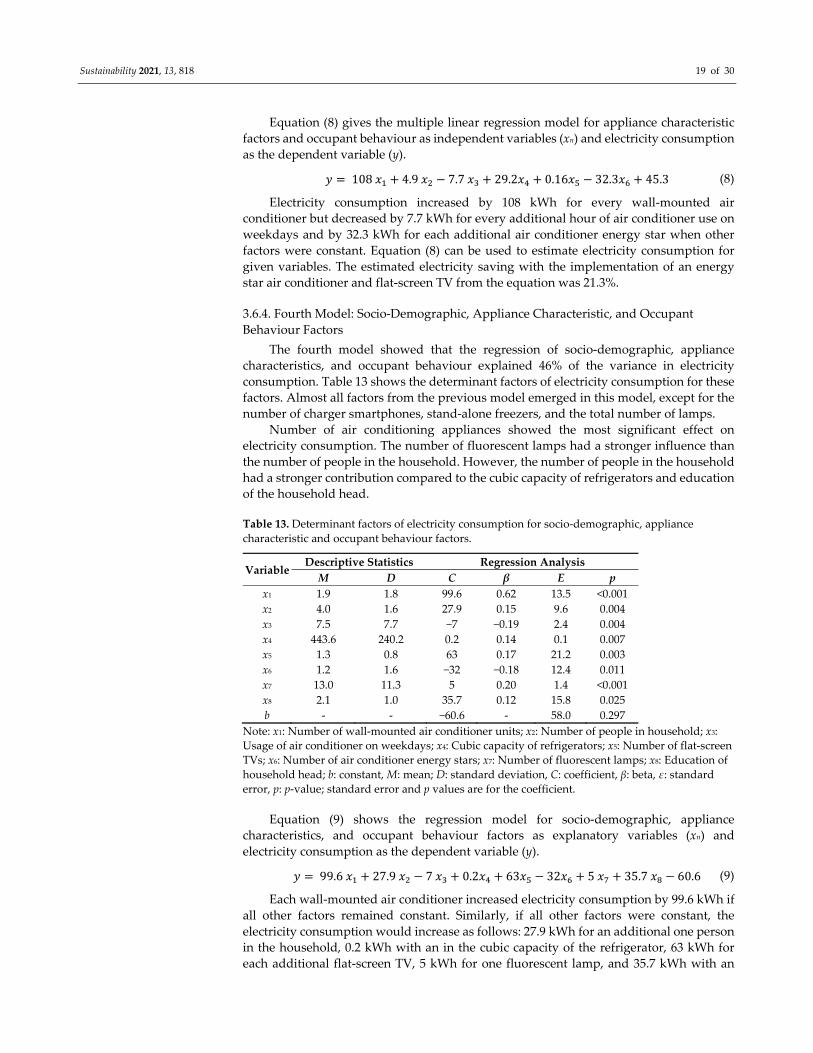
Sustainability 2021, 13, 818 19 of 30
Equation (8) gives the multiple linear regression model for appliance characteristic
factors and occupant behaviour as independent variables (xn) and electricity consumption
as the dependent variable (y).
𝑦 108 𝑥 4.9 𝑥 7.7 𝑥 29.2𝑥 0.16𝑥 32.3𝑥 45.3 (8)
Electricity consumption increased by 108 kWh for every wall‐mounted air
conditioner but decreased by 7.7 kWh for every additional hour of air conditioner use on
weekdays and by 32.3 kWh for each additional air conditioner energy star when other
factors were constant. Equation (8) can be used to estimate electricity consumption for
given variables. The estimated electricity saving with the implementation of an energy
star air conditioner and flat‐screen TV from the equation was 21.3%.
3.6.4. Fourth Model: Socio‐Demographic, Appliance Characteristic, and Occupant
Behaviour Factors
The fourth model showed that the regression of socio‐demographic, appliance
characteristics, and occupant behaviour explained 46% of the variance in electricity
consumption. Table 13 shows the determinant factors of electricity consumption for these
factors. Almost all factors from the previous model emerged in this model, except for the
number of charger smartphones, stand‐alone freezers, and the total number of lamps.
Number of air conditioning appliances showed the most significant effect on
electricity consumption. The number of fluorescent lamps had a stronger influence than
the number of people in the household. However, the number of people in the household
had a stronger contribution compared to the cubic capacity of refrigerators and education
of the household head.
Table 13. Determinant factors of electricity consumption for socio‐demographic, appliance
characteristic and occupant behaviour factors.
Variable Descriptive Statistics Regression Analysis
M D C β Ε p
x1 1.9 1.8 99.6 0.62 13.5 <0.001
x2 4.0 1.6 27.9 0.15 9.6 0.004
x3 7.5 7.7 −7 −0.19 2.4 0.004
x4 443.6 240.2 0.2 0.14 0.1 0.007
x5 1.3 0.8 63 0.17 21.2 0.003
x6 1.2 1.6 −32 −0.18 12.4 0.011
x7 13.0 11.3 5 0.20 1.4 <0.001
x8 2.1 1.0 35.7 0.12 15.8 0.025
b ‐ ‐ −60.6 ‐ 58.0 0.297
Note: x1: Number of wall‐mounted air conditioner units; x2: Number of people in household; x3:
Usage of air conditioner on weekdays; x4: Cubic capacity of refrigerators; x5: Number of flat‐screen
TVs; x6: Number of air conditioner energy stars; x7: Number of fluorescent lamps; x8: Education of
household head; b: constant, M: mean; D: standard deviation, C: coefficient, β: beta, ε: standard
error, p: p‐value; standard error and p values are for the coefficient.
Equation (9) shows the regression model for socio‐demographic, appliance
characteristics, and occupant behaviour factors as explanatory variables (xn) and
electricity consumption as the dependent variable (y).
𝑦 99.6 𝑥 27.9 𝑥 7 𝑥 0.2𝑥 63𝑥 32𝑥 5 𝑥 35.7 𝑥 60.6 (9)
Each wall‐mounted air conditioner increased electricity consumption by 99.6 kWh if
all other factors remained constant. Similarly, if all other factors were constant, the
electricity consumption would increase as follows: 27.9 kWh for an additional one person
in the household, 0.2 kWh with an in the cubic capacity of the refrigerator, 63 kWh for
each additional flat‐screen TV, 5 kWh for one fluorescent lamp, and 35.7 kWh with an
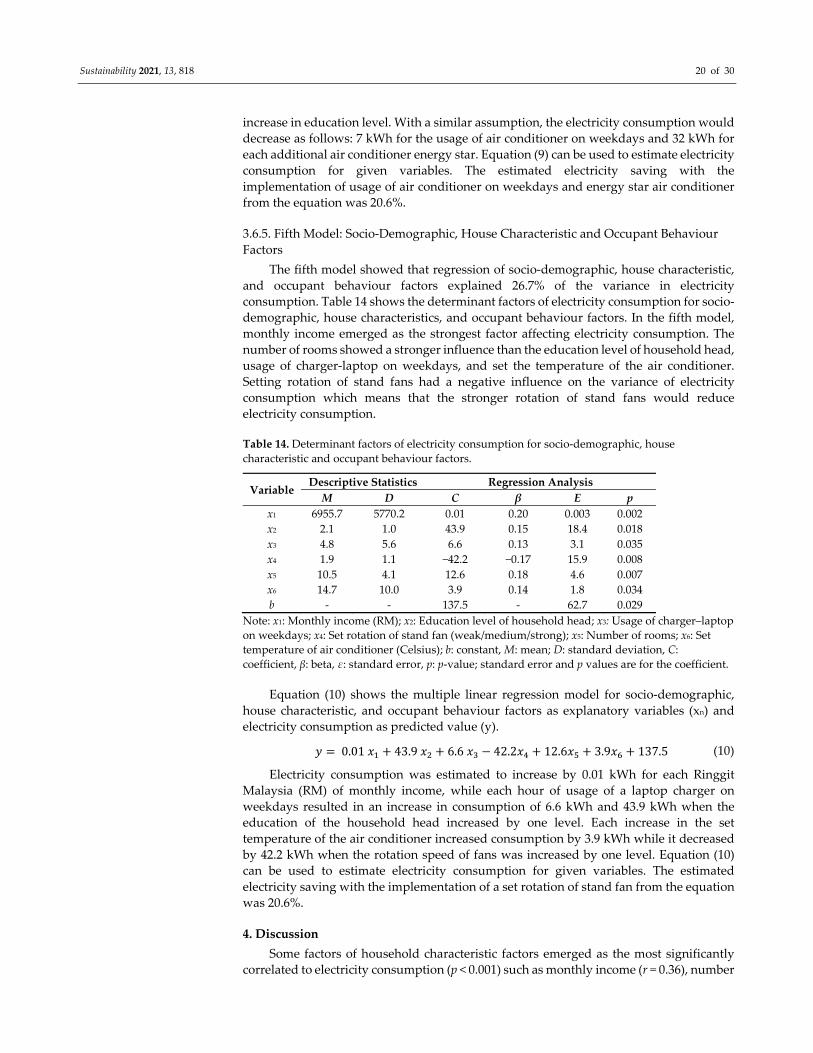
Sustainability 2021, 13, 818 20 of 30
increase in education level. With a similar assumption, the electricity consumption would
decrease as follows: 7 kWh for the usage of air conditioner on weekdays and 32 kWh for
each additional air conditioner energy star. Equation (9) can be used to estimate electricity
consumption for given variables. The estimated electricity saving with the
implementation of usage of air conditioner on weekdays and energy star air conditioner
from the equation was 20.6%.
3.6.5. Fifth Model: Socio‐Demographic, House Characteristic and Occupant Behaviour
Factors
The fifth model showed that regression of socio‐demographic, house characteristic,
and occupant behaviour factors explained 26.7% of the variance in electricity
consumption. Table 14 shows the determinant factors of electricity consumption for socio‐
demographic, house characteristics, and occupant behaviour factors. In the fifth model,
monthly income emerged as the strongest factor affecting electricity consumption. The
number of rooms showed a stronger influence than the education level of household head,
usage of charger‐laptop on weekdays, and set the temperature of the air conditioner.
Setting rotation of stand fans had a negative influence on the variance of electricity
consumption which means that the stronger rotation of stand fans would reduce
electricity consumption.
Table 14. Determinant factors of electricity consumption for socio‐demographic, house
characteristic and occupant behaviour factors.
Variable Descriptive Statistics Regression Analysis
M D C β Ε p
x1 6955.7 5770.2 0.01 0.20 0.003 0.002
x2 2.1 1.0 43.9 0.15 18.4 0.018
x3 4.8 5.6 6.6 0.13 3.1 0.035
x4 1.9 1.1 −42.2 −0.17 15.9 0.008
x5 10.5 4.1 12.6 0.18 4.6 0.007
x6 14.7 10.0 3.9 0.14 1.8 0.034
b ‐ ‐ 137.5 ‐ 62.7 0.029
Note: x1: Monthly income (RM); x2: Education level of household head; x3: Usage of charger–laptop
on weekdays; x4: Set rotation of stand fan (weak/medium/strong); x5: Number of rooms; x6: Set
temperature of air conditioner (Celsius); b: constant, M: mean; D: standard deviation, C:
coefficient, β: beta, ε: standard error, p: p‐value; standard error and p values are for the coefficient.
Equation (10) shows the multiple linear regression model for socio‐demographic,
house characteristic, and occupant behaviour factors as explanatory variables (xn) and
electricity consumption as predicted value (y).
𝑦 0.01 𝑥 43.9 𝑥 6.6 𝑥 42.2𝑥 12.6𝑥 3.9𝑥 137.5 (10)
Electricity consumption was estimated to increase by 0.01 kWh for each Ringgit
Malaysia (RM) of monthly income, while each hour of usage of a laptop charger on
weekdays resulted in an increase in consumption of 6.6 kWh and 43.9 kWh when the
education of the household head increased by one level. Each increase in the set
temperature of the air conditioner increased consumption by 3.9 kWh while it decreased
by 42.2 kWh when the rotation speed of fans was increased by one level. Equation (10)
can be used to estimate electricity consumption for given variables. The estimated
electricity saving with the implementation of a set rotation of stand fan from the equation
was 20.6%.
4. Discussion
Some factors of household characteristic factors emerged as the most significantly
correlated to electricity consumption (p < 0.001) such as monthly income (r = 0.36), number
Sustainability 2021, 13, 818 21 of 30
of lamps (all) (r = 0.40), number of air conditioning appliances (r = 0.54), and number of
miscellaneous appliances (r = 0.32). Air conditioning appliances emerged as the most
important factor which affected consumption because of all aspects of air conditioners
such as the age of air conditioner (r = 0.32), the power rating of air conditioners (r = 0.27),
and setting the temperature of the air conditioner (r = 0.27) also significantly correlated
with electricity consumption.
Only a few previous studies investigated the cross‐correlation analyses among
household characteristic factors as performed by Chen et al. [6] and Kim [5]. Monthly
income, air conditioning appliances and ownership of miscellaneous appliances emerged
as the centre of cross‐correlation analyses which almost had a significant correlation with
all household characteristic factors and electricity consumption. These findings proved
that wealthier people tend to have more appliances and consumed more electricity
consumption.
Multicollinearity is an important issue for multiple linear regression analysis which
occurs when one or more predictors have a linear relationship with other factors. The
variance inflation factor (VIF) was used as a parameter to check for the multicollinearity
problem in regression. The standard values for VIF were different in some previous
studies with a VIF of less than 10 [18,24] and less than 3.3 [16,22]. In this paper, a VIF value
of less than 3.3 was selected as a standard value. The highest VIF obtained from the
regression analysis was 2.6 which means that no multicollinearity was found among
variables.
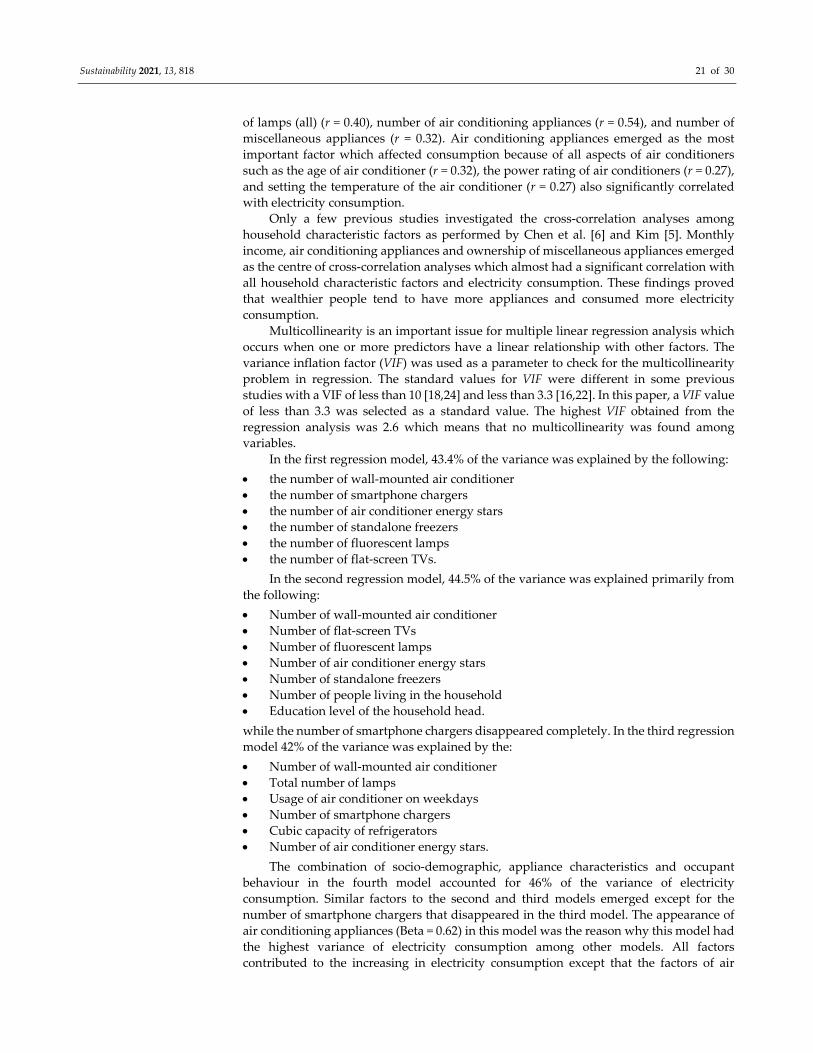
In the first regression model, 43.4% of the variance was explained by the following:
the number of wall‐mounted air conditioner
the number of smartphone chargers
the number of air conditioner energy stars
the number of standalone freezers
the number of fluorescent lamps
the number of flat‐screen TVs.
In the second regression model, 44.5% of the variance was explained primarily from
the following:
Number of wall‐mounted air conditioner
Number of flat‐screen TVs
Number of fluorescent lamps
Number of air conditioner energy stars
Number of standalone freezers
Number of people living in the household
Education level of the household head.
while the number of smartphone chargers disappeared completely. In the third regression
model 42% of the variance was explained by the:
Number of wall‐mounted air conditioner
Total number of lamps
Usage of air conditioner on weekdays
Number of smartphone chargers
Cubic capacity of refrigerators
Number of air conditioner energy stars.
The combination of socio‐demographic, appliance characteristics and occupant
behaviour in the fourth model accounted for 46% of the variance of electricity
consumption. Similar factors to the second and third models emerged except for the
number of smartphone chargers that disappeared in the third model. The appearance of
air conditioning appliances (Beta = 0.62) in this model was the reason why this model had
the highest variance of electricity consumption among other models. All factors
contributed to the increasing in electricity consumption except that the factors of air
Sustainability 2021, 13, 818 22 of 30
conditioning appliance such as the number of air conditioning appliances, the number of
energy star air conditioner and usage of air conditioner on weekdays showed a reduction
in energy use. This anomaly may be caused by the occupancy schedule in Malaysia that
only used air conditioning appliances at night and on the weekend as confirmed by
[19,29,30].
The fifth model, which combined socio‐demographic, house characteristics, and
occupant behaviour, explained 26.7% of the variance of electricity consumption. Similar
factors from previous models also appeared in the fifth model; however, it also showed
the following as being significant:
monthly income
usage of laptop chargers on weekdays
rotation speed setting of stand fans
set temperature of air conditioners
These results showed that the combination of factors in the last (fifth) model had less
effect on the variance of electricity consumption than the combination of factors in other
models. It might be caused by the appearance of usage of charger‐laptop on weekdays
(Beta = 0.13) and the set temperature of air conditioners (Beta = 0.14) which had less
contribution to the variance of electricity consumption in the model. This finding
confirmed that the last model was not suitable to represent electricity consumption for
Malaysian households.
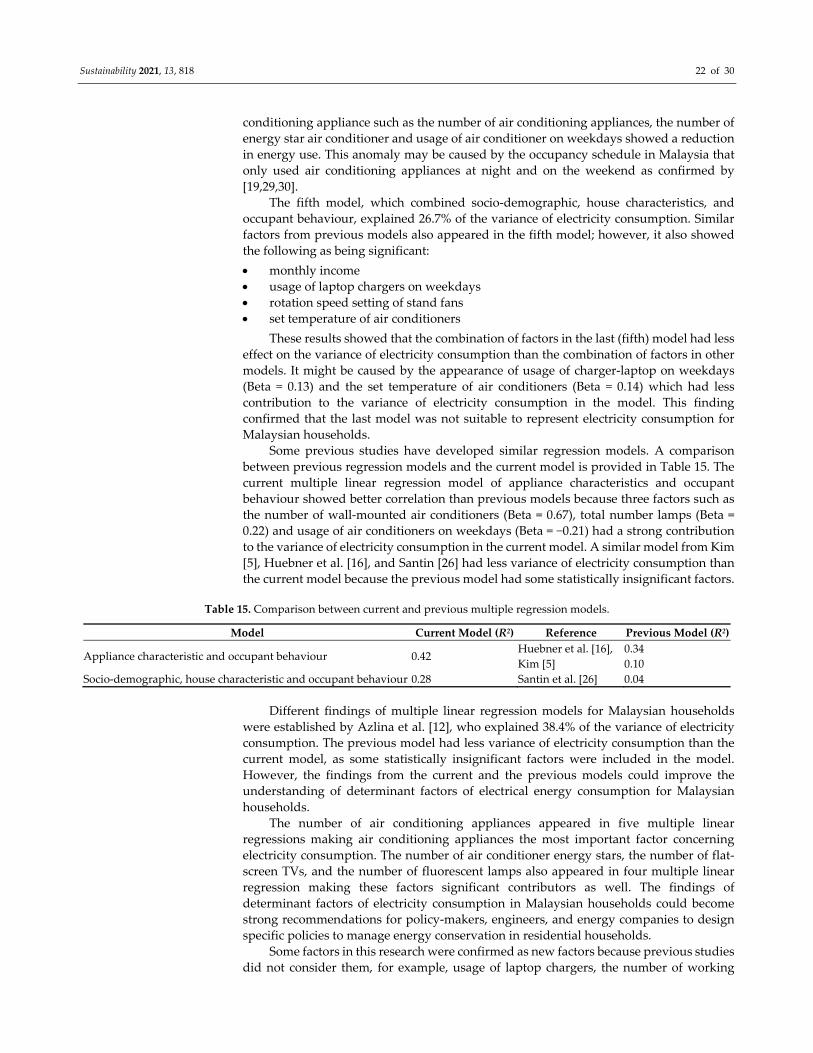
Some previous studies have developed similar regression models. A comparison
between previous regression models and the current model is provided in Table 15. The
current multiple linear regression model of appliance characteristics and occupant
behaviour showed better correlation than previous models because three factors such as
the number of wall‐mounted air conditioners (Beta = 0.67), total number lamps (Beta =
0.22) and usage of air conditioners on weekdays (Beta = −0.21) had a strong contribution
to the variance of electricity consumption in the current model. A similar model from Kim
[5], Huebner et al. [16], and Santin [26] had less variance of electricity consumption than
the current model because the previous model had some statistically insignificant factors.
Table 15. Comparison between current and previous multiple regression models.
Model Current Model (R2) Reference Previous Model (R2)
Appliance characteristic and occupant behaviour 0.42 Huebner et al. [16],
Kim [5]
0.34
0.10
Socio‐demographic, house characteristic and occupant behaviour 0.28 Santin et al. [26] 0.04
Different findings of multiple linear regression models for Malaysian households
were established by Azlina et al. [12], who explained 38.4% of the variance of electricity
consumption. The previous model had less variance of electricity consumption than the
current model, as some statistically insignificant factors were included in the model.
However, the findings from the current and the previous models could improve the
understanding of determinant factors of electrical energy consumption for Malaysian
households.
The number of air conditioning appliances appeared in five multiple linear
regressions making air conditioning appliances the most important factor concerning
electricity consumption. The number of air conditioner energy stars, the number of flat‐
screen TVs, and the number of fluorescent lamps also appeared in four multiple linear
regression making these factors significant contributors as well. The findings of
determinant factors of electricity consumption in Malaysian households could become
strong recommendations for policy‐makers, engineers, and energy companies to design
specific policies to manage energy conservation in residential households.
Some factors in this research were confirmed as new factors because previous studies
did not consider them, for example, usage of laptop chargers, the number of working
Sustainability 2021, 13, 818 23 of 30
people in the household, and the setting of the rotation speed of stand fans as strong and
significant factors in terms of electricity consumption. Previous studies did not specifically
ascertain the type of appliance as significant factors; for example, Tso and Yau [9] only
considered general types of fans and Bedir et al. [14] only examined general battery‐
charged types.
Current results were compared with national statistics of household characteristic
factors performed by Khazanah Research Institute in 2018 [47]. The average number of
people in the household was 4.0 persons with a standard deviation of 1.6 and the average
monthly income was RM 6955.70 with a standard deviation of RM 5770.20. Those results
were similar to national statistics in 2016 which established that the average number of
people in the household was 4.1 person and the average monthly income was RM 6958.00.
Limitation and Future Research
This study has a limitation on the size of the sample. The total valid questionnaires
for analysis in this paper were 214; therefore, the result of this research cannot be
represented by the whole of Malaysia. Our current study only covered a population
sample of students in Universiti Teknologi Malaysia for 21,997 students with a confidence
level of 95% and margin of error of 7% based on sample calculation from Cochran [39].
Furthermore, five regression models in this research explain 27.5%, 42%, 44.5%, 43.4% and
46% variance of electricity consumption. These results confirmed that the overall trend of
the regression model is quite good. It is recommended to consider a greater sample and
also a non‐linear model in order to develop the best model in predicting the electricity
consumption in residential households.
The present study also had a limitation on the source of information. Here, only
families with an academic background were surveyed. In the future, we will include
families with other backgrounds also. Proportionate, but random sampling is a good
recommendation for a future study where the society is stratified based on certain
parameter levels such as income, occupation, or educational background.
While there were limitations to this research as already mentioned, the findings are
useful for improving the understanding as to what factors affect electricity consumption
in Malaysian households. Malaysia only had one previous study in this field which was
conducted by Azlina et al. [12]. The current study investigated four groups of factors that
consisted of socio‐demographic, house characteristic factors, appliance characteristic
factors, and occupant behaviour, which were more comprehensive than in the previous
study.
5. Conclusions
The research was intended to assess comprehensive determinant factors of electricity
consumption in Malaysian households. The data were collected from direct and indirect
questionnaire survey from 214 volunteer students. Three types of regression models, such
as single, double combined, and triple combined, were developed. Monthly income,
number of air conditioning appliances and ownership of miscellaneous appliances
emerged as factors that had a significant cross‐correlation with many household
characteristic factors. These results showed that households with higher income would
have more appliances and used more electricity.
In the single model, appliance characteristics explained 43.4% of the variance in
electricity consumption. In the double combined models, appliance characteristics
explained 44.5% of the variance when combined with socio‐demographic and 42% when
combined with occupant behaviour. Socio‐demographic factors showed a better
contribution to the variance of electricity consumption than occupant behaviour factors.
The number of air conditioners and the number of fluorescent lamps emerged as strong
and significant factors for single and double combined models. The number of people
living in the household had a stronger effect on the variability of electricity consumption
than the education level of the household head. The usage of air conditioners on weekdays
Sustainability 2021, 13, 818 24 of 30
significantly affected the variance of electricity consumption in the double combined
models. In the triple combined models, socio‐demographic, appliance characteristic and
occupant behaviour explained 46% of the variance in electricity consumption. The number
of air conditioners emerged as the strongest and the most significant contributor. In
contrast, socio‐demographic, house characteristics and occupant behaviour factors
explained 26.7% of the variance in electricity consumption. Monthly income had a
stronger effect on the variance of electricity consumption than setting the rotation speed
of stand fans, the set temperature of air conditioner, the number of flat‐screen TVs and the
cubic capacity of refrigerators. In these models, appliance characteristics showed a
stronger effect on the variance of electricity consumption than house characteristics. The
estimated electricity‐saving based on the multiple linear regression model was from 10.4%
to 21.3%.
Air conditioners, fluorescent lamps and flat‐screen TVs emerged as strong and
significant factors. Energy‐saving air conditioners also arose as a factor that affected the
variability of electricity consumption. These findings suggest that Malaysia has achieved
a good implementation of the electricity‐saving policy by producing an energy‐saving
program, that is, the energy star appliances.
Two types of light sources, (i) fluorescent and (ii) LED lamps, emerged as substantial
factors in the partial correlation analysis. However, fluorescent lamps emerged as a factor
affecting the variance of electricity consumption in the multiple linear regression models
instead of energy‐saving lamps. These findings confirm that the penetration level of LED
lamp ownership is still less in Malaysia. Usage of air conditioner on weekdays and setting
rotation of stand fan also emerged as significant factors that affect the variance of
electricity consumption in the model. Recommending policies such as affordable LED
lamp cost, scheduling usage of air conditioners and usage of fans in the house, schools,
companies or government institutions may improve the awareness of the energy saving
in the house.
The current study improves the understanding of the direct impact of comprehensive
household characteristic factors on electricity consumption. Cross‐correlation analysis
was developed so that the indirect effect of household electricity consumption can be
revealed. The study also escalates the insight about determinant factors affecting
electricity consumption in the tropical country, therefore, the collaborative research or
policy might be established with other country regions in order to accomplish the
increasing of energy consumption in the future.
Author Contributions: Conceptualization, B.S. and S.A.Z.; methodology, B.S.; software, B.S.;
validation, B.S., and S.A.Z.; formal analysis, B.S.; investigation, B.S.; resources, B.S., and S.A.Z.; data
curation, B.S.; writing—original draft preparation, B.S.; writing—review and editing, B.S., S.A.Z.,
H.B.R., N.M.Y., J.A.A.‐R.; F.Y.; M.K.R., and F.M.‐S.; visualization, B.S.; supervision, S.A.Z., and
N.M.Y.; project administration, B.S., and S.A.Z.; funding acquisition, S.A.Z., J.A.A.‐R. and F.M.‐S.
All authors have read and agreed to the published version of the manuscript.
Funding: This study is financially supported by the Malaysian Ministry of Education (MOE) under
the Fundamental Research Grant Scheme (Vot 5F150) and Takasago Engineering Ltd Grant (Vot
4B364) projects of Universiti Teknologi Malaysia and was partly supported by the Environment
Research and Technology Development Fund (1‐1502) of the Ministry of the Environment, Japan.
This work was supported by Agencia Nacional de Investigación y Desarrollo (ANID) under Grants
Fondecyt 1200055 and Fondef 19I10165, and the UTFSM, under Grant PI_m_19_01.
Data Availability Statement: The data presented in this study are available on request from the
corresponding author.
Acknowledgments: We wish to thank Jyukankyo Research Institute for sharing their data with us.
Conflicts of Interest: The authors declare no conflict of interest. The funders had no role in the
design of the study; in the collection, analyses, or interpretation of data; in the writing of the
manuscript, or in the decision to publish the results.
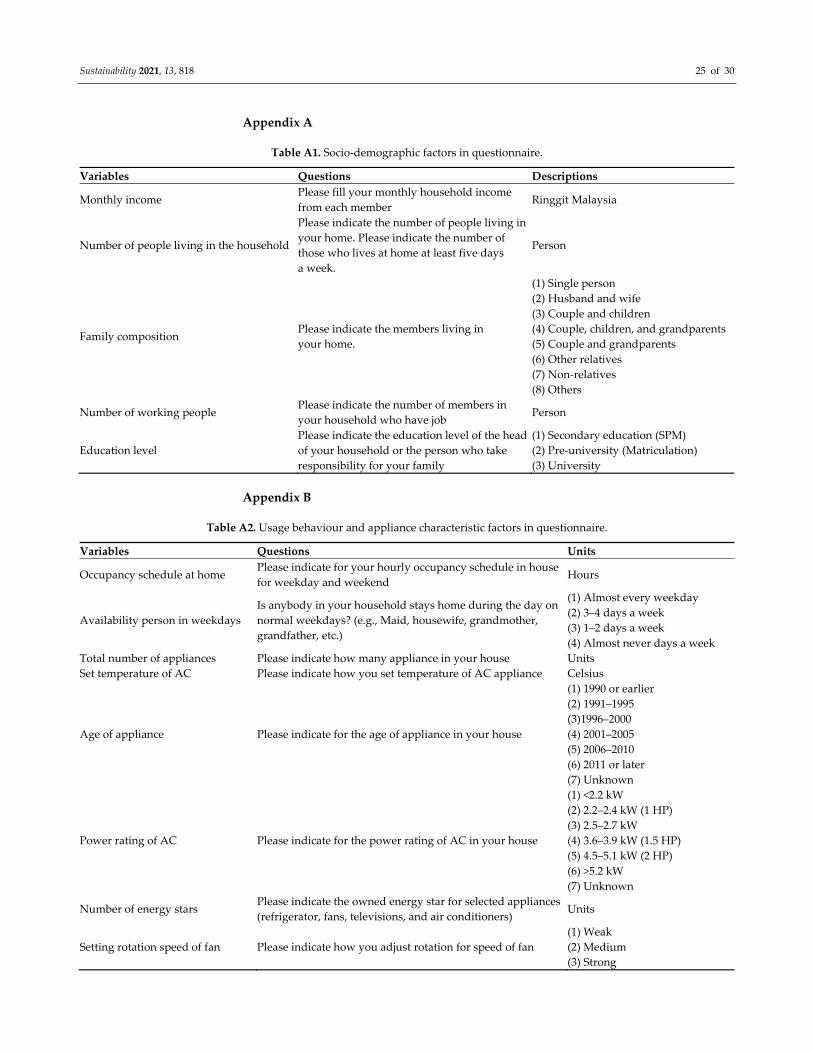
Sustainability 2021, 13, 818 25 of 30
Appendix A
Table A1. Socio‐demographic factors in questionnaire.
Variables Questions Descriptions
Monthly income Please fill your monthly household income
from each member Ringgit Malaysia
Number of people living in the household
Please indicate the number of people living in
your home. Please indicate the number of
those who lives at home at least five days
a week.
Person
Family composition Please indicate the members living in
your home.
(1) Single person
(2) Husband and wife
(3) Couple and children
(4) Couple, children, and grandparents
(5) Couple and grandparents
(6) Other relatives
(7) Non‐relatives
(8) Others
Number of working people Please indicate the number of members in
your household who have job Person
Education level
Please indicate the education level of the head
of your household or the person who take
responsibility for your family
(1) Secondary education (SPM)
(2) Pre‐university (Matriculation)
(3) University
Appendix B
Table A2. Usage behaviour and appliance characteristic factors in questionnaire.
Variables Questions Units
Occupancy schedule at home Please indicate for your hourly occupancy schedule in house
for weekday and weekend Hours
Availability person in weekdays
Is anybody in your household stays home during the day on
normal weekdays? (e.g., Maid, housewife, grandmother,
grandfather, etc.)
(1) Almost every weekday
(2) 3–4 days a week
(3) 1–2 days a week
(4) Almost never days a week
Total number of appliances Please indicate how many appliance in your house Units
Set temperature of AC Please indicate how you set temperature of AC appliance Celsius
Age of appliance Please indicate for the age of appliance in your house
(1) 1990 or earlier
(2) 1991–1995
(3)1996–2000
(4) 2001–2005
(5) 2006–2010
(6) 2011 or later
(7) Unknown
Power rating of AC Please indicate for the power rating of AC in your house
(1) <2.2 kW
(2) 2.2–2.4 kW (1 HP)
(3) 2.5–2.7 kW
(4) 3.6–3.9 kW (1.5 HP)
(5) 4.5–5.1 kW (2 HP)
(6) >5.2 kW
(7) Unknown
Number of energy stars Please indicate the owned energy star for selected appliances
(refrigerator, fans, televisions, and air conditioners) Units
Setting rotation speed of fan Please indicate how you adjust rotation for speed of fan
(1) Weak
(2) Medium
(3) Strong
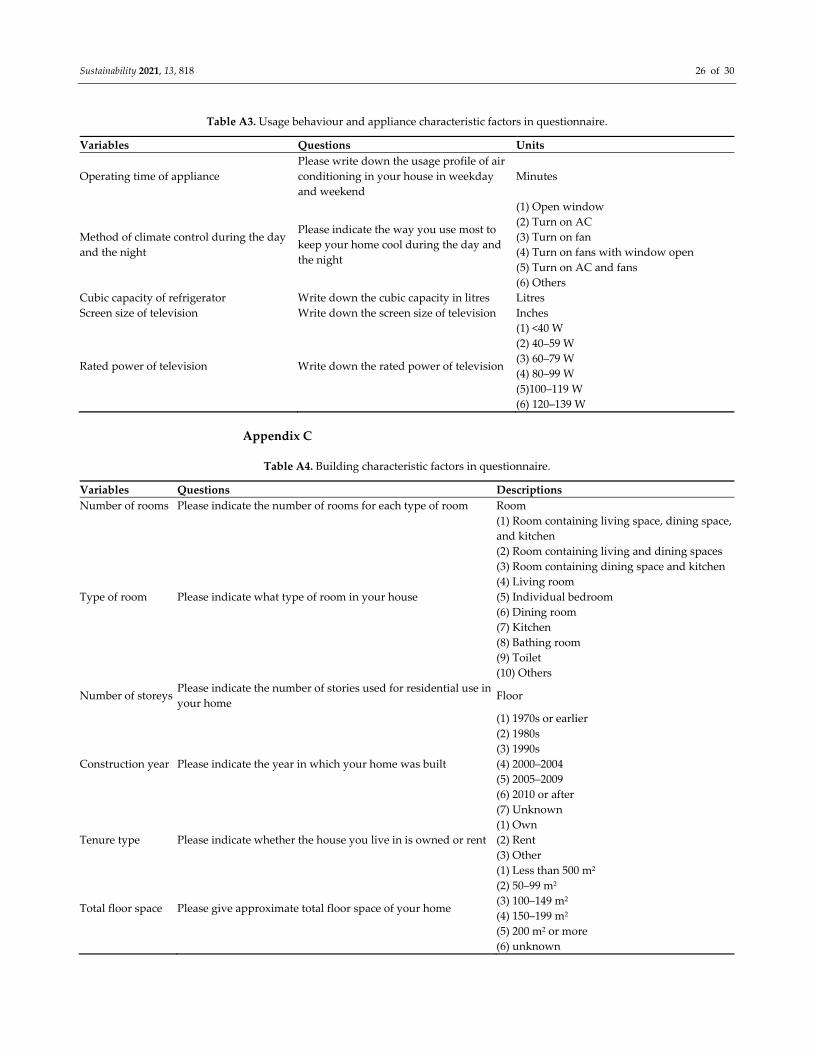
Sustainability 2021, 13, 818 26 of 30
Table A3. Usage behaviour and appliance characteristic factors in questionnaire.
Variables Questions Units
Operating time of appliance
Please write down the usage profile of air
conditioning in your house in weekday
and weekend
Minutes
Method of climate control during the day
and the night
Please indicate the way you use most to
keep your home cool during the day and
the night
(1) Open window
(2) Turn on AC
(3) Turn on fan
(4) Turn on fans with window open
(5) Turn on AC and fans
(6) Others
Cubic capacity of refrigerator Write down the cubic capacity in litres Litres
Screen size of television Write down the screen size of television Inches
Rated power of television Write down the rated power of television
(1) <40 W
(2) 40–59 W
(3) 60–79 W
(4) 80–99 W
(5)100–119 W
(6) 120–139 W
Appendix C
Table A4. Building characteristic factors in questionnaire.
Variables Questions Descriptions
Number of rooms Please indicate the number of rooms for each type of room Room
Type of room Please indicate what type of room in your house
(1) Room containing living space, dining space,
and kitchen
(2) Room containing living and dining spaces
(3) Room containing dining space and kitchen
(4) Living room
(5) Individual bedroom
(6) Dining room
(7) Kitchen
(8) Bathing room
(9) Toilet
(10) Others
Number of storeys Please indicate the number of stories used for residential use in
your home Floor
Construction year Please indicate the year in which your home was built
(1) 1970s or earlier
(2) 1980s
(3) 1990s
(4) 2000–2004
(5) 2005–2009
(6) 2010 or after
(7) Unknown
Tenure type Please indicate whether the house you live in is owned or rent
(1) Own
(2) Rent
(3) Other
Total floor space Please give approximate total floor space of your home
(1) Less than 500 m2
(2) 50–99 m2
(3) 100–149 m2
(4) 150–199 m2
(5) 200 m2 or more
(6) unknown

Sustainability 2021, 13, 818 27 of 30
Table A5. Building characteristic factors in questionnaire.
Variables Questions Description
Type of house Please indicate the type of house you are living in.
(1) Detached/terraced house
(2) Apartment/flat/condominium
(3) Town house
(4) Shop house
Wall material What material is the roof of your house made of?
(1) Woods
(2) Bricks
(3) Concrete
(4) Others
Roof material What material are your walls made of?
(1) Concrete
(2) Tile
(3) Tin
(4) Others
Glazing ratio Please describe the glazing ratio based on four facades of building from your
house
(1) 20%
(2) 40%
(3) 60%
(4) 80%
(5) 90%
(6) 100%
Shading device Please describe the type of shading device for window in house for all room
(1) Curtain
(2) Internal blinds
(3) Awning
(4) Louvre
Glazing type of window Please describe the type of glazing for window in house for all room
(1) Single glazing
(2) Double glazing
(3) Triple glazing
(4) Unknown
House orientation Please describe the house orientation to the sun.
(1) North [N]
(2) East [E]
(3) South [S]
(4) West [W]
(5) SE
(6) NE
(7) SW
(8) NW
(9) NS
(10) EW
Appendix D
Table A6. Cross correlation analysis for household characteristic factors with respect to monthly
income.
a b c d e f g h i j k
a 1
b 0.14 * 1
c 0.27 ** 0.13 * 1
d 0.32 ** 0.26 ** 0.29 ** 1
e 0.32 ** 0.04 0.22 ** 0.30 ** 1
f 0.33 ** 0.07 0.24 ** 0.31 ** 0.37 ** 1
g 0.37 ** 0.13 * 0.30 ** 0.56 ** 0.37 ** 0.42 ** 1
h 0.40 ** 0.21 ** 0.29 ** 0.32 ** 0.20 ** 0.35 ** 0.30 ** 1
i 0.31 ** 0.08 0.26 ** 0.26 ** 0.24 ** 0.68 ** 0.34 ** 0.27 ** 1
j 0.31 ** −0.03 0.13 * 0.14 * 0.32 ** 0.27 ** 0.21 ** 0.23 ** 0.18 ** 1
k 0.33 ** −0.06 0.13 * 0.14 * 0.31 ** 0.23 ** 0.21 ** 0.24 ** 0.16 * 0.94 ** 1
Note: * Correlation is significant at the 0.05 level, ** correlation is significant at the 0.01 level, a:
monthly income, b: number of people living, c: education level of household head, d: number of
rooms, e: number of wall mounted air conditioner, f: number of miscellaneous appliances, g:
number of lamps (all), h: number of charger laptop, i: number of vacuum cleaners, j: usage of the
router on weekdays, k: usage of router on weekends.
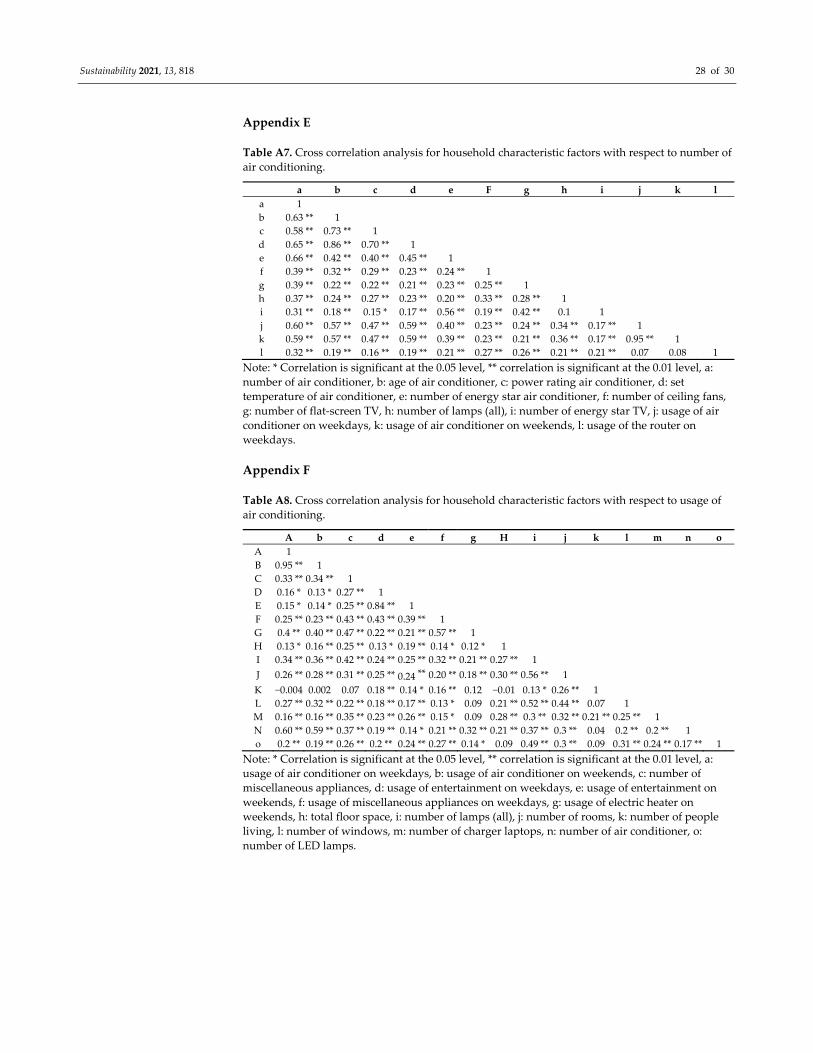
Sustainability 2021, 13, 818 28 of 30
Appendix E
Table A7. Cross correlation analysis for household characteristic factors with respect to number of
air conditioning.
a b c d e F g h i j k l
a 1
b 0.63 ** 1
c 0.58 ** 0.73 ** 1
d 0.65 ** 0.86 ** 0.70 ** 1
e 0.66 ** 0.42 ** 0.40 ** 0.45 ** 1
f 0.39 ** 0.32 ** 0.29 ** 0.23 ** 0.24 ** 1
g 0.39 ** 0.22 ** 0.22 ** 0.21 ** 0.23 ** 0.25 ** 1
h 0.37 ** 0.24 ** 0.27 ** 0.23 ** 0.20 ** 0.33 ** 0.28 ** 1
i 0.31 ** 0.18 ** 0.15 * 0.17 ** 0.56 ** 0.19 ** 0.42 ** 0.1 1
j 0.60 ** 0.57 ** 0.47 ** 0.59 ** 0.40 ** 0.23 ** 0.24 ** 0.34 ** 0.17 ** 1
k 0.59 ** 0.57 ** 0.47 ** 0.59 ** 0.39 ** 0.23 ** 0.21 ** 0.36 ** 0.17 ** 0.95 ** 1
l 0.32 ** 0.19 ** 0.16 ** 0.19 ** 0.21 ** 0.27 ** 0.26 ** 0.21 ** 0.21 ** 0.07 0.08 1
Note: * Correlation is significant at the 0.05 level, ** correlation is significant at the 0.01 level, a:
number of air conditioner, b: age of air conditioner, c: power rating air conditioner, d: set
temperature of air conditioner, e: number of energy star air conditioner, f: number of ceiling fans,
g: number of flat‐screen TV, h: number of lamps (all), i: number of energy star TV, j: usage of air
conditioner on weekdays, k: usage of air conditioner on weekends, l: usage of the router on
weekdays.
Appendix F
Table A8. Cross correlation analysis for household characteristic factors with respect to usage of
air conditioning.
A b c d e f g H i j k l m n o
A 1
B 0.95 ** 1
C 0.33 ** 0.34 ** 1
D 0.16 * 0.13 * 0.27 ** 1
E 0.15 * 0.14 * 0.25 ** 0.84 ** 1
F 0.25 ** 0.23 ** 0.43 ** 0.43 ** 0.39 ** 1
G 0.4 ** 0.40 ** 0.47 ** 0.22 ** 0.21 ** 0.57 ** 1
H 0.13 * 0.16 ** 0.25 ** 0.13 * 0.19 ** 0.14 * 0.12 * 1
I 0.34 ** 0.36 ** 0.42 ** 0.24 ** 0.25 ** 0.32 ** 0.21 ** 0.27 ** 1
J 0.26 ** 0.28 ** 0.31 ** 0.25 ** 0.24 ** 0.20 ** 0.18 ** 0.30 ** 0.56 ** 1
K −0.004 0.002 0.07 0.18 ** 0.14 * 0.16 ** 0.12 −0.01 0.13 * 0.26 ** 1
L 0.27 ** 0.32 ** 0.22 ** 0.18 ** 0.17 ** 0.13 * 0.09 0.21 ** 0.52 ** 0.44 ** 0.07 1
M 0.16 ** 0.16 ** 0.35 ** 0.23 ** 0.26 ** 0.15 * 0.09 0.28 ** 0.3 ** 0.32 ** 0.21 ** 0.25 ** 1
N 0.60 ** 0.59 ** 0.37 ** 0.19 ** 0.14 * 0.21 ** 0.32 ** 0.21 ** 0.37 ** 0.3 ** 0.04 0.2 ** 0.2 ** 1
o 0.2 ** 0.19 ** 0.26 ** 0.2 ** 0.24 ** 0.27 ** 0.14 * 0.09 0.49 ** 0.3 ** 0.09 0.31 ** 0.24 ** 0.17 ** 1
Note: * Correlation is significant at the 0.05 level, ** correlation is significant at the 0.01 level, a:
usage of air conditioner on weekdays, b: usage of air conditioner on weekends, c: number of
miscellaneous appliances, d: usage of entertainment on weekdays, e: usage of entertainment on
weekends, f: usage of miscellaneous appliances on weekdays, g: usage of electric heater on
weekends, h: total floor space, i: number of lamps (all), j: number of rooms, k: number of people
living, l: number of windows, m: number of charger laptops, n: number of air conditioner, o:
number of LED lamps.
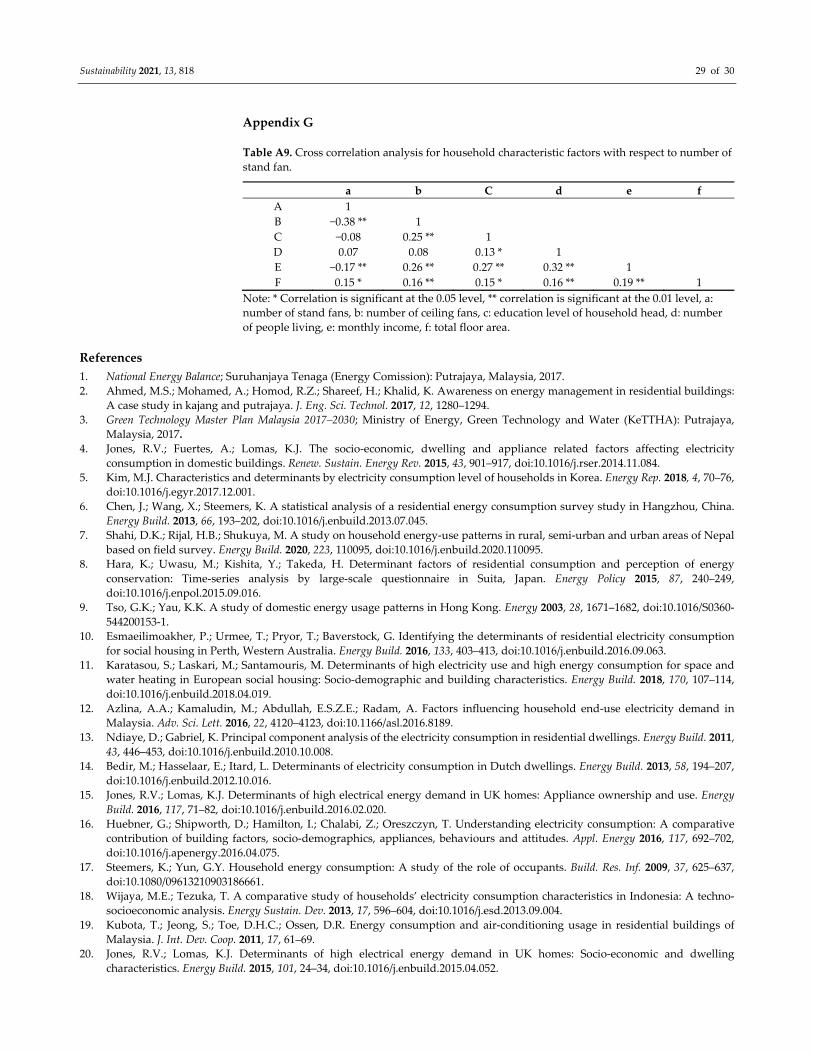
Sustainability 2021, 13, 818 29 of 30
Appendix G
Table A9. Cross correlation analysis for household characteristic factors with respect to number of
stand fan.
a b C d e f
A 1
B −0.38 ** 1
C −0.08 0.25 ** 1
D 0.07 0.08 0.13 * 1
E −0.17 ** 0.26 ** 0.27 ** 0.32 ** 1
F 0.15 * 0.16 ** 0.15 * 0.16 ** 0.19 ** 1
Note: * Correlation is significant at the 0.05 level, ** correlation is significant at the 0.01 level, a:
number of stand fans, b: number of ceiling fans, c: education level of household head, d: number
of people living, e: monthly income, f: total floor area.
References
1. National Energy Balance; Suruhanjaya Tenaga (Energy Comission): Putrajaya, Malaysia, 2017.
2. Ahmed, M.S.; Mohamed, A.; Homod, R.Z.; Shareef, H.; Khalid, K. Awareness on energy management in residential buildings:
A case study in kajang and putrajaya. J. Eng. Sci. Technol. 2017, 12, 1280–1294.
3. Green Technology Master Plan Malaysia 2017–2030; Ministry of Energy, Green Technology and Water (KeTTHA): Putrajaya,
Malaysia, 2017.
4. Jones, R.V.; Fuertes, A.; Lomas, K.J. The socio‐economic, dwelling and appliance related factors affecting electricity
consumption in domestic buildings. Renew. Sustain. Energy Rev. 2015, 43, 901–917, doi:10.1016/j.rser.2014.11.084.
5. Kim, M.J. Characteristics and determinants by electricity consumption level of households in Korea. Energy Rep. 2018, 4, 70–76,
doi:10.1016/j.egyr.2017.12.001.
6. Chen, J.; Wang, X.; Steemers, K. A statistical analysis of a residential energy consumption survey study in Hangzhou, China.
Energy Build. 2013, 66, 193–202, doi:10.1016/j.enbuild.2013.07.045.
7. Shahi, D.K.; Rijal, H.B.; Shukuya, M. A study on household energy‐use patterns in rural, semi‐urban and urban areas of Nepal
based on field survey. Energy Build. 2020, 223, 110095, doi:10.1016/j.enbuild.2020.110095.
8. Hara, K.; Uwasu, M.; Kishita, Y.; Takeda, H. Determinant factors of residential consumption and perception of energy
conservation: Time‐series analysis by large‐scale questionnaire in Suita, Japan. Energy Policy 2015, 87, 240–249,
doi:10.1016/j.enpol.2015.09.016.
9. Tso, G.K.; Yau, K.K. A study of domestic energy usage patterns in Hong Kong. Energy 2003, 28, 1671–1682, doi:10.1016/S0360‐
544200153‐1.
10. Esmaeilimoakher, P.; Urmee, T.; Pryor, T.; Baverstock, G. Identifying the determinants of residential electricity consumption
for social housing in Perth, Western Australia. Energy Build. 2016, 133, 403–413, doi:10.1016/j.enbuild.2016.09.063.
11. Karatasou, S.; Laskari, M.; Santamouris, M. Determinants of high electricity use and high energy consumption for space and
water heating in European social housing: Socio‐demographic and building characteristics. Energy Build. 2018, 170, 107–114,
doi:10.1016/j.enbuild.2018.04.019.
12. Azlina, A.A.; Kamaludin, M.; Abdullah, E.S.Z.E.; Radam, A. Factors influencing household end‐use electricity demand in
Malaysia. Adv. Sci. Lett. 2016, 22, 4120–4123, doi:10.1166/asl.2016.8189.
13. Ndiaye, D.; Gabriel, K. Principal component analysis of the electricity consumption in residential dwellings. Energy Build. 2011,
43, 446–453, doi:10.1016/j.enbuild.2010.10.008.
14. Bedir, M.; Hasselaar, E.; Itard, L. Determinants of electricity consumption in Dutch dwellings. Energy Build. 2013, 58, 194–207,
doi:10.1016/j.enbuild.2012.10.016.
15. Jones, R.V.; Lomas, K.J. Determinants of high electrical energy demand in UK homes: Appliance ownership and use. Energy
Build. 2016, 117, 71–82, doi:10.1016/j.enbuild.2016.02.020.
16. Huebner, G.; Shipworth, D.; Hamilton, I.; Chalabi, Z.; Oreszczyn, T. Understanding electricity consumption: A comparative
contribution of building factors, socio‐demographics, appliances, behaviours and attitudes. Appl. Energy 2016, 117, 692–702,
doi:10.1016/j.apenergy.2016.04.075.
17. Steemers, K.; Yun, G.Y. Household energy consumption: A study of the role of occupants. Build. Res. Inf. 2009, 37, 625–637,
doi:10.1080/09613210903186661.
18. Wijaya, M.E.; Tezuka, T. A comparative study of households’ electricity consumption characteristics in Indonesia: A techno‐
socioeconomic analysis. Energy Sustain. Dev. 2013, 17, 596–604, doi:10.1016/j.esd.2013.09.004.
19. Kubota, T.; Jeong, S.; Toe, D.H.C.; Ossen, D.R. Energy consumption and air‐conditioning usage in residential buildings of
Malaysia. J. Int. Dev. Coop. 2011, 17, 61–69.
20. Jones, R.V.; Lomas, K.J. Determinants of high electrical energy demand in UK homes: Socio‐economic and dwelling
characteristics. Energy Build. 2015, 101, 24–34, doi:10.1016/j.enbuild.2015.04.052.
Sustainability 2021, 13, 818 30 of 30
21. Huebner, G.M.; Hamilton, I.; Chalabi, Z.; Shipworth, D.; Oreszczyn, T. Explaining domestic energy consumption‐The
comparative contribution of building factors, socio‐demographics, behaviours and attitudes. Appl. Energy 2015, 159, 589–600,
doi:10.1016/j.apenergy.2015.09.028.
22. McLoughlin, F.; Duffy, A.; Conlon, M. Characterising domestic electricity consumption patterns by dwelling and occupant
socio‐economic variables: An Irish case study. Energy Build. 2012, 48, 240–248, doi:10.1016/j.enbuild.2012.01.037.
23. Salari, M.; Javid, R.J. Modeling household energy expenditure in the United States. Renew. Sustain. Energy Rev. 2017, 69, 822–
832, doi:10.1016/j.rser.2016.11.183.
24. Permana, A.S.; Aziz, N.A.; Siong, H.C. Is mom energy efficient? A study of gender, household energy consumption and family
decision making in Indonesia. Energy Res. Soc. Sci. 2015, 6, 78–86, doi:10.1016/j.erss.2014.12.007.
25. Kavousian, A.; Rajagolap, R.; Fischer, M. Determinants of residential electricity consumption: Using smart meter data to
examine the effect of climate, building characteristics, appliance stock, and occupants’ behaviour. Energy 2013, 55, 184–194,
doi:10.1016/j.energy.2013.03.086.
26. Santin Guerra, O.; Itard, L.; Visscher, H. The effect of occupancy and building characteristics on energy use for space and water
heating in Dutch residential stock. Energy Build. 2009, 41, 1223–1232, doi:10.1016/j.enbuild.2009.07.002.
27. Bedir, M.; Kara, E.C. Behavioral patterns and profiles of electricity consumption in Dutch dwellings. Energy Build. 2017, 150,
339–352, doi:10.1016/j.enbuild.2017.06.015.
28. Jaffar, B.; Oreszczyn, T.; Raslan, A.; Summerfield, A. Understanding energy demand in Kuwaiti villas: Findings from a
quantitative household survey. Energy Build. 2018, 165, 379–389, doi:10.1016/j.enbuild.2018.01.055.
29. Ashouri, M.; Haghighat, F.; Fung, B.C.; Lazrak, A.; Yoshino, H. Development of building energy saving advisory: A data mining
approach. Energy Build. 2018, 172, 139–151, doi:10.1016/j.enbuild.2018.04.052.
30. Pal, M.; Alyafi, A.A.; Ploix, S.; Reignier, P.; Bandyopadhyay, S. Unmasking the causal relationships latent in the interplay
between occupant’s actions and indoor ambience: A building energy management outlook. Appl. Energy 2019, 238, 1452–1470,
doi:10.1016/j.apenergy.2019.01.118.
31. Ranjbar, N.; Zaki, S.A.; Yusoff, N.M.; Hagishima, A. Time series data analysis of household electricity usage during El‐Nino in
Malaysia. Chem. Eng. Trans. 2017. 56, 379–384, doi:10.3303/CET1756064.
32. Aqilah Hisham, N.; Ahmad Zaki, S.; Hagishima, A.; Md Yusoff, N. Load and household profiles analysis for air‐conditioning
and total electricity in Malaysia. KnE Soc. Sci. 2019, 773–786, doi:10.18502/kss.v3i21.5010.
33. Zaki, S.A.; Hagishima, A.; Fukami, R.; Fadhillah, N. Development of a model for generating air‐conditioner operation schedules
in Malaysia. Build. Environ. 2017, 122, 354–362, doi:10.1016/j.buildenv.2017.06.023.
34. Aqilah, N.; Salim, S.A.Z.S.; Hagishima, A.; Yusoff, N.M.; Yakub, F. Time series data measurement on electricity consumption
for selected domestic appliances in typical terrace house of Malaysia. Bull. Electr. Eng. Inform. 2019, 8, 101–110,
doi:10.11591/eei.v8i4.1601.
35. Subang Airport, Selangor, Malaysia Weather History. Available online:
https://www.wunderground.com/history/daily/my/subang‐airport/WMSA (accessed on 31 January 2019).
36. Malaysia Map Vector PNG Clipart Malaysia Map Vector PNG Clipart. 2019. Available online:
https://www.pinclipart.com/pindetail/ioowix_lantech‐case‐study‐malaysia‐map‐vector‐png‐clipart.html (accessed on 26
October 2019).
37. Nakagami, H.; Murakoshi, C.; Iwafune, Y. International comparison of household energy consumption and its indicator. ACEEE
Summer Study Energy Effic. Build. 2008, 8, 214–224.
38. Shrestha, P.P.; Kulkarni, P. Factors influencing energy consumption of energy star and non–energy star homes. J. Manag. Eng.
2013, 29, 269–278.
39. Cochran, W.G. Sampling Techniques, 3rd ed.; John Wiley&Sons: New York, NY, USA, 1977.
40. Genjo, K.; Tanabe, S.; Matsumoto, S.; Hasegawa, K.; Yoshino, H. Relationship between possession of electric appliances and
electricity for lighting and others in Japanese households. Energy Build. 2005, 37, 259–272, doi:10.1016/j.enbuild.2004.06.025.
41. De Dear, R.; Brager, G.; Cooper, D. Developing an Adaptive Model of Thermal Comfort and Preference; Final Report; ASHRAE:
Peachtree Corners, GE, USA, 1997.
42. Gautam, B.; Rijal, H.B.; Shukuya, M.; Imagawa, H. A field investigation on the wintry thermal comfort and clothing adjustment
of residents in traditional Nepalese houses. J. Build. Eng. 2019, 26, 100886, doi:10.1016/j.jobe.2019.100886.
43. Galvin, R. Targeting ‘behavers’ rather than behaviours: A ‘subject‐oriented’approach for reducing space heating rebound effects
in low energy dwellings. Energy Build. 2013, 67, 596–607, doi:10.1016/j.enbuild.2013.08.065.
44. S. Domínguez‐Amarillo.; J. Fernández‐Agüera, S.; Cesteros‐García, R.A.; González‐Lezcano, Bad Air Can Also Kill: Residential
Indoor Air Quality and Pollutant Exposure Risk during the COVID‐19 Crisis. Int. J. Environ. Res. Public Health 2020, 17, 7183–
7216.
45. Silva, M.F.; Maas, S.; De Souza, H.A.; Gomes, A.P. Post‐occupancy evaluation of residential buildings in Luxembourg with
centralized and decentralized ventilation systems, focusing on indoor air quality (IAQ). Assessment by questionnaires and
physical measurements. Energy Build. 2017, 148, 119–127, doi:10.1016/j.enbuild.2017.04.049.
46. Dziedzic, J.W.; Da, Y.; Novakovic, V. Indoor occupant behaviour monitoring with the use of a depth registration camera. Build.
Environ. 2019, 148, 44–54, doi:10.1016/j.buildenv.2018.10.032. 47. Ng, A.; Firouz, A.M.M.; Khalidi, J.R.; Muhtar, M.A.; Tumin, S.A.; Man, T.K.; Theng, T.T.; Gen, T.Z. The State of Households 2018:
Different Realities; Khazanah Research Institute: Kuala Lumpur, Malaysia, 2018.