Embed Size (px)
Citation preview
Page 1 of 38
Article DOI: https://doi.org/10.3201/eid2711.210636
Prevalence of SARS-CoV-2 Antibody after First 6 Months of the COVID-19 Pandemic,
Portugal Appendix
Study Context
It is challenging to determine the true extent of SARS-CoV-2 infection in different
countries due to different testing programs and capacities, and variations in the fraction of
asymptomatic infections (1–4). In this context, seroepidemiologic surveys are a powerful tool to
help estimate the true prevalence of infection in a given population. There have been multiple
seroprevalence studies for SARS-CoV-2 in different settings around the world (5–11),
summarized in several meta-analyses-type studies (12–14), but there have been few national-
level studies (3,15–20).
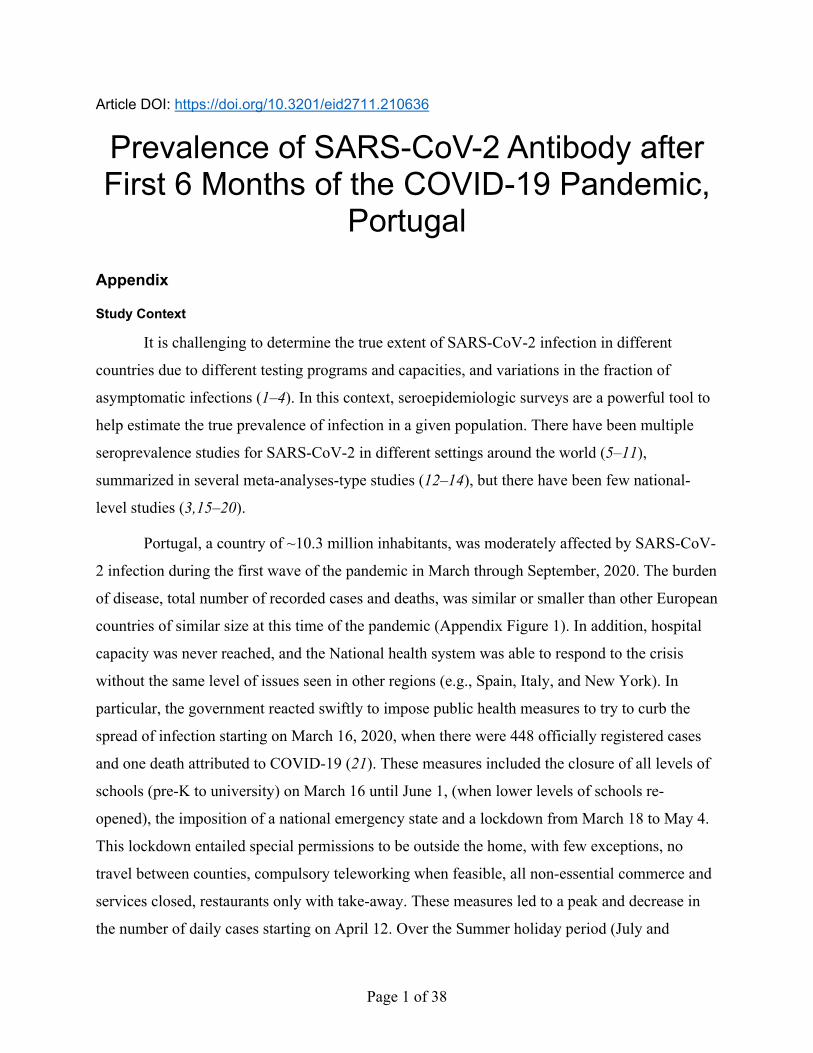
Portugal, a country of ~10.3 million inhabitants, was moderately affected by SARS-CoV-
2 infection during the first wave of the pandemic in March through September, 2020. The burden
of disease, total number of recorded cases and deaths, was similar or smaller than other European
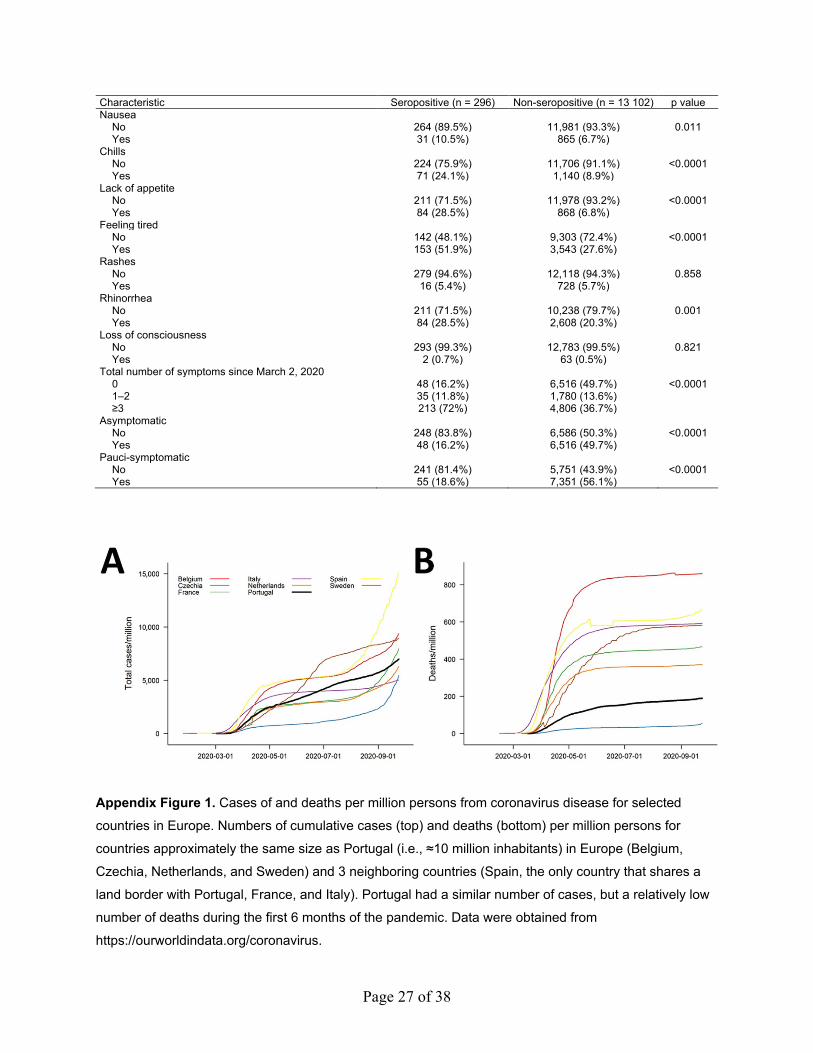
countries of similar size at this time of the pandemic (Appendix Figure 1). In addition, hospital
capacity was never reached, and the National health system was able to respond to the crisis
without the same level of issues seen in other regions (e.g., Spain, Italy, and New York). In
particular, the government reacted swiftly to impose public health measures to try to curb the
spread of infection starting on March 16, 2020, when there were 448 officially registered cases
and one death attributed to COVID-19 (21). These measures included the closure of all levels of
schools (pre-K to university) on March 16 until June 1, (when lower levels of schools re-
opened), the imposition of a national emergency state and a lockdown from March 18 to May 4.
This lockdown entailed special permissions to be outside the home, with few exceptions, no
travel between counties, compulsory teleworking when feasible, all non-essential commerce and
services closed, restaurants only with take-away. These measures led to a peak and decrease in
the number of daily cases starting on April 12. Over the Summer holiday period (July and
Page 2 of 38
August), the number of cases was somewhat elevated, but steady, with a daily average of 255
cases.
As of June 2, 2020, Portugal was one of the ten countries in the world with highest levels
of testing in per capita terms (22). This notwithstanding, the potential for asymptomatic
infections makes it difficult to estimate the true extent of SARS-CoV-2 infections in Portugal
after the first phase of the pandemic, although an earlier, more limited, study estimated
seroprevalence at 2.9% (23).
Calculation of Sample Size
The sample was stratified by age groups (<18, 18 to 54, ≥55 years old) crossed by
population density of the place of residence (<60; 60 to 500; >500 persons/km2). These strata
were chosen for epidemiologic reasons. Age is a major factor in COVID-19 severity, and the
three age groups were chosen based on cut-offs proposed in a vaccine trial (24). Population
density is a major factor in the transmission of infectious diseases, and the three groups were
chosen to have a good balance between number of counties sampled and total population in each
density strata. At the same time, we strived to keep the total number of strata at <10, to reduce
the logistical complexities and sample size associated with more strata. The overall sample size
was determined by assuming low prevalence in each of the nine strata, between 0.1% and 3%,
with lower levels in the regions of low population density. We also defined a relative error
margin of 15% for the global prevalence estimate (i.e., error margin could be at most 15% of the
observed prevalence). In addition, we assumed that the test to be used would have 99%
sensitivity and 98.7% specificity. Using the test characteristics changes the expected fraction of
positive actually observed in the study (see below). We then used these corrected seroprevalence
values and Cochrane’s formula for proportional allocation to estimate sample size in stratified
populations (25), and obtained a sample size of at least 11,241 persons divided proportionally
among the 9 strata mentioned. To guarantee precision in the lowest population density regions,
where prevalence was expected to be lower, the sample size in those strata (each of the 3 age
groups) was increased by 50% of the value calculated. Thus, the final sample is no longer
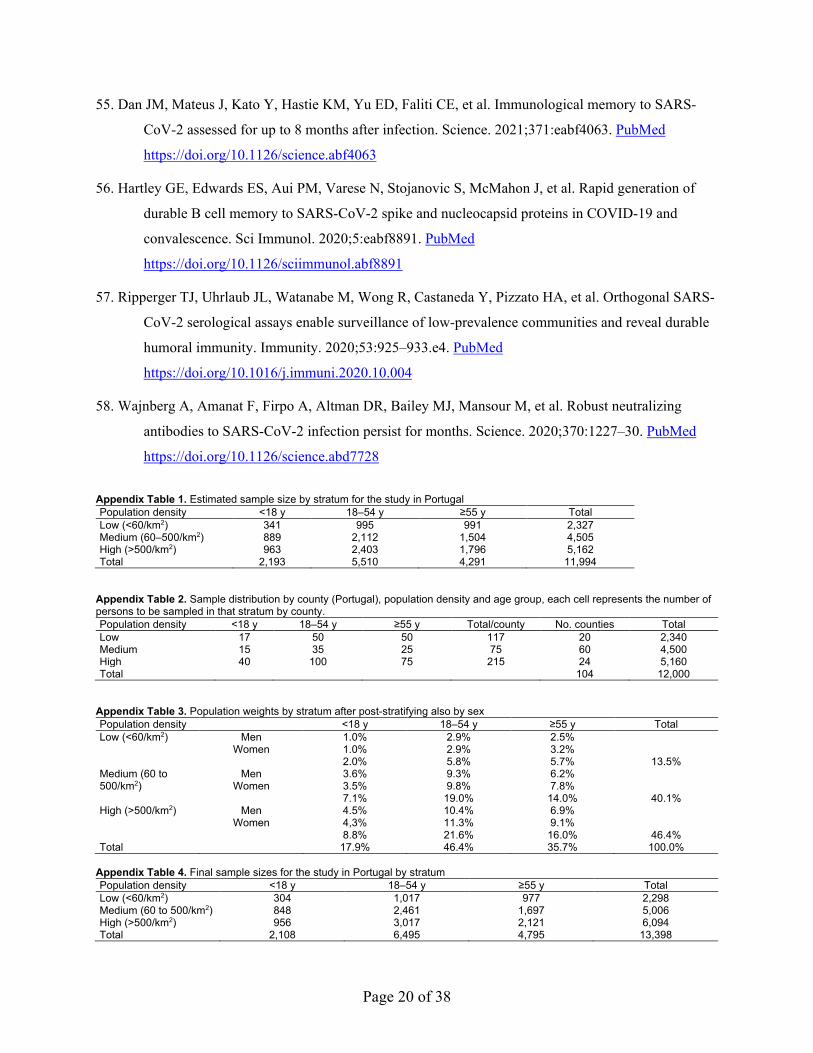
proportional to the population. The total sample size should be at least 11,994 persons distributed
according to Appendix Table 1. To achieve the required allocation by population density, the 308
counties of Portugal (including both the Madeira and Azores archipelagos) were subdivided into
the three levels of population density and 104 were randomly selected to be sampled, among all

Page 3 of 38
counties with a collection laboratory, and with the number of persons in each age group per
county as prescribed in (Appendix Table 2).
Recruitment of Study Participants
For logistical reasons, we recruited volunteers to this study, according with the quotas
defined (Appendix Table 2). Thus, this study uses a convenience sample. To achieve the needed
number of participants from all of Portugal, we developed a communication and study
dissemination strategy with several layers. One month before the beginning of the study, the
main media groups in Portugal were contacted to aid in the broadcasting of this project. Media
Capital, a large group representing 2 TV channels (TVI and TVI 24, over the air broadcast and
cable, respectively) and several radio stations (Rádio Comercial, M80, Cidade FM) with
National coverage, promptly joined in, promoting short campaign videos featuring TV and News
hosts in teasers aired at the beginning of the recruitment. Additionally, a press release containing
all the information about the study and how to participate, was widely distributed to the
Portuguese media, 1 week before the beginning of the study (with embargo). This enabled
several news pieces to be prepared in advance and released on the first day of the study. During
September 8‒30, a total of 296 news clippings, reaching all regions of Portugal, about the study
were registered.
We also implemented a campaign of leaflet distribution and poster advertisements,
through one of the funding partners of this study: Jeronimo Martins Group, which owns one of
the largest supermarket chains in Portugal (Pingo Doce), again with implantation in all regions of
Portugal. To help disseminate the study to a larger audience, a leaflet was prepared and
distributed in the Pingo Doce stores across the country. At the entrance of the stores,
advertisement posters were visible to all the clients. Additionally, advertisement posters were
distributed to the 314 participating Germano de Sousa laboratories.
Finally, we used social media, including a short video
(https://www.youtube.com/watch?v = TiKMz-Ne9bo) and specifically designed materials were
produced for the communication of the project through the institutional social media channels
(Facebook, Instagram, LinkedIn, Twitter, and YouTube), again reaching a wide audience. We
also had an email and phone lines dedicated to the study, through which interested persons could
reach us for help in registration or information about the study.
Page 4 of 38
All participants were recruited by voluntary registration through a Web site specifically
designed for the study. To help citizens with fewer digital skills, the enrollment could be done
directly at one of the 314 participating blood collection laboratories (Germano de Sousa
Laboratories), where the local technicians could support and assist in the process of registration
through the Web site. Participants were not given any compensation beyond being informed of
their serologic status. Participants were excluded only if they had any contraindication for
phlebotomy. Prior diagnosis of SARS-CoV-2 infection was not an exclusion criterion.
Blood Collection and Serologic Tests
All blood collections and serologic tests were done by Centro de Medicina Laboratorial
Germano de Sousa (CMLGS), an ISO 9001:2015 certified private laboratory, which performs
serologic tests for SARS-CoV-2 according to the clinical guidelines issued by the Directorate-
General of Health (DGS), within the Portuguese Ministry of Health. CMLGS has a national
network of collection sites, of which 314 were involved in this study. This network enabled
blood collection from the participants, wherever it was most convenient for them, typically in
their area of residence. Each participant donated 7–9 mL of blood collected into tubes with
separation gel and without any anti-coagulant, for a 4–5 mL of serum sample, obtained by
centrifugation. All samples were transported to the central laboratory, according to usual
procedures, where they were assayed.
Blood samples were assayed for total antibodies against SARS-CoV-2 by using the
Siemens SARS-CoV-2 Total (COV2T) (Advia Centaur Siemens, Siemens Healthcare, Portugal),
a chemiluminescent immunoassay test targeting the spike protein. Positive samples were stored
at Biobanco-iMM, Lisbon Academic Medical Center.
Epidemiologic Questionnaire and Outcomes
All participants completed a questionnaire with sociodemographic, general health and
clinical/epidemiologic questions regarding SARS-CoV-2 exposure, including symptoms of
interest. The full (translated) questionnaire is presented near the end of this Appendix. The
questionnaire was in Portuguese (the overwhelmingly dominant language in Portugal), and it was
tested beforehand in a study of the University of Lisbon, involving ≈2,500 persons (mostly staff).
The questionnaire was completed at enrollment, and it was the only way participants could get a
code to perform the free blood draw, within 2 weeks.
Page 5 of 38
The primary outcome was the proportion of serologic positive cases defined as the
fraction of participants who were positive for SARS-CoV-2 specific total antibodies: overall and
stratified by age and population density. The secondary outcomes included the proportion of
serologic positive cases without any symptoms of interest (asymptomatic cases); or with <3
symptoms and without sudden loss of smell or taste (pauci-symptomatic cases as defined) (3).
The symptoms of interest reported by participants in the questionnaire were: loss of smell/taste,
fever, chills, cough (dry or with mucus), muscle or joint pain, sore throat, headaches, general
weakness/tiredness, respiratory difficulty, gastrointestinal issues (vomit, nausea, diarrhea), loss
of appetite, rashes, rhinorrhea, or loss of consciousness.
Finally, the associations between antibody positivity and the sociodemographic, health
and epidemiologic characteristics of the participants were explored. We included questions about
education, household size, occupation, chronic disease conditions, body mass index, exercise,
smoking habits, influenza and Bacille Calmette-Guerin (BCG) vaccine (against tuberculosis),
contact with persons who had COVID-19, previous tests for SARS-CoV-2, among others (see
questionnaire).
Adjustment of Seroprevalence for Sample Weights
To extrapolate our results for the entire population, sample seroprevalences were adjusted
based on official estimates for the resident population, per quinquennial age group, in each
county of Portugal as of December 31, 2019 (26), and further adjusted for the overrepresentation
of women by post-stratifying the sample on sex. The weights for each of the 9 study strata
divided by sex are presented (Appendix Table 3).
Due to the low values of seroprevalences, specific methods were favored in the
calculation of upper and lower limits of the CIs, in detriment of methods based on the normal
approximation to the binomial distribution. In particular, Jeffreys CIs for a proportion were used
at the strata level (27). To calculate CIs for aggregated strata (i.e., marginal values), we used the
exact limiting terms for the binomial parameter adapted for weighted proportions (28).
Correcting Seroprevalence Estimates with Test Sensitivity and Specificity
The total antibody test has a sensitivity, from 14 days post-infection, of 98.1% (based on
536 positive samples); and a specificity of 99.9% (based on 994 samples) (29).
Page 6 of 38
The seroprevalence observed in our weighted sample was adjusted taking into
consideration the sensitivity and specificity of the tests by using the Rogan‒Gladen estimator
(30,31)
11
m padj
p
P SP
S S+ −
=+ − ,
where Pm is the measured prevalence and Padj is the final adjusted prevalence, as reported
in the main text, with the test specificity Sp and sensitivity S.
Correcting the Asymptomatic and Pauci-Symptomatic Prevalence Estimates with Test Sensitivity and Specificity
The proportion of asymptomatic observed in our weighted sample was adjusted taking
into consideration the sensitivity and specificity of the tests, by using the following formula,
deduced by applying standard results from probability theory (see the section at the end of this
Appendix),
(1 )1
m p Sadj
m P
AP S AA
P S− −
=+ − ,
where A is the observed weighted proportion of asymptomatic in the seropositive
participants Pm is the measured seroprevalence, AS is the observed proportion of asymptomatic in
the full sample, Sp is the test specificity and Aadj is the final adjusted proportion of
asymptomatic, as reported in the main text. Similarly, the proportion of pauci-symptomatic
observed in our weighted sample was adjusted taking into consideration the sensitivity and
specificity of the tests.
Comparison to Official Reported Cases
To compare our seroprevalence results with official reported cases, we used cutoffs in 10-
year age groups, which is how the official statistics are presented. For each of the age intervals
(Figure 1 of the main text), we calculated the seroprevalence in Portugal by sex and compared it
to the fraction of reported cases, as a proportion of the respective age-sex population in Portugal.
We then calculated the multiplier corresponding to how many more cases our seroprevalence
study found compared with those officially reported. For this analysis, we used the number of
reported cases on September 1, 2020 (21). We use this date to account for some time between
Page 7 of 38
infection and seroconversion, which has been reported to take ≈2 weeks (32–34). Since 90% of
blood samples from participants were collected between September 8 and September 19, 2020,
the chosen date is good for this comparison. Note that incidence was stable: ≈50 cases/million
persons/day in early September (Appendix Figure 1).
Calculation of Infection-Fatality Rates
We used the official number of deaths due to COVID-19 by age and sex divided by our
estimated number of cases in the total population to obtain the infection-fatality rate (IFR).
Again, we used cutoffs in 10-year age groups, which is how the official statistics are presented.
In addition, we took into account the typical delay between infection and death, which we
assumed to be ≈3 weeks (35,36). If we assume that we are estimating infections up to September
1, 2020 (see above), then we should calculate IFR with death data from September 21. We note
that there are more sophisticated ways to take into account the distribution of times until death
(37,38), but here for simplicity and for lack of data on that distribution, we just calculate the
quotient of deaths on September 21 by the total number of estimated infected in our study. Thus,
this is only an approximation to the IFR, albeit likely a good one, because the numbers of cases
and deaths were relatively low around these dates.
Statistical Analyses
We used the χ2 test to compare categorical variables (e.g., distribution of the number of
positive and negative participants with a given symptom), except when the numbers in some
groups were low, when we used the Fisher exact test. We used logistic regression to analyze the
effect of smoking status on prevalence of seropositivity, controlling for sex and age. For this, we
used the survey package of R (39). We did not input any missing values.
All statistical analyses were two-sided, the significance level was α = 0.05, and reported
CIs are at the 95% level. Statistical analyses were done by using SAS version 9.4 (SAS Institute
Inc, Cary, NC, USA) and R version 3.6.1 (R Foundation for Statistical Computing, Vienna,
Austria).
Sample Representativeness
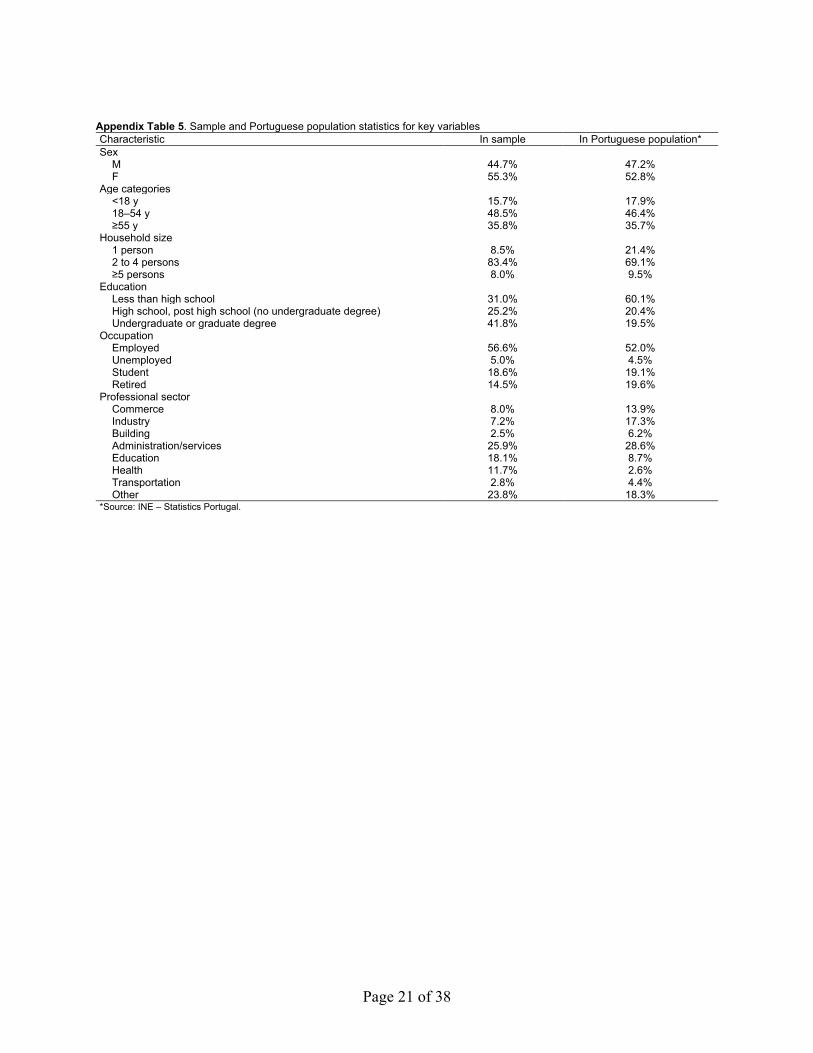
Overall, comparing with the sociodemographic characteristics of the Portuguese
population, we found an overrepresentation in the education and health sectors (36% of
employees in the sample, compared with 19% in the population). This had an impact on some
Page 8 of 38
characteristics of the 18–54 age group: more women, more graduates and fewer persons living
alone than in the global population of these ages. We present the characterization of this sample
regarding sociodemographic and health characteristic (Appendix Tables 5‒7).
SARS-CoV-2 Antibody Seroprevalence in the Population in Portugal
As we mentioned in the main text, the differences in seroprevalence across age groups
were not statistically significant. However, this difference was highly dependent on population
density, with the lowest observed seroprevalence in the youngest group in low population density
areas (0.6%) and the highest seroprevalence also in the youngest group, but in high population
density areas, with a point estimate 6 times higher (3.5%) (Table 1, main text).
After adjusting for sensitivity and specificity, the estimated proportion of asymptomatic
among seropositive was 17.4% (95% CI 14.1%‒22.9%), and the prevalence of asymptomatic
cases was much higher in persons <18 years of age (Appendix Table 8). If we consider pauci-
symptomatic cases, which also includes asymptomatic cases, the proportion among seropositive
persons increases to 19.9% (95% CI 16.1%‒25.4%), also with significantly higher values for
persons <18 years old (39.6%) (Appendix Table 8).
Demographic, Health, and Epidemiologic Determinants of Seroprevalence
We found no difference between seropositivity levels in men and women (2.3% vs. 2.1%)
(Table 2; Appendix Table 9). In terms of occupation, there were small differences in
seroprevalence between employed persons (2.3%), unemployed persons (2.5%), or students
(2.3%). However, for retired persons, we found a lower seroprevalence level (1.6%). It is
noteworthy that healthcare professionals (3.2%) and transport sector workers (3.2%) had higher
levels of seroprevalence than other workers, such as persons in commerce, industry, education,
services, or construction. About 15% (n = 1,104) of employed participants reported that they
were teleworking, and teleworkers show a lower seroprevalence (1.4%) than non-teleworkers
(2.4%), independently of whether the latter had contact with other persons at work (Table 2;
Appendix Table 9).
We also enquired about health conditions and 27.7% (n = 3,717) participants reported at
least 1 chronic condition, but we found no differences in seroprevalence for persons with or
without such conditions (Appendix Table 10). However, there was, a significant difference (p =
0.002) between persons who do not smoke (n = 9,235 participants) and those who smoke (n =
Page 9 of 38
1,862 participants), with an estimated higher seroprevalence among persons who do not smoke
(2.4%; 95% CI 2.1%–2.9%) compared with persons who smoked (1.0%; 95% CI 0.9%–2.2%)
(Table 2 in the main text). When we considered together ex-smokers and smokers, the
seroprevalence in this group of ever smokers was 1.7% (95% CI 1.4%–2.5%). Ex-smokers seem
to have a prevalence closer to non-smokers than to that of smokers. Smokers (median age = 47
years) were older than non-smokers (median age = 41 years), and as mentioned above, older
participants had a lower prevalence. In addition, smoking status differs by sex; more men
smoked than women (p = 0.001). Thus, we performed a logistic regression of seroprevalence on
smoking status controlling for the possible confounding factors of age and sex. In this analysis,
smokers still had a significantly lower seroprevalence (p = 0.003). Further analyses of this result
indicated that women were the main drivers for this difference in seroprevalence between
smokers and non-smokers.
We also considered other health-related variables. For example, there was no difference
in seroprevalence among participants who practice regular exercise versus those who do not. We
also enquired about Bacille Calmette-Guerin (BCG) status (a vaccine against tuberculosis). In
our study, 688 participants reported not taking this vaccine versus 10,672 who did, and
seroprevalence was not statistically different between these groups (Appendix Table 10). Finally,
although we found a slight over-representation of overweight and obese persons in seropositive
when compared with seronegative participants, this result was not statistically significant (Table
2).
Among participants who believed that they had been in contact with an infected person,
prevalence was 16.2% (95% CI 14.2%–19.3%), and most of these contacts were reported to be at
work. Prevalence among participants, who had someone infected in their household, was 28.3%
(95% CI 24.5%–33.7%) (Table 2). Of the 401 participants who indicated that someone in their
household had been given a diagnosis of COVID-19, 71.3% (n = 286) were seronegative, and
presumably were not infected by their household contact.
Clinical Comparison of Seropositive with Seronegative Cases
Based on the clinical questionnaire, the symptoms with largest differences in reporting
between seropositive and seronegative participants were loss of taste (42.4% of seropositive
participants vs. only 2.8% of seronegative participants), loss of smell (39.3% vs. 2.0%), general
Page 10 of 38
weakness (38.6% vs. 11.5%), fever (temperature ) >38°C (32.9% vs. 6.1%), feeling tired (51.9%
vs. 27.6%), muscular or joint pain (49.2% vs. 25.3%), and lack of appetite (28.5% vs. 6.8%), all
of which were significantly more common in seropositive participants (p<0.0001, for all of these
symptoms) (Appendix Table 10). For persons who had loss of smell or loss of taste, we
estimated seroprevalences of 31.2% (95% CI 27.1%–37.1%) and 27.7% (95% CI 23.7%–32.8%).
These are the symptoms, and the subgroups of participants, in whom prevalence is the highest,
indicating a good positive predictive value.
A total of 50.0% of seropositive participants had never been given a diagnosis of having a
case or suspected case of infection (Appendix Table 11), and 42.9% of them had never taken a
diagnostic test for SARS-CoV-2. Of the 169 seropositive persons who took such a test, 29.0% (n
= 49) had a negative result. Conversely, when seronegative participants were analyzed, 4.0% (n
= 521) were considered to have had a suspicious case at some point before this study. However,
most of these suspicions were not confirmed because of those 521 participants, 435 actually had
a reverse transcription PCR (RT-PCR) for SARS-CoV-2 and only 24 had a positive result.
Altogether, among the 2,025 seronegative participants who had an RT-PCR before our study,
1.2% (n = 24) were positive. These tests were performed a median of 88 days (minimum 12 days
and maximum 186 days) before the study.
Results in Context
We found an overall prevalence of 2.2% of persons positive for antibodies against SARS-
CoV-2 in the population of Portugal. This prevalence is was lower than that for an earlier smaller
study, using samples from persons who were tested in clinical laboratories for non‒SARS-CoV-2
reasons, which showed a seroprevalence <2.9% (23). Our results suggest that there were 3‒4-
fold as many persons infected by SARS-CoV-2 than those officially reported by health
authorities. However, this factor varied across age groups, being ≈9-fold among younger persons
(<18 years of age, both males and females). This result is striking because it contradicts the
recent suggestion that young persons might have a lower susceptibility to infection compared
with adults (40). However, other seroprevalence studies also reported this large discrepancy
between seropositive young persons and official reported cases (41).
We found that ≈40% of infections were asymptomatic in persons <18 years old, whereas
this proportion was much lower in older persons. However, we note that, in this study, a
Page 11 of 38
participant was considered asymptomatic if she or he had not experienced any of the listed
symptoms since the beginning of the pandemic (i.e., within a period of 6 months). Thus, the
percentage of asymptomatic infection is probably an underestimate, although it is consistent with
other values reported (1–4).
Spain, the only country with which Portugal has land borders, reported 5%
seroprevalence in a study done 4 months before ours (3). The dire situation observed early on in
some regions and hospitals of Spain had a profound influence in the nonpharmaceutical control
measures imposed by the Portuguese authorities, and these seemed to have been successful in
controlling the spread of infection.
We found similar seroprevalence estimates for men (2.3%) and women (2.1%), which
translates into more women having been infected than men because ≈53% of the population in
Portugal are women (42), and it is also consistent with the number of confirmed cases, in which
women had ≈54% of the cases. Our results also show that retired (older) persons, who might take
more care not to expose themselves to the virus, had lower seroprevalence (1.6%) than other
groups. Among those working, teleworking resulted in lower seroprevalence, when compared
with persons physically present at their work locations. In addition, in workers of certain sectors
(such as healthcare or transportation) seroprevalence was higher. Some of these differences did
not reach statistical significance, but are suggestive of differences in risk for acquiring infections.
In this respect, we did not find differences in seroprevalence among persons with and without
previous chronic health conditions. Given the widespread knowledge that some chronic
conditions are major risk factors for severe disease, one might expect persons who had
comorbidities to take extra precautions to avoid infection. However, our data do not support this
expectation.
We were also able to analyze 2 controversial issues related to the risk for infection. First
there have been some reports of a link between smoking and risk for SARS-CoV-2 infection (or
COVID-19 severity). A few studies looked at risk for infection (asymptomatic, mild, or severe),
including an ecologic meta-analysis (43), and a study of an outbreak on an aircraft carrier (44),
indicating a potential protective effect of smoking. Conversely, a large cross-sectional study
based on a symptom app indicated an increased risk for (symptomatic) infection for smokers
(45). In our population-based study, with self-reported smoking status, we found a lower
Page 12 of 38
seroprevalence in smokers (1.0%) vs. non-smokers (2.4%), which was one of the most robust
differences, even when accounting for sex and age of the participants. Women were the drivers
of this finding, and if we analyzed only the men, we found that the difference in prevalence
between smokers and non-smokers was no longer significant. Although these results were clear,
it is essential to stress that smoking is a well-known risk factor for many other pathologies, most
more pathogenic than SARS-CoV-2 infection (46). In addition, it is probable that once infected,
smokers have a worse prognosis (47). Thus, our findings should be interpreted cautiously.
Another debated issue is the suggestion that the BCG vaccine might be protective against
infection (48), which led to some ongoing clinical trials to analyze that hypothesis (49). In our
study, there was a slightly increased prevalence of total SARS-CoV-2 antibodies in those
reporting not taking the BCG vaccine (2.6%) versus participants who had taken the vaccine
before (2.2%), which was not statistically significant, but it is consistent with a recent result (50).
We note that only a small percentage of persons (≈6%) report not taking this vaccine (excluding
those that did not know their BCG status), which is in accordance with the recommendation of
universal vaccination in Portugal until 2016.
Some seronegative patients reported that they had been given a diagnosis of having a
suspicious case of COVID-19. However, almost none of these cases were actually confirmed by
PCR. This finding is probably caused by heightened awareness of the infection, leading to many
spurious diagnoses. According to the responses of participants, >60% of these suspicious cases
were diagnosed by using SNS24, a National Health Service telephone line managed by the
government as a first line of medical advice (not just during the pandemic). The national health
authorities reported the number of suspected cases in their daily briefings until August 16, 2020
(21). On that day, 2 weeks before the start of our study, there were 468,937 suspected cases,
which corresponds to 4.6% of the ≈10.3 million persons in Portugal. The number of suspicious
diagnosis in our sample is consistent with that value. However, there were 24 seronegative
persons who reported having a positive RT-PCR result before our study.
There are several possible explanations for this observation. These persons could have
true negative results (e.g., persons who did not yet have antibodies, persons who might have lost
antibodies (seroreversion), or persons who had a false-positive RT PCR result). Alternatively,
they could be persons who had false-negative results in our antibody test. In any case, when
Page 13 of 38
correcting our prevalence estimates with the sensitivity and specificity of the test, we are (up to a
point) taking into account these potential false-negative results in the antibody test.
As stated in the main text, our study has some limitations. We used quota sampling,
relying on volunteers for the study. Thus, our sample might not reflect the population of Portugal
in some demographic/epidemiologic respects. We stratified the study and sampled over counties
in Portugal to at least have an appropriate representation over these variables (age and population
density). In addition, we checked sex distribution by strata and found a distortion in the 18–54
years age group , for all density levels, leading us to post-stratify by sex, despite the resulting
larger imprecision in the estimates. However, there is always the possibility that access to the
internet, interest in finding serostatus results, and other factors bias the sample of participants. In
this regard, it is useful to note that other sample characteristics that deviated from the population
statistics, such as education level or household size, were not associated with seroprevalence.
One reason we chose our method of enrollment was to achieve a fast enrollment process. During
an infection outbreak, the number of persons infected, who eventually will seroconvert, is
changing continuously. This process is different from other study situations in which the
outcome is more stable (e.g., chronic conditions, behavior, or opinions). If the study (i.e.,
enrollment) takes too long, then large changes in prevalence during the study period are possible,
and it is unclear how to associate the prevalence estimate with a given time period. We reasoned
that the occurrence of such changes could bias the study more than the method of recruitment. In
addition, we note that studies designed to have a fully random sample often end up with a large
fraction of persons not participating (e.g., refusing to participate or could not be contacted),
negating the objective of that design choice (3,16). Another limitation is that we used relatively
large intervals for age groups. Likely, a more fine-grained stratification (e.g., 0–5, 6–10, 11–20,
21–50, 51–60, 61–70, 71–80, >80 years) would be more representative of epidemiologic and
clinical aspects of SARS-CoV-2. However, such stratification, as well as adding other variables
(e.g., biologic sex), would need a much larger sample size.
Our study was also based on a self-reporting questionnaire, often retrospectively,
especially for such issues as past symptoms and behaviors, and we cannot exclude errors in this
reporting. We did recontact persons who consented and for whom there were inconsistencies in
the questionnaire results that were clear obvious mistakes. In addition, in a study of
seroprevalence, there are always potential issues of assay imprecision, which we attempted to
Page 14 of 38
correct on the basis of published sensitivity and specificity. Finally, we did not correct for
potential seroreversion, which has been suggested (51–53). This phenomenon would reduce the
fraction of seropositive persons detected in our study in relation to the actual number of past
infections, which would also lower the estimated IFR. We note that this study was conducted 6
months after the start of the pandemic in Portugal, and persons were infected at various times
within that period. Several studies, including our own, have now demonstrated that antibodies to
SARS-CoV-2 are often detectable for >6 months (6,54–58). Overall, we expect seroreversion to
have a small impact on our results. However, it is not known if age, severity of disease, or other
characteristics of the infected person affect how long antibodies will be detectable after infection.
We emphasize that some or all of these potential limitations are common to essentially all
seroprevalence studies, and do not limit the usefulness of our study during the evolving
pandemic.
Despite these issues, our study demonstrated a low prevalence of SARS-CoV-2 exposure
in the Portuguese population during the first wave of the pandemic, between March and
September 2020. This study sets the groundwork for continued longitudinal monitoring of the
evolution of seroprevalence levels in Portugal.
References
1. Beale S, Hayward A, Shallcross L, Aldridge RW, Fragaszy E. A rapid review and meta-analysis of the
asymptomatic proportion of PCR-confirmed SARS-CoV-2 infections in community settings
(version 1; peer review: 1 approved with reservations). Wellcome Open Res. 2020;5:266 [cited
2021 Aug 16]. https://doi.org/10.12688/wellcomeopenres.16387.1
2. Byambasuren O, Cardona M, Bell K, Clark J, McLaws M-L, Glasziou P, et al. P. Estimating the extent
of asymptomatic COVID-19 and its potential for community transmission: systematic review and
meta-analysis. Journal of the Association of Medical Microbiology and Infectious Disease
Canada. 2020;5:223–34. https://doi.org/10.3138/jammi-2020-0030
3. Pollán M, Pérez-Gómez B, Pastor-Barriuso R, Oteo J, Hernán MA, Pérez-Olmeda M, et al.; ENE-
COVID Study Group. Prevalence of SARS-CoV-2 in Spain (ENE-COVID): a nationwide,
population-based seroepidemiological study. Lancet. 2020;396:535–44. PubMed
https://doi.org/10.1016/S0140-6736(20)31483-5
Page 15 of 38
4. Syangtan G, Bista S, Dawadi P, Rayamajhee B, Shrestha LB, Tuladhar R, et al. Asymptomatic SARS-
CoV-2 carriers: a systematic review and meta-analysis. Front Public Health. 2021;8:587374.
PubMed https://doi.org/10.3389/fpubh.2020.587374
5. Capai L, Ayhan N, Masse S, Canarelli J, Priet S, Simeoni MH, et al. Seroprevalence of SARS-CoV-2
IgG antibodies in Corsica (France), April and June 2020. J Clin Med. 2020;9:E3569. PubMed
https://doi.org/10.3390/jcm9113569
6. Figueiredo-Campos P, Blankenhaus B, Mota C, Gomes A, Serrano M, Ariotti S, et al. Seroprevalence
of anti-SARS-CoV-2 antibodies in COVID-19 patients and healthy volunteers up to 6 months
post disease onset. Eur J Immunol. 2020;50:2025–40. PubMed
https://doi.org/10.1002/eji.202048970
7. Fischer B, Knabbe C, Vollmer T. SARS-CoV-2 IgG seroprevalence in blood donors located in three
different federal states, Germany, March to June 2020. Euro Surveill. 2020;25:2001285. PubMed
https://doi.org/10.2807/1560-7917.ES.2020.25.28.2001285
8. Jespersen S, Mikkelsen S, Greve T, Kaspersen KA, Tolstrup M, Boldsen JK, et al. SARS-CoV-2
seroprevalence survey among 17,971 healthcare and administrative personnel at hospitals, pre-
hospital services, and specialist practitioners in the Central Denmark Region. Clin Infect Dis.
2020;ciaa1471. PubMed https://doi.org/10.1093/cid/ciaa1471
9. Rosenberg ES, Tesoriero JM, Rosenthal EM, Chung R, Barranco MA, Styer LM, et al. Cumulative
incidence and diagnosis of SARS-CoV-2 infection in New York. Ann Epidemiol. 2020;48:23–
29.e4. PubMed https://doi.org/10.1016/j.annepidem.2020.06.004
10. Stringhini S, Wisniak A, Piumatti G, Azman AS, Lauer SA, Baysson H, et al. Seroprevalence of anti-
SARS-CoV-2 IgG antibodies in Geneva, Switzerland (SEROCoV-POP): a population-based
study. Lancet. 2020;396:313–9. PubMed https://doi.org/10.1016/S0140-6736(20)31304-0
11. Waterfield T, Watson C, Moore R, Ferris K, Tonry C, Watt A, et al. Seroprevalence of SARS-CoV-2
antibodies in children: a prospective multicentre cohort study. Arch Dis Child. 2020. PubMed
12. Arora RK, Joseph A, Van Wyk J, Rocco S, Atmaja A, May E, et al. SeroTracker: a global SARS-
CoV-2 seroprevalence dashboard. Lancet Infect Dis. 2020. PubMed
13. Lai CC, Wang JH, Hsueh PR. Population-based seroprevalence surveys of anti-SARS-CoV-2
antibody: an up-to-date review. Int J Infect Dis. 2020;101:314–22. PubMed
https://doi.org/10.1016/j.ijid.2020.10.011
Page 16 of 38
14. Rostami A. Sepidarkish M. Leeflang MM, Riahi SM. Nourollahpour Shiadeh M, Esfandyari S, et al.
SARS-CoV-2 seroprevalence worldwide: a systematic review and meta-analysis. Clin Microbiol
Infect. 2020. PubMed https://doi.org/10.1016/j.cmi.2020.10.020
15. Gudbjartsson DF, Norddahl GL, Melsted P, Gunnarsdottir K, Holm H, Eythorsson E, et al. Humoral
immune response to SARS-CoV-2 in Iceland. N Engl J Med. 2020;383:1724–34. PubMed
https://doi.org/10.1056/NEJMoa2026116
16. Hallal PC, Hartwig FP, Horta BL, Silveira MF, Struchiner CJ, Vidaletti LP, et al. SARS-CoV-2
antibody prevalence in Brazil: results from two successive nationwide serological household
surveys. Lancet Glob Health. 2020;8:e1390–8. PubMed https://doi.org/10.1016/S2214-
109X(20)30387-9
17. Poustchi H, Darvishian M, Mohammadi Z, Shayanrad A, Delavari A, Bahadorimonfared A, et al.
SARS-CoV-2 antibody seroprevalence in the general population and high-risk occupational
groups across 18 cities in Iran: a population-based cross-sectional study. Lancet Infect Dis. 2020.
PubMed
18. Vos ERA, den Hartog G, Schepp RM, Kaaijk P, van Vliet J, Helm K, et al. Nationwide
seroprevalence of SARS-CoV-2 and identification of risk factors in the general population of the
Netherlands during the first epidemic wave. J Epidemiol Community Health. 2020;jech-2020-
215678. PubMed
19. Research Luxembourg. CON-VINCE [cited 2021 Aug 12]. https://researchluxembourg.lu/covid-19-
taskforce/con-vince
20. Petersen MS, Strøm M, Christiansen DH, Fjallsbak JP, Eliasen EH, Johansen M, et al. Seroprevalence
of SARS-CoV-2-Specific Antibodies, Faroe Islands. Emerg Infect Dis. 2020;26:2761–3. PubMed
https://doi.org/10.3201/eid2611.202736
21. Portuguese Ministry of Health. Status report – COVID-19 [in Portuguese] [cited 2021 Jan 14].
https://covid19.min-saude.pt/relatorio-de-situacao/
22. Triunfol M. High COVID-19 testing rate in Portugal. Lancet Infect Dis. 2020;20:783. PubMed
https://doi.org/10.1016/S1473-3099(20)30499-0
23. Kislaya I, Gonçalves P, Barreto M, Sousa R, Garcia AC, Matos R, et al.; ISNCOVID-19 Group.
Seroprevalence of SARS-CoV-2 infection in Portugal in May‒July 2020: results of the first
national serological survey (ISNCOVID-19). Acta Med Port. 2021;34:87–94. PubMed
https://doi.org/10.20344/amp.15122
Page 17 of 38
24. US National Library of Medicine. Study to describe the safety Tolerability, immunogenicity, and
efficacy of RNA vaccine candidates against COVID-19 in healthy individuals [cited 2021 Apr
30]. https://clinicaltrials.gov/ct2/show/NCT04368728
25. Cochran WG. Sampling techniques. 3rd ed. New York: John Wiley & Sons; 1977.
26. PORDATA. Resident population. Estimates at December 31: total and by age group [cited 2020 Jan
13]. https://www.pordata.pt/en/DB/Municipalities/Search+Environment/Table/5819785
27. Brown LD, Cai TT, DasGupta A. Interval estimation for a binomial proportion. Stat Sci.
2001;16:101–33. https://doi.org/10.1214/ss/1009213286
28. Waller JL, Addy CL, Jackson KL, Garrison CZ. Confidence intervals for weighted proportions. Stat
Med. 1994;13:1071–82. PubMed https://doi.org/10.1002/sim.4780131009
29. Ainsworth M, Andersson M, Auckland K, Baillie JK, Barnes E, Beer S, et al.; National SARS-CoV-2
Serology Assay Evaluation Group. Performance characteristics of five immunoassays for SARS-
CoV-2: a head-to-head benchmark comparison. Lancet Infect Dis. 2020;20:1390–400. PubMed
https://doi.org/10.1016/S1473-3099(20)30634-4
30. Sempos CT, Tian L. Adjusting coronavirus prevalence estimates for laboratory test kit error. Am J
Epidemiol. 2021;190:109–15. PubMed https://doi.org/10.1093/aje/kwaa174
31. Rogan WJ, Gladen B. Estimating prevalence from the results of a screening test. Am J Epidemiol.
1978;107:71–6. PubMed https://doi.org/10.1093/oxfordjournals.aje.a112510
32. Bar-On YM, Flamholz A, Phillips R, Milo R. SARS-CoV-2 (COVID-19) by the numbers. eLife.
2020;9:e57309. PubMed https://doi.org/10.7554/eLife.57309
33. Long QX, Liu BZ, Deng HJ, Wu GC, Deng K, Chen YK, et al. Antibody responses to SARS-CoV-2
in patients with COVID-19. Nat Med. 2020;26:845–8. PubMed https://doi.org/10.1038/s41591-
020-0897-1
34. Lou B, Li TD, Zheng SF, Su YY, Li ZY, Liu W, et al. Serology characteristics of SARS-CoV-2
infection after exposure and post-symptom onset. Eur Respir J. 2020;56:2000763. PubMed
https://doi.org/10.1183/13993003.00763-2020
35. Linton NM, Kobayashi T, Yang Y, Hayashi K, Akhmetzhanov AR, Jung SM, et al. Incubation period
and other epidemiological characteristics of 2019 novel coronavirus infections with right
truncation: a statistical analysis of publicly available case data. J Clin Med. 2020;9:E538.
PubMed https://doi.org/10.3390/jcm9020538
Page 18 of 38
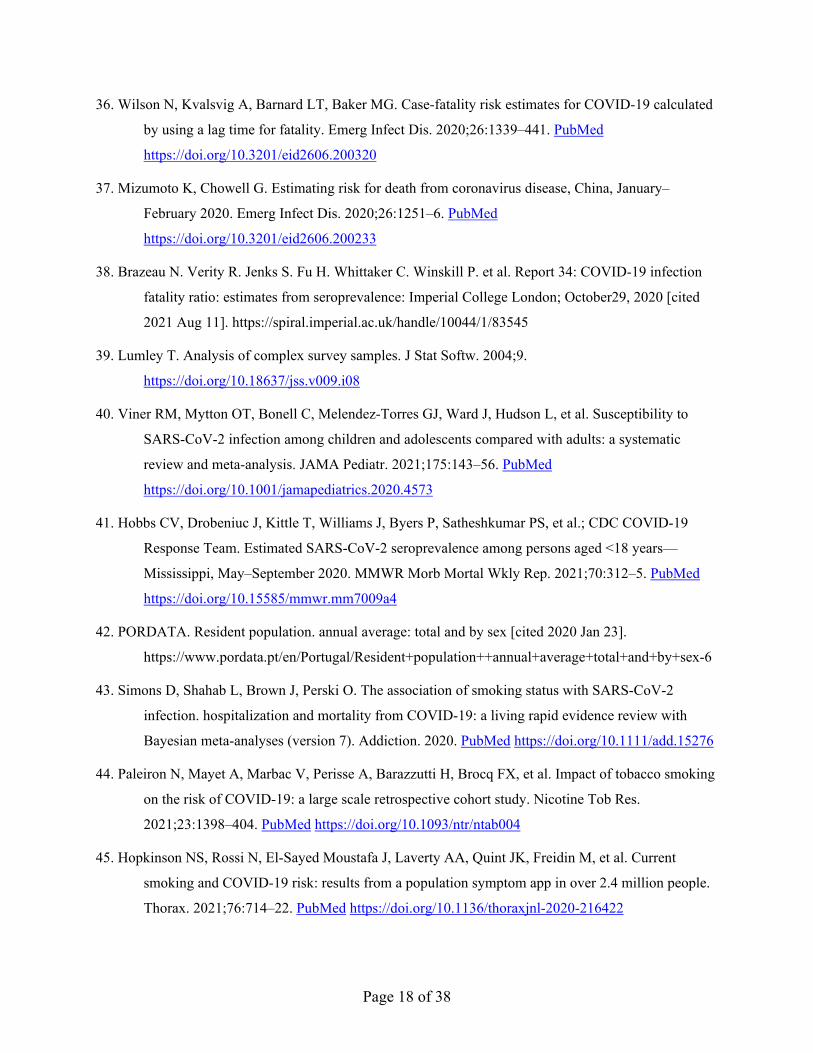
36. Wilson N, Kvalsvig A, Barnard LT, Baker MG. Case-fatality risk estimates for COVID-19 calculated
by using a lag time for fatality. Emerg Infect Dis. 2020;26:1339–441. PubMed
https://doi.org/10.3201/eid2606.200320
37. Mizumoto K, Chowell G. Estimating risk for death from coronavirus disease, China, January‒
February 2020. Emerg Infect Dis. 2020;26:1251–6. PubMed
https://doi.org/10.3201/eid2606.200233
38. Brazeau N. Verity R. Jenks S. Fu H. Whittaker C. Winskill P. et al. Report 34: COVID-19 infection
fatality ratio: estimates from seroprevalence: Imperial College London; October29, 2020 [cited
2021 Aug 11]. https://spiral.imperial.ac.uk/handle/10044/1/83545
39. Lumley T. Analysis of complex survey samples. J Stat Softw. 2004;9.
https://doi.org/10.18637/jss.v009.i08
40. Viner RM, Mytton OT, Bonell C, Melendez-Torres GJ, Ward J, Hudson L, et al. Susceptibility to
SARS-CoV-2 infection among children and adolescents compared with adults: a systematic
review and meta-analysis. JAMA Pediatr. 2021;175:143–56. PubMed
https://doi.org/10.1001/jamapediatrics.2020.4573
41. Hobbs CV, Drobeniuc J, Kittle T, Williams J, Byers P, Satheshkumar PS, et al.; CDC COVID-19
Response Team. Estimated SARS-CoV-2 seroprevalence among persons aged <18 years—
Mississippi, May‒September 2020. MMWR Morb Mortal Wkly Rep. 2021;70:312–5. PubMed
https://doi.org/10.15585/mmwr.mm7009a4
42. PORDATA. Resident population. annual average: total and by sex [cited 2020 Jan 23].
https://www.pordata.pt/en/Portugal/Resident+population++annual+average+total+and+by+sex-6
43. Simons D, Shahab L, Brown J, Perski O. The association of smoking status with SARS-CoV-2
infection. hospitalization and mortality from COVID-19: a living rapid evidence review with
Bayesian meta-analyses (version 7). Addiction. 2020. PubMed https://doi.org/10.1111/add.15276
44. Paleiron N, Mayet A, Marbac V, Perisse A, Barazzutti H, Brocq FX, et al. Impact of tobacco smoking
on the risk of COVID-19: a large scale retrospective cohort study. Nicotine Tob Res.
2021;23:1398–404. PubMed https://doi.org/10.1093/ntr/ntab004
45. Hopkinson NS, Rossi N, El-Sayed Moustafa J, Laverty AA, Quint JK, Freidin M, et al. Current
smoking and COVID-19 risk: results from a population symptom app in over 2.4 million people.
Thorax. 2021;76:714–22. PubMed https://doi.org/10.1136/thoraxjnl-2020-216422
Page 19 of 38
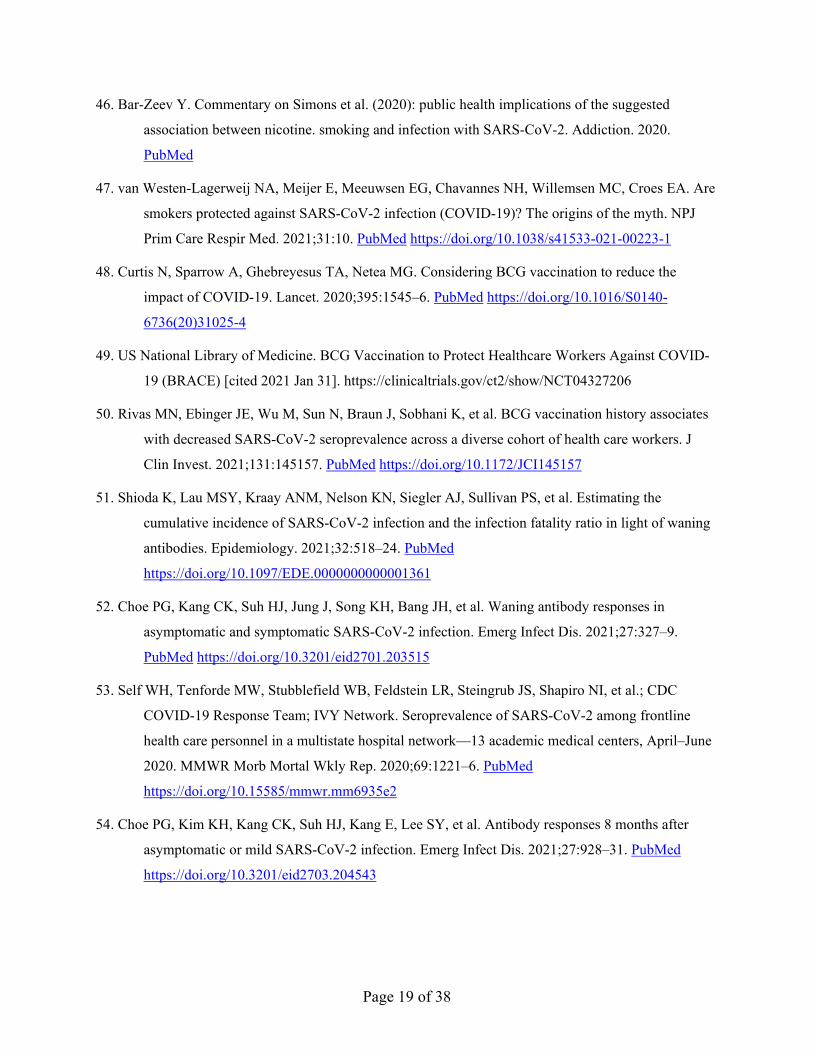
46. Bar-Zeev Y. Commentary on Simons et al. (2020): public health implications of the suggested
association between nicotine. smoking and infection with SARS-CoV-2. Addiction. 2020.
PubMed
47. van Westen-Lagerweij NA, Meijer E, Meeuwsen EG, Chavannes NH, Willemsen MC, Croes EA. Are
smokers protected against SARS-CoV-2 infection (COVID-19)? The origins of the myth. NPJ
Prim Care Respir Med. 2021;31:10. PubMed https://doi.org/10.1038/s41533-021-00223-1
48. Curtis N, Sparrow A, Ghebreyesus TA, Netea MG. Considering BCG vaccination to reduce the
impact of COVID-19. Lancet. 2020;395:1545–6. PubMed https://doi.org/10.1016/S0140-
6736(20)31025-4
49. US National Library of Medicine. BCG Vaccination to Protect Healthcare Workers Against COVID-
19 (BRACE) [cited 2021 Jan 31]. https://clinicaltrials.gov/ct2/show/NCT04327206
50. Rivas MN, Ebinger JE, Wu M, Sun N, Braun J, Sobhani K, et al. BCG vaccination history associates
with decreased SARS-CoV-2 seroprevalence across a diverse cohort of health care workers. J
Clin Invest. 2021;131:145157. PubMed https://doi.org/10.1172/JCI145157
51. Shioda K, Lau MSY, Kraay ANM, Nelson KN, Siegler AJ, Sullivan PS, et al. Estimating the
cumulative incidence of SARS-CoV-2 infection and the infection fatality ratio in light of waning
antibodies. Epidemiology. 2021;32:518–24. PubMed
https://doi.org/10.1097/EDE.0000000000001361
52. Choe PG, Kang CK, Suh HJ, Jung J, Song KH, Bang JH, et al. Waning antibody responses in
asymptomatic and symptomatic SARS-CoV-2 infection. Emerg Infect Dis. 2021;27:327–9.
PubMed https://doi.org/10.3201/eid2701.203515
53. Self WH, Tenforde MW, Stubblefield WB, Feldstein LR, Steingrub JS, Shapiro NI, et al.; CDC
COVID-19 Response Team; IVY Network. Seroprevalence of SARS-CoV-2 among frontline
health care personnel in a multistate hospital network—13 academic medical centers, April‒June
2020. MMWR Morb Mortal Wkly Rep. 2020;69:1221–6. PubMed
https://doi.org/10.15585/mmwr.mm6935e2
54. Choe PG, Kim KH, Kang CK, Suh HJ, Kang E, Lee SY, et al. Antibody responses 8 months after
asymptomatic or mild SARS-CoV-2 infection. Emerg Infect Dis. 2021;27:928–31. PubMed
https://doi.org/10.3201/eid2703.204543
Page 20 of 38
55. Dan JM, Mateus J, Kato Y, Hastie KM, Yu ED, Faliti CE, et al. Immunological memory to SARS-
CoV-2 assessed for up to 8 months after infection. Science. 2021;371:eabf4063. PubMed
https://doi.org/10.1126/science.abf4063
56. Hartley GE, Edwards ES, Aui PM, Varese N, Stojanovic S, McMahon J, et al. Rapid generation of
durable B cell memory to SARS-CoV-2 spike and nucleocapsid proteins in COVID-19 and
convalescence. Sci Immunol. 2020;5:eabf8891. PubMed
https://doi.org/10.1126/sciimmunol.abf8891
57. Ripperger TJ, Uhrlaub JL, Watanabe M, Wong R, Castaneda Y, Pizzato HA, et al. Orthogonal SARS-
CoV-2 serological assays enable surveillance of low-prevalence communities and reveal durable
humoral immunity. Immunity. 2020;53:925–933.e4. PubMed
https://doi.org/10.1016/j.immuni.2020.10.004
58. Wajnberg A, Amanat F, Firpo A, Altman DR, Bailey MJ, Mansour M, et al. Robust neutralizing
antibodies to SARS-CoV-2 infection persist for months. Science. 2020;370:1227–30. PubMed
https://doi.org/10.1126/science.abd7728
Appendix Table 1. Estimated sample size by stratum for the study in Portugal Population density <18 y 18–54 y ≥55 y Total Low (<60/km2) 341 995 991 2,327 Medium (60‒500/km2) 889 2,112 1,504 4,505 High (>500/km2) 963 2,403 1,796 5,162 Total 2,193 5,510 4,291 11,994
Appendix Table 2. Sample distribution by county (Portugal), population density and age group, each cell represents the number of persons to be sampled in that stratum by county. Population density <18 y 18–54 y ≥55 y Total/county No. counties Total Low 17 50 50 117 20 2,340 Medium 15 35 25 75 60 4,500 High 40 100 75 215 24 5,160 Total 104 12,000
Appendix Table 3. Population weights by stratum after post-stratifying also by sex Population density <18 y 18–54 y ≥55 y Total Low (<60/km2) Men 1.0% 2.9% 2.5%
Women 1.0% 2.9% 3.2%
2.0% 5.8% 5.7% 13.5%
Medium (60 to 500/km2)
Men 3.6% 9.3% 6.2%
Women 3.5% 9.8% 7.8%
7.1% 19.0% 14.0% 40.1%
High (>500/km2) Men 4.5% 10.4% 6.9%
Women 4,3% 11.3% 9.1%
8.8% 21.6% 16.0% 46.4%
Total
17.9% 46.4% 35.7% 100.0% Appendix Table 4. Final sample sizes for the study in Portugal by stratum Population density <18 y 18–54 y ≥55 y Total Low (<60/km2) 304 1,017 977 2,298 Medium (60 to 500/km2) 848 2,461 1,697 5,006 High (>500/km2) 956 3,017 2,121 6,094 Total 2,108 6,495 4,795 13,398
Page 21 of 38
Appendix Table 5. Sample and Portuguese population statistics for key variables Characteristic In sample In Portuguese population* Sex
M 44.7% 47.2% F 55.3% 52.8% Age categories
<18 y 15.7% 17.9% 18–54 y 48.5% 46.4% ≥55 y 35.8% 35.7% Household size
1 person 8.5% 21.4% 2 to 4 persons 83.4% 69.1% ≥5 persons 8.0% 9.5% Education
Less than high school 31.0% 60.1% High school, post high school (no undergraduate degree) 25.2% 20.4% Undergraduate or graduate degree 41.8% 19.5% Occupation
Employed 56.6% 52.0% Unemployed 5.0% 4.5% Student 18.6% 19.1% Retired 14.5% 19.6% Professional sector
Commerce 8.0% 13.9% Industry 7.2% 17.3% Building 2.5% 6.2% Administration/services 25.9% 28.6% Education 18.1% 8.7% Health 11.7% 2.6% Transportation 2.8% 4.4% Other 23.8% 18.3% *Source: INE – Statistics Portugal.
Page 22 of 38
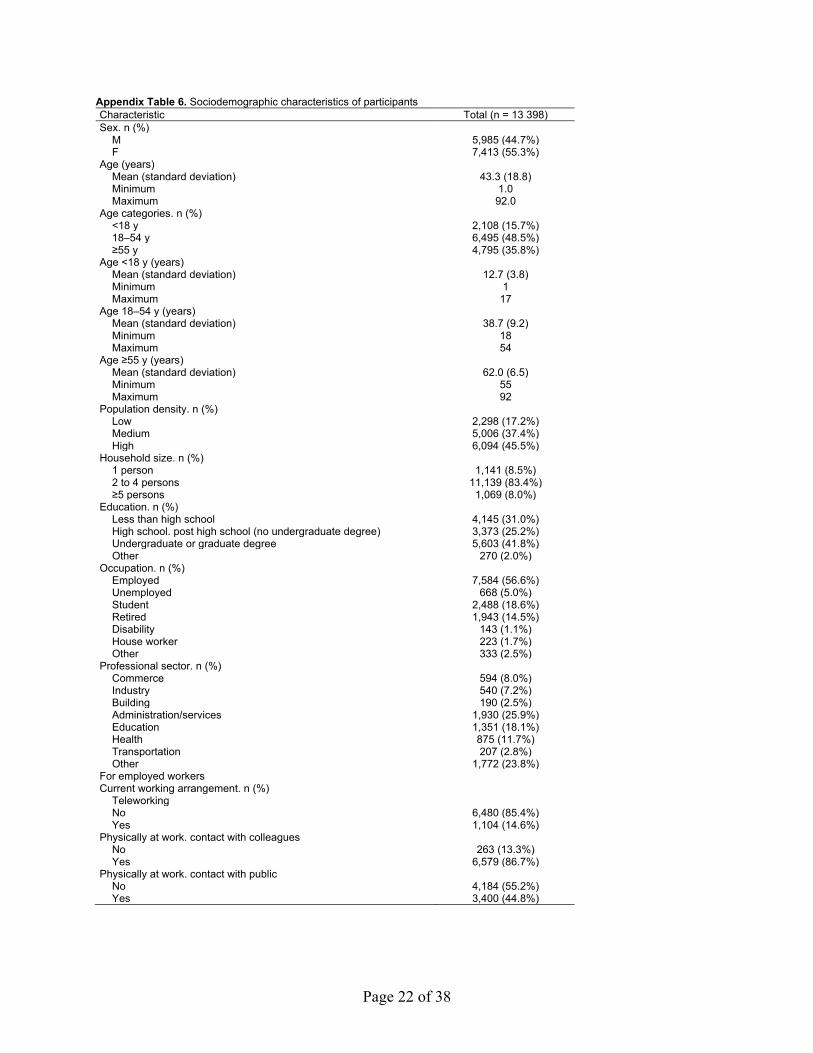
Appendix Table 6. Sociodemographic characteristics of participants Characteristic Total (n = 13 398) Sex. n (%) M 5,985 (44.7%) F 7,413 (55.3%) Age (years) Mean (standard deviation) 43.3 (18.8) Minimum 1.0 Maximum 92.0 Age categories. n (%) <18 y 2,108 (15.7%) 18–54 y 6,495 (48.5%) ≥55 y 4,795 (35.8%) Age <18 y (years) Mean (standard deviation) 12.7 (3.8) Minimum 1 Maximum 17 Age 18–54 y (years) Mean (standard deviation) 38.7 (9.2) Minimum 18 Maximum 54 Age ≥55 y (years) Mean (standard deviation) 62.0 (6.5) Minimum 55 Maximum 92 Population density. n (%) Low 2,298 (17.2%) Medium 5,006 (37.4%) High 6,094 (45.5%) Household size. n (%) 1 person 1,141 (8.5%) 2 to 4 persons 11,139 (83.4%) ≥5 persons 1,069 (8.0%) Education. n (%) Less than high school 4,145 (31.0%) High school. post high school (no undergraduate degree) 3,373 (25.2%) Undergraduate or graduate degree 5,603 (41.8%) Other 270 (2.0%) Occupation. n (%) Employed 7,584 (56.6%) Unemployed 668 (5.0%) Student 2,488 (18.6%) Retired 1,943 (14.5%) Disability 143 (1.1%) House worker 223 (1.7%) Other 333 (2.5%) Professional sector. n (%) Commerce 594 (8.0%) Industry 540 (7.2%) Building 190 (2.5%) Administration/services 1,930 (25.9%) Education 1,351 (18.1%) Health 875 (11.7%) Transportation 207 (2.8%) Other 1,772 (23.8%) For employed workers Current working arrangement. n (%) Teleworking No 6,480 (85.4%) Yes 1,104 (14.6%) Physically at work. contact with colleagues No 263 (13.3%) Yes 6,579 (86.7%) Physically at work. contact with public No 4,184 (55.2%) Yes 3,400 (44.8%)
Page 23 of 38
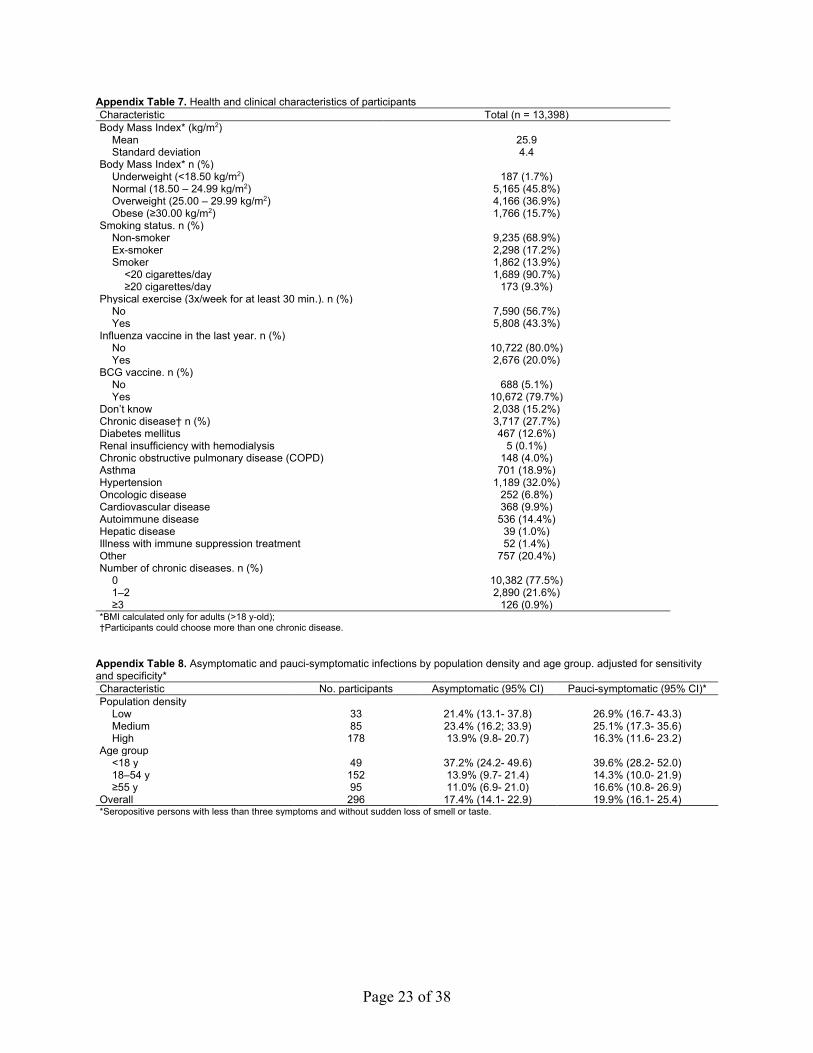
Appendix Table 7. Health and clinical characteristics of participants Characteristic Total (n = 13,398) Body Mass Index* (kg/m2) Mean 25.9 Standard deviation 4.4 Body Mass Index* n (%) Underweight (<18.50 kg/m2) 187 (1.7%) Normal (18.50 – 24.99 kg/m2) 5,165 (45.8%) Overweight (25.00 – 29.99 kg/m2) 4,166 (36.9%) Obese (≥30.00 kg/m2) 1,766 (15.7%) Smoking status. n (%) Non-smoker 9,235 (68.9%) Ex-smoker 2,298 (17.2%) Smoker 1,862 (13.9%) <20 cigarettes/day 1,689 (90.7%) ≥20 cigarettes/day 173 (9.3%) Physical exercise (3x/week for at least 30 min.). n (%) No 7,590 (56.7%) Yes 5,808 (43.3%) Influenza vaccine in the last year. n (%) No 10,722 (80.0%) Yes 2,676 (20.0%) BCG vaccine. n (%) No 688 (5.1%) Yes 10,672 (79.7%) Don’t know 2,038 (15.2%) Chronic disease† n (%) 3,717 (27.7%) Diabetes mellitus 467 (12.6%) Renal insufficiency with hemodialysis 5 (0.1%) Chronic obstructive pulmonary disease (COPD) 148 (4.0%) Asthma 701 (18.9%) Hypertension 1,189 (32.0%) Oncologic disease 252 (6.8%) Cardiovascular disease 368 (9.9%) Autoimmune disease 536 (14.4%) Hepatic disease 39 (1.0%) Illness with immune suppression treatment 52 (1.4%) Other 757 (20.4%) Number of chronic diseases. n (%) 0 10,382 (77.5%) 1–2 2,890 (21.6%) ≥3 126 (0.9%) *BMI calculated only for adults (>18 y-old); †Participants could choose more than one chronic disease.
Appendix Table 8. Asymptomatic and pauci-symptomatic infections by population density and age group. adjusted for sensitivity and specificity* Characteristic No. participants Asymptomatic (95% CI) Pauci-symptomatic (95% CI)* Population density Low 33 21.4% (13.1- 37.8) 26.9% (16.7- 43.3) Medium 85 23.4% (16.2; 33.9) 25.1% (17.3- 35.6) High 178 13.9% (9.8- 20.7) 16.3% (11.6- 23.2) Age group <18 y 49 37.2% (24.2- 49.6) 39.6% (28.2- 52.0) 18–54 y 152 13.9% (9.7- 21.4) 14.3% (10.0- 21.9) ≥55 y 95 11.0% (6.9- 21.0) 16.6% (10.8- 26.9) Overall 296 17.4% (14.1- 22.9) 19.9% (16.1- 25.4) *Seropositive persons with less than three symptoms and without sudden loss of smell or taste.
Page 24 of 38
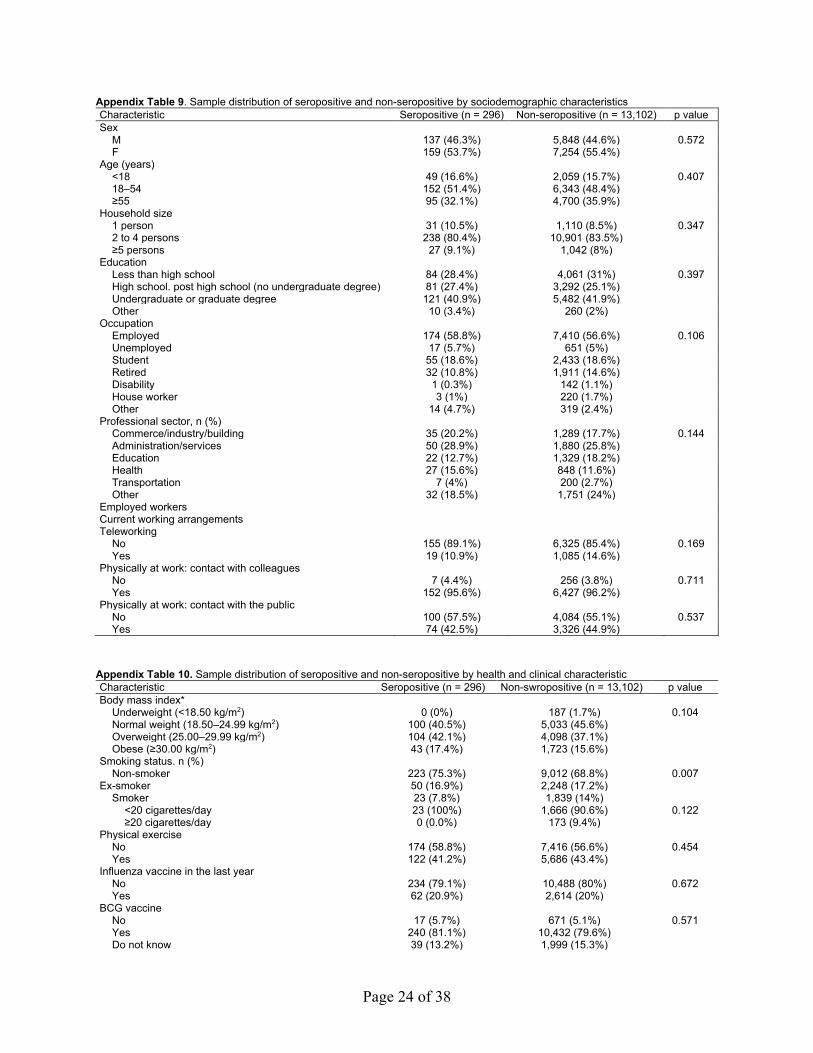
Appendix Table 9. Sample distribution of seropositive and non-seropositive by sociodemographic characteristics Characteristic Seropositive (n = 296) Non-seropositive (n = 13,102) p value Sex
M 137 (46.3%) 5,848 (44.6%) 0.572 F 159 (53.7%) 7,254 (55.4%)
Age (years)
<18 49 (16.6%) 2,059 (15.7%) 0.407 18–54 152 (51.4%) 6,343 (48.4%)
≥55 95 (32.1%) 4,700 (35.9%)
Household size
1 person 31 (10.5%) 1,110 (8.5%) 0.347 2 to 4 persons 238 (80.4%) 10,901 (83.5%)
≥5 persons 27 (9.1%) 1,042 (8%)
Education
Less than high school 84 (28.4%) 4,061 (31%) 0.397 High school. post high school (no undergraduate degree) 81 (27.4%) 3,292 (25.1%)
Undergraduate or graduate degree 121 (40.9%) 5,482 (41.9%)
Other 10 (3.4%) 260 (2%)
Occupation
Employed 174 (58.8%) 7,410 (56.6%) 0.106 Unemployed 17 (5.7%) 651 (5%)
Student 55 (18.6%) 2,433 (18.6%)
Retired 32 (10.8%) 1,911 (14.6%)
Disability 1 (0.3%) 142 (1.1%)
House worker 3 (1%) 220 (1.7%)
Other 14 (4.7%) 319 (2.4%)
Professional sector, n (%)
Commerce/industry/building 35 (20.2%) 1,289 (17.7%) 0.144 Administration/services 50 (28.9%) 1,880 (25.8%)
Education 22 (12.7%) 1,329 (18.2%)
Health 27 (15.6%) 848 (11.6%)
Transportation 7 (4%) 200 (2.7%)
Other 32 (18.5%) 1,751 (24%)
Employed workers
Current working arrangements
Teleworking
No 155 (89.1%) 6,325 (85.4%) 0.169 Yes 19 (10.9%) 1,085 (14.6%)
Physically at work: contact with colleagues
No 7 (4.4%) 256 (3.8%) 0.711 Yes 152 (95.6%) 6,427 (96.2%)
Physically at work: contact with the public
No 100 (57.5%) 4,084 (55.1%) 0.537 Yes 74 (42.5%) 3,326 (44.9%)
Appendix Table 10. Sample distribution of seropositive and non-seropositive by health and clinical characteristic Characteristic Seropositive (n = 296) Non-swropositive (n = 13,102) p value Body mass index*
Underweight (<18.50 kg/m2) 0 (0%) 187 (1.7%) 0.104 Normal weight (18.50–24.99 kg/m2) 100 (40.5%) 5,033 (45.6%)
Overweight (25.00–29.99 kg/m2) 104 (42.1%) 4,098 (37.1%)
Obese (≥30.00 kg/m2) 43 (17.4%) 1,723 (15.6%)
Smoking status. n (%)
Non-smoker 223 (75.3%) 9,012 (68.8%) 0.007 Ex-smoker 50 (16.9%) 2,248 (17.2%)
Smoker 23 (7.8%) 1,839 (14%)
<20 cigarettes/day 23 (100%) 1,666 (90.6%) 0.122 ≥20 cigarettes/day 0 (0.0%) 173 (9.4%)
Physical exercise
No 174 (58.8%) 7,416 (56.6%) 0.454 Yes 122 (41.2%) 5,686 (43.4%)
Influenza vaccine in the last year
No 234 (79.1%) 10,488 (80%) 0.672 Yes 62 (20.9%) 2,614 (20%)
BCG vaccine
No 17 (5.7%) 671 (5.1%) 0.571 Yes 240 (81.1%) 10,432 (79.6%)
Do not know 39 (13.2%) 1,999 (15.3%)
Page 25 of 38
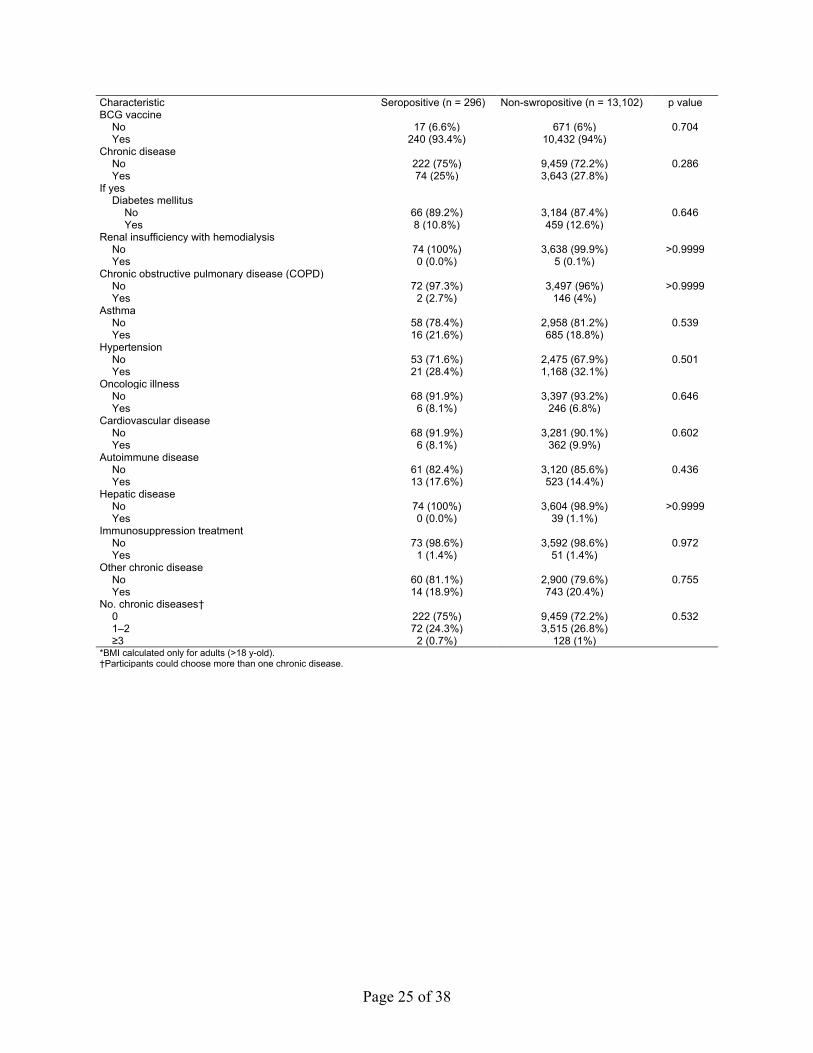
Characteristic Seropositive (n = 296) Non-swropositive (n = 13,102) p value BCG vaccine
No 17 (6.6%) 671 (6%) 0.704 Yes 240 (93.4%) 10,432 (94%)
Chronic disease
No 222 (75%) 9,459 (72.2%) 0.286 Yes 74 (25%) 3,643 (27.8%)
If yes
Diabetes mellitus
No 66 (89.2%) 3,184 (87.4%) 0.646 Yes 8 (10.8%) 459 (12.6%)
Renal insufficiency with hemodialysis
No 74 (100%) 3,638 (99.9%) >0.9999 Yes 0 (0.0%) 5 (0.1%)
Chronic obstructive pulmonary disease (COPD)
No 72 (97.3%) 3,497 (96%) >0.9999 Yes 2 (2.7%) 146 (4%)
Asthma
No 58 (78.4%) 2,958 (81.2%) 0.539 Yes 16 (21.6%) 685 (18.8%)
Hypertension
No 53 (71.6%) 2,475 (67.9%) 0.501 Yes 21 (28.4%) 1,168 (32.1%)
Oncologic illness
No 68 (91.9%) 3,397 (93.2%) 0.646 Yes 6 (8.1%) 246 (6.8%)
Cardiovascular disease
No 68 (91.9%) 3,281 (90.1%) 0.602 Yes 6 (8.1%) 362 (9.9%)
Autoimmune disease
No 61 (82.4%) 3,120 (85.6%) 0.436 Yes 13 (17.6%) 523 (14.4%)
Hepatic disease
No 74 (100%) 3,604 (98.9%) >0.9999 Yes 0 (0.0%) 39 (1.1%)
Immunosuppression treatment
No 73 (98.6%) 3,592 (98.6%) 0.972 Yes 1 (1.4%) 51 (1.4%)
Other chronic disease
No 60 (81.1%) 2,900 (79.6%) 0.755 Yes 14 (18.9%) 743 (20.4%)
No. chronic diseases†
0 222 (75%) 9,459 (72.2%) 0.532 1–2 72 (24.3%) 3,515 (26.8%)
≥3 2 (0.7%) 128 (1%)
*BMI calculated only for adults (>18 y-old). †Participants could choose more than one chronic disease.
Page 26 of 38
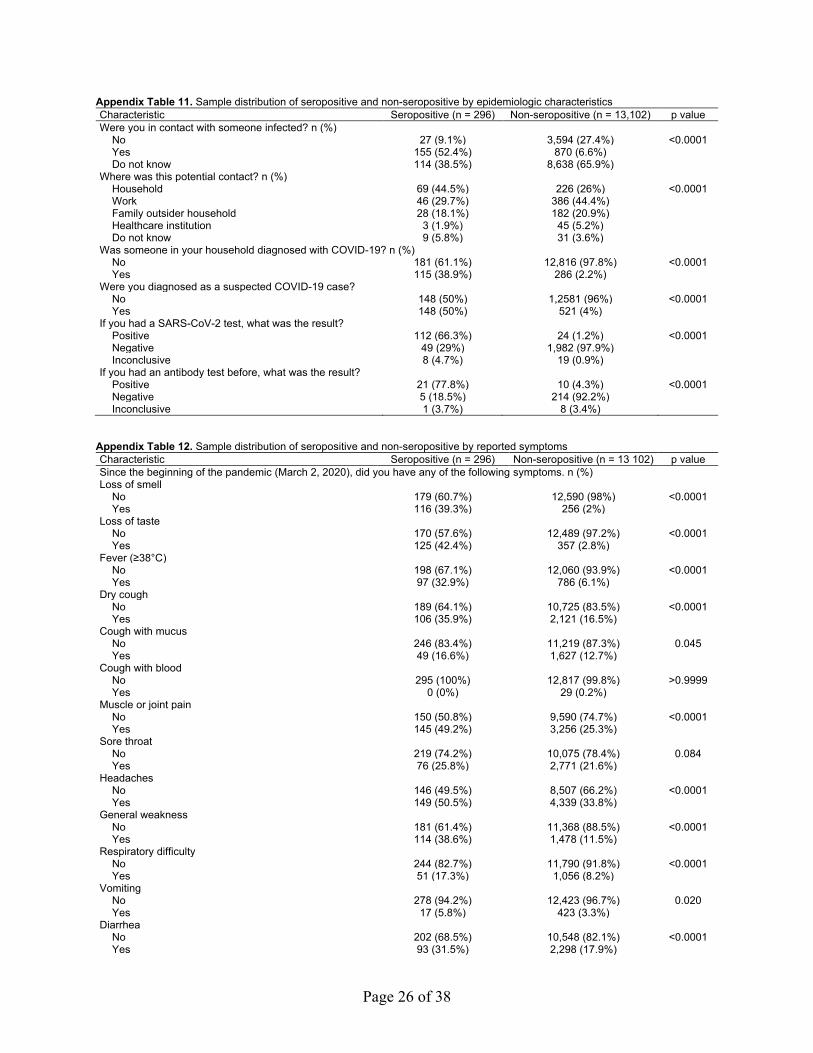
Appendix Table 11. Sample distribution of seropositive and non-seropositive by epidemiologic characteristics Characteristic Seropositive (n = 296) Non-seropositive (n = 13,102) p value Were you in contact with someone infected? n (%)
No 27 (9.1%) 3,594 (27.4%) <0.0001 Yes 155 (52.4%) 870 (6.6%)
Do not know 114 (38.5%) 8,638 (65.9%)
Where was this potential contact? n (%)
Household 69 (44.5%) 226 (26%) <0.0001 Work 46 (29.7%) 386 (44.4%)
Family outsider household 28 (18.1%) 182 (20.9%)
Healthcare institution 3 (1.9%) 45 (5.2%)
Do not know 9 (5.8%) 31 (3.6%)
Was someone in your household diagnosed with COVID-19? n (%)
No 181 (61.1%) 12,816 (97.8%) <0.0001 Yes 115 (38.9%) 286 (2.2%)
Were you diagnosed as a suspected COVID-19 case?
No 148 (50%) 1,2581 (96%) <0.0001 Yes 148 (50%) 521 (4%)
If you had a SARS-CoV-2 test, what was the result?
Positive 112 (66.3%) 24 (1.2%) <0.0001 Negative 49 (29%) 1,982 (97.9%)
Inconclusive 8 (4.7%) 19 (0.9%)
If you had an antibody test before, what was the result?
Positive 21 (77.8%) 10 (4.3%) <0.0001 Negative 5 (18.5%) 214 (92.2%)
Inconclusive 1 (3.7%) 8 (3.4%)
Appendix Table 12. Sample distribution of seropositive and non-seropositive by reported symptoms Characteristic Seropositive (n = 296) Non-seropositive (n = 13 102) p value Since the beginning of the pandemic (March 2, 2020), did you have any of the following symptoms. n (%) Loss of smell
No 179 (60.7%) 12,590 (98%) <0.0001 Yes 116 (39.3%) 256 (2%)
Loss of taste
No 170 (57.6%) 12,489 (97.2%) <0.0001 Yes 125 (42.4%) 357 (2.8%)
Fever (≥38°C)
No 198 (67.1%) 12,060 (93.9%) <0.0001 Yes 97 (32.9%) 786 (6.1%)
Dry cough
No 189 (64.1%) 10,725 (83.5%) <0.0001 Yes 106 (35.9%) 2,121 (16.5%)
Cough with mucus
No 246 (83.4%) 11,219 (87.3%) 0.045 Yes 49 (16.6%) 1,627 (12.7%)
Cough with blood
No 295 (100%) 12,817 (99.8%) >0.9999 Yes 0 (0%) 29 (0.2%)
Muscle or joint pain
No 150 (50.8%) 9,590 (74.7%) <0.0001 Yes 145 (49.2%) 3,256 (25.3%)
Sore throat
No 219 (74.2%) 10,075 (78.4%) 0.084 Yes 76 (25.8%) 2,771 (21.6%)
Headaches
No 146 (49.5%) 8,507 (66.2%) <0.0001 Yes 149 (50.5%) 4,339 (33.8%)
General weakness
No 181 (61.4%) 11,368 (88.5%) <0.0001 Yes 114 (38.6%) 1,478 (11.5%)
Respiratory difficulty
No 244 (82.7%) 11,790 (91.8%) <0.0001 Yes 51 (17.3%) 1,056 (8.2%)
Vomiting
No 278 (94.2%) 12,423 (96.7%) 0.020 Yes 17 (5.8%) 423 (3.3%)
Diarrhea
No 202 (68.5%) 10,548 (82.1%) <0.0001 Yes 93 (31.5%) 2,298 (17.9%)
Page 27 of 38
Characteristic Seropositive (n = 296) Non-seropositive (n = 13 102) p value Nausea
No 264 (89.5%) 11,981 (93.3%) 0.011 Yes 31 (10.5%) 865 (6.7%)
Chills
No 224 (75.9%) 11,706 (91.1%) <0.0001 Yes 71 (24.1%) 1,140 (8.9%)
Lack of appetite
No 211 (71.5%) 11,978 (93.2%) <0.0001 Yes 84 (28.5%) 868 (6.8%)
Feeling tired
No 142 (48.1%) 9,303 (72.4%) <0.0001 Yes 153 (51.9%) 3,543 (27.6%)
Rashes
No 279 (94.6%) 12,118 (94.3%) 0.858 Yes 16 (5.4%) 728 (5.7%)
Rhinorrhea
No 211 (71.5%) 10,238 (79.7%) 0.001 Yes 84 (28.5%) 2,608 (20.3%)
Loss of consciousness
No 293 (99.3%) 12,783 (99.5%) 0.821 Yes 2 (0.7%) 63 (0.5%)
Total number of symptoms since March 2, 2020 0 48 (16.2%) 6,516 (49.7%) <0.0001 1–2 35 (11.8%) 1,780 (13.6%)
≥3 213 (72%) 4,806 (36.7%)
Asymptomatic No 248 (83.8%) 6,586 (50.3%) <0.0001 Yes 48 (16.2%) 6,516 (49.7%)
Pauci-symptomatic No 241 (81.4%) 5,751 (43.9%) <0.0001 Yes 55 (18.6%) 7,351 (56.1%)
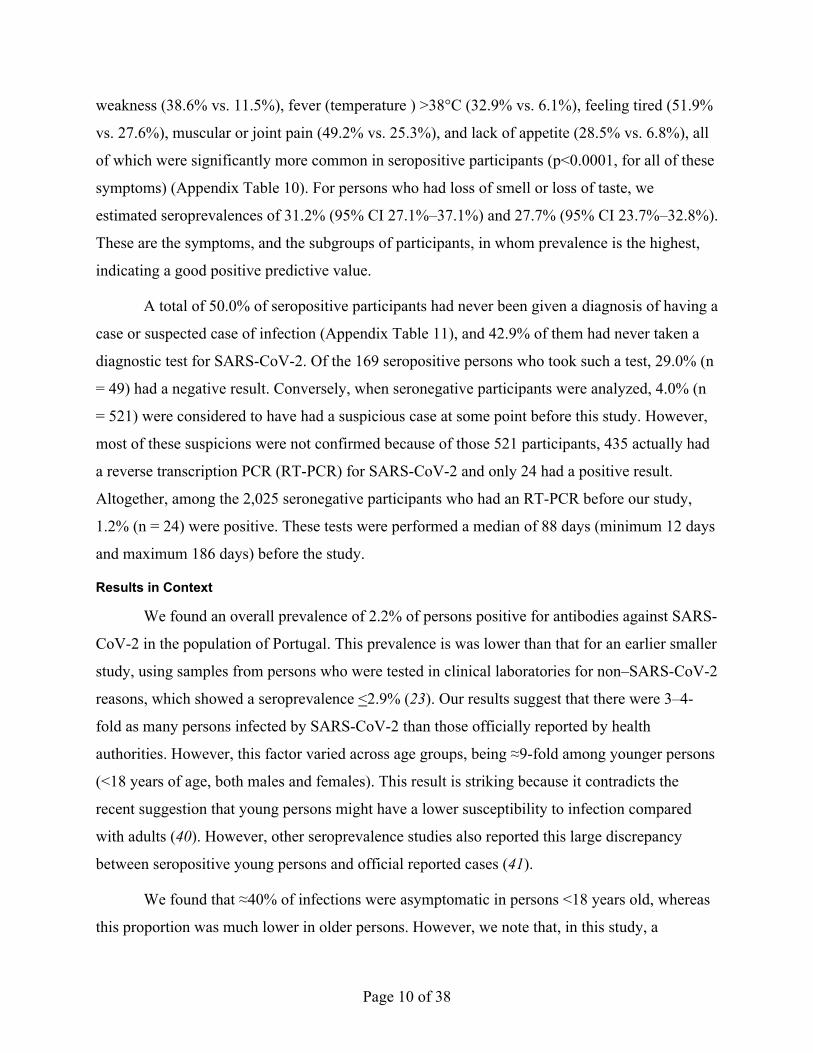
Appendix Figure 1. Cases of and deaths per million persons from coronavirus disease for selected
countries in Europe. Numbers of cumulative cases (top) and deaths (bottom) per million persons for
countries approximately the same size as Portugal (i.e., ≈10 million inhabitants) in Europe (Belgium,
Czechia, Netherlands, and Sweden) and 3 neighboring countries (Spain, the only country that shares a
land border with Portugal, France, and Italy). Portugal had a similar number of cases, but a relatively low
number of deaths during the first 6 months of the pandemic. Data were obtained from
https://ourworldindata.org/coronavirus.
Page 28 of 38
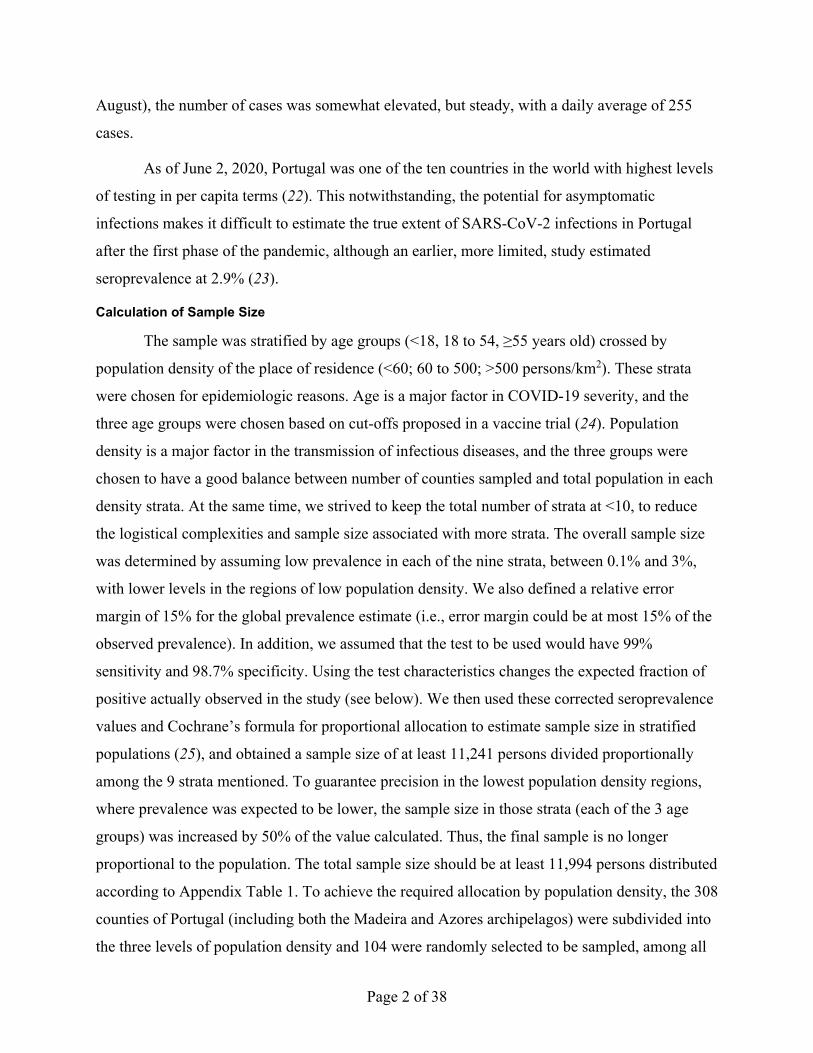
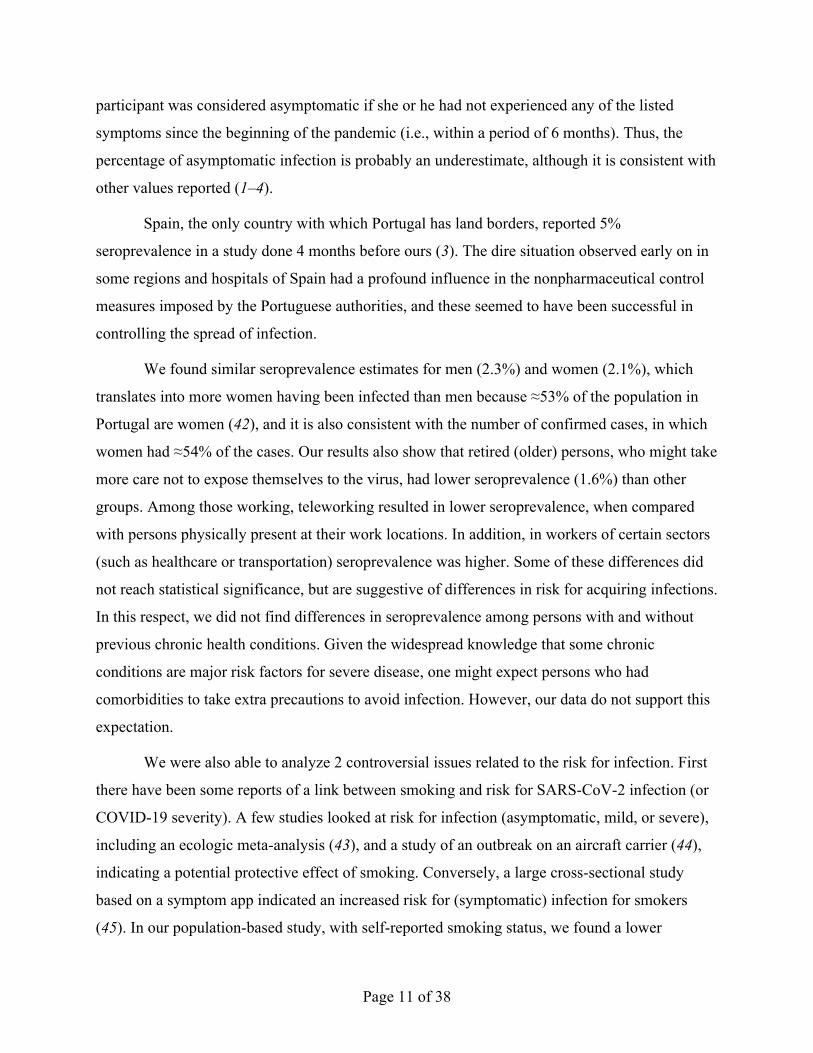
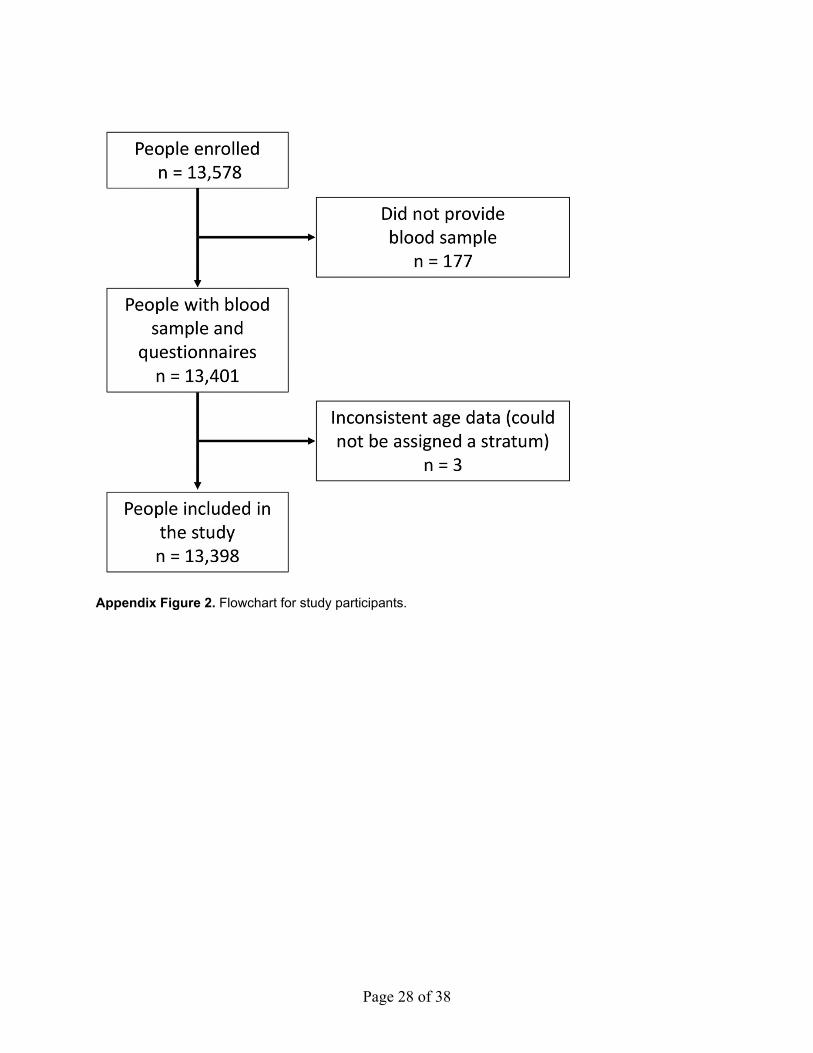
Appendix Figure 2. Flowchart for study participants.
Page 29 of 38
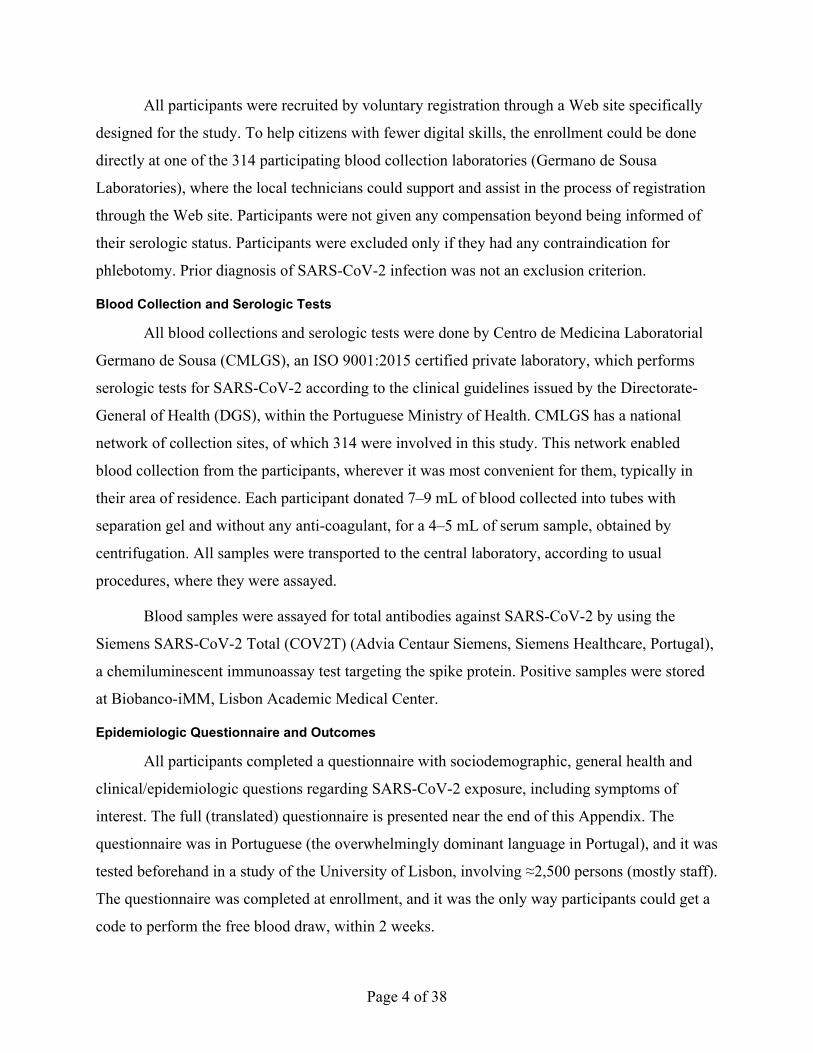
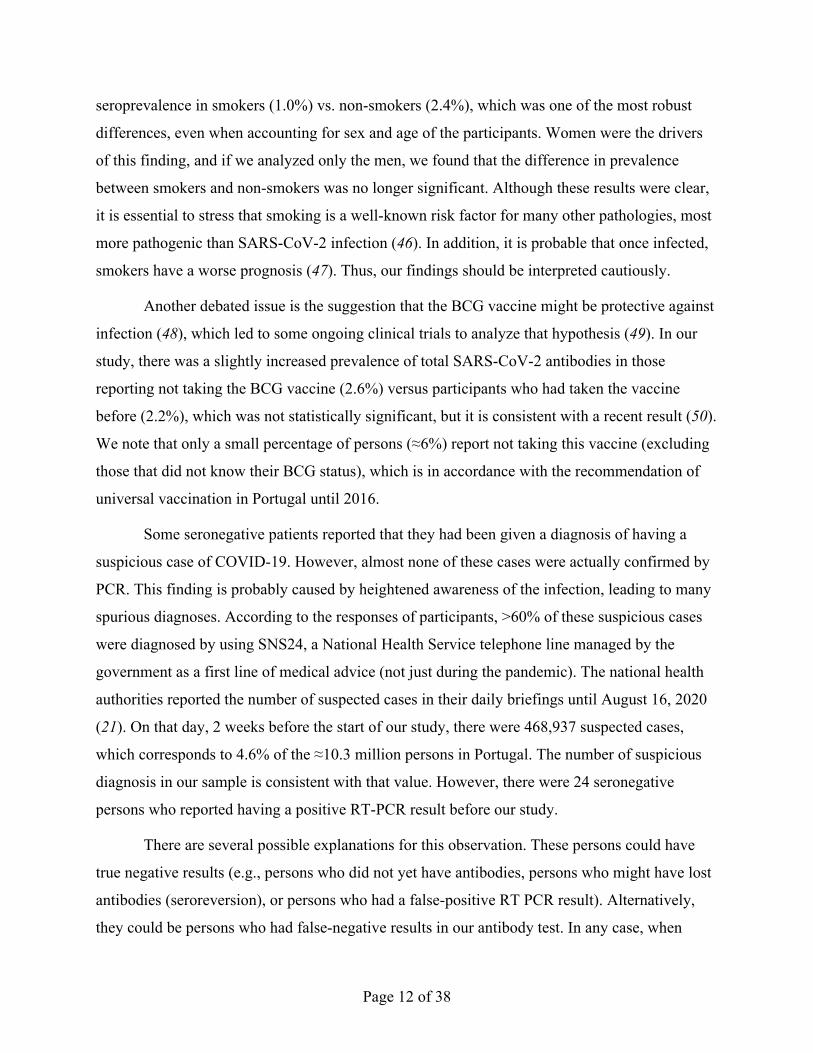
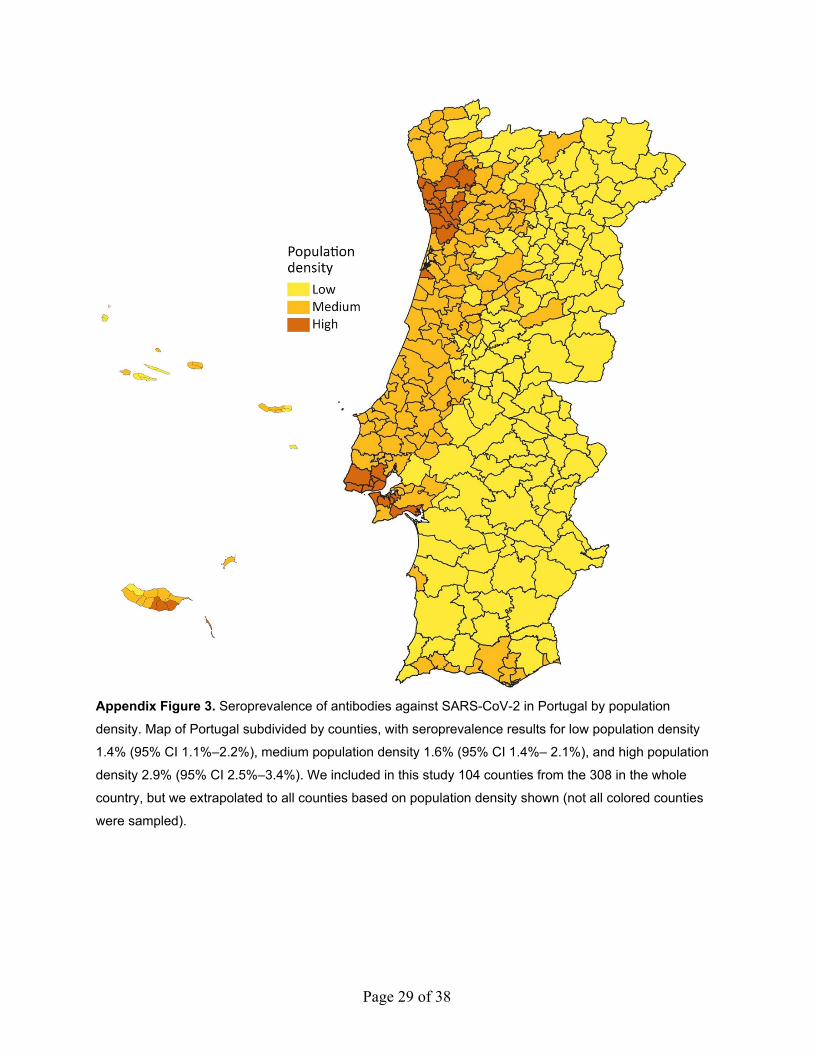
Appendix Figure 3. Seroprevalence of antibodies against SARS-CoV-2 in Portugal by population
density. Map of Portugal subdivided by counties, with seroprevalence results for low population density
1.4% (95% CI 1.1%‒2.2%), medium population density 1.6% (95% CI 1.4%‒ 2.1%), and high population
density 2.9% (95% CI 2.5%‒3.4%). We included in this study 104 counties from the 308 in the whole
country, but we extrapolated to all counties based on population density shown (not all colored counties
were sampled).

Page 30 of 38
Questionnaire
The participants answered the following questionnaire (the original version is in
Portuguese). Most questions were single choice. unless it explicit says “Select all applicable”
Sociodemographic
1) Sex Male Female
2) Age years
3) Nationality Portuguese Other
4) Place of residence [Dropdown box with counties]
5) Weight Kg
6) Height . m
7) How many people live in your household (including you)? people
8) What is the highest level of schooling that you completed or obtained an equivalency
to?
(Use the last level that you completed. If you don’t know what is the best option. choose
“Other situation.”)
X Did not go to school
X Completed the 1st, 2nd, or 3rd year of school
X Completed the 4th or 5th year of school
X Completed the 6th, 7th, or 8th year of school
X Completed the 9th, 10th, or 11th year of school
X Completed high school (12th year. or other equivalent degree)
X Completed non-university post-high school degree (professional training)
X Completed an university degree (undergraduate. master. PhD)
X Other situation
9) What is your current professional situation? Active worker

Page 31 of 38
Volunteer worker
Unemployed
Student
Retired
Disability/Medical leave
Homemaker
Other
9.1.1) If active/volunteer worker. what sector?
Commerce Security
Industry Cleaning
Building Health
Administration and services Health without clinical intervention
Transportation Carer of dependent people
Militarized forces Academics/Education
Other
9.1.2) If active/volunteer worker. what is your current working arrangements? Select all
applicable.
Teleworking
Physically at work. no contact with colleagues
Physically at work. with contact with colleagues
Physically at work. with contact with the public
Health priors
10) Smoking habits Non-smoker
Ex-smoker
Page 32 of 38
Smoker: <20 cigarettes/day
≥20 cigarettes/day
11) Do you exercise regularly (3 times/week for at least 30 min.)? Yes No
12) In the last year. did you take the flu vaccine? Yes No
13) Did you ever get the BCG vaccine (for tuberculosis)? Yes No Don’t know
14) Do you have a chronic disease? Yes No
15) Do you have any of the following chronic diseases? Select all applicable.
Diabetes mellitus
Renal insufficiency with hemodialysis
Chronic obstructive pulmonary disease (COPD)
Asthma
Arterial hypertension
Oncological disease
Cardiovascular disease
Autoimmune disease
Hepatic disease
Illness with immunosuppression treatment
None of the above
Factors possibly associated with infection by SARS-CoV-2
16) Since the beginning of the pandemic (2 March 2020). did you have any of the
following symptoms? What was the severity (1 = mild to 5 = severe)? Select all applicable.
Sudden loss of smell
Severity 1 2 3 4 5

Page 33 of 38
Loss of taste
Severity 1 2 3 4 5
Fever (≥38°C)
Severity 1 2 3 4 5
Dry cough
Severity 1 2 3 4 5
Cough with mucus
Severity 1 2 3 4 5
Cough with blood
Severity 1 2 3 4 5
Muscle or joint pain
Severity 1 2 3 4 5
Sore throat
Severity 1 2 3 4 5
Headache
Severity 1 2 3 4 5
General weakness
Severity 1 2 3 4 5
Respiratory difficulty
Severity 1 2 3 4 5
Vomit
Severity 1 2 3 4 5
Diarrhea
Severity 1 2 3 4 5
Page 34 of 38
Nausea
Severity 1 2 3 4 5
Chills
Severity 1 2 3 4 5
Lack of appetite
Severity 1 2 3 4 5
Tiredness
Severity 1 2 3 4 5
Rashes
Severity 1 2 3 4 5
Runny nose (rhinorrhea)
Severity 1 2 3 4 5
Loss of consciousness
Severity 1 2 3 4 5
16.1.1) When did the first symptoms start? / /
16.1.2.1) Do you still have the symptoms? Yes No
16.1.2.2) If not. when did the symptoms end? / /
16.2) Did you have any of the symptoms in the past 15 days? Yes No
16.2.1) If yes. which? [Dropdown box multiselect]
17) Did you have any contact with someone infected with SARS-CoV-2?
Yes No Don’t know
17.1) If yes. when was the probable date of contact with an infected person?
/ /
Page 35 of 38
17.2) Where was the probable contact with an infected person?
Home
Work
Family outsider the household
Health institution
Don’t know
18) Was anyone in your household diagnosed with COVID-19? Yes No
18.1) If yes. what was the date of the diagnosis? / /
19) Were you at any moment diagnosed with COVID-19? Yes No
19.1) If yes. what was the date of the diagnosis? / /
19.2) Who diagnosed you?
SNS24
Private hospital
Public hospital
Private doctor
20) Before this study did you take a COVID-19 test? Yes No
20.1) If yes. what type of test?
Nose swab
Blood draw
Finger prick
Other
Don’t know
20.2) When did you take the test? / /
Page 36 of 38
20.3) Where did you take the test?
Private hospital
Public hospital
Private laboratory
At home
20.4) What was the result of the test?
Positive
Negative
Inconclusive
21) Were you hospitalized due to COVID-19? Yes No
21.1) Date of hospitalization / /
21.2) Date of discharge / /
22) Are you cured? Yes No Don’t know
22.1) Who said you were cured?
SNS24
Private hospital
Public hospital
Private doctor
22.2) Did you take a test to confirm cure? Yes No
22.3) Date when you were considered cured / /
23) Before this study did you take an immunity test for COVID-19? Yes No
23.1) When did you take the test? / /
Page 37 of 38
23.2) Where did you take the test?
Home
Clinic
Hospital
Pharmacy
Private laboratory
23.3) What was the result of the test?
Positive
Negative
Inconclusive
Submit
Correcting the Asymptomatic and Pauci-Symptomatic Prevalence Estimates with Test Sensitivity and Specificity
The proportion of asymptomatic observed in our weighted sample was adjusted taking
into consideration the sensitivity and specificity of the test, using the following formula
(1 )1
m p Sadj
m P
AP S AA
P S− −
=+ − .
where A is the observed weighted proportion of asymptomatic in the seropositive
participants Pm is the measured seroprevalence, AS is the observed proportion of asymptomatic in
the full sample, Sp is the test specificity, and Aadj is the final adjusted proportion of
asymptomatic.
Derivation of the Formula Based on Conditional Probabilities and Bayes’ Law
Consider these events/statements
Ab, having antibodies
T+, having a positive antibody test, and the corresponding probability Pm = P[T+]
T-, ≈T+ (having a negative antibody test)
Page 38 of 38
Asym, being asymptomatic, and the corresponding probability As = P[Asym]
And consider the following notations for the conditional probabilities:
S = P[T+| Ab], probability of positive test result and having antibodies.
Sp = P[T-|~Ab ], probability of negative test result and not having antibodies.
A = P[Asym | T+], probability of being asymptomatic and having a positive test result
Aadj = P[Asym | Ab], probability of being asymptomatic and having antibodies.
Taking into account that
P[T+| Asym] = P[Ab | Asym]×S + (1- P[Ab |Asym])×(1-Sp)
We first obtain (1)
P[Ab | Asym] =P[T+| Asym] + Sp − 1
S + Sp − 1
Now. our quantity of interest can be calculated as (2)
P[Asym | Ab] =P[Ab| Asym] × P[Asym]
P[Ab]
and we also have (3)
P[T+| Asym] =P[ Asym |T+] × P[T+]
P[Asym]
Thus, replacing (3) in (1), (1) in (2), and using the Rogan‒Gladen formula to calculate
P[Ab] via P[T+], S and Sp (shown in Methods above) we obtain the desired result.