Embed Size (px)
Citation preview

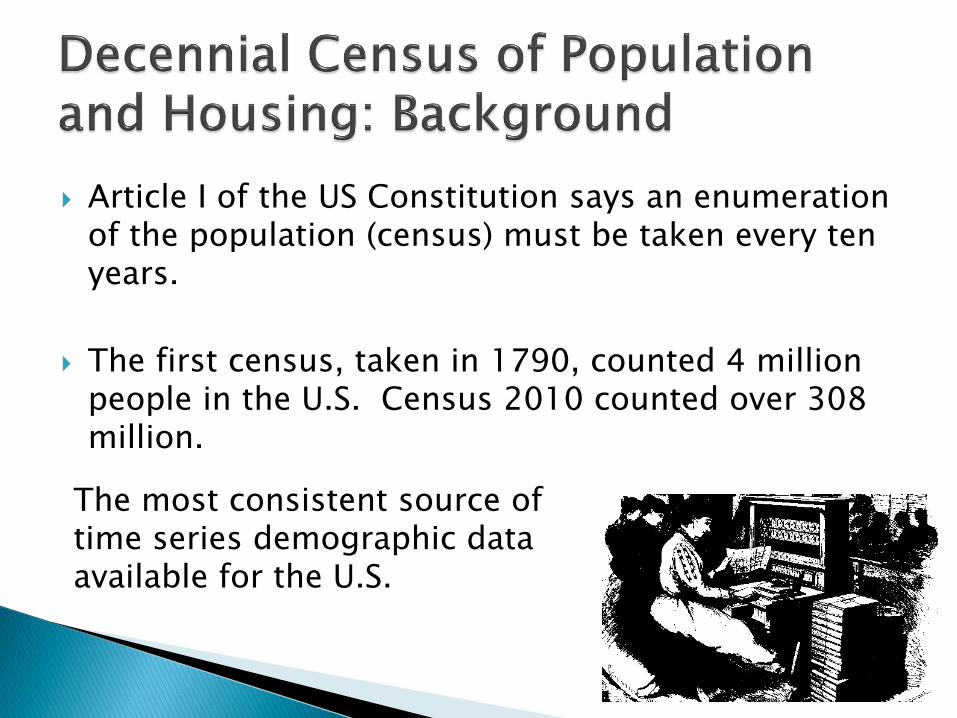
Article I of the US Constitution says an enumeration of the population (census) must be taken every ten years.
The first census, taken in 1790, counted 4 million people in the U.S. Census 2010 counted over 308 million.
The most consistent source of time series demographic data available for the U.S.
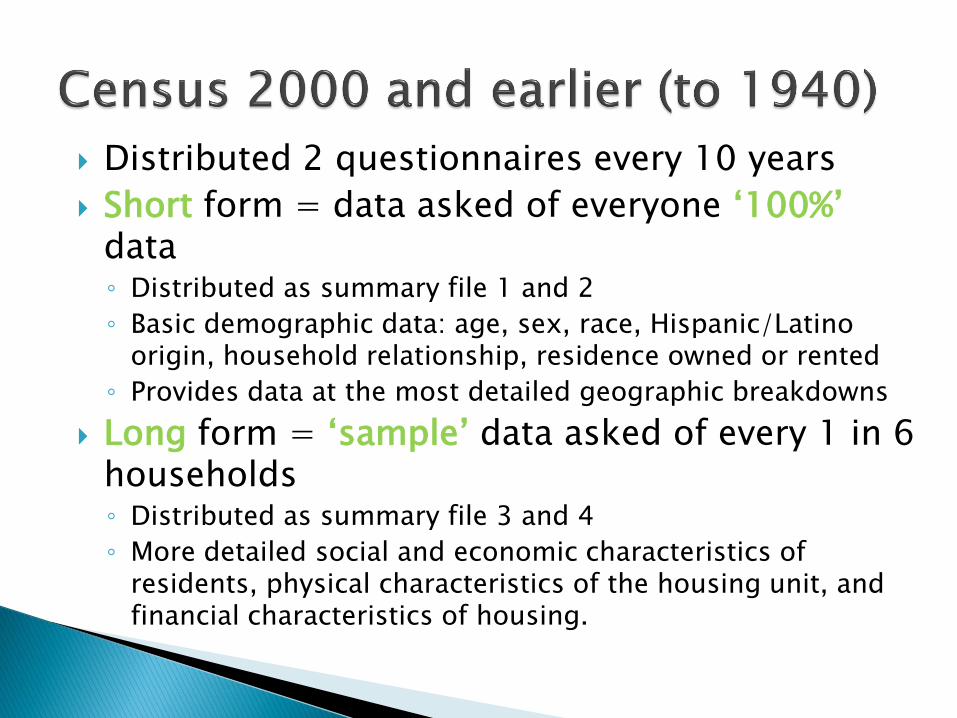
Distributed 2 questionnaires every 10 years
Short form = data asked of everyone „100%‟ data ◦ Distributed as summary file 1 and 2
◦ Basic demographic data: age, sex, race, Hispanic/Latino origin, household relationship, residence owned or rented
◦ Provides data at the most detailed geographic breakdowns
Long form = „sample‟ data asked of every 1 in 6 households ◦ Distributed as summary file 3 and 4
◦ More detailed social and economic characteristics of residents, physical characteristics of the housing unit, and financial characteristics of housing.
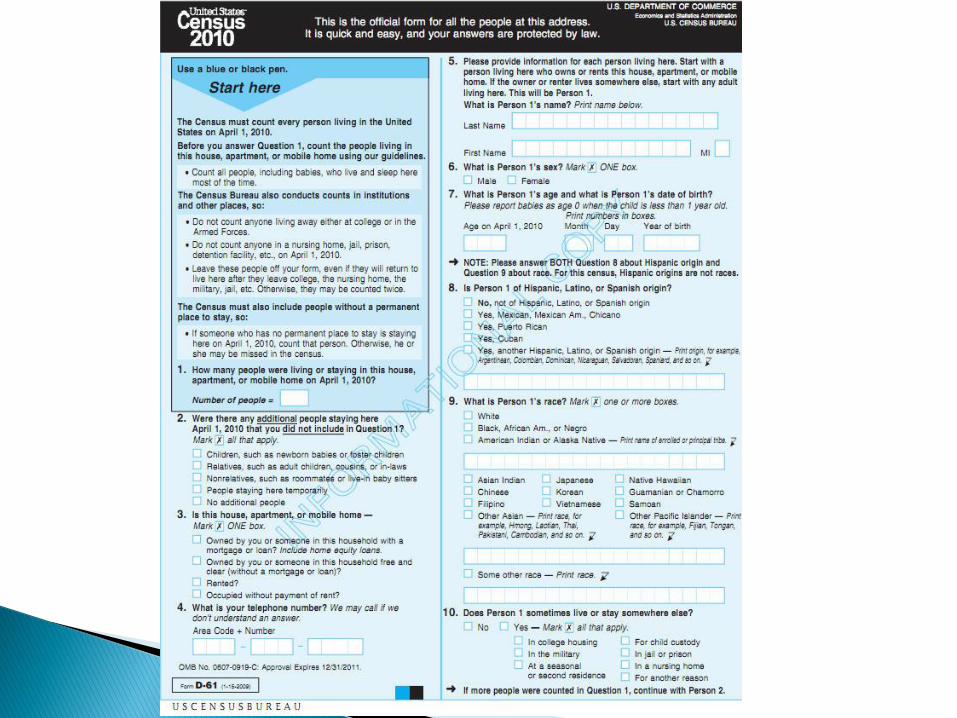
Now just the basic demographic questions are asked (i.e. the previous “short form”)
Sampling of the population on more detailed topics is now accomplished by the separate American Community Survey
Allows Decennial Census to focus on compiling an accurate count of the population
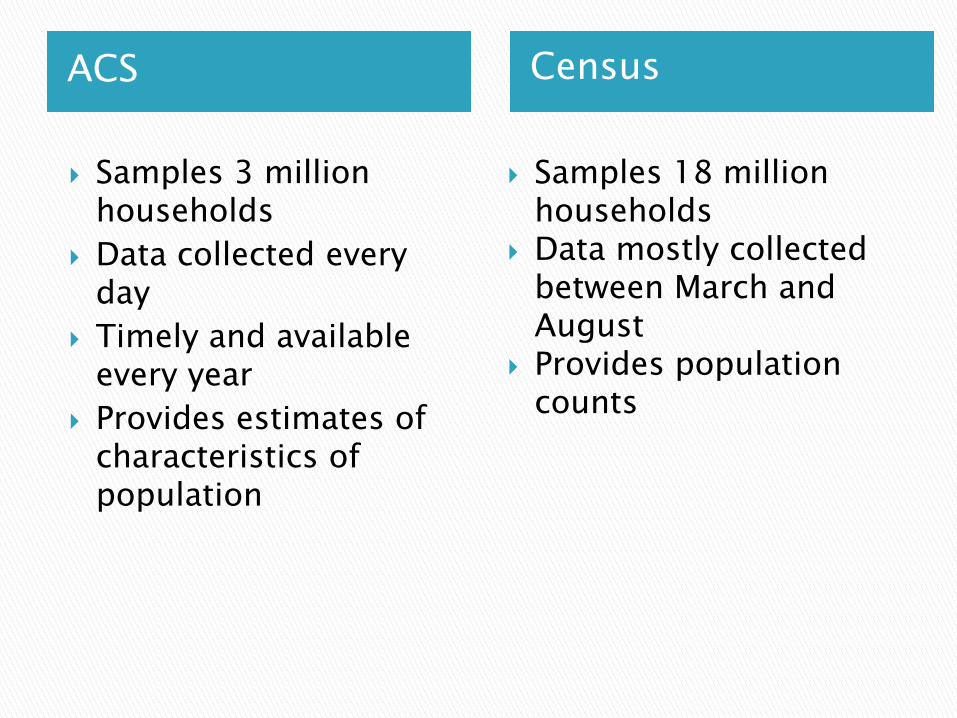
ACS
Census
Samples 3 million households
Data collected every day
Timely and available every year
Provides estimates of characteristics of population
Samples 18 million households
Data mostly collected between March and August
Provides population counts
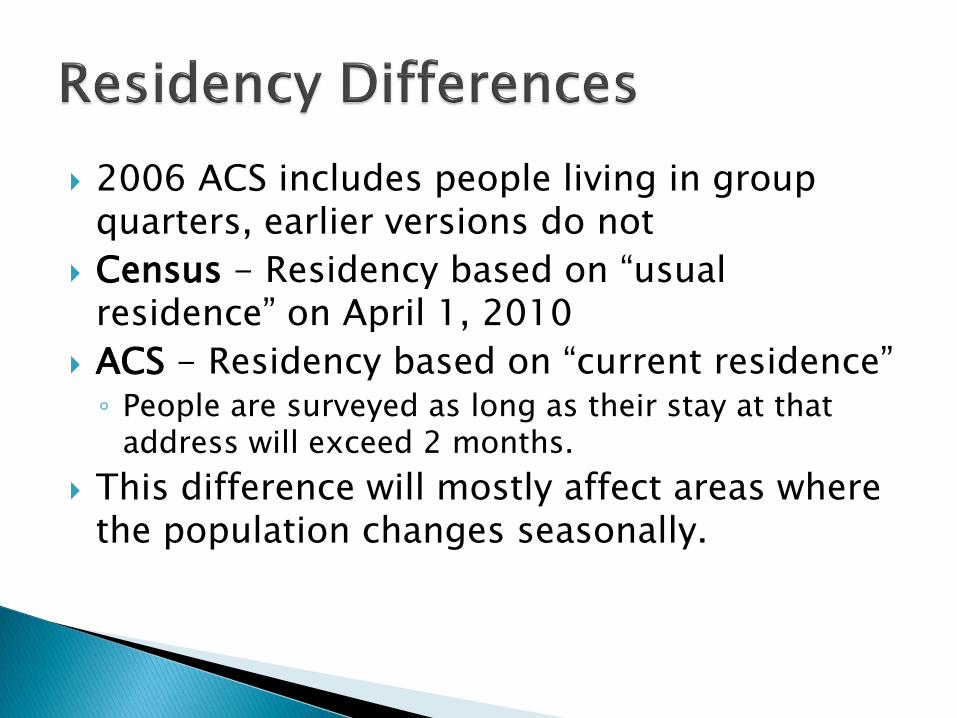
2006 ACS includes people living in group quarters, earlier versions do not
Census - Residency based on “usual residence” on April 1, 2010
ACS - Residency based on “current residence” ◦ People are surveyed as long as their stay at that
address will exceed 2 months.
This difference will mostly affect areas where the population changes seasonally.
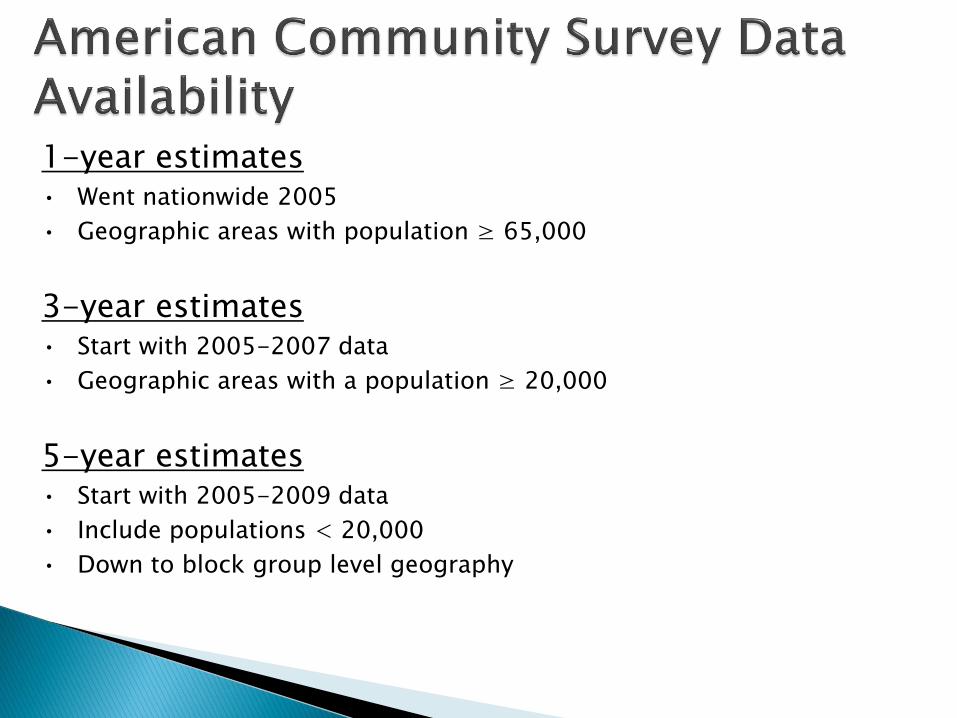
1-year estimates • Went nationwide 2005
• Geographic areas with population ≥ 65,000
3-year estimates • Start with 2005-2007 data
• Geographic areas with a population ≥ 20,000
5-year estimates • Start with 2005-2009 data
• Include populations < 20,000
• Down to block group level geography


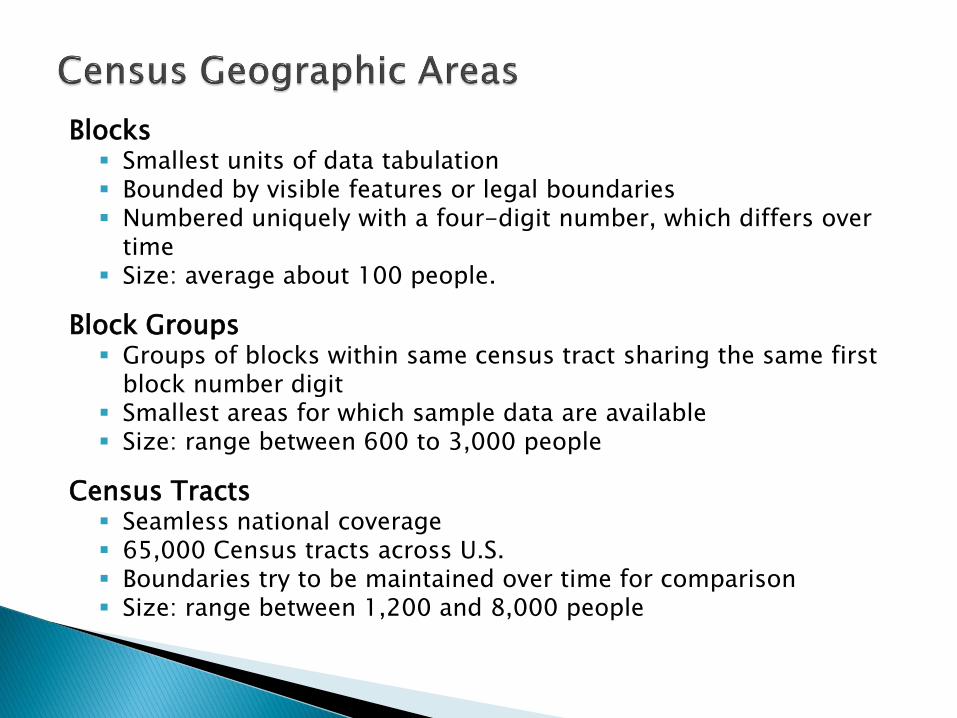
Blocks Smallest units of data tabulation Bounded by visible features or legal boundaries Numbered uniquely with a four-digit number, which differs over
time Size: average about 100 people.
Block Groups Groups of blocks within same census tract sharing the same first
block number digit Smallest areas for which sample data are available Size: range between 600 to 3,000 people
Census Tracts Seamless national coverage 65,000 Census tracts across U.S. Boundaries try to be maintained over time for comparison Size: range between 1,200 and 8,000 people
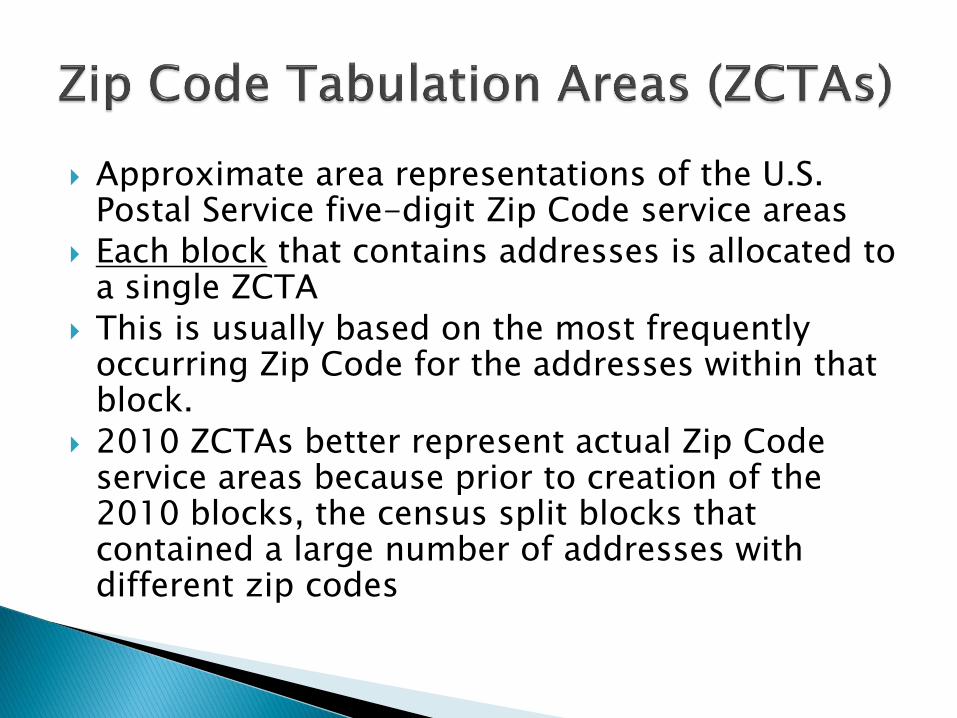
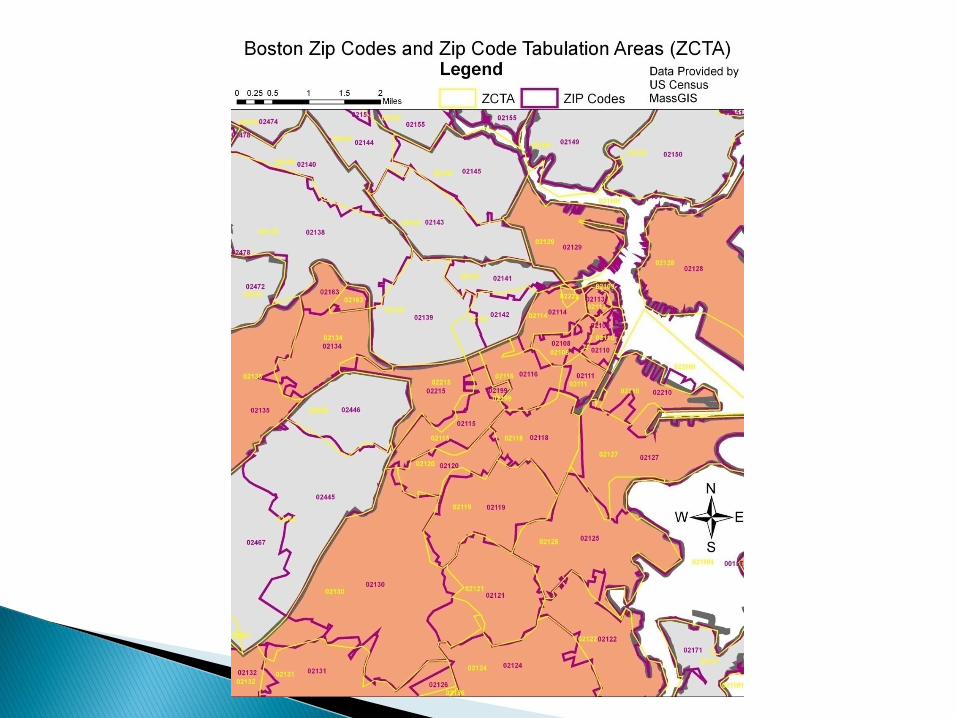
Approximate area representations of the U.S. Postal Service five-digit Zip Code service areas
Each block that contains addresses is allocated to a single ZCTA
This is usually based on the most frequently occurring Zip Code for the addresses within that block.
2010 ZCTAs better represent actual Zip Code service areas because prior to creation of the 2010 blocks, the census split blocks that contained a large number of addresses with different zip codes
Boundaries from January 1st of the last year of the ACS survey are used for reporting. Example: 2006-2009 ACS uses boundaries as of
January 1, 2009
The census does not update geographies for previously released estimates.
For more information see: http://www.census.gov/acs/www/guidance_for_data_users/geography/
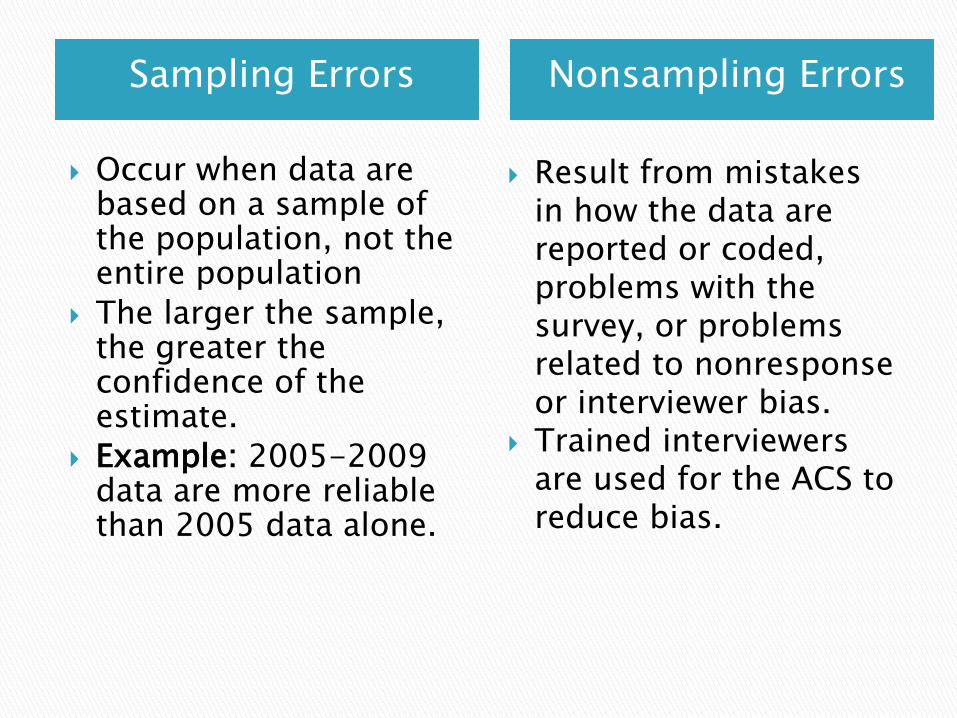
Sampling Errors
Nonsampling Errors
Occur when data are based on a sample of the population, not the entire population
The larger the sample, the greater the confidence of the estimate.
Example: 2005-2009 data are more reliable than 2005 data alone.
Result from mistakes in how the data are reported or coded, problems with the survey, or problems related to nonresponse or interviewer bias.
Trained interviewers are used for the ACS to reduce bias.
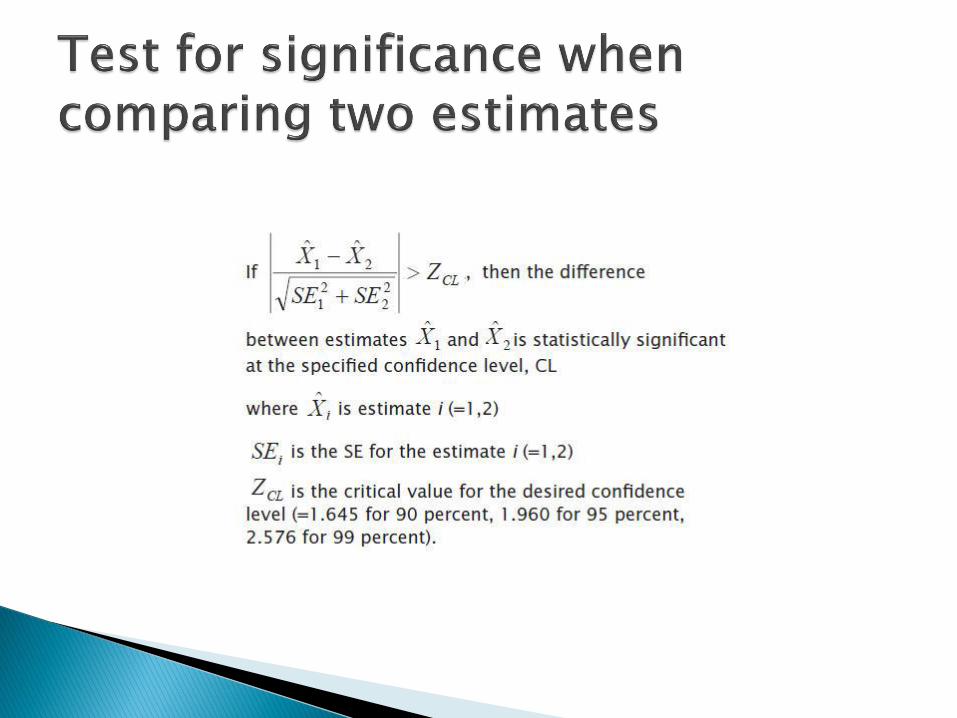
It provides a measure of how much the values provided by the ACS could vary from the actual population values.
This may impact conclusions you can make as part of your research.
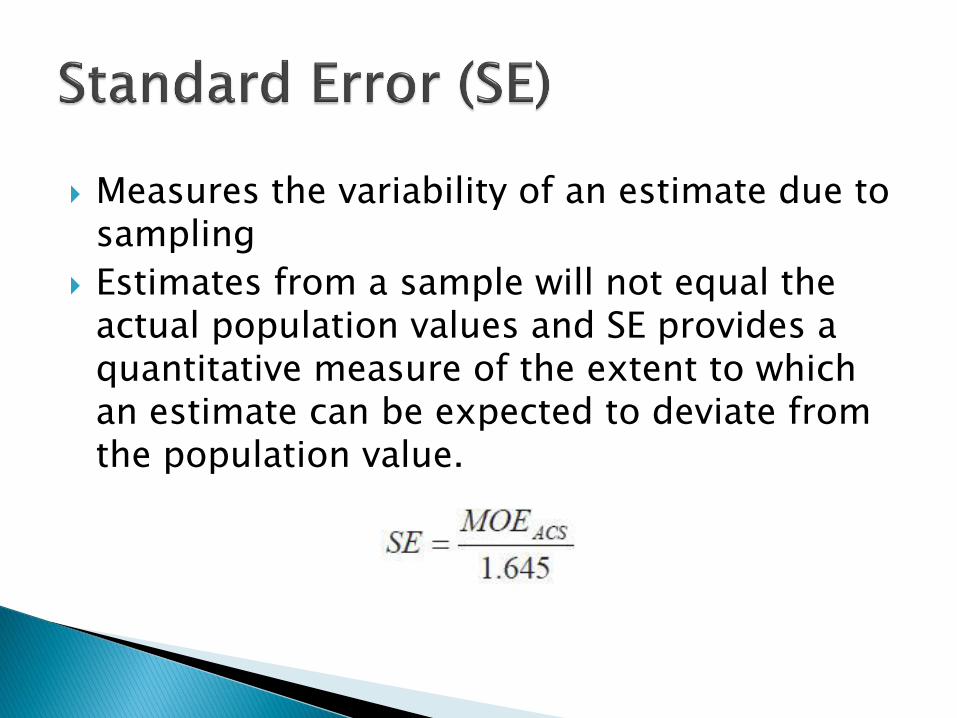
Measures the variability of an estimate due to sampling
Estimates from a sample will not equal the actual population values and SE provides a quantitative measure of the extent to which an estimate can be expected to deviate from the population value.
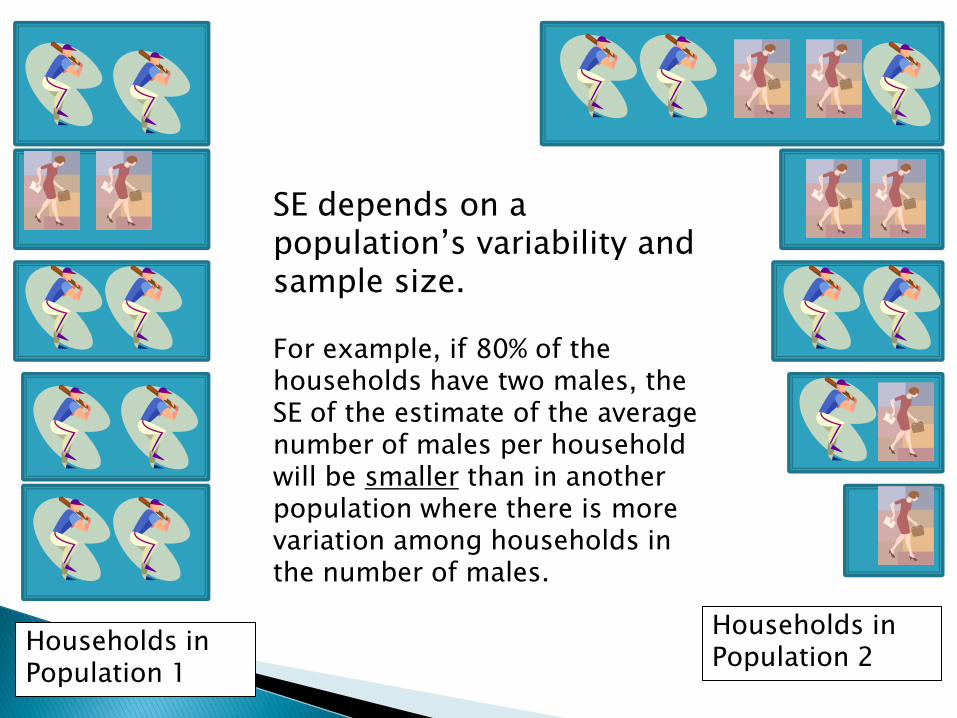
SE depends on a population‟s variability and sample size. For example, if 80% of the households have two males, the SE of the estimate of the average number of males per household will be smaller than in another population where there is more variation among households in the number of males.
Households in Population 1
Households in Population 2
The precision of the estimate at a given level of confidence.
Census standard confidence level is 90%. Users can calculate MOE for other confidence
levels. MOE is relative to the size of the estimate.
◦ Larger sample size usually means lower MOE
MOEs are provided in every ACS data table for each variable.
In general, the larger the MOE, the less reliable the estimate.
Range that is expected to contain the average value of the characteristic that would result over all possible samples with a known probability
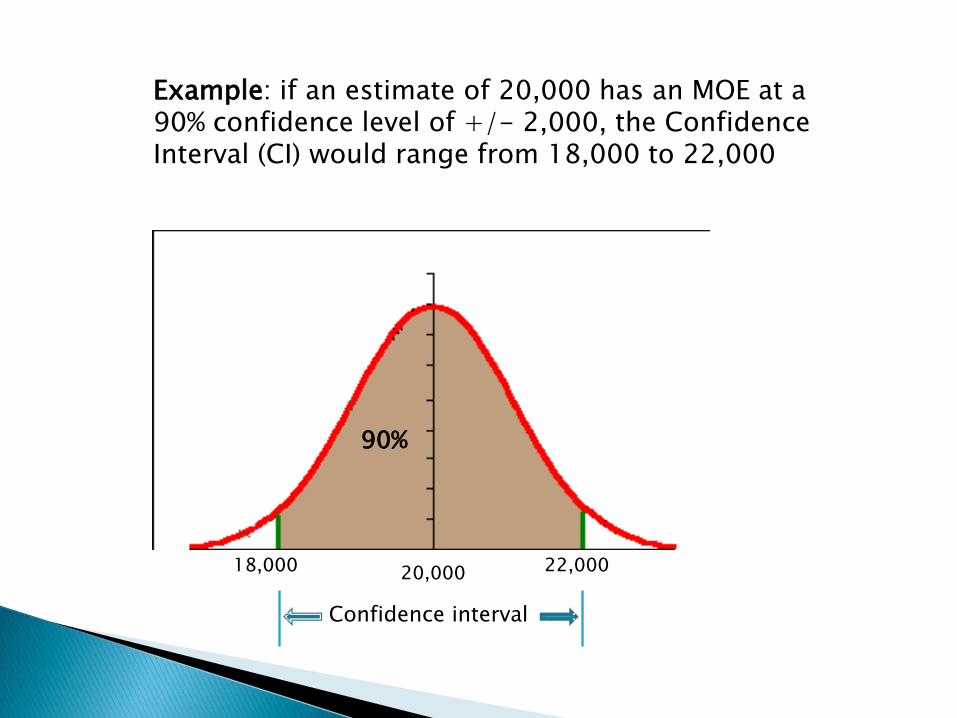
Confidence interval
90%
18,000 22,000
Example: if an estimate of 20,000 has an MOE at a 90% confidence level of +/- 2,000, the Confidence Interval (CI) would range from 18,000 to 22,000
20,000
Baltimore: Males who have never married = 52.1% +/- 1.7% (at 90% level)
CI = 50.4% to 53.8%
If we actually asked every single male in Baltimore if they had been married, there is a 90% chance that the actual mean value will fall between 50.4% and 53.8%
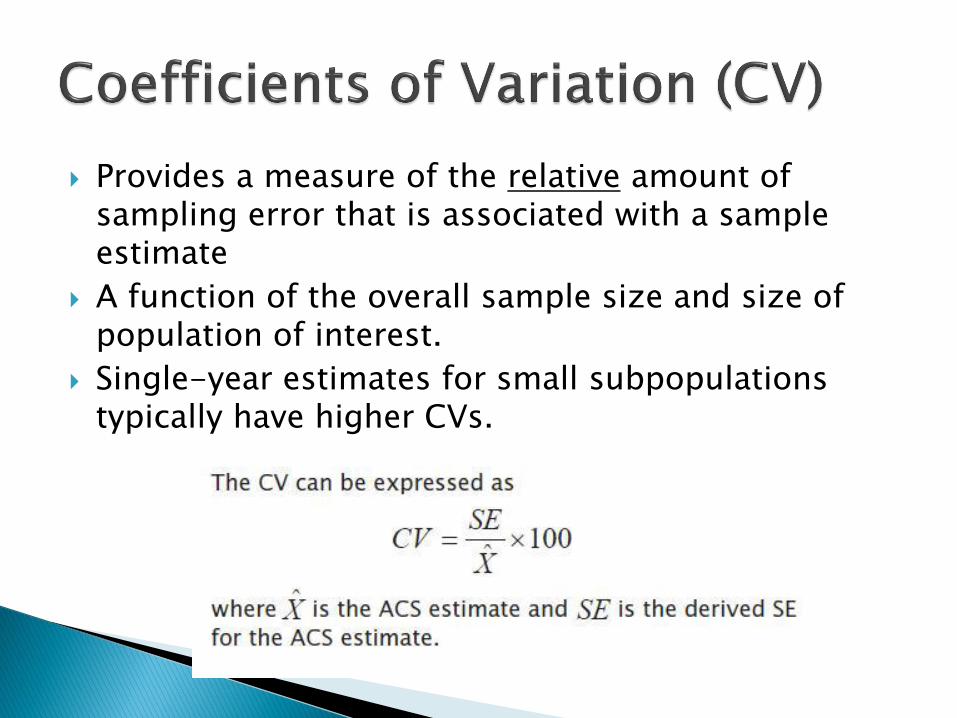
Provides a measure of the relative amount of sampling error that is associated with a sample estimate
A function of the overall sample size and size of population of interest.
Single-year estimates for small subpopulations typically have higher CVs.
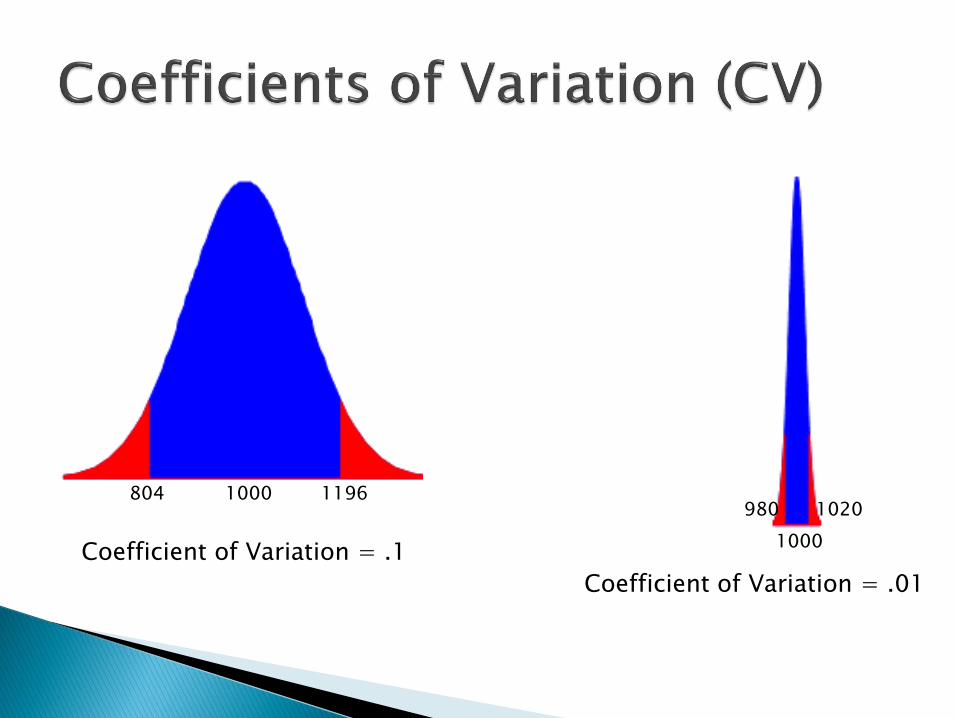
Coefficient of Variation = .1
Coefficient of Variation = .01
1000
1000
804 1196 980 1020
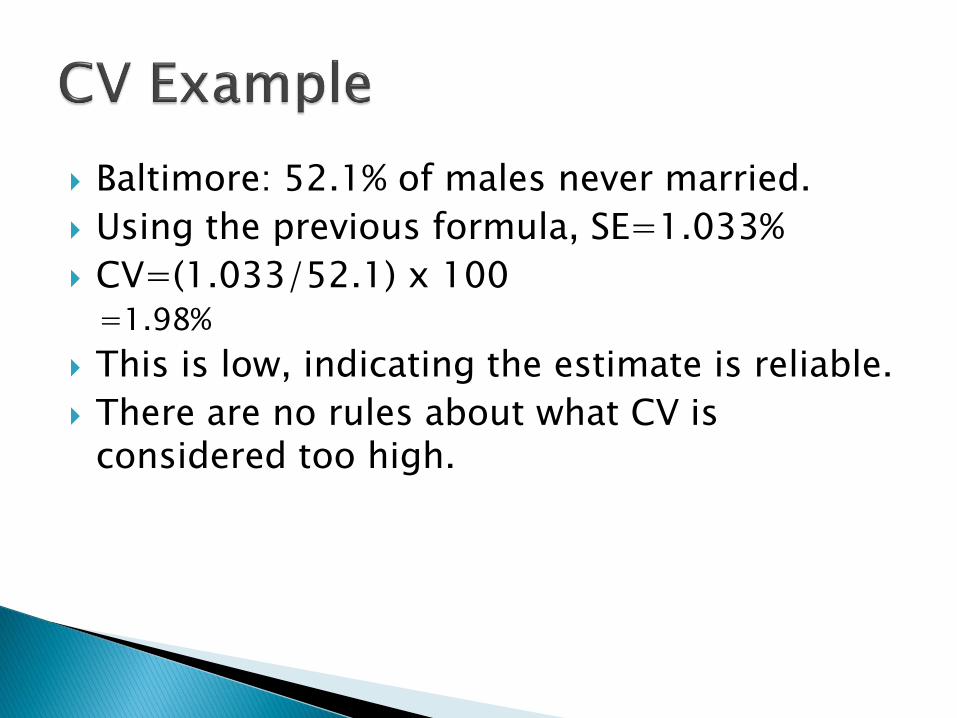
Baltimore: 52.1% of males never married.
Using the previous formula, SE=1.033%
CV=(1.033/52.1) x 100 =1.98%
This is low, indicating the estimate is reliable.
There are no rules about what CV is considered too high.
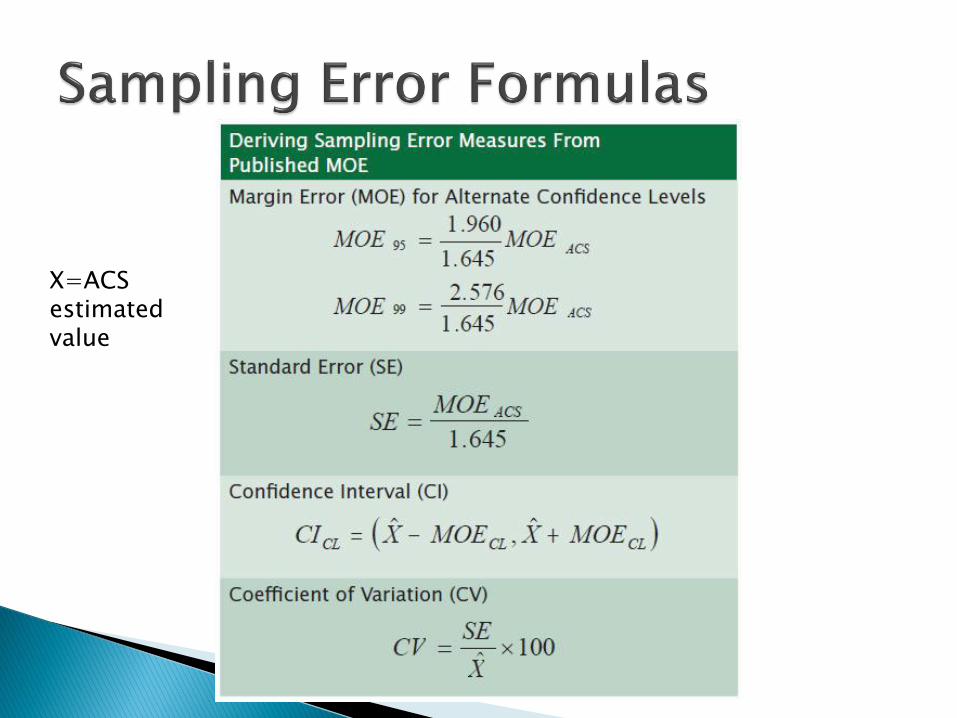
X=ACS estimated value

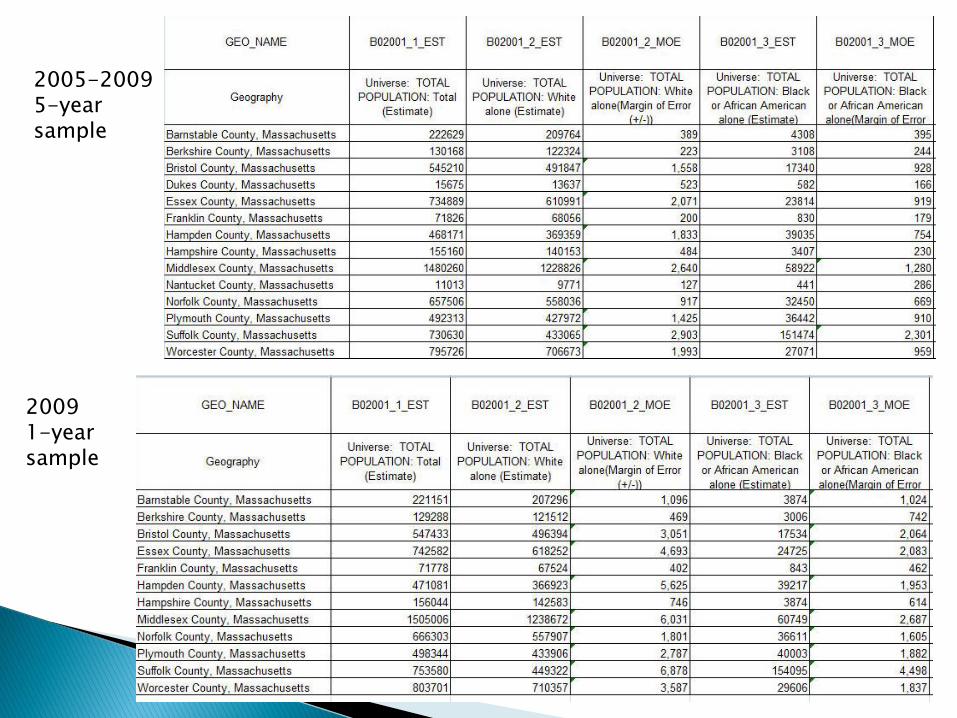
2005-2009 5-year sample
2009 1-year sample

Compare ACS estimates based on the same survey year(s) Example: compare 2005-2009 data for Nantucket and Boston
because only 5-year data are available for Nantucket. Do not compare 2009 Boston data to 2005-2009 Nantucket data.
Do not use estimates from overlapping years
Example: Compare 2005-2007 to 2008-2010, not 2005-2007 to 2006-2009
Alternatives: ◦ Show single year estimates for large counties and combine
remaining counties into a residual. Subtract the large counties from total data for the state to find the value of the residual.
◦ Use Public Use Microdata Sample (PUMS), which are samples of
raw data from selected areas
ACS estimates are similar to those obtained from past decennial census sample data for most areas and characteristics.
Many variables can be compared, but users should be aware of changes in the wording of questions.
For more information consult: http://www.census.gov/acs/www/guidance_for_data_users/comparing_data/
There is little to compare because the long form data is no longer part of 2010 decennial census.
Population data is likely to differ. The ACS population totals are based on estimates.
Tiger Files: http://www.census.gov/geo/www/tiger/wwtl/wwtl.html
Decennial Census (and ACS starting in Fall 2011):
http://factfinder2.census.gov
ACS (these data will be migrated to Factfinder2 during the fall
of 2011):
http://factfinder.census.gov
http://www.census.gov/acs/www/guidance_for_data_users/handbooks/