Embed Size (px)
Citation preview

Sustainability 2020, 12, 3028; doi:10.3390/su12073028 www.mdpi.com/journal/sustainability
Article
System Dynamics Analysis of the Relationship
between Transit Metropolis Construction and
Sustainable Development of Urban Transportation—
Case Study of Nanchang City, China
Yunqiang Xue 1,2,3,*, Lin Cheng 2, Kuang Wang 1, Jing An 1 and Hongzhi Guan 1,4
1 College of Transportation and Logistics, East China JiaoTong University, Nanchang 330013, China;
[email protected] (K.W.), [email protected] (J.A.), [email protected] (H.G.) 2 School of Transportation, Southeast University, Nanjing 210096, China; [email protected] 3 High-speed Rail and Regional Development Research Center of Jiangxi Province, Nanchang 330013, China 4 College of Architecture and Civil Engineering, Beijing University of Technology, Beijing 100124 China
* Correspondence: [email protected]; Tel.: +86-132-417-324-69
Received: 8 February 2020; Accepted: 8 April 2020; Published: 9 April 2020
Abstract: In order to systematically analyze the benefits of transit metropolis construction, the
system dynamics (SD) theory was used to construct the transit metropolis SD simulation model
from the four subsystems of economy, society, environment, and transportation supply and
demand. The validity of the SD model was verified by the social and economic data of Nanchang
City and the operational data of the bus company, and the quantitative simulation analysis was
carried out by taking the construction of the transit metropolis in Nanchang as an example. The
simulation results show that, in 2020, the number of motor vehicles in Nanchang will reach 1.13
million and the urban population will reach 5.71 million. It is necessary to build a transit metropolis
for the sustainable development of urban transportation. In order to complete the transit metropolis
creation goal of 60% of the public transit mobility sharing rate, the proportion of public transport
investment in the total transportation investment needs to be adjusted from 0.25 to 0.35. As a result,
Nanchang City will improve after the peak traffic congestion in 2022, indicating that the
construction of the transit metropolis will have a positive effect on Nanchang. By developing new
energy vehicles and low-emission vehicles, vehicle emissions will drop from 0.05 tons/year to 0.04
tons/year, and overall nitrogen oxide emissions will fall by 70%, which is significant for urban
environments. The research results provide theoretical support for the significance of transit
metropolis construction, and promote the sustainable development of urban transportation.
Keywords: transit metropolis; system dynamics; sustainable development; urban transportation;
modelling and simulation
1. Introduction
With the rapid development of China’s economy, society, and urbanization, the number of
motor vehicles has increased dramatically, bringing urban traffic problems such as traffic congestion,
traffic accidents and environmental pollution [1]. According to the data released by the Traffic
Management Bureau of the Ministry of Public Security of China, at the end of 2019 the number of
motor vehicles in the country reached 348 million, including 260 million cars and 207 million private
cars, with 435 million motor vehicle drivers, of which 397 million were motorists. The number of
owners and drivers will continue to increase. The National New Urbanization Plan (2014–2020)
proposes that China’s urbanization rate will further increase to 60% in 2020. With the further increase

Sustainability 2020, 12, 3028 2 of 25
of the urban population and the number of motor vehicles, urban transportation problems will
become more and more serious.
Compared with cars, public transportation has obvious advantages due to its per capita
occupation of road resources and per capita energy consumption [2]. Public transportation has
become an effective travel tool for urbanization and the sustainable development of urban
transportation [2–4], and it is common sense to address urban transportation issues by prioritizing
the development of public transportation [5,6]. The concept of public transport priority originated in
France in the 1960s and was subsequently improved in developed countries such as Great Britain, the
United States, and Japan [7–9]. China has advocated public transport priority since the 1980s.
Determining public transport priority as a national level development strategy is the subject of
Circular no. 64, issued by the State Council in 2012, titled “Guiding Opinions on Urban Priority
Development of Public Transport.” In order to cope with urban traffic problems and implement
Circular no. 64, the Ministry of Transport (MoT) launched the Transit Metropolis Program in 2012.
Up to now, a total of three batches of 87 cities have been selected as Transit Metropolis creation
demonstration projects. Fourteen cities, including Shanghai and Nanjing, have completed the
establishment of transit metropolises and officially become National Transit Metropolis
Demonstration Cities. The city applying for the Transit Metropolis Program needs to meet the
requirements of 20 assessment indicators (Table 1) and 10 reference indicators (Table 2) [10], and
propose specific quantitative and qualitative goals for its own city. A city formally wins the honorary
title of National Transit Metropolis Demonstration City only after at least five years of the creation
and successful completion of the creation goals proposed in the application. In addition, the city
applying for the Transit Metropolis Program can also propose no more than three characteristic
indicators based on its own characteristics. For example, due to its abundant underground spring
water, Jinan City lacks large-capacity subway lines; the BRT (Bus Rapid Transit) network forms the
backbone of the public transportation network. Therefore, Jinan takes the ratio of the length of the
BRT line network to the length of the entire public transportation line network as a characteristic
indicator of the creation of a transit metropolis. In fact, Curitiba, Brazil, is the hometown of BRT.
Many cities in the world, including most large and medium-sized cities in China, have planned and
built BRT under the guidance of the Brazilian experts from the World Bank. The BRT system also
plays an important role in the construction of a transit metropolis. Robert Cervero [11,12] detailed
the efficient BRT system in Curitiba, Brazil, in his book Transit Metropolis.
Table 1. Assessment indicators for the creation of a transit metropolis.
Serial
number Assessment indicator
Serial
number Assessment indicator
1 Motorized travel sharing rate of public
transport 11 Green bus vehicle ratio
2 Ratio of bus line network 12 Fatality rate of bus-involved traffic
accidents
3 500-m coverage at bus stations 13 Fatality rate of rail-involved traffic
accidents
4 Public transport vehicle ownership per
10,000 residents 14
Ratio of transit operation in urban–
rural passenger transport
5 Punctuality of public transport 15 Public transport operation subsidy
system and subsidy availability rate
6
Average speed of public buses and
trams in morning and evening peak
hours
16 Usage rate of public transport smart
card
7
Average crowded level of public
transport in morning and evening peak
hours
17 Inter-provincial public transport card
usage
8 Public transport passenger satisfaction 18 Construction and operation of
intelligent public transport system

Sustainability 2020, 12, 3028 3 of 25
9 Rate of entering parking lot of buses
and trams 19
Urban public transport planning and
implementation
10 Bus lane setting rate 20 Implementation of traffic impact
assessment for construction projects
Table 2. Reference indicators for the creation of a transit metropolis.
Serial
number Assessment indicator
Serial
number Assessment indicator
1 Public transport sharing rate
without walking 6 Average station area of buses and trams
2 Public transport trips per
capita per day 7 Bus bay setting rate
3 Density of bus network 8 Ratio of bus signal priority intersections
4 Average age of buses and
trams 9 Income level of public transport employees
5 Settlement rate of public
transport complaint events 10
Formulation of supporting policies for priority
development of public transportation
As an urban transportation strategy adopted in response to the rapid growth of cars and traffic
congestion, the transit metropolis will promote the priority of public transportation and sustainable
development of urban transportation in China to a new level. However, if the establishment of a
transit metropolis is completed, how much will it promote the sustainable development of urban
transportation? How to systematically evaluate the role of a transit metropolis in promoting
sustainable development of urban transportation? All the questions are worth exploring.
2. Literature Review
2.1. Research Status of the Transit Metropolis
The term transit metropolis was first proposed by Robert Cervero of the University of California,
Berkeley, a well-known transportation expert, in his book Transit Metropolis [11]. Transit metropolis
refers to an area where public transportation services and urban forms develop harmoniously. It
advocates urban public transportation to actively guide urban development and emphasizes the
coexistence of urban public transportation and the city [12]. The transit metropolis generally has a
high share of urban public transport, compact urban space layout, a diversified urban public
transport service network, a people-oriented public transport priority policy, and efficient integrated
urban transport management. Tokyo, Seoul, Singapore, and Hong Kong in Asia, and London, Paris,
Stockholm, and Copenhagen in Europe are the world’s eight major transit metropolises [11]. The
book Transit Metropolis provides a wealth of insights about transportation problems and practical
solutions and is becoming an important resource for planners and managers throughout the world
[13]. The Transit Metropolis Program proposed by the Ministry of Transport of China has established
a set of public transport city assessment index systems in line with national conditions [13]. Carrying
out the demonstration project of Transit Metropolis construction in China is a major measure to
implement the strategy of prioritizing public transportation development, regulate and guide traffic
demand, alleviate urban traffic congestion and pressure on resources and environment, and promote
the sound and rapid development of urban public transportation in the new era [10]. The impact of
the Transit Metropolis Program will be profound [10–15]. First, it is an important vehicle for
implementing the strategy of prioritizing the development of urban public transportation. The central
task of the construction of a transit metropolis is to fully mobilize enthusiasm in all aspects, provide
power and create experience for the comprehensive implementation of the priority development
strategy of public transportation, comprehensively improve the service quality and security
capabilities of public transportation, and fundamentally change the lagging development and passive
adaptation of urban public transportation. Secondly, it includes specific actions to protect and
improve people’s livelihoods. The important goal of the construction of a transit metropolis is to

Sustainability 2020, 12, 3028 4 of 25
protect the basic travel rights of the people. This is an important task for the transportation sector in
order to strengthen and innovate social management. Thirdly, it is an important way to change the
development mode of urban traffic and an effective way to manage urban traffic congestion. The
essence of Transit Metropolis construction is strategically guided by “public transportation-oriented
urban development.” Through scientific planning and system construction, a public transportation-
based urban transportation system is established to reverse the passive adaptation of urban public
transportation to urban development and realize positive interaction and coordinated development
of public transportation and the city. Fourthly, it is an effective way to alleviate urban traffic
congestion. Urban traffic congestion has become a prominent problem commonly faced by large and
medium-sized cities in China and a hot spot that widely concerns all sectors of society. The experience
of countries around the world shows that focusing on urban scientific planning and prioritizing the
development of public transportation are the most fundamental and effective ways to alleviate urban
traffic congestion. The core of the construction of a transit metropolis is to continuously improve the
attractiveness of the city’s public transportation system and reduce the residents’ dependence on cars
through the implementation of scientific planning and control, the optimization of networks, facilities
construction, information services, and comprehensive management. It would regulate the total
amount of urban traffic demand and travel structure, improve the efficiency of urban traffic
operation, and fundamentally alleviate urban traffic congestion.
Jiangping Zhou [10,14] reviewed and surveyed characteristics of the Chinese transit metropolis
and compared the contents of the transit metropolis proposed by Cervero and by the MoT,
respectively. The performance measures for a transit metropolis proposed by the Ministry of
Transport of China are more universal and quantitative than Cervero’s, the policies and perspectives
are still parochial [14]. More work is needed to better define, analyze, and implement a transit
metropolis in China. Tian Jiang [15] assessed the status of public transport in Chinese major cities
and analyzed the factors that affect the public transport development supporting the Transit
Metropolis Program. With the growth of GDP, the public transit share rate tends to go “up-down-
up” at different stages of the economy. Chen and Yang [14,16] argued that the definition of transit
metropolis given by Cervero is appropriate and qualitative; they added goals and objectives to
expand Cervero’s definition. Liu Lan [17] proposed that quantitative indicators such as level of
congestion, average vehicle speed, on-schedule rate, ratio of urban and rural public transit services
should be used to evaluate transit metropolises in different aspects. His indicators are similar to those
of the Ministry of Transport of China [14]. The MoT’s Transit Metropolis focuses on government
support, accessibility, safety, availability, level of services, technologies, and internal employee
retention of public transport [14], while Cervero focuses on how to realize the strong connection
between public transit and land use [12]. The former has more detailed, stringent, and universal
requirements; for instance, the motorized travel sharing rate of public transport should not be less
than 60%, and 500-m coverage at bus stops and subway stations should comprise at least 90% of built-
up areas. The MoT cares more about service levels, availability, accessibility and scope of coverage
of public transport; it ignores land use patterns, housing, and activities around the bus stop and
subway station or along transit corridors. Although there are differences in transit metropolis and
measurement indicators at home and abroad, there is a consensus that a transit metropolis should
embody a structure of urban layout that uses urban public transportation as the main body of
motorized travel and guides urban development with urban public transportation. Constrained by
safety, resources, environment, and other conditions, the best form of urban construction is an urban
development model with the best overall efficiency and social and environmental benefits. The transit
metropolis advocates urban public transportation to actively guide urban development, emphasizing
that urban public transportation and urban human settlements, structural functions, the
environment, and spatial layout should coexist harmoniously. The transit metropolis is a leap in
understanding the theory and practice to solve urban and transportation problems.
The construction of the transit metropolis has been a great opportunity for public transport
development in recent years. The application cities will further expand the scale based on the current
87 cities. With the rapid development of transit metropolises, fruitful research results have been
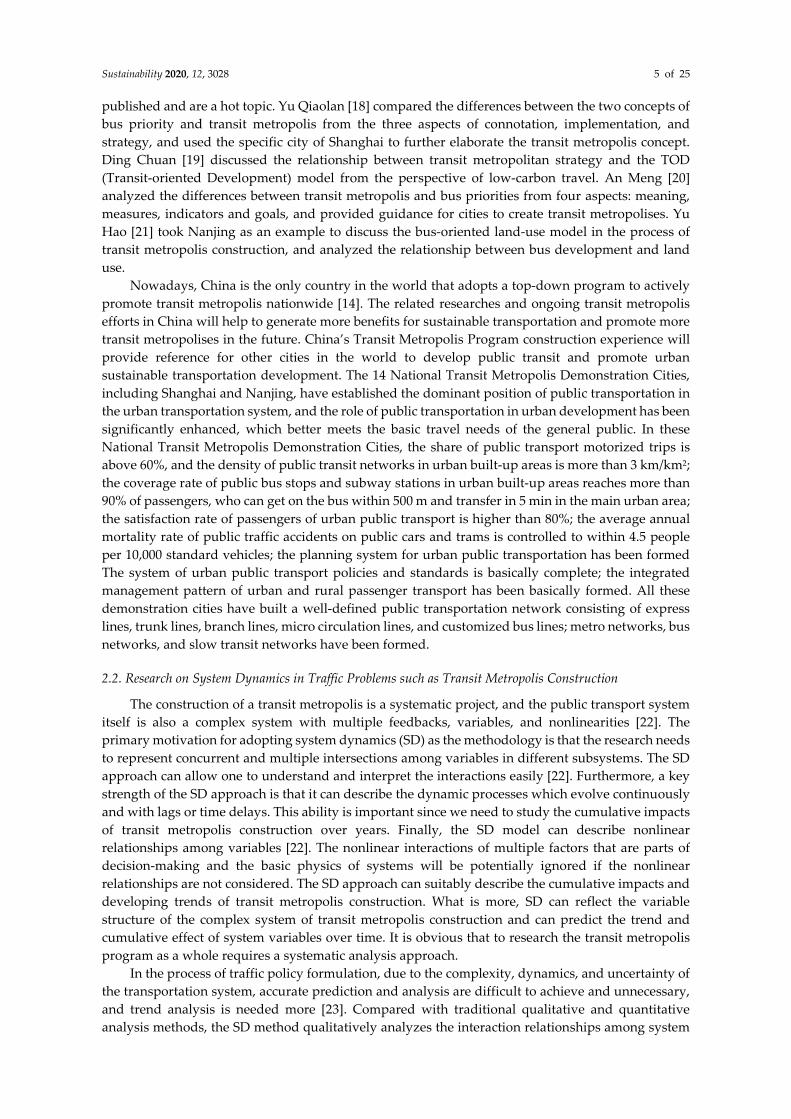
Sustainability 2020, 12, 3028 5 of 25
published and are a hot topic. Yu Qiaolan [18] compared the differences between the two concepts of
bus priority and transit metropolis from the three aspects of connotation, implementation, and
strategy, and used the specific city of Shanghai to further elaborate the transit metropolis concept.
Ding Chuan [19] discussed the relationship between transit metropolitan strategy and the TOD
(Transit-oriented Development) model from the perspective of low-carbon travel. An Meng [20]
analyzed the differences between transit metropolis and bus priorities from four aspects: meaning,
measures, indicators and goals, and provided guidance for cities to create transit metropolises. Yu
Hao [21] took Nanjing as an example to discuss the bus-oriented land-use model in the process of
transit metropolis construction, and analyzed the relationship between bus development and land
use.
Nowadays, China is the only country in the world that adopts a top-down program to actively
promote transit metropolis nationwide [14]. The related researches and ongoing transit metropolis
efforts in China will help to generate more benefits for sustainable transportation and promote more
transit metropolises in the future. China’s Transit Metropolis Program construction experience will
provide reference for other cities in the world to develop public transit and promote urban
sustainable transportation development. The 14 National Transit Metropolis Demonstration Cities,
including Shanghai and Nanjing, have established the dominant position of public transportation in
the urban transportation system, and the role of public transportation in urban development has been
significantly enhanced, which better meets the basic travel needs of the general public. In these
National Transit Metropolis Demonstration Cities, the share of public transport motorized trips is
above 60%, and the density of public transit networks in urban built-up areas is more than 3 km/km2;
the coverage rate of public bus stops and subway stations in urban built-up areas reaches more than
90% of passengers, who can get on the bus within 500 m and transfer in 5 min in the main urban area;
the satisfaction rate of passengers of urban public transport is higher than 80%; the average annual
mortality rate of public traffic accidents on public cars and trams is controlled to within 4.5 people
per 10,000 standard vehicles; the planning system for urban public transportation has been formed
The system of urban public transport policies and standards is basically complete; the integrated
management pattern of urban and rural passenger transport has been basically formed. All these
demonstration cities have built a well-defined public transportation network consisting of express
lines, trunk lines, branch lines, micro circulation lines, and customized bus lines; metro networks, bus
networks, and slow transit networks have been formed.
2.2. Research on System Dynamics in Traffic Problems such as Transit Metropolis Construction
The construction of a transit metropolis is a systematic project, and the public transport system
itself is also a complex system with multiple feedbacks, variables, and nonlinearities [22]. The
primary motivation for adopting system dynamics (SD) as the methodology is that the research needs
to represent concurrent and multiple intersections among variables in different subsystems. The SD
approach can allow one to understand and interpret the interactions easily [22]. Furthermore, a key
strength of the SD approach is that it can describe the dynamic processes which evolve continuously
and with lags or time delays. This ability is important since we need to study the cumulative impacts
of transit metropolis construction over years. Finally, the SD model can describe nonlinear
relationships among variables [22]. The nonlinear interactions of multiple factors that are parts of
decision-making and the basic physics of systems will be potentially ignored if the nonlinear
relationships are not considered. The SD approach can suitably describe the cumulative impacts and
developing trends of transit metropolis construction. What is more, SD can reflect the variable
structure of the complex system of transit metropolis construction and can predict the trend and
cumulative effect of system variables over time. It is obvious that to research the transit metropolis
program as a whole requires a systematic analysis approach.
In the process of traffic policy formulation, due to the complexity, dynamics, and uncertainty of
the transportation system, accurate prediction and analysis are difficult to achieve and unnecessary,
and trend analysis is needed more [23]. Compared with traditional qualitative and quantitative
analysis methods, the SD method qualitatively analyzes the interaction relationships among system

Sustainability 2020, 12, 3028 6 of 25
elements and also quantifies these relationships through the construction of dynamic differential
equations, and it uses computer simulation technology to achieve the dynamics of the relationships
among transportation elements. Simulation is helpful to reflect the effect of policy implementation.
It is obvious the SD method is one of the best methods to analyze the transportation system and
evaluate the transportation policy [23]. Therefore, it is applicable and feasible to use the SD method
to study traffic problems such as the construction of a transit metropolis, which can reflect the
advantages of systemicity and dynamics.
At present, SD is commonly used to systematically study traffic problems, including
transportation systems, highways, road traffic emission policies, congestion policies, freight
transportation, and so on. Many researchers have used the SD approach to analyze transportation
system problems. Wilsses et al. [24] considered it suitable to capture the causality of urban
transportation system variables using system dynamics and analyzed the impact of some Brazilian
policies on the transportation system environment, economy, and transportation variables. They
conducted extreme condition tests and integration error tests for model validation via the software
Vinsim. Yongtao Tan et al. [25] used Beijing, China, as an example to simulate the sustainable
performance of the city with a system dynamics model. In order to achieve sustainable development,
Beijing should adopt a low speed urbanization policy. They performed model verification with
historical data such as total population, service industry output value, number of health workers,
annual total water consumption, and farmland area. The absolute error rates were less than 5%. The
SD approach is also used to research highway problems. Gokhan et al. [26] used a system dynamics
method to study highway sustainability and simulated three potential strategies for policy
development: fuel efficiency, public transportation, and electric vehicle usage. The mixed
implementation of strategies played an important role in the success of policy making. In the process
of model validation, the CO2 emission values obtained from the SD model were compared with the
real data, and a one-way ANOVA statistical hypothesis test was also used to compare the simulated
trend and the actual emission trend [26]. Additionally, the SD method is used to study road traffic
emission policies. Aiga Barisa et al. [27] used a system dynamics model to analyze CO2 emission
reduction policies of road traffic. The SD model can better understand the factors behind road
emissions. Structural and behavioral validation tests were performed for model validation in the
research, which compared the simulated values with the real values and examined the sensitivity of
the SD model’s behavior under the changed values of some major parameters. Xue Liu [28] proposed
an SD approach to scenario analysis for energy consumption and CO2 emissions of urban passenger
transport and built a Beijing urban passenger transport carbon model. The SD model simulated
different policy scenarios under different conditions. What is more, some authors have used SD to
analyze congestion policies. Shiyong Liu [29] used the SD model to assess the dynamic impact of
congestion pricing strategies on the socioeconomic system of transportation and to support policy
makers; the population, employment growth, and tourism are exogenous factors that affect travel
demand. For the freight transportation problems, Carina Thaller et al. [30] used the SD model to
describe and reveal urban freight traffic, and made medium and long-term predictions. The proposed
SD model enabled trend analysis by medium and long-term forecasts [30]. Wen Huang [31] proposed
a methodological framework for truck weight regulation based on system dynamics. The framework
was composed of five subsystems and captured the vehicle, highway, and freight variables that
influence the effects of truck weight regulation and transportation efficiency over time. For model
validation, the freight volume, truck traffic, and freight turnover outputs simulated by the SD model
were compared to the actual values over the same period. Significant correlations were found
between the actual data and the simulated data. The SD model was verified by finding a significant
correlation between actual and simulated data [31]. For some other problems, Eirini Grammatiki
Pagoni [32] developed a novel SD-based decision support tool to assess the socially and financially
sustainable performance of national public–private partnership programs. Historical data were used
to estimate parameters of the SD model and their trends, such as Population_Net_Fractional_Rate,
Income_Per_Capita, and Labour_Force_Participation. The test results indicated no systematic bias
between the simulated and actual values; hence, the SD model could replicate the observed behavior
Sustainability 2020, 12, 3028 7 of 25
in the studied system [32]. These researches are valuable for understanding the SD model structure,
model verification, model simulation and applications in policy analysis. The Transit Metropolis
Program has Chinese characteristics. Although there are many researches on the transit metropolis
in China [10,14,15,17–21], there is little research on the systematic effects of the Transit Metropolis
Program.
The construction of a transit metropolis is a complex system, including a series of aspects such
as environment, urban economy, urban population, and other aspects of transportation demand and
supply. This also requires that the construction of a transit metropolis must be considered from
multiple aspects. System dynamics is an effective tool for studying complex systems. However, there
is little literature on systematically studying the construction of a transit metropolis, especially the
quantitative relationship between transit metropolis construction and sustainable development of
urban transportation. We hope this systematic quantitative analysis can describe the construction
effect of the transit metropolis and illustrate how to take measures to achieve the transit metropolis
construction indicators, so as to better promote the sustainable development of urban transportation
and meet the citizens’ travel needs. In the context of transit metropolis construction, taking Nanchang
city as an example, the system dynamics theory is used to quantitatively analyze the progress made
in transit metropolis construction, and corresponding suggestions are proposed for the construction
of a transit metropolis and the development of public transportation in Nanchang. Due to the
similarity of public transit city construction indicators, the analysis ideas and system dynamic models
constructed in this paper can be applied to other transit metropolis construction cities.
The research structure is arranged as follows: Section 3 is an introduction to the research
methods; SD model construction is presented in Section 4; Section 5 is the SD model simulation, and
the last section is the Conclusion and prospects.
3. Methodology
This paper adopts a system dynamics method to characterize the construction effect of the transit
metropolis. Since Forrester first proposed the system dynamics model in 1961 [33], it has been widely
used in various fields of studies.
SD consists of stock, flow, auxiliary variables, and feedbacks [24]. Stock is the variable state in a
system that influences system behavior at a certain time. In a period of time, flow is the decrease or
increase in the value of a stock. The rates that change stocks during a period of time via determining
the flow value are auxiliary variables. The feedback loops are commonly presented in the form of
causal relationship diagrams. After the flow, flock, auxiliary variables, and causal relationships are
determined and verified, the researched system is simulated with respect to the past data as initial
baseline values.
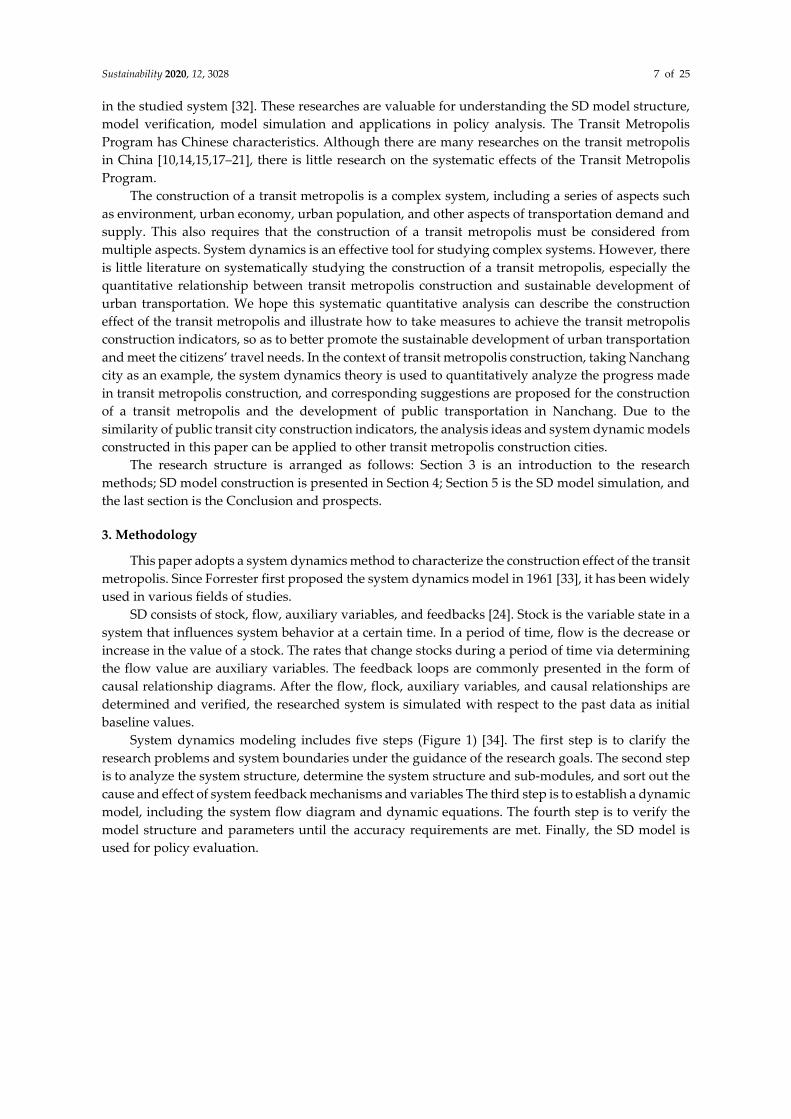
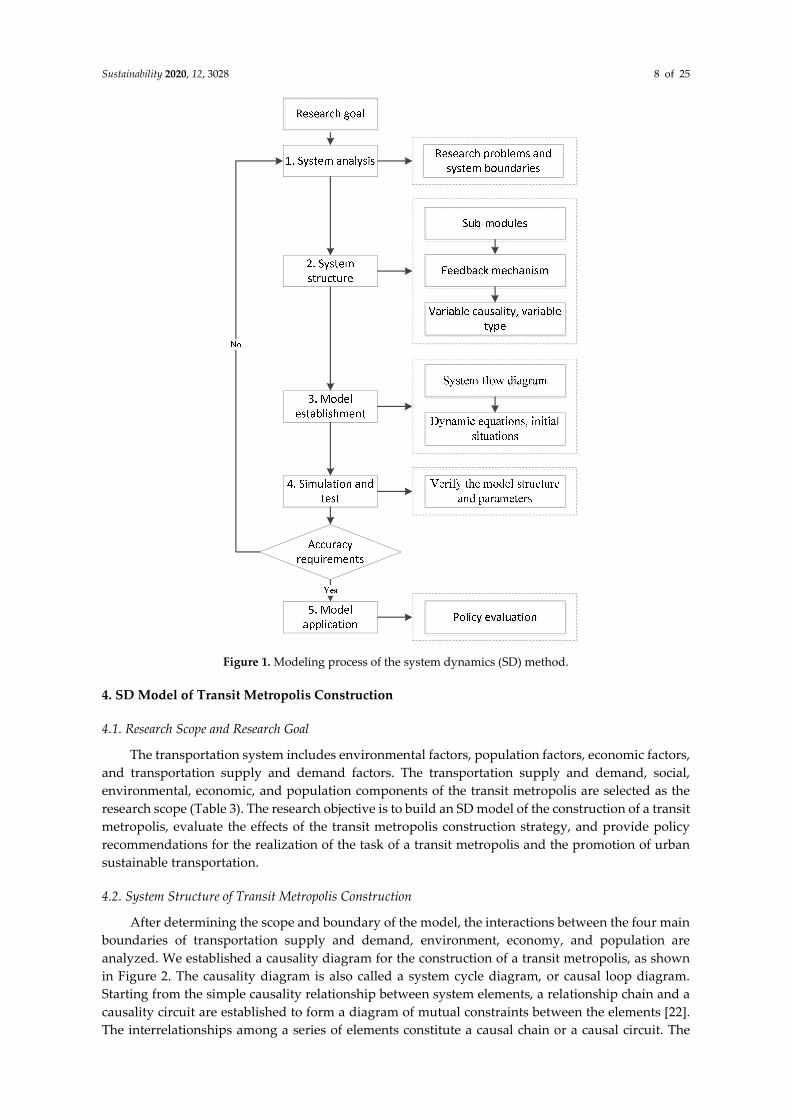
System dynamics modeling includes five steps (Figure 1) [34]. The first step is to clarify the
research problems and system boundaries under the guidance of the research goals. The second step
is to analyze the system structure, determine the system structure and sub-modules, and sort out the
cause and effect of system feedback mechanisms and variables The third step is to establish a dynamic
model, including the system flow diagram and dynamic equations. The fourth step is to verify the
model structure and parameters until the accuracy requirements are met. Finally, the SD model is
used for policy evaluation.
Sustainability 2020, 12, 3028 8 of 25
Figure 1. Modeling process of the system dynamics (SD) method.
4. SD Model of Transit Metropolis Construction
4.1. Research Scope and Research Goal
The transportation system includes environmental factors, population factors, economic factors,
and transportation supply and demand factors. The transportation supply and demand, social,
environmental, economic, and population components of the transit metropolis are selected as the
research scope (Table 3). The research objective is to build an SD model of the construction of a transit
metropolis, evaluate the effects of the transit metropolis construction strategy, and provide policy
recommendations for the realization of the task of a transit metropolis and the promotion of urban
sustainable transportation.
4.2. System Structure of Transit Metropolis Construction
After determining the scope and boundary of the model, the interactions between the four main
boundaries of transportation supply and demand, environment, economy, and population are
analyzed. We established a causality diagram for the construction of a transit metropolis, as shown
in Figure 2. The causality diagram is also called a system cycle diagram, or causal loop diagram.
Starting from the simple causality relationship between system elements, a relationship chain and a
causality circuit are established to form a diagram of mutual constraints between the elements [22].
The interrelationships among a series of elements constitute a causal chain or a causal circuit. The

Sustainability 2020, 12, 3028 9 of 25
causal loops are determined based on the cause and effect relationships among parameters [26]. The
plus and minus signs next to the arrows indicate the positive and negative attributes of the correlation
between the variables. It should be noted that each chain in the causal circuit diagram must represent
a causal relationship between variables, not just a correlation between variables [35,36]. Correlation
between variables reflects the past behavior of the system, and correlation does not represent the
results of the system. Confounding relationships with causality can lead to misleading and policy
errors. Although statistics show a positive correlation between ice cream sales and murder, both of
which fluctuate with the average temperature and increase in summer and decrease in winter, the
cause and effect chain cannot be drawn between the two. Murder crimes cannot be reduced by
limiting consumption of ice cream [36]. The modeler must carefully consider whether the relationship
in the dynamic model is causal, regardless of how strong the correlation is, or how statistically
important the regression coefficient is [35,36]. This requires a large collection of historical data,
follow-up inspection, statistical inference, and logical experience judgment [36].
Table 3. System elements of transit metropolis construction.
Factors Specific parameters Unit
Environmental factor
Cumulative NOx emissions ton
Increase amount of NOx emissions ton
NOx dissipation rate ——
NOx dissipation amount ton
NOx environmental capacity ton
Average annual NOx emissions per vehicle ton/vehicle/year
Contribution of motor vehicles to NOx ——
Population factor
Natural growth rate of population ——
Population migration rate ——
Growth amount of population million
Trips per capita trip
Urban resident population million
Total resident travel trip
Economic factor
Local GDP Yuan (RMB)
GDP growth Yuan (RMB)
GDP growth rate ——
Investment in transit metropolis Yuan (RMB)
Proportion of transportation investment in
regional GDP %
Transit investment ratio in transportation
investment %
Transit investment conversion rate ——
Road investment ratio in transportation
investment %
Road construction investment Yuan (RMB)
Road investment conversion rate ——
Transportation supply and demand
factor
Car trips trip
Passenger capacity per bus per day trip/bus/day
Average passenger factor of car person/car
Bus ownership standard vehicle
Regular bus trips trip
Rail transit trips trip
Road mileage km
Road capacity vehicle/hour
Road saturation ——
Motorized sharing rate of public transport %
Sharing rate of public transport %

Sustainability 2020, 12, 3028 10 of 25
Figure 2. Causality diagram of transit metropolis construction.
The main causal loops in the model causality diagram are based on the following logic:
(1) The improvement of regional GDP has a positive effect on the investment of transit
metropolis construction. The investment of transit metropolis construction has a positive correlation
with the share of public transport, and has a positive correlation with the amount of public bus trips.
The increase in the average speed of the road network is conducive to the improvement of road traffic
conditions, and the degree of road congestion has an adverse effect on the local GDP.
(2) The growth of the urban economy will lead to an increase in the city’s resident population
and per capita GDP, and the increase in people’s living standards will also increase the number of
motor vehicles. This will adversely affect the state of road traffic and the transportation environment,
and will adversely affect economic development.
(3) Urban economic development has resulted in a corresponding increase in urban transport
investment. Optimization of urban road mileage and road structure has improved road capacity and
has a positive effect on urban economic development.
(4) The increase of urban resident population will increase the number of urban residents who
travel, which will have an adverse effect on road load and the average speed of the road network.
The deterioration of the urban road network has a negative effect on the number of urban residents.
To reiterate, this article studies the relationship between the construction of the transit
metropolis and the sustainable development of urban transportation. The transit metropolis
construction first requires economic development and capital investment. The sustainability of urban
transportation is mainly reflected by road traffic conditions and traffic pollutant emissions. Therefore,
the causal loops that include factors such as GDP, urban investment, road traffic conditions, and
traffic emissions are the most critical. Starting with GDP, three causal loops are considered, and one
of them is reinforcing and the other two are balancing.
Loop 1: Local GDP → +Investment of transit metropolis → +Investment in public transport →
+Investment in urban roads → +road length → +road capacity → +road traffic status → -Local
GDP (Balancing loop)
Investment of transitmetropolis
Local GDP
Investment in publictransport
+
+
Investment inurban roads
Investment inrailway
Public transporttrips
Road networkaverage speed
Urban residentpopulation
Motor vehicle trips
-
+
+
road length
Road capacity
+
+
The length of buslane
Bus vehiclesownership
Total emissions ofpollutants
sharing rate ofpublic transport
Harbor-type stopsetting rate
++ ++
Bus station area
+
Car pollutionemissions
+
+
Road traffic status+
+
-
-
Vehicle ownership
+
+
++
+
-
Sustainability 2020, 12, 3028 11 of 25
Loop 2: Local GDP → +Investment of transit metropolis → +Investment in public transport →
+The length of bus lane/Bus vehicles ownership/Investment in railway → +Sharing rate of public
transport → +Public transport trips → -Motor vehicle trips → -Road network average speed →
+Road traffic status → -Local GDP (Balancing loop)
Loop3: Local GDP → +Investment of transit metropolis → +Investment in public transport →
+The length of bus lane/Bus vehicles ownership/Investment in railway → +Sharing rate of public
transport → +Public transport trips → -Motor vehicle trips → +Car pollution emissions → +Total
emissions of pollutants → -Local GDP (Reinforcing loop)
These causal relationships seem to hold true, and a model test is needed to compare model
simulation values with real values. In fact, the SD model has a delay phenomenon. Delay is a process
whose output lags behind its input in some modes. For example, the investment effect of the transit
metropolis will have a time period. Investment and construction of bus lanes and subways require a
series of times for bidding, construction, supervision, and operation; the purchase of bus vehicles also
requires a time for purchase and vehicle filing. For simplicity, this article ignores these delays, and
they need to be considered further in future research.
Causality diagrams describe the interrelationships between variables, and no quantitative
analysis has yet been given. The quantitative relationships between the variables will be analyzed in
the next section, when discussing how a change in a variable affects the change in the system.
4.3. System Flow Diagram and Dynamics Equations of Transit Metropolis Construction
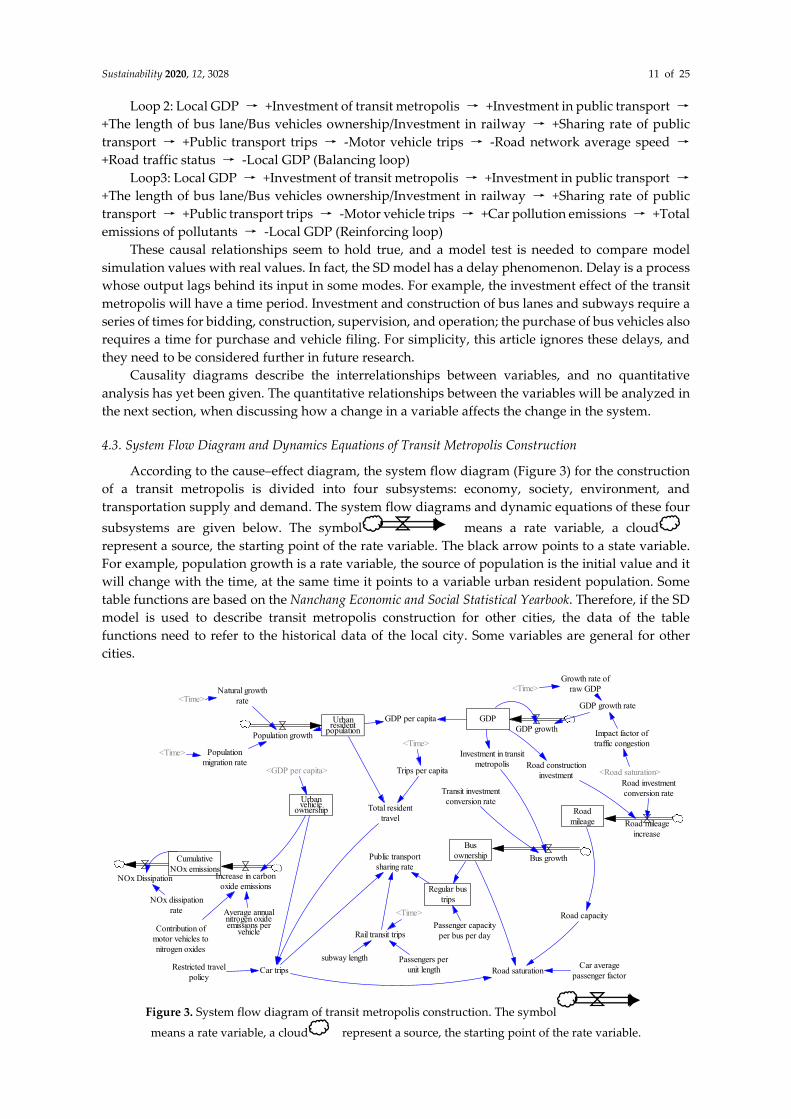
According to the cause–effect diagram, the system flow diagram (Figure 3) for the construction
of a transit metropolis is divided into four subsystems: economy, society, environment, and
transportation supply and demand. The system flow diagrams and dynamic equations of these four
subsystems are given below. The symbol means a rate variable, a cloud
represent a source, the starting point of the rate variable. The black arrow points to a state variable.
For example, population growth is a rate variable, the source of population is the initial value and it
will change with the time, at the same time it points to a variable urban resident population. Some
table functions are based on the Nanchang Economic and Social Statistical Yearbook. Therefore, if the SD
model is used to describe transit metropolis construction for other cities, the data of the table
functions need to refer to the historical data of the local city. Some variables are general for other
cities.
Figure 3. System flow diagram of transit metropolis construction. The symbol
means a rate variable, a cloud represent a source, the starting point of the rate variable.
Urbanresident
population
Urbanvehicle
ownership
Car trips
Population growth
Natural growthrate
Trips per capita
Regular bustrips
GDPGDP growth
Investment in transitmetropolis Road construction
investment
Busownership Bus growth
Roadmileage Road mileage
increase
Road capacity
Road saturation
Total residenttravel
Public transportsharing rate
Rail transit tripsPassenger capacity
per bus per day
subway length Passengers perunit length
<Time>
Average annualnitrogen oxideemissions per
vehicleContribution ofmotor vehicles tonitrogen oxides
CumulativeNOx emissions
Increase in carbonoxide emissions
NOx Dissipation
NOx dissipationrate
<Time>Growth rate of
raw GDP
GDP growth rate
Road investmentconversion rateTransit investment
conversion rate
Car averagepassenger factor
<Road saturation>
Impact factor oftraffic congestion
GDP per capita
<GDP per capita>
Populationmigration rate
<Time><Time>
<Time>
Restricted travelpolicy
Sustainability 2020, 12, 3028 12 of 25
4.3.1. Flow Chart and Dynamic Equation of the Economic Subsystem
The economic system includes a state variable regional GDP (Local GDP), the rate variables
include: GDP growth, raw GDP growth, GDP growth rate, public transport investment conversion
rate, urban road investment conversion rate, and the impact factor of traffic congestion as auxiliary
variables (Figure 4). There are two table functions in the economic subsystem, the original GDP
growth and the traffic congestion impact factor.
Figure 4. System causalities of the economic subsystem.
GDP is calculated from GDP points as follows, it equals the original GDP plus the increase GDP.
This function is general for other cities. The specific data should be collected for a certain city.
(1)
where is the regional GDP, is the GDP growth rate, is the original GDP. The
GDP growth rate is determined by the original GDP growth rate and the influence factor of
traffic congestion, and the formula is as follows:
, (2)
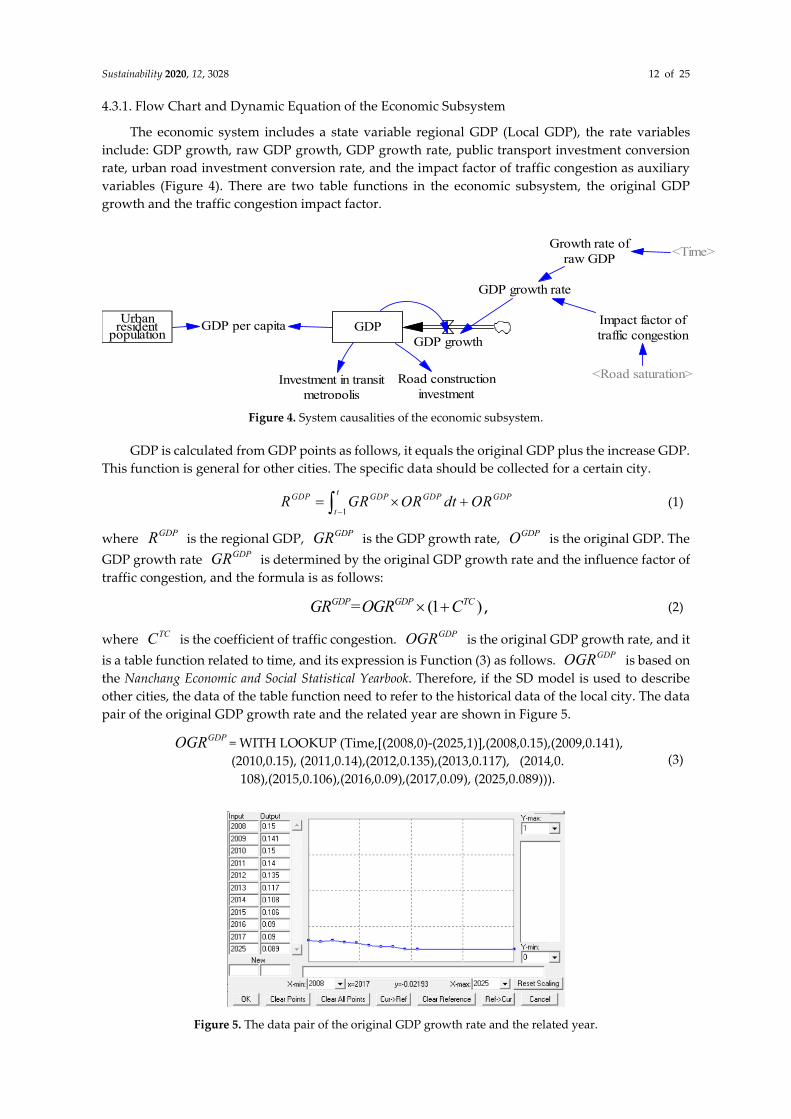
where is the coefficient of traffic congestion. is the original GDP growth rate, and it
is a table function related to time, and its expression is Function (3) as follows. is based on
the Nanchang Economic and Social Statistical Yearbook. Therefore, if the SD model is used to describe
other cities, the data of the table function need to refer to the historical data of the local city. The data
pair of the original GDP growth rate and the related year are shown in Figure 5.
= WITH LOOKUP (Time,[(2008,0)-(2025,1)],(2008,0.15),(2009,0.141),
(2010,0.15), (2011,0.14),(2012,0.135),(2013,0.117), (2014,0.
108),(2015,0.106),(2016,0.09),(2017,0.09), (2025,0.089))).
(3)
Figure 5. The data pair of the original GDP growth rate and the related year.
Urbanresident
populationGDP
GDP growth
Investment in transitmetropolis
Road constructioninvestment
<Time>Growth rate of
raw GDP
GDP growth rate
<Road saturation>
Impact factor oftraffic congestion
GDP per capita
1
tGDP GDP GDP GDP
tR GR OR dt OR
GDPR GDPGR GDPOGDPGR
(1 )GDP GDP TCGR =OGR C
TCC GDPOGRGDPOGR
GDPOGR

Sustainability 2020, 12, 3028 13 of 25
The influence factor of traffic congestion is a table function of road saturation , and
its expression is as follows. The data pair of the coefficient of influence factor and road saturation are
shown in Figure 6.
= WITH LOOKUP( ,[(0,-0.5)-(20,0)],(0,0),(0.5,-0.0012),(1,-0.0022), (1.5,-
0.003),(2,-0.0035), (2.5,-0.004),(3,-0.0045),(5,-0.005),(10,-0.01),(20,-0.02)). (4)
Figure 6. The data pair of the coefficient of influence factor and road saturation.
The GDP per capita is divided by the regional GDP divided by the urban
resident population . The formula is as follows:
(5)
The investment in transit metropolis is determined by the product of regional GDP
and public transport investment ratio :
(6)
The investment in urban road construction is determined by the product of the regional
GDP and the proportion of urban road investment :
(7)
4.3.2. Flow chart and dynamic equation of the society subsystem
In the social subsystem (Figure 7), there is a level variable of the city’s resident population, and
the rate variables include the natural growth rate, population migration rate, and population growth.
There are two table functions in the social subsystem, which are the table function of natural
population growth rate and table function of population migration rate.
Figure 7. System causalities of the society subsystem.
TCC SR
TCC SR
GDPPC GDPRURP
/GDP GDP URPC =R P
TMI GDPRPTIR
TM GDP PTI =R RI
URCIGDPR URIP
URC GDP URII =R P
Urbanresident
populationPopulation growth
Natural growthrate
Trips per capita
Total residenttravel
<Time>
Populationmigration rate
<Time>
<Time>

Sustainability 2020, 12, 3028 14 of 25
The urban resident population is calculated from the integral of population growth over
time:
(8)
where is population growth rate, is original population.
(9)
where, is population growth, is the natural growth rate of population, is the
population migration rate. The natural growth rate is based on the data of the National
Economic and Social Development Bulletin of Nanchang [37], which is a table function related to time.
Therefore, the data of the table function need to refer to the historical data of the local city if the SD
model is used to describe transit metropolis construction for other cities. The data pair of the natural
growth rate of population and the related year are shown in Figure 8.
= WITH LOOKUP (Time,[(2008,0)-(2025,0.03)], (2008,0.00785),(2009,0.00783),
(2010,0.0075), (2011,0.0073),(2012,0.007),
(2013,0.00679),(2014,0.00678),(2015,0.00675),(2016,0.00693),
(2017,0.00763),(2018,0.00683),(2025,0.0065)).
(10)
Figure 8. The data pair of the natural growth rate of population and the related year.
The population migration rate is a table function related to time. It also needs local data
for different cities. The data pair of the population migration rate and the related year are shown in
Figure 9.
= WITH LOOKUP (Time,[(2008,0)-(2025,0.01)], (2008,0.002),
(2012,0.0035),(2013,0.0038),
(2014,0.00395),(2015,0.00511),(2016,0.00586),(2017,0.0093),(2018,0.008),
(2025,0.009)).
(11)
URP
1( 1)
tUR GR O
tP P P dt
GRP OP
( )G UR GR MRP =P N P
GRP GRN MRPGRN
GRN
MRP
MRP

Sustainability 2020, 12, 3028 15 of 25
Figure 9. The data pair of the population migration rate and the related year.
The number of resident trips is the product of the resident population and the
number of trips per resident . The number of trips per capita is a table function related
to time. It needs local data in the table function. The data pair of the number of trips per capita and
the related year is shown are Figure 10.
= WITH LOOKUP (Time,[(2008,2)-(2024,3)],(2008,2.55),(2012,2.6),
(2015,2.65), (2018,2.75),(2021,2.85),(2023,2.95)). (12)
Figure 10. The data pair of the number of trips per capita and the related year.
(13)
where is the total number of resident trips.
4.3.3. Flow Chart and Dynamic Equation of the Environment Subsystem
The environmental subsystem (Figure 11) includes a level variable of cumulative nitrogen oxide
emissions. The rate variables include nitrogen oxide dissipation, nitrogen oxide dissipation rate,
nitrogen oxide emissions increase, motor vehicle contribution to nitrogen oxides, and vehicle average
nitrogen oxide emissions. Urban vehicle ownership is a linear function related to per capita GDP,
which is obtained from the economic system.
RTN URPPRTN PRTN
PRTN
RT UR PRTN =P N
RTN
Sustainability 2020, 12, 3028 16 of 25
Figure 11. System causalities of the environment subsystem.
(14)
where is emission, is emission increase of , is emission
dissipation of .
(15)
where is emission amount, is emission dissipation rate of .
(16)
where is emission increase of , is urban vehicle ownership, is
emission per vehicle, is motor vehicle contribution to emissions. The number of
motor vehicles will change with the residents’ living standards. The number of motor vehicles is
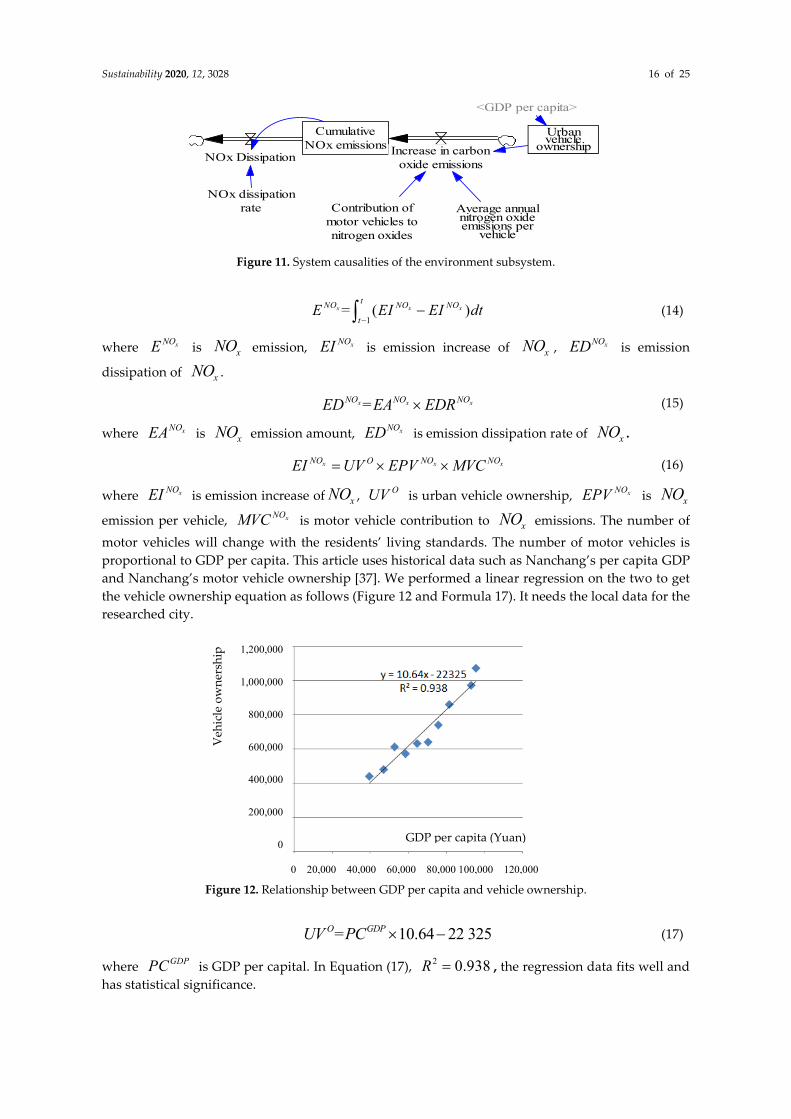
proportional to GDP per capita. This article uses historical data such as Nanchang’s per capita GDP
and Nanchang’s motor vehicle ownership [37]. We performed a linear regression on the two to get
the vehicle ownership equation as follows (Figure 12 and Formula 17). It needs the local data for the
researched city.
Figure 12. Relationship between GDP per capita and vehicle ownership.
(17)
where is GDP per capital. In Equation (17), , the regression data fits well and
has statistical significance.
Urbanvehicle
ownership
Average annualnitrogen oxideemissions per
vehicle
Contribution ofmotor vehicles tonitrogen oxides
CumulativeNOx emissions Increase in carbon
oxide emissionsNOx Dissipation
NOx dissipationrate
<GDP per capita>
1( )x x x
tNO NO NO
tE = EI EI dt
xNOE xNO xNOEI xNO xNOED
xNO
x x xNO NO NOED =EA EDR
xNOEA xNO xNOED xNO
x x xNO NO NOOEI UV EPV MVC
xNOEI xNO OUV xNOEPV xNOxNOMVC xNO
10.64 22 325O GDPUV =PC
GDPPC 2 0.938R
GDP per capita (Yuan)
Veh
icle
ow
ner
ship
0 20,000 40,000 60,000 80,000 100,000 120,000
1,200,000
1,000,000
800,000
600,000
400,000
200,000
0

Sustainability 2020, 12, 3028 17 of 25
4.3.4. Flow Chart and Dynamic Equation of Transportation Demand and Supply
There are three level variables in the transportation supply and demand system (Figure 13),
which are bus ownership, public transportation trips, and road mileage. The rate variables include
bus growth and road mileage growth.
Figure 13. System causalities of the transportation demand and supply subsystem.
The amount of bus ownership is the integral of the growth of the bus over time:
(18)
where is bus ownership, is bus ownership increase, is original bus ownership.
(19)
where is transit investment conversation rate, is transit metropolis investment,
is regional GDP, is transportation investment ratio, is investment ratio of public
transport.
Road mileage is the integral of road mileage increase over time:
(20)
where is road mileage, is road mileage increase, is original road mileage.
(21)
where is road construction investment, is road investment conversion rate, is
regional GDP, is transportation investment ratio, is road investment ratio.
Road capacity ( ) calculation formula is as follows:
= ( ×0.05×6×15000) + ( ×0.15×6×8000) + ( ×0.8×2×5000) (22)
The formula for calculating the number of rail transit trips is shown in Equation (23):
(23)
where is rail trip volume, is subway length, is passengers per unit subway
length.
(24)
Car trips
Regular bustrips
Investment in transitmetropolis
Road constructioninvestment
Busownership Bus growth
Roadmileage
Road mileageincrease
Road capacity
Road saturation
Total residenttravel
Public transportsharing rate
Rail transit trips
Passenger capacityper bus per day
subway length Passengers perunit length
Road investmentconversion rate
Transit investmentconversion rate
Car averagepassenger factor
<Time>
1
tO OI OO
tB = B dt B
OB OIB OOB
OI CR TM CR GDP TR PTB =TI I TI R I IR
CRTI TMI GDPRTRI PTIR
1
tM MI M
tR = R dt OR
MR M IR MOR
M I RC CR GDP TR RR CRR =I RI =R I I RI
RCI CRRI GDPRTRI RRI
CR
CR MR MR MR
RT L PUSLV =S P
RTV LS PUSLP
T O PBPDRB =B PC

Sustainability 2020, 12, 3028 18 of 25
where is regular bus trips, is bus ownership, is passenger capacity per bus per
day.
(25)
where is bus motorized sharing rate, is regular bus trips, is rail transit trips,
is car trips.
(26)
where is the total number of resident trips, is bus motorized sharing rate.
(27)
where is road saturation, is car trips, is car average passenger factor, is bus
ownership, is road capacity.
Based on the data provided by Nanchang Statistical Yearbook [37], Statistical Bulletin, and public
transport collective, the initial values of the SD model parameters are given in Table 4. If the SD model
is transferred to other cities for system analysis of transit metropolis construction, the initial data
should be collected from the researched city.
Table 4. Initial values of parameters in the SD model.
parameter Initial value parameter Initial value
Regional GDP RMB 16.60
billion Urban resident population 4.95 million
NOx emissions 36 million tons Contribution of motor vehicles
to NOx [38] 0.8
NOx dissipation rate 0.2 Average annual NOx emissions
per vehicle 0.05 ton
Bus ownership of Nanchang 2520 Transit investment conversion
rate 1.5
Proportion of transportation
investment in regional GDP 0.022
Transit investment ratio in
transportation investment 0.25
Road mileage 1000 km Road investment conversion
rate 1.71×10⁻⁸
Road investment ratio in
transportation investment 0.21 Subway length 48.47 km
Passenger per unit subway length 6500
passenger/km Passenger capacity per bus
700
passengers/day
Car average travel distance 20 km/day Average passenger factor of car 1.8
Public transport travel distance 250 km/day
5. SD Model Simulation of Transit Metropolis Construction
5.1. Model Verification
No model precisely matches the real system because all models are something less than the
system modelled [27]. Generally, SD model builders are more interested in dynamic tendencies than
in specific values of system variables [27]. In practice, the usefulness of a proposed model is of major
concern [39]. Forrester and Senge [40] believe that confidence is the best criterion for model
assessment because there is no absolute proof of the model capability to describe reality. SD models
are found to be valid when they can be used with confidence [39,40]. For SD model validation, it is
common to compare the simulation values and actual data [22–32,38–41]. Sun [41] chose two
variables (public transport vehicles and public transport demand) to test the SD model of the public
transport price strategy. Eirini Grammatiki Pagoni [32] used historical data of
Population_Net_Fractional_Rate, Income_Per_Capita, and Labour_Force_Participation to estimate
TRB OB PBPDPC
( ) / ( )MSR T T T T TB RB RT RB C RT
MSRB MSRB TRTTC
(1 )T RT MSRC =N B
RTN MSRB
( / 20 200) /S T APF O CR C C B R
SR TC APFC OBCR

Sustainability 2020, 12, 3028 19 of 25
parameters of the SD model and their trends. Xue [22] also chose two variables: public transport
demand (trips/month) and public transport vehicles as test variables. If the reliability level is used as
a test standard, the error rate of the SD model should be within 5% to meet the accuracy requirements
[22,40,41]. When analyzing the parking charging policy in urban areas with a system dynamics
model, He Jie [23] chose road length and vehicle ownership as the main historical value inspection
indicators. There are three reasons for choosing these two parameters as test variables [23]: (1) the
core of the research is the relationship between parking pricing policies and socioeconomic and urban
transportation. The state variables in the model, road length and vehicle ownership, are the main
variables; (2) These two variables have historical data that can be compared; (3) In the process of
system dynamics simulation, according to the index interference level and the cyclic process, these
variables are the center of the simulation process and are important factors affecting the change of
the parking rate.
We will also use historical data to check the SD model validation according to the above SD
literatures. Using the historical data of Nanchang, the two indicators of resident population and
regional GDP of Nanchang were tested in Table 5. Additionally, the number of buses, mileage, and
vehicle ownership can be used as indicators to verify the traffic facilities. The simulated values and
actual data of the three parameters of Nanchang city in 2016 are compared in Table 6. From the data
in Table 5 and Table 6, it can be seen that from 2008 to 2018, the error rates of resident population and
regional GDP of Nanchang City were controlled within 5%, the error rates of traffic facilities were
also less than 5%, indicating that the accuracy of the model meets the needs of simulation analysis
[22,40,41]. We can use the constructed system dynamics model to simulate and analyze the
construction of Nanchang’s transit metropolis.
Table 5. Comparison of historical and simulated data for the resident population (million) and GDP
(billion).
Year Simulated Value of
Resident Population
Real Value of
Resident
Population
Error
Rate
Simulation
Value of GDP
Real
GDP
Error
Rate
2008 494.73 494.73 0.00% 166.008 166.008 0.00%
2009 499.60 497.33 0.45% 190.825 183.750 3.71%
2010 504.70 502.23 0.49% 217.640 220.711 1.41%
2011 509.88 504.95 0.98% 250.173 268.887 7.48%
2012 515.19 507.87 1.44% 285.075 300.052 5.25%
2013 520.60 518.42 0.42% 323.424 338.726 4.73%
2014 526.11 524.02 0.40% 361.129 370.555 2.61%
2015 531.76 530.29 0.28% 399.991 401.188 0.30%
2016 538.07 537.14 0.17% 442.238 439.568 0.06%
2017 544.95 546.35 0.26% 481.895 481.976 0.02%
2018 554.17 554.55 0.07% 525.107 527.467 0.45%
Table 6. Comparison of historical and simulated data for the traffic facilities of Nanchang city in 2016.
Parameter Simulated Value Real Value Error Rate
Number of buses (unit vehicle) 3945 4000 1.37%
Mileage (Km) 1181.6 1200 1.53%
Vehicle ownership (unit vehicle) 852,181 860,000 0.91%
5.2. Model Simulation and Analysis
A complete analysis of the SD model’s behavior requires the study of a large number of model
parameters. Such a detailed experimental design is practically impossible and not necessary [32]. We
will focus on the key factors related to the research topic. This section analyzes the SD model of transit
metropolis construction, and analyzes the effects of Nanchang’s transit metropolis construction with
the main indicators of vehicle ownership, motorized travel-sharing rate of public transport, road
saturation, and nitrogen oxide emissions. The simulation time of this model is from 2008 to 2023, and
Sustainability 2020, 12, 3028 20 of 25
the simulation step is one year, which simulates the changing trend of Nanchang’s urban
transportation system. Because the academic edition of the software Vensim does not include
sensitivity analysis function, we adjusted the values of the strategy parameters to obtain the value
table of the specific variable via Vensim software. Then Excel was used to draw respective variable
trend lines in the same figure under different strategies.
5.2.1. Vehicle Ownership
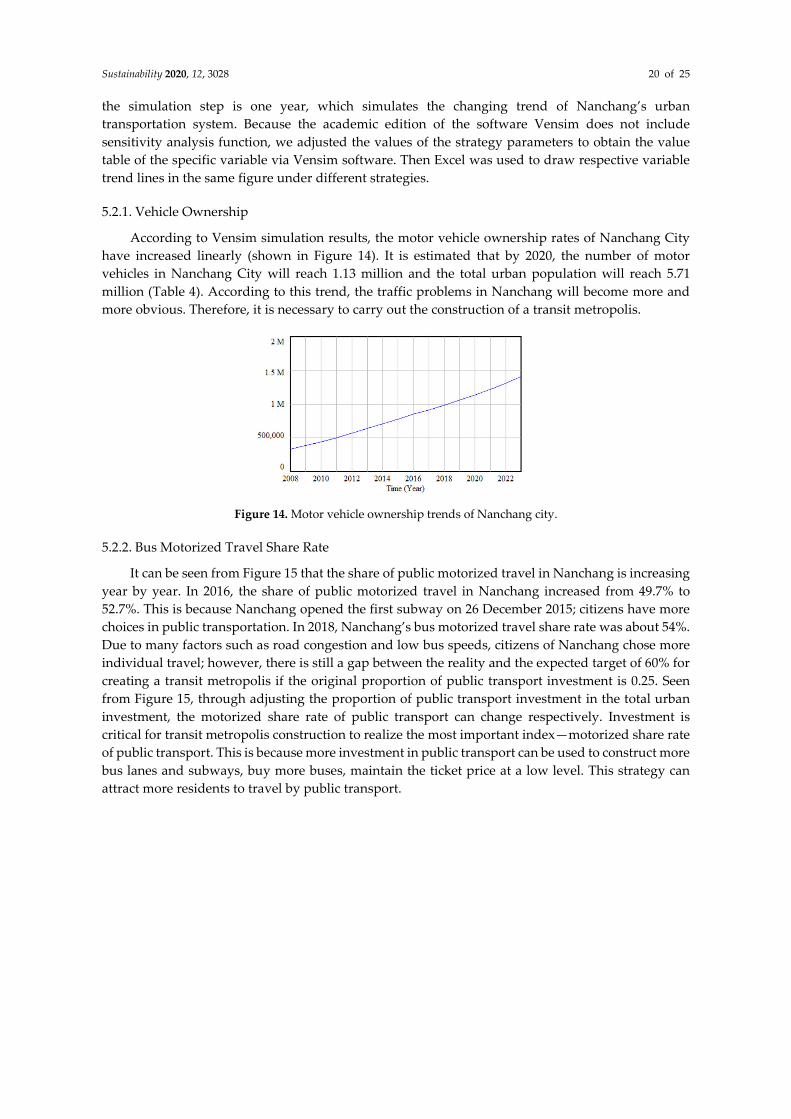
According to Vensim simulation results, the motor vehicle ownership rates of Nanchang City
have increased linearly (shown in Figure 14). It is estimated that by 2020, the number of motor
vehicles in Nanchang City will reach 1.13 million and the total urban population will reach 5.71
million (Table 4). According to this trend, the traffic problems in Nanchang will become more and
more obvious. Therefore, it is necessary to carry out the construction of a transit metropolis.
Figure 14. Motor vehicle ownership trends of Nanchang city.
5.2.2. Bus Motorized Travel Share Rate
It can be seen from Figure 15 that the share of public motorized travel in Nanchang is increasing
year by year. In 2016, the share of public motorized travel in Nanchang increased from 49.7% to
52.7%. This is because Nanchang opened the first subway on 26 December 2015; citizens have more
choices in public transportation. In 2018, Nanchang’s bus motorized travel share rate was about 54%.
Due to many factors such as road congestion and low bus speeds, citizens of Nanchang chose more
individual travel; however, there is still a gap between the reality and the expected target of 60% for
creating a transit metropolis if the original proportion of public transport investment is 0.25. Seen
from Figure 15, through adjusting the proportion of public transport investment in the total urban
investment, the motorized share rate of public transport can change respectively. Investment is
critical for transit metropolis construction to realize the most important index—motorized share rate
of public transport. This is because more investment in public transport can be used to construct more
bus lanes and subways, buy more buses, maintain the ticket price at a low level. This strategy can
attract more residents to travel by public transport.
Sustainability 2020, 12, 3028 21 of 25
Figure 15. Trend of the share of public motorized travel in Nanchang.
5.2.3. NOx Emissions
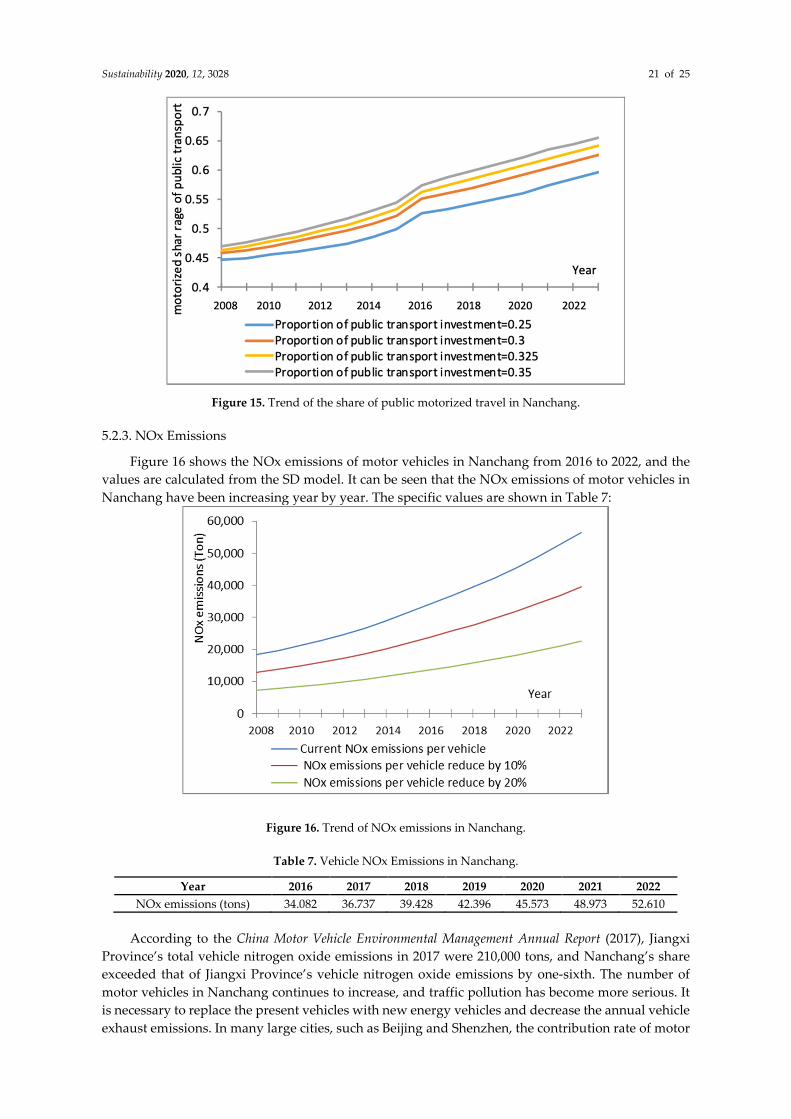
Figure 16 shows the NOx emissions of motor vehicles in Nanchang from 2016 to 2022, and the
values are calculated from the SD model. It can be seen that the NOx emissions of motor vehicles in
Nanchang have been increasing year by year. The specific values are shown in Table 7:
Figure 16. Trend of NOx emissions in Nanchang.
Table 7. Vehicle NOx Emissions in Nanchang.
Year 2016 2017 2018 2019 2020 2021 2022
NOx emissions (tons) 34.082 36.737 39.428 42.396 45.573 48.973 52.610
According to the China Motor Vehicle Environmental Management Annual Report (2017), Jiangxi
Province’s total vehicle nitrogen oxide emissions in 2017 were 210,000 tons, and Nanchang’s share
exceeded that of Jiangxi Province’s vehicle nitrogen oxide emissions by one-sixth. The number of
motor vehicles in Nanchang continues to increase, and traffic pollution has become more serious. It
is necessary to replace the present vehicles with new energy vehicles and decrease the annual vehicle
exhaust emissions. In many large cities, such as Beijing and Shenzhen, the contribution rate of motor

Sustainability 2020, 12, 3028 22 of 25
vehicle emissions has reached more than 40%, which is the culprit of environmental pollution, and it
is urgent to reduce motor vehicle emissions.
5.2.4. Traffic Congestion Factor (Road Saturation)
Figure 17 shows that the traffic congestion factor of Nanchang City is increasing year by year,
and it is expected to reach a peak of 2.16 in 2022 if the original proportion of public transport
investment is 0.25. This shows that Nanchang City has improved traffic demand and methods by
improving road network grading and the construction of the transit metropolis, which has improved
the traffic situation. According to Schrank’s definition of the traffic congestion coefficient [42], when
the traffic congestion coefficient is greater than 2, urban traffic is in a moderately congested state;
when the traffic congestion coefficient is between 1 and 2, urban traffic is in a basically smooth state;
when the traffic congestion coefficient is less than 1, urban traffic is in a smooth state. If the proportion
of public transport investment is increased, the road saturation will be improved. It can be seen that
during the future development of Nanchang, it will be in a state of moderate congestion, and the
traffic situation in Nanchang will improve after 2022, indicating that the construction of the transit
metropolis will have had positive effects on Nanchang’s traffic.
Figure 17. Trend of road saturation in Nanchang.
5.3. Suggestions for the Transit Metropolis Construction of Nanchang city
Nanchang City needs to complete the requirements of the transit metropolis construction, and
the share of public transport motorized travel needs to reach 60%. According to the simulation
results, Nanchang City cannot achieve this goal in 2020. In the SD model, we adjusted the relevant
indicators of Nanchang’s transit metropolis construction to find a way to reach the share rate
indicator by the end of 2020. The proportion of public transport investment in the total transportation
investment was adjusted from 0.25 to 0.325; that is, about 900 additional buses were added to get a
new share of public motor vehicle travel in Nanchang. According to Figure 15, at the end of 2020,
Nanchang’s public motor vehicle travel sharing rate will reach 61%, which is in line with Nanchang’s
transit metropolis construction index, and which indicates that Nanchang should increase its
investment in public transport vehicles and infrastructures. It is still unable to meet the needs of
residents’ travel. It is recommended to: (1) increase the number of buses, and (2) optimize the bus
routes in Nanchang to reduce the transfer rate of public bus trips.
According to the simulation results of the above model, the vehicle emissions and pollutant
emission speed of Nanchang City are increasing year by year. New energy vehicles are being
promoted at home and abroad to reduce vehicle emissions. Moreover, the Transit Metropolis
2008 2010 2012 2014 2016 2018 2020 2022

Sustainability 2020, 12, 3028 23 of 25
Creation Project clearly puts forward that the proportion of green public transport vehicles is an
important assessment indicator. Therefore, through the construction of a transit metropolis, vehicle
pollutant emissions will be improved. By adjusting the annual vehicle exhaust emissions from 0.05
tons to 0.04 tons per year a new cumulative nitrogen oxide emission in Nanchang can be obtained.
Compared with the current simulation value, the nitrogen oxide emissions have decreased by nearly
70%, which indicates that the current automotive nitrogen oxide emissions are too high, and low-
emission or new energy vehicles need to be developed. The creation of a transit metropolis will
effectively improve the urban transportation environment.
6. Conclusions
Taking Nanchang’s transit metropolis construction and its indicators as the starting point, the
SD software Vensim is used to model some easily quantifiable indicators of Nanchang’s transit
metropolis. The core indicator of Nanchang’s transit metropolis construction is the public transport
motorization share rate, and nitrogen oxide emissions and traffic congestion coefficients were
forecasted to illustrate the effect of Nanchang’s transit metropolis construction. Due to the similarity
of the indicators of the transit metropolis, the research results can be extended to other cities that
struggle to become National Transit Metropolis Demonstration Cities.
Due to the rapid development of public transportation in Nanchang, the traffic data of Nanchang
found on the Internet have a certain lag, and the SD model established this time only selects some of
the core indicators of the construction of the transit metropolis, and the system indicators for
modeling and evaluating need further improvement. In the future development process, due to the
popularity of big data and intelligent transportation, many traffic data can be easily collected, which
can also be updated and constructed more dynamically to improve the accuracy of the model.
Actually, the SD model has a delay phenomenon. Delay is a process whose output lags behind
its input in some modes. For simplicity, this article ignores these delays and they need to be
considered further in future research. Additionally, both the system dynamics and nonlinear
specification of public transportation supply and demand, as well as related causal relations and
cost/evaluation methods need further and deeper research.
Author Contributions: The individual contributions and responsibilities of the authors are listed as follows: Y.X.
designed the research, developed the model, conducted model validation, and wrote the paper; L.C. guided the
research process; K.W. collected and analyzed the data; J.A. revised the manuscript, provided some comments
and helped edit the manuscript; H.G. provided some comments on the case study and edited the manuscript.
All authors have read and agreed to the published version of the manuscript.
Funding: This research was sponsored by the National Natural Science Foundation of China (Grant No.
71961006 and 71971005), the Social Science Planning Fund of Jiangxi Province, China (No.18GL37), the College
Humanities and Social Sciences Fund of Jiangxi Province, China (No. GL18219), and the Postdoctoral Research
Foundation of Southeast University (No.1121000301).
Acknowledgments: The authors give thanks to the Nanchang Public Traffic Company for operational data. The
authors are also very grateful for the comments from the editor and the anonymous reviewers.
Conflicts of Interest: The authors declare no conflict of interest.
References
1. Xue, Y.; Fan, H.; Guan, H. Commuter Department Time Choice Considering Parking Space Shortage and
Commuter’s Bounded Rationality. J. Adv. Transp. 2019, 4, 1–7.
2. Miller, P.; De Barros, A.G.; Kattan, L.; Wirasinghe, S.C. Public Transportation and Sustainability: A Review.
KSCE J. Civ. Eng. 2016, 20, 1076–1083.
3. Ghorbanzadeh, O.; Moslem, S.; Blaschke, T.; Duleba, S. Sustainable urban transport planning considering
different stakeholder groups by an interval-AHP decision support model. Sustainability 2018, 12, 1–18.
4. Shi, W.; Yu, C.; Ma, W.; Wang, L.; Nie, L. Simultaneous optimization of passive transit priority signals and
lane allocation. KSCE J. Civ. Eng. 2020, 24, 624–634.

Sustainability 2020, 12, 3028 24 of 25
5. Jia, G.; Ma, R.; Hu, Z. Urban transit network properties evaluation and optimization based on complex
network theory. Sustainability 2019, 4, 1–16.
6. Sinha, R.; Olsson, L.E.; Frostell, B. Sustainable personal transport modes in a life cycle perspective-public
or private? Sustainability 2019, 12, 1–13.
7. Bagloee, S.A.; Sarvi, M.; Ceder, A. Transit priority lanes in the congested road networks. Public Transp. 2017,
9, 571–599.
8. Currie, G.; Sarvi, M.; Young, B. A new approach to evaluating on-road public transport priority projects:
Balancing the demand for limited road-space. Transportation 2007, 34, 413–428.
9. Li, Z.; Li, Y.; Sun, Y.; Li, H.; Yang, L.; Shi, Y.; You, X. A stydy on the research status quo of sustainable
preferential development of public transportation in large and medium-sized citie. J. Beijing Jiaotong Univ.
Soc. Sci. Ed. 2013, 12, 37–46, 51. (In Chinese)
10. Department of Road Transport, M.O.T. Notice of the Ministry of Transport on Printing and Distributing the
“Transit Metropolis Assessment and Evaluation Index System”; Jiao Yunfa [2013] No. 387; China
Communications Press: Beijing, China, 2013.
11. Cervero, R. The Transit Metropolis: A Global Inquiry, 4th ed.; Island Press: Washington, DC, USA, 1998.
12. Cervero, R. The transit metropolis: A 21st century perspective. Transp. Land Useenviron. Plan. 2020, 1, 131–
149.
13. Handy, S. Reviews: The transit metropolis: A global inquiry. J. Plan. Educ. Res. 1999, 19, 107–109.
14. Zhou, J. The transit metropolis of Chinese characteristics? Literature review, interviews, surveys and case
studies. Transp. Policy 2016, 51, 115–125.
15. Jiang, T.; Song, M.; Jiang, Y.; Li, M.; Zou, H. Toward transit metropolis: Status quo analysis for Chinese
major cities. Procedia-Soc. Behav. Sci. 2013, 96, 2621–2634.
16. Chen, X.; Ye, J.; Yang, T. The plight of urban public transportation priority and potential solutions. Urban
Transp. China 2013, 11, 17–25.
17. Liu, L. Theoretical source of public bus cities and advices on multiple construction. Urban Manag. 2013, 45,
44–48. (In Chinese)
18. Yu, Q.; Gu, T. Analysis of the policy differences “transit priority” to “transit metropolis” in Shanghai.
Theory Pract. Dev. Reform 2017, 11, 25–28. (In Chinese)
19. Ding, C.; Wang, Y.; Lin, Y. Analysis on the relationship between transit metropolis strategy and TOD mode:
From the perspective of low-carbon travel. Urban Plan. 2013, 11, 54–61. (In Chinese)
20. An, M.; Chen, X.; Zhu, Y. Research on the differences between “Transit Metropolis” and “Transit Priority”.
J. Transp. Eng. Inf. 2015, 13, 85–89. (In Chinese)
21. Yu, H.; Wang, S.; Shi, Y. Research on the relationship between land use and public transport under the
establishment of transit metropolis: A case study of Nanjing city. Traffic Eng. 2018, 18, 14–21. (In Chinese)
22. Xue, Y.; Guan, H.; Corey, J.; Zhang, B.; Yan, H.; Qin, H. Transport Emissions and Energy Consumption
Impacts of Private Capital Investment in Public Transport. Sustainability 2017, 10, 1–19.
23. He, J.; Zhang, C.; Hang, W. Complex Transportation Problems Policy Decision-Making Modeling based on the
System Dynamics Method; Communications Press Co., Ltd.: Beijing, China, 2016. (In Chinese)
24. Fontoura, W.B.; de Lorena Diniz Chaves, G.; Ribeiro, G.M. The Brazilian urban mobility policy: The impact
in São Paulo transport system using system dynamics. Transp. Policy 2019, 73, 51–61.
25. Tan, Y.; Jian, L.; Shai, C.; Shen, L. A system dynamics model for simulating urban sustainability
performance: A China case study. J. Clean. Prod. 2018, 199, 1107–1115.
26. Egimez, G.; Tatari, O. A dynamic modelling approach to highway sustainability: Srategies to reduce overall
impact. Transp. Res. Part A 2012, 46, 1086–1096.
27. Barisa, A.; Rosa, M. A system dynamics model for CO2 emission mitigation policy design in road transport
sector. Energy Procedia 2018, 147, 419–427.
28. Liu, X.; Ma, S.; Tian, J.; Jia, N.; Li, G.A. system dynamics approach to scenario analysis for urban passenger
transport energy consumption and CO2 emissions: A case study of Beijing. Energy Policy 2015, 85, 253–270.
29. Liu, S.; Triantis, K.P.; Sarangi, S. A framework for evaluating the dynamic impacts of a congestion pricing
policy for a transportation socioeconomic system. Transp. Res. Part A-Policy Pract. 2010, 44, 596–608.
30. Thaller, C.; Niemann, F.; Dahmen, B.; Clausen, U.; Leerkamp, B. Describing and explaining urban freight
transport by System Dynamics. Transp. Res. Procedia 2017, 25, 1075–1094.
31. Huang, W.; Li, X. Application of system dynamics for evaluating truck weight regulations. Transp. Policy
2010, 17, 240–250.

Sustainability 2020, 12, 3028 25 of 25
32. Pagoni, E.G.; Patroklos, G. A system dynamics model for the assessment of national public-private
partnership programmes’ sustainable performance. Simul. Model. Pract. Theory 2019, 97, 1–28.
33. Forrester, J.W. 479 Industrial Dynamics; Wiley-Interscience: New York, NY, USA, 1961.
34. Wang, Q. System Dynamics.;Shanghai University of Finance and Economics Press, Shanghai, China,
2009. (In Chinese)
35. Sterman, J.D. Business Dynamics, Systems Thinking and Modeling for a Complex World; Irwin McGraw-Hill:
New York, NY, USA, 2000.
36. Zhong, Y.; Jia, X.; Qian, Y. System Dynamics, 2nd ed.; Science Press: Beijing, China, 2013. (In Chinese)
37. Statistics, N.B.O. Nanchang Economic and Social Statistical Yearbook; China Statistics Press: Beijing, China,
2017. (In Chinese)
38. Xu, T. A System Dynamics Study of the Impact of Beijing’s Transportation Policy; Beijing Jiaotong University:
Beijing, China, 2014. (In Chinese)
39. Shreckengost, R.C. Dynamic Simulation Models: How Valid are They? Self-Report Methods of Estimating Drug
Use: Current Challenges to Validity; Office of Science of the National Institute on Drug Abuse: Washington,
DC, USA, 1985.
40. Forrester, J.W.; Senge, P.M. Tests for building confidence in system dynamics models. In TIMS Studies in
the Management Science; North Holland Press: Amsterdam, The Netherlands, 1980.
41. Sun, G. Research on Price Linkage Strategy of Public Transport of City. Ph.D. Thesis, Harbin Institute of
Technology, Harbin, China, 2013. (In Chinese)
42. Schrank, D.; Lomax, T. Urban Mobility Report; Texas Transportation Institute, The Texas A&M University
System: College Station, TX, USA, 2001.
© 2020 by the authors. Licensee MDPI, Basel, Switzerland. This article is an open access
article distributed under the terms and conditions of the Creative Commons Attribution
(CC BY) license (http://creativecommons.org/licenses/by/4.0/).