Embed Size (px)
Citation preview

Articulatory Timing of English Consonant Clusters in the Coda
Positions: A Study of Chinese-English Interlanguage
by
Yanan Fan
B.A. Nantong University, 2009
A Thesis Submitted in Partial Fulfillment of the
Requirements for the Degree of
MASTER OF ARTS
in the Department of Linguistics
© Yanan Fan, 2011
University of Victoria
All rights reserved. This thesis may not be reproduced in whole or in part, by photocopy
or other means, without permission of the author.

ii
SUPERVISORY COMMITTEE
Articulatory Timing of English Consonant Clusters in the Coda Positions:
A Study of Chinese-English Interlanguage
by
Yanan Fan
B.A. Nantong University, 2009
Supervisory Committee
Dr. Hua Lin (Department of Linguistics)
Supervisor
Dr. Li-shih Huang (Department of Linguistics)
Departmental Member

iii
ABSTRACT
Supervisory Committee
Dr. Hua Lin (Department of Linguistics)
Supervisor
Dr. Li-shih Huang (Department of Linguistics)
Departmental Member
The present study adopted Articulatory Phonology as a theoretical framework to
investigate the aticulatory timing of English consonant clusters. Both native and
non-native (Mandarin ESL learners) speakers‘ performances were of interest. An acoustic
approach was taken to explore the consonantal overlap in both native and non-native
English speakers‘ production. Also investigated in the present study were the factors that
influence the overlap between consonants.
Thirty-one native Mandarin speakers and eight native Canadian English speakers
participated in the study. The thirty-one native Mandarin speakers were divided into three
proficiency groups according to a pretest which evaluated Mandarin speakers‘ English
speaking proficiency. The experiment of the study was a reading task. Participants were
instructed to put the words ending with the target consonant clusters in four carrier
sentences and read them aloud. In total, 256 tokens (20 clusters×2 vowel environments×4
carrier sentences+12 consonants×2 vowel environments×4 carrier sentences) were
recorded for each participant. The duration of each segment in the word was measured in
the phonetic software, Praat. Three timing ratios: consonant to cluster, cluster to a pair of
individual consonants, and cluster to rime were calculated.

iv
Repeated measures ANOVAs showed significant effect for place of articulation and
manner of articulation on the articulatory timing of English consonant clusters in the coda
position. Meanwhile, voicing feature, as an unexpected factor, was also reported to be an
influential factor. More detailed analysis revealed that heterorganic clusters have more
overlap than homorganic clusters. Within heterorganic clusters, a tongue tip consonant is
more overlapped by a following tongue body consonant than a tongue body consonant is
by a following tongue tip consonant. For manner of articulation, stops are found to be
more overlapped by a following stop than by a following fricative. Overlapping caused by
voicing feature was an unexpected outcome found in the present study. Voiceless
consonant clusters have more overlap than voiced clusters.
The difference between native and non-native speakers is also of interest. With
respect to the amount of overlap, native speakers have more overlap than non-native
speakers. Moreover, statistic tests reported a significant effect for proficiency group.
From the comparison of mean values of three ratios, the performance of advanced group
was close to native speakers. And intermediate and low groups exhibited similar
performance.

v
TABLE OF CONTENTS
SUPERVISORY COMMITTEE……………………………………………………….………..ii
ABSTRACT…………………………………………………...…………………………………iii
TABLE OF CONTENTS………………………………………………………………………...v
LIST OF TABLES……………………………………………………..………………………..vii
LIST OF FIGURES……………………………………………………..……………………...viii
ACKNOWLEDGEMENTS……………………………….……………………………………ix
Chapter One ......................................................................................................................... 1
INTRODUCTION ........................................................................................................ 1
1.1 Purpose of the present study ........................................................................... 1
1.2 Motivation of the present study ....................................................................... 1
1.3 Research questions and hypothesis .................................................................. 5
1.4 Structure of the thesis ...................................................................................... 7
Chapter Two ......................................................................................................................... 8
LITERATURE REVIEW ............................................................................................. 8
2.1 Mandarin and English Phonotactics ................................................................ 8
2.2 Mandarin ESL learners‘ acquisition of English consonant clusters .............. 11
2.3 Different accounts for difficulties in acquisition of second language
consonant cluster ................................................................................................. 14
2.4 Articulatory Phonology ................................................................................. 17
2.5 Articulatory timing in second language consonant clusters .......................... 29
2.6 Summary ....................................................................................................... 32
Chapter Three .................................................................................................................... 35
THE EXPERIMENT .................................................................................................. 35
3.1 The participants ............................................................................................. 35
3.2 Speech materials ............................................................................................ 36
3.3 Data collection procedure ............................................................................. 39
3.4 Data analysis ................................................................................................. 40
3.5 Statistic analysis ............................................................................................ 46
Chapter Four ..................................................................................................................... 49
RESULTS AND ANALYSES .................................................................................... 49
4.1 Results on Speaking Task .............................................................................. 49
4.2 Results on stop-stop clusters ......................................................................... 52
4.3 The results on stop-fricative clusters ............................................................. 63
4.4 Results on fricative-stop clusters .................................................................. 70
4.5 Results on liquid-stop and nasal-stop clusters .............................................. 78
4.6 Manners of articulation ................................................................................. 82
Chapter Five ...................................................................................................................... 87
GENERAL DISCUSSION ......................................................................................... 87
5.1 The overlap between English consonants ..................................................... 87
5.2 Place of articulation ....................................................................................... 89
5.3 Manner of articulation ................................................................................... 92

vi
5.4 The effect of voicing feature on articulatory timing ..................................... 94
5.5 The group difference in articulatory timing .................................................. 95
Chapter Six ........................................................................................................................ 99
CONCLUSION .......................................................................................................... 99
6.1 Summery of the research ............................................................................... 99
6.2 Implications..........................................................................................................102
6.3 Limitation .................................................................................................... 104
6.3 Future research ............................................................................................ 105
References ........................................................................................................................ 106
Appendix 1....................................................................................................................... 117
Appendix 2....................................................................................................................... 121
Appendix 3………………………………………………………………………………………………………………… 123

vii
LIST OF TABLES
Table 3-1………………………………………………………………………………….36
Table 3-2………………………………………………………………………………….37
Table 3-3………………………………………………………………………………….41
Table 4-1………………………………………………………………………………….50
Table 4-2………………………………………………………………………………….52
Table 4-3………………………………………………………………………………….53
Table 4-4………………………………………………………………………………….54
Table 4-5………………………………………………………………………………….55
Table 4-6………………………………………………………………………………….56
Table 4-7………………………………………………………………………………….59
Table 4-8………………………………………………………………………………….62
Table 4-9………………………………………………………………………………….63
Table 4-10………………………………………………………………………………...66
Table 4-11………………………………………………………………………………...67
Table 4-12………………………………………………………………………………...69
Table 4-13………………………………………………………………………………...71
Table 4-14………………………………………………………………………………...73
Table 4-15………………………………………………………………………………...75
Table 4-16………………………………………………………………………………...77
Table 4-17………………………………………………………………………………...77
Table 4-18………………………………………………………………………………...78
Table 4-19………………………………………………………………………………...81
Table 4-20………………………………………………………………………………...82
Table 4-21………………………………………………………………………………...84
Table 4-22………………………………………………………………………………...85
Table 5-1………………………………………………………………………………….97

viii
LIST OF FIGURES
Figure 2-1……………………………………………………………………………….....9
Figure 2-2………………………………………………………………………………...23
Figure 2-3………………………………………………………………………………...24
Figure 2-4………………………………………………………………………………...25
Figure 3-1………………………………………………………………………………...43
Figure 4-1………………………………………………………………………………...55
Figure 4-2………………………………………………………………………………...57
Figure 4-3………………………………………………………………………………...60
Figure 4-4………………………………………………………………………………...64
Figure 4-5………………………………………………………………………………...66
Figure 4-6………………………………………………………………………………...68
Figure 4-7………………………………………………………………………………...74
Figure 4-8………………………………………………………………………………...75
Figure 4-9………………………………………………………………………………...79
ix
ACKNOWLEDGEMENTS
The study presented here would not be possible without the support and guidance of great
many individuals. First, I would like to thank all the participants in my study. They
volunteered their invaluable time to this research. Without their generous participation,
the completion of this study would have been impossible. Second, I would like to thank
my supervisory committee members. I wish to first express my gratitude to my supervisor,
Dr. Hua Lin, for her guidance, care and support throughout my MA program. It was her
who turned the light on and led me into the fascinating area of second language phonetics
and phonology. And it was her who systematically guided me into the much neglected
area of the durational aspect of L2 phonetics and phonology. Her constant words of
encouragement and always being available for support helped me go through the first
year in Canada, and her patience and stimulating and encouraging comments
accompanied me during my thesis composition. This thesis benefited much from her
careful perusals of the drafts and extensive comments. The thesis would not have been
possible without her constant support. I also wish to thank my committee member, Dr.
Li-shih Huang, for her creative thoughts and enthusiasm on my study. She generously
shared her expertise in applied linguistics with me and constantly offered her support to
my study. A special thank goes to Dr. Richard King, my external examiner, for his
insightful feedback and suggestions.
Outside of my supervisory committee, I have many people to thank, too. I thank Dr. Ewa
Czaykowska-Higgins for bring about the issue of consonant clusters to me last year in the
course Ling. 503. Her interesting lectures and valuable reading materials inspired me at

x
the first stage of this study. I thank Chris Coey for preparing the equipment for my
experiments and technological support in the data collection process. I thank Trish
Hannigan and Nicholas Travers for being the native English speaker judges in my study.
I‘m also grateful to my friends Li Ji, Buyun Xu and Peng Li. They shared their
knowledge in computer science and statistics with me and helped me improved the study.
My thanks also go to the UVic faculty and staff members who have kindly supported me.
Last, I wish to extend my sincere gratitude to my family and friends. During the two and
half years study in Canada, the love and nice words from my family helped me go
through all those difficulties, lose and depression. I thank my boyfriend, Yunfeng Xu, for
his encouraging words and strong support during my MA program in Canada. I also thank
all my friends Alice, Akitsugu, Carolyn, Chong, Chris, Dingding, Kate, Shu-min,
Xiaoqian and Xiaojuan for their friendly support during my thesis composition.

Chapter One
INTRODUCTION
1.1 Purpose of the present study
The present study adopts an articulatory approach to investigate Mandarin-English
speakers‘ production of English consonant clusters in the coda position. The study
explores Mandarin-English speakers‘ management of English consonant clusters,
identifies and explains the similarities and differences between second language
production and native production.
The articulatory approach involves measuring articulatory timing of target English
consonant clusters produced by both Mandarin speakers and Canadian English speakers.
In the present study, the articulatory timing is measured in terms of following duration
ratios: consonant to cluster, cluster to pair of individual consonants, and cluster to rime
(See section 3.4.3).
1.2 Motivation of the present study
Consonant clusters are a common feature of many languages. Locke (1983)
surveyed 104 world languages and reported that 48% of these languages have consonant
clusters in both word-initial and word-final positions. Although consonant clusters are

2
common among many languages, they are considered as typologically marked structures
according to Greenberg‘s (2005) typological markedness theory. In language acquisition,
children learning to produce consonant clusters have found the task challenging (McLeod,
van Doorn, & Reed, 2001). Similarly, second language learners encounter difficulties in
learning non-native consonant clusters. Contrastive Analysis Hypothesis (Lado, 1957)
predicts that second language learners have difficulties in non-native consonant clusters
which are not allowed in their native languages. Mandarin (Hansen, 2001), Japanese and
Korean (Eckman, 1991) ESL learners were found to have low accuracy for English
consonant clusters. All the three Asian languages do not allow consonant clusters. Even
for learners whose native language does have consonant clusters, they may still not be
able to produce target-like second language consonant clusters. For instance,
Spanish-English learners were found to insert a vowel before word initial /sC/ clusters
(Barlow, 2005), even though Spanish has consonant clusters. Thus, consonant clusters
seem to cause difficulties for second language learners regardless of their native
languages.
Many famous second language theories, such as L1 language transfer (James, 1988),
Contrastive Analysis Hypothesis (Lado, 1957), Markedness Differential Hypothesis
(Eckman, 1977), and Minimal Sonority Distance (Broselow & Finer, 1991) indicate that
various linguistic factors all play important roles in the production and perception of
second language consonant clusters. In Mandarin speakers‘ production of English
consonant clusters, native syllable structure plays an important role. For example,
Mandarin ESL learners showed lower accuracy for the consonant clusters in the preterit

3
form than in the lexical words, because there is no inflectional morpheme in Mandarin
(Bayley, 1996). Also, the modification strategies (deletion and vowel insertion) Mandarin
ESL learners used to repair the consonant clusters (Hansen, 2001) may be influenced by
Mandarin syllable structure constraint that complex onsets and complex codas are not
allowed. ESL learners, including Mandarin speakers, acquired two-member consonant
clusters before three-member consonant clusters (Hansen, 2001; Yoo, 2004). In this case,
markedness plays a role in the acquisition.
However, the second language production is complicated and variable. The above
impressionistic explanations still cannot explain many of the situations in ESL learners‘
production of consonant clusters. New scopes are needed to investigate more detailed
situations. For example, English consonant clusters /ft/ and /st/ have the same sonority
distance. If learners have relatively similar performance, in terms of accuracy rate and
modification strategies, on the two clusters, it can be more ready to claim that the above
mentioned linguistic factors influence ESL learners‘ production of English consonant
clusters. However, if learners have significantly different performance on the two clusters,
other factors may be considered as the major factor that influence ESL learners‘
production. In this case, the only difference between the two clusters is the place and the
manner of articulation. Thus, articulation may be suspected to be a possible factor
affecting learners‘ production. In fact, previous study by Davidson, Jusczyk, &
Smolensky (2004) found that English-Russian learners performed differently on /zm/ and
/vn/ in terms of accuracy. Neither language transfer, markedness theory or sonority
distance can explain the significant difference. In sum, the above linguistic factors can

4
only explain second language consonant clusters in a general way. For more detailed
situation, the pure phonological factors may only play a limited role.
Ohala (1983) proposed that the incorporation of phonetics into phonology is regarded
as a necessary prerequisite to the solution of phonological problems in general.
Articulatory Phonology (Browman & Goldstein, 1986) is an executor of this approach,
which addressed phonetics in phonology. Articulatory Phonology considers the
phonological representation as the description of organized patterns of coordinated
articulatory gestures. This approach provides phonological representation with a physical
and phonetic background, which is a great step of phonology. As a result, Articulatory
Phonology brings new scope in studies of consonant clusters. Recently, researchers
started to reanalyze the consonant clusters in terms of gesture overlap. Take place
assimilation for example. The gestural coordination between two consonants is
investigated to explore how the assimilation happens.
However, in second language phonology, the ariticulatory studies on second language
consonant clusters seem to be scanty. Most of the previous research on second language
consonant clusters takes a pure phonological perspective. Within the limited amount of
second language consonant clusters research in Articulatory Phonology, only
Russian-English and English-Russian speakers‘ production were investigated. Two
notable exceptions are Davidson‘s (2003, 2006) study which investigated the gestural
overlap in Russian speakers‘ production of English consonant clusters and Zsiga‘s (2003)
study of native language transfer in articulatory timing by English-Russian and
Russian-English speakers. More articulatory studies of second language consonant

5
clusters are called for to bridge the gap.
In order to extend our knowledge of articulatory coordination in second language,
this study investigates Mandarin speakers‘ production of English consonant clusters
within the framework of Articulatory Phonology and tries to find factors that influence
learners‘ production of consonant clusters in terms of articulatory timing. Mandarin does
not allow consonant clusters in its phonotactics, which is different from those of English
and Russian. Mandarin speakers‘ performance may therefore be different from that of
Russian and English speakers. So the present study tries to provide more comprehensive
knowledge on ESL learners‘ production on consonant clusters.
1.3 Research questions and hypothesis
The goal of this study is to investigate the consonantal coordination in English
consonant clusters in the coda position by both native English speakers and Mandarin
ESL learners. Based on Articulatory Phonology, it is hypothesized that learners‘ foreign
accent and difficulties in consonant clusters are due to their failure to manage the
articulatory timing of target consonant clusters. It is found that the position of the
consonant cluster may influence the coordination of the consonant cluster (Byrd, 1996a,
1996b). Meanwhile, with respect to consonantal overlap, most of the previous research
about consonant clusters focused on the clusters across the syllable boundaries (Davidson,
2005a, 2005b; Zsiga, 2000, 1992; Byrd, 1996a, 1996b; Browman & Goldstein, 1988,
1990b). Thus, this study focuses on the consonant clusters in the coda position. The
research questions come from four perspectives: (1) the amount of consonantal overlap in

6
both Canadian English speakers‘ and Mandarin ESL learners‘ production of the clusters in
question; (2) the influential factors in articulatory timing in both Canadian English
speakers‘ and Mandarin ESL learners‘ production of the clusters in question; (3) the
relationship between articulatory timing and learners‘ L2 language proficiency; (4)
Mandarin ESL learners‘ modification strategies in producing English consonant clusters.
The specific research questions are as follows:
a. How do two adjacent English consonants coordinate in the coda position? Can
Mandarin ESL learners manage the coordination? What‘s the difference in the
production by native Canadian English speakers and Mandarin ESL learners in
terms of consonantal coordination in consonant clusters?
b. Do place of articulation and articulatory manner influence the articulatory timing?
Does this influence happen in both native Canadian English speakers‘ and
Mandarin speakers‘ production of English?
c. Does Mandarin ESL learners‘ language proficiency, especially speaking
proficiency, play a role in the consonantal coordination in coda position?
d. What kinds of modification strategies do Mandarin ESL learners use to alter
English consonant clusters? Does articulatory timing play a role in these
strategies?
An experiment on the English production by native Canadian English speakers and
Mandarin ESL learner is carried out in order to answer the questions above.

7
1.4 Structure of the thesis
This thesis is organized as follows: Chapter 1 provides the rationale of this study and
specific research purposes, and questions. Chapter 2 provides background information on
previous research about consonant clusters in both first and second languages. The
Articulatory Phonology, as the theoretical framework of this thesis, is also introduced in
this chapter. Chapter 3 describes the methodology and analyses of this study. Chapter 4
presents the results from both acoustic and statistical analyses and discusses the relation
between learners‘ accuracy, articulatory timing, and language proficiency. Chapter 5
further discusses the key findings and their theoretical implications for L2 speech
production. Chapter 6 concludes the thesis, identifies the limitation of the study, and
suggests future research.
8
Chapter Two
LITERATURE REVIEW
Consonant clusters, a common feature of many languages, interest researchers in
both the theoretical and the applied field, and the acquisition of consonant clusters by
learners are well documented by the previous studies. This chapter starts with the
comparison between Mandarin phonotactics and English phonotactics to have a better
understanding of learners‘ native language. Then, previous research on Mandarin ESL
learners‘ production and perception of English consonant clusters is reviewed (Section
2.2). The second section focuses on the previous theories and factors in second language
consonant clusters (Section 2.3). The third section introduces the framework of
Articulatory Phonology (2.4). Within this section, the basic concepts of Articulatory
Phonology (2.4.1), articulatory timing (2.4.2), and coordination of consonant clusters
(2.4.3) are examined. The next section reviews the limited number of studies on second
language consonant clusters in terms of articulatory timing (2.5). The last section
summarizes previous research and lists the remaining issues (2.6).
2.1 Mandarin and English Phonotactics
Before reviewing studies about Chinese ESL learners‘ performance in English
consonant clusters, the phonotactics of Mandarin Chinese should be reviewed, because

9
learners‘ native language plays a very important role in second language phonetics and
phonology.
The syllable structure is one of the most salient phonological characteristics of
Mandarin (Lin 2001). Traditionally, a Mandarin syllable is divided into two parts: the
initial and the final. The initial is the syllable initial non-glide consonant. The rest of the
syllable after the initial is the final. The maximal syllable structure in Mandarin Chinese
is CGVX (C=consonant, G=glide, V=vowel, X=nasal or vowel) (See Lin, 2001). The
vowel of a syllable can be either a single vowel or a diphthong. The initial consonant can
be absent. And a single vowel can be a syllable in Mandarin.
Initial Final
(C) (G) V ({C, G*})
* Where G is a contextual variation of a high vowel, and C in the final is a nasal consonant.
Figure 2-1 The syllable structure of Mandarin (from, Lin, 2001, p. 30)
Putting the traditional Chinese analysis into Western Linguistics tradition, the
pre-nuclear glide will be considered as part of the rime. In this case, the single consonant
in the onset has a secondary feature. This secondary feature is not standing alone in the
consonant. Thus, Mandarin syllables do not allow complex onsets or codas. However,
some other researchers claimed that the pre-nuclear glide is part of the onset. Therefore,
complex onset is allowed in Mandarin. The position of glide is still an issue that has been
debated. This study adopts the view that Mandarin does not allow consonant clusters in
either onset or coda positions, because this approach is widely accepted in traditional

10
Chinese Linguistics.
Although Mandarin speakers do not have any experience of consonant clusters in the
coda position, they can manage some consonant clusters in the middle of the words across
a syllable boundary. In Mandarin Chinese disyllabic words, when the coda of the first
syllable is a nasal (/n/ or /ŋ/), the onset of the second syllable can be a plosive (e.g., běnbù,
[pɤn]₁₁₃[pu]₅₁, ―headquarters‖)1, a fricative (e.g., fēnshŏu, [fɤn]₅₅[ʂo]₁₁₃, ―break up‖), an
affricate (e.g., fēnqí, [fɤn]₅₅[tɕʰi]₃₅, ―difference‖), a liquid (e.g., běnlái, [pɤn]₁₁₃[lai]₃₅,
―original‖), and a nasal (e.g., běnnéng, [pɤn]₁₁₃[nɤŋ]₃₅, ―instinct‖).
English syllables contain an onset and a nucleus-coda rime. Onset or coda position
can be optional. A single vowel is obligatory in a syllable. The common syllable begins
with a consonant or more than one consonant. Similarly with the onset, consonant clusters
are also allowed in the coda position. Contrastive Analysis Hypothesis (Lado, 1957)
proposes that the difference between native language and target language will cause
learning difficulties in second language acquisition. Meanwhile, Markedness Differential
Hypothesis (Eckman, 1977) claimes that if a feature in the target language is more
marked than that in the native language, learners of the second language learners may
have trouble in learning this second language feature. Thus, the difference between
Mandarin and English syllable structure will lead to difficulties for Mandarin ESL
learners, since complex onset or coda is more marked than simple onset or coda.
1 The examples here are expressed in Pinyin, IPA and its relative meaning in English. Four Mandarin tones are described according to the Scale of Five Pitch Levels. The present study adopts Lin’s (2001) description about four basic tones as here: First Tone (₅₅), Second Tone (₃₅), Third Tone (₁₁₃), and Forth Tone (₅₁).

11
2.2 Mandarin ESL learners’ acquisition of English consonant clusters
Within the scanty number of studies about Mandarin ESL learners‘ acquisition of
English consonant clusters, two major issues were investigated: learners‘ production error
type and their modification strategies.
Weinberger (1987) found a clear relationship between the size of consonant clusters
and the accuracy of Mandarin speakers‘ production of English consonant clusters. In the
study, three speech tasks, word list, reading the paragraph, and storytelling were used.
Four types of Mandarin speakers‘ production errors were found to be increased as the size
of the consonant cluster increased. There was no clear relationship between task types and
production error.
Similar findings were made by Anderson (1987). Spontaneous speeches about a
certain topic were used to elicit consonant clusters. Both Mandarin and Arabic speakers
were involved in the study. The results reported that Mandarin speakers exhibited 50%
more modification in three-member codas than in one-member codas. The study also
showed that Mandarin speakers had more difficulties in producing longer English
consonant clusters in the coda position than in the onset position.
The modification strategies used by Mandarin speakers to ―fix‖ consonant clusters
were also investigated by the previous studies. Gui (2008) in a study about Mandarin ESL
learners acquisition of English consonants found that Mandarin speakers used feature
change, and epenthesis when they pronounced English consonant clusters in the coda
positions. This finding is in accordance with findings made in other previous studies
about Mandarin speakers‘ production of consonant clusters (Chan, 2007; Hansen, 2001;
12
Broselow et al, 1998). In her study, she pointed out that lack of some consonants, such as
/θ/, /Ʒ/, and /ʃ/ in Mandarin, caused difficulties in the acquisition of consonants for
Mandarin speakers. Meanwhile, the difference between Mandarin and English syllable
structures also lead to errors in ESL learning.
Yan and Cai (2004) showed that, besides the three major strategies above, Mandarin
ESL learners also used similar Mandarin consonants to replace English consonants which
do not exist in Mandarin. For example, Mandarin speakers used Chinese /s/ to replace /θ/.
She classified this strategy as substitution. In their study, 6 Mandarin ESL learners‘
production of English consonant clusters in both onset and coda position was analyzed.
Three types of strategies were identified: epenthesis, deletion and substitution. They
ranked the frequency of modification strategies by the participants. They found that
epenthesis is the most frequently used strategy, followed by deletion and substitution.
Optimality Theory (OT) was used to analyze the data. In English, the faithfulness
constraint DEP-IO ranks higher than markedness constraint *COMPLEX CODA. However,
in Mandarin, the markedness constraint ranks higher than the faithfulness constraint. They
claimed that the function of second language constraints was decreased by the constraints
in native language. Thus, native language plays an important role in second language
acquisition.
Hansen (2001) conducted a comprehensive study about Mandarin ESL learners‘
production of English consonant clusters. She tried to use different linguistic constraints
to explain the situation in Mandarin ESL learners‘ production. As a longitudinal study,
two sets of data were collected over the six months. The percentage of correct production
13
and modification were calculated. The results showed that epenthesis and feature change
are the common modification strategies for Mandarin ESL learners. Deletion may not be
a preferred modification strategy. Hansen also found that Mandarin speakers preferred
epenthesis in the English coda position to modify the consonant clusters. Three female
participants used significantly more epenthesis than feature change to repair the
consonant clusters. Hansen also reported two interesting insertion patterns CVCVC and
CVCCV used by Mandarin speakers to break up a two-member coda. She attributed this
strategy to the interaction between the linguistic environment and the universal
preferences of syllable structure. Why speakers use two different ways of insertion to
repair the non-native consonant clusters is a very interesting question. And for the
CVCCV pattern, even with the vowel insertion, there is still a consonant cluster in the
word. Can the universal preference of CV syllable structure fully explain the two patterns
of vowel insertion?
In sum, all the studies above investigate Mandarin ESL learners‘ production by
calculating the frequency or percentage of each type. Two major findings were reported
by previous studies of Mandarin ESL learners. The first, Mandarin ESL learners have
difficulties in English consonant clusters and the difficulties interact with the size of the
clusters. Second, the common modification strategies are epenthesis and feature change
used by Mandarin ESL learners. Other strategies, for example, deletion and substitution,
are also found but not preferred. None of the studies above explore ESL learners‘
production from a phonetic perspective.

14
2.3 Different accounts for difficulties in acquisition of second language consonant
cluster
Acquisition of second language consonant clusters is well-documented in the
previous research. Prior studies about second language consonant clusters usually explain
the difficulties or errors in terms of native language transfer, markedness, sonority
difference and lexical frequency.
Native language transfer has been considered as the predominant factor of foreign
accent in second language acquisition. A large number of studies investigated the native
language transfer in the acquisition of second language consonant clusters. Broselow
(1987) reported that when English speakers were learning Arabic, they tended to assign
the first consonant in a word initial cluster to the last syllable of the preceding word
ending in a vowel. Furthermore, such assignment occurred no matter how familiar the
learners were with the words. He used contrastive analysis to explain that English
speakers applied English syllabification rules when perceiving and producing Arabic
words. Besides native phonotactics, the process of native morphology is also transferred
to the acquisition of non-native consonant clusters. Bayley (1996) found that Mandarin
speakers had more deletion when the consonant cluster is in the preterit form than in the
lexical words. In the discussion, the author proposed that lack of inflectional morphemes
in Mandarin resulted in the deletion in the clusters with inflectional morphemes. In short,
possible L1 phonological interference includes: syllable structure—syllabification rules,
phonotactics, liaison rules, etc.
Studies in markedness explained second language learners‘ different accuracies in

15
different types of consonant clusters. A large number of studies, especially longitudinal
studies, found second language learners acquired the clusters in the onset before those in
the coda position and acquired two-member clusters before three-member clusters in
different target languages (Yoo, 2004; Hansen, 2001; Carlisle, 1998; Eckman & Iverson
1993, 1994). Some previous studies also used markedness to explain learners‘ acquisition
progress. Yoo (2004) investigated phonological development in the production of English
consonant clusters made by Korean children. The data were collected from 18 children
three times during the period of 3 years. In the study, she proposed Korean-English
children‘s acquisition order: CC onset > CCC onset > CC coda > CCC coda. Yoo stated
that speakers will exhibit the unmarked version before producing the corresponding
marked version in the second language acquisition.
Sonority difference is another factor which leads to the accuracy difference for
different consonant clusters. Broselow and Finer (1991) interpreted markedness among
the consonant clusters in terms of the value of Minimal Sonority Distance (MSD). 24
Korean and 8 Japanese speakers participated in the study. The target clusters were in the
onset position. They found that learners had more difficulties in the clusters which are
relatively more marked according to the sonority distance than those that are relatively
less marked. Sonority distance defines a subset relationship among the classes of possible
syllable structures through sonority values across languages. Hansen (2001) showed that
73% of the modified English consonant clusters in her study violated the Universal
Canonical Syllable Structure (UCSS), which states that ―the sonority of segment…
increase(s) as the syllable nucleus is approached‖ (Herber, 1986, p 62). Carlisle (2006)

16
examined Spanish speakers‘ acquisition of /st/, /sl/ and /sn/ clusters. The results showed
that /sn/ was modified less than /sl/. According to Sonority Distance Principle, /sn/ is less
marked than /sl/. And the most modification was found in the production of /st/ cluster
which violates the UCSS or the Sonority Sequence Principle (SSP). However, in a study
conducted by Davidson, Jusczyk and Smolensky (2004) about Polish consonant clusters
which do not exist in English, they found that English speakers‘ accuracies were
significantly different for /zm/ and /vn/. The significant difference in accuracy cannot be
explained by sonority because /zm/ and /vn/ have the same sonority distance. Thus, they
concluded that sonority itself cannot fully explain the different accuracies. Meanwhile,
Eckman and Iverson (1993) proposed in their study that typological markedness itself
rather than sonority can explain learners‘ different accuracies for different clusters.
In addition to phonotactics, markedness and SSP, esearchers have also investigated
the role of lexical frequency in the acquisition of non-native consonant clusters. However,
these studies did not show a strong influence of frequency. Pitt (1998) found no
interference from frequency when English listeners perceived the consonant clusters
illegal in English. Davidson (2006) in her study about English speakers‘ production of
pseudo-Czech words which contained clusters that are positionally restricted legal in
English. The results didn‘t show any advantage for the more frequent clusters over the
less frequent clusters.
The acquisition of non-native consonant clusters is well-documented in the previous
studies. However, all the accounts stated above still cannot fully explain second language
learners‘ different performance in different clusters. For example, English speakers‘

17
accuracy was significantly higher in /zm/ cluster than in /vn/ cluster in Davidson, Jusczyk
and Smolensky‘s study (2004). Phonologically, the two clusters are both phonotactically
abnormal in English and have the same sonority distance. There are no cues to interpret
the relationship between the two clusters in terms of markedness. How can we explain
speakers‘ significantly different performance in this case? Phonetically, in the /vn/ cluster,
one more oral articulator – upper teeth is involved. Can this additional articulator cause
accuracy difference in learners‘ production? The participation of one more articulator may
cause great anticipatory coarticulation which may cause difficulties for second language
learners.
The present study takes a different perspective to analyze the acquisition of second
language consonant clusters. Based on the Articulatory Phonology, it is hypothesized that
second language learners may fail to acquire the articulatory timing patterns of the target
language. All the previous studies above addressed the issue only in a pure phonological
perspective. However, in the present study, the importance of learners‘ articulatory ability
or phonetic ability will be highlighted which gives the phonological problem a foundation
of articulatory phonetics.
2.4 Articulatory Phonology
The present study adopts Articulatory Phonology as the theoretical framework.
Browman and Goldstein proposed in 1986 that Articulatory Phonology unifies phonology
and phonetics into one model which aligns the units in the phonological level the same as
those in physical level. This model provides the abstract phonological issues with a

18
concrete physical base. This section introduces the major concepts of Articulatory
Phonology first. And then the importance of the articulatory timing in speech is addressed.
The last part of this section reviews the previous studies on consonant clusters in terms of
articulatory timing within Articulatory Phonology.
2.4.1 The theory of Articulatory Phonology
The advent of Articulatory Phonology is based on the recent technological and
theoretical development in speech production. The improvement of the technology of
recording continuous articulatory movement becomes the technological support for
Articulatory Phonology. The new technology provides more explicit physical
measurement of the articulators. Meanwhile, the development of the simplified
description of coordinated movement is the functional motivation of Articulatory
Phonology. The simplified description of coordination is analytical and mathematical
compared with previous descriptions (Browman & Goldstein, 1986). The aim of
Articulatory Phonology is to identify the discrepancies of phonology and phonetics and to
incorporate the two into one model by the idea that the concrete physical system
constrains the abstract phonological system.
The basic units of Articualatory Phonology are ―gestures‖. The Articulatory
Phonology claims that phonological structures are formed out of ―gestures‖, which are the
primary movement of the vocal tract articulators. Browman and Goldstein (1989) defined
―gestures‖ as ―the formation (and release) of a characteristic constriction within one of
the relatively independent articulatory subsystems of the vocal tract (i.e. oral, laryngeal,

19
velic)‖ (Browman & Goldstein, 1989, p. 1). The constrictions here can be formed by three
articulators: the lips, the tongue blade and the tongue body. In the definition of gestures,
the articulatory movement is inherent. Each gesture has an intrinsic time or duration.
The relation between gestures and phonological segments or phonological features is
not one-to-one. For example, a voiceless stop /p/ requires two gestures: a bilabial closure
gesture and a glottal opening gesture. The pattern of a set of gestures is called gestural
CONSTELLATION (Browman & Goldstein, 1986, p. 2). Thus, phonotactics within this
approach describes the possible combination of gestural constellations. A word in terms
of its gestural units and their organization is called a GESTURAL SCORE (Byrd, 1996b,
p. 140). Within the Articulatory Phonology, the lexical distinctions are limited into two
ways (Browman & Goldstein, 1995b). One is the presence and absent of a gesture; the
other is the temporal coordination difference between gestures. An utterance in this
approach is defined as ―an organized patterns of overlapping articulatory gestures‖
(Browman & Goldstein, 1986, p.219). And this organization is in both time and space.
The Articulatory Phonology provides a new link between phonological and physical
structure and incorporates timing into the basic definition of phonetic units. The approach
allows gestures to overlap in time and characterizes the overlap of articulatory gestures
with inherent timing, which can account for the acoustic variation. From the theory of
Articulatory Phonology, the importance of articulatory timing is fundamental. The
following section will discuss how articulatory timing works in the Articulatory
Phonology.

20
2.4.2 Articulatory timing
Articulatory timing is the time pattern that organizes the gestures to be a speech.
―The pattern of organization, or constellation, of gestures corresponding to a given
utterance is embodied in a set of phasing principles ... that specify the spatiotemporal
coordination of the gestures‖ (Browman & Goldstein, 1989, p. 211).
The importance of articulatory timing was addressed in the earlier studies. Lisker
(1974) from a phonetic perspective showed the importance of segmental timing in
language acquisition. He proposed that temporal differences are usually not linguistically
distinctive, but some linguistic contrasts ―depend essentially on a speaker‘s maintaining a
particular articulatory posture for a shorter or longer time interval‖ (p. 2389). And a lot of
phonetic studies (Abramson, 1962; Liiv, 1961; Nasr, 1960; Obrecht, 1965 for example),
which were mentioned in his article, confirmed his claim. Lisker‘s (1974) statement
suggested that segment timing is an important aspect that learners have to acquire during
the language acquisition.
Browman and Goldstein (1986) addressed the importance of articulatory timing by
analyzing the difference between released and unreleased stops. They argued that the
released and unreleased stops differ in the temporal overlap of adjacent gestures. This
difference in gestural overlap indicated that the organization of the interarticulator
temporal structure can cause different acoustic results.
Byrd (1996) pointed out the importance of speech timing from both phonological
and phonetic perspectives. First, articulatory timing is one of the way which leads to
different lexical representations; second, it reflects the ―interface between the

21
phonological representation and its overt realization as speech‖ (Byrd, 1996, p.143); third,
some particular phonological contrasts are realized by articulatory timing; forth, empirical
and phonetic evidences of prosodic structures are provided. Byrd (1996) stated that
articulatory timing is not with the respect of external clock, but with the respect of the
interrelation with some other gestures. In sum, articulatory timing is the essential of
speech formation. It is one way of realizing the abstract speech system. Also, some
segmental contrasts and lexical difference result from the difference in articulatory
timing.
The cross-language differences in articulatory timing have been pointed out by
Articulatory Phonology. Languages vary in the way they organize elements of speech in
time. The rhythm studies reflect this common knowledge and categorized the languages
as ‗‗stress-timing‘‘, ‗‗syllable-timing‘‘, and ‗‗mora-timing‘‘ (Pike, 1945; Hoequist, 1983),
according to units that a language will tend to use at regular intervals.
The difference in articulatory timing of different languages may happen at segmental
level, syllable level and beyond the syllable level. At the segmental level, vowels are
found to be longer before voiced obstruents than those before voiceless ones in many
languages, but the magnitude of this effect was found different across languages. In
English vowel duration was found to be significantly longer before voiced obstruents
(Flege, 1988). In French, although the vowel duration difference was significant, the
effect was small (Mack, 1982), and for Arabic, the vowels in the two different conditions
had almost the same duration (Flege, 1979). At the syllable level, the timing organization
is reflected by language specific phonotactics. Tajima, Port, & Dalby (1997) stated that

22
―to the extent that the elements comprising a syllable have durations associated with them,
the presence or absence of a segment (which may distinguish between a closed CVC
syllable and an open CV syllable) has direct consequences for both articulatory timing
and the temporal patterning of acoustic events‖ (p.2). For the level beyond the syllable,
languages also differ in the timing organization. Phrase and utterance final syllables were
found to be lengthened in both English and French (Delattre, 1966). But for the
non-phrasal final syllables, the duration is relatively similar for French, but greatly
different for English because of word stress (Levitt, 1991).
The cross-language differences in articulatory timing indicate that speech timing
patterns are part of grammar which will be acquired by children when they learn the
native language. Gafos (2002) stated ―linguistic grammars are conducted in part out of
this temporal substance. Language-particular sound patterns are in part patterns of
temporal coordination among gestures‖ (Gafos, 2002, p. 269). Thus, for second language
learners, articulatory timing patterns of the target language are also the indispensable
knowledge to be native-like. The incorrect management of non-native timing patterns
may lead to errors and foreign accent.
2.4.3 Articulatory timing of consonant clusters
In Articulatory Phonology, gestures are in time and over space. Since gestures are
physical acts, they are affected by other physical event during speaking. Gestures have
intrinsic duration. Thus, in the speech, gestures can overlap with each other. In Browman
and Goldstein‘s model (1986, 1989), gestures are coordinated to each other temporally.

23
The gestures are organized in a gesture score as follows:
larynx
lips
tongue body
Figure 2-2 Gesture scores of /pʰa/
The boxes represent different gestures. The length indicates the time during which
the articulators of each gesture are active. The two lines linking the gestures indicate that
gestures are temporally coordinated.
Based on this framework, Browman and Goldstein (1990b) investigated the
coordination of consonant clusters. They reported that in the consonant clusters, the first
consonant, which is perceived as deleted or assimilated in the place of articulation of the
second consonant, is still articulated and has corresponding gestures. The fact is that the
gesture of the first consonant is reduced or uncompleted or overlapped by the second
consonantal gesture. This finding was also confirmed by Barry (1985, 1991) and Nolan
(1992). This study provides the possibility that some pronunciation strategies in
consonant clusters, such as deletion and assimilation, may not be a pure phonological
process. Phonetic motivation may also play a role in the speech production.
Byrd (1996a) conducted an experimental study using Electropalatography (EPG) to
qualify the coordination of consonant clusters. He investigated two-member consonant
clusters (stop-stop, stop-s, and s-stop) in the word boundaries. Five English speakers were
Open
Bilabial, closed
Pharyngeal, narrow
24
recorded and EPG data were collected. He found the effect of consonantal place, manner
and the position on gestural reduction and overlap. Similar results were found in Byrd‘s
other studies (1996b, 1992, 1994). The findings show the variability of articulatory timing.
Therefore, in the language acquisition, speakers need to master the variation of
articulatory timing of the target language. According to the EPG pictures of the
movement of articulators, Byrd (1996a) also proposed four timepoints during each state
of consonant activity: ―first frame with any contact in the region, first frame at maximum
contact, last frame at maximum contact, and last frame with any contact in the region‖
(Bryd, 1996a). This EPG study provided physical and scientific evidence of gesture and
articulatory timing, which makes the concept of articulatory timing more concrete.
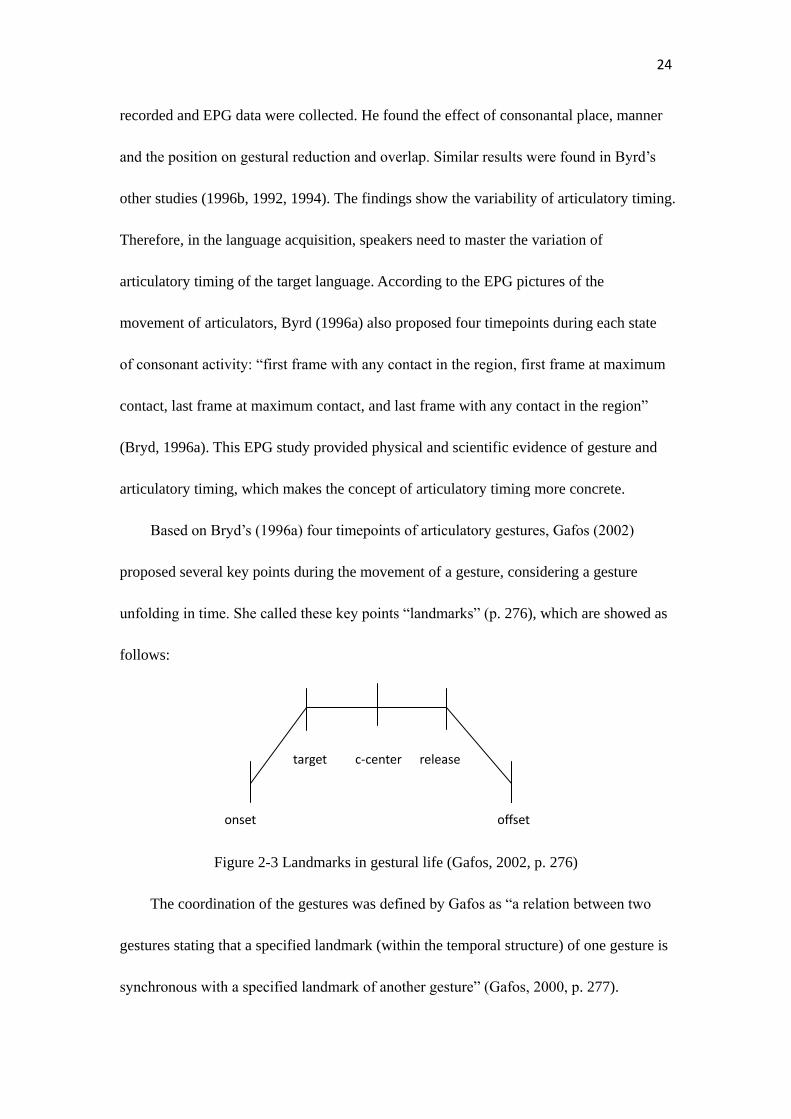
Based on Bryd‘s (1996a) four timepoints of articulatory gestures, Gafos (2002)
proposed several key points during the movement of a gesture, considering a gesture
unfolding in time. She called these key points ―landmarks‖ (p. 276), which are showed as
follows:
Figure 2-3 Landmarks in gestural life (Gafos, 2002, p. 276)
The coordination of the gestures was defined by Gafos as ―a relation between two
gestures stating that a specified landmark (within the temporal structure) of one gesture is
synchronous with a specified landmark of another gesture‖ (Gafos, 2000, p. 277).
onset
target
c
c-center release
offset

25
Coordination of gestures will have three types, which are shown in Figure 2-3. Two
gestures can be separated without any overlap (2c), or can have overlap (2b), or can have
significant overlap (2d). Gafos‘ approach provides the potential explanation of errors and
difficulties in second language learning. When second language learners face a non-native
sequence, they may have difficulties in pronouncing or organizing the gestures in a native
way which may result in a foreign accent.
Figure 2-4 The example of gesture coordination (Gafos, 2002, p. 277)
In terms of consonant clusters, Gafos (2002) proposed that the coordination of
consonant clusters is language specific, because the recoverability constraint2 is different
in any given language. In general, there are two kinds of gestural coordination. One is
called ―open transition‖ (Bloomfield, 1933, cited from Gafos, 2002) like in (2b), where
there is an intervening acoustic release between two consonants. The other is called
―close transition‖ (Bloomfield, 1933, cited from Gafos, 2002) like in (2c), where the
release of the first gesture occurs at the time of the target of the second gesture.
2 Recoverability constraint takes a perceptual perspective. According to the functional approach, there are two functional goals in phonology and phonetics: the minimization of articulation effort and the maximization of intelligibility. The speech is governed by the conflict of the two goals (Abrahamsson, 2003). The recoverability constraint emphasizes the maximization of listeners’ perception that speakers’ production should be recoverable to the original form. Weinberger (1996) proposed the recoverability principle that “Recoverable representations take precedence over unrecoverable ones” (p. 293).
b. Overlap
o
t
cc
r
roff
cc
cc=o
a. Landmarks
c. No overlap d. More overlap
roff=o r=t

26
In terms of Gafos‘s framework of gestural coordination of consonant clusters, some
modification strategies, such as vowel insertion and consonant insertion, were reanalyzed
as ―gestural mistiming‖ based on the gestural model. In first language production,
phonologists have already proposed that some of the inserted vowels are gestural
mistiming in some languages such as Hocank (Steriade, 1990), Scots Gaelic (Bosch,
1995), and Moroccan Colloquial Arabic and Sierra Popoluca (Gafos, 2002). Hall (2006)
proposed a cross-linguistic pattern of inserted vowels in which she clearly stated the
properties of epenthetic vowels and intrusive vowels (gesture mistiming). All these
previous studies are theoretical papers about data found in first language.
For English consonant clusters, there is a sufficient overlap within the two
consonants compared with Russian, Piro, and MCA (Zisga, 1996, 2000; Byrd, 1996a,
1992; Byrd & Tan, 1996; Barry, 1991; Browman & Goldstein, 1990b). The acoustic state
for English consonant clusters is that the closure of the first consonant is typically not
released until the closure of the second consonant is formed (Byrd, 1996a; Ladefoged,
1993). The articulatory explanation is that ―the movement of the articulators toward
closure for the second consonant begins during the articulation of the first, often resulting
in a period of time with two simultaneous closures‖ (Zsiga, 2003, p. 403). According to
Gafos‘ model (2002) of consonants coordination, English consonant clusters should
ideally be (2d), where the release of the first consonant equals the target of the second
consonant. Acoustic evidence of gestural overlap of English consonants was provided by
Zsiga (1994). In her study, English consonant clusters in the word boundaries were
investigated. The F2 and F3 values from the midpoint of the preceding vowel to the
27
closure were measured. The results showed the overlap of two English consonants was
evidenced by the influence of the second consonant on the vowel (preceding) to
consonant formant transition.
A large number of studies which investigated the articulatory timing of English
consonant clusters found that the effective temporal overlap within the clusters may
change. Browman and Goldstein (1987) discussed the difference between canonical
pronunciation and pronunciation in connected speech. They proposed that the differences
―all result from two simple kinds of changes to the gesture scores: (1) reduction in the
magnitude of individual gestures (in both time and space) and (2) increase in overlap
among gestures‖ (Browman & Goldstein, 1989, p.214). This statement indicates that
speaking rate may be a factor influencing the articulatory timing. Byrd and Tan (1996)
carried out an EPG study to investigate the articulatory timing of consonant clusters in
fast speech. They hypothesized four situations: a. increased the overlap; b. shortening of
each consonant; c. shortening of each consonant but maintaining the same overlap; d.
shortening each consonant and increased overlap. In the experiment, they only found two
strategies (a & b) were used to increase the speaking rate. The results also showed a
reduction in the articulation.
The coordination of English consonant clusters may be affected by the place and the
manner of articulation. In 1994, Byrd conducted an EPG study which systematically
explored English consonant clusters. His results showed that different types of clusters, in
terms of places and manners of articulation, have different proportions of gestural overlap.
In this study, heterorganic English consonant clusters within and across word boundaries

28
were investigated. The articulatory timing of English consonant clusters was the focus of
his study. Two types of timing were measured using EPG, which he named them local and
global time. The local time refers to the coordination within the cluster. The global time
refers to the coordination between the proceeding or following vowel and the whole
cluster. One of his findings was that stop-stop clusters had more overlap than
stop-fricative clusters. He stated that places and manners of articulation may be a factor
that influences the overlap of consonant clusters. Later, Byrd (1996) conducted a further
EPG study in which the target consonant clusters were in a carrier sentence. Stop-stop,
fricative-stop, and stop-fricative clusters were considered both within and across the word
boundaries. The results reported that English stops were more overlapped by a following
consonant than fricatives. Also, coronal consonant-velar stop clusters were shown to have
more overlap than velar stop-coronal consonant clusters.
Meanwhile, the position of the clusters will influence the proportion of overlap.
Browman and Goldstein (1988) argued that for a cluster in the onset, it is the c-center of
the cluster coordinated with the vowel gesture, which turns out to be the most stable
relation with the vowel gesture. However, for the coda position, the achievement of target
of the first consonantal gesture coordinated with the vowel gesture. Two EPG studies
conducted by Byrd (1994, 1996) prove that the overlap in the onset position is more
stable than that in coda position. And the gestural reduction was presented in the coda
position.
All the above-presented studies show the variability of gestural overlap within
consonant clusters. The variation of consonant gestural overlap may explain the reason

29
why second language learners have different accuracy rates for different clusters. For
language learners, some gestural timing patterns may be more difficult than the others.
2.5 Articulatory timing in second language consonant clusters
In the second language acquisition field, articulatory timing didn‘t receive enough
attention in the past. But more recently, with new technology and new research equipment,
more and more researchers are trying to find the reasons for the difficulties in second
language speech production from an articulatory perspective.
Early studies about temporal features in second language speech focused on the
duration values of a single segment, such as phoneme duration, vowel reduction, closure
duration and voice onset time which are all detected as factors that lead to perceived
foreign accent (Cebrian, 2000; Flege, Munro, & MacKay, 1995; Magen, 1998; Major,
1987; Tajima, Port, & Dalby, 1997).
Recent studies in articulatory timing paid more attention to the coordination between
segments. Articulatory Phonology provided the possibility that the inserted segments
might due to ―gesture mistiming‖ which had been proved in languages such as Hocank
(Steriade, 1990), Scots Gaelic (Bosch, 1995), and Moroccan Colloquial Arabic and Sierra
Popoluca (Gafos, 2002). Based on this finding in first language studies, researchers in the
second language field began to reconsider second language speakers‘ modification
strategies of non-native consonant clusters. Davidson (2003) conducted an ultrasound
study on the inserted vowels in non-native clusters in order to discover whether the
inserted vowel was phonological epenthesis or ―gesture mistiming‖. The ultrasound was

30
used to detect English speakers‘ tongue motion during the production of Slavic consonant
clusters. In this study, Davidson compared English-speaking participants‘ tongue
movement in the production of illegal Slavic consonant clusters with legal English
consonant clusters and the corresponding sequences with a schwa. If the articulator
movement of insertion was similar with that of legal English consonant clusters, then the
insertion would be considered as ―gesture mistiming‖. If the tongue movement is close to
that of English consonant cluster with a lexical schwa, the insertion would be considered
as phonological epenthesis. Five native English speakers who can‘t speak Slavic were
involved. The target Slavic clusters /zb/, /zd/, /zg/ was in the initial of the words. The
ultrasound images showed that at least three speakers did not necessarily use
phonological epenthesis to repair illegal consonant clusters, but rather failed to employ
the appropriate gestural coordination for Slavic initial consonant clusters. The three
speakers pulled apart the gesture of /z/ and following consonants to avoid the overlap
between the two consonants.
Later, Davison (2006) made acoustic measurements to detect the ―gestural mistiming‖
in non-native consonant clusters. If the inserted vowels are due to ―gesture mistiming‖,
the tongue will not have a vowel-like movement. In the study, 20 native English speakers
were asked to pronounce pseudo-Czech words with /s/-, /f/-, /z/-, and /v/-initial obstruent
clusters. She found significantly lower duration, and F1and F2 values for the inserted
vowel within the consonant clusters from the English speakers‘ production. Based on
these results, Davidson assumed that the inserted schwa in her study might be ―gesture
mistiming‖. If the inserted vowel is ―gesture mistiming‖, the schwa is a quick period of

31
open vocal tract between two constrictions, which leads to a more closed mouth than that
of a lexical schwa. Thus, a lower F1 would be resulted. Meanwhile, the tongue root may
anticipate the following vowel when the tongue tip and tongue body are involve in the
consonant constrictions. Thus, the lower F2 values might indicate a pharyngeal
constriction for following /a/ begins during the cluster. Davidson claimed that ―epenthetic
vowels used to repair phonologically prohibited sequences may not result from vowel
insertion, but from the failure to produce the consonants using the correct overlapping
gestural coordination for the target language‖ (2006, p. 108).
Articulatory timing patterns are language specific. Languages may vary in the
organization of their gestures. Thus, second language learners‘ difficulties in management
of non-native articulatory timing may be due to their articulatory habits of native
languages. Sole (1997) claimed the influence of native language on L2 articulatory timing
in a review article. ―The difficulty in mastering L2 timing patterns derives from the fact
that timing habits in the L1 get fossilized as articulatory subrountines (sequences of
articulatory instructions that operate together) in adult speakers and new phasing relations
between articulators within and across segments have to be learned and automized‖ (Sole,
1997, p.540). Zsiga (2003) conducted an experimental study to investigate the role of
language transfer in acquisition of articulatory timing. In this study, six English speakers
and six Russian speakers were asked to pronounce a set of two-word phrases in their
second languages. The target consonant clusters were stop-stop clusters across the word
boundaries. She found that native Russian speakers transferred their native speech timing
patterns to L2 English, but native English speakers did not transfer English articulatory

32
timing to L2 Russian. The author explained that sufficient consonantal overlap of English
consonant clusters is more marked. Relatively, the audible release in Russian is unmarked.
English-Russian speakers‘ performance indicated the emergence of the unmarked forms.
Nevertheless, the articulatory transfer was clearly proved by Russian-English speakers.
From the studies above, it is showed that articulatory timing can be a critical factor
which leads to unexpected sounds or incorrect pronunciation. And for second language
learners, the unfamiliarity of the target timing patterns may result in mistiming of gestures
which can be the reason for foreign accents.
2.6 Summary
With the development of experimental phonology and the interaction of phonology
and phonetics, Articulatory Phonology claims that the temporal dimension is relevant to
the phonological representation through coordination and the abstract timing (Browman
& Goldstein, 1986, 1989; Gafos, 2002). The speech production in Articulatory Phonology
involves four elements: a. the target gestures which include the particular articulator and
the location; b. the coordination between gestures which describes the timing of
articulatory movements; c. the expected target aerodynamic condition; d. the degree of
stiffness of the articulators (Sole, 1997). Within these four elements, there will be two
issues as Byrd proposed in 1996: (1) what is coordinated; (2) how it is coordinated.
Gestures are organized in space and over time. Thus, in order to explore how gestures are
coordinated and how speech is organized in articulation, articulatory timing is of primary
importance.

33
The gestural coordination evokes the reanalysis of several modification strategies
used by speakers to repair marked structures like consonant clusters. Researchers
proposed that assimilation, reduction and perceived deletion may be due to different
degree of gestural coordination. And segment insertion, for example, schwa insertion and
stop insertion, is considered as ―gesture mistiming‖.
Many factors, such as speaking rate, the position of the segment, the place of
articulation and the articulatory manners, may influence the coordination between
gestures. Moreover, the gestural coordination is language specific. Languages vary in
their organization of speech in time. The language-specific articulatory timing patterns
have been found in different prosodic levels.
The variability and cross-language differences make articulatory timing a possible
area where second language learners may have difficulties. Previous studies in second
language speech reported that temporal dimension was a factor that led to foreign accent.
Recent studies about second language articulatory timing began to focus on learners‘
mastering of coordination of the target languages. New technology, for example, EPG and
ultrasound, was employed. Like the studies in first languages, second language speech
studies also used the framework of Articulatory Phonology to reanalysis assimilation,
deletion and insertion in learners‘ production.
As demonstrated above, articulatory timing is proved to be essential in speech
production. However, less attention was paid on second language articulatory timing
among previous research. With respect of foreign accent in second language, articulatory
timing is assumed to be a factor because of its cross-language differences and variability.
34
Nevertheless, the relationship between foreign accent and articulatory timing has not been
clearly described. In terms of language transfer, Zsiga (2003) proposed that articulatory
timing could be transferred. But transfer is not widely proved. Beyond these two issues,
the modification strategies used by second language learners are also a debatable issue.
Whether deletion and insertion are due to articulatory mistiming or phonological repair is
still debated. Regard to articulatory timing itself, what factors will influence second
language articulatory timing is still unknown.

35
Chapter Three
THE EXPERIMENT
3.1 The participants
Thirty one Mandarin Chinese speakers (16 females and 15 males) and eight native
Canadian English speakers (4 females and 4 males) participated in this study. A one-page
questionnaire (see Appendix 1) was administered to elicit the information on the
participants‘ language background (such as their native language, dialect, foreign
language experience, and English learning experience), and personal information (such as
gender, age, major, school year and experience in English-spoken countries). The
information gathered in this questionnaire was used to choose the right participants and to
examine possible correlations between participants‘ background and their production
patterns.
The thirty one Mandarin speaking participants are international students from the
University of Victoria. The participants‘ age ranges between the age of 19 and 35, and
most of them are in the age group of 25-30. The average is 23.83 (SD = 3.26). The
participants have been in Canada for 4 to 48 months. The average length of residence is
18.33 months (SD = 11.14). All of them received formal English education in China from
middle school through university before they came to Canada. Six of them received 3 to 6
36
months‘ ESL education in Canada before they entered the University of Victoria. The
participants have 11.50 years of English learning experience on average (SD = 3.26).
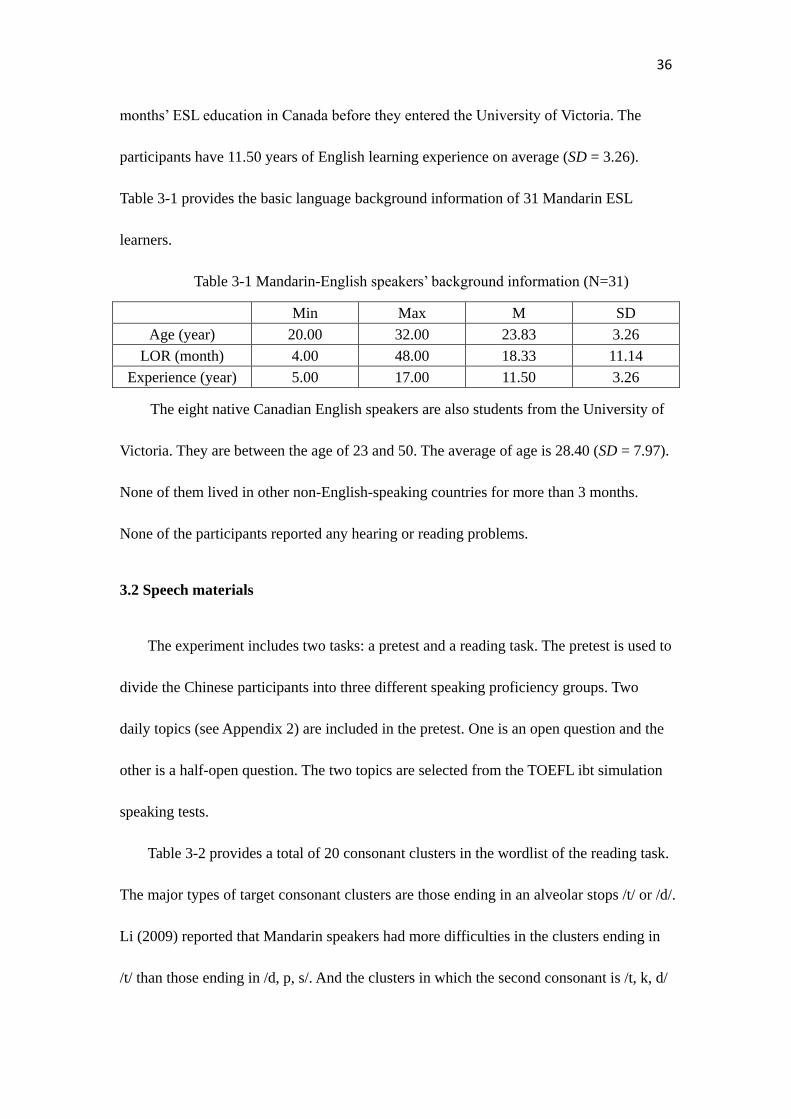
Table 3-1 provides the basic language background information of 31 Mandarin ESL
learners.
Table 3-1 Mandarin-English speakers‘ background information (N=31)
Min Max M SD
Age (year) 20.00 32.00 23.83 3.26
LOR (month) 4.00 48.00 18.33 11.14
Experience (year) 5.00 17.00 11.50 3.26
The eight native Canadian English speakers are also students from the University of
Victoria. They are between the age of 23 and 50. The average of age is 28.40 (SD = 7.97).
None of them lived in other non-English-speaking countries for more than 3 months.
None of the participants reported any hearing or reading problems.
3.2 Speech materials
The experiment includes two tasks: a pretest and a reading task. The pretest is used to
divide the Chinese participants into three different speaking proficiency groups. Two
daily topics (see Appendix 2) are included in the pretest. One is an open question and the
other is a half-open question. The two topics are selected from the TOEFL ibt simulation
speaking tests.
Table 3-2 provides a total of 20 consonant clusters in the wordlist of the reading task.
The major types of target consonant clusters are those ending in an alveolar stops /t/ or /d/.
Li (2009) reported that Mandarin speakers had more difficulties in the clusters ending in
/t/ than those ending in /d, p, s/. And the clusters in which the second consonant is /t, k, d/

37
were most frequently modified. Thus, consonant clusters ending in /t/ and /d/ are
considered as the target clusters in the present study so that the issue whether the
difficulties in these two kinds of clusters are caused by mismanagement of the articulatory
timing of these clusters can be explored.
Table 3-2 Target consonant clusters
Cluster type Clusters
Stop-stop /pt/, /kt/, /bd/, /gd/
Stop-fricative /ps/, /ts/, /ks/, /bz/,/dz/,/gz/
Fricative-stop /sp/, /st/, /sk/, /zd/, /ft/, /vd/
Liquid-stop /lt/, /ld/
Nasal-stop /nt/, /nd/
Meanwhile, the relationship between places and manners of articulation and
articulatory timing is another focus of the present study. Thus, consonant clusters with
different places and manners are selected for the purpose of investigating how places and
manners of articulation influence articulatory timing. The presentation of Table 3-2 is
according to clusters‘ manners of articulation. Four different manners of articulation are
involved. According to place of articulation, the 20 clusters can be divided into two
general groups: homorganic and heterorganic clusters. For example, /st/, /zd/, /lt/, /ld/, /nt/,
/nd/, /ts/, and /dz/ are all homorganic clusters because the consonants share the same place
of articulation (alveolar). Clusters such as /pt/, /bd/, /kt/, /gd/, /sk/, /sp/, /ft/, /vd/, /ps/, /bz/,
/ks/, and /gz/, are all heterorganic clusters, because the consonants are not articulated in
the same place of articulation. The heterorganic clusters here can be further divided into
three groups: one active articulator—tongue (/kt/, /gd/, /sk/, /ks/, /gz/); two active

38
articulators—tongue and lip (/pt/, /bd/, /sp/, /ps/, /bz/); three active articulators—tongue,
lip and low teeth (/ft/, /vd/).
Among the 20 clusters, stop-fricative clusters are special in the coda position in
English. They violate the Universal Canonical Syllable Structure, because the sonority of
the segments doesn‘t increase from the right edge to the nucleus. The selection of
stop-fricative clusters is for the purpose of investigating whether ESL learners have more
difficulties in this particular type of clusters than in others.
All the consonant clusters are in the coda position of English nonsense words (see
Appendix 2). The use of nonsense words is to avoid influence by literacy and familiarity
of the target words. Previous studies (Davidson, 2006) found that speakers‘ production
may be influenced by frequency; that is speakers may be more accurate for more frequent
words. Speakers may need more time to process and produce the unfamiliar words. Thus,
nonsense words are chosen to avoid this kind of interfering factors. The proceeding
vowels may interact with the following consonant or consonant cluster. For instance, He
& Lin (2005) found that Mandarin ESL speakers have fewer problems with English dark
/l/ following high front vowels than low back vowels. The proceeding vowels in the
present study are the high front vowel /i/ and the low back vowel /ɔ/. To avoid the
influence of stress, only monosyllabic words are used. In addition, consonants which
appear in the cluster are separately examined for the measurement of duration ratio in the
data analysis.

39
3.3 Data collection procedure
The experiment was performed in a sound-attenuated room in the Phonetics
Laboratory of the University of Victoria. A large diaphragm condenser microphone
(M-Audio Lunar) was placed at about a 10 cm distance from the participant‘s mouth. The
recording workstation was a Windows XP PC equipped with a Mic Preamp and A/D
converter (M-Audio firewire 410), and the recording software was Audacity 1.2.4. The
sampling frequency was 44100Hz.
Both groups of participants were instructed to read a consent form. After they signed
the consent form, they filled out a questionnaire (see Appendix 1) about their language
background. Then, the researcher explained the process of the whole experiment to the
participants. The first task was for the Chinese participants and it involves a topic
statement. Participants were provided with two questions in both English and Chinese
(see Appendix 2) to make sure they understand the task. They were asked to go through
the questions and prepare the two questions for about 15 minutes. Participants were
allowed to write down some key points during the preparation. When participants were
preparing the topics, a trial recording was carried out before the formal recording to
ensure the recording quality. Participants informed the researcher if they were ready to
record. The recording took 10 to 15 minutes for each participant and they had 10 minutes
rest after the first recording.
The second task is a word list reading task. Both groups of participants were
instructed to put the nonsense words into four carrier sentences (see Appendix 2). First,
the researcher explained to the participants how these nonsense words were composed.

40
All the nonsense words were made according to the phonotactics of English. Second,
participants received a word list on paper and practice by themselves. During the practice,
they could listen to the correct production by a female native Canadian English speaker
who is a linguist. Participants were instructed that there was a 2-second interval between
two sentences when they read the word list. A total of 256 (20×2×4+12×2×4) sentences
were collected from each participant. The participants were instructed to read the whole
sentence again if they made a mistake during the reading task. During the recording they
would have 10 minutes to rest. Each recording file was saved in .wav format. Then,
speech data were acoustically analyzed using Praat 5.0.19.
3.4 Data analysis
3.4.1 Speaking task rating
The audio data of each participant were referred to by a reference number in an
alphabetic order. Two ESL instructors, both native Canadian English speakers, were asked
to rate the topic speaking task. They were instructed to listen to the recording files one by
one and give scores from four factors: pronunciation, intonation, fluency, and
comprehensibility. The pronunciation refers to speakers‘ pronunciation of each consonant
and vowel and the stress pattern of each word. The intonation refers to the intonation of
each sentence. The fluency refers to the coherence of the whole speech. The
comprehensibility refers to the clearness and intelligibility of the speech. Whether the
speech is able to be understood is judged under the comprehensibility. The score range for
each factor is 1 to 5. For pronunciation and intonation, 1 means most accented and wrong

41
production; 5 means native-like production. For fluency and comprehensibility, 1 means
incoherent and unclear production which cannot be understood; 5 means fluent and
intelligible production.
The two ESL instructors were asked to rate the recordings separately according to the
criteria of four factors stated in the following table (Table 3-3). They listened to the
participants‘ production one by one. And the mean scores were considered as the final
scores. Inter-rater reliability would be calculated.
Table 3-3 Speaking Task Rating Criteria
Factors Criteria
Pronunciation
1 wrong pronunciation in vowels, consonants and stress patterns
most of the time;
2 strong accent pronunciation in vowels, consonants and stress
patterns;
3 accented pronunciation in vowels, consonants and stress
patterns;
4 accented pronunciation in some particular vowels, consonants
and stress patterns;
5 almost native-like pronunciation in vowels, consonants and stress
patterns.
Intonation
1 wrong intonation most of the time;
2 strong accented intonation;
3 accented intonation;
4 accented intonation only in several sentences in some particular
types of sentences;
5 almost native-like intonation.
Fluency
1 participants can only use some words to express their opinions;
2 there are many pauses, hesitations, blockages, and repetition. The
opinion cannot be expressed coherently;
3 there are a few of pauses, hesitations, blockages, and repetition.
But the opinion can be expressed coherently;
4 there are few pauses, hesitations, blockages, and repetition. The
opinion can be clearly expressed;
5 there are almost no pauses, hesitations, and repetition. The
opinion can be smoothly expressed.
Comprehensibility 1 responses barely comprehensible. Errors and use of English
interfere with comprehension;

42
2 responses comprehensible. Many sections may be more difficult
to interpret;
3 responses comprehensible. Few clarifications may be needed for
individual words or phrases. Some errors interfere with
comprehension;
4 responses mostly comprehensible. Few clarifications may be
needed for individual words or phrases. Errors do not interfere with
the comprehension overall.
5 responses readily comprehensible. No clarifications needed.
Errors are minimal and do not interfere with the message.
3.4.2 Segmentation
All 256 tokens were extracted from the initial .wav file by using Praat script 2
(Remijsen, 2004). All scripts used in this study were adapted by the researcher from a
number of sources. A preliminary .TextGrid file was then automatically created by Praat
script 3 (Remijsen, 2004) to segment and label each extracted token in terms of the vowel
and consonant intervals. When the .TextGrid file, along with the token‘s waveform and
spectrogram, was read all at once into the Praat object window in a directory by using
Praat script 1 (Remijsen, 2004), the preliminary segmenting points were manually
adjusted by the researcher. Relying on both visual and audio cues, the researcher carried
out the segmentation on computer using the acoustic-analysis software Praat (Version
5.0.19).
In the segmentation, only the nonsense words with target consonant clusters were
labeled by segment and the carrier sentences were segmented as phrases (see Figure 3-1).
Segmentation was conducted under the assumption that anything on the spectrogram with
glottal striations (vocal pulses) and well-defined formants were labeled as a vowel.
Generally, the first zero-crossing point of the first glottal pulse of the vowel (can be
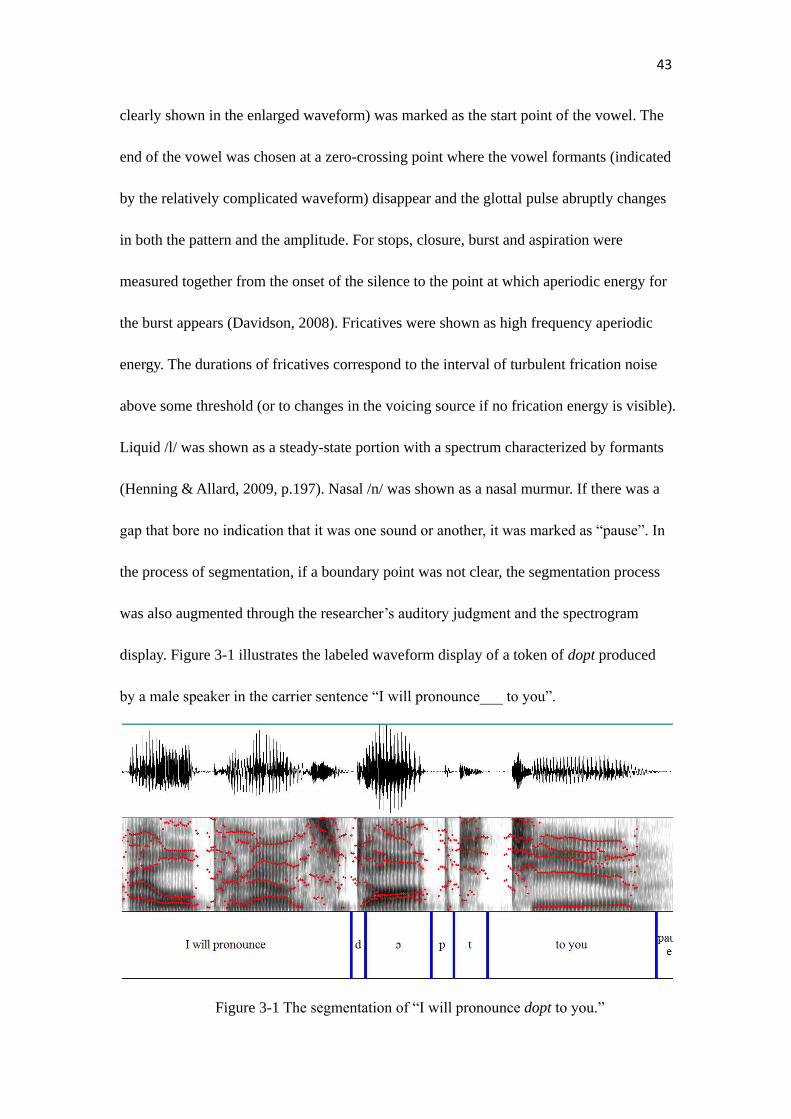
43
clearly shown in the enlarged waveform) was marked as the start point of the vowel. The
end of the vowel was chosen at a zero-crossing point where the vowel formants (indicated
by the relatively complicated waveform) disappear and the glottal pulse abruptly changes
in both the pattern and the amplitude. For stops, closure, burst and aspiration were
measured together from the onset of the silence to the point at which aperiodic energy for
the burst appears (Davidson, 2008). Fricatives were shown as high frequency aperiodic
energy. The durations of fricatives correspond to the interval of turbulent frication noise
above some threshold (or to changes in the voicing source if no frication energy is visible).
Liquid /l/ was shown as a steady-state portion with a spectrum characterized by formants
(Henning & Allard, 2009, p.197). Nasal /n/ was shown as a nasal murmur. If there was a
gap that bore no indication that it was one sound or another, it was marked as ―pause‖. In
the process of segmentation, if a boundary point was not clear, the segmentation process
was also augmented through the researcher‘s auditory judgment and the spectrogram
display. Figure 3-1 illustrates the labeled waveform display of a token of dopt produced
by a male speaker in the carrier sentence ―I will pronounce___ to you‖.
Figure 3-1 The segmentation of ―I will pronounce dopt to you.‖
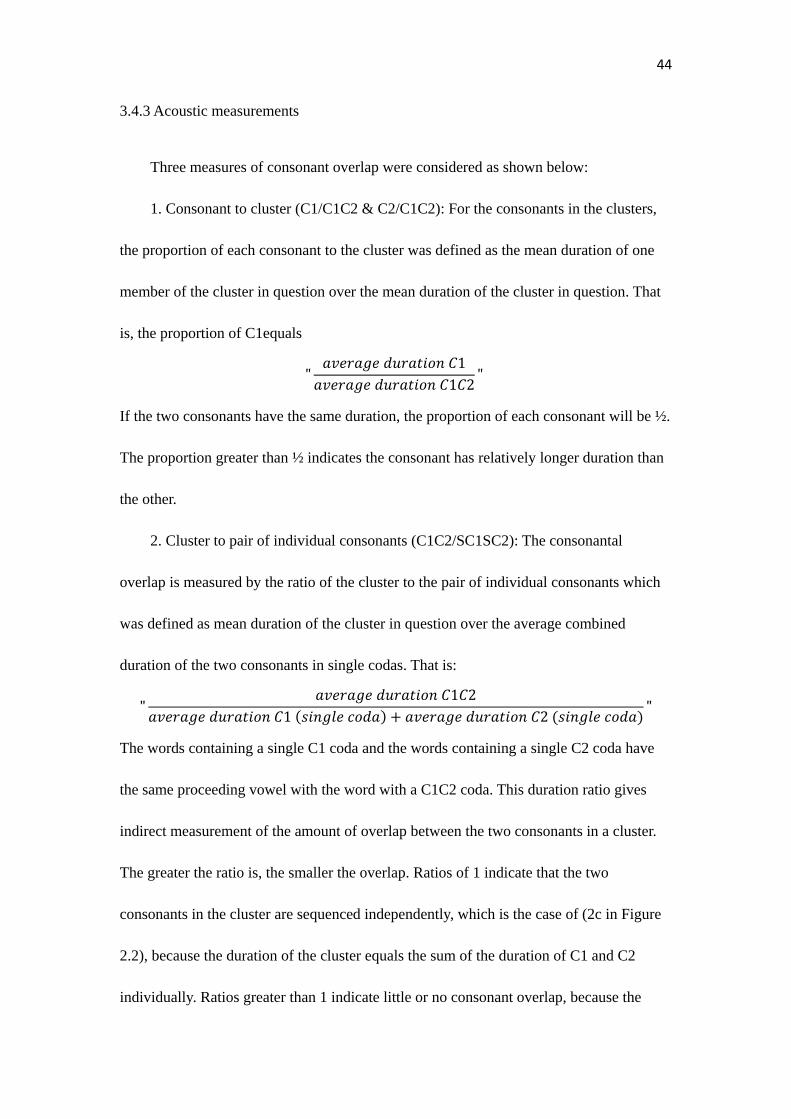
44
3.4.3 Acoustic measurements
Three measures of consonant overlap were considered as shown below:
1. Consonant to cluster (C1/C1C2 & C2/C1C2): For the consonants in the clusters,
the proportion of each consonant to the cluster was defined as the mean duration of one
member of the cluster in question over the mean duration of the cluster in question. That
is, the proportion of C1equals
If the two consonants have the same duration, the proportion of each consonant will be ½.
The proportion greater than ½ indicates the consonant has relatively longer duration than
the other.
2. Cluster to pair of individual consonants (C1C2/SC1SC2): The consonantal
overlap is measured by the ratio of the cluster to the pair of individual consonants which
was defined as mean duration of the cluster in question over the average combined
duration of the two consonants in single codas. That is:
The words containing a single C1 coda and the words containing a single C2 coda have
the same proceeding vowel with the word with a C1C2 coda. This duration ratio gives
indirect measurement of the amount of overlap between the two consonants in a cluster.
The greater the ratio is, the smaller the overlap. Ratios of 1 indicate that the two
consonants in the cluster are sequenced independently, which is the case of (2c in Figure
2.2), because the duration of the cluster equals the sum of the duration of C1 and C2
individually. Ratios greater than 1 indicate little or no consonant overlap, because the

45
duration of the cluster is longer than the sum of its individual parts, which indicate a lag
between the two consonants. Ratios less than 1 indicate some overlap between the
consonants, because the duration of the clusters is shorter than the sum of its individual
parts (2b in Figure 2.2). A ratio of 0.5 means that the two consonants are completely
overlapped and therefore are simultaneous. For the ratios to be meaningful, it must be
assumed that the consonants are articulated similarly in clusters and in the single coda.
This duration ratio was also used by Zsiga (2003) to investigate the overlap of consonant
clusters.
3. Cluster to rime: The proportion of the cluster within the rime was defined as mean
duration of the cluster in question over the duration of the rime in which the cluster is
found. That is, the proportion of the cluster equals
The reason to calculate the proportion of the cluster within the rime is that English has
higher consonant proportion than Chinese as found in rhythm studies by Lin and Wang
(2005, 2006, 2007, 2008). Zsiga (2003) found that L1 articulatory timing can be
transferred into an L2 just as other phonological patterns. And Mandarin speakers may
transfer the rhythm of Chinese to English (Lin & Wang, 2005, 2006, 2008). It is predicted
that Mandarin speakers may have smaller proportion of the cluster within the rime than
English native speakers.
Deletion and vowel insertion may be the possible modification strategies used by
second language learners. The present study also summarized the patterns for deletion and
vowel insertion, such as which sound is deleted or added, where the deletion and vowel

46
insertion happen. Also these modification strategies influenced the measurement of
duration of the cluster. The present study assumes that the learners‘ problem in the
consonant clusters is due to the failure of managing the articulatory timing properly. Thus,
if deletion happens, we measured the duration of the remaining consonant, which was
treated as the duration of the whole cluster. If vowel insertion happens, the duration of the
consonants was measured as well as that of the inserted vowel. And the duration the
cluster was measured from the onset of the first consonant to the offset of the second
consonant. This study used script 4 (Remijsen, 2004) to measure the duration of each
segment.
3.5 Statistic analysis
Acoustic data measured and calculated by the Praat script 4 were first extracted into
Microsoft Office Excel 2007. The statistical software IBM SPSS 17.0 for Windows was
used to find out whether or not there exist significant differences among the test words in
terms of the above acoustic correlates.
3.5.1 Tests of Interrater Reliability
Interrater reliability is calculated to examine the agreement between the two ESL
raters on the scores of participants‘ topic statement. The interrater agreement is assessed
by correlating the two ESL judges‘ rating. The correlation coefficients are calculated in
SPSS 17. Considering the fact that two judges scores could be highly correlated with one
another but show little agreement, the intraclass correlation coefficient is calculated to
reassure the reliability.

47
3.5.2 Paired-samples T-test
Paired-sample T-tests are used to compare the variance between voiceless and voiced
clusters or are used to compare two consonant clusters different in their place or manner
of articulation. The statistical results are used to indicate the effect of voice feature or
place of articulation or manner of articulation in the participants‘ performance on two
different types of clusters. For instance, if the significance is found between /pt/ and /kt/
on C1C2/SC1SC2, thus, the differences on C1C2/SC1SC2 between the two clusters are
significant. Ideally, because of the only articulatory difference between the two clusters is
the place of articulation, there may be a reason to suspect that the place of articulation
influence the values of C1C2/SC1SC2 of the two clusters.
3.5.3 Independent-samples T-tests
The independent-samples T-tests are used to compare the difference between native
Canadian English speakers and Mandarin ESL learners‘ performance on one type of
cluster. The statistical results are used to indicate the distance between native Canadian
English speakers and Mandarin ESL learners‘ performance. For example, if there is a
significant difference between native Canadian English speakers and Mandarin ESL
learners on cluster /pt/, it may indicate that Mandarin ESL learners may not be able to
manage the articulatory timing of /pt/.
3.5.4 One-way ANOVA
One-way ANOVA tests are used to compare the variance caused by one of the
influential factors in one of the parameters among four groups of participants. The

48
statistical results estimate the effect of the influential factor on articulatory timing. For
example, /sk/, /st/ and /sp/ are different in place of articulation. To find the effect of place
of articulation on C1C2/SC1SC2 of the three clusters, a one-way ANOVA is used on the
duration ratios of /sk/, /st/ and /sp/. If significant difference is reported among the three
clusters, it estimates place of articulation has major effect on speakers‘ articulatory
timing.
3.5.5 Repeated measures ANOVA
Repeated measures ANOVA tests are used to investigate the effect of all the
influential factors and the interaction among the factors on three ratios. In the repeated
measures ANOVA, the three ratios are treated as three dependent variables. The potential
factors are treated as within-subjects factors. The proficiency group is treated as
between-subjects factor. The statistical results report the significance of the variance in
each dependent variable caused by both within- and between-subjects factors and their
interaction. If the significance is reported, it estimates significant major effect of the
factor on one of the ratios.

49
Chapter Four
RESULTS AND ANALYSES
The first half of the thesis (Chapter 1, 2 and 3) has been devoted to providing the
theoretical framework and methodology of current research. The aim of the second half of
the thesis is to report and analysis the findings. This chapter reports the results and
statistic analyses of the data. The chapter consists of three major sections. Section 4.1
presents subjects‘ performance in the topic speaking task from which subjects are divided
into three different language proficiency groups. All the results of articulatory timing are
presented from section 4.2 to 4.5. The sections are organized by the types of cluster.
Section 4.2 reports the results of stop-stop clusters, section 4.3 of stop-fricative clusters,
section 4.4 of fricative-stop clusters, and section 4.5 of liquid-stop and nasal-stop clusters.
Within each section, the values of three ratios: a. Consonant to Cluster (C1/C1C2 &
C2/C1C2); b. Cluster to pair of individual consonants (C1C2/SC1SC2); c. Cluster to rime
(C1C2/Rime). Meanwhile, the effect of place of articulation is analyzed. Section 4.6
compares different types of clusters to investigate the effect of manner of articulation.
4.1 Results on Speaking Task
4.1.1 Overall performance
Two experienced ESL instructors rated the speaking tasks according to four criteria
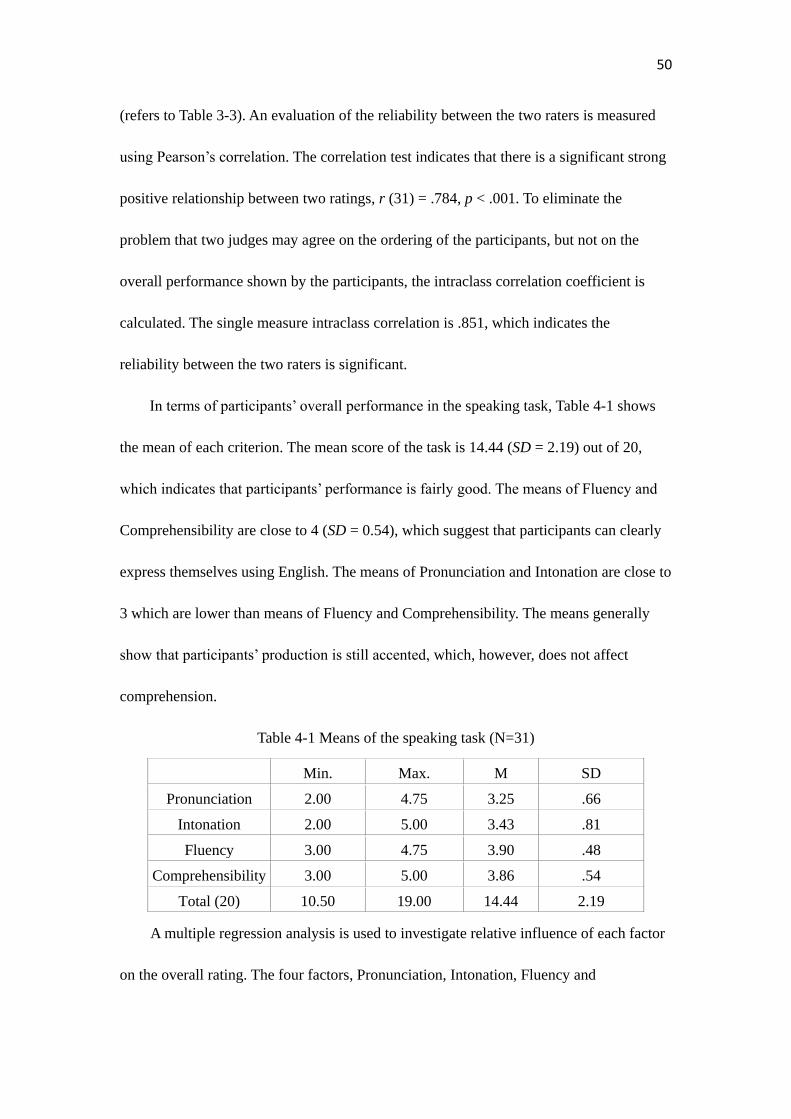
50
(refers to Table 3-3). An evaluation of the reliability between the two raters is measured
using Pearson‘s correlation. The correlation test indicates that there is a significant strong
positive relationship between two ratings, r (31) = .784, p < .001. To eliminate the
problem that two judges may agree on the ordering of the participants, but not on the
overall performance shown by the participants, the intraclass correlation coefficient is
calculated. The single measure intraclass correlation is .851, which indicates the
reliability between the two raters is significant.
In terms of participants‘ overall performance in the speaking task, Table 4-1 shows
the mean of each criterion. The mean score of the task is 14.44 (SD = 2.19) out of 20,
which indicates that participants‘ performance is fairly good. The means of Fluency and
Comprehensibility are close to 4 (SD = 0.54), which suggest that participants can clearly
express themselves using English. The means of Pronunciation and Intonation are close to
3 which are lower than means of Fluency and Comprehensibility. The means generally
show that participants‘ production is still accented, which, however, does not affect
comprehension.
Table 4-1 Means of the speaking task (N=31)
Min. Max. M SD
Pronunciation 2.00 4.75 3.25 .66
Intonation 2.00 5.00 3.43 .81
Fluency 3.00 4.75 3.90 .48
Comprehensibility 3.00 5.00 3.86 .54
Total (20) 10.50 19.00 14.44 2.19
A multiple regression analysis is used to investigate relative influence of each factor
on the overall rating. The four factors, Pronunciation, Intonation, Fluency and
51
Comprehensibility, are treated as independent variables and the final rating is treated as a
dependent variable. The β values show that Intonation has the greatest influence on the
judgment: β = .37, t = 6.54, p < .001; followed by Pronunciation: β = .30, t =5.82, p
< .001; Comprehensibility: β = .25, t = 6.40, p < .001; and Fluency: β = .22, t = 5.78, p
< .001. And the direction of influence for all the four factors is positive, which means
high scores indicate high proficiency for four factors. The regression analysis indicates
that the two raters‘ judgment of speaking proficiency depending more on participants‘
foreign accent, because intonation and pronunciation influence more than
comprehensibility and fluency on the raters‘ judgment.
4.1.2 Grouping
The purpose of the speaking task is to divide the participants into different speaking
proficiency groups. Based on each participant‘s scores on the four factors (refers to Table
3-3) in the speaking tasks, a hierarchical cluster analysis is used to group the participants
into three clusters, namely, low, intermediate, and advanced. The three proficiency levels
here only indicate participants‘ performance on the speaking tasks according to the four
criteria (refers to Table 3-3) provided in the present study. Table 4-2 below provides the
detailed background information of each group. The detailed results of cluster analysis are
reported in Appendix 3.

52
Table 4-2 Background information of three Mandarin-English groups
Groups Number Age (year)
LOR
(month)
English
experience*
(year)
Mean scores of
reading task
M SD M SD M SD M SD
Low 12 24.50 3.92 14.92 8.21 12.83 3.01 12.23 0.95
Intermediate 12 23.36 3.17 21.55 11.96 11.27 3.52 14.94 0.69
Advanced 7 23.57 2.15 20.86 13.06 9.86 2.34 17.61 0.64
*English experience here is indicated by the years of English learning.
Thirty one participants are divided into three different groups based on their scores
in speaking tasks. Four males and three females are in the advanced group. Six males and
six females are in the intermediate group. Five males and seven females are in the low
group. The average age, length of residence and English learning experience are also
provided in Table 4-2. The means of age and English experience are close among three
groups and the standard deviations show little variation. For length of residence, the
average of low group is obviously lower than those of the other two groups. However, a
correlation test does not show statistically significant relationship between participants‘
length of residence and their speaking scores: r (31) = .216, p > .05.
4.2 Results on stop-stop clusters
The following sections reveal the results of three duration ratios of each group of
consonant clusters. In order to better present the results, the definition and formula of
three duration ratios are summarized in the following table:

53
Table 4-3 Three duration ratios of consonant clusters
Name of Ratio Formula Abbreviation Definition
Consonant to
Cluster
a. Consonant
(C1)/Cluster Coda
(C1C2)
b. Consonant
(C2)/Cluster Coda
(C1C2)
C1/C1C2
C2/C1C2
Mean duration of one member
of the cluster in question over
the mean duration of the cluster
in question.
Cluster to pair
of individual
consonants
Cluster Coda
(C1C2)/Single
Coda (C1)+Single
Coda (C2)
C1C2/SC1SC2
Mean duration of the cluster in
question over the average
combined duration of the two
consonants in single codas.
Cluster to rime Cluster Coda
(C1C2)/Rime C1C2/Rime
Mean duration of the cluster in
question over the duration of
the rime.
4.2.1 Consonant to cluster (C1/C1C2 & C2/C1C2)
Mean duration of one member of the cluster over the mean duration of the whole
cluster measures the timing difference between the two consonants within the cluster. The
ratios of both consonants are calculated in the study to investigate the internal structure of
the clusters.
The proportion of each consonant in the stop-stop clusters are presented in Table 4-4.
The average ratios of four groups all show that the second consonant takes more time
proportion than the first one within the cluster. The paired-sample t test shows that C2
proportion is significantly greater than C1 proportion: t (39) = 5.43, p < .001. From
general observation, the difference among groups is not obvious. The production of
advanced and intermediate groups is closed to native speakers for each cluster. However,
there is remarkable distance between the low group and native Canadian English speakers.
To investigate if proficiency group is an influential factor on C1 and C2 proportion, a
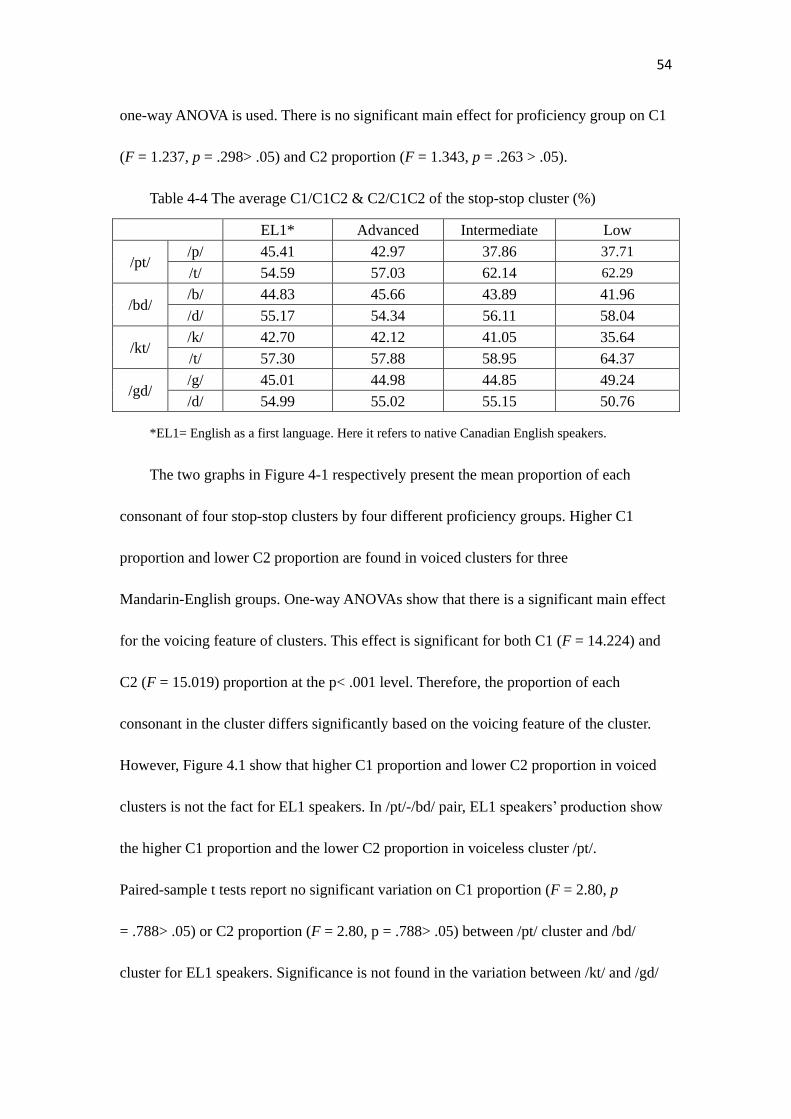
54
one-way ANOVA is used. There is no significant main effect for proficiency group on C1
(F = 1.237, p = .298> .05) and C2 proportion (F = 1.343, p = .263 > .05).
Table 4-4 The average C1/C1C2 & C2/C1C2 of the stop-stop cluster (%)
EL1* Advanced Intermediate Low
/pt/ /p/ 45.41 42.97 37.86 37.71
/t/ 54.59 57.03 62.14 62.29
/bd/ /b/ 44.83 45.66 43.89 41.96
/d/ 55.17 54.34 56.11 58.04
/kt/ /k/ 42.70 42.12 41.05 35.64
/t/ 57.30 57.88 58.95 64.37
/gd/ /g/ 45.01 44.98 44.85 49.24
/d/ 54.99 55.02 55.15 50.76
*EL1= English as a first language. Here it refers to native Canadian English speakers.
The two graphs in Figure 4-1 respectively present the mean proportion of each
consonant of four stop-stop clusters by four different proficiency groups. Higher C1
proportion and lower C2 proportion are found in voiced clusters for three
Mandarin-English groups. One-way ANOVAs show that there is a significant main effect
for the voicing feature of clusters. This effect is significant for both C1 (F = 14.224) and
C2 (F = 15.019) proportion at the p< .001 level. Therefore, the proportion of each
consonant in the cluster differs significantly based on the voicing feature of the cluster.
However, Figure 4.1 show that higher C1 proportion and lower C2 proportion in voiced
clusters is not the fact for EL1 speakers. In /pt/-/bd/ pair, EL1 speakers‘ production show
the higher C1 proportion and the lower C2 proportion in voiceless cluster /pt/.
Paired-sample t tests report no significant variation on C1 proportion (F = 2.80, p
= .788> .05) or C2 proportion (F = 2.80, p = .788> .05) between /pt/ cluster and /bd/
cluster for EL1 speakers. Significance is not found in the variation between /kt/ and /gd/
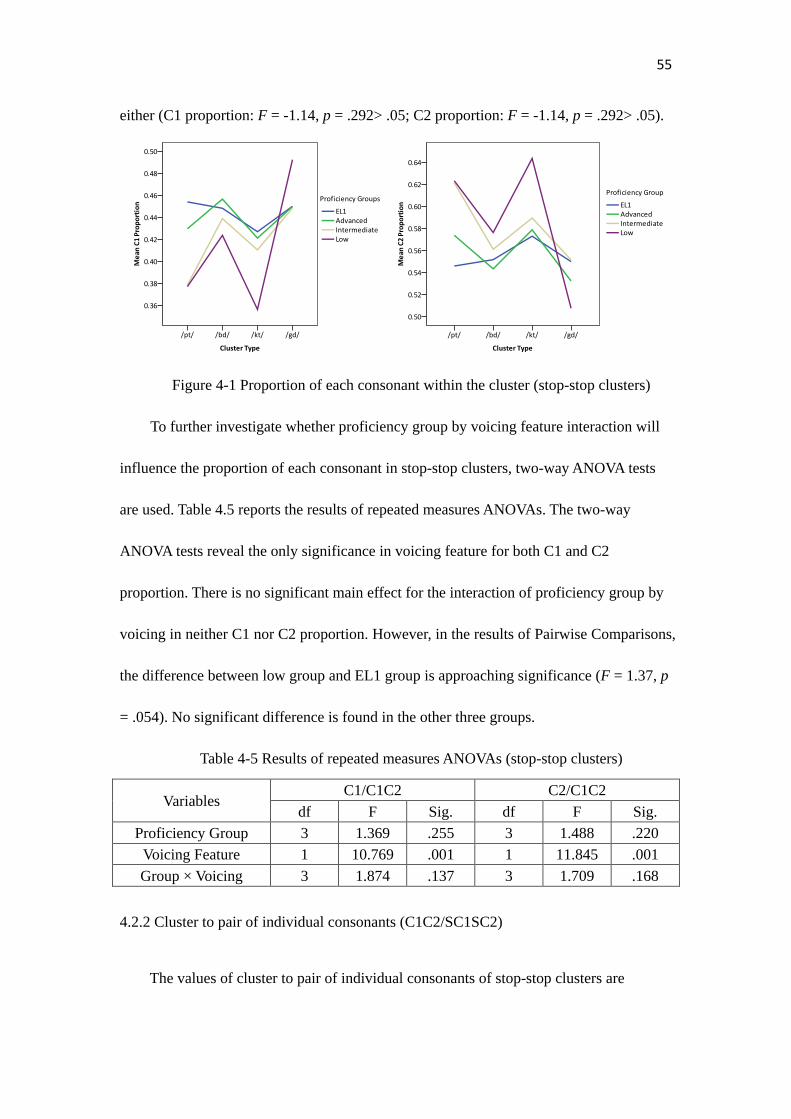
55
either (C1 proportion: F = -1.14, p = .292> .05; C2 proportion: F = -1.14, p = .292> .05).
Figure 4-1 Proportion of each consonant within the cluster (stop-stop clusters)
To further investigate whether proficiency group by voicing feature interaction will
influence the proportion of each consonant in stop-stop clusters, two-way ANOVA tests
are used. Table 4.5 reports the results of repeated measures ANOVAs. The two-way
ANOVA tests reveal the only significance in voicing feature for both C1 and C2
proportion. There is no significant main effect for the interaction of proficiency group by
voicing in neither C1 nor C2 proportion. However, in the results of Pairwise Comparisons,
the difference between low group and EL1 group is approaching significance (F = 1.37, p
= .054). No significant difference is found in the other three groups.
Table 4-5 Results of repeated measures ANOVAs (stop-stop clusters)
Variables C1/C1C2 C2/C1C2
df F Sig. df F Sig.
Proficiency Group 3 1.369 .255 3 1.488 .220
Voicing Feature 1 10.769 .001 1 11.845 .001
Group × Voicing 3 1.874 .137 3 1.709 .168
4.2.2 Cluster to pair of individual consonants (C1C2/SC1SC2)
The values of cluster to pair of individual consonants of stop-stop clusters are

56
presented in Table 4-6. The mean of each group and the mean of each cluster are also
calculated. The mean C1C2/SC1SC2 of stop-stop clusters is 0.887 (SD = 3.45), which
indicates that the consonants are overlapped on average for about 11% of their duration.
However, in Zsiga‘s (2003) study, the mean value was found to be approximately 0.80 for
English consonant clusters, which is close but lower than the mean value here.
Meanwhile, Barry (1991) and Byrd (1996) reported the articulatory contact for English
consonant clusters is around 30% to 60% which is much higher than the mean amount in
the present study. Notice that the mean value here includes three non-native groups‘
production. If look at the EL1 speakers‘ values only, it is found that the mean
C1C2/SC1SC2 is 0.741 which is consistent with the studies above (Barry, 1991; Byrd,
1996; Zsiga, 2003). Zsiga (2003) mentioned in her study that 30% to 60% of overlap
would rarely cause an audible internal release. The mean C1C2/SC1SC2 for the three
Mandarin-English groups is 0.946 (SD = 5.52) which is much higher than EL1 speakers.
An independent-samples test shows that Mandarin-English speakers exhibit a
significantly higher C1C2/SC1SC2 than EL1 speakers (t = -18.802, p < .001). Notice that
the means of intermediate and low groups are approximately from 0.900 (SD = 6.35) to
1.000 (SD = 6.74) which suggests an audible release is produced in their production.
Table 4-6 The values of C1C2/SC1SC2 of stop-stop clusters
EL1 Advanced Intermediate Low M
/pt/ 0.708 0.858 0.925 0.969 0.865
/bd/ 0.736 0.868 0.949 0.990 0.886
/kt/ 0.739 0.866 0.949 0.984 0.885
/gd/ 0.783 0.882 0.971 1.022 0.914
Mean 0.741 0.868 0.948 0.991 0.887
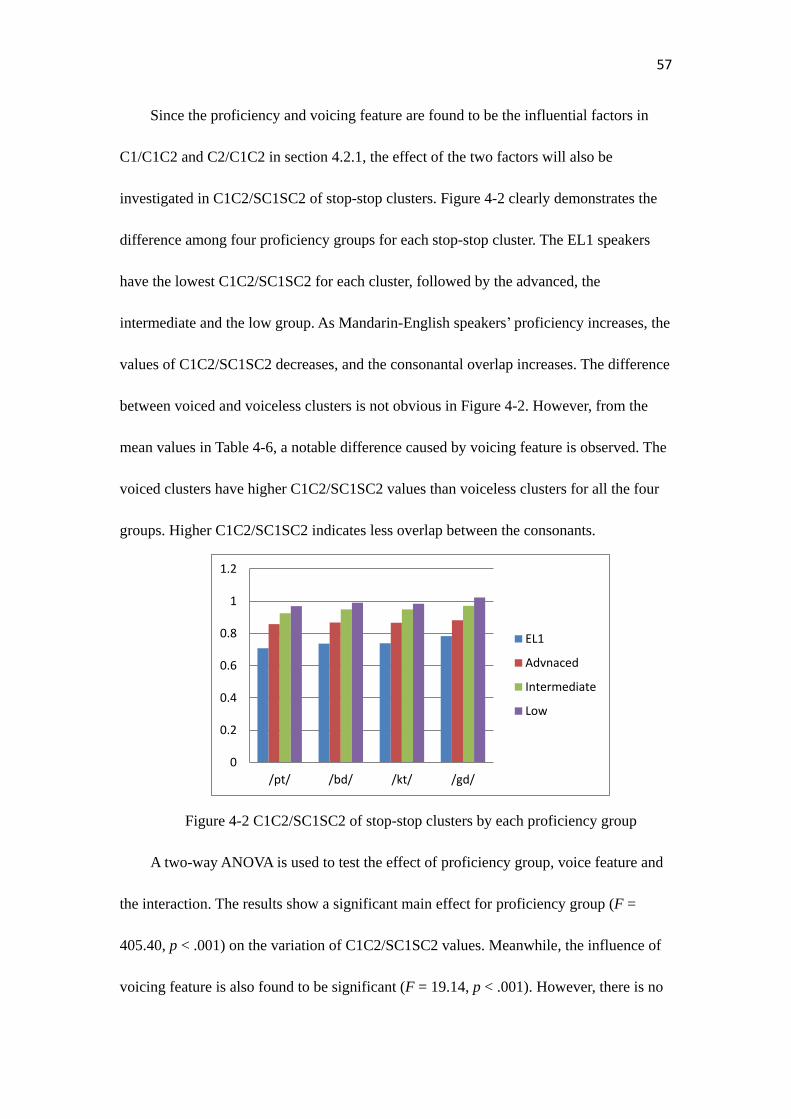
57
Since the proficiency and voicing feature are found to be the influential factors in
C1/C1C2 and C2/C1C2 in section 4.2.1, the effect of the two factors will also be
investigated in C1C2/SC1SC2 of stop-stop clusters. Figure 4-2 clearly demonstrates the
difference among four proficiency groups for each stop-stop cluster. The EL1 speakers
have the lowest C1C2/SC1SC2 for each cluster, followed by the advanced, the
intermediate and the low group. As Mandarin-English speakers‘ proficiency increases, the
values of C1C2/SC1SC2 decreases, and the consonantal overlap increases. The difference
between voiced and voiceless clusters is not obvious in Figure 4-2. However, from the
mean values in Table 4-6, a notable difference caused by voicing feature is observed. The
voiced clusters have higher C1C2/SC1SC2 values than voiceless clusters for all the four
groups. Higher C1C2/SC1SC2 indicates less overlap between the consonants.
Figure 4-2 C1C2/SC1SC2 of stop-stop clusters by each proficiency group
A two-way ANOVA is used to test the effect of proficiency group, voice feature and
the interaction. The results show a significant main effect for proficiency group (F =
405.40, p < .001) on the variation of C1C2/SC1SC2 values. Meanwhile, the influence of
voicing feature is also found to be significant (F = 19.14, p < .001). However, there is no
0
0.2
0.4
0.6
0.8
1
1.2
/pt/ /bd/ /kt/ /gd/
EL1
Advnaced
Intermediate
Low

58
significant effect for the interaction of proficiency group and voicing feature (F = .46, p
= .712 > .05). The results of Pairwise Comparison about group reported that the
differences among four groups all reach the significance (F = 1.86, p < .001).
4.2.3 Cluster to Rime (C1C2/Rime)
The duration of the cluster over the duration of the rime also reflects the amount of
overlap between the consonants. Meanwhile, this measurement also can be used to
describe the rhythm of the language. In Ramus, Nespor, and Mehler‘s study (1999), they
use %V as one of the parameter to describe language rhythm. Because %C is isomorphic
to %V, either of the two ratios can be used. Thus, in the present study, the proportion of
the cluster to the rime is used to demonstrate the coordination of the consonants as well as
to investigate if language transfer happened in the foreign language timing.
The results of stop-stop clusters for C1C2/Rime are presented in Table 4-7 and
Figure 4-3. The mean of all production in stop-stop clusters is 0.515 (SD = 11.32) which
is lower than 0.60 (the %V in Ramus, Nespor, and Mehler‘s study is approximately 40%).
Notice that the mean of EL1 speakers is 0.478 (SD = 3.47), which is even lower. This low
value may be due to the short duration of stop consonants. From this perspective,
Mandarin-English speakers‘ higher C1C2/Rime values indicate longer duration than EL1
speakers in stop-stop clusters. Among the Mandarin-English speakers, the advanced
group has the lowest value, while the means of intermediate and low groups are closed to
each other.

59
Table 4-7 The results of C1C2/Rime of stop-stop clusters
EL1 Advanced Intermediate Low M
/pt/ 0.487 0.519 0.562 0.559 0.532
/bd/ 0.449 0.475 0.523 0.526 0.493
/kt/ 0.535 0.540 0.582 0.574 0.558
/gd/ 0.439 0.490 0.497 0.487 0.478
Mean 0.478 0.506 0.541 0.536 0.515
Figure 4-3 shows the mean values of each group in each cluster. Besides the group
difference mentioned above, the difference between voiced and voiceless clusters is
observed. The proportion of cluster to the rime is higher in the voiceless clusters than in
the corresponding voiced clusters for both EL1 and Mandarin-English speakers. Two
independent-samples t tests show that for both pairs of clusters, the values of voiceless
clusters are significantly higher than voiced clusters (/pt/-/bd/: t = 2.845, p = .006< .01;
/kt/-/gd/: t =6.475, p < .001).
In order to interpret the effect of group difference and the voicing difference in the
production, a two-way ANOVA is conducted. The statistical tests show that both
proficiency group (F = 18.046, p < .001) and voicing feature (F = 29.715, p < .001) have
significant main effects on the proportion of the cluster to the rime in stop-stop clusters.
However, there is no significant main effect for the interaction of group and voicing
feature (F = .817, p = .486 > .05).

60
Figure 4-3 C1C2/Rime by each group on stop-stop clusters
The group difference is further analyzed by the Pairwise Comparison. The results
show that EL1 speakers‘ values of C1C2/Rime are significantly lower than each
Mandarin-English group. Within the Mandarin-English groups, the differences between
advanced group and other two groups reach the significance (F = 3.54, p < .01). There is
no significant difference between intermediate and low groups in terms of the proportion
of the cluster to the rime.
4.2.4 The place of articulation
One of the research questions in the present study is to investigate the influence of
place of articulation on the overlap between the two consonants. In the present study, the
clusters are divided into three types according to the movement of the articulator. If the
two consonants share the same place of articulation, the clusters are homorganic; if the
articulator moves from the front of the mouth to the back of the mouth during the
articulation of the cluster, it is considered as front-back cluster; if the articulator moves
from the back of the mouth to the front of the mouth during the articulation of the cluster,
0
0.1
0.2
0.3
0.4
0.5
0.6
0.7
/pt/ /bd/ /kt/ /gd/
EL1
Advanced
Intermediate
Low
61
it is considered as back-front cluster.
In stop-stop clusters, the four clusters can be divided into two groups according to
places of articulation. In /pt/ and /bd/, the place of articulation moves from the bilabial to
the alveolar, which is included into the front-back type. In /kt/ and /gd/, the place of
articulation moves from the velar to the alveolar, from dorsal to coronal, which is
included in the back-front type in the present study.
In the previous three sections, proficiency group and voicing feature are found to be
the factors that influence the three ratios. In this section, the two factors as well as place
of articulation are treated as the independent variables. Explicitly, the voicing feature and
place of articulation are treated as within-subjects factors; the proficiency group is treated
as a between-subjects factor. And the three ratios are treated as dependent variables. A
repeated-measures ANOVA is used to further analyze the effect of the three factors on the
variation of the three ratios. Table 4.8 reports the results of repeated measures ANOVAs.
For stop-stop clusters, the place of articulation only significantly influences the
C1C2/SC1SC2 values. The interaction of place of articulation and voicing has a
significant effect on the proportion of the cluster to the rime. There is no significant effect
for place of articulation in the values of consonant to cluster (C1/C1C2). The influence of
three factors all reaches significance in the C1C2/SC1SC2 values of stop-stop clusters.

62
Table 4-8 Results of the repeated measures ANOVAs (stop-stop clusters)
Variables C1/C1C2 C1C2/SC1SC2 C1C2/Rime
df F df F df F
Between subjects
Proficiency group 3, 35 0.512 3, 35 316.868** 3, 35 3.929*
Within subjects
Place of articulation 1, 35 0.555 1, 35 28.535** 1, 35 0.986
Voicing feature 1, 35 18.201** 1, 35 27.769** 1, 35 137.289**
Interactions
Group×Place 3, 35 1.341 3, 35 1.308 3,35 2.130
Group×Voicing 3, 35 3.166* 3, 35 0.882 3, 35 0.575
Place×Voicing 3, 35 1.979 3, 35 1.147 3,35 19.988**
Group×Place×Voicing 3, 35 2.417 3, 35 0.351 3, 35 1.325
*: p< .05. **: p< .001.
To further investigate if place of articulation influences the consonantal coordination,
participants‘ production of front-back stop-stop clusters will be compared with back-front
stop-stop clusters in terms of three ratios of measurement.
For the proportion of each cluster, the results in section 4.2.1 show /pt/ has a smaller
C1 proportion than /kt/ while /bd/ has a larger C1 proportion than /gd/. Two
paired-samples t tests do not show significant difference between the two pairs of clusters
(/pt/-/kt/: t = .356, p = .724 > .05; /bd/-/gd/: t = -1.707, p = .096 > .05). On the other hand,
both back-front clusters have higher C1C2/SC1SC2 and C1C2/Rime values than
front-back clusters. Paired-samples t tests show that the differences between /pt/-/kt/
reach significance for both C1C2/SC1SC2 (t = 1.721, p < .001) and C1C2/Rime (t =
2.124, p < .001) values. For the /kt/-/gd/ pair, the differences are also significant (t =
1.726, p < .001) for C1C2/SC1SC2, and for C1C2/Rime (t = 2.431, p = .025 < .05).

63
4.3 The results on stop-fricative clusters
4.3.1 Consonant to cluster (C1/C1C2 & C2/C1C2)
The consonant to cluster ratio is also calculated for stop-fricative clusters. The
results are presented in Table 4-9. Higher C2 proportion and lower C1 proportion for each
cluster are found in four groups. A paired-sample t test reveals the difference is significant
(p< .001). Among the four proficiency groups, EL1 speakers have the highest C1
proportion followed by the advanced group. This is true for every cluster. The C1
proportion of the intermediate and the low groups is close to each other but lower than
EL1 and advanced groups. The opposite situation is found in C2 proportion. This
tendency is clearly illustrated in Figure 4-4, which indicates that proficiency group is an
influential factor in the proportion of each consonant. Two one-way ANOVAs indicate
that C1/C1C2 and C2/C1C2 values vary significantly according to proficiency difference
(C1: F = 11.568, p < .001; C2: F = 10.877, p < .001).
Table 4-9 The average C1/C1C2 & C2/C1C2 of stop-fricative cluster (%)
EL1 Advanced Intermediate Low
/ps/ /p/ 37.77 34.20 31.45 30.28
/s/ 62.23 65.80 68.55 69.72
/bz/ /b/ 39.13 37.33 32.08 33.91
/z/ 60.87 62.67 67.92 66.09
/ks/ /k/ 37.14 35.43 30.24 31.03
/s/ 62.86 64.57 69.76 68.97
/gz/ /g/ 38.29 36.16 32.50 32.72
/z/ 61.71 63.84 67.50 67.28
/ts/ /t/ 33.60 31.02 29.11 27.84
/s/ 66.40 68.98 70.89 72.16
/dz/ /d/ 37.24 34.12 32.58 32.41
/z/ 62.76 65.88 67.42 67.59
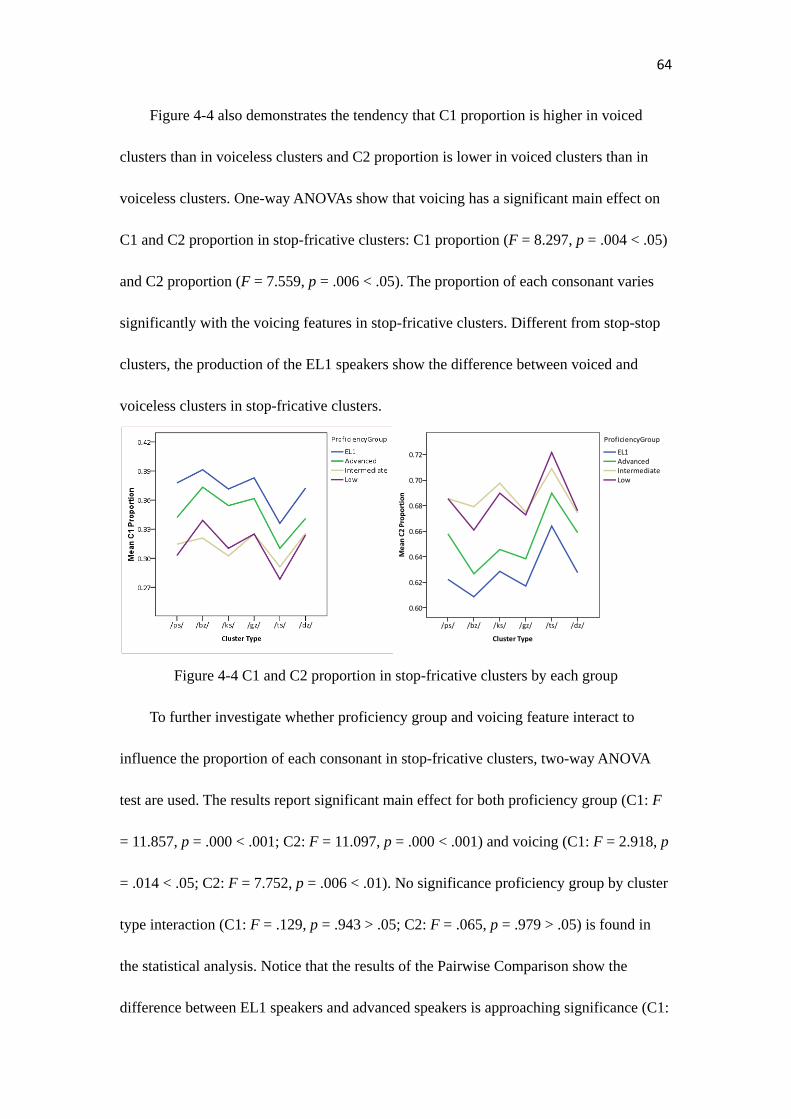
64
Figure 4-4 also demonstrates the tendency that C1 proportion is higher in voiced
clusters than in voiceless clusters and C2 proportion is lower in voiced clusters than in
voiceless clusters. One-way ANOVAs show that voicing has a significant main effect on
C1 and C2 proportion in stop-fricative clusters: C1 proportion (F = 8.297, p = .004 < .05)
and C2 proportion (F = 7.559, p = .006 < .05). The proportion of each consonant varies
significantly with the voicing features in stop-fricative clusters. Different from stop-stop
clusters, the production of the EL1 speakers show the difference between voiced and
voiceless clusters in stop-fricative clusters.
Figure 4-4 C1 and C2 proportion in stop-fricative clusters by each group
To further investigate whether proficiency group and voicing feature interact to
influence the proportion of each consonant in stop-fricative clusters, two-way ANOVA
test are used. The results report significant main effect for both proficiency group (C1: F
= 11.857, p = .000 < .001; C2: F = 11.097, p = .000 < .001) and voicing (C1: F = 2.918, p
= .014 < .05; C2: F = 7.752, p = .006 < .01). No significance proficiency group by cluster
type interaction (C1: F = .129, p = .943 > .05; C2: F = .065, p = .979 > .05) is found in
the statistical analysis. Notice that the results of the Pairwise Comparison show the
difference between EL1 speakers and advanced speakers is approaching significance (C1:

65
F = 3.821, p = .059; C2: F = 2.673, p = .062), while the difference between EL1 and
intermediate speakers, and between EL1 and low speakers is significant (F = 1.734, p
< .001). The production of advanced speakers is also significantly different from that of
the intermediate (C1: F = 1.714, p = .005 < .01; C2: F = 1.823, p = .006 < .01) and the
low (C1: F = 1.143, p = .005 < .01; C2: F = 3.417, p = .01). No significant difference is
found between the intermediate and the low groups (F = 6.133, p = 1.000).
4.3.2 Consonant to pair of individual consonants (C1C2/SC1SC2)
The mean C1C2/SC1SC2 for stop-fricative clusters is 0.806 (SD = 13.176) which is
consistent with Zsiga‘s (2003) finding for English consonant clusters. More specific mean
C1C2/SC1SC2 values are presented in Table 4-10. Different from stop-stop clusters, the
mean C1C2/SC1SC2 values of the four groups are all close to 0.80 regardless of their
proficiency. The group difference is not found in the mean values. However, looking at
the mean values cluster by cluster, the group difference is apparent. For /ps/ and /bz/
clusters, the C1C2/SC1SC2 values increase from EL1 speakers, advanced, intermediate
and low groups. For /ks/ and /gz/ clusters, EL1 speakers still have the lowest
C1C2/SC1SC2 values. Among the three Mandarin-English groups, the values of
advanced and intermediate groups are almost equal to each other. As can be expected, the
means of low group are higher than the other three groups. For /ts/ and /dz/ clusters, the
situation is the opposite of the other clusters. EL1 speakers exhibit the highest
C1C2/SC1SC2 values for /ts/ and /dz/ clusters, while the mean ratios of three
Mandarin-English groups are much lower than EL1 speakers. Nevertheless, there is no

66
great variation among the three Mandarin-English groups. The mean C1C2/SC1SC2
values are approximately 0.70 (SD = 9.452).
Table 4-10 C1C2/SC1SC2 values of stop-fricative clusters
EL1 Advanced Intermediate Low Mean
/ps/ 0.711 0.819 0.836 0.848 0.804
/bz/ 0.741 0.839 0.859 0.874 0.828
/ks/ 0.788 0.874 0.875 0.922 0.865
/gz/ 0.807 0.880 0.881 0.942 0.878
/ts/ 0.833 0.687 0.668 0.670 0.715
/dz/ 0.870 0.724 0.700 0.695 0.747
Mean 0.792 0.803 0.803 0.825 0.806
Figure 4-5 clearly demonstrates the effect of voicing feature. For each group, voiced
clusters have higher C1C2/SC1SC2 values than the corresponding voiceless clusters.
Three independent-samples t tests show the differences between voiced and voiceless
clusters are approaching significance (/ps/-/bz/: t = 1.867, p = .067; /ks/-/gz/: t = 1.139, p
= .083; /ts/-/dz/: t = 1.855, p = .068).
Figure 4-5 C1C2/SC1SC2 of stop-fricative clusters
A two-way ANOVA is conducted in order to further investigate the influence of
proficiency group and voicing features on C1C2/SC1SC2 values of stop-fricative clusters.
There is significant main effect for both proficiency group (F = 8.043, p < .001) and
0
0.1
0.2
0.3
0.4
0.5
0.6
0.7
0.8
0.9
1
EL1 Advanced Intermediate Low
/ps/
/bz/
/ks/
/gz/
/ts/
/dz/

67
voicing features (F = 46.914, p < .001). No significant effect is found in the interaction of
proficiency group and voicing feature (F = .305, p = .821). The results of Multiple
Comparison report that the differences between EL1 speakers and three
Mandarin-English groups all reach the significance at p< .001 level. Among the three
Mandarin-English groups, the difference between advanced and low groups is significant
at p< .01 level. The difference between intermediate and low groups (F = 11.363, p = .068)
is approaching the significance. However, there is no significant difference between
advanced and intermediate groups (F = 13.273, p = .978).
4.3.3 Cluster to rime (C1C2/Rime)
Table 4-11 reports the results of the proportion of the cluster to the rime. The mean
C1C2/Rime of stop-fricative cluster is 0.546 (SD = 16.375), higher than that of stop-stop
clusters. However, the mean value is still lower than that in Ramus, Nespor, and Mehler‘s
study (1999). From the mean values of each group, an interesting finding is that the value
of low group is almost equal to that of EL1 speakers. However, advanced and
intermediate groups perform differently with EL1 speakers, a result not predicted. Within
Mandarin-English groups, the mean values increase as the proficiency decreases.
Table 4-11 The results of C1C2/Rime of stop-fricative clusters
EL1 Advanced Intermediate Low M
/ps/ 0.551 0.547 0.589 0.627 0.579
/bz/ 0.498 0.516 0.544 0.588 0.537
/ks/ 0.577 0.625 0.633 0.633 0.617
/gz/ 0.555 0.591 0.605 0.607 0.590
/ts/ 0.596 0.459 0.446 0.463 0.491
/dz/ 0.565 0.421 0.429 0.432 0.462
Mean 0.557 0.527 0.541 0.558 0.546

68
Although the value of low group is almost equal to EL1 speakers, their performance
on each cluster is quite different. For /ps/, /bz/, /ks/, and /gz/, EL1 speakers have the
lowest mean values, while the low group exhibits the highest mean values among four
groups. Differently, in /ts/ and /dz/ clusters, the mean values of low group are much lower
than EL1 speakers. Besides, three groups of Mandarin-English speakers‘ mean values are
close in /ts/ and /dz/ clusters. This situation is well demonstrated in Figure 4-6.
Figure 4-6 C1C2/Rime of each group on stop-fricative clusters
The differences between voiced and voiceless clusters are reported in Figure 4-6.
Similar with the stop-stop clusters, the voiceless clusters have higher C1C2/Rime values
than the corresponding voiced clusters. This tendency is observed in all four proficiency
groups. Two-way ANOVA tests show there is significant main effect for voicing feature
(F = 12.119, p = .001). However, no significant effect is found in group proficiency (F =
2.523, p = .072 > .05) and the interaction of group and voicing feature (F = .200, p
= .896 > .05).
0
0.1
0.2
0.3
0.4
0.5
0.6
0.7
/ps/ /bz/ /ks/ /gz/ /ts/ /dz/
EL1
Advanced
Intermediate
Low

69
4.3.4 The place of articulation
According to the places of articulation, the stop-fricative clusters in the present study
can be divided into three groups. /ts/ and /dz/ are homorganic clusters because the two
consonants share the same place of articulation (alveolar). /ps/ and /bz/ are front-back
clusters, because the places of articulation move from lip to alveolar. /ks/ and /gz/ are
back-front clusters, because the places of articulation move from velar to alveolar.
A repeated measures ANOVA is conducted for the data of stop-fricative clusters in
order to investigate if the place of articulation is an influential factor on the three
articulatory ratios as well as proficiency group and voicing feature which are found in the
sections above. The voicing feature and the place of articulation are treated as
within-subjects factors and the proficiency group is treated as between-subjects factor.
The results of repeated measures ANOVAs are presented in Table 4-12.
Table 4-12 Results of the repeated measures of ANOVAs of stop-fricative clusters
Variables C1/C1C2 C1C2/SC1SC2 C1C2/Rime
df F df F df F
Between subjects
Proficiency group 3, 35 8.793** 3, 35 8.043** 3, 35 4.278*
Within subjects
Place of articulation 1, 35 2.453 1, 35 202.889** 1, 35 132.843**
Voicing feature 1, 35 11.548** 1, 35 46.914** 1, 35 81.870**
Interactions
Group×Place 3, 35 0.190 3, 35 134.867** 3,35 44.686**
Group×Voicing 3, 35 0.206 3, 35 0.305 3, 35 1.213
Place×Voicing 3, 35 2.109 3, 35 0.855 3,35 1.822
Group×Place×Voicing 3, 35 0.155 3, 35 0.185 3, 35 0.729
*: p < .05. **: p < .001.
The influence of the place of articulation is significant on both C1C2/SC1SC2 and
C1C2/Rime values of stop-fricative clusters at p< .001level. However, there is no

70
significant effect for the place of articulation on the proportion of each consonant cluster.
Meanwhile, the interaction of group and place of articulation also has significant effects
on C1C2/SC1SC2 and C1C2/Rime values of stop-fricative clusters. For other two factors,
significances are found in all three articulatory ratios.
More detailed analysis is conducted to compare the means of three articulatory ratios.
For C1 proportion, the two groups of heterorganic clusters (front-back and back-front)
have similar means. However, the homorganic clusters have the lowest C1 proportion. As
predicted, a one-way ANOVA doesn‘t show significant difference among the three groups.
For both C1C2/SC1SC2 and C1C2/Rime values, the back-front clusters have highest
values followed by front-back clusters and homorganic clusters, regardless of the voicing
feature. The one-way ANOVAs show that the differences among three types clusters
caused by place of articulation are significant at p< .001 level.
4.4 Results on fricative-stop clusters
4.4.1 Consonant to cluster (C1/C1C2 & C2/C1C2)
In Table 4-13 consonant to cluster ratios of fricative-stop clusters are presented
separately. Unlike stop-stop and stop-fricative clusters, C2 proportion is no longer greater
than C1 proportion in fricative-stop clusters. No clear tendency is found through four
groups about the internal structure of fricative-stop clusters. However, some patterns can
be found separately in each group. For EL1 speakers and advanced speakers, the
observation is apparent. C1 proportion is greater than C2 proportion for each
fricative-stop clusters. Two paired-sample t tests show that C1 takes significantly higher

71
proportion than C2 in the fricative-stop clusters for both groups (EL1: t = 16.850, p
< .001; advanced: t = 4.990, p < .001). Significant correlation also exists between C1 and
C2 proportion (EL1: r = -1.000, p < .001; advanced: r = - .987, p < .001) indicating that
clusters which have a high C1 proportion tend to have a low C2 proportion. However, the
difference between EL1 speakers and advanced speakers are obvious. Notice that EL1
speakers‘ C1 proportion is clearly higher than advanced speakers in each fricative-stop
cluster. Accordingly, the opposite situation exists in C2 proportion. Two
independent-samples t tests reveal that EL1 speakers have a mean of 61.12% for C1
proportion which is significantly greater than the mean C1 proportion of advanced
speakers (53.74%). However, the mean C2 proportion is significantly lower in EL1
speakers‘ production than in advanced speakers. The significance reaches p < .001 level
for both proportions. For intermediate and low speakers, the C1 and C2 proportion are
close to each other, which may indicate an approaching equal structure in fricative-stop
clusters by intermediate and low groups.
Table 4-13 C1/C1C2 & C2/C1C2 in fricative-stop clusters (%)
EL1 Advanced Intermediate Low
C1
/st/ 64.24 57.38 55.69 56.70
/zd/ 61.40 52.71 54.60 54.95
/ft/ 61.28 50.26 45.98 46.45
/vd/ 56.93 52.75 50.25 49.82
/sk/ 59.65 53.87 50.35 50.01
/sp/ 63.23 55.30 52.35 53.17
C2
/st/ 36.77 42.62 44.31 43.30
/zd/ 38.60 47.29 45.40 45.05
/ft/ 38.72 49.74 52.73 53.55
/vd/ 43.07 47.25 49.75 50.18
/sk/ 40.35 46.13 49.65 49.99
/sp/ 36.77 44.70 47.65 46.83

72
In the previous section (4.2.1 & 4.3.1) about C1 and C2 proportion, voicing feature
and proficiency group difference is found to be the factors influence speakers‘ C1 and C2
proportion in both stop-stop and stop fricative clusters. In this section, the two factors are
also tested. The two-way ANOVA reports that proficiency group has a significant main
effect on C1 (F = 13.508, p < .001) and C2 (F = 13.491, p < .001) proportion in
fricative-stop clusters. However, there is no significant effect is found for voicing feature
(C1: F = .265, p = .607 > .05; C2: F = .303, p = 582 > .05) or the interaction of
proficiency group and voicing feature (C1: F = .810, p = .490 > .05; C2: F = .720, p
= .541 > .05) on C1 and C2 proportion.
Looking further into the effect of proficiency group, the difference between EL1
speakers and other three Mandarin-English groups all reaches significance (p < .001) for
both proportions. However, there is no significant difference among three
Mandarin-English speaker groups. EL1 speakers have significantly greater C1 proportion
and lower C2 proportion than Mandarin-English speakers in fricative-stop clusters which
also can be observed by the mean proportion presented in Table 4-13.
4.4.2 Cluster to pair of individual consonants (C1C2/SC1SC2)
Table 4-14 presents the mean C1C2/SC1SC2 values in fricative-stop clusters. The
mean ratio of EL1 English speakers is 0.801 which is close to the mean C1C2/SC1SC2
values in stop-stop and stop-fricative clusters. However, due to the high values of
Mandarin-English speakers, the mean C1C2/SC1SC2 value of the whole participants is
0.902 (SD = 17.135), which is much higher than the mean of EL1 speakers.
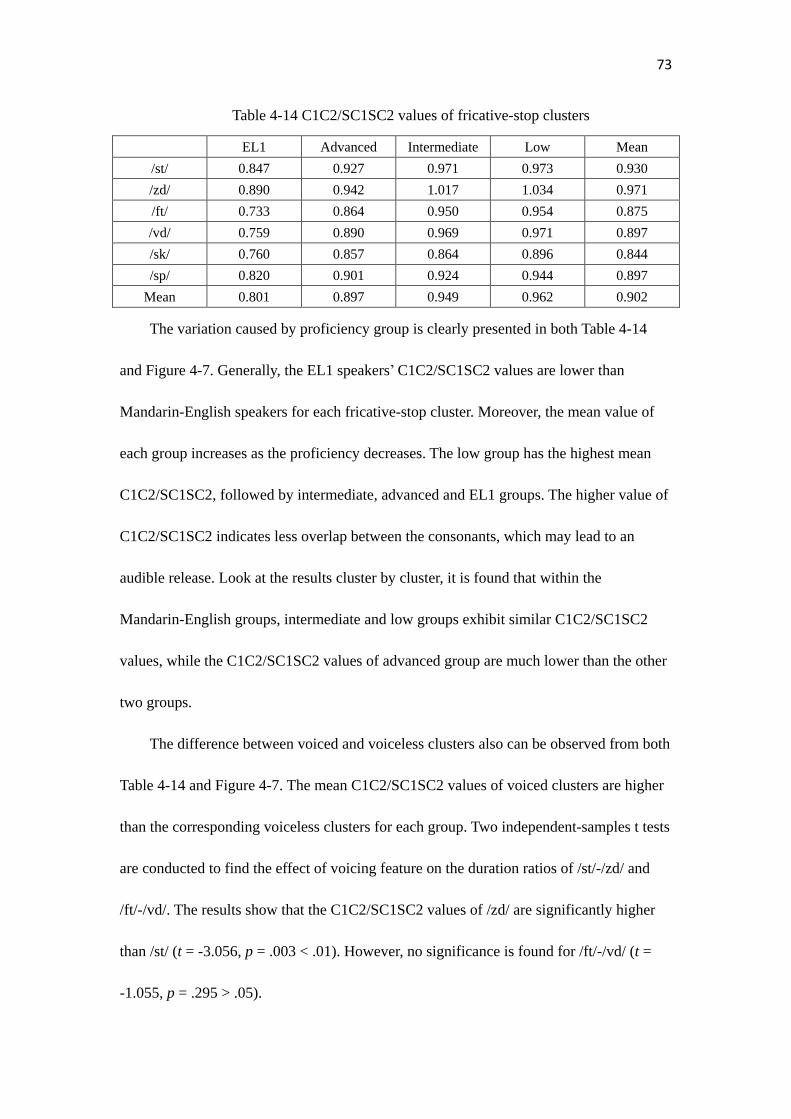
73
Table 4-14 C1C2/SC1SC2 values of fricative-stop clusters
EL1 Advanced Intermediate Low Mean
/st/ 0.847 0.927 0.971 0.973 0.930
/zd/ 0.890 0.942 1.017 1.034 0.971
/ft/ 0.733 0.864 0.950 0.954 0.875
/vd/ 0.759 0.890 0.969 0.971 0.897
/sk/ 0.760 0.857 0.864 0.896 0.844
/sp/ 0.820 0.901 0.924 0.944 0.897
Mean 0.801 0.897 0.949 0.962 0.902
The variation caused by proficiency group is clearly presented in both Table 4-14
and Figure 4-7. Generally, the EL1 speakers‘ C1C2/SC1SC2 values are lower than
Mandarin-English speakers for each fricative-stop cluster. Moreover, the mean value of
each group increases as the proficiency decreases. The low group has the highest mean
C1C2/SC1SC2, followed by intermediate, advanced and EL1 groups. The higher value of
C1C2/SC1SC2 indicates less overlap between the consonants, which may lead to an
audible release. Look at the results cluster by cluster, it is found that within the
Mandarin-English groups, intermediate and low groups exhibit similar C1C2/SC1SC2
values, while the C1C2/SC1SC2 values of advanced group are much lower than the other
two groups.
The difference between voiced and voiceless clusters also can be observed from both
Table 4-14 and Figure 4-7. The mean C1C2/SC1SC2 values of voiced clusters are higher
than the corresponding voiceless clusters for each group. Two independent-samples t tests
are conducted to find the effect of voicing feature on the duration ratios of /st/-/zd/ and
/ft/-/vd/. The results show that the C1C2/SC1SC2 values of /zd/ are significantly higher
than /st/ (t = -3.056, p = .003 < .01). However, no significance is found for /ft/-/vd/ (t =
-1.055, p = .295 > .05).
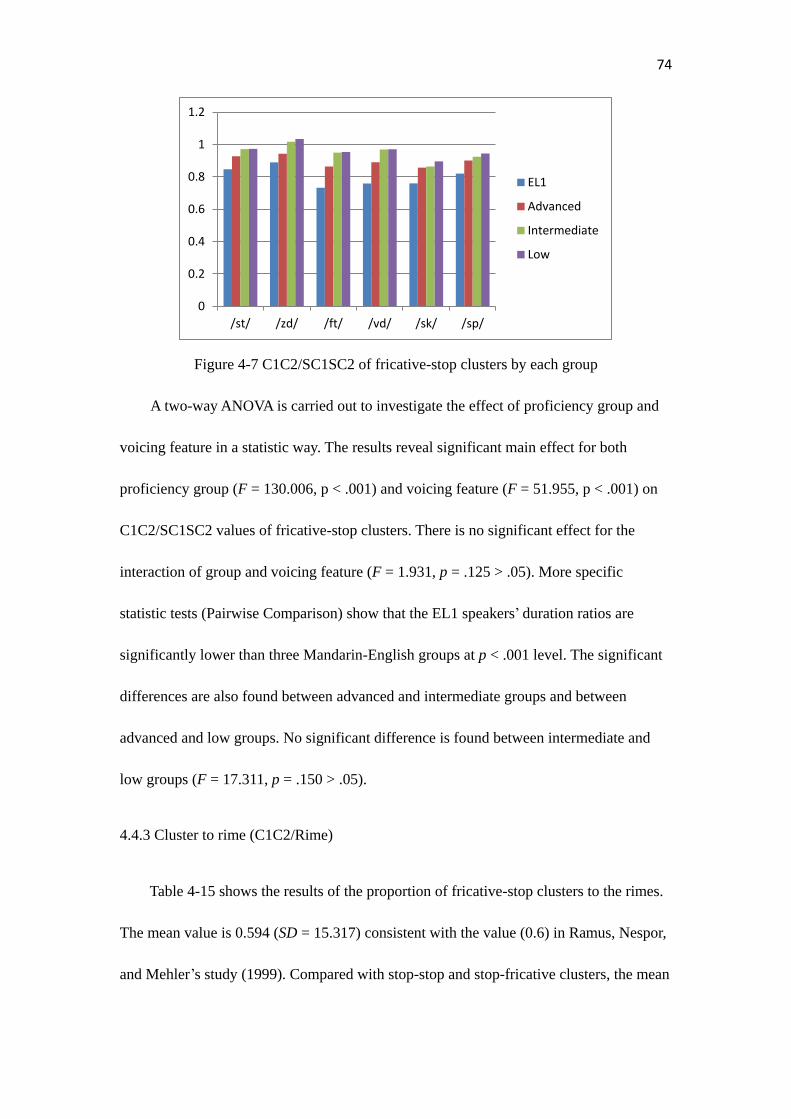
74
Figure 4-7 C1C2/SC1SC2 of fricative-stop clusters by each group
A two-way ANOVA is carried out to investigate the effect of proficiency group and
voicing feature in a statistic way. The results reveal significant main effect for both
proficiency group (F = 130.006, p < .001) and voicing feature (F = 51.955, p < .001) on
C1C2/SC1SC2 values of fricative-stop clusters. There is no significant effect for the
interaction of group and voicing feature (F = 1.931, p = .125 > .05). More specific
statistic tests (Pairwise Comparison) show that the EL1 speakers‘ duration ratios are
significantly lower than three Mandarin-English groups at p < .001 level. The significant
differences are also found between advanced and intermediate groups and between
advanced and low groups. No significant difference is found between intermediate and
low groups (F = 17.311, p = .150 > .05).
4.4.3 Cluster to rime (C1C2/Rime)
Table 4-15 shows the results of the proportion of fricative-stop clusters to the rimes.
The mean value is 0.594 (SD = 15.317) consistent with the value (0.6) in Ramus, Nespor,
and Mehler‘s study (1999). Compared with stop-stop and stop-fricative clusters, the mean
0
0.2
0.4
0.6
0.8
1
1.2
/st/ /zd/ /ft/ /vd/ /sk/ /sp/
EL1
Advanced
Intermediate
Low

75
value of fricative-stop clusters is the highest among the three types. Except /st/ and /zd/
clusters, the means of EL1 speakers are lower than Mandarin-English speakers. Within
the Mandarin-English groups, the means of /st/ and /zd/ clusters decrease from advanced
group to low group. However, the means of /ft/, /vd/, /sk/, and /sp/ are close among three
groups.
Table 4-15 Results of C1C2/Rime of fricative-stop clusters
EL1 Advanced Intermediate Low Mean
/st / 0.621 0.636 0.604 0.552 0.603
/zd/ 0.583 0.602 0.545 0.495 0.556
/ft/ 0.587 0.617 0.626 0.625 0.600
/vd/ 0.541 0.588 0.589 0.583 0.575
/sk/ 0.557 0.570 0.585 0.581 0.573
/sp/ 0.599 0.656 0.651 0.652 0.639
Mean 0.581 0.609 0.603 0.581 0.594
Although the group difference is not apparent, the effect of voicing feature on
C1C2/Rime is obvious in fricative-stop clusters. Similar with the stop-stop and
stop-fricative clusters, the means C1C2/Rime of voiceless clusters are higher than the
corresponding voiced clusters. Two independent-sample t tests show that the mean
C1C2/Rime of /st/ is significantly higher than that of /zd/ (t = 3.252, p = .002 < .01). The
significance is also found in /ft/-/vd/ pair (t = 2.173, p = .033 < .05).
Figure 4-8 The C1C2/Rime of each group in fricative-stop clusters
0
0.1
0.2
0.3
0.4
0.5
0.6
0.7
/st / /zd/ /ft/ /vd/ /sk/ /sp/
EL1
Advanced
Intermediate
Low

76
As in the previous sections, a two-way ANOVA is used to investigate the effect of
proficiency group and voicing feature in a statistical perspective. The results show
significant main effect for voicing feature (F = 19.721, p < .001) on C1C2/Rime values of
fricative-stop clusters. Although there is no clear tendency for group difference in the
mean values, the statistic test also reports the significant effect of group proficiency (F =
2.916, p = .035 < .05) on C1C2/Rime values in fricative-stop clusters. No significance is
found in the interaction of group and voicing feature (F = .954, p = .415 > .05).
4.4.4 Place of articulation
Different from stop-stop and stop-fricative clusters, the fricative-stop clusters in the
present study are paired into two groups to investigate the influence of place of
articulation. The first group includes /sp/, /st/ and /sk/. The second consonant of the three
clusters are different in places of articulation. The second group includes /st/-/ft/ and
/zd/-/vd/. In these four clusters, the first consonant of the clusters are different in places of
articulation.
Among /sp/, /st/, and /sk/, the mean values of the three ratios follow the same
tendency that homorganic cluster /st/ which has the highest values followed by back-front
cluster /sp/ and front-back cluster /sk/. Because the three clusters are all voiceless, only
place of articulation is considered as a within-subjects factor. The results of repeated
measures ANOVA test are showed in Table 4-16. There are significant main effects for
place of articulation on C1/C1C2, C1C2/SC1SC2, and C1C2/Rime values of /sp/-/st/-/sk/
clusters. The interaction of place of articulation and proficiency group is also found to

77
influence C1C2/SC1SC2 and C1C2/Rime values significantly.
Table 4-16 Results of repeated measures ANOVA of /sp/-/st/-/sk/
Variables C1/C1C2 C1C2/SC1SC2 C1C2/Rime
df F df F df F
Between subjects
Proficiency group 3, 35 7.895** 3, 35 156.806** 3, 35 2.144
Within subjects
Place of articulation 1, 35 10.086* 1, 35 374.950** 1, 35 11.077*
Interactions
Group×Place 3, 35 0.173 3, 35 3.652* 3,35 6.399**
*: p < .05. **: p < .001.
In /st/-/ft/ and /zd/-/vd/ clusters, /st/ and /zd/ are treated as homorganic clusters
(alveolar). /ft/ and /vd/ are treated as front-back clusters (labial dental-alveolar). For
/st/-/ft/ pair, the homorganic cluster (/st/) has higher values of three ratios than the
front-back cluster (/ft/). For /zd/-/vd/ pair, the homorganic cluster (/zd/) has higher values
in C1 proportion and C1C2/SC1SC2 than in the front-back cluster (/vd/). While in
C1C2/Rime values, the front-back (/vd/) cluster has a higher value than the homorganic
cluster (/zd/). Different from /sp/-/st/-/sk/ pair, voicing feature is a within-subjects factor
so is place of articulation in the repeated measure ANOVA test. The results of /st/-/ft/ and
/zd/-/vd/ clusters are presented in Table 4-17.
Table 4-17 Results of repeated measures ANOVA of /st/, /zd/, /ft/ and /vd/
Variables C1/C1C2 C1C2/SC1SC2 C1C2/Rime
df F df F df F
Between subjects
Proficiency group 3, 35 4.279* 3, 35 239.383** 3, 35 1.225
Within subjects
Place of articulation 1, 35 21.724** 1, 35 222.194** 1, 35 2.973*
Voicing feature 1, 35 0.361 1, 35 42.483** 1, 35 14.799**
Interactions
Group×Place 3, 35 0.852 3, 35 20.980** 3,35 10.106**
Group×Voicing 3, 35 1.484 3, 35 0.557 3, 35 0.125
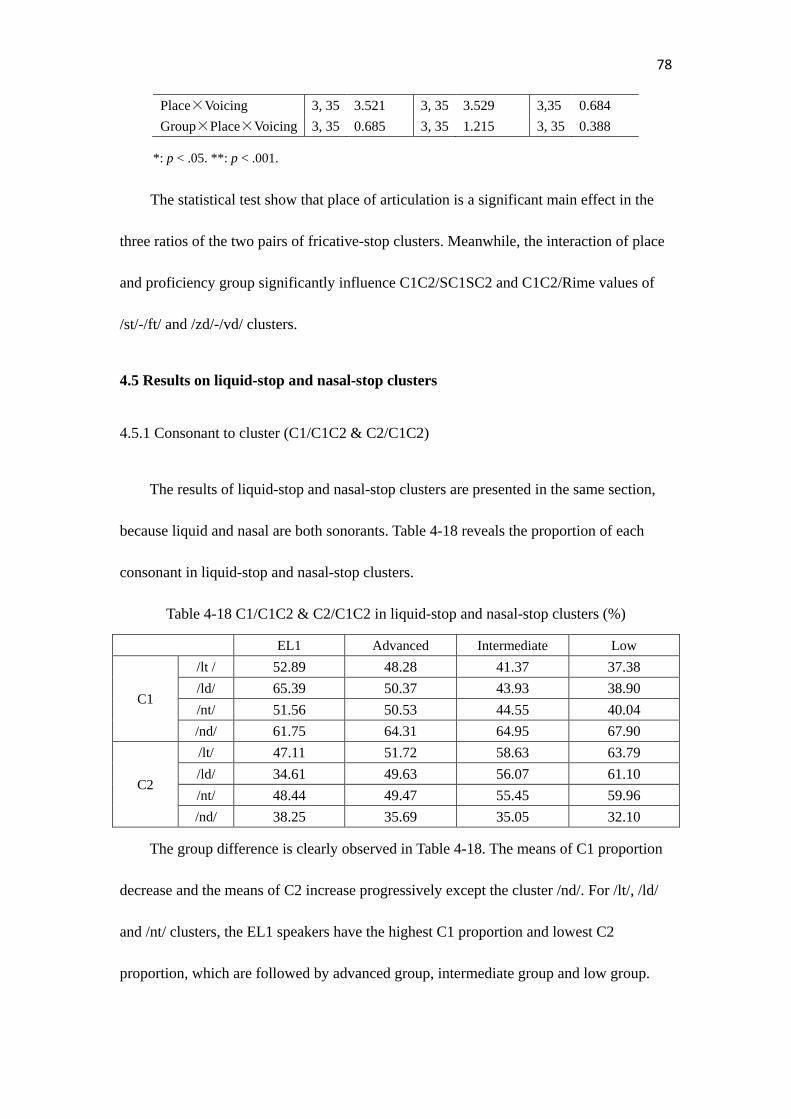
78
Place×Voicing 3, 35 3.521 3, 35 3.529 3,35 0.684
Group×Place×Voicing 3, 35 0.685 3, 35 1.215 3, 35 0.388
*: p < .05. **: p < .001.
The statistical test show that place of articulation is a significant main effect in the
three ratios of the two pairs of fricative-stop clusters. Meanwhile, the interaction of place
and proficiency group significantly influence C1C2/SC1SC2 and C1C2/Rime values of
/st/-/ft/ and /zd/-/vd/ clusters.
4.5 Results on liquid-stop and nasal-stop clusters
4.5.1 Consonant to cluster (C1/C1C2 & C2/C1C2)
The results of liquid-stop and nasal-stop clusters are presented in the same section,
because liquid and nasal are both sonorants. Table 4-18 reveals the proportion of each
consonant in liquid-stop and nasal-stop clusters.
Table 4-18 C1/C1C2 & C2/C1C2 in liquid-stop and nasal-stop clusters (%)
EL1 Advanced Intermediate Low
C1
/lt / 52.89 48.28 41.37 37.38
/ld/ 65.39 50.37 43.93 38.90
/nt/ 51.56 50.53 44.55 40.04
/nd/ 61.75 64.31 64.95 67.90
C2
/lt/ 47.11 51.72 58.63 63.79
/ld/ 34.61 49.63 56.07 61.10
/nt/ 48.44 49.47 55.45 59.96
/nd/ 38.25 35.69 35.05 32.10
The group difference is clearly observed in Table 4-18. The means of C1 proportion
decrease and the means of C2 increase progressively except the cluster /nd/. For /lt/, /ld/
and /nt/ clusters, the EL1 speakers have the highest C1 proportion and lowest C2
proportion, which are followed by advanced group, intermediate group and low group.

79
However, for /nd/, C1 proportion increase and C2 proportion decrease from EL1 speakers
to low group. Looking into each group, it shows that EL1 speakers have a greater C1
proportion than C2 proportion. A paired-samples t test shows the significance (t = 5.881,
p < .001) of the difference between C1 and C2 proportion for EL1 speakers. But this
tendency cannot be spotted in the other three groups.
Same as stop-stop, stop-fricative, and fricative-stop clusters, the difference between
voiced and voiceless clusters is apparent in Figure 4-9. For EL1 speakers, the influence
by voicing feature is obvious. Higher C1 proportions and lower C2 proportions is clearly
shown in voiced clusters than in voiceless ones. However, the three Mandarin-English
groups have their own patterns on the four clusters. For liquid-stop clusters, although the
three Mandarin-English groups exhibit a higher C1 proportion and a lower C2 proportion
in the voiced cluster than in the voiceless one, the degree of difference is not as great as
that of the EL1 speakers. Different from liquid-stop clusters, just like the EL1 speakers,
all three Mandarin-English groups show an enormous increase of C1 proportion and a
sharp drop of C2 proportion from the voiceless cluster to the voiced cluster.
Figure 4-9 C1 and C2 proportion in liquid-stop and nasal-stop clusters
Two-way ANOVAs treat proficiency group and voicing feature as independent

80
variables and C1, C2 proportions as dependent variables. The results report significant
main effect for both proficiency group (C1: F = 6.469, p < .001; C2: F = 6.701, p < .001)
and voicing feature (C1: F = 29.929, p < .001; C2: F = 30.512, p < .001) on C1 and C2
proportion in liquid-stop and nasal stop clusters. There is no significant effect for the
interaction between proficiency group and voicing feature (C1: F = .435, p = .728 > .05;
C2: F = .522, p = .668 > .05).
Further analysis by the Pairwise Comparison on the variation by group difference
shows that there is significant difference between EL1 speakers and Mandarin-English
speakers. The difference between EL1 and advanced groups reaches the significance for
C1 proportion (F = 13.153, p = .040 < .05) and for C2 proportion (F = 11.769, p
= .041< .05). The difference between the EL1 and the intermediate groups and the
difference between the EL1 and the low groups all reach the significant level of p < .001
for both C1 and C2 proportion. Among the three Mandarin-English groups, no
significance is found between advanced and intermediate groups (C1: F = 7.913, p
= .121 > .05; C2: F = 15.741, p = .123 > .05) and between intermediate and low groups
(C1: F = 3.473, p = .305 > .05; C2: F = 1.977, p = .257 > .05). But there is significant
difference between advanced and low groups for both C1 (F = 1.747, p = .016 < .05) and
C2 (F = 1.791, p = .012 < .05) proportions.
4.5.2 Cluster to pair of individual consonants (C1C2/SC1SC2)
The mean C1C2/SC1SC2 values of liquid-stop and nasal-stop clusters are presented
in Table 4-19. The mean C1C2/SC1SC2 for the four clusters is 0.861(SD = 20.351).

81
Separately, the mean of liquid-stop clusters is 0.851 (SD = 17.953) and the mean of
nasal-stop clusters is 0.872 (SD = 23.753). The three means are higher than the values
found in the previous studies.
Table 4-19 C1C2/SC1SC2 in liquid-stop and nasal-stop clusters
EL1 Advanced Intermediate Low Mean
/lt/ 0.826 0.850 0.869 0.876 0.855
/ld/ 0.853 0.896 0.813 0.823 0.846
Mean 0.840 0.873 0.841 0.849 0.851
/nt/ 0.837 0.895 0.882 0.857 0.871
/nd/ 0.887 0.889 0.861 0.861 0.873
Mean 0.864 0.892 0.871 0.859 0.872
Different from other types of clusters in the present study, the advanced group has
the highest duration ratios for both liquid-stop and nasal-stop clusters. For the other three
groups, the means of intermediate group are almost equal to the EL1 speakers in both
types of clusters. As to the voicing feature effect, no consolidated tendency can be
observed. In the other cluster types, the duration ratios in voiced clusters are all higher
than in the voiceless clusters. For liquid-stop and nasal-stop clusters, this tendency is only
followed by EL1 speakers. As predicted, two two-way ANOVAs show no significance for
the proficiency group, the voicing feature, or the interaction of proficiency group and
voicing feature in neither liquid-stop or nasal-stop clusters.
In order to find the reason why participants‘ performances are different with other
three groups of clusters, the individual data are analyzed. For both types of clusters,
deletion is found in the production of Mandarin-English speakers. In all 124 liquid-stop
tokens, deletion is found in 16 tokens. And in 124 nasal-stop tokens, deletion is found in
19 tokens. For liquid-stop clusters, Mandarin-English speakers tend to delete the liquid in
the cluster. For nasal-stop clusters, Mandarin-English speakers tend to delete the nasal in

82
the voiceless cluster (6), while to delete the stop in the voiced cluster (13). Although,
compared with the large number of tokens, the deletion here only takes a small proportion;
the mean of C1C2/SC1S2C may decreases a lot because of the absence of one consonant
in the cluster.
4.5.3 Cluster to rime (C1C2/Rime)
The proportions of liquid-stop and nasal-stop clusters to the rimes are presented in
Table 4.5.3. The mean value of liquid-stop clusters is 0.594 (SD = 17.531) higher than
that of nasal-stop clusters (0.570). Moreover, for Mandarin-English speakers, the mean
values of liquid-stop clusters are all higher than those of nasal-stop clusters. However, the
reverse situation is found in EL1 speakers‘ production. The influence of voicing feature is
also illustrated in Table 4-20. The mean values of voiceless clusters are all higher than
those of voiced clusters. This tendency is straight for each cluster and each group.
Table 4-20 The results of C1C2/Rime of liquid-stop and nasal-stop clusters
EL1 Advanced Intermediate Low M
/lt / 0.608 0.641 0.631 0.607 0.623
/ld/ 0.562 0.593 0.574 0.534 0.566
Mean 0.585 0.617 0.603 0.571 0.594
/nt/ 0.670 0.580 0.571 0.534 0.589
/nd/ 0.618 0.545 0.528 0.507 0.550
Mean 0.644 0.563 0.550 0.521 0.570
A two-way ANOVA is used as before to investigate the effect of group and voicing
feature in a statistical perspective. As predicted, the results show significant main effects
for both proficiency group (F = 6.822, p < .001) and voicing feature (F = 17.678, p
< .001). However, no significance is found in the effect of the interaction of group and
voicing feature (F = .024, p = .995 > .05).

83
4.6 Manners of articulation
The effect of manner of articulation on consonantal overlap is of interest in the
present study. In the sections above, the place of articulation and voicing feature are
found to be the influential factors on overlap. Thus, in this section, the two factors will be
controlled.
Two research questions are asked in this section. The first one is whether a stop is
more overlapped by a following stop than by a following fricative. The three articulatory
parameters of /kt/-/ks/ and /gd/-/gz/ are compared to answer this question. The second
question is when the first consonant is a fricative, a nasal or a liquid, which is more
overlapped by a following consonant. In the previous studies, stop is found to be more
overlapped by a following consonant than is a fricative (Byrd, 1996; Zsiga, 2000).
Because of the limitation of the English phonotactics, there are no stop-C clusters which
are missing in the comparison under the control of place of articulation in the present
study. However, I would like to continue the previous studies to involve more types of
manners.
For /kt/-/ks/ and /gd/-/gz/, to investigate the effect of manner on the overlap of the
two types of clusters, a repeated-measure ANOVA is conducted, which treats manner and
voicing feature as within-subjects factors. The results of repeated measures ANOVAs are
presented in Table 4-21. Significant main effect for manner of articulation is found in
three ratios.

84
Table 4-21 Results of repeated measures ANOVAs of /kt/, /ks/, /gd/ and /gz/
Variables C1/C1C2 C1C2/SC1SC2 C1C2/Rime
df F df F df F
Between subjects
Proficiency group 3, 35 1.499 3, 35 223.018** 3, 35 3.947*
Within subjects
Manner of articulation 1, 35 62.348** 1, 35 28.329** 1, 35 132.858**
Voicing feature 1, 35 16.941** 1, 35 19.351** 1, 35 104.692**
Interactions
Group×Manner 3, 35 1.232 3, 35 29.966** 3,35 0.396
Group×Voicing 3, 35 3.662* 3, 35 1.171 3, 35 0.195
Manner×Voicing 3, 35 7.060* 3, 35 3.805* 3,35 11.751*
Group×Manner×Voicing 3, 35 2.614 3, 35 0.102 3, 35 3.847*
*: p < .05. **: p < .001.
Comparing the mean values of /kt/ and /ks/, /gd/ and /gz/, the stop-stop clusters have
higher values than stop-fricative clusters in C1 proportion and C1C2/SC1SC2. However,
for C1C2/Rime, stop-fricative clusters have lower mean values than stop-stop clusters.
Higher C1 proportion and C1C2/SC1SC2 values indicate less overlap between the
consonants, which means stop-stop clusters have less overlap than stop-fricative clusters
in the present study. However, higher C1C2/Rime values suggest less overlap, which
means stop-fricative clusters have less overlap according to the comparison of the mean
values of C1C2/Rime. Thus, the two findings are in conflict with each other. Meanwhile,
in Byrd‘s (1996) study, he found that ―the sequences including a fricative are less
overlapped than those having only stops‖. Notice that the present study includes both EL1
and Mandarin-English speakers, while Byrd‘s study only investigated EL1 speakers. If
only take EL1 speakers‘ data into consideration, it is found that the mean C1C2/SC1SC2
values of stop-stop clusters are lower than stop-fricative clusters, which indicates more
overlap in stop-stop clusters. Thus, from the lower C1C2/SC1SC2 and C1C2/Rime values

85
of stop-stop clusters, it can be inferred that more overlap is in stop-stop clusters than in
stop-fricative clusters.
To answer the second research question in this section, the data of /st/-/lt/-/nt/,
/zd/-/ld/-/nd/ are compared. Similarly, manner and voicing feature are treated as
within-subjects factors and treat proficiency group as between-subjects factor. A repeated
measures ANOVA is conducted to investigate the effect of manner of articulation in
fricative-stop, liquid-stop and nasal-stop clusters. The results are reported in Table 4-22.
The effect of manner is found to be significant in C1C2/SC1SC2 and C1C2/Rime values.
And the interaction of group and manner is only significant in C1C2/SC1SC2 values. The
interaction of two within-subjects factors is significant in C1 proportion and
C1C2/SC1SC2 values.
Table 4-22 Results of repeated measures ANOVA of /st/-/lt/-/nt/, /zd/-/ld/-/nd/
Variables C1/C1C2 C1C2/SC1SC2 C1C2/Rime
df F df F df F
Between subjects
Proficiency group 3, 35 7.761** 3, 35 2.404 3, 35 8.164**
Within subjects
Manner of articulation 1, 35 0.570 1, 35 29.773** 1, 35 6.525*
Voicing feature 1, 35 30.012** 1, 35 1.965 1, 35 57.007**
Interactions
Group×Manner 3, 35 0.669 3, 35 6.160* 3,35 1.205
Group×Voicing 3, 35 0.811 3, 35 1.403 3, 35 0.257
Manner×Voicing 3, 35 45.718** 3, 35 4.935* 3,35 0.319
Group×Manner×Voicing 3, 35 1.387 3, 35 0.574 3, 35 0.312
*: p < .05. **: p < .001.
In order to further analyze the data, a detailed comparison is conducted among
stop-stop (/st/ & /zd/), liquid-stop (/lt/ & /ld/) and nasal-stop (/nt/ & /nd/) clusters. As
mentioned in section 4.5.1 to 4.5.4, deletion occurrs in Mandarin-English speakers‘
86
production. Thus, for the detailed comparison, only EL1 speakers‘ data is of the interest.
According to the data in previous sections (4.4 & 4.5), two consolidated tendencies are
found in C1C2/SC1SC2 and C1C2/Rime values for EL1 English speakers. For
C1C2/SC1SC2 values, fricative-stop clusters have the highest means followed by
nasal-stop clusters and liquid-stop clusters. However, in C1C2/Rime values, nasal-stop
clusters have the highest values followed by fricative-stop clusters and liquid-stop
clusters. Notice that liquid-stop clusters have the lowest values in both ratios, which
indicates liquid-stop clusters have the most overlap among three types of clusters.

87
Chapter Five
GENERAL DISCUSSION
In Chapter Four, the data and analysis bring about a number of interesting findings.
Several issues regarding the findings remain to be discussed. This chapter tries to group
the discussion according to the factors that influence the overlap between the consonants
of the clusters in the coda position. The first section summarizes and describes the
consonantal overlap found in the present study. The second and third sections explore
the influence of place and manner of articulation on the consonantal overlap. The forth
section discusses the effect of the unexpected factor, voicing feature on the coordination
of the consonants. The last section takes the differences among four proficiency groups
into consideration.
5.1 The overlap between English consonants
The first finding can be drawn from the three ratios in this study is that English
consonants display a large amount of overlap. Native Canadian English speakers in this
study do not pull the closures apart to avoid an audible release between the two
consonants in the clusters. The values of C1C2/SC1SC2 are strong evidence for the
consonantal overlap. The mean C1C2/SC1SC2 values in the present study range from
0.715 to 0.971. For EL1 speakers, the average C1C2/SC1SC2 is from 0.708 to 0.890. A

88
C1C2/SC1SC2 approximately from 0.70 to 0.90 indicates that the consonants are
overlapped on average for 30% to 10% of their duration. Catford (1977) found the
degree of articulatory overlap between two consonants was from 29% to 45% of the
total duration in an EPG study. In another EPG study, Byrd (1996) reported the overlap
of contact for two adjacent consonants was between 27% and 59%. A wider range of
overlap (from 11% to 91%) was also reported using total contact duration to indicate the
duration of clusters. In an acoustic study, Zsiga (2003) found the average amount of
overlap in English consonant clusters is around 20%. In general, according to different
instruments, the amount of consonantal overlap varies in the previous studies. The
average consonantal overlap in the present study is smaller than that in the previous
studies. Nevertheless, this amount of overlap cannot facilitate an audible release
between the two consonants.
The overlap between adjacent consonants in English reflects the model of economy
of speech gestures (Lindblom, 1983). This approach highlights the muscular force
needed for specific articulation. In the speech production, speakers prefer ease of
articulation. Kirchner (2000) adopted an effort approach using OT theory to analyze
germination. A constraint LAZY was proposed as a scalar effort minimization constraint.
The effort cost is calculated for each candidate. Longer constriction and larger area of
lingual-palatal contact cost more effort, which violates the LAZY constraint. In this case,
stops cost more effort than fricatives because of their larger articulatory displacement. In
order to achieve the ease of articulation, stops may be more overlapped in speakers‘
production.

89
In the results of C1C2/SC1SC2, Mandarin-English speakers have less overlap than
EL1 speakers. Intermediate and low groups even have C1C2/SC1SC2 values higher than
1 in /gd/ (refers to Table 4-6) and /zd/ (refers to Table 4-14) clusters. Mandarin-English
speakers try to maintain the acoustic cues to maximize lexical contrast in the coda
position. However, EL1 speakers do not using the organization of timing to preserve the
lexical contrast.
5.2 Place of articulation
The effect of place of articulation is explored in stop-stop, stop-fricative, and
fricative-stop clusters. Among three ratios, significant main effect is found in
C1C2/SC1SC2 values in all three types of clusters. For C1 proportion and C1C2/Rime,
the significant effect of place of articulation is also found but not in all three types of
clusters.
With respect to the amount of overlap of consonant clusters, the following place of
articulation effect is observed in the analysis of front-back, back-front and homorganic
clusters: tongue tip obstruents are more overlapped by a following tongue body
obstruent than tongue body obstruents are by a following tongue tip obstruent. The
results of C1C2/SC1SC2 and C1C2/Rime report that front-back clusters have a lower
C1C2/SC1SC2 and C1C2/Rime values than back-front clusters in all three types of
clusters. More overlap in the cluster leads to shorter total duration of the cluster. As a
result, the values of C1C2/SC1SC2 and C1C2/Rime are lower in the clusters with more
overlap. Thus, the front-back consonant clusters are more overlapped than the back-front

90
consonant clusters.
The parallel findings are also reported in previous research. Hardcastle & Roach
(1979) showed that, in /tk/ and /kt/ clusters, the duration from the closure of the first
consonant to the initial of the second consonant was longer in a /kt/ cluster than in a /tk/
cluster. Byrd (1996) compared lingual-palatal contact of the heterorganic clusters /g#d/,
/d#g/, /g#s/ and /s#g/ in an EPG study. Significantly more ligual-palatal contact and
longer contact duration were found in/d#g/ and /s#g/ clusters than in /g#d/ and /g#s/
clusters. From an articulatory approach, in a front-back cluster, the movement of
articulator from a tongue tip sound to a tongue body sound only involves one raising
movement of the back of the tongue. However, for a back-front cluster, the tongue
should move forward and upward to reach the alveolar. In this process, an additional
muscle is involved, which is used to replace the tongue position. Moreover, Recasens et
al. (1993) proposed that the greater flexibility of tongue tip brings about great
anticipatory coarticulation. This explanation is under a pure articulatory approach.
However, Browman & Goldstein (1992) suggested that differential acoustic effect might
be a reason that one kind of intergestural organization is favorable over the other. This
statement indicates that acoustic and perceptual goals may be a factor causing different
amount of overlap.
The auditory motivation was addressed by Johnson et al. (1993). They claimed that
the perceptual goals are ―the crucial determinant‖ of the organization of articulation. At
the same time, Kohler (1992) adopted the similar approach to explain the coda reduction
as a result of speakers complying with the principle of economy of effort. Speakers
91
reduce ―what is not very distinctive for a listener‖ to save the effort of articulation (1992,
p. 231). Thus, relatively less perceptually valuable acoustic cues are more likely to be
obscured by temporal overlap. If the alveolar consonants do not contain as powerful
perceptual cues as velar consonants in the coda position, the speakers may take the effort
of articulation into consideration and decide to how to assign articulatory resources in
production.
To explain why front-back clusters are more overlapped than back-front clusters in
the present study, which type of consonants are more obscure to the listeners may be
asked, the alveolar consonants or the velar consonants? Winitz, Scheib & Reeds (1972)
reported that the alveolar consonants caused more confusion for listeners than velar
consonants in the coda position. Therefore, alveolar sounds may not be worthy of more
articulatory effort. In a consonant cluster, when the first consonant is an alveolar
followed by a velar, the speakers tend to obscure the less perceptually valuable alveolar
sound by overlap. However, in a velar-alveolar cluster, the speakers may keep more cues
of velar sound to achieve the efficiency of communication. The similar explanation is
found in Byrd‘s (1996) EPG study. More overlap was found in /d#g/ than /g#d/ in his
study. He stated that ―the cues for the unreleased /d/ are so weak to start with; there is
little motivation for the speaker to safeguard them‖ (1996, p. 235). Alveolar /d/ has a
rapid and small formant transition, which doesn‘t affect F3 largely. Thus, the more
remarkable velar /g/ is easily to overwhelm /d/.
Homorganic clusters are also of the interest in the present study. Compared
homorganic clusters with the two types of heterorganic clusters, the homorganic clusters

92
have the highest values in fricative-stop clusters. However, in stop-fricative clusters, the
homorganic clusters have the lowest values. To find the reason of the conflicting results,
detailed data are taken into consideration. In the stop-fricative clusters, the significant
lower values of C1C2/SC1SC2 (refers to Table 4-10) and C1C2/Rime (refers to Table
4-11) of Mandarin-English speakers cause the means of homorganic clusters to be lower
than the two heterorganic clusters. If I only take the data of EL1 speakers into
consideration, it is found that the homorganic clusters have the highest C1C2/SC1SC2
and C1C2/Rime values in stop-fricative clusters as well as in fricative-stop cluster.
Higher C1C2/SC1SC2 and C1C2/Rime values indicate less overlap. Thus, among three
types of clusters, homorganic clusters have most overlap. In English /st/, /zd/, /ts/, and
/dz/ clusters, the second consonant is activated when the tip-blade articulator is already
in contact with the dental-alveolar zone. Throughout the whole sequence, the tip-blade
maintains the contact at the target position. Thus, no acoustic release is produced
between the consonants. Meanwhile, the same articulation place doesn‘t provide more
possibility of overlap between the consonants.
5.3 Manner of articulation
The effect of manner of articulation is investigated in two groups. In the first group,
the second consonants are different in manners of articulation. In the second group, the
first consonants are different in manners of articulation. Two repeated measures
ANOVAs report the significant main effect for manner of articulation in C1C2/SC1SC2
and C1C2/Rime values for both groups.

93
With respect to the amount of overlap between the consonants, the detailed effect of
manner is observed in the comparison of two groups: a) a stop consonant is overlapped
more by a stop consonant than by a fricative consonant; b) a liquid is overlapped more
by a stop consonant than by a nasal and a fricative.
In the /kt/-/ks/ and /gd/-/gz/ pairs, higher C1C2/SC1SC2 and C1C2/Rime values are
found in /ks/ and /gz/ clusters than in /kt/ and /gd/ clusters, which indicate that /kt/ and
/gd/ have more overlap than /ks/ and /gz/. This finding is consistent with Byrd‘s (1996)
study. He found that ―the sequences including a fricative are less overlapped than those
having only stops‖ (1996, p. 223). The more overlap of stop-stop clusters can be
explained by the effort-based approach. According to the effort computation, stop
consonants require more energy than fricative consonants. Stops are formed by a
complete closure in the speech tract. The airstream is blocked by a complete constriction
in the oral cavity. However, fricative is produced by a narrow or partial obstruction with
friction in the oral cavity. A complete obstruction may take more energy in the universal
effort computation. Meanwhile, stops have a larger articulatory displacement and more
muscular force than fricatives. To obtain the ease of articulation, speakers may reduce
the articulation force of stops by overlap. The effort-based approach is from an
articulatory perspective to explain the overlap between consonants. That is to say the
effort constraint is only based on speakers‘ articulation ease but does not take listeners‘
perception into consideration.
In fact, there may be a perceptual or acoustic motivation for the overlap difference
between stops and fricatives. As stated in the 5.2 section, speakers may keep the more

94
perceptually valuable cues for listeners to recover the consonant. For stops, the salient
perceptual cue is a short duration burst followed by a F2 transition at the edges of the
stop consonants (Li, Menon, & Allen, 2009). However, for fricatives, the distribution of
the fricative noise is important for perception. Dorman et al. (1980) reported that the
following factors caused the perceptual salience of fricatives: the release burst, the rising
time of the fricative noise and the duration of the fricative noise. Stevens & Keyser
(1989) showed that the frequency distribution of fricative noise was valuable perceptual
cues for listeners. From the two previous studies, the fricative noise is a salient cues to
recover a fricative. Thus, in the clusters, speakers don‘t obscure too much of the fricative
noise for a perception motivation. However, for a stop consonant, only the short burst
and F2 transition need to be kept as perceptual salient cues.
5.4 The effect of voicing feature on articulatory timing
The voicing feature is an unexpected influential factor in articulatory timing.
However, in every type of clusters, the significant effect of voicing feature is found with
respect of amount of overlap between consonants. In the present study, the voiceless
clusters have more overlap than the corresponding voiced clusters. Significantly higher
C1C2/SC1SC2 and low C1C2/Rime values are found in voiced clusters than in the
corresponding voiceless clusters. This tendency is presented in every type of clusters
regardless of their place and manner of articulation.
The previous studies showed that the oral constriction size of voiceless obstruent is
greater than of voiced obstruent (Ladefoged & Maddieson, 1996). From an articulatory

95
perspective, the voiced obstruent narrows the constriction in a more anterior position to
keep the intraoral airstream low and facilitate the vocal fold vibration. Thus, the voiced
consonants have a less constriction size than voiceless consonants. This claim was
confirmed by the previous studies. Dixit & Homffman (2004) reported narrow
constriction size for /z/ than /s/. A palatographic study, conducted by Farnetani (1990),
reported greater tongue contact degree for voiceless stops than voiceless stops. Thus, the
voiceless obstruent takes more articulation resource than the corresponding voiced
obstruent. For the reason of ease of articulation and the economy principle, the speakers
tend to reduce the voiceless obstruent by temporal consonantal overlap.
5.5 The group difference in articulatory timing
Whether Mandarin-English speakers‘ proficiency will influence their production of
articulatory timing in consonant clusters is one of the research questions in the present
study. The significant effect for proficiency group is found in each type of clusters in
terms of three ratios. Although the significance is not all three ratios for each type of
clusters, significant effect of proficiency group is found in at least two ratios.
With respect of the amount of overlap in the present study, the effect of proficiency
groups is observed in the analysis of the values of three ratios in every type of clusters: a)
Generally speaking, Mandarin-English speakers show less amount of consonantal
overlap than EF1 speakers; b) The advanced group of Mandarin-English speakers‘
performance is close to that of EL1 speakers. However, the intermediate and low group
of Mandarin-English speakers exhibit similar performance. The Mandarin-English

96
speakers present higher mean C1C2/SC1SC2 and C1C2/Rime values than EL1 speakers
in every type of clusters. The higher values indicate less consonantal overlap in the
clusters. Meanwhile, audible release is observed in intermediate and low proficiency
group speakers‘ production according to the values of C1C2/SC1SC2 (C1C2/SC1SC2
above 1 indicates an audible release.). However, an audible release is not an important
acoustic goal for English EL1 speakers. English does not organize articulatory timing to
preserve the contrast in coda position. In terms of OT theory, the Mandarin-English
speakers rank the constraint that segmental contrasts in coda position should be
maintained high in their phonology. In contrast, English EL1 speakers rank this
constraint very low. Thus, the more gestural overlap is presented in EL1 English
speakers‘ output.
In all the twenty target clusters, it is found find that Mandarin-English speakers
only show more overlap than EL1 speakers in /ts/ and /dz/ clusters (refers to Table 4-10
& Table 4-11). Previous language experience is considered as a reason for the difference
in these two clusters. According to Speech Leaning Model (Flege, 1995), second
language learners perceived the L2 sounds into L1 category on the similarity despite the
difference of in phonetic features of the phonemes. Therefore, the L2 sounds which are
similar to L1 are more likely to be difficult for second language learners. Notice that
Mandarin Chinese is rich in affricates. There are six affricates in Mandarin Chinese that
contrast by place of articulation, tongue posture, and presence or absence of aspiration
(Table 5-1). Therefore, Mandarin-English speakers have rich experience in affricates.
The two clusters /ts/ and /dz/ here may be put into the Mandarin affricates category by
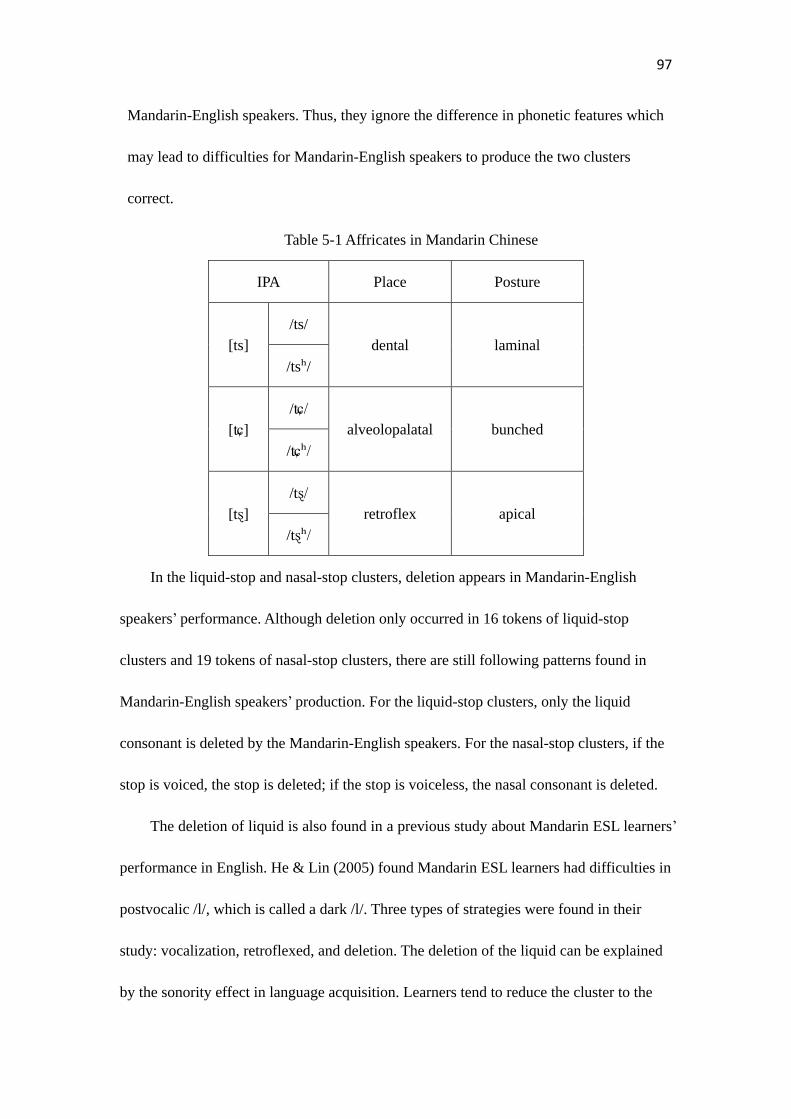
97
Mandarin-English speakers. Thus, they ignore the difference in phonetic features which
may lead to difficulties for Mandarin-English speakers to produce the two clusters
correct.
Table 5-1 Affricates in Mandarin Chinese
IPA Place Posture
[ts]
/ts/
dental laminal
/tsʰ/
[ʨ]
/ʨ/ alveolopalatal bunched
/ʨʰ/
[tȿ] /tȿ/
retroflex apical
/tȿʰ/
In the liquid-stop and nasal-stop clusters, deletion appears in Mandarin-English
speakers‘ performance. Although deletion only occurred in 16 tokens of liquid-stop
clusters and 19 tokens of nasal-stop clusters, there are still following patterns found in
Mandarin-English speakers‘ production. For the liquid-stop clusters, only the liquid
consonant is deleted by the Mandarin-English speakers. For the nasal-stop clusters, if the
stop is voiced, the stop is deleted; if the stop is voiceless, the nasal consonant is deleted.
The deletion of liquid is also found in a previous study about Mandarin ESL learners‘
performance in English. He & Lin (2005) found Mandarin ESL learners had difficulties in
postvocalic /l/, which is called a dark /l/. Three types of strategies were found in their
study: vocalization, retroflexed, and deletion. The deletion of the liquid can be explained
by the sonority effect in language acquisition. Learners tend to reduce the cluster to the

98
segment with lease sonority in the cluster (Ohala, 1999; Barlow, 2003). Sonority patterns
are reported to be common in phonological acquisition. According to sonority hierarchy,
liquid is more sonorous than stop. Thus, speakers may delete the liquid to reach the least
sonority of the cluster. This sonority pattern is also found in the nasal-voiced stop clusters
in the present study. However, the deletion of nasal consonant in nasal-voiceless stop
clusters violates the sonority pattern in the present study. The deletion of more sonorous
segment was also found in child language acquisition. Smith (1973) reported the same
deletion patter in a longitudinal study about child English acquisition. The participant in
his study dropped the sonorant in the sonorant-voiced clusters, however, dropped the
obstruent in the sonorant-voiceless clusters. The similar findings were reported in child
language acquisition in Spanish (Barlow, 2003) and Mexican (Macken, 1979). Moreover,
in the acquisition of Spanish nasal-stop clusters (Macken, 1979), a similar gemination
pattern was found. In nasal-voiceless stop clusters, voiceless stop gemination occurred
(/nt/ became /tt/). However, in nasal-voiced stop clusters, nasal gemination occurred (/nt/
became /nn/). Barlow (2003) explained the violation of sonority patterns as the conflict
between markedness (*VOICEOBSTR) and faithfulness constraints (IDENT-VOICE)
with the sonority constraint. And the ranking depends on the voicing contrast in the
grammar.
99
Chapter Six
CONCLUSION
The final chapter concludes the study and findings. The conclusion is grouped into
two sections. In the first section, the findings are summarized in terms of research
questions. Both theoretical and pedagogical implications are drawn from the findings. In
the second section, the limitation and the remaining questions are considered.
Accordingly, the further research is proposed afterwards.
6.1 Summary of the research
The aim of the study was to find the articulatory timing of English consonant
clusters in coda position by both EL1 English speakers and Mandarin-English speakers.
There were two major focuses in the present study. The first focus was the factors that
influence the articulatory timing of English consonant clusters. The two predicted factors
were the place and manner of articulation. To investigate the effect of the two factors, 20
consonant clusters were chosen according to their place and manner of articulation.
Meanwhile, the 20 clusters were divided into five groups based on the manners of the first
consonant in the cluster. The second aim was to investigate the difference between EL1
speakers and Mandarin-English speakers in terms of articulatory timing of consonant
clusters. Four groups of participants were involved in the present study in terms of their
100
language proficiency. Thirty one Mandarin-English speakers were assigned to three
different proficiency groups according to a pretest. A group of eight EL1 Canadian
English speakers were also involved. The amount of coordination between the two
consonants was of the interest. Three ratios were calculated to reflect the articulatory
timing. The comparison was taken among four groups and among different types of
clusters.
The results of participants‘ production showed significant main effect of place and
manner of articulation on the three ratios of articulatory timing. In terms of place of
articulation, more detailed analysis found heterorganic clusters had more overlap than
homorganic clusters. Meanwhile, within the heterorganic clusters, front-back (for
example, alveolar-velar clusters: /sk/) clusters had more overlap than back-front (for
example, velar-alveolar cluster: /ks/) clusters. With respect to manner of articulation, two
pairs of comparison were taken within five groups of clusters. The results reported that
the stop was overlapped more by a stop than by a stop than by a fricative. At the same
time, the liquid was more overlapped by a consonant than a homorganic fricative and a
homorganic nasal. In the analysis, voicing feature was also found to be an influential
factor in articulatory timing, which was unexpected in the present study. The repeated
measures ANOVAs reported significant main effect for voicing feature in each type of
clusters. Look further into the data, voiceless clusters had more overlap than voiced
clusters.
The different amount of consonantal overlap in the target clusters was directed by
both articulatory goals and perceptual goals in the speech production. The speakers
101
tended to use the least effort to achieve the ease of articulation in the speech production.
Thus, the more effort cost consonant was reduced by temporal overlap. However, in the
communication, listeners‘ perception was also a determinant of the efficiency of
information transition. Thus, the organization of articulatory timing took acoustic and
perceptual goals into consideration. Relatively the less valuable acoustic and perceptual
cues were more likely to be obscured by consonantal overlap in the clusters.
The second focus of the study was whether participants‘ proficiency difference
indicates different performance in terms of articulatory timing. Repeated measures
ANOVAs also reported significant effect for proficiency group in three ratios of
articulatory timing. With respect of amount of overlap, EL1 English speakers had more
overlap in most of the clusters except /ts/ and /dz/. Meanwhile, advanced
Mandarin-English speakers‘ performance was closer to EL1 speakers. However,
intermediate and low Mandarin-English speakers had similar performance. The
differences between EL1 and Mandarin-English speakers reflected the different
constraints ranking in their phonology. EL1 English speakers did not use the consonantal
timing in the coda position to preserve the lexical contrast. However, Mandarin-English
speakers maintained the segmental contrast to maximize lexical contrast.
In Mandarin-English speakers‘ production, two interesting phenomena were found.
First, Mandarin-English speakers had much more overlap than EL1 speakers in /ts/ and
/dz/ clusters. Mandarin speakers‘ abnormal performance in these two clusters might be
due to the influence of previous language experience. Mandarin speakers already had rich
experience in affricates in Mandarin. According to Speech Learning Model, second

102
language learners might have difficulties in those L2 sounds that similar to their EL1
language. Thus, in the present study, Mandarin speakers had different performance in
these two clusters. Second, deletion was found in liquid-stop and nasal-stop clusters. In
most of the deletion cases, the sonorant was deleted. However, in nasal-voiceless stop
clusters, Mandarin speakers dropped the stop in the performance. Sonority distance might
play a role in these deletion cases. Previous studies (Barlow, 2003; Ohala, 1999) reported
that more sonorous segment is deleted to reach the least sonority in the clusters. However,
Mandarin speakers‘ production in nasal-voiceless stop clusters violated the sonority
pattern.
6.2 Implication
6.2.1 Theoretical implication
In the present study, Mandarin ESL learners present different management of
articulatory timing with native Canadian English speakers. This finding has an
implication for the role of rhythm in segmental production. L2 segmental production is
influenced by the supra-segmental difference between L1 and L2. Taking a top-down
perspective, the rhythmic difference may lead to different syllable durations. The
difference between syllable durations may require different degrees of coordination
between segments.
Mandarin is a syllable-timed language, which leads to relatively fixed syllable
durations. However, English is a stress-timed language. The syllable durations are varied.
The difference between syllable duration may influence the degrees of segmental

103
coordination. Thus, English segments display different amount of overlap, while the
segmental overlap in Mandarin is relatively steady. Therefore, a higher level of rhythmic
difference travels down the phonological hierarchy to the lower level of segmental
production. The difference at the rhythmic level between Mandarin and English may lead
to determine Mandarin ESL learners‘ management of segmental coordination. Mandarin
ESL learners in the present study show small amount of overlap than English speakers.
Previous second language theories such as language transfer, Eckman‘s (1977) MDH,
and Flege‘s (1995) SLM focus mainly on the segmental comparison between L1 and L2.
However, James (1988) mentioned the possibility of a high level of L1 influence on L2
phonology in his study. Later, Shattuck-Hufnagel (2006) claimed ―Prosody First‖
approach that prosodic features are more basic than segmental features and prosody can
govern the coordination or timing relation between segments. Whether or not prosody
governs segments still awaits for further research, but one thing is borne out from the
present study: the segmental articulatory timing patterns may be associated with rhythmic
patterns.
6.2.2 Pedagogical implications
In the present study, the coordination between English consonants is found in terms
of articulatory timing. For ESL learners, they not only have to learn the pronunciation of
English segments, but also have to manage the relationship between segments. Therefore,
one pedagogical implication is borne out from the present study: the phasing relations
between segments should be taught as well as segmental pronunciations in second

104
language teaching and learning.
The second pedagogical implication is proposed from an articulatory approach. The
Mandarin ESL learners in the present study didn‘t correctly mold their articulatory
movement to the new phasing relations in English. Thus, ESL teachers may have to teach
and stimulate learners‘ articulatory awareness in ESL teaching. Videos about native
speakers‘ articulator movement can be showed to ESL learners. They can compare their
management of articulators with native speakers. Based on the videos, ESL learners can
adjust their articulators and control the movement of the articulators according to L2
articulatory patterns. Therefore, ESL learners can be more accurate in English
pronunciation.
6.3 Limitation
The primary limitation lies in the methodology of the present study. First, the
validity of the pretest should be more strictly tested. In the pretest, four criteria were
chosen to judge speakers‘ English speaking proficiency. Although, each criterion was
grounded in some standard tests (TOFEL), the validity of the tasks and the criteria were
not validated. Second, the choice of participants is limited. In the present study, the
difference among proficiency groups was of interest. However, participants in the present
study were all students of the University of Victoria. Relatively, most of them were all
belong to intermediate English learners, because they had previously been able to achieve
the University of Victoria admission requirement or even higher on TOEFL or IELTS.
Thus, the proficiency difference was not distinct in the present study. Third, the sample
105
size of participants is limited. Totally there were thirty nine participants in the present
study. But for each group, only about ten participants were involved. A large study pool
may reduce some statistical uncertainties and make the study more convincing. Last, the
duration of some segments may have not been measured accurately. In the present study,
the acoustic measurement was conducted by standard computer program. Some acoustic
parameters to determine the segmental boundaries may not be detected.
6.4 Future research
In the present study, the coordination between consonants in English clusters is
acoustically investigated in the coda position. And three major influential factors are
found in three ratios. However, previous research showed cluster position may influence
speakers‘ performance. And in the present study, only clusters in coda position are
involved. Thus, the future research can investigate the articulatory timing of clusters in
onset, across syllable boundaries and across word boundaries. Compare the results in
different positions.
Meanwhile, language transfer is always of the interest in second language studies. In
the present study, only Mandarin speakers‘ English performance is analyzed in terms of
consonantal overlap. Moreover, in previous study (Zsiga, 2003) language transfer was
found in articulatory timing of consonant clusters by Russian-English speakers. Therefore,
the future study can investigate the articulaoty timing or segmental overlap in Mandarin
to explore whether language transfer happens in Mandarin-English speakers in terms of
articulatory timing.

106
References
Abrahamsson, N. (2003). Development and recoverability of L2 codas: A longitudinal
study of Chinese –Swedish interphonology. SSLA, 25, 313-349.
Anderson, J. I. (1987). The markedness differential hypothesis and syllable structure
difficulty. In G.Ioup & S. H. Weinberger (Eds.), Interlanguage phonology: The
acquisition of a second language sound system (pp. 279-291). Rowley, MA: Newbury
House.
Barlow, J. A. (2003). Asymmetries in the acquisition of consonant clusters in Spanish.
The Canadian Journal of Linguistics, 48, 179-221.
Barlow, J.A. (2005). Phonological change and the representation of consonant clusters in
Spanish: A case study. Clinical Linguistics & Phonetics, 19, 659-679.
Barry, M. (1985). A palatographic study of connected speech processes. Cambridge
Papers in Phonetics and Experimental Linguistics, 4, 1-16.
Barry, M. (1991). Temporal modeling of gestures in articulatory assimilation.
Proceedings of the XXIIth congress of phonetic sciences, 4, 14-17.
Bayley, R. (1996). Competing constraints on variation in the speech of Chinese learners
of English. In R. Bayley & D. R. Preston (Eds.), Second language acquisition and
linguistic variation (pp. 97-120). Amsterdam: Benjamins.
Bloomfield, L. (1933). Language. New York: Henry Holt.
Bosch, A. (1995). A gestural analysis of epenthesis in Scottish Gaelic. Ms, University of
Kentucky.

107
Broselow, E. (1987). Non-obvious transfer: On predicting epenthesis errors.
Interlanguage Phonology: The Acquisition of a Second Language System.
Broselow, E., & Finder, D. (1991). Parameter setting in second language phonology and
syntax. Second Language Research, 7 (1), 35-59.
Broselow, E., Su-I C., & Chilin W. (1998). The emergence of the unmarked in second
language phonology. Studies in Second Language Acquisition, 20, 261-280.
Browman, C. P. & Goldstein, L. M. (1986).Towards an articulatory phonology.
Phonology Yearbook 3, 219-252.
Browman, C.P., & Goldstein, L. (1987). Tiers in Articulatory Phonology, with some
implications for casual speech. In J. Kingston & M.E. Beckman (Eds.), Papers in
Laboratory Phonology I: Between the Grammar and the Physics of Speech. Cambridge:
Cambridge University Press.
Browman, C. P. & Goldstein, L. M. (1988). Some notes on syllable structure in
articulatory phonology. Phonetica, 45, 140-155.
Browman, C. P. & Goldstein, L. M. (1989). Articulatory gestures as phonological units.
Phonology, 6, 201-252.
Browman, C. P., & Goldstein, L. (1990b). Tiers in articulatory phonology, with some
implications for casual speech. In J. Kingston & M. E. Beckman (Eds.), Papers in
laboratory phonology I: Between the grammar and the physics of speech. Cambridge:
Cambridge University Press.
Browman, C. P. & Goldstein, L. M. (1992a). Articulatory phonology: an overview.
Phonetica, 49, 222-234.

108
Browman, C. P. & Goldstein, L. M. (1995b). Dynamics and articulatory phonology. In T.
van Gelder & R. F. Port (Eds.), Mind as Motion (pp. 175-193), Cambridge, MA: MIT
Press.
Byrd, D. (1992). Perception of assimilation in consonant clusters: A gestural model.
Phonetica, 49, 1-24.
Byrd, D. (1994). Relations of sex and dialect to reduction. Speech Communication, 15,
39-54.
Byrd, D. (1996a). Influence on articulatory timing in consonantal sequences. Journal of
Phonetics, 24, 209-244.
Byrd, D. (1996b). A phrase window framework for articulatory timing. Phonetica, 13,
139-169.
Byrd, D. & Tan, C. C. (1996). Saying consonant clusters quickly. Journal of Phonetics, 24,
263-282.
Carlisle, R. (1998). The acquisition of onsets in a markedness relationship: A longitudinal
study. Studies in Second Language Acquisition, 20, 245-260.
Carlisle, R. (2006). The sonority cycle and the acquisition of complex onsets. In Baptisata,
B., &Watkins, M. (Ed.), English with a Latin Beat: Studies in Prtugues/Spanish
English interphonology (pp. 105-137), Amsterdam: Johns Benjamins.
Catford, J. C. (1977). Fundamental Problem in Phonetics. Bloomington: Indiana
University Press.
Cebrian, J. (2000). Transferability and productivity of L1 rules in Catalan-English
interlanguage. Studies in Second Language Acquisition, 22, 1-26.

109
Chan, Y. W. (2007). The acquisition of English final consonants by Cantonese ESL
learners in Hongkong. The Canadian Journal of Linguistics, 52(3), 231-253.
Davidson, L. & Stone, M. (2003). Epenthesis versus gestural mistiming in consonant
cluster production: An ultrasound study. WCCFL, 22, 1-14.
Davidson, L., Jusczyk, P., & Smolensky, P. (2004). The initial and final states: Theoretical
implications and experimental explorations of richness of the base. In R. Kager, W.
Zonneveld, & J. Pater (Eds.), Fixing Priorities: Constraints in Phonological
Acquisition. Cambridge: Cambridge University Press.
Davidson, L. (2005). Addressing phonological questions with ultrasound. Clinical
Linguistics and Phonetics. 19 (6), 619-633.
Davidson, L. (2006). Phonology, phonetics, or frequency: Influences on the production of
non-native sequences. Journal of Phonetics, 34, 104-137.
Davidson, L. & Kevin, R. (2008). Durational correlates for differentiating consonant
sequences in Russian. Journal of the International Phonetic Association, 38 (2),
137-165.
Delattre, P. (1966). Les dix intonations de base du français. French Review, 40, 1-14.
Dixit, R. P., & Hoffman, P. R. (2004). Articulatory characteristics of fricatives and
affricates of Hindi: An electropalatographic study. Journal of the International
Phonetic Association, 34, 141-160.
Dorman, M. F., Raphael, L. J., & Isenbrg, D. (1980). Acoustic cues for a
fricative-affricate contrast in word-final position. Journal of Phonetics, 8, 397-405.
Eckman, F. (1977). Markedness and the contrastive analysis hypothesis. Language

110
Learning 27, 315-330.
Eckman, F. (1991). The Structural Conformity Hypothesis and the acquisition of
consonant clusters in the interlanguage of ESL learners. Studies in Second Language
Acquisition, 13, 23-41.
Eckman, F., & Iverson, G. (1993). Sonority and markedness among onset clusters in the
interlanguge of ESL learners. Second Language Research, 9, 234-252.
Eckman, F., & Iverson, G. (1994). Pronunciation difficulties in ESL: Coda consonants in
English interlanguage. In Mehment Yavas (Ed.), First and Second Language
Phonology, (pp. 251-266), San Diego, CA: Singular.
Flege, J. E. (1979). Phonetic interference in second language acquisition. Unpublished
doctoral dissertation, Indiana University, Bloomington, IN.
Flege, J. E. (1988). The development of skill in producing word-final English stops:
Kinematic parameters. Journal of Acoustical Society of America, 84 (5), 1639-1652.
Flege, J. E. (1995). Second-Language Speech Learning. In W. Strange (Ed.) Speech
Perception and Linguistic Experience: Issues in Cross-Language Research, Baltimore,
USA: York Press.
Flege, J. E., Munro, M., & MacKay, I. (1995). Factors affecting strength of perceived
foreign accent in a second language. Journal of the Acoustical Society of America, 97,
3125-3134.
Gafos, A. I. (2002). A grammar of getural coordination. Natural Language & Linguistic
Theory, 20, 269-337.
Greenberg, J. H. (2005). Language universals: With special reference to feature
111
hierarchies. New York: Mouton de Gruyter.
Hall, N. (2006). Cross-linguistic patterns of vowel intrusion. Phonology, 23, 387-429.
Hansen, J. G. (2001). Linguistic constraints on the acquisition of English syllable codas
by native speakers of Mandarin Chinese. Applied Linguistics, 22, 338-365.
Hardeastle, W. J. & Roach, P. (1979). An instrumental investigation of coarticulation in
stop consonant sequences. In H. Hollien & P. Hollien (Eds.), Current Issues in the
Phonetic Science, (pp. 531-540). Amsterdam: John Benjamins.
He, Y. J. & Lin, H. (2005). Mandarin speakers' production of English /l/ in syllable-final
position. Second Language Research Forum , Teachers College, Columbia University,
October 2005.
Reetz, H. & Allard, J. (2009). Phonetics, Transcription, Production, Acoustics, and
Perception. Wiley-Blackwell.
Herber, R. K. (1986). Language Universals, Markedness Theory, and Natural Phonetic
Processes, Berlin: Mounton de Gruyter.
Hoequist Jr., C. (1983). Syllable duration in stress- , syllable- , and mora-timed languages,
Phonetica, 40, 203-237.
James, A. R. (1988). The Acquisition of a Second Language Phonology. Tübingen: Gunter
Narr.
Johnson, K., Ladefoged, P., & Lindau, M. (1993). Individual differences in vowel
production. Journal of the Acoustical Society of America, 94 (2), 701-714.
Kirchner, R. (2000). Geminate inalterability and lenition. Language, 76 (3), 509-545.
Kohler, K. J. (1992). Gestural reorganization in connected speech: a functional viewpoint

112
on ―articulatory phonology‖. Phonetica, 49, 205-211.
Ladefoged, P. (1993). A course in phonetics. 3rd edition. Fort Worth, TX: Harcourt, Brace,
and Jovanovich.
Ladefoged, P. & Maddieson, I. (1996). The sounds of the world's languages. Oxford:
Blackwell.
Liiv, G. (1962). On the acoustic composition of Estonian vowels of three degrees of
length. ETATUS XI, 271-290.
Lado, R. (1957). Linguistics across Cultures: Applied Linguistics for Language Teachers,
10th Edition, USA: The University of Michigan Press.
Levitt,A. G. (1991). Reiterant speech as a test of non-native speakers‘ mastery of the
timing of French. Journal of the Acoustical Society of America, 90, 3008-3018.
Li, F. P., Menon, A. & Allen, J. B. (2009). A psychoacoustic method to find the perceptual
cues of stop consonants in natural speech. Journal of the Acoustical Society of America,
127 (4), 2599-2610.
Lin, H. (2001). A grammar of Mandarin Chinese. Munique, Germany: Lincom Europa.
Lin, H. & Wang, Q. (2005). Syllable-Timedness in the ESL Production of Mandarin
Chinese Speakers. Paper presented at the Conference Between Stress and Tone,
Leiden, the Netherlands. June 2005.
Lin, H. & Wang, Q. (2006). An Instrumental Study of Mandarin Rhythm: A Comparison
between Mandarin, English and EFL English. University of Victoria Center for Asia
Pacific Initiatives Annual Student Symposium. University of Victoria, March, 2006.
Lin, H. & Wang, Q. (2007). Mandarin rhythm: An acoustic study. 普通话节律的声学研

113
究。 Journal of Chinese Linguistics and Computing, 17 (3): 127-140.
Lin, H. & Wang, Q. (2008). Interlanguage rhythm in the English production of Mandarin
speakers. 中国人英语中介语节律. In Proceedings of the 8th Phonetic Conference of
China and the International Symposium on Phonetic Frontiers, Beijing, April 18-20,
2008. On CD.
Lindblom, B. (1983). Economy of speech gestures. In P. MacNeilage (Ed.), Speech
production, (pp. 217-246). New York: Springer Verlag.
Lisker, L. (1974). On time and timing in speech. In T. A. Sebeok (Ed.) Current Trends in
Linguistics 12 (pp. 2387-2428). The Hague: Mounton.
Locke, J. L. (1983). Phonological Acquisition and Change. New York Academic.
Major, R. (1987). English voiceless stop production by speakers of Brazilian Portuguese.
Journal of Phonetics, 15, 197-202.
Major, R. C. (1996). Markedness and second language acquisition of consonant clusters.
Variation Linguistics and Second Language Acquisition.
Mack, M. (1982). Voicing-dependent vowel duration in English and French: monolingual
and bilingual production, Journal of the Acoustical Society of America, 71, 173-178.
Macken, M. A. (1979). Developmental reorganization of phonology: A hierarchy of basic
units of acquisition. Lingua 49, 11-49.
Magen, H. (1998). The perception of foreign-accented speech. Journal of Phonetics, 26,
381-400.
McLeod, van Doorn J, & Reed. (2001). Normal acquisition of consonant clusters.
American Journal of Speech-Language Pathology, 10 (2), 99-110.

114
Munro, M., & Derwing, T. (1995). Processing time, accent, and comprehensibility in the
perception of native and foreign-accented speech. Language and Speech, 38, 289-306.
Munro, M., & Derwing, T. M. (1998). The effects of speaking rate on listener evaluations
of native and foreign-accented speech. Language Learning, 48, 159-182.
Nasr, R.T. (1960). Phonemic length in Lebanese Arabic. Phonetica, 5, 209-211.
Nolan, F. (1992). The descriptive role of segments: evidence from assimilation. In: G.
Docherty and D.R. Ladd (Eds.), Laboratory Phonology 2 (pp. 261-280). Cambridge:
CUP.
Obrecht, D. H. (1965). Three experiments in the perception of gemination consonants in
Arabic. L&S, 8, 31-41.
Ohala, J. J. (1983). The origin of sound patterns in vocal tract constraint. In: P. F.
MacNeilage (Ed.), The Production of Speech (pp. 189-216). New York:
Springer-Verlag.
Ohala, D. K. (1999). The influence of sonority on children‘s cluster reductions. Journal of
Communication Disorders, 32, 397-422.
Pike, K. L. (1945). The intonation of American English. In Ann Arbor (Ed.), MI:
University of Michigan Press.
Pitt, M. (1998). Phonological processes and the perception of phonotactically illegal
consonant clusters. Perception & Psychophysics, 60(6), 941-951.
Ramus, F., Nespor, M., & Mehler, J. (1999). Correlates of linguistic rhythm in the speech
signal. Cognition, 73(3), 265-292.
Recasens, D., Fontdevila, J. & Pallares, M. D. (1993). An electropalatographic study of

115
stop consonant clusters. Speech Communication, 12, 335-355.
Recasens, D. & Espinosa, A. (2007). An electropalatographic and acoustic study of
affricates and fricatives in two Catalan dialects. Journal of the International Phonetic
Association, 37 (2), 143-172.
Shattuck-Hufnagel, S. (2006). Prosody first or prosody last? Evidence from the phonetics
of word-final /t/ in American English. Goldstein, L., Whalen, D.H., & Best, C. (Eds.).
Laboratory phonology 8. 445-472.
Smith, N. V. (1973). The Acquisition of Phonology: A Case Study. Cambridge University
Press, Cambridge.
Sole, M. J. (1997). Timing patterns in the production of a foreign language. Views on the
Acquisition and Use of a Second Language (pp. 539-551). Universitat Autonoma de
Barcelona.
Steriade, D. (1990). Gestures and autosegments: comments on Browman & Goldstein‘s
paper. 382-397.
Stevens, K. N. & Keyser, S. J. (1989). Primary features and their enhancement in
consonants. Language, 65(1), 81-106.
Tajima, k., Port, R.,& Dalby, J. (1997). Effects of temporal correction on intelligibility of
foreign-accented English. Journal of Phonetics, 25, 1-24.
Weinberger, D.R. (1987). Implications of normal brain development for the pathogenesis
of schizophrenia. Arch. Gen. Psychiatry, 44, 660-669.
Winitz, H., Scheib, M. E., & Reeds, J. A. (1972). Identification of stops and vowels for
the burst portion of /p,t,k/ isolated from conversational speech. JASA, 51, 1309-1317.

116
Yan, L. L., & Cai, J.T. (2004). Acquisition of English consonant clusters by Chinese
learners of English: an OT approach. Journal of PLA University of Foreign Languages,
27 (1), 70-74.
Yavaç, M., & Barlow, J. (2006). Acquisition of #SC clusters in Spanish-English bilingual
children. Journal of Multilingual Communication Disorders, 4, 182-193.
Yoo, H. (2004). A longitudinal study of consonant cluster acquisition. Studies in
Phonetics, Phonology and Morphology 10(3), 481-503.
Zsiga, E. C. (1992). Acoustic evidence for gestural overlap in consonant sequences.
Haskins Laboratories Status Report on Speech Research, 111, 43-62.
Zsiga, E. C. (1994). Acoustic evidence for gestural overlap in consonant sequences.
Journal of Phonetics, 22, 121-140.
Zsiga, E. C. (1996). Relearning consonant timing. Journal of the Acoustical Society of
America 100, 4.
Zsiga, E. C. (2000). Phonetic alignment constraints: consonant overlap and palatalization
in English and Russian. Journal of Phonetics, 28, 69-102.
Zsiga, E. C. (2003). Articulatory timing in a second language: Evidence from Russian and
English. SSLA, 25, 399-432.
桂盈.(2008).英语辅音丛习得的母语负迁移.外语教学与研究, 43,126-128.

117
Appendix 1
Background Information Questionnaire
Second language articulatory timing of English consonant clusters in the coda positions:
A study of Chinese-English Interlanguage
Yanan Fan
Language Background Survey
1. Can you speak Mandarin fluently?
2. Is Mandarin your native dialect? If not, what is your native dialect?
3. Besides Mandarin, what Chinese dialect can you speak?
4. How long have you been in these dialects area?
Dialect 1: _______________________
Dialect 2: _______________________
Dialect 3: _______________________
Dialect 4: _______________________
5. What foreign language(s) do you speak? How well do you speak it/them? If the range is 1 to 5,
what score will you give to yourself?
F1 _________ 1 2 3 4 5 F3 ________ 1 2 3 4 5
F2 _________ 1 2 3 4 5 F4 ________ 1 2 3 4 5
6. How long have you been learning these foreign languages?
7. Where do you learn these foreign languages? In China or in Canada or in other countries?
8. In your daily life, how often do you use English? A. rarely; B. not quite often; C. half of the
time; D. quite often; E. almost all the time.
9. When do you use English? And provide the percentage.
A. at work ____ B. at school ____ C. at home ____ D. others ____
118
Personal information survey
1. How long have you been in Canada?
2. Have you been to other English-speaking countries? How long have you been there?
Place: _______ Year: _______ Age: ______
Place: _______ Year: _______ Age: ______
3. You are A. an undergraduate student; B. a graduate student; C. others ______
4. What is your TOEFL/ IELTS score? And which year? If you have a speaking score, please
specify.

119
背景信息调查问卷
语言背景调查
1. 你可以说流利的普通话吗?
2. 普通话是你的母语方言吗?
3. 如果不是,你的母语方言是什么?
4. 除了母语方言,你会还会什么汉语方言?
5. 你在这些方言区住了多长时间?
a) 母语方言区:
b) 方言区 2:
c) 方言区 3:
d) 方言区 4:
6. 你会几种外语?他们分别是什么?如果给自己的口语打分 (1-5 分),你会分别
为这几种外语打几分?
外语 1:_______ 1 2 3 4 5 外语 2:______ 1 2 3 4 5
外语 3:_______ 1 2 3 4 5 外语 4:______ 1 2 3 4 5
7. 这些外语你是从什么时候开始学的?学习了多久?
外语 1
外语 2
外语 3
外语 4
8. 你是在什么地方学习这些外语的?在中国,在加拿大,还是在其他国家?
9. 在你的日常生活中,你使用英语的频率是:A. 几乎不用;B. 很少,不经常;
C. 一半时间;D. 经常使用;E. 几乎所有时间。
10. 你会在什么地方或者情况下使用英语?在这些地方或情况下使用的英语占总共
使用情况的比例是多少?
A. 工作中 ______ B. 学校或学习中 ______ C. 在家中 _____ D. 其他
_____

120
个人信息调查
1. 你来加拿大有多久?
2. 你还去过别的国家吗?
国家:_______ 年份:_______ 停留时间:_______
国家:_______ 年份:_______ 停留时间:_______
国家:_______ 年份:_______ 停留时间:_______
3. 你是:A. 本科生 (专业:_____); B. 硕士或博士 (专业:_____); C. 其他
_______
你的托福或者雅思成绩:______; 如果有口语成绩:______; 考试年份:______.

121
Appendix 2
Speaking and Reading Materials
Speaking Task
State your own opinion or reasons for the following two topics in English. For each topic,
you have to speak for at least 5 minutes
1. What is/are your hobby/hobbies? Explain why you enjoy this type of hobby. Includes
reasons and details in your explanation.
2. Some students prefer to go to universities or colleges in their hometown. Others
prefer to go to universities or colleges in new cities or towns. Which do you prefer
and why? Includes details and examples in your explanation.
Reading Task
Put the word into the following sentences:
“I will say ____ twice quickly”;
“I will say ___ as soon as possible”;
“I will pronounce ____ to you”;
“I will pronounce ____ after you.”
beept dopt veebd tobd peact bokt teagd togd
geaps bops feabs tobs teeks toks breegs braugs
deats cauts peast tost beeds tods breazed snozed
peaft coft teask fosk deavd povd teasp cosp
pielt palt deant pont bield fald seend cond
peet kot geep jop beed tod keab nob
feek dok pease foss deeg kog breaze snoze
teel paul peef poff feen son teave kauv

122
话题陈述
请用英语回答以下两个问题,并陈述相关看法和理由。每个话题至少陈述 5 分钟。
1. 你有什么兴趣爱好吗?你为什么选择这些作为你的兴趣爱好?请在回答中包括
原因和具体例子。
2. 有些学生偏向于在自己的家乡上大学,有些学生更喜欢在一个新的城市上大学。
你更倾向于哪一种观点?为什么?请在回答中包括原因和具体例子。
朗读
请将以下单词分别填入以下四个句子中,并用英语朗读。
“I will say ____ twice quickly”;
“I will say ___ as soon as possible”;
“I will pronounce ____ to you”;
“I will pronounce ____ after you.”
beept dopt veebd tobd peact bokt teagd togd
geaps bops feabs tobs teeks toks breegs braugs
deats cauts peast tost beeds tods breazed snozed
peaft coft teask fosk deavd povd teasp cosp
pielt palt deant pont bield fald seend cond
peet kot geep jop beed tod keab nob
feek dok pease foss deeg kog breaze snoze
teel paul peef poff feen son teave kauv

123
Appendix 3
Results of Hierarchical Cluster Analysis
Figure 1 Cluster membership
Table 1 Result of Clusters
Clusters Number Participants
1 12 SCJ, JL, LD, LHY, SSh, TX, WCY, WX, WJ, XYY, YY, ZYH
2 12 Participant 1, 2, GF, HJ, JWH, KC, LP, LN, SY, YJ, YYY, ZX;
3 7 CYD, DJ, GL, GXQ, GY, LS, MBJ;

124
Table 2 Agglomeration Schedule
Stage
Cluster Combined
Coefficients
Stage Cluster First Appears
Next Stage Cluster 1 Cluster 2 Cluster 1 Cluster 2
1 21 28 .125 0 0 7
2 26 27 .125 0 0 13
3 4 19 .125 0 0 19
4 8 15 .125 0 0 8
5 11 12 .125 0 0 13
6 7 17 .250 0 0 8
7 10 21 .313 0 1 16
8 7 8 .344 6 4 17
9 20 25 .375 0 0 14
10 16 22 .375 0 0 21
11 29 31 .500 0 0 20
12 14 24 .500 0 0 28
13 11 26 .531 5 2 18
14 20 23 .625 9 0 21
15 5 9 .625 0 0 23
16 10 13 .667 7 0 20
17 1 7 .750 0 8 24
18 11 30 .938 13 0 25
19 4 18 1.063 3 0 22
20 10 29 1.094 16 11 26
21 16 20 1.292 10 14 25
22 3 4 1.333 0 19 23
23 3 5 1.406 22 15 27
24 1 2 1.725 17 0 26
25 11 16 2.630 18 21 28
26 1 10 2.781 24 20 29
27 3 6 4.354 23 0 29
28 11 14 5.625 25 12 30
29 1 3 9.521 26 27 30
30 1 11 22.451 29 28 0

125
Dendrogram
* * * * * * * * * * * * * * * * * * * H I E R A R C H I C A L C L U S
T E R A N A L Y S I S * * * * * * * * * * * * * * * * * * *
Dendrogram using Average Linkage (Between Groups)
Rescaled Distance Cluster Combine
C A S E 0 5 10 15 20 25
Label Num +---------+---------+---------+---------+---------+
No. 21 21 -+
No. 28 28 -+
No. 10 10 -+-+
No. 13 13 -+ +-+
No. 29 29 -+-+ |
N0.31 31 -+ |
No. 8 8 -+ +---------------+
No. 15 15 -+ | |
No. 7 7 -+-+ | |
No. 17 17 -+ +-+ |
No.1 1 -+ | |
No. 2 2 ---+ +---------------------------+
No. 5 5 -+-+ | |
No. 9 9 -+ | | |
No. 4 4 -+-+-----+ | |
No. 19 19 -+ | | | |
No. 18 18 ---+ +-----------+ |
No. 3 3 ---+ | |
No. 6 6 ---------+ |
No. 14 14 -+-----------+ |
No. 24 24 -+ | |
No. 26 26 -+ | |
No. 27 27 -+ +-----------------------------------+
No. 11 11 -+---+ |
No. 12 12 -+ | |
No. 30 30 -+ +-------+
No. 16 16 -+-+ |
No. 22 22 -+ +-+
No. 20 20 -+ |
No. 25 25 -+-+
No. 23 23 -+