Embed Size (px)
Citation preview

Okwu et al., Cogent Engineering (2018), 5: 1447774https://doi.org/10.1080/23311916.2018.1447774
PRODUCTION & MANUFACTURING | RESEARCH ARTICLE
Artificial neural network model for cost optimization in a dual-source multi-destination outbound systemModestus O. Okwu1, Benjamin Ufuoma Oreko1*, Stanley Okiy2, Austin C. Uzorh3 and Onyewuchi Oguoma3
Abstract: Cost optimization is one of the most important issues in distribution opera-tions of any manufacturing system. Most real life problems are non-deterministic polynomial-time hard, and solving such problems are quite challenging. Managing Dual Source multi-destination Inventory system is extensively more difficult than managing a single source multi-destination inventory structure. Undesirably, most managers rely on traditional method while making allocation decision. There is need for efficient and robust computational algorithm. This study emphasizes the impor-tance of creative algorithm, artificial neural network (ANN) in decision-making. ANN model was applied to a double-source multi-destination system in a paint manufac-turing company. The accuracy of the model was evaluated using mean square error and correlation coefficient (®values for actual and predicted standards. ANN Feed-Forward Back-Propagation learning with sigmoid transfer function [3–10–1–1] was considered using 74% of available data for training and 26% for testing and validation.
*Corresponding author: Benjamin Ufuoma Oreko, Department of Mechanical Engineering, Federal University of Petroleum Resources Effurun, Warri, NigeriaE-mails: [email protected], [email protected]
Reviewing editor:Jun Guo, Wuhan University of Technology, China
Additional information is available at the end of the article
ABOUT THE AUTHORSModestus O. Okwu (PhD) is a lecturer at FUPRE, Nigeria. His research interests include: operations research; renewable and alternative energy; robotics and complex system modelling.
Benjamin Ufuoma Oreko (PhD) is a lecturer at FUPRE, Nigeria. His academic research interest include: Engineering materials, Nanotechnology, Operation Research, Mechanical Design and Renewable Energy.
Stanley Okiy (PhD) is a training officer in the Department of welding engineering and offshore technology, PTI, Nigeria. He is involved in active academic research and engineering consultancy. His research interest include: Operations research and project management.
Austin C. Uzorh (PhD) is a renowned lecturer in the Department of Mechanical Engineering, FUTO, Nigeria. He is the deputy director centre for industrial studies, a fellow of Industrial administrator. He has years of industrial and university teaching experience.
Onyewuchi Oguoma (PhD) is a seasoned Professor and the immediate past Deputy Vice-Chancellor Academics, FUTO. He has years of industrial and university teaching experience. He is involved in active academic research and engineering consultancy for government and industries.
PUBLIC INTEREST STATEMENTThe major challenge managers’ face in industries today is how to reliably meet customers’ requirements at a minimum cost. The rule of thumb approach used by companies may not guarantee optimal distribution result. Scientific approach using creative algorithms could improve the quality of decisions in a complex distribution problem. In this study, we developed artificial neural network (ANN) model for effective product distribution in a dual-source multi-destination system for a paint manufacturing company in Nigeria. We incorporated two input non-deterministic parameters, product demand and unit cost of shipment. The ANN model was used to generate series of iterations and training continuously with many weighted input parameters until a fairly minimum error was obtained and a good solution attained. In conclusion, the non-deterministic models offered better solutions compared to the company deterministic model. Approximately 17% of the company distribution cost was saved using ANN approach.
Received: 15 September 2017Accepted: 22 February 2018First Published: 06 March 2018
© 2018 The Author(s). This open access article is distributed under a Creative Commons Attribution (CC-BY) 4.0 license.
Page 1 of 13
Page 2 of 13
Okwu et al., Cogent Engineering (2018), 5: 1447774https://doi.org/10.1080/23311916.2018.1447774
The result showed that the proposed method (ANN) outperforms the classical method in use. Approximately 17% of the current operational cost was saved using the soft computing technique.
Subjects: Industrial Engineering & Manufacturing; Mechanical Engineering; Logistics; Sustainable Engineering & Manufacturing; Operations Research; Production Systems & Automation; Production Engineering; Systems & Control Engineering; Transport & Vehicle Engineering
Keywords: artificial neural network; transhipment; dual source; multi-destinations
1. IntroductionTranshipment of goods in manufacturing settings is a crucial task especially in developing nations. Huge amount of money are spent daily on distribution of raw materials to factories or distribution of finished products to various depots or locations. It becomes necessary to develop models and algo-rithms as well as plans that are suitable for effective product distribution at optimal cost. Solving transhipment problems is much more difficult than transportation model because transhipment allows flow through intermediate points. This is particularly so if the input are stochastic or fuzzy. Unfortunately, managers rely on local heuristics while making allocation decision. Rule of thumb strategies may not guarantee optimal solution. The major challenge manufacturers’ face in indus-tries today is how to consistently meet customers’ requirements and demands at an optimal cost with the ability to effectively compete in the market. These require the optimization of production processes and the distribution operations. Optimization problems arise in various disciplines such as engineering design, manufacturing system, oil and gas sector, bottling company etc. Thus, in view of the practical effectiveness of optimization problems there is a need for efficient and robust compu-tational algorithms which can unravel these problems arising in different fields.
Transhipment model has gained popularity in different areas of application and has been used extensively in engineering like automobile, equipment supply and so on (Özdemir, Yücesan, & Herer, 2013). Hmiden, Said, and Ghédira (2013) developed transhipment plan to determine uncertain and approximate replenishment quantity. Managing inventory by developing transhipment model re-duces inventory cost and increases customers’ satisfaction (Cannella & Ciancimino, 2010). Transhipment problems and inventory management can be better solved using heuristic techniques (Azmi & Harold, 2013).
ANN model has also been employed in different areas like: the analysis and prediction of concen-tration of air pollutant (Ding, Zhang, & Leung, 2016); electrical load forecasting (Singh, Singh, & Tripathy, 2016); organization of task during data mining (Naik, Nayak, Behera, & Abraham, 2016); supply chain problems (Tavana, Fallahpour, Di Caprio, & Santos-Arteaga, 2016); traffic data quality (Li, 2015; Li & Chen, 2016; Nayak, Naik, & Behera, 2016); forecasting oil prices (Mostafa & El-Masry, 2016) and cost optimization in bottling and paint company in Nigeria (Okwu, 2017). Available work in ANN gave a better solution compared to the classical perception models. In Nigeria, the applica-tion of ANN model for optimal transhipment cost in a dual or multiple-source to multi-destination system had rarely been studied. Hence, in this study cost optimization in a dual source multi-desti-nation system, using data-set obtained from a Paint Manufacturing Company in Nigeria was studied using artificial neural network (ANN) technique with the goal of minimizing overall cost of distribu-tion in the entire chain system.
2. ANN modelling procedures
2.1. Mathematical model of a neuron and data parameterizationThe architecture of ANN is shown in Figure 1 with strength of connection of the neuron, bias and activation function. The architecture of the neuron has a close resemblance with facility distribution structure from source to destination. Where the interconnection of the neuron represent the route

Page 3 of 13
Okwu et al., Cogent Engineering (2018), 5: 1447774https://doi.org/10.1080/23311916.2018.1447774
from sources to destinations, information flow from external environment into the neuron represent product flow from source to destinations and the summing junction represent the transhipment point. The system under consideration is a dual-source to 15 destinations system. The following mathematical notations and definition of terms were adopted in this study:
Notation and definition of termsInputs Description
W Weight or strength of connection
Wk1 Weight or strength of connection from neuron 1 to k
Wk2 Weight or strength of connection from neuron 2 to k
Wk3 Weight or strength of connection from neuron 3 to k
Wkn Connection weight from neuron n to neuron k
X1 Input from 1 to neuron k
X2 Input from 2 to neuron k
Xn Input from n to neuron k
j Index identifying the number of inputs
n Index identifying destinations
k Index identifying processing elements
Uk Linear combiner output due to input signal/Sum of the total neuron
Vk Linear combiner with bias to support input signal
Yk Total output
Wkj Weight or strength of connection from neuron j to k
Wk1,1 Cost input signal from destination 1 to Source 1
Wk1,2 Cost input signal from destination 2 to Source 1
Wky,z Cost input signal from destination y to Source z
Xkj Demand input signal from Depot j to source k
Xk1,1 Demand input signal from destination 1 to Source 1
Xk1,2 Demand input signal from destination 2 to Source 1
Xky,z Demand input signal from destination y to Source z
Ypred Predicted value of the neural network model
Yexp Experimental value of the neural network model
Figure 1. Diagram showing the strength of connection of a neuron with bias and activation function.

Page 4 of 13
Okwu et al., Cogent Engineering (2018), 5: 1447774https://doi.org/10.1080/23311916.2018.1447774
From Figure 1, to attain the total sum of the neuron Uk; it is important to linearly combine all the inputs, multiplied by the appropriate weights of connecting neurons so that in mathematical form, a neuron Uk can be expressed in Equation (1) as:
Introducing an adder, an activation junction and bias (bk), as an external parameter of artificial neu-ron to the system, then the combined input (Vk) can be expressed in Equation (2) as:
Substituting the value of Uk in Equation (1) into Equation (2), we have,
Defining the threshold function as a sigmoid function, then the total output can be expressed in Equation (4) as:
SgFn is substituted with activation function expressed in Equation (5) as:
Substituting the value of (Vk) in Equation (3) transforms the total output as expressed in Equation (6).
From Equation (1), developing an equation for linear combiner output due to input signal at source 1, we have,
Developing equation for linear combiner output due to input signal at source 2, we obtained,
From Equation (2), linear combiner with bias to support input signal at source 1 is:
Linear combiner with bias to support input signal at source 2 is:
Total linear combiner with bias to support input signal at source 1 and 2:
(1)Uk =
n∑j=1
xjwkj
(2)Vk = Uk + bk
(3)Vk =
n∑j=1
xjwkj + bk
(4)Yk = SgFn(Vk)
(5)Yk = �(⋅)Vk
(6)Yk = �(⋅)
n∑j=1
xjwkj + bk
(7)U1k =
15∑j=1
xjwkj
(8)U2k =
15∑j=1
xjwkj
(9)V1k = U1k + bk
(10)V2k = U2k + bk
(11)Vk = U1k + U2k + bk

Page 5 of 13
Okwu et al., Cogent Engineering (2018), 5: 1447774https://doi.org/10.1080/23311916.2018.1447774
hence, we have
Total output at source 1:
Total output at source 2:
3. Materials and methods
3.1. Research designThis research study is designed to show how the total cost of product distribution in a complex sys-tem of source(s) and destinations can be optimized. This is achieved by designing a transhipment model for a two sources multi-destination system. A well-known Paint company in Nigeria with two sources and 15 distribution hubs constitute the population of the study.
3.2. Method of data collection and models employedData sourcing was actualized by direct interaction with strategic and operational staff at the paint manufacturing company as well as interaction with customers at destination points. Information as regards product demand and unit cost of product distribution were obtained from the system re-cords. The use of questionnaire method to obtain information from respondents was also employed. A 69 monthly data, for a period of January 2011–September 2016 was collated and transhipment model for product delivery was developed. Data sets obtained from the company was trained, tested and validated with ANN model developed in Equations (1)–(14), using MATLAB R2013a software for easy computation. The structural connection of the neuron with bias and activation function is dem-onstrated in Figure 1. The accuracy of ANN model was evaluated using mean square error (MSE) and correlation coefficient ® values for actual and predicted. The equation for MSE and R-value is shown in Equations (15) and (16). An ANN Feed-Forward Back-Propagation learning with sigmoid transfer function [3–10–1–1] was considered using 74% of the data for training and 26% for testing and vali-dation. See Figure 2. The interactions and movement of products in the system was identified and modelled as shown in the frame work of Figure 3.
(12)Vk =
15∑j=1
xjwkj +
15∑j=1
xjwkj
(13)Y1k = �(⋅)
15∑j=1
xjwkj + b1k
(14)Y2k = �(⋅)
15∑j=1
xjwkj + b2k
Figure 2. A feed-forward artificial neural network [3–10–1–1].

Page 6 of 13
Okwu et al., Cogent Engineering (2018), 5: 1447774https://doi.org/10.1080/23311916.2018.1447774
The periodic availability of products from the two sources is presented in Table 1. Figure 3, denotes the system architecture for dual source and fifteen destination points. Figure 4, summarizes the periodic demand and cost of distribution of product from the two Sources to the 15 destination hubs. Also the periodic supply of products and total cost of supply from sources to destinations is plotted in Figure 5. The performance of the solution developed is analysed using mean square error and re-gression analysis. A two-layer feed-forward network with sigmoid hidden neurons and linear output neurons was used. The network was trained with back propagation algorithm. This was achieved by positioning the cost and demand as input variables of w and x and the output as the product avail-ability, Y.
3.3. ANN trainingIn this research, a rough iteration was performed followed by series of iterations. In neural network programming, it is necessary to train the network for accurate value. The accurate value is a function of Mean Square Error (MSE) and Correlation Coefficient ® value. The goal of this research is to mini-mize these errors. This was achieved by running series of iterations and training continuously with many weighted input parameters until minimal error is obtained (Figure 6).
(15)PMSE =1
n
n∑m=1
(Yexp .m − Ypred.m
)2
(16)R =
⎛⎜⎜⎜⎜⎜⎝
∑n
m=1
�Ypred.m − ypred
��Yexp .m − yexp
��
∑n
m=1
�Ypred.m − ypred
�2 n∑m=1
�Yexp .m − yexp
�2
⎞⎟⎟⎟⎟⎟⎠
Figure 3. Underlying product flow for sources and destinations.
Table 1. Periodic availability of products1 Source 1 S1 = 40,900
2 Source 2 S2 = 35,000

Page 7 of 13
Okwu et al., Cogent Engineering (2018), 5: 1447774https://doi.org/10.1080/23311916.2018.1447774
Figure 4. Periodic demand of products and cost of distribution of product from the two sources to destinations.
Figure 5. Periodic supply of product and total cost of supply from sources to destinations.
Figure 6. Total cost of supply from sources to destinations (total cost = 833,050 Naira).
Table 2. Performance value for ANN modelling (first iteration)First iteration result
Samples (%) MSE RTraining 74 279,814 0.9883
Validation 13 199,741 1.0000
Testing 13 334,362 1.0000
Page 8 of 13
Okwu et al., Cogent Engineering (2018), 5: 1447774https://doi.org/10.1080/23311916.2018.1447774
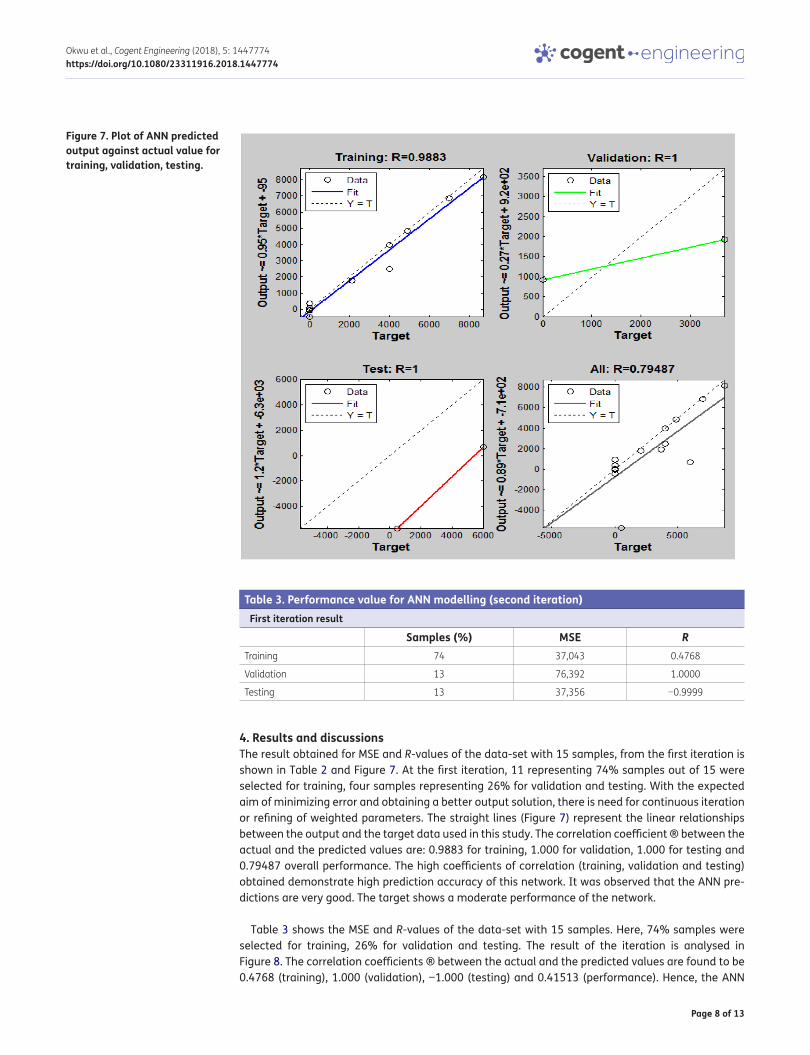
4. Results and discussionsThe result obtained for MSE and R-values of the data-set with 15 samples, from the first iteration is shown in Table 2 and Figure 7. At the first iteration, 11 representing 74% samples out of 15 were selected for training, four samples representing 26% for validation and testing. With the expected aim of minimizing error and obtaining a better output solution, there is need for continuous iteration or refining of weighted parameters. The straight lines (Figure 7) represent the linear relationships between the output and the target data used in this study. The correlation coefficient ® between the actual and the predicted values are: 0.9883 for training, 1.000 for validation, 1.000 for testing and 0.79487 overall performance. The high coefficients of correlation (training, validation and testing) obtained demonstrate high prediction accuracy of this network. It was observed that the ANN pre-dictions are very good. The target shows a moderate performance of the network.
Table 3 shows the MSE and R-values of the data-set with 15 samples. Here, 74% samples were selected for training, 26% for validation and testing. The result of the iteration is analysed in Figure 8. The correlation coefficients ® between the actual and the predicted values are found to be 0.4768 (training), 1.000 (validation), −1.000 (testing) and 0.41513 (performance). Hence, the ANN
Figure 7. Plot of ANN predicted output against actual value for training, validation, testing.
Table 3. Performance value for ANN modelling (second iteration)First iteration result
Samples (%) MSE RTraining 74 37,043 0.4768
Validation 13 76,392 1.0000
Testing 13 37,356 −0.9999

Page 9 of 13
Okwu et al., Cogent Engineering (2018), 5: 1447774https://doi.org/10.1080/23311916.2018.1447774
predictions for training are moderate, the prediction for validation and testing is good and the gen-eral performance of the network is moderately acceptable.
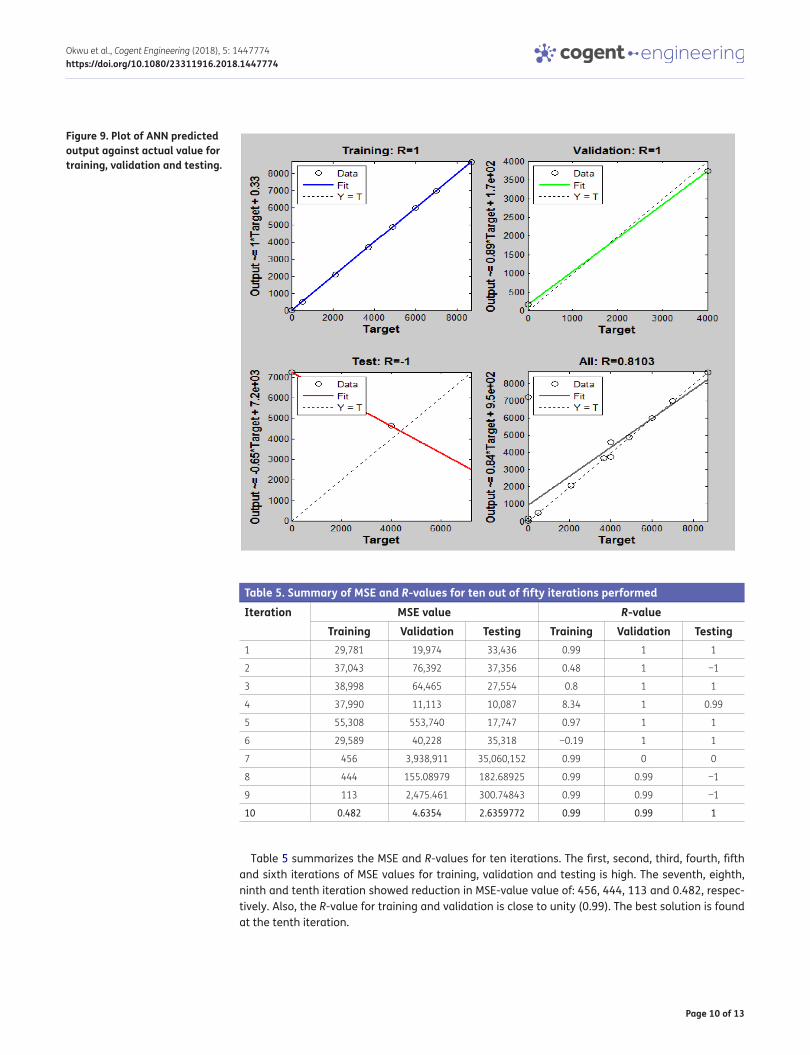
Also, Table 4 shows the the MSE and R-value of the data-set with 15 samples of which 74% sam-ples were selected for training, 26% for validation and testing. The performance value for the third iteration gave a satisfactory result since the MSE value for training and validation are very low com-pared to the MSE values of the first and second iterations. Again, the R-value obtained is close to unity. Figure 8 depicts the linear relationships between the target and the output observed for the training, validation, testing and the performance of the distribution network. The correlation coeffi-cients of 1.000 (training), 1.000 (validation), −1.000 (testing) and 0.8103 (performance) have been obtained for the distribution network. Hence, the ANN predictions for training and validation are perfect; the prediction for testing is poor. However, results demonstrate substantial agreement be-tween the target and output for this network. Fifty iterations were performed in order to determine the optimal solution. It was observed that the tenth run gave the best solution with minimal MSE value of 0.48 (Table 4 and Figure 9).
Figure 8. Plot of ANN predicted output against actual value for (A) training, (B) validation, (C) testing.
Table 4. Performance value for ANN modelling (third iteration)First iteration result
Samples (%) MSE RTraining 74 0.48175 0.9999
Validation 13 4.63535 0.9999
Testing 13 26.6359 −1.0000
Page 10 of 13
Okwu et al., Cogent Engineering (2018), 5: 1447774https://doi.org/10.1080/23311916.2018.1447774
Table 5 summarizes the MSE and R-values for ten iterations. The first, second, third, fourth, fifth and sixth iterations of MSE values for training, validation and testing is high. The seventh, eighth, ninth and tenth iteration showed reduction in MSE-value value of: 456, 444, 113 and 0.482, respec-tively. Also, the R-value for training and validation is close to unity (0.99). The best solution is found at the tenth iteration.
Figure 9. Plot of ANN predicted output against actual value for training, validation and testing.
Table 5. Summary of MSE and R-values for ten out of fifty iterations performedIteration MSE value R-value
Training Validation Testing Training Validation Testing1 29,781 19,974 33,436 0.99 1 1
2 37,043 76,392 37,356 0.48 1 −1
3 38,998 64,465 27,554 0.8 1 1
4 37,990 11,113 10,087 8.34 1 0.99
5 55,308 553,740 17,747 0.97 1 1
6 29,589 40,228 35,318 −0.19 1 1
7 456 3,938,911 35,060,152 0.99 0 0
8 444 155.08979 182.68925 0.99 0.99 −1
9 113 2,475.461 300.74843 0.99 0.99 −1
10 0.482 4.6354 2.6359772 0.99 0.99 1

Page 11 of 13
Okwu et al., Cogent Engineering (2018), 5: 1447774https://doi.org/10.1080/23311916.2018.1447774
The ANN final result for product allocation was presented in Table 6. From Figure 6, the company spent a total of 833,050 Naira (2,380 USD) using the classical approach in product distribution. However, from Table 6 and Figure 10 the overall cost of 692,100 Naira (1,978 USD) was obtained, which represent distribution cost reduction of 140,950 Naira (403 USD) or approximately 17% using ANN approach.
Table 6. Optimal cost obtained from predetermined ANN for the entire system
Notation: D = Depot; CS1 = Unit Cost from Source 1 to Destination; CS2 = Unit Cost from Source 2 to Destination; d = demand at destinations; A S1 = Allocation of products to source 1; A S2 = Allocation of products to source 2; CT1 = Total cost required to distribute products to Source 1; CT2 = Total cost required to distribute products to Source 2.
D CS1 CS2 d A S1 A S2 CT1 CT2
1 6 4 4,000 0 4,000 0 16,000
2 8 7 500 0 500 0 3,500
3 7 5 6,000 0 6,000 0 30,000
4 12 8 4,500 4,500 0 54,000 0
5 10 15 4,000 4,000 0 40,000 0
6 20 14 6,000 2,500 3,500 50,000 49,000
7 18 5 5,000 0 5,000 0 25,000
8 16 7 6,500 0 6,500 0 45,500
9 13 9 3,700 3,700 0 48,100 0
10 9 12 4,900 4,900 0 44,100 0
11 11 7 8,700 8,700 0 95,700 0
12 10 4 7,500 0 7,500 0 30,000
13 19 5 2,000 0 2,000 0 10,000
14 17 12 5,600 5,600 0 95,200 0
15 8 14 7,000 7,000 0 56,000 0
Total quantity supplied to destinations 40,900 35,000 N483,100 N209,000
Optimal cost of supply = N692,100
Figure 10. Optimal cost obtained from predetermined ANN at S1 and S2.
Page 12 of 13
Okwu et al., Cogent Engineering (2018), 5: 1447774https://doi.org/10.1080/23311916.2018.1447774
5. ConclusionThe article has introduced the application of ANN model in cost optimization of a dual-source multi-destination system. The model developed in this research is effective. It provided a simple, transpar-ent solution system to a dual-source multi-destination problem. The technique also has the advantage of manipulating any set of deterministic and stochastic data. From the general analysis, an illustration of the performance of the proposed algorithm has been demonstrated in a multi-echelon system for cost reduction. The distribution of products from two manufacturing plants to fifteen available depots were optimized using ANN modelling approach. It was observed that the company spent a total of 833,050 Naira (2,380 USD) using the company’s classical method. Application of ANN technique resulted to overall cost reduction of 692,100 Naira (1,978 USD). The result showed that the proposed method (ANN) outperforms the classical method. Approximately 17% of current operational cost was saved using ANN approach. Therefore, the application of the proposed ANN method is cost effective and efficient. This study has shown the limitations of the Rule of Thumb and Classical techniques in product distribution. However, in this work comparative analy-sis of different optimization algorithms/tools was not done. It is recommended that further research be conducted using other creative algorithms and possibly compare the solutions obtained with ANN model.
FundingThe authors received no direct funding for this research.
Author detailsModestus O. Okwu1
E-mails: [email protected], [email protected] Ufuoma Oreko1
E-mails: [email protected], [email protected] Okiy2
E-mail: [email protected] C. Uzorh3
E-mail: [email protected] Oguoma3
E-mail: [email protected] Department of Mechanical Engineering, Federal University of
Petroleum Resources Effurun, Warri, Nigeria.2 Department of Welding Engineerig and Offshore Technology,
Petroleum Training Institute Effurun, Warri, Nigeria.3 Department of Mechanical Engineering, Federal University of
Technology Owerri, Owerri, Nigeria.
Citation informationCite this article as: Artificial neural network model for cost optimization in a dual-source multi-destination outbound system, Modestus O. Okwu, Benjamin Ufuoma Oreko, Stanley Okiy, Austin C. Uzorh & Onyewuchi Oguoma, Cogent Engineering (2018), 5: 1447774.
ReferencesAzmi, A., & Harold, W. L. (2013). A new optimization algorithm
for combinatorial problems. International Journal of Advanced Research in Artificial Intelligence (IJARAI), 2, 5–10.
Cannella, S., & Ciancimino, E. (2010). On the bullwhip avoidance phase: Supply chain collaboration and order smoothing. International Journal of Production Research, 44(22), 6739–6776. https://doi.org/10.1080/00207540903252308
Ding, W., Zhang, J., & Leung, Y. (2016). Prediction of air pollutant concentration based on sparse response back-propagation training feed-forward neural networks.
Journal of Environmental Science Pollution Resources, 23, 19481–19494.
Hmiden, M., Said, L. B., & Ghédira, K. (2013). Transshipment problem with fuzzy customer demands and fuzzy inventory costs. International Journal of Management and Decision Making, 13(1), 99–118. https://doi.org/10.1504/IJMDM.2014.058467
Li, L. (2015). A simulate prediction and analysis of Jilin province rural tourism development based on BP neural network. Chemical Engineering Transactions, 46, 619–624.
Li, Y., & Chen, D. (2016). A learning-based comprehensive evaluation model for traffic data quality in intelligent transportation systems. Multimedia Tools and Applications, 11683–11698. https://doi.org/10.1007/s11042-015-2676-4
Mostafa, M. M., & El-Masry, A. A. (2016). Oil price forecasting using gene expression programming and artificial neural networks. Economic Modelling, 54, 40–53. https://doi.org/10.1016/j.econmod.2015.12.014
Naik, B., Nayak, J., Behera, H. S., & Abraham, A. (2016). A self-adaptive harmony search based functional link higher order ANN for non-linear data classification. Journal of Neurocomputing, 179, 69–87.
Nayak, J., Naik, B., & Behera, H. S. (2016). A novel nature inspired firefly algorithm with higher order neural network: Performance analysis. Engineering Science and Technology, an International Journal, 19, 197–211. https://doi.org/10.1016/j.jestch.2015.07.005
Okwu, M. O. (2017). Transhipment model for multi-echelon system (Doctoral Thesis). Federal University of Technology Owerri, Nigeria.
Özdemir, D., Yücesan, E., & Herer, Y. T. (2013). Multi-location transshipment problem with capacitated production. European Journal of Operational Research, 226(3), 425–435. https://doi.org/10.1016/j.ejor.2012.11.014
Singh, N. K., Singh, A. K., & Tripathy, M. (2016). A comparative study of BPNN, RBFNN and ELMAN neural network for short-term electric load forecasting: A case study of Delhi region. IJCTA, International Science Press, 8(5), 2169–2177.
Tavana, M., Fallahpour, A., Di Caprio, D., & Santos-Arteaga, F. J. (2016). A hybrid intelligent fuzzy predictive model with simulation for supplier evaluation and selection. Expert Systems with Applications, 61, 129–144. https://doi.org/10.1016/j.eswa.2016.05.027

Page 13 of 13
Okwu et al., Cogent Engineering (2018), 5: 1447774https://doi.org/10.1080/23311916.2018.1447774
© 2018 The Author(s). This open access article is distributed under a Creative Commons Attribution (CC-BY) 4.0 license.You are free to: Share — copy and redistribute the material in any medium or format Adapt — remix, transform, and build upon the material for any purpose, even commercially.The licensor cannot revoke these freedoms as long as you follow the license terms.
Under the following terms:Attribution — You must give appropriate credit, provide a link to the license, and indicate if changes were made. You may do so in any reasonable manner, but not in any way that suggests the licensor endorses you or your use. No additional restrictions You may not apply legal terms or technological measures that legally restrict others from doing anything the license permits.
Cogent Engineering (ISSN: 2331-1916) is published by Cogent OA, part of Taylor & Francis Group. Publishing with Cogent OA ensures:• Immediate, universal access to your article on publication• High visibility and discoverability via the Cogent OA website as well as Taylor & Francis Online• Download and citation statistics for your article• Rapid online publication• Input from, and dialog with, expert editors and editorial boards• Retention of full copyright of your article• Guaranteed legacy preservation of your article• Discounts and waivers for authors in developing regionsSubmit your manuscript to a Cogent OA journal at www.CogentOA.com