Embed Size (px)
Citation preview

A
Ba
b
c
d
a
ARRA
KANTFFV
1
todbLhdachA
iT
0d
Computers and Electronics in Agriculture 68 (2009) 52–61
Contents lists available at ScienceDirect
Computers and Electronics in Agriculture
journa l homepage: www.e lsev ier .com/ locate /compag
rtificial neural networks for automated year-round temperature prediction
rian A. Smitha,b, Gerrit Hoogenbooma,c,∗, Ronald W. McClendona,d
Institute for Artificial Intelligence, The University of Georgia, Athens, GA 30602, USAComputer Science Department, The University of Georgia, Athens, GA 30602, USADepartment of Biological and Agricultural Engineering, The University of Georgia, Griffin, GA 30223, USADepartment of Biological and Agricultural Engineering, Driftmier Engineering Center, The University of Georgia, Athens, GA 30602, USA
r t i c l e i n f o
rticle history:eceived 31 March 2008eceived in revised form 12 February 2009ccepted 22 April 2009
eywords:rtificial intelligenceeural networkemperature predictionrost protectionruit cropsegetable crops
a b s t r a c t
Crops and livestock in most of the southeastern United States are susceptible to potential losses due toextreme cold and heat. However, given suitable warning, agricultural and horticultural producers canmitigate the damage of extreme temperature events. To provide such a warning, air temperature predic-tion models are needed at horizons ranging from 1 to 12 h. The goal of this project was to explore theapplication of artificial neural networks (ANNs) for the prediction of air temperature during the entireyear based on near real-time data. Ward-style ANNs were developed using detailed weather data col-lected by the Georgia Automated Environmental Monitoring Network (AEMN). The ANNs were able toprovide predictions throughout the year, with a mean absolute error (MAE) of the year-round modelsthat was less during the winter months than the MAE of the models resulting from the application ofpreviously developed winter-specific models. The prediction MAE for a year-round evaluation set rangedfrom 0.516 ◦C at the one-hour horizon to 1.873 ◦C at the twelve-hour horizon. A detailed graphical analysisof MAE by time-of-year and time-of-day was also performed. A tendency to over-predict temperatures
during summer afternoons was associated with localized cloud cover during that period. The inclusionof rainfall as input to the model was also shown to improve prediction accuracy. In addition, two sim-ple ensemble techniques were explored and neither parallel nor series aggregation was found to reduceprediction errors. When simulated over two extreme temperature events, the models were capable ofrapidly adjusting predictions on the basis of new information. The final models were applied to predictionhorizons of 1–12 h and deployed on the website of the Georgia AEMN (www.GeorgiaWeather.net) for useecisi
as a general, year-round d. Introduction
Damage to plants and animals caused by extreme tempera-ures is a serious concern for agricultural producers. In the statef Georgia and elsewhere in the southeastern United States, frostamage is a problem during the late winter and early spring whenud formation and flowering occur in many horticultural crops.ate freezes can damage floral buds of fruit, leading to reducedarvests. Orchard heaters, irrigation, wind machines and otherevices can protect fruit trees and bushes from severe frost dam-
ge, provided that growers are given adequate warning of freezingonditions. Extreme heat cannot only damage plants, but can causeeat exhaustion in both livestock and agricultural workers (Nationalgricultural Statistical Service, 2005). The accurate prediction of∗ Corresponding author at: Department of Biological and Agricultural Engineer-ng, The University of Georgia, 1109 Experiment Street, Griffin, GA 30223, USA.el.: +1 770 228 7216; fax: +1 770 228 7218.
E-mail address: [email protected] (G. Hoogenboom).
168-1699/$ – see front matter © 2009 Elsevier B.V. All rights reserved.oi:10.1016/j.compag.2009.04.003
on support tool.© 2009 Elsevier B.V. All rights reserved.
extreme temperature events could also be valuable in decision sup-port systems for energy management and transportation. To besuitable for decision support, temperature prediction models mustbe accurate, robust, and available 24 h a day.
Artificial neural networks (ANNs) have been used in a number ofprediction studies that involve atmospheric time series data. Yi andPrybutok (1996) predicted daily maximum ozone levels in Texasmetropolitan areas with a standard three-layer ANN model withnine inputs and four hidden nodes and found it to be superior tostatistical methods. A three-layer ANN model with 17 inputs wasdeveloped by Jiang et al. (2004) to predict the air pollution levels ofcities in China. Inputs to the models were not site-specific, allowingthe model to be applied to a number of locations across China. Airtemperature, wind speed, and relative humidity in Saskatchewan,Canada were predicted 24 h in advance by ANN models developed
and applied by Maqsood et al. (2004). They found that combiningthe outputs of a standard feed-forward ANN, a recurrent ANN, aradial basis function network, and a Hopfield network into a sim-ple “winner-take-all” ensemble led to more accurate predictionsof wind speed, relative humidity, and air temperature than any
ectron
oatsumawaaetu
mw2gTstagtaTdtAvpofl
mWorrdBpi(aG
asudtaIdctsn(rtataw
B.A. Smith et al. / Computers and El
f the individual component networks. Ruano et al. (2006) usedmulti-objective genetic algorithm to develop a radial basis func-
ion ANN model for the prediction of air temperature in a secondarychool building in Portugal. Air-conditioning control scheme sim-lations indicated that temperatures could be more consistentlyanaged and that air conditioner run times could be reduced using
n ANN model. Ghielmi and Eccel (2006) compared the use of ANNsith traditional mathematical models to predict minimum temper-
tures. They found that the ANNs provided comparable accuracynd offered the advantage of including inputs not used in traditionalquations. The authors also suggested that predictions of minimumemperatures should be included on a website for dissemination tosers.
In 1991, the University of Georgia initiated the Georgia Auto-ated Environmental Monitoring Network (AEMN) to collecteather data from sites across the state of Georgia (Hoogenboom,000). This network has expanded to more than 75 sites thatather local information for a range of environmental variables.he data are obtained at 1 s intervals and aggregated into 15 minummaries. Each site consists of an automated, solar-powered sta-ion that periodically downloads the data to a central server locatedt the University of Georgia Griffin Campus. The weather data areathered primarily from rural locations for which detailed observa-ions from the National Weather Service are unavailable. The datare disseminated via the AEMN website www.GeorgiaWeather.net.he website also provides a number of calculators, maps, andecision support tools to assist users. Twelve-hour air tempera-ure predictors are available during the winter and early spring.ccurate temperature predictions during this time of year can pro-ide advance warning of upcoming freezes, allowing horticulturalroducers to employ mitigation techniques such as irrigation orrchard heating to reduce the potential damage to the developingowers and fruits.
The data provided by the AEMN have been used to develop ANNodels for the prediction or estimation of atmospheric variables.eather observations from the Tifton, Georgia along with three
ut-of-state sites were used to develop ANNs to estimate daily solaradiation based on daily minimum and maximum air temperatures,ainfall, and calculated values of clear-sky radiation and length ofay (Elizondo et al., 1994). Data from three AEMN sites were used byruton et al. (2000) to develop ANN-based models to estimate dailyan evaporation. The predictions of the ANN model were a slight
mprovement over those of statistical regression models. Li et al.2004) developed ANNs to estimate daily maximum and minimumir temperature as well as total solar radiation for sites in Tifton andriffin, Georgia using AEMN data from nearby sites.
Several studies have used AEMN data to develop ANN modelss an aid for frost protection decision support. Air temperature,olar radiation, wind speed, and relative humidity were found to beseful meteorological inputs for air temperature prediction ANNsuring the winter and early spring (Jain et al., 2003, 2006). Inputso the networks, which predicted air temperature from 1 to 12 hhead, included up to 6 h of prior observations for each input series.n addition, the work encoded the time of day at the point of pre-iction using four cyclic input variables. Ramyaa (2004) developedlassification ANNs to predict freeze events rather than using airemperature for prediction. The networks were trained to clas-ify an upcoming twelve-hour period as a freeze, near-freeze, oron-freeze event. In addition to the inputs identified by Jain et al.2006), these classification networks included current and priorainfall observations. Ward-style ANN models to predict dew point
emperatures up to 12 h in advance were developed by Shank etl. (2008a). Ensemble ANNs were subsequently used to improvehe accuracy of the dew point temperature predictions (Shank etl., 2008b). These ANNs were implemented on the AEMN websiteww.GeorgiaWeather.net. Predictions of dew point temperatureics in Agriculture 68 (2009) 52–61 53
can help assess the severity of frost and freeze events when coupledwith accurate air temperature predictions.
Smith et al. (2006) found that training multiple instances ofa model, each with different initial randomly-assigned weights,increased the likelihood that ANN design alternatives were eval-uated accurately. This approach was applied to the developmentof winter-only air temperature prediction models with the goal ofdeveloping models which would be more accurate than those of Jainet al. (2003). The models were developed with prediction horizonsfrom 1 to 12 h ahead using the Ward-style ANN architecture andAEMN weather data. Observation patterns from January throughearly April were used for ANN development and evaluation. Rain-fall observations were included as inputs based on the results of thefreeze classification approach of Ramyaa (2004). Smith et al. (2006)found that models which included cyclic, day-of-year variables and24 h of prior data as inputs produced more accurate predictionsthan models without such inputs. The inclusion of day-of-year vari-ables suggested the possibility of extending the methodology toa year-round prediction scheme. Prabha and Hoogenboom (2008)evaluated the use of the Advanced Research Weather Research andForecasting model for two episodic frost events in the southeasternU.S. The accuracy of the minimum temperature prediction rangedfrom 90% for the April event to 80% for the December event. Noattempt to include these simulations in a real-time mode was pur-sued due to the excessive computational requirements.
The goal of the research presented herein was to develop a set ofyear-round ANN models for air temperature prediction for 1–12 hahead for inclusion in general, year-round, real-time decision sup-port aids. The objectives related to this goal were: (1) a comparisonof the temperature prediction accuracy of year-round models tothat of existing winter models, (2) a determination of the effecton accuracy of including rainfall input terms, (3) an examinationof ensemble network techniques, and (4) an analysis of predictionerrors based on the day-of-year and time-of-day data to assess thesuitability of the models for general decision-making.
2. Methodology
2.1. Data sets
Meteorological data observations from the AEMN system wereformatted and scaled into input-target patterns. The patterns werepartitioned into the following data sets: a development set, a selec-tion set, and an evaluation set. The development set was used totrain multiple networks for each model and to choose a preferrednetwork from among those instantiating the same model. Distinctinstantiations of the same model differed in the initial randomweights assigned to the network and the order of presentation oftraining patterns. The development set was created from patternsrecorded during the years 1997 to 2000 and consisted of approxi-mately 1.25 million patterns. The patterns in the development setwere drawn from the weather stations located in Alma, Arling-ton, Attapulgus, Blairsville, Fort Valley, Griffin, Midville, Plains, andSavannah. These sites are located across the state and representboth geographical and agricultural diversity. For example, Arling-ton and Attapulgus are in the Georgia Coastal Plain, Blairsville islocated in northern Georgia’s Appalachian Mountains, Griffin is inthe central Piedmont, and Savannah is located on the Atlantic coast.Patterns from Brunswick, Byron, Cairo, Camilla, Cordele, Dearing,Dixie, Dublin, Homerville, Nahunta, Newton, Valdosta, and Vidalia
were used for model selection and evaluation. Collectively, thesestations represent important agricultural production areas in thesouthern and central parts of the state of Georgia. The selection setpatterns were drawn from 2001 to 2003 and numbered approxi-mately 1.25 million. The MAE for this set was used to select between
5 ectronics in Agriculture 68 (2009) 52–61
cyTfa(
(tirpcp
podrfst
thAvvioT
x
wtotat
asfaaIbmtasm
2
Mzs2u1gs
4 B.A. Smith et al. / Computers and El
ompeting ANN design alternatives. The evaluation set from theears 2004 to 2005 consisted of approximately 800,000 patterns.his data set was used to calculate an independent error measureor the selected model. The sites used in the model developmentnd evaluation sets were the same as those used by Smith et al.2006).
Previous models developed by Jain et al. (2006) and Smith et al.2006) predicted air temperature to aid in frost prediction and wererained on patterns generated from observations that occurred dur-ng the first 100 days of the year. The patterns used were alsoestricted to those in which the temperature at the time of therediction was less than or equal to 20 ◦C. As a result of theseonstraints, the models would not be applicable for higher tem-eratures or during other times of the year.
The goal of the current research was to develop models thaterform well over the entire year without sacrificing accuracyver winter observations. Therefore, winter-period subsets of theevelopment, selection, and evaluation sets were created. Decisionsegarding preferred networks and models were based on the MAEor year-round data sets, but the MAE calculated using the winterubsets was considered as an indication of model accuracy duringhe winter months.
Current values and 24 h duration of prior observations for airemperature, solar radiation, wind speed, rainfall, and relativeumidity from the time of prediction were used as inputs for theNN models. The hourly rates of change in each of the five weatherariables at the prediction point and at 1-h intervals over the pre-ious day were also included as inputs for the models. These 250nputs were rescaled using a linear transformation such that allbservations used in model development were in the range [0.1,0.9].he scaled value, xscaled, of an observation x was determined by
scaled = x − xmin
xmax − xmin0.8 + 0.1 (1)
here xmin and xmax were the minimum and maximum values ofhe variable found in the development data set. Because the outputf the network was restricted to the domain [0,1], it was necessaryo map the output signal back to the range of expected temper-tures. The inverse of the linear function used to scale the inputemperature was used for this purpose.
The time-of-day and the day-of-year data were each encodeds four cyclic variables using triangular fuzzy logic-type member-hip functions in the range [0,1]. The four time-of-day membershipunctions are presented in Fig. 1. The variable midnight “wrapsround” the day, with a maximum value at 2400 h. The figure issmooth, continuous representation of the membership functions.
n practice, AEMN observations are aggregated at 15 min intervalseginning at the top of the hour. The values of the time-of-dayembership functions were determined by the hour in which
he observation occurred. Day-of-year variables were treated insimilar manner, using four membership functions to represent
easonality. With the inclusion of these eight cyclic variables, eachodel had a total of 258 inputs.
.2. Model development
Ward-style (Ward Systems Group, Inc. NeuroShell 2, Frederick,D (http://www.wardsystems.com/)) ANNs with a prediction hori-
on of 4 h were used for model development, similar to previoustudies of air temperature predictions with AEMN data (Jain et al.,
003; Ramyaa, 2004; Smith et al., 2006). Design decisions basedpon this horizon were later used to develop models to predict fromto 12 h ahead. The Ward-style ANNs are feed-forward, backpropa-ation networks that implement multiple activation functions in aingle hidden layer. In the Ward-style networks used in this study,Fig. 1. Triangular fuzzy logic-type membership functions for time-of-day inputs tothe models.
the signal of the kth output node, zk, is given by
zk = g
⎛⎝ J∑
j=0
ˇkjyi
⎞⎠ , (2)
where yj is the output of the jth hidden node in the network, ˇkj isan adjustable weight parameter, and
g(n) = 11 + exp (−n)
. (3)
The term y0 is set to a constant value of 1 and the coefficient ˇk0 isthe bias of the kth output node. The value of the summation overthe J hidden nodes is referred to as the induced local field of thenode (Haykin, 1999). Some ANN architectures use the same activa-tion function, g, for each node in the hidden layer. The Ward-stylearchitecture, in contrast, makes use of multiple activation functionsin a single hidden layer. When xi is the output of the ith input and˛ji is a weighting factor, the value of yj, the jth hidden node in aWard-style network, is given by
yj = fj
(I∑
i=0
˛jixi
), (4)
where
0 < j1 < j2 < J (5)
and
fj(n) ={
tan h(n), for 0 < j ≤ j1exp(−n2), for j1 < j ≤ j2
1 − exp(−n2), for j2 < j ≤ J(6)
As in Eq. (2), x0 = 1, so that each ˛j0 serves as a bias for its respectivehidden node. All “slabs” of nodes with the same activation functionwere constrained to be of an equal size. As the ANNs were trained topredict temperature at a single prediction horizon, there was only
one output node z.The ˛ and ˇ terms in Eqs. (2) and (4) are adjustable weightcoefficients. Training a neural network via error back propagation(EBP) is an attempt to identify a set of weights that reduces themean squared error of the output node over a development set. EBP
ectron
pTpmto
e
a
E
Tl
�
Tncfc
�
�
SwitiEp
pseiemTuAeipadvoeip
2
bPo
B.A. Smith et al. / Computers and El
erforms a local gradient search in the space of possible weights.he algorithm was applied after the presentation of each trainingattern and a single feed-forward pass followed by a weight adjust-ent constituted a learning event. For a training pattern n with
arget t(n), the prediction error and error energy of a network withutput z(n), are e(n) and E(n), respectively, where
(n) = t(n) − z(n) (7)
nd
(n) = 12
e(n)2. (8)
he change to a weight w in light of a training pattern n and aearning rate � was given by the delta rule:
w = −�∂E(n)∂w
. (9)
he value of the last term in Eq. (9) is the partial derivative of theetwork error energy with respect to a selected weight w. The cal-ulation of this term depends on whether the weight in questioneeds a signal to the output layer or the hidden layer. In the formerase, w is ˇkj. Differentiating Eq. (2) yields
ˇkj = �e(n)g′
⎛⎝ J∑
j=0
ˇkjyj
⎞⎠ yj. (10)
For weights leading into the hidden layer
˛ji = �e(n)g′
⎛⎝ J∑
j=0
ˇkjyj
⎞⎠ˇkjf
(I∑
i=0
˛jixi
)xi. (11)
uch weight adjustment equations can be calculated for a networkith any number of layers. In practice, the networks in this research
mplemented a local gradient signal which was propagated backhrough the network during training. The local gradient of a nodes the partial derivative of error energy for a particular observation,(n), with respect to the induced local field of a node. Haykin (1999)rovides a concise presentation of local gradient calculation.
The temperature prediction models included several constantarameters selected from Smith et al. (2006). All networks had aingle hidden layer consisting of 120 nodes that were distributedqually among the three slabs comprising the layer. Limited exper-mentation with the number of hidden nodes had only minimalffect on accuracy. The use of 120 nodes produced a slight improve-ent in accuracy. All initial weights were in the range [−0.1,0.1].
he learning rate, �, was set to 0.1 and no momentum term wassed. Smith et al. (2006) established that comparing alternativeNN models by instantiating and training multiple networks forach model led to improved parameter selection and a reductionn prediction error when compared to previous air temperaturerediction research (Jain et al., 2006). Because the EBP algorithmttempts to minimize prediction error by performing gradientescent in the space of possible weights, networks tend to con-erge towards local optima. Making use of repeated instantiationsf the same model, differing only in the random seed used to gen-rate initial weights and the order of training pattern presentation,s analogous to making repeated draws from the distribution ofossible local optima.
.3. Experiments
Each network created during the course of this research requiredetween 6 and 20 h to train and evaluate using one of 30 Dellentium IV workstations in a University of Georgia computer lab-ratory. When evaluating the accuracy of competing ANN models,
ics in Agriculture 68 (2009) 52–61 55
each alternative was instantiated 30 times for the four-hour predic-tion horizon. All model comparisons for parameter selection weremade on the basis of the four-hour horizon and then implementedacross all other horizons. While it was possible that other hori-zons might have benefited from alternative design decisions, theamount of processing time necessary to investigate all horizonswas prohibitively large and beyond the scope of this study. Priorwork had shown that selecting model parameters on the basis ofthe four-hour horizon reduced MAE across all horizons (Smith etal., 2006).
The most accurate network for each competing model, measuredin terms of MAE over the development set, was used to representthe performance of that model. Once a representative instantiationwas assigned to a model, it was evaluated over the selection set.When comparing among alternatives, the model with the lowestMAE over the selection set was chosen.
One aspect of this research involved comparing the accuracy ofwinter and year-round models. Networks instantiating the year-round model were trained over a data set of 300,000 patterns for15 epochs, or 4.5 million learning events. For each instantiation,the year-round model randomly selected a different subset fromthe more than 1.25 million training patterns available. Year-roundinstantiations, therefore, differed from one another not only in theinitial weights and the order of the training patterns, but also in thesubset of training patterns itself. This restriction on the numberof training patterns was introduced to allow for a fair compari-son between the year-round and winter models. Winter networksmade use of all of the approximately 300,000 patterns in the winter-specific subset of development patterns for training.
Jain et al. (2006) found that the inclusion of rainfall variablesdid not increase the accuracy of temperature prediction, whileRamyaa (2004) concluded that rainfall was helpful in classifyingupcoming periods as containing a freeze, near-freeze, or non-freezeevent. Both studies relied on single-network evaluation to selectinputs. Smith et al. (2006) did not address this issue, but arbitrar-ily included rainfall data as inputs. An experiment was conductedherein to determine the effects of using rainfall variables as inputsto the year-round model. Thirty networks were trained over ran-domly selected, 300,000-observation subsets of the developmentset for 15 epochs. These ANNs instantiated models with and withoutrainfall variables as input.
Several additional experiments were conducted to determinethe utility of changes to the input vector and the output range. Amodel was instantiated that included additional values and ratesof change for observations 15, 30, 45, 75, 90, and 105 min priorto the point of prediction. Because of the additional temperature,solar radiation, wind speed, humidity, and rainfall variables, themodel used an input vector with 318 values. Networks developedwith these additional inputs did not provide more accurate predic-tions. Likewise, no improvement in accuracy was found in a modelwith the values and rates of change corresponding to 13, 15, 17,19, 21, and 23 h prior to the prediction point removed from theinput vector. A model was also developed with the hyperbolic tan-gent function used for the activation function of the output node.This change, which doubled the output range of the network from[0,1] to [−1,1], did not improve accuracy and was not investigatedfurther.
Two ensemble techniques were also investigated. Series aggre-gation involves improving the output of a single model by traininga second model using the outputs or errors of the first and combin-ing their outputs. Series aggregation was implemented by training
a network to predict the errors of the most accurate year-roundANN, as measured by development set MAE. Once again, a four-hour horizon was used to study this approach. Thirty instantiationsof the four-hour series model were trained using randomly selected,400,000-observation subsets of the development set for 10 epochs,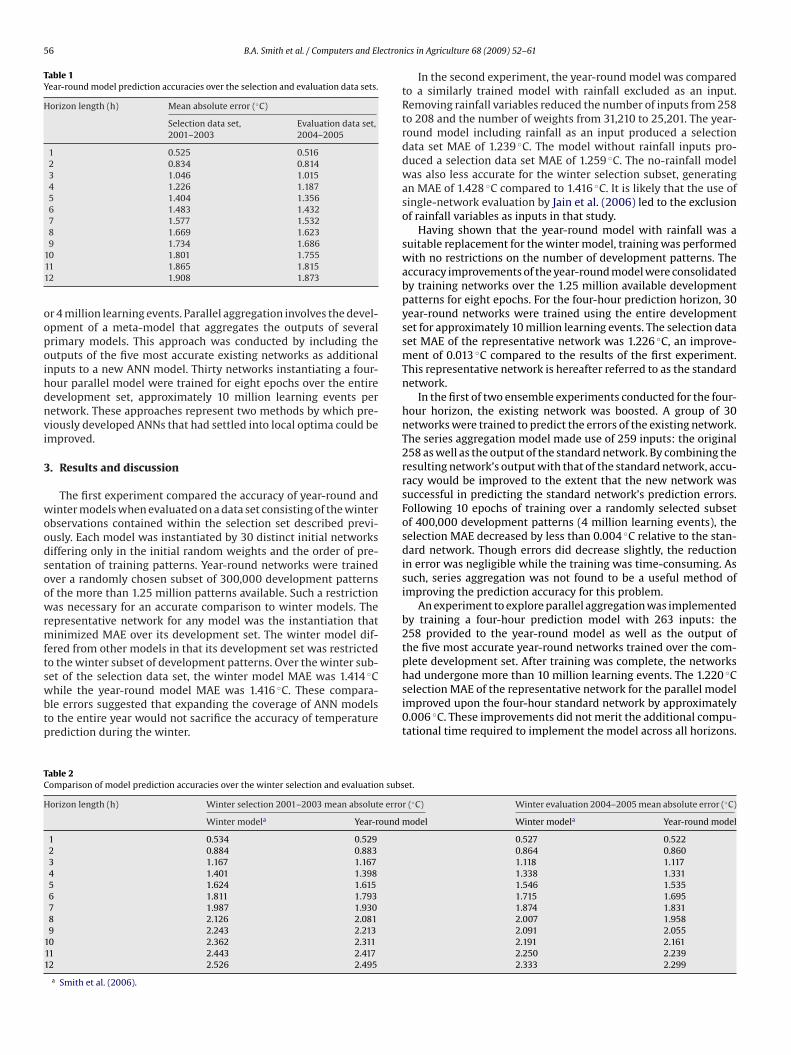
56 B.A. Smith et al. / Computers and Electron
Table 1Year-round model prediction accuracies over the selection and evaluation data sets.
Horizon length (h) Mean absolute error (◦C)
Selection data set,2001–2003
Evaluation data set,2004–2005
1 0.525 0.5162 0.834 0.8143 1.046 1.0154 1.226 1.1875 1.404 1.3566 1.483 1.4327 1.577 1.5328 1.669 1.623
oopoihdnvi
3
woodsoowrmftswbtp
TC
H
9 1.734 1.68610 1.801 1.75511 1.865 1.81512 1.908 1.873
r 4 million learning events. Parallel aggregation involves the devel-pment of a meta-model that aggregates the outputs of severalrimary models. This approach was conducted by including theutputs of the five most accurate existing networks as additionalnputs to a new ANN model. Thirty networks instantiating a four-our parallel model were trained for eight epochs over the entireevelopment set, approximately 10 million learning events peretwork. These approaches represent two methods by which pre-iously developed ANNs that had settled into local optima could bemproved.
. Results and discussion
The first experiment compared the accuracy of year-round andinter models when evaluated on a data set consisting of the winter
bservations contained within the selection set described previ-usly. Each model was instantiated by 30 distinct initial networksiffering only in the initial random weights and the order of pre-entation of training patterns. Year-round networks were trainedver a randomly chosen subset of 300,000 development patternsf the more than 1.25 million patterns available. Such a restrictionas necessary for an accurate comparison to winter models. The
epresentative network for any model was the instantiation thatinimized MAE over its development set. The winter model dif-
ered from other models in that its development set was restrictedo the winter subset of development patterns. Over the winter sub-
et of the selection data set, the winter model MAE was 1.414 ◦Chile the year-round model MAE was 1.416 ◦C. These compara-le errors suggested that expanding the coverage of ANN modelso the entire year would not sacrifice the accuracy of temperaturerediction during the winter.
able 2omparison of model prediction accuracies over the winter selection and evaluation subs
orizon length (h) Winter selection 2001–2003 mean absolute erro
Winter modela Year-round
1 0.534 0.5292 0.884 0.8833 1.167 1.1674 1.401 1.3985 1.624 1.6156 1.811 1.7937 1.987 1.9308 2.126 2.0819 2.243 2.213
10 2.362 2.31111 2.443 2.41712 2.526 2.495
a Smith et al. (2006).
ics in Agriculture 68 (2009) 52–61
In the second experiment, the year-round model was comparedto a similarly trained model with rainfall excluded as an input.Removing rainfall variables reduced the number of inputs from 258to 208 and the number of weights from 31,210 to 25,201. The year-round model including rainfall as an input produced a selectiondata set MAE of 1.239 ◦C. The model without rainfall inputs pro-duced a selection data set MAE of 1.259 ◦C. The no-rainfall modelwas also less accurate for the winter selection subset, generatingan MAE of 1.428 ◦C compared to 1.416 ◦C. It is likely that the use ofsingle-network evaluation by Jain et al. (2006) led to the exclusionof rainfall variables as inputs in that study.
Having shown that the year-round model with rainfall was asuitable replacement for the winter model, training was performedwith no restrictions on the number of development patterns. Theaccuracy improvements of the year-round model were consolidatedby training networks over the 1.25 million available developmentpatterns for eight epochs. For the four-hour prediction horizon, 30year-round networks were trained using the entire developmentset for approximately 10 million learning events. The selection dataset MAE of the representative network was 1.226 ◦C, an improve-ment of 0.013 ◦C compared to the results of the first experiment.This representative network is hereafter referred to as the standardnetwork.
In the first of two ensemble experiments conducted for the four-hour horizon, the existing network was boosted. A group of 30networks were trained to predict the errors of the existing network.The series aggregation model made use of 259 inputs: the original258 as well as the output of the standard network. By combining theresulting network’s output with that of the standard network, accu-racy would be improved to the extent that the new network wassuccessful in predicting the standard network’s prediction errors.Following 10 epochs of training over a randomly selected subsetof 400,000 development patterns (4 million learning events), theselection MAE decreased by less than 0.004 ◦C relative to the stan-dard network. Though errors did decrease slightly, the reductionin error was negligible while the training was time-consuming. Assuch, series aggregation was not found to be a useful method ofimproving the prediction accuracy for this problem.
An experiment to explore parallel aggregation was implementedby training a four-hour prediction model with 263 inputs: the258 provided to the year-round model as well as the output ofthe five most accurate year-round networks trained over the com-plete development set. After training was complete, the networks
had undergone more than 10 million learning events. The 1.220 ◦Cselection MAE of the representative network for the parallel modelimproved upon the four-hour standard network by approximately0.006 ◦C. These improvements did not merit the additional compu-tational time required to implement the model across all horizons.et.
r (◦C) Winter evaluation 2004–2005 mean absolute error (◦C)
model Winter modela Year-round model
0.527 0.5220.864 0.8601.118 1.1171.338 1.3311.546 1.5351.715 1.6951.874 1.8312.007 1.9582.091 2.0552.191 2.1612.250 2.2392.333 2.299

ectron
Tn
fsiatgtneept21wt1fl
bMatcew
Fa
B.A. Smith et al. / Computers and El
he performance of the ensemble techniques suggested that theetworks were not settling into easily improvable local optima.
Models were then developed for the other prediction horizonsrom 1 to 12 h ahead using inputs determined from the four-hourtandard model. These models made use of 258 inputs, includ-ng air temperature, wind speed, relative humidity, solar radiation,nd rainfall and hourly rates of change at the time of predic-ion as well as the history of prior observations at 1-h intervalsoing back 24 h. Also among the models’ inputs were four cyclicime-of-day and four cyclic day-of-year terms. For each model, 30etworks were trained over all available development patterns foright epochs. Due to the computational time required to train andvaluate so many networks over such a large number of patterns,oorly performing networks were discarded at two stages of theraining process. Following two epochs of training (approximately.5 million learning events), each network was evaluated over a00,000-pattern subset of development patterns and the 15 net-orks with the highest MAEs were discarded. Following another
wo epochs, the process was repeated and five of the remaining5 networks were discarded. The remaining networks were trainedor an additional four epochs, for a total of more than 10 millionearning events each.
The MAEs of the standard models at all prediction horizons foroth the selection and evaluation sets are presented in Table 1. TheAE of the selection data set increased monotonically from 0.525 ◦C
t the one-hour horizon to 1.908 ◦C at the twelve-hour horizon. Therend was similar for the MAEs of the evaluation data set that werealculated for the same sites during 2004 and 2005. The MAEs of thevaluation data set associated with the models during this periodere slightly lower than those for the selection set, ranging from
ig. 2. Predicted and observed temperatures for Byron during 2004–2005 for the standarnd (d) twelve-hour horizon. A solid diagonal line indicates a hypothetical perfect model.
ics in Agriculture 68 (2009) 52–61 57
0.516 ◦C for the one-hour model to 1.873 ◦C for the 12 h model. Thefour-hour horizon that was used as the basis for experimentation inthis research resulted in an MAE of 1.187 ◦C for the evaluation dataset compared to 1.226 ◦C for the selection data set.
The resulting year-round models, developed with all 1.25 millionavailable patterns, were also evaluated over the winter selectionand winter evaluation subsets (Table 2). This allowed for furthercomparison with the winter models previously developed by Smithet al. (2006). When compared to these winter models, the year-round ANN errors were less than or equal to the winter selectionand winter evaluation MAEs for all horizons. These results indicatedthat the year-round air temperature prediction models, developedto be included in general decision support aids, were suitable for useduring the winter months. When comparing the results presentedin Tables 1 and 2, the MAEs for the winter data set proved to behigher than those for the year-round data across all horizons.
The scatter plots depicted in Fig. 2 present the prediction errorsfor four horizons. As expected, differences between predicted andobserved temperatures increased with the prediction horizon asreflected in the greater dispersion about the 1:1 line of a hypothet-ical, perfect model. Likewise, as horizon length increased, the valuefor R2 decreased. The regression analysis also suggested that themodels for longer horizons had a tendency to over-predict low-temperature observations and under-predict high-temperatureobservations.
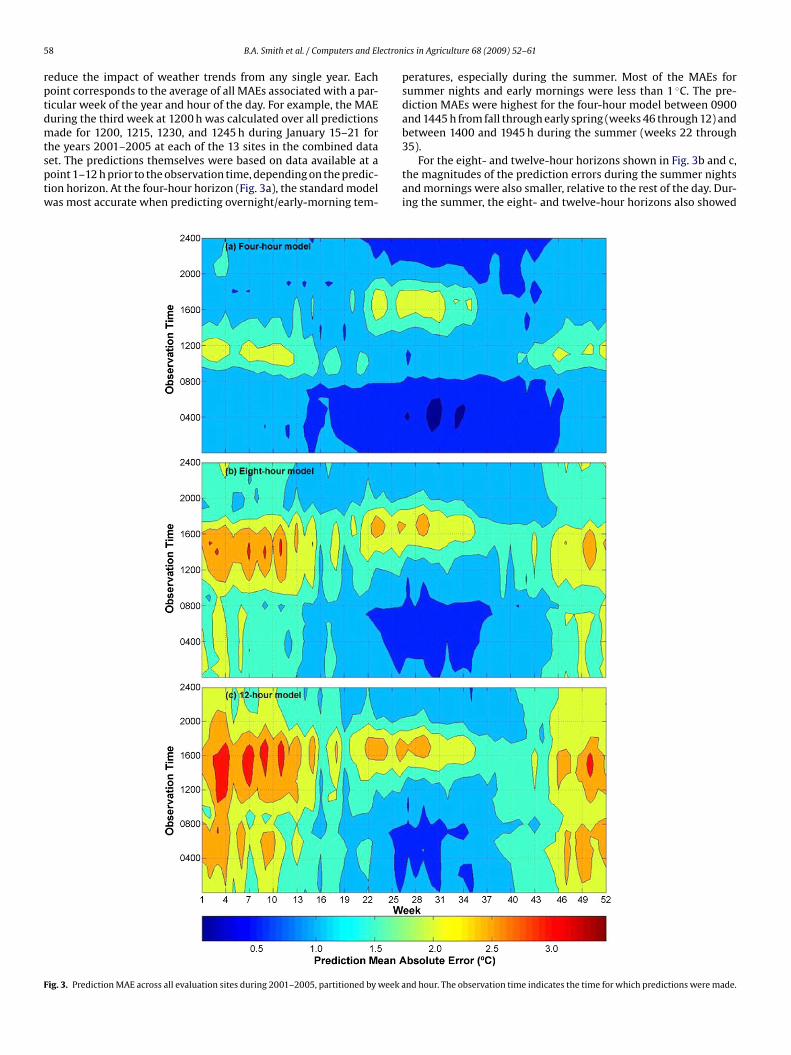
The accuracy of the models was also evaluated in relation tothe day of year and time of day at three different prediction hori-zons: 4, 8, and 12 h. Fig. 3 presents a contour plot of MAE for thecombined selection and evaluation sets of 2001–2005 partitionedby week of year and hour of day. The data sets were combined to
d model at the (a) one-hour horizon, (b) four-hour horizon, (c) eight-hour horizon,
5 ectron
rptdmtsptw
F
8 B.A. Smith et al. / Computers and El
educe the impact of weather trends from any single year. Eachoint corresponds to the average of all MAEs associated with a par-icular week of the year and hour of the day. For example, the MAEuring the third week at 1200 h was calculated over all predictionsade for 1200, 1215, 1230, and 1245 h during January 15–21 for
he years 2001–2005 at each of the 13 sites in the combined dataet. The predictions themselves were based on data available at aoint 1–12 h prior to the observation time, depending on the predic-ion horizon. At the four-hour horizon (Fig. 3a), the standard modelas most accurate when predicting overnight/early-morning tem-
ig. 3. Prediction MAE across all evaluation sites during 2001–2005, partitioned by week a
ics in Agriculture 68 (2009) 52–61
peratures, especially during the summer. Most of the MAEs forsummer nights and early mornings were less than 1 ◦C. The pre-diction MAEs were highest for the four-hour model between 0900and 1445 h from fall through early spring (weeks 46 through 12) andbetween 1400 and 1945 h during the summer (weeks 22 through
35).For the eight- and twelve-hour horizons shown in Fig. 3b and c,the magnitudes of the prediction errors during the summer nightsand mornings were also smaller, relative to the rest of the day. Dur-ing the summer, the eight- and twelve-hour horizons also showed
nd hour. The observation time indicates the time for which predictions were made.

B.A. Smith et al. / Computers and Electronics in Agriculture 68 (2009) 52–61 59
F ionedw
ttmrlhso
ig. 4. Prediction mean errors across all evaluation sites during 2001–2005, partitere made.
he highest MAEs during the afternoons from approximately 1400o 1900 h. The behavior of the standard eight- and twelve-hour
odel differed substantially from the four-hour horizon during the
est of the year. The eight- and twelve-hour horizons had noticeablyarger errors during the fall and winter mornings than the four-our horizon. The errors for the twelve-hour horizon were largertill. Periods of higher-than-average MAE for the four-hour horizonccurred in the morning and early afternoon outside of the sum-by week and hour. The observation time indicates the time for which predictions
mer. At the eight- and twelve-hour horizons, these periods of loweraccuracy persisted until the early evening.
The bias of the standard models as measured by mean error
partitioned by week and hour is presented in Fig. 4. A negativemean error indicates a tendency to under-predict, while a posi-tive mean error is evidence of over-prediction. Fig. 4a shows thatthe two areas of greatest MAEs identified at the four-hour hori-zon, fall/winter mid-day and summer afternoon, were associated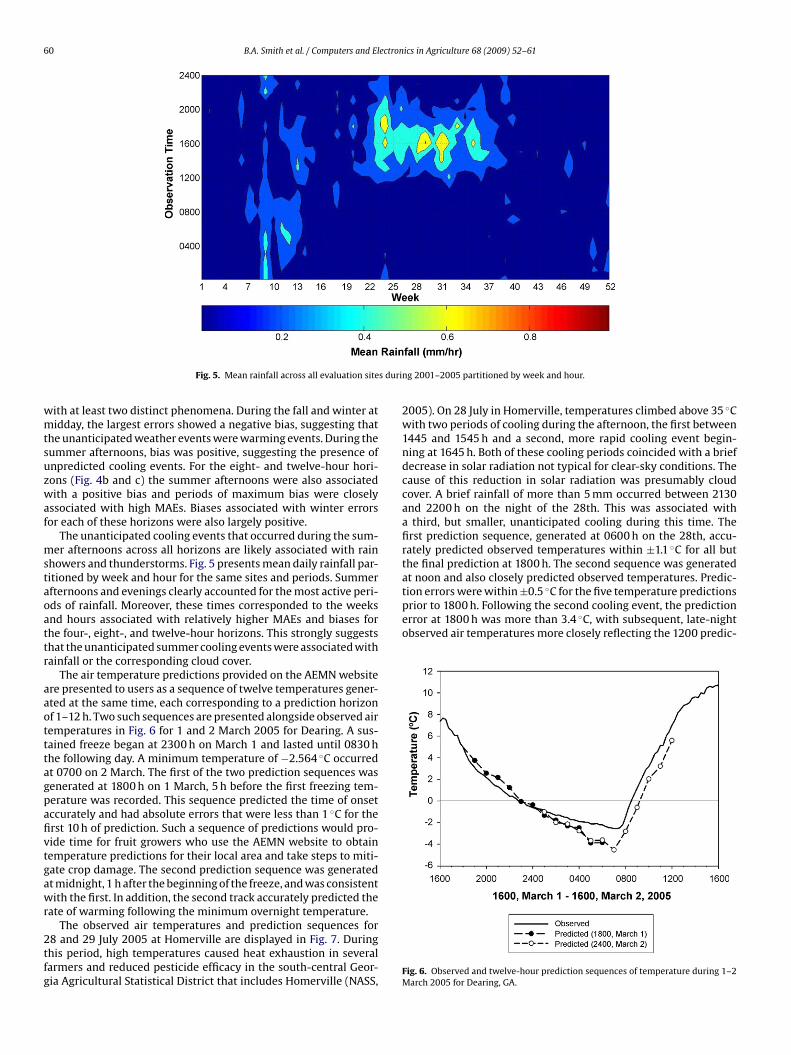
60 B.A. Smith et al. / Computers and Electronics in Agriculture 68 (2009) 52–61
s duri
wmtsuzwaf
mstaoattr
aaotttagpafivtgawr
2tfg
tion errors were within ±0.5 ◦C for the five temperature predictionsprior to 1800 h. Following the second cooling event, the predictionerror at 1800 h was more than 3.4 ◦C, with subsequent, late-nightobserved air temperatures more closely reflecting the 1200 predic-
Fig. 5. Mean rainfall across all evaluation site
ith at least two distinct phenomena. During the fall and winter atidday, the largest errors showed a negative bias, suggesting that
he unanticipated weather events were warming events. During theummer afternoons, bias was positive, suggesting the presence ofnpredicted cooling events. For the eight- and twelve-hour hori-ons (Fig. 4b and c) the summer afternoons were also associatedith a positive bias and periods of maximum bias were closely
ssociated with high MAEs. Biases associated with winter errorsor each of these horizons were also largely positive.
The unanticipated cooling events that occurred during the sum-er afternoons across all horizons are likely associated with rain
howers and thunderstorms. Fig. 5 presents mean daily rainfall par-itioned by week and hour for the same sites and periods. Summerfternoons and evenings clearly accounted for the most active peri-ds of rainfall. Moreover, these times corresponded to the weeksnd hours associated with relatively higher MAEs and biases forhe four-, eight-, and twelve-hour horizons. This strongly suggestshat the unanticipated summer cooling events were associated withainfall or the corresponding cloud cover.
The air temperature predictions provided on the AEMN websitere presented to users as a sequence of twelve temperatures gener-ted at the same time, each corresponding to a prediction horizonf 1–12 h. Two such sequences are presented alongside observed airemperatures in Fig. 6 for 1 and 2 March 2005 for Dearing. A sus-ained freeze began at 2300 h on March 1 and lasted until 0830 hhe following day. A minimum temperature of −2.564 ◦C occurredt 0700 on 2 March. The first of the two prediction sequences wasenerated at 1800 h on 1 March, 5 h before the first freezing tem-erature was recorded. This sequence predicted the time of onsetccurately and had absolute errors that were less than 1 ◦C for therst 10 h of prediction. Such a sequence of predictions would pro-ide time for fruit growers who use the AEMN website to obtainemperature predictions for their local area and take steps to miti-ate crop damage. The second prediction sequence was generatedt midnight, 1 h after the beginning of the freeze, and was consistentith the first. In addition, the second track accurately predicted the
ate of warming following the minimum overnight temperature.
The observed air temperatures and prediction sequences for8 and 29 July 2005 at Homerville are displayed in Fig. 7. Duringhis period, high temperatures caused heat exhaustion in severalarmers and reduced pesticide efficacy in the south-central Geor-ia Agricultural Statistical District that includes Homerville (NASS,
ng 2001–2005 partitioned by week and hour.
2005). On 28 July in Homerville, temperatures climbed above 35 ◦Cwith two periods of cooling during the afternoon, the first between1445 and 1545 h and a second, more rapid cooling event begin-ning at 1645 h. Both of these cooling periods coincided with a briefdecrease in solar radiation not typical for clear-sky conditions. Thecause of this reduction in solar radiation was presumably cloudcover. A brief rainfall of more than 5 mm occurred between 2130and 2200 h on the night of the 28th. This was associated witha third, but smaller, unanticipated cooling during this time. Thefirst prediction sequence, generated at 0600 h on the 28th, accu-rately predicted observed temperatures within ±1.1 ◦C for all butthe final prediction at 1800 h. The second sequence was generatedat noon and also closely predicted observed temperatures. Predic-
Fig. 6. Observed and twelve-hour prediction sequences of temperature during 1–2March 2005 for Dearing, GA.

B.A. Smith et al. / Computers and Electron
F2
tccc
4
oAswabtpsttatmcmwz
aist
ig. 7. Observed and twelve-hour prediction sequences of temperature during8–29 July 2005 for Homerville, GA.
ion sequence. Evaluations of multiple sites over a five-year period,oupled with the examination of individual prediction tracks, indi-ated that unanticipated cloud cover and rainfall were the likelyause of prediction errors associated with cooling events.
. Summary and conclusions
Year-round air temperature prediction models were devel-ped for prediction horizons of 1 to 12 h using Ward-styleNNs. These models were intended for use in general decisionupport and are currently implemented on the AEMN website,ww.GeorgiaWeather.net. The implementation of these models isclear example of research-based Artificial Intelligence (AI) that haseen implemented in a practical manner in a real-world applica-ion (Farkas, 2003). The ANN design modifications described hereinrovided increased accuracy over previously developed, winter-pecific models during the winter period. It was shown that modelshat included rainfall terms in the input vector were more accuratehan those that did not. Applying the ensemble techniques of seriesnd parallel aggregation to single-network models was not foundo be useful for this problem domain, as the very modest improve-
ents in prediction accuracies came with a heavy computationalost. The accuracy of the resulting four-, eight-, and twelve-hourodels was analyzed, showing that unanticipated cooling eventsere the most significant obstacle faced, especially at longer hori-
ons.
The results suggest that accurate cloud-cover predictions mightid in the prediction of associated cooling events, especially dur-ng the summer. Further study might also determine if modelspecifically tailored to the periods of greater-than-average predic-ion errors might be useful in an ensemble approach. Because of
ics in Agriculture 68 (2009) 52–61 61
the focus on developing models applicable to a broad range of loca-tions, temperature prediction work in the AEMN domain has notmade use of geographic information. Future work could focus onthe possibility of adding the information in such a manner as topreserve the general applicability of the model.
Acknowledgments
This work was funded in part by a partnership between theUSDA-Federal Crop Insurance Corporation through the Risk Man-agement Agency and the University of Georgia and by state andfederal funds allocated to Georgia Agricultural Experiment Sta-tions Hatch projects GEO00877 and GEO01654. The authors wouldalso like to thank the other members of the AEMN researchteam, Daniel Shank and Kevin Crowell, for their input and sugges-tions.
References
Bruton, J.M., McClendon, R.W., Hoogenboom, G., 2000. Estimating daily pan evapo-ration with artificial neural networks. Trans. ASAE 43 (2), 491–496.
Elizondo, D., Hoogenboom, G., McClendon, R.W., 1994. Development of a neuralnetwork to predict daily solar radiation. Agric. Forest Meteorol. 71, 115–132.
Farkas, I., 2003. Artificial intelligence in agriculture. Comput. Electron. Agric. 40, 1–3,Editorial.
Ghielmi, L., Eccel, E., 2006. Descriptive models and artificial neural networks forspring frost prediction in an agricultural mountain area. Comput. Electron. Agric.54, 101–114.
Haykin, S., 1999. Neural Networks: A Comprehensive Foundation, 2nd ed. Prentice-Hall, Upper Saddle River, NJ.
Hoogenboom, G., 2000. The Georgia automated environmental monitoring network.In: Preprints of the 24th Conference on Agricultural and Forest Meteorology, pp.24–25.
Jain, A., McClendon, R.W., Hoogenboom, G., 2006. Freeze prediction for specific loca-tions using artificial neural networks. Trans. ASAE 49 (6), 1955–1962.
Jain, A., McClendon, R.W., Hoogenboom, G., Ramyaa, R., 2003. Prediction of frost forfruit protection using artificial neural networks. American Society of AgriculturalEngineers, St. Joseph, MI, ASAE Paper 03-3075.
Jiang, D., Zhang, Y., Hu, X., Zeng, Y., Tan, J., Shao, D., 2004. Progress in developing anANN model for air pollution index forecast. Atmos. Environ. 38 (40), 7055–7064.
Li, B., McClendon, R.W., Hoogenboom, G., 2004. Spatial interpolation of weathervariables for single locations using artificial neural networks. Trans. ASAE 47 (2),629–637.
Maqsood, I., Khan, M.R., Abraham, A., 2004. An ensemble of neural networks forweather forecasting. Neural Comput. Appl. 13, 112–122.
National Agricultural Statistical Service, 2005. Crop Progress and Condition Report.31 July 2005.
Prabha, T., Hoogenboom, G., 2008. Evaluation of the weather research and forecastingmodel for two frost events. Comput. Electron. Agric. 64, 234–247.
Ramyaa, 2004. Frost prediction using artificial neural networks: a classificationapproach. MS Thesis, Artificial Intelligence Center, University of Georgia, Athens,GA.
Ruano, A.E., Crispim, E.M., Conceicão, E.Z.E., Lúcio, M.M.J.R., 2006. Prediction of build-ing’s temperature using neural networks models. Energy Build. 38, 682–694.
Shank, D., Hoogenboom, G., McClendon, R.W., 2008a. Dew point temperature pre-diction using artificial neural networks. J. Appl. Meteorol. Climatol. 47 (6),1757–1769.
Shank, D.B., McClendon, R.W., Paz, J.O., Hoogenboom, G., 2008b. Ensemble artificialneural networks for prediction of dew point temperature. Appl. Artif. Intell. 22(6), 523–542.
Smith, B.A., McClendon, R.W., Hoogenboom, G., 2006. Improving air temperature
prediction with artificial neural networks. Int. J. Comput. Intell. 3 (3), 179–186.Ward Systems Group, Inc. NeuroShell 2, Frederick, MD (http://www.wardsystems.com/).
Yi, J., Prybutok, R., 1996. A neural network model forecasting for prediction of dailymaximum ozone concentration in an industrialized urban area. Environ. Pollut.92 (3), 349–357.