Embed Size (px)
DESCRIPTION
This report presents the outcome analyses conducted by the Justice Research Center (JRC) of the third & final year of the Jefferson County School Board Arts in Education Project (AEP). Youth at the Howard Middle School in Jefferson County, FL (treatment group) received the curriculum, while a matched set of youth attending Central Middle School in Madison County, FL, were selected to serve as a comparison group. Various measures of academic progress were collected for the students in the treatment cohort & compared to those in the comparison cohort. Data were collected for the 5th, 6th, 7th & 8th grade years for both cohorts to assess outcome results. The results of this study indicate that both the treatment and comparison cohorts had decreases in mean subject grades over the study period. However, the treatment group exhibited significant increases in the National Norm Reference Test for reading & math scores, as well as increases in FCAT scores.
Citation preview

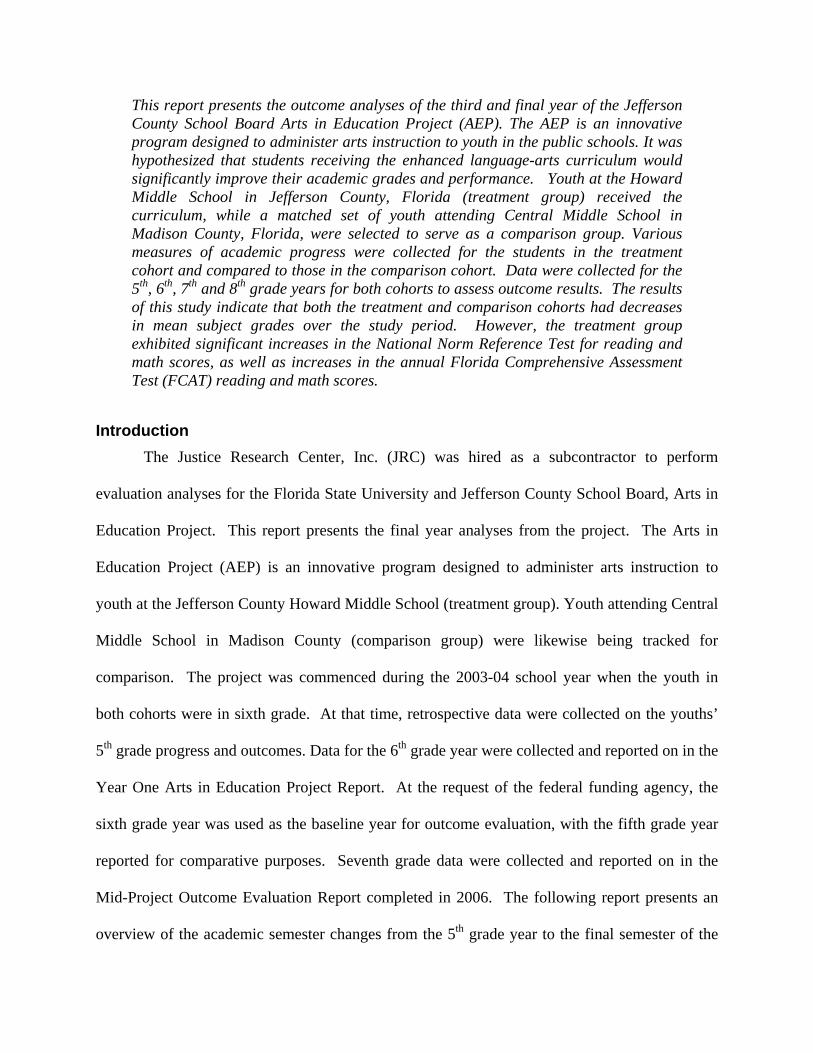
This report presents the outcome analyses of the third and final year of the Jefferson County School Board Arts in Education Project (AEP). The AEP is an innovative program designed to administer arts instruction to youth in the public schools. It was hypothesized that students receiving the enhanced language-arts curriculum would significantly improve their academic grades and performance. Youth at the Howard Middle School in Jefferson County, Florida (treatment group) received the curriculum, while a matched set of youth attending Central Middle School in Madison County, Florida, were selected to serve as a comparison group. Various measures of academic progress were collected for the students in the treatment cohort and compared to those in the comparison cohort. Data were collected for the 5th, 6th, 7th and 8th grade years for both cohorts to assess outcome results. The results of this study indicate that both the treatment and comparison cohorts had decreases in mean subject grades over the study period. However, the treatment group exhibited significant increases in the National Norm Reference Test for reading and math scores, as well as increases in the annual Florida Comprehensive Assessment Test (FCAT) reading and math scores.
Introduction The Justice Research Center, Inc. (JRC) was hired as a subcontractor to perform
evaluation analyses for the Florida State University and Jefferson County School Board, Arts in
Education Project. This report presents the final year analyses from the project. The Arts in
Education Project (AEP) is an innovative program designed to administer arts instruction to
youth at the Jefferson County Howard Middle School (treatment group). Youth attending Central
Middle School in Madison County (comparison group) were likewise being tracked for
comparison. The project was commenced during the 2003-04 school year when the youth in
both cohorts were in sixth grade. At that time, retrospective data were collected on the youths’
5th grade progress and outcomes. Data for the 6th grade year were collected and reported on in the
Year One Arts in Education Project Report. At the request of the federal funding agency, the
sixth grade year was used as the baseline year for outcome evaluation, with the fifth grade year
reported for comparative purposes. Seventh grade data were collected and reported on in the
Mid-Project Outcome Evaluation Report completed in 2006. The following report presents an
overview of the academic semester changes from the 5th grade year to the final semester of the
8th grade year for the treatment and comparison groups. In examining significant outcome
differences between the two groups, the 6th grade year was used as the baseline and each
subsequent year-end semester through the 8th grade as outcome data. This quasi-experimental
design was used (as random assignment was not permitted) to assess outcome differences in
school performance between the treatment and comparison group. Significant differences should
be interpreted with caution, as they may in part be due to internal or external factors impacting
outcomes. Both descriptive statistics and analysis of variance models are presented in examining
differences between the treatment and comparison groups on school performance measures.
Study Hypotheses and Baseline Data
In the original grant application, the Florida State University researchers hypothesized
that students receiving the enhanced language-arts curriculum in Jefferson County’s Howard
Middle School would significantly improve their reading and language arts skills as measured by
three indicators: 1) student grades, 2) National Norm Referenced Test scores and 3) Florida
Comprehensive Assessment Test (FCAT) scores in reading and math. It was also hypothesized
that youth completing the intervention in the treatment group would exhibit improvements in
other subjects such as reading, science, and social studies grades. Because past research has
found a link between arts education and social skills, the Florida State University researchers
also hypothesized that the language-arts intervention would enhance students’ empathy and pro-
social skills. Improvement in these areas was to be measured by examining changes in school
disciplinary referrals, attendance, suspensions and scores on two instruments: the Interpersonal
Reactivity Index (IRI) to measure empathy, and the Social Skills Rating System (SSRS) to
measure pro-social skills. While data on disciplinary referrals, attendance and suspensions were
forwarded to the JRC, scores on the IRI and SSRS were not provided to the subcontractor and,
2

therefore, only changes on subject grades, national standardized tests, FCAT scores, school
attendance, suspensions and disciplinary referrals are presented here.
Findings
The focus of the current analysis was to examine descriptive statistics and outcomes for
the treatment (Jefferson) and comparison (Madison) cohorts of youth across the period from the
students’ sixth grade year through the eighth grade. Within- and between-group comparisons of
outcomes are presented for youths’ academic performance in the subject areas of language arts,
reading, math, social studies and science; the extent of absences, suspensions and disciplinary
actions; and performance on state and national standardized educational testing scores.
Treatment and Comparison Group Descriptions
The 5th grade school year was originally intended to serve as the baseline measurement
for the Arts in Education project. However, at the request of the federal funding agency seeking
to have uniformity across funding sites, 6th grade was set as the baseline year against which
subsequent years’ grades and scores would be compared for both the treatment and comparison
cohorts. It should be noted, that for the final 8th grade year, data were not uniformly available for
all Jefferson and Madison county study youth for science and social studies. As such, these two
subjects were omitted from outcome evaluation comparisons.
Table 1 presents the descriptive statistics for the treatment and comparison groups by
academic grade/year. There were a total of 91 students in the 6th grade treatment cohort in
Jefferson County. This compares to a class size of 236 in the comparison group, Madison
County. While Florida State University project staff attempted to track each of these youths
3
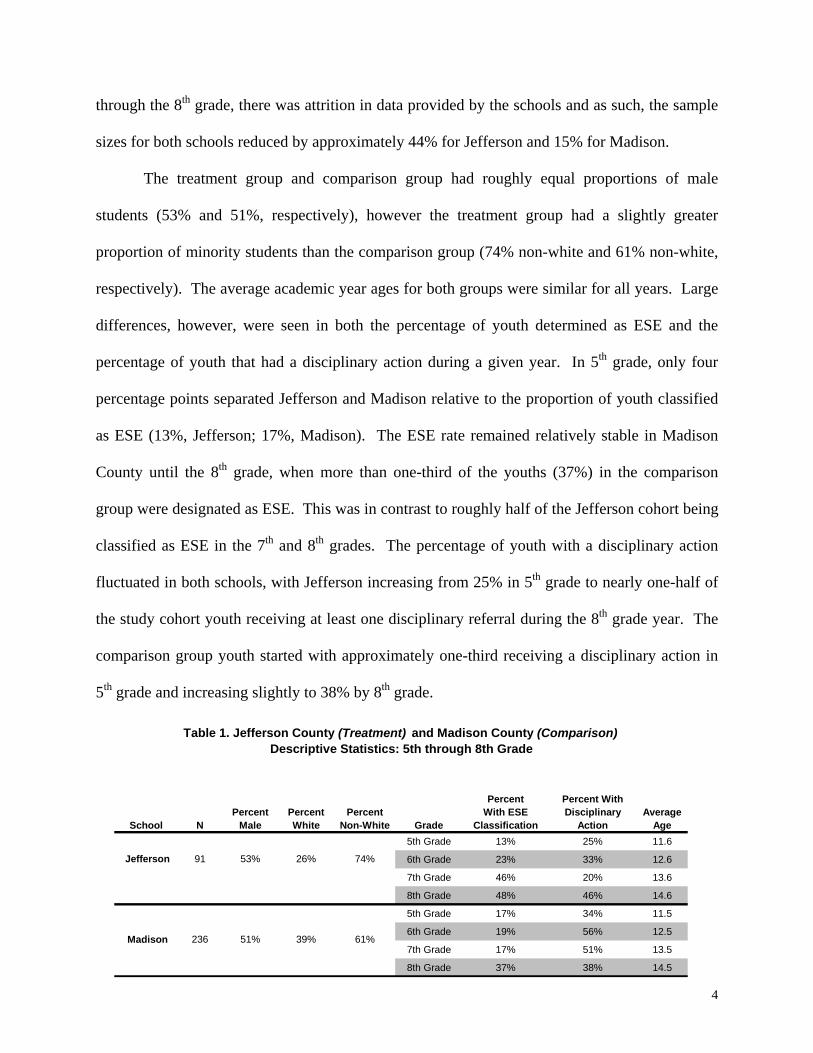
through the 8th grade, there was attrition in data provided by the schools and as such, the sample
sizes for both schools reduced by approximately 44% for Jefferson and 15% for Madison.
The treatment group and comparison group had roughly equal proportions of male
students (53% and 51%, respectively), however the treatment group had a slightly greater
proportion of minority students than the comparison group (74% non-white and 61% non-white,
respectively). The average academic year ages for both groups were similar for all years. Large
differences, however, were seen in both the percentage of youth determined as ESE and the
percentage of youth that had a disciplinary action during a given year. In 5th grade, only four
percentage points separated Jefferson and Madison relative to the proportion of youth classified
as ESE (13%, Jefferson; 17%, Madison). The ESE rate remained relatively stable in Madison
County until the 8th grade, when more than one-third of the youths (37%) in the comparison
group were designated as ESE. This was in contrast to roughly half of the Jefferson cohort being
classified as ESE in the 7th and 8th grades. The percentage of youth with a disciplinary action
fluctuated in both schools, with Jefferson increasing from 25% in 5th grade to nearly one-half of
the study cohort youth receiving at least one disciplinary referral during the 8th grade year. The
comparison group youth started with approximately one-third receiving a disciplinary action in
5th grade and increasing slightly to 38% by 8th grade.
5th Grade 13% 25% 11.6
6th Grade 23% 33% 12.6
7th Grade 46% 20% 13.6
8th Grade 48% 46% 14.6
5th Grade 17% 34% 11.5
6th Grade 19% 56% 12.5
7th Grade 17% 51% 13.561%
Jefferson
Percent White
91 53% 26%
School NPercent
MalePercent
Non-White
Madison 236 51% 39%
Table 1. Jefferson County (Treatment) and Madison County (Comparison)Descriptive Statistics: 5th through 8th Grade
74%
Percent With Disciplinary
ActionAverage
AgeGrade
Percent With ESE
Classification
8th Grade 37% 38% 14.5
4
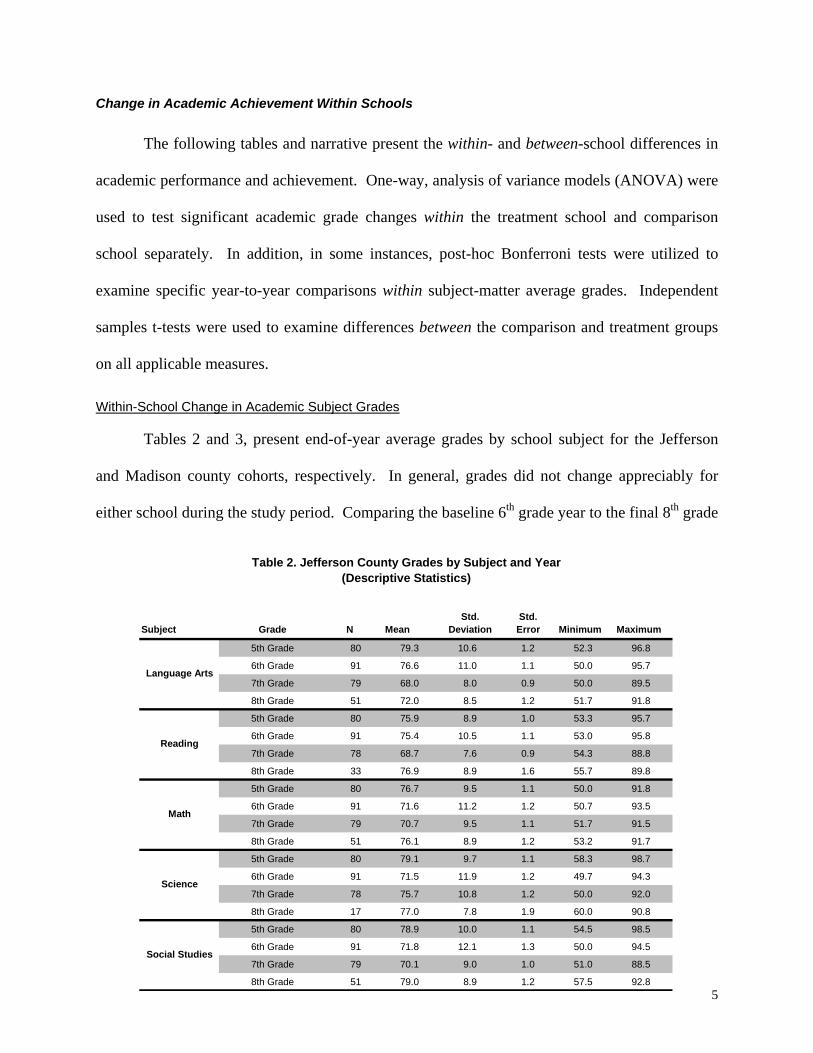
Change in Academic Achievement Within Schools
The following tables and narrative present the within- and between-school differences in
academic performance and achievement. One-way, analysis of variance models (ANOVA) were
used to test significant academic grade changes within the treatment school and comparison
school separately. In addition, in some instances, post-hoc Bonferroni tests were utilized to
examine specific year-to-year comparisons within subject-matter average grades. Independent
samples t-tests were used to examine differences between the comparison and treatment groups
on all applicable measures.
Within-School Change in Academic Subject Grades
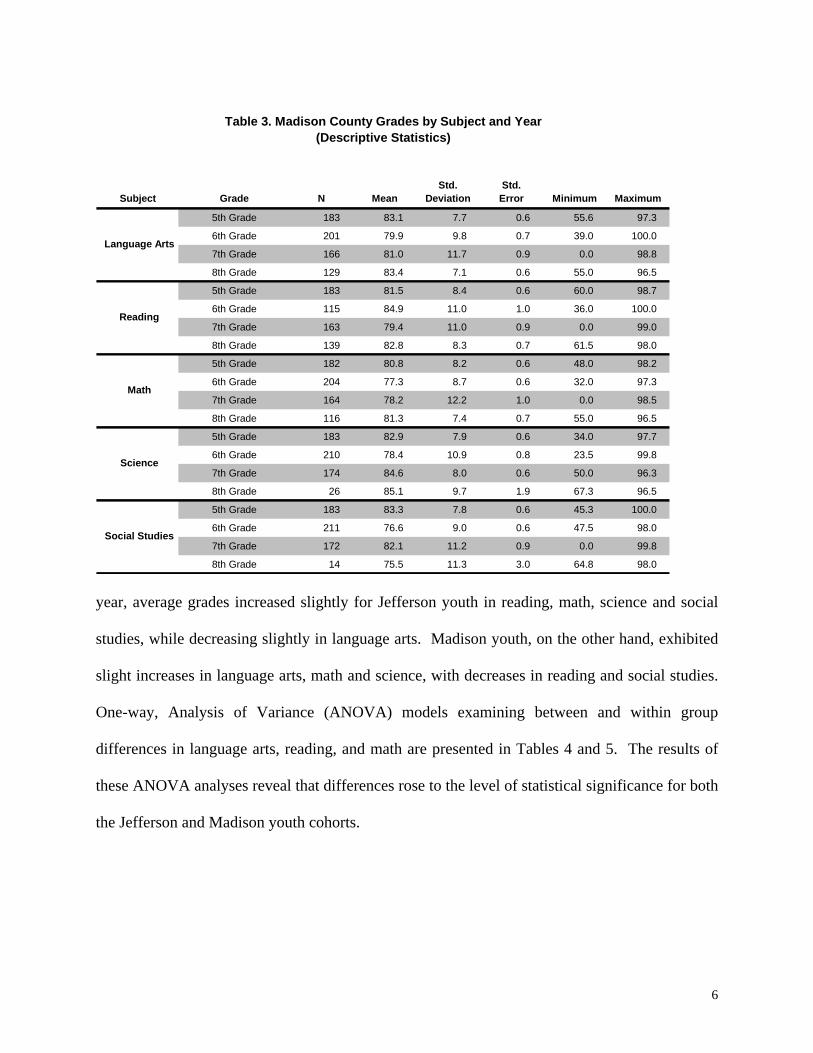
Tables 2 and 3, present end-of-year average grades by school subject for the Jefferson
and Madison county cohorts, respectively. In general, grades did not change appreciably for
either school during the study period. Comparing the baseline 6th grade year to the final 8th grade
Subject Grade N MeanStd.
DeviationStd.
Error Minimum Maximum
5th Grade 80 79.3 10.6 1.2 52.3 96.8
6th Grade 91 76.6 11.0 1.1 50.0 95.7
7th Grade 79 68.0 8.0 0.9 50.0 89.5
8th Grade 51 72.0 8.5 1.2 51.7 91.8
5th Grade 80 75.9 8.9 1.0 53.3 95.7
6th Grade 91 75.4 10.5 1.1 53.0 95.8
7th Grade 78 68.7 7.6 0.9 54.3 88.8
8th Grade 33 76.9 8.9 1.6 55.7 89.8
5th Grade 80 76.7 9.5 1.1 50.0 91.8
6th Grade 91 71.6 11.2 1.2 50.7 93.5
7th Grade 79 70.7 9.5 1.1 51.7 91.5
8th Grade 51 76.1 8.9 1.2 53.2 91.7
5th Grade 80 79.1 9.7 1.1 58.3 98.7
6th Grade 91 71.5 11.9 1.2 49.7 94.3
7th Grade 78 75.7 10.8 1.2 50.0 92.0
8th Grade 17 77.0 7.8 1.9 60.0 90.8
5th Grade 80 78.9 10.0 1.1 54.5 98.5
6th Grade 91 71.8 12.1 1.3 50.0 94.5
Table 2. Jefferson County Grades by Subject and Year(Descriptive Statistics)
Language Arts
Reading
Math
Science
Social Studies
5
7th Grade 79 70.1 9.0 1.0 51.0 88.5
8th Grade 51 79.0 8.9 1.2 57.5 92.8
Subject Grade N MeanStd.
DeviationStd.
Error Minimum Maximum
5th Grade 183 83.1 7.7 0.6 55.6 97.3
6th Grade 201 79.9 9.8 0.7 39.0 100.0
7th Grade 166 81.0 11.7 0.9 0.0 98.8
8th Grade 129 83.4 7.1 0.6 55.0 96.5
5th Grade 183 81.5 8.4 0.6 60.0 98.7
6th Grade 115 84.9 11.0 1.0 36.0 100.0
7th Grade 163 79.4 11.0 0.9 0.0 99.0
8th Grade 139 82.8 8.3 0.7 61.5 98.0
5th Grade 182 80.8 8.2 0.6 48.0 98.2
6th Grade 204 77.3 8.7 0.6 32.0 97.3
7th Grade 164 78.2 12.2 1.0 0.0 98.5
8th Grade 116 81.3 7.4 0.7 55.0 96.5
5th Grade 183 82.9 7.9 0.6 34.0 97.7
6th Grade 210 78.4 10.9 0.8 23.5 99.8
7th Grade 174 84.6 8.0 0.6 50.0 96.3
8th Grade 26 85.1 9.7 1.9 67.3 96.5
5th Grade 183 83.3 7.8 0.6 45.3 100.0
6th Grade 211 76.6 9.0 0.6 47.5 98.0
7th Grade 172 82.1 11.2 0.9 0.0 99.8
8th Grade 14 75.5 11.3 3.0 64.8 98.0
Table 3. Madison County Grades by Subject and Year(Descriptive Statistics)
Language Arts
Reading
Math
Social Studies
Science
year, average grades increased slightly for Jefferson youth in reading, math, science and social
studies, while decreasing slightly in language arts. Madison youth, on the other hand, exhibited
slight increases in language arts, math and science, with decreases in reading and social studies.
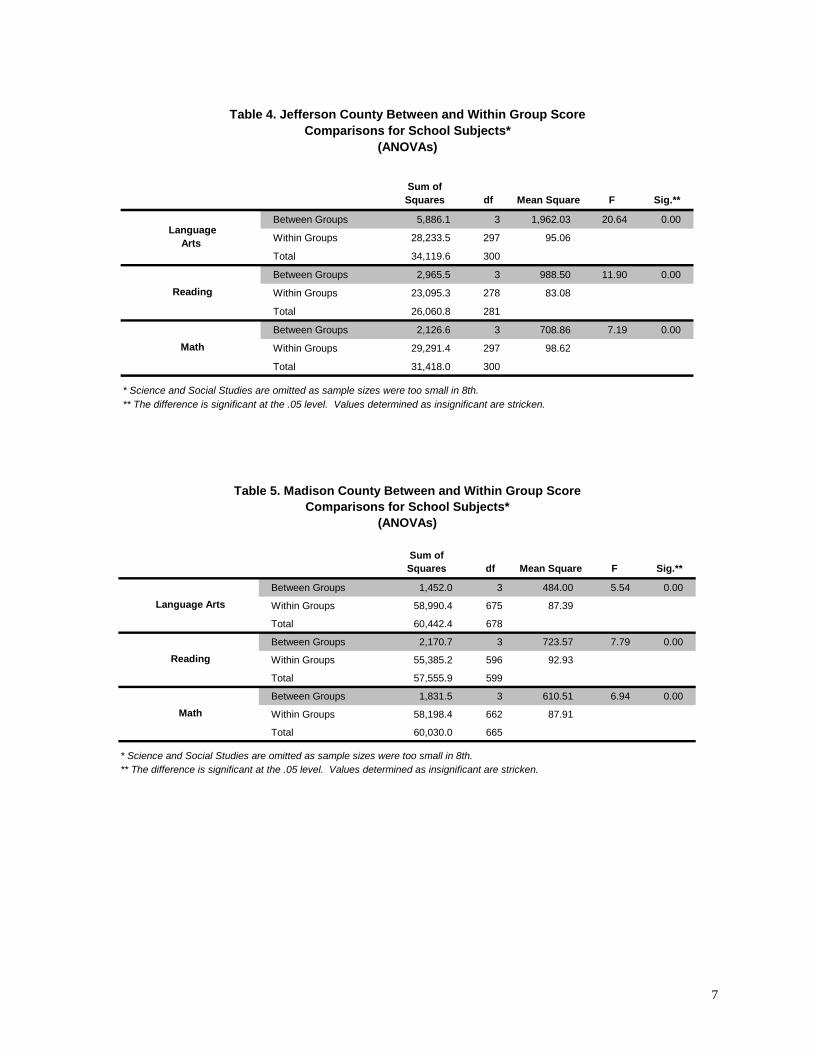
One-way, Analysis of Variance (ANOVA) models examining between and within group
differences in language arts, reading, and math are presented in Tables 4 and 5. The results of
these ANOVA analyses reveal that differences rose to the level of statistical significance for both
the Jefferson and Madison youth cohorts.
6
Sum of Squares df Mean Square F Sig.**
Between Groups 5,886.1 3 1,962.03 20.64 0.00
Within Groups 28,233.5 297 95.06
Total 34,119.6 300
Between Groups 2,965.5 3 988.50 11.90 0.00
Within Groups 23,095.3 278 83.08
Total 26,060.8 281
Between Groups 2,126.6 3 708.86 7.19 0.00
Within Groups 29,291.4 297 98.62
Total 31,418.0 300
Table 4. Jefferson County Between and Within Group Score Comparisons for School Subjects*
(ANOVAs)
Language Arts
Reading
Math
* Science and Social Studies are omitted as sample sizes were too small in 8th.** The difference is significant at the .05 level. Values determined as insignificant are stricken.
Sum of Squares df Mean Square F Sig.**
Between Groups 1,452.0 3 484.00 5.54 0.00
Within Groups 58,990.4 675 87.39
Total 60,442.4 678
Between Groups 2,170.7 3 723.57 7.79 0.00
Within Groups 55,385.2 596 92.93
Total 57,555.9 599
Between Groups 1,831.5 3 610.51 6.94 0.00
Within Groups 58,198.4 662 87.91
Total 60,030.0 665
* Science and Social Studies are omitted as sample sizes were too small in 8th.** The difference is significant at the .05 level. Values determined as insignificant are stricken.
Table 5. Madison County Between and Within Group Score Comparisons for School Subjects*
(ANOVAs)
Language Arts
Reading
Math
7
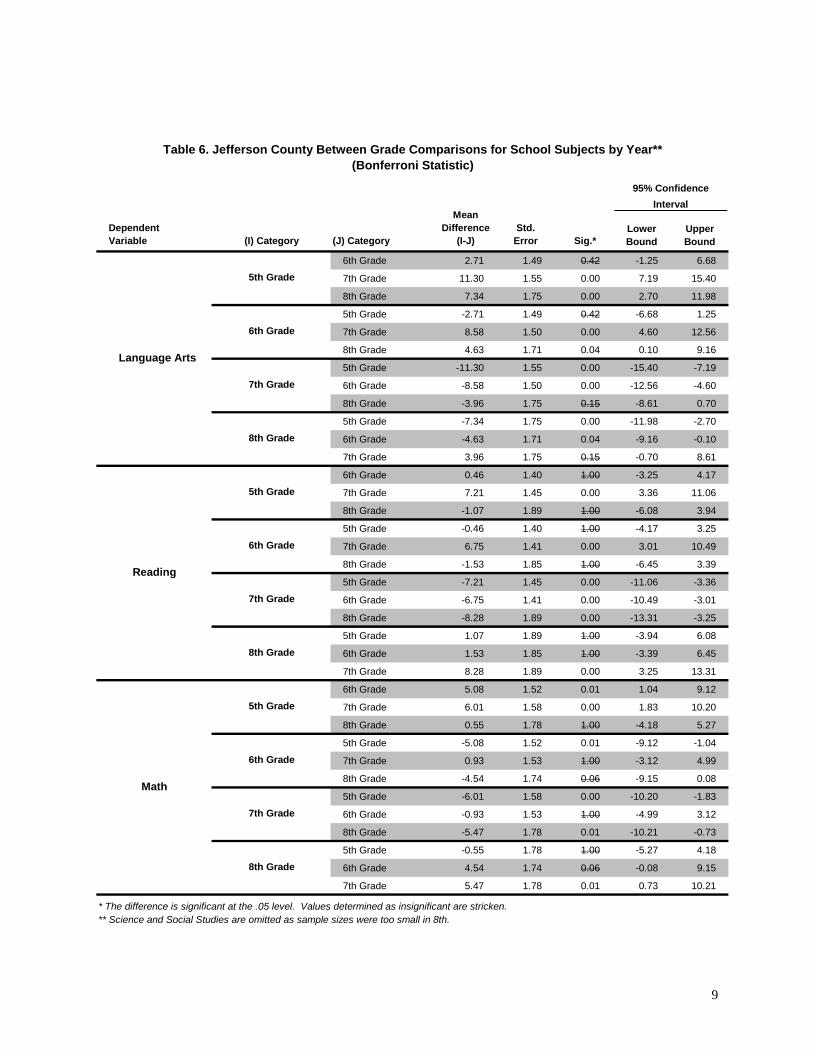
Post-hoc Bonferroni tests were utilized to examine specific year-to-year comparisons
within subject-matter average grades. The critical year comparisons are 6th to 8th grade mean
differences and corresponding significance levels (i.e., baseline year to final year). As can be
seen in Table 6, the decreases in language arts grades were significant between 5th and 8th, and
the 6th and 8th grade years for Jefferson County. While there was a 3.96 average percentage point
increase between 7th and 8th grade in language arts, this change was not statistically significant at
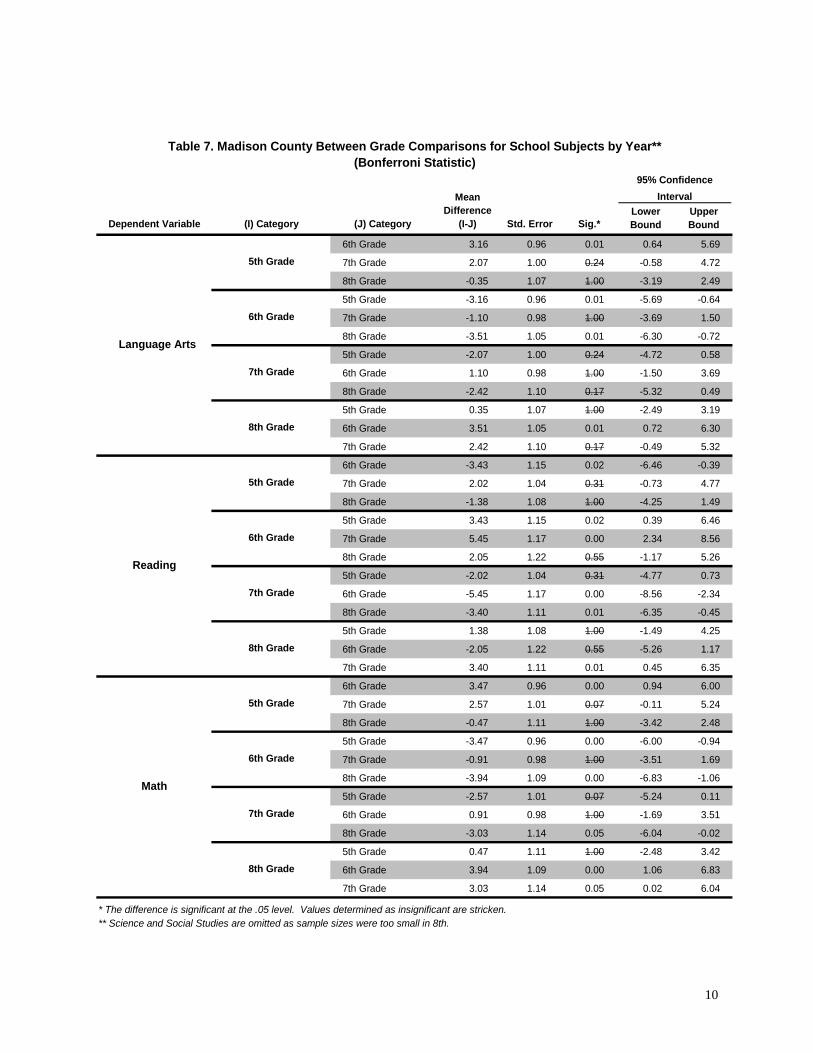
the 0.05 level. Conversely, Table 7 depicts the same test statistics for Madison County where
the average language arts grade for students increased approximately 3.51 percentage points
between 6th and 8th grade, a finding statistically significant at the 0.05 level.
While average language arts grades did not increase for Jefferson students, their average
grades for reading and math did increase significantly between the 7th and 8th grade years of the
Arts in Education Project. Madison County reading grades while up over this same one-year
period, actually declined overall between the 6th and 8th grade years.
8
Lower Bound
Upper Bound
6th Grade 2.71 1.49 0.42 -1.25 6.68
7th Grade 11.30 1.55 0.00 7.19 15.40
8th Grade 7.34 1.75 0.00 2.70 11.98
5th Grade -2.71 1.49 0.42 -6.68 1.25
7th Grade 8.58 1.50 0.00 4.60 12.56
8th Grade 4.63 1.71 0.04 0.10 9.16
5th Grade -11.30 1.55 0.00 -15.40 -7.19
6th Grade -8.58 1.50 0.00 -12.56 -4.60
8th Grade -3.96 1.75 0.15 -8.61 0.70
5th Grade -7.34 1.75 0.00 -11.98 -2.70
6th Grade -4.63 1.71 0.04 -9.16 -0.10
7th Grade 3.96 1.75 0.15 -0.70 8.61
6th Grade 0.46 1.40 1.00 -3.25 4.17
7th Grade 7.21 1.45 0.00 3.36 11.06
8th Grade -1.07 1.89 1.00 -6.08 3.94
5th Grade -0.46 1.40 1.00 -4.17 3.25
7th Grade 6.75 1.41 0.00 3.01 10.49
8th Grade -1.53 1.85 1.00 -6.45 3.39
5th Grade -7.21 1.45 0.00 -11.06 -3.36
6th Grade -6.75 1.41 0.00 -10.49 -3.01
8th Grade -8.28 1.89 0.00 -13.31 -3.25
5th Grade 1.07 1.89 1.00 -3.94 6.08
6th Grade 1.53 1.85 1.00 -3.39 6.45
7th Grade 8.28 1.89 0.00 3.25 13.31
6th Grade 5.08 1.52 0.01 1.04 9.12
7th Grade 6.01 1.58 0.00 1.83 10.20
8th Grade 0.55 1.78 1.00 -4.18 5.27
5th Grade -5.08 1.52 0.01 -9.12 -1.04
7th Grade 0.93 1.53 1.00 -3.12 4.99
8th Grade -4.54 1.74 0.06 -9.15 0.08
5th Grade -6.01 1.58 0.00 -10.20 -1.83
6th Grade -0.93 1.53 1.00 -4.99 3.12
8th Grade -5.47 1.78 0.01 -10.21 -0.73
5th Grade -0.55 1.78 1.00 -5.27 4.18
6th Grade 4.54 1.74 0.06 -0.08 9.15
7th Grade 5.47 1.78 0.01 0.73 10.21
5th Grade
6th Grade
7th Grade
8th Grade
8th Grade
Reading
5th Grade
6th Grade
7th Grade
8th Grade
* The difference is significant at the .05 level. Values determined as insignificant are stricken.** Science and Social Studies are omitted as sample sizes were too small in 8th.
5th Grade
6th Grade
7th Grade
Language Arts
Math
Table 6. Jefferson County Between Grade Comparisons for School Subjects by Year** (Bonferroni Statistic)
Mean Difference
(I-J)Std.
Error Sig.*
95% Confidence Interval
(J) Category(I) CategoryDependent Variable
9
Lower Bound
Upper Bound
6th Grade 3.16 0.96 0.01 0.64 5.69
7th Grade 2.07 1.00 0.24 -0.58 4.72
8th Grade -0.35 1.07 1.00 -3.19 2.49
5th Grade -3.16 0.96 0.01 -5.69 -0.64
7th Grade -1.10 0.98 1.00 -3.69 1.50
8th Grade -3.51 1.05 0.01 -6.30 -0.72
5th Grade -2.07 1.00 0.24 -4.72 0.58
6th Grade 1.10 0.98 1.00 -1.50 3.69
8th Grade -2.42 1.10 0.17 -5.32 0.49
5th Grade 0.35 1.07 1.00 -2.49 3.19
6th Grade 3.51 1.05 0.01 0.72 6.30
7th Grade 2.42 1.10 0.17 -0.49 5.32
6th Grade -3.43 1.15 0.02 -6.46 -0.39
7th Grade 2.02 1.04 0.31 -0.73 4.77
8th Grade -1.38 1.08 1.00 -4.25 1.49
5th Grade 3.43 1.15 0.02 0.39 6.46
7th Grade 5.45 1.17 0.00 2.34 8.56
8th Grade 2.05 1.22 0.55 -1.17 5.26
5th Grade -2.02 1.04 0.31 -4.77 0.73
6th Grade -5.45 1.17 0.00 -8.56 -2.34
8th Grade -3.40 1.11 0.01 -6.35 -0.45
5th Grade 1.38 1.08 1.00 -1.49 4.25
6th Grade -2.05 1.22 0.55 -5.26 1.17
7th Grade 3.40 1.11 0.01 0.45 6.35
6th Grade 3.47 0.96 0.00 0.94 6.00
7th Grade 2.57 1.01 0.07 -0.11 5.24
8th Grade -0.47 1.11 1.00 -3.42 2.48
5th Grade -3.47 0.96 0.00 -6.00 -0.94
7th Grade -0.91 0.98 1.00 -3.51 1.69
8th Grade -3.94 1.09 0.00 -6.83 -1.06
5th Grade -2.57 1.01 0.07 -5.24 0.11
6th Grade 0.91 0.98 1.00 -1.69 3.51
8th Grade -3.03 1.14 0.05 -6.04 -0.02
5th Grade 0.47 1.11 1.00 -2.48 3.42
6th Grade 3.94 1.09 0.00 1.06 6.83
7th Grade 3.03 1.14 0.05 0.02 6.04
Table 7. Madison County Between Grade Comparisons for School Subjects by Year** (Bonferroni Statistic)
Mean Difference
(I-J) Std. Error Sig.*
95% Confidence Interval
(J) Category(I) CategoryDependent Variable
5th Grade
6th Grade
7th Grade
Language Arts
Math
** Science and Social Studies are omitted as sample sizes were too small in 8th.* The difference is significant at the .05 level. Values determined as insignificant are stricken.
8th Grade
Reading
5th Grade
6th Grade
7th Grade
8th Grade
5th Grade
6th Grade
7th Grade
8th Grade
10
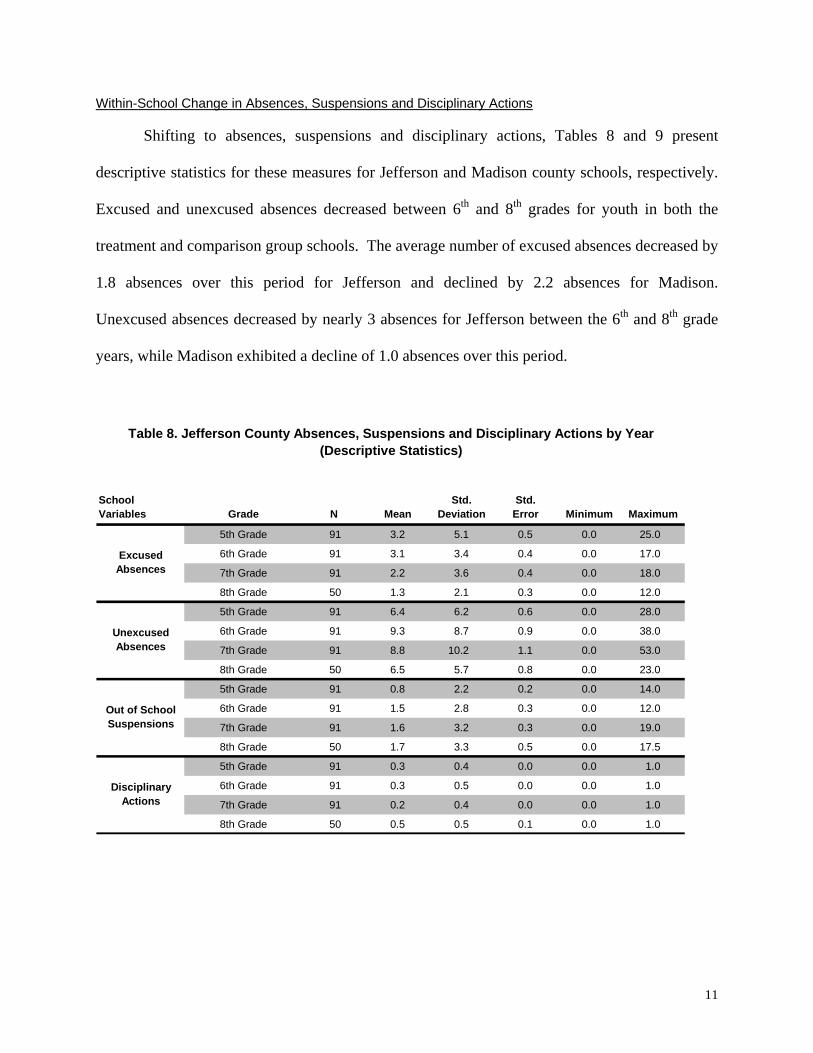
Within-School Change in Absences, Suspensions and Disciplinary Actions
Shifting to absences, suspensions and disciplinary actions, Tables 8 and 9 present
descriptive statistics for these measures for Jefferson and Madison county schools, respectively.
Excused and unexcused absences decreased between 6th and 8th grades for youth in both the
treatment and comparison group schools. The average number of excused absences decreased by
1.8 absences over this period for Jefferson and declined by 2.2 absences for Madison.
Unexcused absences decreased by nearly 3 absences for Jefferson between the 6th and 8th grade
years, while Madison exhibited a decline of 1.0 absences over this period.
School Variables Grade N Mean
Std. Deviation
Std. Error Minimum Maximum
5th Grade 91 3.2 5.1 0.5 0.0 25.0
6th Grade 91 3.1 3.4 0.4 0.0 17.0
7th Grade 91 2.2 3.6 0.4 0.0 18.0
8th Grade 50 1.3 2.1 0.3 0.0 12.0
5th Grade 91 6.4 6.2 0.6 0.0 28.0
6th Grade 91 9.3 8.7 0.9 0.0 38.0
7th Grade 91 8.8 10.2 1.1 0.0 53.0
8th Grade 50 6.5 5.7 0.8 0.0 23.0
5th Grade 91 0.8 2.2 0.2 0.0 14.0
6th Grade 91 1.5 2.8 0.3 0.0 12.0
7th Grade 91 1.6 3.2 0.3 0.0 19.0
8th Grade 50 1.7 3.3 0.5 0.0 17.5
5th Grade 91 0.3 0.4 0.0 0.0 1.0
6th Grade 91 0.3 0.5 0.0 0.0 1.0
7th Grade 91 0.2 0.4 0.0 0.0 1.0
8th Grade 50 0.5 0.5 0.1 0.0 1.0
Out of School Suspensions
Disciplinary Actions
Unexcused Absences
Table 8. Jefferson County Absences, Suspensions and Disciplinary Actions by Year (Descriptive Statistics)
Excused Absences
11

School Variable Grade N MeanStd.
DeviationStd.
Error Minimum Maximum
5th Grade 201 3.2 5.1 0.4 0.0 47.0
6th Grade 209 3.7 8.4 0.6 0.0 104.0
7th Grade 236 2.4 4.0 0.3 0.0 26.0
8th Grade 141 1.5 2.4 0.2 0.0 14.0
5th Grade 201 4.7 5.1 0.4 0.0 29.0
6th Grade 209 5.6 6.0 0.4 0.0 36.0
7th Grade 236 6.9 12.7 0.8 0.0 162.0
8th Grade 141 4.6 5.0 0.4 0.0 29.0
5th Grade 201 0.5 1.6 0.1 0.0 12.0
6th Grade 209 1.4 2.9 0.2 0.0 16.0
7th Grade 236 0.9 2.4 0.2 0.0 18.0
8th Grade 141 0.5 1.1 0.1 0.0 6.0
5th Grade 236 0.3 0.5 0.0 0.0 1.0
6th Grade 236 0.6 0.5 0.0 0.0 1.0
7th Grade 236 0.5 0.5 0.0 0.0 1.0
8th Grade 141 0.4 0.5 0.0 0.0 1.0
Excused Absences
Disciplinary Actions
Unexcused Absences
Out of School Suspension
Table 9. Madison County Absences, Suspensions and Disciplinary Actions by Year (Descriptive Statistics)
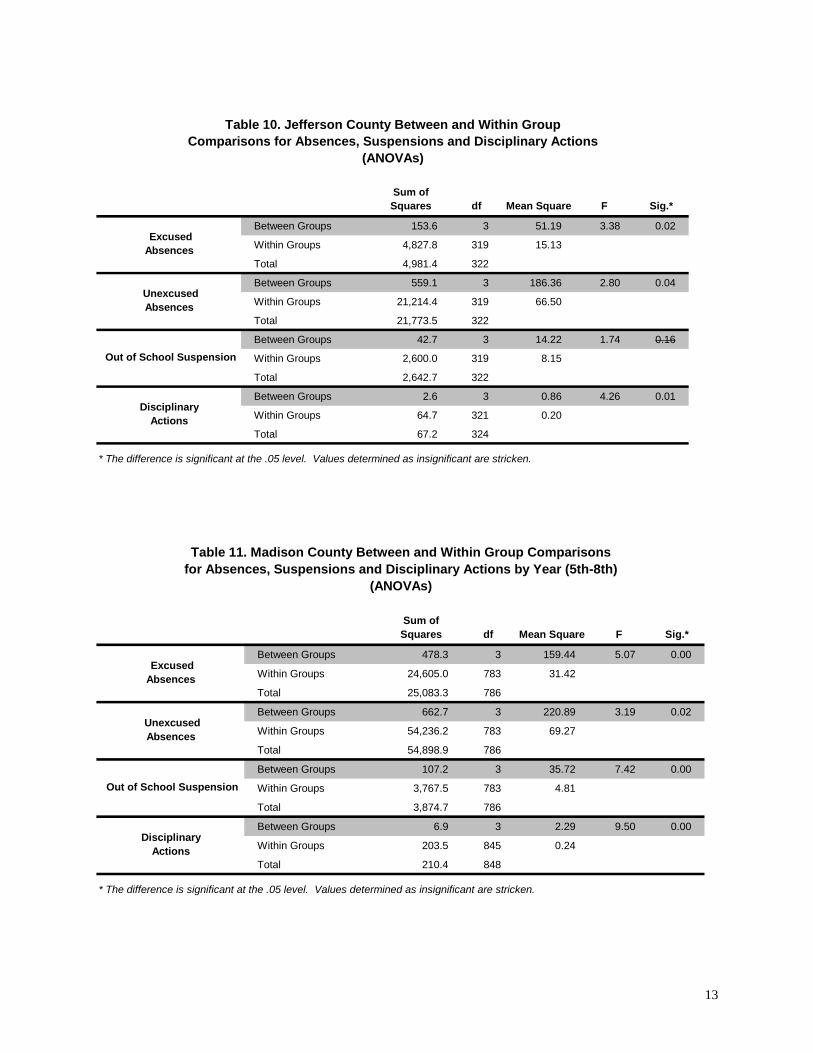
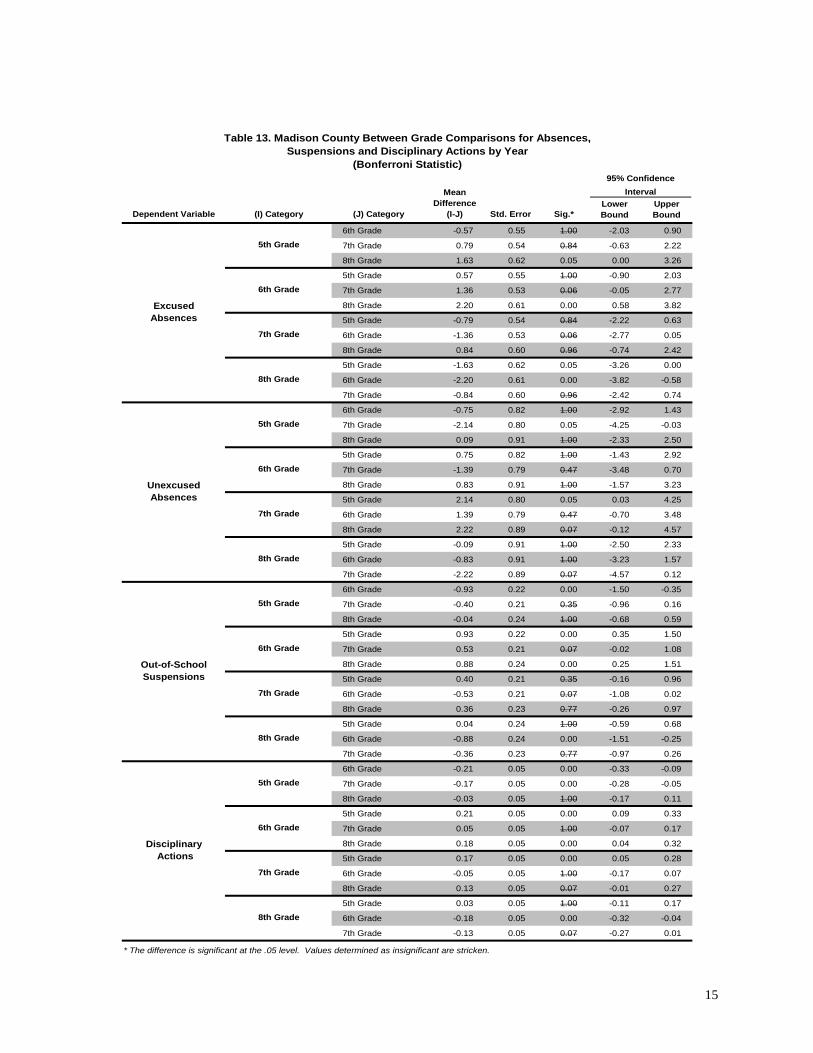
Review of ANOVAs and corresponding Bonferroni statistic of within-school differences
over the study period reveals that these changes in excused and unexcused absences were not
statistically significant at the 0.05 level for Jefferson County (treatment group). Only the
decrease in excused absences was significant for Madison County (comparison group) (see
Tables 10-13).
The average number of out-of-school suspensions did not change appreciably between 6th
and 8th grade for either the treatment or the comparison groups. The Bonferroni statistic of the
mean difference in suspensions did not reach the level of statistical significance for the Jefferson
County or Madison County cohorts.
12
Sum of Squares df Mean Square F Sig.*
Between Groups 153.6 3 51.19 3.38 0.02
Within Groups 4,827.8 319 15.13
Total 4,981.4 322
Between Groups 559.1 3 186.36 2.80 0.04
Within Groups 21,214.4 319 66.50
Total 21,773.5 322
Between Groups 42.7 3 14.22 1.74 0.16
Within Groups 2,600.0 319 8.15
Total 2,642.7 322
Between Groups 2.6 3 0.86 4.26 0.01
Within Groups 64.7 321 0.20
Total 67.2 324
* The difference is significant at the .05 level. Values determined as insignificant are stricken.
Unexcused Absences
Out of School Suspension
Disciplinary Actions
Excused Absences
Table 10. Jefferson County Between and Within Group Comparisons for Absences, Suspensions and Disciplinary Actions
(ANOVAs)
Sum of Squares df Mean Square F Sig.*
Between Groups 478.3 3 159.44 5.07 0.00
Within Groups 24,605.0 783 31.42
Total 25,083.3 786
Between Groups 662.7 3 220.89 3.19 0.02
Within Groups 54,236.2 783 69.27
Total 54,898.9 786
Between Groups 107.2 3 35.72 7.42 0.00
Within Groups 3,767.5 783 4.81
Total 3,874.7 786
Between Groups 6.9 3 2.29 9.50 0.00
Within Groups 203.5 845 0.24
Total 210.4 848
* The difference is significant at the .05 level. Values determined as insignificant are stricken.
Out of School Suspension
Table 11. Madison County Between and Within Group Comparisons for Absences, Suspensions and Disciplinary Actions by Year (5th-8th)
(ANOVAs)
Disciplinary Actions
Excused Absences
Unexcused Absences
13

Lower Bound
Upper Bound
6th Grade 0.12 0.58 1.00 -1.41 1.65
7th Grade 1.00 0.58 0.50 -0.53 2.53
8th Grade 1.91 0.68 0.03 0.09 3.72
5th Grade -0.12 0.58 1.00 -1.65 1.41
7th Grade 0.88 0.58 0.77 -0.65 2.41
8th Grade 1.79 0.68 0.06 -0.03 3.60
5th Grade -1.00 0.58 0.50 -2.53 0.53
6th Grade -0.88 0.58 0.77 -2.41 0.65
8th Grade 0.91 0.68 1.00 -0.91 2.72
5th Grade -1.91 0.68 0.03 -3.72 -0.09
6th Grade -1.79 0.68 0.06 -3.60 0.03
7th Grade -0.91 0.68 1.00 -2.72 0.91
6th Grade -2.92 1.21 0.10 -6.13 0.29
7th Grade -2.40 1.21 0.29 -5.61 0.81
8th Grade -0.11 1.44 1.00 -3.92 3.70
5th Grade 2.92 1.21 0.10 -0.29 6.13
7th Grade 0.53 1.21 1.00 -2.68 3.74
8th Grade 2.82 1.44 0.30 -0.99 6.63
5th Grade 2.40 1.21 0.29 -0.81 5.61
6th Grade -0.53 1.21 1.00 -3.74 2.68
8th Grade 2.29 1.44 0.67 -1.52 6.10
5th Grade 0.11 1.44 1.00 -3.70 3.92
6th Grade -2.82 1.44 0.30 -6.63 0.99
7th Grade -2.29 1.44 0.67 -6.10 1.52
6th Grade -0.69 0.42 0.62 -1.82 0.43
7th Grade -0.80 0.42 0.35 -1.93 0.32
8th Grade -0.94 0.50 0.37 -2.27 0.39
5th Grade 0.69 0.42 0.62 -0.43 1.82
7th Grade -0.11 0.42 1.00 -1.23 1.01
8th Grade -0.25 0.50 1.00 -1.58 1.09
5th Grade 0.80 0.42 0.35 -0.32 1.93
6th Grade 0.11 0.42 1.00 -1.01 1.23
8th Grade -0.14 0.50 1.00 -1.47 1.20
5th Grade 0.94 0.50 0.37 -0.39 2.27
6th Grade 0.25 0.50 1.00 -1.09 1.58
7th Grade 0.14 0.50 1.00 -1.20 1.47
6th Grade -0.08 0.07 1.00 -0.25 0.10
7th Grade 0.05 0.07 1.00 -0.12 0.23
8th Grade -0.21 0.08 0.05 -0.42 0.00
5th Grade 0.08 0.07 1.00 -0.10 0.25
7th Grade 0.13 0.07 0.29 -0.04 0.31
8th Grade -0.13 0.08 0.55 -0.34 0.08
5th Grade -0.05 0.07 1.00 -0.23 0.12
6th Grade -0.13 0.07 0.29 -0.31 0.04
8th Grade -0.26 0.08 0.00 -0.47 -0.06
5th Grade 0.21 0.08 0.05 0.00 0.42
6th Grade 0.13 0.08 0.55 -0.08 0.34
7th Grade 0.26 0.08 0.00 0.06 0.47
8th Grade
Disciplinary Actions
5th Grade
6th Grade
7th Grade
8th Grade
Table 12. Jefferson County Between Grade Comparisons for Absences, Suspensions and Disciplinary Actions by Year
(Bonferroni Statistic)
Dependent Variable (I) Category (J) Category
Mean Difference
(I-J)
5th Grade
5th Grade
6th Grade
7th Grade
8th Grade
Excused Absences
Unexcused Absences
Std. Error Sig.*
5th Grade
6th Grade
7th Grade
95% Confidence Interval
* The difference is significant at the .05 level. Values determined as insignificant are stricken.
Out-of-School Suspensions
6th Grade
7th Grade
8th Grade
14
Lower Bound
Upper Bound
6th Grade -0.57 0.55 1.00 -2.03 0.90
7th Grade 0.79 0.54 0.84 -0.63 2.22
8th Grade 1.63 0.62 0.05 0.00 3.26
5th Grade 0.57 0.55 1.00 -0.90 2.03
7th Grade 1.36 0.53 0.06 -0.05 2.77
8th Grade 2.20 0.61 0.00 0.58 3.82
5th Grade -0.79 0.54 0.84 -2.22 0.63
6th Grade -1.36 0.53 0.06 -2.77 0.05
8th Grade 0.84 0.60 0.96 -0.74 2.42
5th Grade -1.63 0.62 0.05 -3.26 0.00
6th Grade -2.20 0.61 0.00 -3.82 -0.58
7th Grade -0.84 0.60 0.96 -2.42 0.74
6th Grade -0.75 0.82 1.00 -2.92 1.43
7th Grade -2.14 0.80 0.05 -4.25 -0.03
8th Grade 0.09 0.91 1.00 -2.33 2.50
5th Grade 0.75 0.82 1.00 -1.43 2.92
7th Grade -1.39 0.79 0.47 -3.48 0.70
8th Grade 0.83 0.91 1.00 -1.57 3.23
5th Grade 2.14 0.80 0.05 0.03 4.25
6th Grade 1.39 0.79 0.47 -0.70 3.48
8th Grade 2.22 0.89 0.07 -0.12 4.57
5th Grade -0.09 0.91 1.00 -2.50 2.33
6th Grade -0.83 0.91 1.00 -3.23 1.57
7th Grade -2.22 0.89 0.07 -4.57 0.12
6th Grade -0.93 0.22 0.00 -1.50 -0.35
7th Grade -0.40 0.21 0.35 -0.96 0.16
8th Grade -0.04 0.24 1.00 -0.68 0.59
5th Grade 0.93 0.22 0.00 0.35 1.50
7th Grade 0.53 0.21 0.07 -0.02 1.08
8th Grade 0.88 0.24 0.00 0.25 1.51
5th Grade 0.40 0.21 0.35 -0.16 0.96
6th Grade -0.53 0.21 0.07 -1.08 0.02
8th Grade 0.36 0.23 0.77 -0.26 0.97
5th Grade 0.04 0.24 1.00 -0.59 0.68
6th Grade -0.88 0.24 0.00 -1.51 -0.25
7th Grade -0.36 0.23 0.77 -0.97 0.26
6th Grade -0.21 0.05 0.00 -0.33 -0.09
7th Grade -0.17 0.05 0.00 -0.28 -0.05
8th Grade -0.03 0.05 1.00 -0.17 0.11
5th Grade 0.21 0.05 0.00 0.09 0.33
7th Grade 0.05 0.05 1.00 -0.07 0.17
8th Grade 0.18 0.05 0.00 0.04 0.32
5th Grade 0.17 0.05 0.00 0.05 0.28
6th Grade -0.05 0.05 1.00 -0.17 0.07
8th Grade 0.13 0.05 0.07 -0.01 0.27
5th Grade 0.03 0.05 1.00 -0.11 0.17
6th Grade -0.18 0.05 0.00 -0.32 -0.04
7th Grade -0.13 0.05 0.07 -0.27 0.01
* The difference is significant at the .05 level. Values determined as insignificant are stricken.
Out-of-School Suspensions
6th Grade
7th Grade
8th Grade
Excused Absences
Unexcused Absences
5th Grade
5th Grade
6th Grade
7th Grade
8th Grade
5th Grade
95% Confidence Interval
Table 13. Madison County Between Grade Comparisons for Absences, Suspensions and Disciplinary Actions by Year
(Bonferroni Statistic)
Dependent Variable (I) Category (J) Category
Mean Difference
(I-J) Std. Error Sig.*
6th Grade
7th Grade
8th Grade
Disciplinary Actions
5th Grade
6th Grade
7th Grade
8th Grade
15
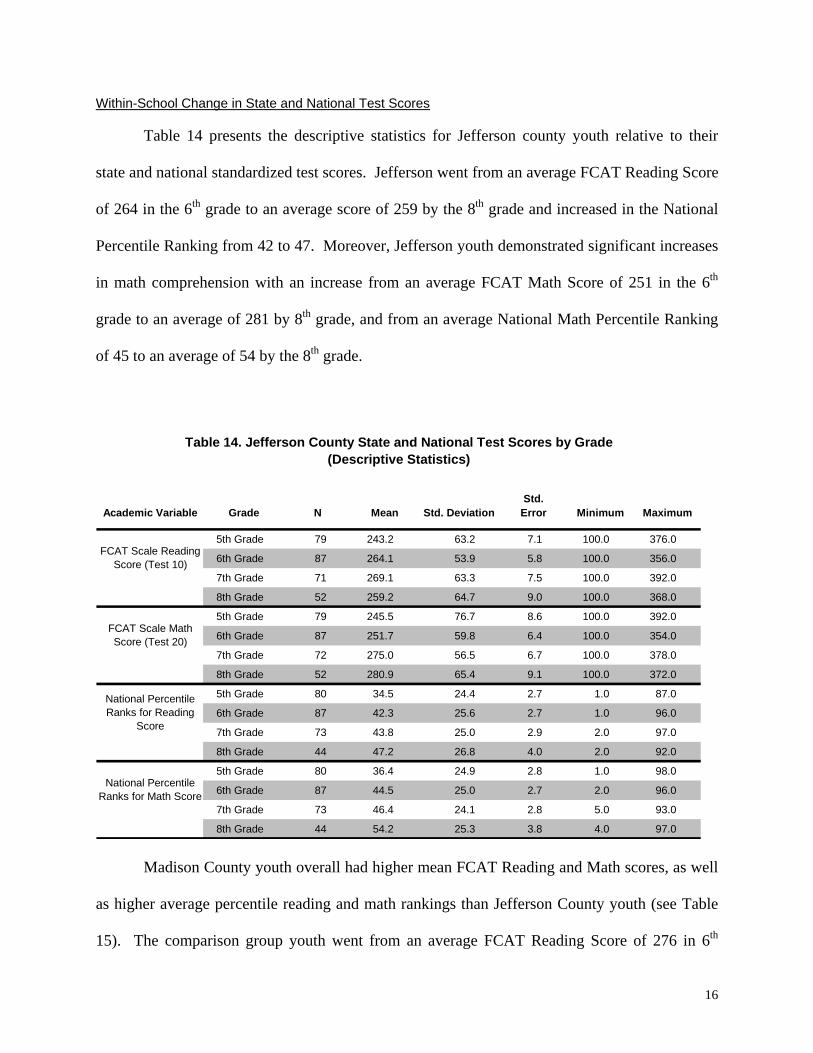
Within-School Change in State and National Test Scores
Table 14 presents the descriptive statistics for Jefferson county youth relative to their
state and national standardized test scores. Jefferson went from an average FCAT Reading Score
of 264 in the 6th grade to an average score of 259 by the 8th grade and increased in the National
Percentile Ranking from 42 to 47. Moreover, Jefferson youth demonstrated significant increases
in math comprehension with an increase from an average FCAT Math Score of 251 in the 6th
grade to an average of 281 by 8th grade, and from an average National Math Percentile Ranking
of 45 to an average of 54 by the 8th grade.
Academic Variable Grade N Mean Std. DeviationStd.
Error Minimum Maximum
5th Grade 79 243.2 63.2 7.1 100.0 376.0
6th Grade 87 264.1 53.9 5.8 100.0 356.0
7th Grade 71 269.1 63.3 7.5 100.0 392.0
8th Grade 52 259.2 64.7 9.0 100.0 368.0
5th Grade 79 245.5 76.7 8.6 100.0 392.0
6th Grade 87 251.7 59.8 6.4 100.0 354.0
7th Grade 72 275.0 56.5 6.7 100.0 378.0
8th Grade 52 280.9 65.4 9.1 100.0 372.0
5th Grade 80 34.5 24.4 2.7 1.0 87.0
6th Grade 87 42.3 25.6 2.7 1.0 96.0
7th Grade 73 43.8 25.0 2.9 2.0 97.0
8th Grade 44 47.2 26.8 4.0 2.0 92.0
5th Grade 80 36.4 24.9 2.8 1.0 98.0
6th Grade 87 44.5 25.0 2.7 2.0 96.0
7th Grade 73 46.4 24.1 2.8 5.0 93.0
8th Grade 44 54.2 25.3 3.8 4.0 97.0
Table 14. Jefferson County State and National Test Scores by Grade(Descriptive Statistics)
National Percentile Ranks for Math Score
FCAT Scale Reading Score (Test 10)
FCAT Scale Math Score (Test 20)
National Percentile Ranks for Reading
Score
Madison County youth overall had higher mean FCAT Reading and Math scores, as well
as higher average percentile reading and math rankings than Jefferson County youth (see Table
15). The comparison group youth went from an average FCAT Reading Score of 276 in 6th
16
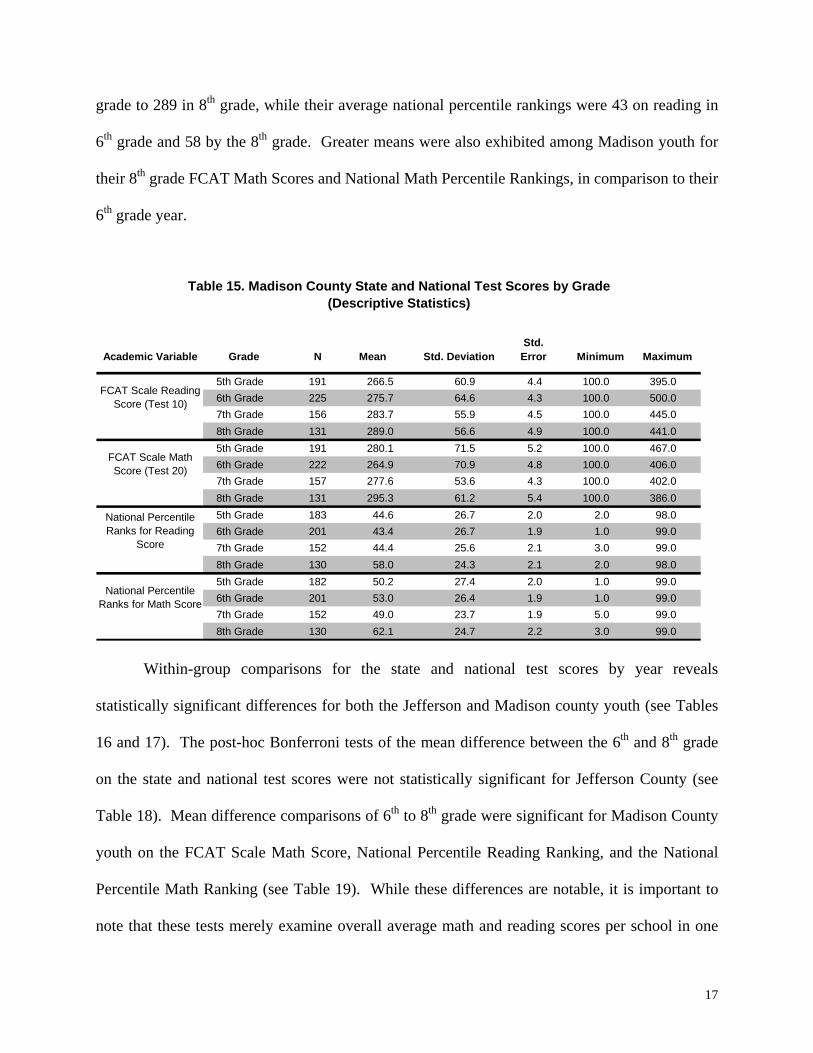
grade to 289 in 8th grade, while their average national percentile rankings were 43 on reading in
6th grade and 58 by the 8th grade. Greater means were also exhibited among Madison youth for
their 8th grade FCAT Math Scores and National Math Percentile Rankings, in comparison to their
6th grade year.
Academic Variable Grade N Mean Std. DeviationStd.
Error Minimum Maximum
5th Grade 191 266.5 60.9 4.4 100.0 395.06th Grade 225 275.7 64.6 4.3 100.0 500.07th Grade 156 283.7 55.9 4.5 100.0 445.08th Grade 131 289.0 56.6 4.9 100.0 441.05th Grade 191 280.1 71.5 5.2 100.0 467.06th Grade 222 264.9 70.9 4.8 100.0 406.07th Grade 157 277.6 53.6 4.3 100.0 402.08th Grade 131 295.3 61.2 5.4 100.0 386.05th Grade 183 44.6 26.7 2.0 2.0 98.06th Grade 201 43.4 26.7 1.9 1.0 99.07th Grade 152 44.4 25.6 2.1 3.0 99.08th Grade 130 58.0 24.3 2.1 2.0 98.05th Grade 182 50.2 27.4 2.0 1.0 99.06th Grade 201 53.0 26.4 1.9 1.0 99.07th Grade 152 49.0 23.7 1.9 5.0 99.08th Grade 130 62.1 24.7 2.2 3.0 99.0
National Percentile Ranks for Reading
Score
National Percentile Ranks for Math Score
FCAT Scale Reading Score (Test 10)
FCAT Scale Math Score (Test 20)
Table 15. Madison County State and National Test Scores by Grade(Descriptive Statistics)
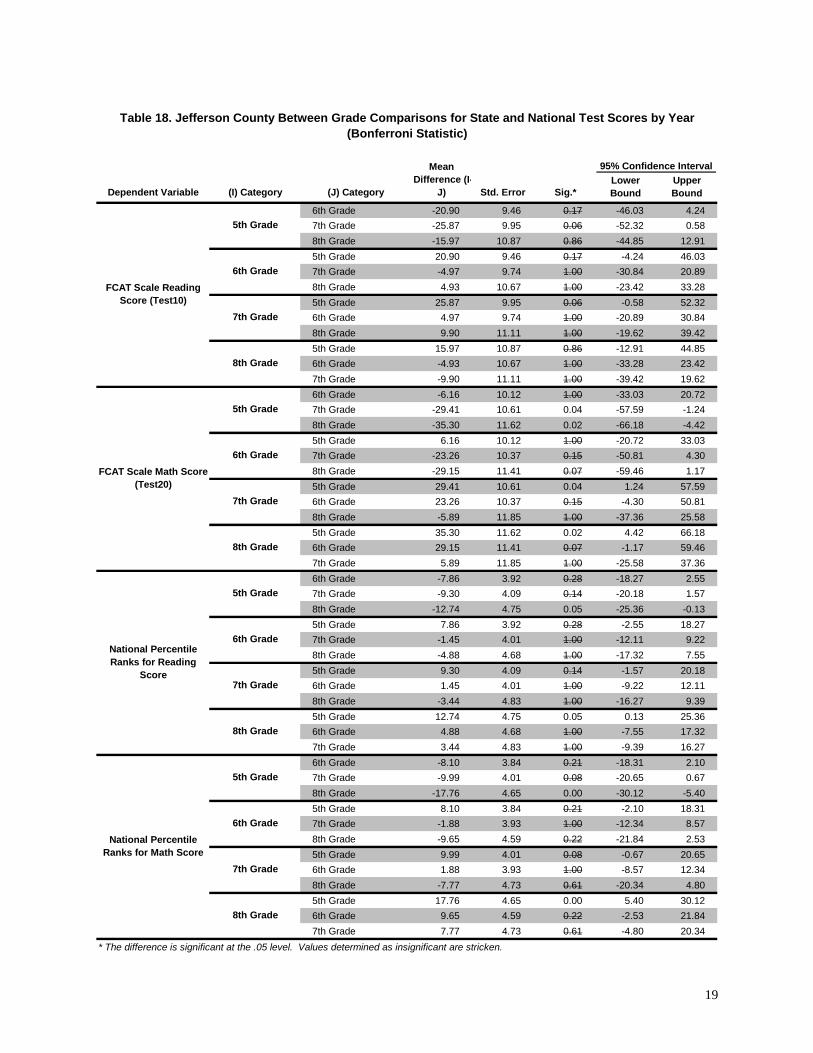
Within-group comparisons for the state and national test scores by year reveals
statistically significant differences for both the Jefferson and Madison county youth (see Tables
16 and 17). The post-hoc Bonferroni tests of the mean difference between the 6th and 8th grade
on the state and national test scores were not statistically significant for Jefferson County (see
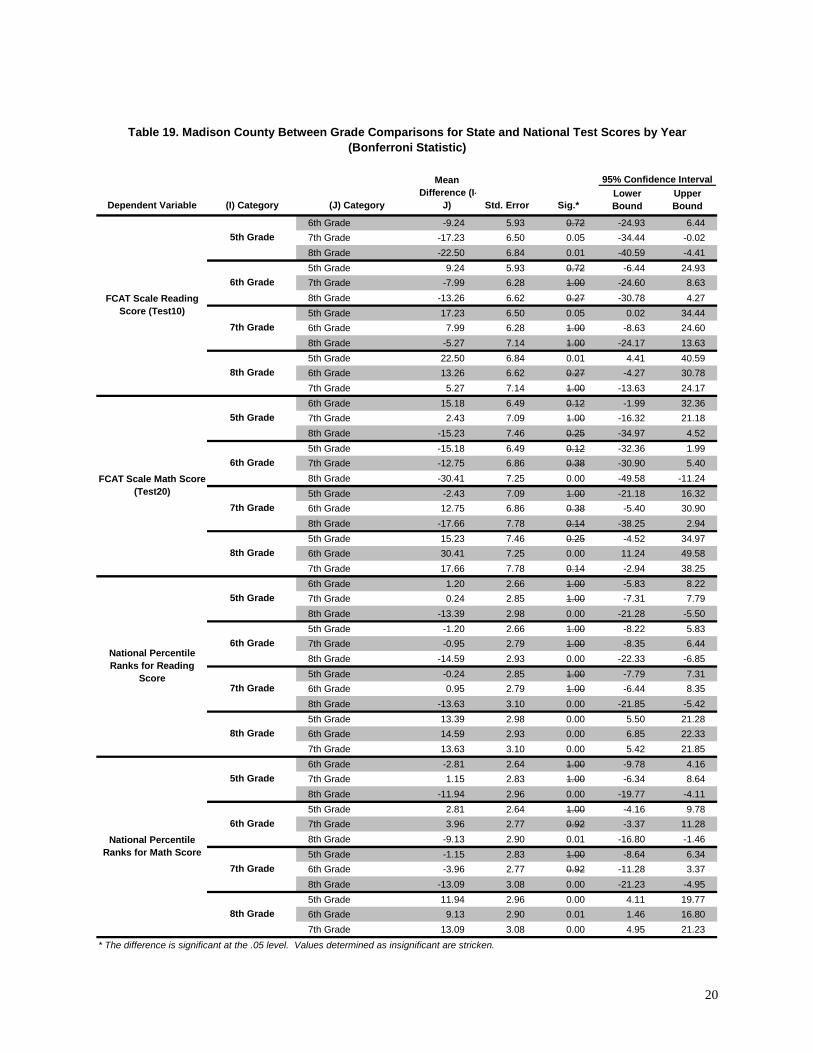
Table 18). Mean difference comparisons of 6th to 8th grade were significant for Madison County
youth on the FCAT Scale Math Score, National Percentile Reading Ranking, and the National
Percentile Math Ranking (see Table 19). While these differences are notable, it is important to
note that these tests merely examine overall average math and reading scores per school in one
17
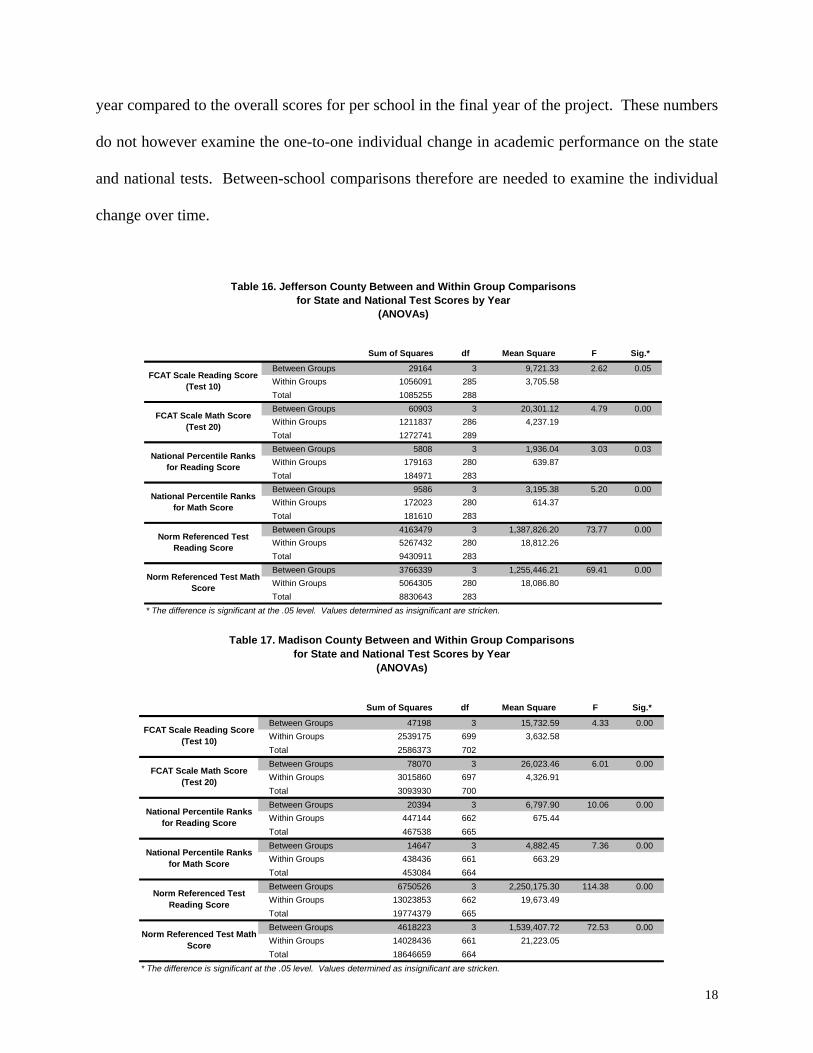
year compared to the overall scores for per school in the final year of the project. These numbers
do not however examine the one-to-one individual change in academic performance on the state
and national tests. Between-school comparisons therefore are needed to examine the individual
change over time.
Sum of Squares df Mean Square F Sig.*
Between Groups 29164 3 9,721.33 2.62 0.05Within Groups 1056091 285 3,705.58Total 1085255 288Between Groups 60903 3 20,301.12 4.79 0.00Within Groups 1211837 286 4,237.19Total 1272741 289Between Groups 5808 3 1,936.04 3.03 0.03Within Groups 179163 280 639.87Total 184971 283Between Groups 9586 3 3,195.38 5.20 0.00Within Groups 172023 280 614.37Total 181610 283Between Groups 4163479 3 1,387,826.20 73.77 0.00Within Groups 5267432 280 18,812.26Total 9430911 283Between Groups 3766339 3 1,255,446.21 69.41 0.00Within Groups 5064305 280 18,086.80Total 8830643 283
* The difference is significant at the .05 level. Values determined as insignificant are stricken.
Table 16. Jefferson County Between and Within Group Comparisons for State and National Test Scores by Year
(ANOVAs)
Norm Referenced Test Reading Score
National Percentile Ranks for Reading Score
Norm Referenced Test Math Score
National Percentile Ranks for Math Score
FCAT Scale Reading Score (Test 10)
FCAT Scale Math Score (Test 20)
Sum of Squares df Mean Square F Sig.*
Between Groups 47198 3 15,732.59 4.33 0.00Within Groups 2539175 699 3,632.58Total 2586373 702Between Groups 78070 3 26,023.46 6.01 0.00Within Groups 3015860 697 4,326.91Total 3093930 700Between Groups 20394 3 6,797.90 10.06 0.00Within Groups 447144 662 675.44Total 467538 665Between Groups 14647 3 4,882.45 7.36 0.00Within Groups 438436 661 663.29Total 453084 664Between Groups 6750526 3 2,250,175.30 114.38 0.00Within Groups 13023853 662 19,673.49Total 19774379 665Between Groups 4618223 3 1,539,407.72 72.53 0.00Within Groups 14028436 661 21,223.05Total 18646659 664
Table 17. Madison County Between and Within Group Comparisons for State and National Test Scores by Year
(ANOVAs)
Norm Referenced Test Reading Score
National Percentile Ranks for Reading Score
Norm Referenced Test Math Score
National Percentile Ranks for Math Score
FCAT Scale Reading Score (Test 10)
FCAT Scale Math Score (Test 20)
* The difference is significant at the .05 level. Values determined as insignificant are stricken.
18
Lower Bound
Upper Bound
6th Grade -20.90 9.46 0.17 -46.03 4.247th Grade -25.87 9.95 0.06 -52.32 0.588th Grade -15.97 10.87 0.86 -44.85 12.915th Grade 20.90 9.46 0.17 -4.24 46.037th Grade -4.97 9.74 1.00 -30.84 20.898th Grade 4.93 10.67 1.00 -23.42 33.285th Grade 25.87 9.95 0.06 -0.58 52.326th Grade 4.97 9.74 1.00 -20.89 30.848th Grade 9.90 11.11 1.00 -19.62 39.425th Grade 15.97 10.87 0.86 -12.91 44.856th Grade -4.93 10.67 1.00 -33.28 23.427th Grade -9.90 11.11 1.00 -39.42 19.626th Grade -6.16 10.12 1.00 -33.03 20.727th Grade -29.41 10.61 0.04 -57.59 -1.248th Grade -35.30 11.62 0.02 -66.18 -4.425th Grade 6.16 10.12 1.00 -20.72 33.037th Grade -23.26 10.37 0.15 -50.81 4.308th Grade -29.15 11.41 0.07 -59.46 1.175th Grade 29.41 10.61 0.04 1.24 57.596th Grade 23.26 10.37 0.15 -4.30 50.818th Grade -5.89 11.85 1.00 -37.36 25.585th Grade 35.30 11.62 0.02 4.42 66.186th Grade 29.15 11.41 0.07 -1.17 59.467th Grade 5.89 11.85 1.00 -25.58 37.366th Grade -7.86 3.92 0.28 -18.27 2.557th Grade -9.30 4.09 0.14 -20.18 1.578th Grade -12.74 4.75 0.05 -25.36 -0.135th Grade 7.86 3.92 0.28 -2.55 18.277th Grade -1.45 4.01 1.00 -12.11 9.228th Grade -4.88 4.68 1.00 -17.32 7.555th Grade 9.30 4.09 0.14 -1.57 20.186th Grade 1.45 4.01 1.00 -9.22 12.118th Grade -3.44 4.83 1.00 -16.27 9.395th Grade 12.74 4.75 0.05 0.13 25.366th Grade 4.88 4.68 1.00 -7.55 17.327th Grade 3.44 4.83 1.00 -9.39 16.276th Grade -8.10 3.84 0.21 -18.31 2.107th Grade -9.99 4.01 0.08 -20.65 0.678th Grade -17.76 4.65 0.00 -30.12 -5.405th Grade 8.10 3.84 0.21 -2.10 18.317th Grade -1.88 3.93 1.00 -12.34 8.578th Grade -9.65 4.59 0.22 -21.84 2.535th Grade 9.99 4.01 0.08 -0.67 20.656th Grade 1.88 3.93 1.00 -8.57 12.348th Grade -7.77 4.73 0.61 -20.34 4.805th Grade 17.76 4.65 0.00 5.40 30.126th Grade 9.65 4.59 0.22 -2.53 21.847th Grade 7.77 4.73 0.61 -4.80 20.34
National Percentile Ranks for Math Score
5th Grade
6th Grade
7th Grade
8th Grade
National Percentile Ranks for Reading
Score
5th Grade
6th Grade
7th Grade
8th Grade
FCAT Scale Math Score (Test20)
5th Grade
6th Grade
7th Grade
8th Grade
FCAT Scale Reading Score (Test10)
6th Grade
7th Grade
8th Grade
* The difference is significant at the .05 level. Values determined as insignificant are stricken.
Table 18. Jefferson County Between Grade Comparisons for State and National Test Scores by Year (Bonferroni Statistic)
Dependent Variable (I) Category (J) Category
Mean Difference (I-
J) Std. Error Sig.*
95% Confidence Interval
5th Grade
19
Lower Bound
Upper Bound
6th Grade -9.24 5.93 0.72 -24.93 6.447th Grade -17.23 6.50 0.05 -34.44 -0.028th Grade -22.50 6.84 0.01 -40.59 -4.415th Grade 9.24 5.93 0.72 -6.44 24.937th Grade -7.99 6.28 1.00 -24.60 8.638th Grade -13.26 6.62 0.27 -30.78 4.275th Grade 17.23 6.50 0.05 0.02 34.446th Grade 7.99 6.28 1.00 -8.63 24.608th Grade -5.27 7.14 1.00 -24.17 13.635th Grade 22.50 6.84 0.01 4.41 40.596th Grade 13.26 6.62 0.27 -4.27 30.787th Grade 5.27 7.14 1.00 -13.63 24.176th Grade 15.18 6.49 0.12 -1.99 32.367th Grade 2.43 7.09 1.00 -16.32 21.188th Grade -15.23 7.46 0.25 -34.97 4.525th Grade -15.18 6.49 0.12 -32.36 1.997th Grade -12.75 6.86 0.38 -30.90 5.408th Grade -30.41 7.25 0.00 -49.58 -11.245th Grade -2.43 7.09 1.00 -21.18 16.326th Grade 12.75 6.86 0.38 -5.40 30.908th Grade -17.66 7.78 0.14 -38.25 2.945th Grade 15.23 7.46 0.25 -4.52 34.976th Grade 30.41 7.25 0.00 11.24 49.587th Grade 17.66 7.78 0.14 -2.94 38.256th Grade 1.20 2.66 1.00 -5.83 8.227th Grade 0.24 2.85 1.00 -7.31 7.798th Grade -13.39 2.98 0.00 -21.28 -5.505th Grade -1.20 2.66 1.00 -8.22 5.837th Grade -0.95 2.79 1.00 -8.35 6.448th Grade -14.59 2.93 0.00 -22.33 -6.855th Grade -0.24 2.85 1.00 -7.79 7.316th Grade 0.95 2.79 1.00 -6.44 8.358th Grade -13.63 3.10 0.00 -21.85 -5.425th Grade 13.39 2.98 0.00 5.50 21.286th Grade 14.59 2.93 0.00 6.85 22.337th Grade 13.63 3.10 0.00 5.42 21.856th Grade -2.81 2.64 1.00 -9.78 4.167th Grade 1.15 2.83 1.00 -6.34 8.648th Grade -11.94 2.96 0.00 -19.77 -4.115th Grade 2.81 2.64 1.00 -4.16 9.787th Grade 3.96 2.77 0.92 -3.37 11.288th Grade -9.13 2.90 0.01 -16.80 -1.465th Grade -1.15 2.83 1.00 -8.64 6.346th Grade -3.96 2.77 0.92 -11.28 3.378th Grade -13.09 3.08 0.00 -21.23 -4.955th Grade 11.94 2.96 0.00 4.11 19.776th Grade 9.13 2.90 0.01 1.46 16.807th Grade 13.09 3.08 0.00 4.95 21.23
* The difference is significant at the .05 level. Values determined as insignificant are stricken.
Table 19. Madison County Between Grade Comparisons for State and National Test Scores by Year (Bonferroni Statistic)
Dependent Variable (I) Category (J) Category
Mean Difference (I-
J) Std. Error Sig.*
95% Confidence Interval
5th Grade
FCAT Scale Reading Score (Test10)
6th Grade
7th Grade
8th Grade
FCAT Scale Math Score (Test20)
5th Grade
6th Grade
7th Grade
8th Grade
National Percentile Ranks for Reading
Score
5th Grade
6th Grade
7th Grade
8th Grade
National Percentile Ranks for Math Score
5th Grade
6th Grade
7th Grade
8th Grade
20

Change in Academic Achievement Between Schools
Comparisons in academic achievement between Jefferson and Madison over the period
from 6th to 8th grade exhibit that Jefferson outperformed Madison youth relative to reading and
math grade changes, as well as individual change in FCAT Reading scores, FCAT Math scores,
Norm Reference Reading Test scores, and Norm Reference Math Test scores (see Table 20
below).
School Sample N MeanStd.
DeviationStd. Error
Mean
Jefferson 51 -5.7 9.9 1.4
Madison 107 1.3 8.4 0.8
Jefferson 33 3.8 8.8 1.5
Madison 79 -2.5 8.8 1.0
Jefferson 51 3.5 9.8 1.4
Madison 96 3.3 6.9 0.
Jefferson 50 4.8 39.1 5.5
Madison 131 -2.1 39.7 3.5
Jefferson 50 36.2 33.8 4.8
Madison 131 15.6 33.6 2.9
Jefferson 42 224.3 149.9 23.1
Madison 129 192.9 163.3 14.4
Jefferson 42 242.5 146.9 22.7
Madison 129 142.8 162.5 14.3
Jefferson 50 -1.7 3.2 0.5
Madison 140 -1.9 4.5 0.4
Jefferson 50 -3.0 6.4 0.9
Madison 140 -0.4 5.9 0.5
Jefferson 50 0.2 3.2 0.5
Madison 140 -0.3 2.4 0.2
Jefferson 52 0.1 0.5 0.1
Madison 141 -0.1 0.6 0.0
FCAT Scale Math Score
Norm Reference Test Reading Score
Table 20. Jefferson and Madison County Group Statistics for the Average Individual Change in Scores from 6th Grade to 8th Grade
Norm Reference Test Math Score
FCAT Scale Reading Score
Language Arts
Reading
Math
Disciplinary Actions
Excused Absences
Unexcused Absences
Out of School Suspensions
7
21
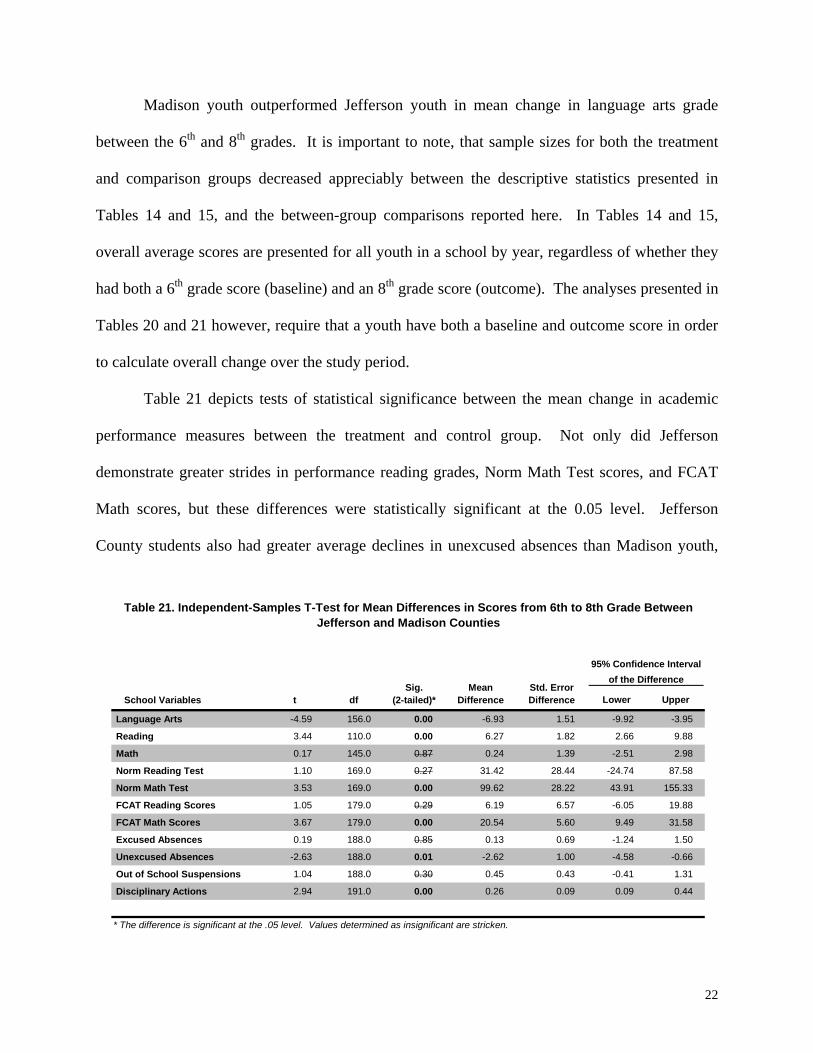
Madison youth outperformed Jefferson youth in mean change in language arts grade
between the 6th and 8th grades. It is important to note, that sample sizes for both the treatment
and comparison groups decreased appreciably between the descriptive statistics presented in
Tables 14 and 15, and the between-group comparisons reported here. In Tables 14 and 15,
overall average scores are presented for all youth in a school by year, regardless of whether they
had both a 6th grade score (baseline) and an 8th grade score (outcome). The analyses presented in
Tables 20 and 21 however, require that a youth have both a baseline and outcome score in order
to calculate overall change over the study period.
Table 21 depicts tests of statistical significance between the mean change in academic
performance measures between the treatment and control group. Not only did Jefferson
demonstrate greater strides in performance reading grades, Norm Math Test scores, and FCAT
Math scores, but these differences were statistically significant at the 0.05 level. Jefferson
County students also had greater average declines in unexcused absences than Madison youth,
Lower Upper
Language Arts -4.59 156.0 0.00 -6.93 1.51 -9.92 -3.95
Reading 3.44 110.0 0.00 6.27 1.82 2.66 9.88
Math 0.17 145.0 0.87 0.24 1.39 -2.51 2.98
Norm Reading Test 1.10 169.0 0.27 31.42 28.44 -24.74 87.58
Norm Math Test 3.53 169.0 0.00 99.62 28.22 43.91 155.33
FCAT Reading Scores 1.05 179.0 0.29 6.19 6.57 -6.05 19.88
FCAT Math Scores 3.67 179.0 0.00 20.54 5.60 9.49 31.58
Excused Absences 0.19 188.0 0.85 0.13 0.69 -1.24 1.50
Unexcused Absences -2.63 188.0 0.01 -2.62 1.00 -4.58 -0.66
Out of School Suspensions 1.04 188.0 0.30 0.45 0.43 -0.41 1.31
Disciplinary Actions 2.94 191.0 0.00 0.26 0.09 0.09 0.44
* The difference is significant at the .05 level. Values determined as insignificant are stricken.
Table 21. Independent-Samples T-Test for Mean Differences in Scores from 6th to 8th Grade Between Jefferson and Madison Counties
95% Confidence Interval of the Difference
t dfSig.
(2-tailed)*Mean
DifferenceStd. Error Difference School Variables
22
23
which likewise was statistically significant. Madison students significantly outperformed
Jefferson youth only in terms of language arts grades and disciplinary actions.
Conclusion
The current report provides final overall baseline data and outcome measurement of the
Arts in Education treatment introduced at the Howard Middle School in Jefferson County over
the period from the 6th to 8th grade school years. The results presented here should be interpreted
with caution given missing school performance data for youth in the 8th grade in both the
treatment and comparison cohorts. In addition, given the correspondingly reduced sample sizes,
sophisticated multivariate analyses were not possible. Despite these qualifiers, the treatment
group did exhibit improvements in reading grades, National Percentile Ranks for Math and
improvements in FCAT Reading scores between the students' 6th grade and 8th grade years.
Furthermore, students attending the treatment school outperformed the comparison group
students on average change for unexcused absences.
The data are inconsistent in demonstrating support for the hypothesis that the Arts in
Education curriculum would improve language arts, math, reading and writing skills. The data
examined provide some support for the impact of the Arts in Education on math skills as
measured by national standardized tests and the state FCAT assessments. Only academic grades
in reading, however, support the study hypotheses. Whether this is indicative of a lack of
support or instead reflects subjective problems in assessments of academic grade allocation is
debatable. The overall relatively large and significant differences between the treatment and
comparison groups on state and national math test scores, does suggest that perhaps the treatment
had an impact on academic performance at the Jefferson County Howard Middle School.