Embed Size (px)
Citation preview

A STUDY ON MARKET POTENTIAL
FOR STAINLESS STEEL IN SALEM REGION
ON BEHALF OF SALEM STEEL PLANT, SAIL
PROJECT REPORT
Submitted by
ARUNKUMAR.M
Register No: 088001608005
In partial fulfillment for the award of the degree
of
MASTER OF BUSINESS ADMINISTRATION
MAHENDRA ENGINEERING COLLEGE
NAMAKKAL
MAY, 2010

MAHENDRA ENGINEERING COLLEGE
NAMAKKAL
Department of Management Studies
PROJECT WORK
MAY, 2010
This is to certify that the project entitled
A STUDY ON MARKET POTENTIAL
FOR STAINLESS STEEL IN SALEM REGION
ON BEHALF OF SALEM STEEL PLANT, SAIL
is the bonafide record of project work done by
ARUNKUMAR.M
Register No : 088001608005
of MASTER OF BUSINESS ADMINISTRATION during the year 2009-2010.
------------------------ ---------- -------------------------------------- Project Guide Head of the Department
Submitted for the Project Viva-Voce examination held on ………………………………..
……………………………… ....……………………………..(Signature of Internal (Signature of ExternalExaminer with date) Examiner with date)
DECLARATION
I affirm that the project work titled A STUDY ON MARKET POTENTIAL FOR
STAINLESS STEEL IN SALEM REGION ON BEHALF OF SALEM STEEL PLANT,
SAIL being submitted in partial fulfillment for the award of MASTER OF BUSINESS
ADMINISTRATION is the original work carried out by me. It has not formed the part of
any other project work submitted for award of any degree or diploma, either in this or any
other University.
M.ARUNKUMAR
Reg No.088001608005
I certify that the declaration made above by the candidate is true
N.SUGANTHI MBA., M.Phil. (Ph.D),
Lecturer

ACKNOWLEDGEMENT
I express my deepest sense of gratitude to the God Almighty for the abundant blessing
without which the study would have never been light of the day.
I here by acknowledge my sincere gratitude to the Mahendra Engineering College and
Dr. R. SAMSON RAVINDRAN B.E., M.S., M.B.A., Ph.D(Solar Energy)., Ph.D(Bio-
Engg)., F.I.E, C.E.(India) M.I.S.T.E., Principal, Mahendra Engineering College and the
Management for giving me an opportunity to undergo M.B.A Degree course and to undertake
this Project work.
I wish to express my deep sense of gratitude to our Dr. K. RAJKUMAR M.com.,
MBA., Ph.D., (M.sc Psycology) Director/HOD, Department of Management Studies,
Mahendra Engineering College,
I owe my reverential gratitude to my faculty guide Mrs.N. SUGANTHI MBA.,
M.Phil. (Ph.D) for his valuable suggesting and constructive criticisms rendered at each stage
of the project. Under his guidance I have been available to conduct the study and complete it
successfully.
I express my thanks to Mr. R.VISWANATHAN, General Manager, and
Mr.A.PANDIARAJ Asst. General Manager, Human resources and other staff members at
SALEM STEEL PLANT,SALEM who kindly provided their helping hand for doing the
project work.
I acknowledge the immense help rendered by family and friends without whom the
effort would not have been possible.

CONTENTS
CHAPTER DESCRIPTION PAGE NO
LIST OF TABLES
LIST OF CHARTS
1 INTRODUCTION
1.1 Introduction 1
1.2 Company Profile 2
1.3 Industrial Profile 6
1.4 Product Profile 7
2 MAIN THEME OF THE STUDY
2.1 Objective of the Study 10
2.2 Scope and limitations of the Study 10
2.3 Research Methodology 11
2.4 Method of data collection 12
2.5 Review of Literature 16
3 ANALYSIS AND INTERPRETATION
3.1 Simple Percentage Analysis 19
3.2 Chi-Square Analysis 29
4 FINDINGS, SUGGESTIONS AND
CONCLUSION
4.1 Findings 47
4.2 Suggestions And Recommendations 50
4.3 Conclusion 52
APPENDIX (QUESTIONNAIRE 53
REFERENCE 59

LIST OF TABLES
TABLENO.
PARTICULARSPAGE
NO.
3.1
TYPES OF STAINLESS STEEL USED BY THE
CUSTOMER 19
3.2
GRADES OF THE STAINLESS STEEL USED BY THE
CUSTOMER 20
3.3FREQUENCY OF PURCHASING BY THE CUSTOMER 22
3.4THE MODE OF PURCHASE OF THE STAINLESS
STEEL CUSTOMER23
3.5VARIOUS BRANDS OF STAINLESS STEEL USED BY THE CUSTOMERS
25
3.6
DIFFERENT DISCOUNT SCHEMES AND CREDIT
PERIODS GIVEN BY THE DIFFERENT SUPPLIERS OF
STAINLESS STEEL
26
3.7CUSTOMER ANNUAL REQUIREMENT OF STAINLESS
STEEL 28
3.8 CHI-SQUARE ANALYSIS FOR MODE OF PAYMENT 29
3.9CUSTOMERS OPINION TOWARDS THE MARKETING
ATTRIBUTES OF PATTA30
3.10CUSTOMERS OPINION TOWARDS THE MARKETING ATTRIBUTES OF JINDA
31
3.11CUSTOMERS OPINION TOWARDS THE
MARKETINGATTRIBUTES OF SSP33
3.12CUSTOMER OPINION TOWARDS THE MARKETING ATTRIBUTES OF IMPORTS
34
3.13CUSTOMER OPINION TOWARDS THE PRICE OF
EACH BRAND35
3.14CUSTOMERS OPINION TOWARDS THE QUALITY OF EACH BRAND
36
3.15CUSTOMERS OPINION ON BRAND IMAGE OF EACH
BRAND36

TABLENO.
PARTICULARSPAGE
NO.
3.16CUSTOMERS OVERALL ATTITUDES TOWARDS
EACH BRAND OF STAINLESS STEEL37
3.17CUSTOMERS PRODUCTION EXPANSION PLAN IN
FUTURE37
3.18 CUSTOMERS OPINION ON ADVERTISEMENT ABOUT STAINLESS STEEL
38
3.19 MEDIA PREFERENCE AMONG THE CUSTOMERS 38
3.20
SHOWING THE MEAN, STANDARD DEVIATION(S.D) “t” VALUE AND LEVEL OF SIGNIFICANCE ON THE QUALITY OF SSP AND OTHER BRANDS BY THE CUSTOMERS
39
3.21SHOWING THE MEAN STANDARD DEVIATION(S.D)”t” VALUE OF SIGNIFICANCE ON The SSP AND OTHER BRANDS BY THE CUSTOMERS
41
3.22CUSTOMER ATTENDING THE MODERNISATION
PROGRAMME CONDUCTION SSP43

LIST OF CHARTS
TABLENO.
PARTICULARSPAGE
NO.
3.1
TYPES OF STAINLESS STEEL USED BY THE
CUSTOMER 20
3.2
GRADES OF THE STAINLESS STEEL USED BY THE
CUSTOMER 21
3.3
THE FREQUENCY OF PURCHASING BY THE
CUSTOMERS 23
3.4THE MODE OF PURCHASE OF THE STAINLESS
STEEL CUSTOMERS24
3.5VARIOUS BRANDS OF STAINLESS STEEL USED THE CUSTOMERS
26
3.6
DIFFERENT DISCOUNT SCHEMES AND CREDIT
PERIODS GIVEN BY THE DIFFERENT SUPPLIERS OF
STAINLESS STEEL
27
3.7CUSTOMER ANNUAL REQUIREMENT OF STAINLESS
STEEL 29
3.8CUSTOMERS OPINION ON ADVERTISEMENT ABOUT
STAINLESS STEEL39
3.9 MEDIA PREFERECE AMONG THE CUSTOMERS 42
3.10
SHOWING THE MEAN, STANDARD DEVIATION (S.D) “t” VALUE AND LEVEL OF SIGNIFICANCE ON THE QUALITY OF SSP AND OTHER BRANDS BY THE CUSTOMERS
44
3.11CUSTOMER ATTENDING THE MODERNISATION
PROGRAMME CONDUCTION SSP46

ABSTRACT
“SALEM STEEL PLANT “is a one of the leading manufacturing company in the
market. The project titled “A STUDY ON MARKET POTENTIAL IN SALEM” gives us
information regarding pursuing development activities to promote use of Stainless steel in
new areas such as coinage, railway coaches, building, furniture, automobiles, etc.
A well-structured open ended & multiple choice questions & Dichotomous questions
questionnaire was performed by the Researcher. From a total of 100 customer’s, 70 Samples
were taken into consideration. Probabilistic Random Sampling Technique was applied to use
for selecting the Sample size of the respondents.
Chi-square test and simple percentage test were used to render the data collected. The
results show that most of the customer’s were satisfied. Only some of the customer’s were
dissatisfied due to some credit facilities, brands, price etc. Suitable ideas were recommended
by the researcher which also proved satisfactory for the customer’s as well as the company.

CHAPTER 1
INTRODUCTION
1.1 INTRODUCTION ABOUT THE TOPIC
Once a market has been divided into various segments, and characteristics and
motivations of customers in each market have been analyzed, the planner can then estimate
the size of the market.
The term market potential is used to refer to the expected sales of a product or service
for an entire market over a specific time period. More simply if everybody who could buy
would buy, how many units or dollar sales would occur? The answer is the market potential.
Marketers are interested in identifying not only consumer’s needs but also those market
segments that can be served profitably. For a new product, this analysis would be part of a
feasibility study, which should precede introduction of the product.
A market segment that does not have enough consumers spending enough dollaes
does not justify marketing effort, unless a firm is seeking to accomplish some non-renenue
related objective.
Market potential is a quantitative measures of a market’s capacity to consume a
product in a given time period, which is a prerequisite to assessing profitability.
Market potential can be measured in either absolute or relative terms. An absolute
measure is one that can be expressed in units or dollars, Where as a relative measures relates
one part of a market to another and is expressed as a percent are as follows:
THE SALES INDEX MEASURE OF RELATIVE POTENTIAL:
The sales index method provides a relative measure of potential for product that have
passed the introductory stage of their product life cycle. This technique is useful in answering
questions about the relative potential of various geographical market areas. use of this
approach requires familiarity with the product in terms of this stage in the life cycle,
penetration of distribution in various areas, and sales history.

The market potential of a segment can be calculated when the segment is identified
and the number of people & expenditure rate in the segment are known. This technique
produces an estimate of the absolute potential of a given market. Of course, the planner
would have to assume a constant sales rate and accurate population projections. The sales rate
would depend on the level of market development & consumer preferences for a given
product.
1.2 COMPANY PROFILE
HISTORY OF THE ORGANISATION
Steel Authority of India Limited (SAIL) is the leading steel-making company in India.
It is a fully integrated iron and steel maker, producing both basic and special steels producing
for domestic construction, engineering, power, railway, automotive and defense industries
and for sale in export markets.
Ranked amongst the top ten public sector companies in India in terms of turnover, SAIL
manufactures and sells a broad range of steel products, including hot and cold rolled sheets
and coils, galvanized sheets, electrical sheets, structural, railways, products, plates, bars and
rods, stainless steel and other alloy steels. SAIL produces iron and steel at five integrate
plants and three special steel plant, located principally in the eastern and central regions of
India and situated close to domestic sources of raw materials, including the company’s iron
ore, limestone and dolomite mines.
The company has the distinction of being India’s largest producer of iron ore and of having
the country’s second largest mines network. This gives SAIL a competitive edge in terms of
captive availability of iron ore, limestone, and dolomite which are inputs for steel making.
INDUSTRY STRUCTURE:
The Indian steel industry can be divided into two distinct producer group:
MAJOR PRODUCERS:
Also known as integrated steel producers (ISPs), this group includes large steel
producers with high levels of backward integration and capacities of over 1MT. Steel
Authority of India Limited (SAIL), Tata Steel, Rashtriya Ispat Nigam Limited(RINL),
JINDAL Vijayanager Steel Limited (JVSL), Essar Steel and Ispat Industries from this group.
SAIL, TISCO and RINL produce steel using the blast furnace / basic oxygen furnace
(BF/BOF) route that uses iron ore, coal/coke as the basic input mix for producing, finished
steel. Other major producers such as Essar Steel, Ispat Industries and JVSL use routes other
than BF/BOF for producing steel.
While Essar Steel and Ispat Industries employ electric arc furnace (EAF) route that uses
sponge iron, melting scrap or a mix of both as input, JVSL uses CORER, a revolutionary
technology for making steel using basically iron-ore and coal.
OTHER PROCEDURE:
This group consists of smaller stand-alone steel plants that include producers and
processors of steel. PROCESSORS/REROLLERS: Units producing small quantities of steel
(flat/long products) from materials procured from the market or through their own backward
integration system. Stand alone units making pig iron and sponge iron. Small producers using
scrap-sponge iron-pig iron combination produce steel ingots (for long products) using
Electric Arc Furnace (EAF) or Induction Arc Furnace (IAF) route.
The major producers are strategic in nature and account for most of the mild steel
production in the country. The group produces most of the flat steel products in the country
including Hot Rolled, Cold Rolled and Galvanized steel.
The major also produce a small proportion of Long products and other special steel
being produced in the country. Other producers account for a majority of Iona, products being
produced in the country and some of the value added flat steel products like cold rolled steel
and galvanized steel.

SAIL- THE INTEGRATED COMPANY COMPRISED THE FOLLOW
UNITS/SUBSIDARIES:
PLANTS
Bhilai steel plant. Bhilai. Madhyapradesh
Bokaro steel plant, Bhilai, Bokaro, Bihar
Durgapur steel plant, Durgapur, West Bengal
Rourkela steel plant, Rourkela, Orissa
Alloy steel plant, Durgapur. West Bengal
Salem steel plant, Salem, Tamil Nadu
UNITS
o Central marketing organization. West Bengal
o Research & Development center for Iron and Steel
o Management Training Institute, Ranchi
o Center for Engineering and Technology
o SAIL, Safety Organization
o Raw material Division, Calcutta
o SAIL Consultancy Division

o Environment Management Division, Calcutta
o Growth Division, Calcutta
o India Iron & Steel company, West Bengal
JOINT VENTURE:
SAIL has promoted joint venture in different areas ranging from power plants to e-
commerce.
NTPC SAIL POWER COMPANY PRIVATE LIMITED
A 50:50 joint venture between steel authority of India ltd.(SAIL) and National
thermal power corporation ltd. (NTPC LTD),it manages the captive power plants at Rourkela,
Durgapur, Bhilai with a combined capacity of 314 Megawatts(MW).
BOKARO POWER SUPPLY COMPANY PVT.LTD
Corporation formed in January 2002 is managing the 302-MW power generation and
1880 tones per hour steam generation facilities at Bokaro This 50:50 joint venture between
SAIL and the Damodar valley steel plant.
FUNCTION SERVICES LIMITED
A joint venture between SAIL and TATA Steel on 50:50 basis, this company
promotes e-commerce activities in Steel and related areas.
SAIL – BANSAL SERVICE CENTRAL LTD
SAIL has formed a joint venture BMW Industries Ltd. On 40:60 basis to promote a
service at Bokaro with the objective of adding Value to steel.
BHILAI JP CEMENT LTD

SAIL has also incorporated a joint venture company with M/s. Jaiprakash Associates
Ltd to setup a 2.2 MT cement plant at Bhilai.
SAIL has signed an MOU with Manganese ore India Ltd (MOIL) to setup venture
company to produce ferromanganese and silicon-manganese at Bhilai.
MANAGEMENT:
OWNERSHIP AND MANAGEMENT:
The Government of India owns about 86% of SAIL equity and retains voting control
of the company .However, SAIL, by virtue of its Narrate status enjoys significant operational
and financial autonomy.
MISSION:
Sustained growth through internal generation of resource is the hallmark of corporate
mission of SAIL.
VISION:
To be the market leader and prosper in business through satisfaction of customers needs
by continued improvement in quality, cost and delivery of products and services.
1.3 INDUSTRIAL PROFILE
1.3.1 INTORDUCTION ABOUT INDIAN STEEL INDUSTRY
If we there to pause for a moment to think about the growth of human civilization, we
would find that the pace of social and economic growth has been closely linked to the
proficiency with which people have been able to use and shape materials. Steel is one such
material that has played an important role in the development of mankind in the last century.
Today, it is difficult imagine a world without steel. Steel has become vital to our everyday
life.
It is the quality of our life that each of us enjoys today, helping to shelter us, to feed us
and facilitate both our working day and leisure activities. We depend on steel for almost
everything from our houses, buildings, the cars we drive, roads, bridges, agricultural
equipment, machines, the list is endless.
Steel is a versatile, constantly 7 developing material that underpins all manufacturing
activity. Even if a product is not made entirely from steel, it will undoubtedly have steel as a
component at some point in the manufacturing process. There are currently more than 3500
different grades of steel with many different properties.—physical, chemical, environmental,
75% of which have been developed in the last 20 years. Steel is also an environment friendly
material and has the distinction of being the most recycled material in the world today.
Today, consumption of steel is also regarded as an indicator of development of nation. Per
capita steel consumption is now universally accepted as an index of economic development
of nation. Steel has established itself as the backbone of any economy.
1.4 PRODUCT PROFILE
1.4.1 PRODUCT- MIX, PROCESS, EQUIPMENT AND
INFRASTRUCTURE OF HOT ROLLING MIX:
HOT ROLLING STECKEL MILL
The Hot Rolling Mill complex consists of a slab yard, a Walking beam Reheating
Furnace, a Roughing Mill, a single stand 4 high Reversible Steckel Mill, a down coiler and a
coil yard for making, cooling, dispatch. The major equipments expecting for the walking
beam reheating furnace have been supplied by M/S
PRODUCT MIX:
With the commission of hot rolling mill, Salem Steel Plant has also entered the
market of carbon steels. The hot rolling steckel mill is capable for producing both stainless as
well as non stainless steel. In cases of carbon steels, the minimum thickness which can be
achieved is 1.6 mm and in case of stainless steel the minimum thickness achieved would be
2.0 mm. The mill has the capacity to roll up to 1300 mm width.
PROCESS:
Slabs of carbon steel (or) stainless steel are received through wagons from Alloy steel
plant, Durgapur or Bhillai Steel Plant, or from abroad and stored in slab-

stored yard. As per the schedule the slabs are changed in to the Walking Beam
Reheating Furnace and to a suitable temperature. Later these slabs are discharged from
furnace and sent to Roughing Mill. In Roughing Mill the slabs are rolled to transfer bar to a
thickness of 25 mm and sent to steckel Mill for further reduction. Having achieved the
required thickness, the material is cooled with the system of Laminar Cooling in case of
carbon steel and cooling. From down coiler HR coils are taken to CRM or customers through
trucks.
PRODUCT RANGE:
CATEGORY : Astentic, Stainless Steel
GRADE : 301, 304, 3041, 309, 309S, 310, 316, 3163,
3163L, 317.317L, 321
CATEGORY : Ferritic Stainless Steel
GRADE : 409,4093,430
CATEGORY : Martensitic Stainless Steel
GRADE : 410,420
1.4.2 FUNCTIONS OF MARKETING DEPARTMENT:
The Marketing Department of Salem Steel Plant encompasses the entire gamut of
activities relate to the marketing of cold rolled and hot rolled Stainless and non Stainless
products from Salem Steel Plant excepting the sale of commercial quality – the process
arising of the plant that are disposed off through tendering mechanism by the Materials
Management Department. The marketing division covers the sales of these products in the
home market as well as in the export market.
The cycle of marketing operations commence from the process of segmentation of the
market. The Stainless Steel market has been segmented into ten market segment as under.
A. Dairy, Food Processing

B. Chemical and Fertilizer
C. Heavy Engineering
D. Pipes and Tubes
E. Building and Construction
F. Railways
G. Power, Automobile
H. Appliances

CHAPTER 2
2. MAIN THEME OF THE PROJECT
2.1.OBJECTIVES OF THE STUDY
2.1.1 PRIMARY OBJECTIVES:
The primary objectives of the study are to know market potential in Salem steel plant
in Salem.
2.1.2 SECONDARY OBJECTIVES:
1. To analyze the extent of awareness about SSP among the customers to understand how
people come to know about SSP.
2. To find out the factors that affects the purchasing decision of customers of SSP.
3. To study the people mentality about the market potential in SSP.
4. To study the present perception of market potential by the customers.
5. To know what are the competitions available in Salem for SSP.
6. To analyze customer satisfaction.
7. To give the suitable suggestion that improves the sales of the steel for various countries.
2.2 SCOPE AND LIMITATION OF THE STUDY
2.2.1 SCOPE OF THE STUDY
The study covers all functionality aspects of this company.
The research will help the company to know the customer expectations &
level of satisfaction.

The aim of the study is to analyze and evaluate the market potential of
customers towards SSP with specific reference to salem.
So this study will help the company to know about the customer expectation &
hence improve their services.
2.2.2 LIMITATIONS OF THE STUDY
As it is a study about “market potential”, the data are being collected approximately 50%
from the customers & 20% collected from the Salem steel plant employees.
The study is performed on primary source. The entire project relies on the reliability of
the data provided by the source.
It is difficult to get the feedback from the customers of SSP.
Since this study is on “market potential”, respondents did not come out clearly with the
facts. However all efforts are being made to establish rapport.
2.3 RESEARCH METHODOLOGY
2.3.1 RESEARCH DESIGN
With the given objectives mentioned already it was decided to use exploratory
research design since it meets the required goal. To obtain the relevant information , primary
data had to be gathered. Survey of customers was used to collect primary data. Since the
customers have knowledge about the product, it was decided to use personal interview
schedule so that relevant and accurate information could be obtained, this was done primarily
to avoid bias and ambiguity to the maximum possible extent. We shall now have an overall
view of the certain survey methods available for the market researcher and their advantage
and short comings. With due emphasis being given to the personal interview survey method
adopted for the project work.

2.3.2 EXPLORATORY RESEARCH
In the scientific method the research is based on the judgment of facts and not on
preconceived notions or intuitions. It attempts to obtain the most accurate measurements
possible. It also considers all that aie pertinent to the problem at hand. the research design
adopted is exploratory in nature to gain insight into various aspects related to marketing of
stainless steel.
2.4 METHODS OF DATA COLLECTION
Data collected for this research primary and secondary sources. Primary data collected
by the survey method has resulted in border range of information. The technique used this
survey has very well structured and designed questionnaire was given to get the individual
ideas on some specific issues.
Data which are not originally collected but rather obtained from published and
unpublished coerces known as secondary data have been collected from records, reports and
magazines of various organizations.
2.4.1 TOOLS FOR DATA COLLECTION
The first step towards research is to establish the objectives of the study. once the
objective are finalized, we have to embark on the collection of data, which would enable us to
satisfy our objectives set previously. For the collection of data, the researcher has personal
interview method.
LIKERTS SCALE
Here the researcher has constructed a number of statements relation to the issue under
investigation. Respondents have been allowed to indicate their degree of agreements or with
each statement.
The researcher has used the likert scale to measure the opinion about the sales through
an advertisement and brad image. The researcher has used likert scale to exactly measure the
overall performance of various brands of stainless steel.

SEMANTIC DIFFERENTIAL SCALE
The semantic differential scale contains a number of issues as points or as a set of
statement. But unlike likert scale, here the response categories consists of a set of five point
bipolar adjectives such as high low thus in semantic different scale method response consists
of opposite meaning words, to anchor the ends of scale.
The researcher has used semantic differential scale to measure the importance of
brand image of stainless steel by asking the respondent to give their opinion in the given
point scale ranging from high to low.
RANKING ORDER SCALE
In this scale, the respondent is given a list of specific characteristics of the stimulus.
The respondents are asked to provide ranking of various option given.
The researcher used ranking order scale to assess buyer’s order of preference on
various attributes of stainless steel when they purchase material.
2.4.2 SAMPLING TECHNIQUE
The sampling technique used for the research study in stratified random sampling
that in turn is a probability sampling. The reason for taking a stratified sample is to have an
efficient sample. The sampling error is reduced because the groups are internally
homogenous but comparatively different. Another reson for conducting strafied sample is the
assurance that a sample will accurately reflect the population on the basis of the criteria used
for stratification.
SAMPLING SIZE
The total population is 475 in Coimbatore region only which consists of 325
appliances, 75 utensils, 25 automobiles and 50 others for various competitive brands. So a
sample of 16% is taken from each market segment of users stratified random sampling.
TOTAL SAMPLE SIZE=70

SAMPLING UNIT
Stainless steel customers, who have purchased the stainless steel for their
manufacturing process.
SAMPLING PLAN
The sampling plan is as follows:
a) Appliances - 48
b) Utensils - 12
c) Others - 7
d) Automobile - 3
TOTAL = 70
2.4.3 QUESTIONNAIRE PREPARATION
PERSONAL INTERVIEW
It is the best available method for collecting information. It eliminates all changes of
ambiguity either on the interviewers part or in the responds. Part difficulties if any, in
understanding or answering the question can be recounted by the interview or immediately.
This would result in a better comprehension of the questions in the questionnaire by the
respondents. Hence it would elicit responses of a better quality. Weighing in mind all these
attributes, it was decided to resort to the personal interview methods as the means for
collecting data.
It has been was decided to develop a questionnaire and administer it to the various
market segments comprising essentially of stainless steel customers, a questionnaire must
reflect on the objective of the study and also it should be interesting enough for the
respondents to answer the question given.

The different types of questions that can be used in the marketing research survey are
a. Open ended questionnaire
b. Multiple choice questionnaire
c. Dichotomous questions
OPEN ENDED QUESTIONS
The main advantage of this type of questions is the researchers can extract more
information from the respondents.
MULTIPLE CHOICE QUESTIONS
These questions elicit certain responses previously decided by the interview. The
respondent has to choose among the alternative given. An advantage of multiple choice
questions is that the tabulation process is made simple but on the other hand it may lead to
biased answer due to the reason that respondents may pickup alternatives in a casual way.
DICHOTOMOUS QUESTIONS
These questions have only respondents “yes” or “no” so respondents cannot possibly go
beyond two given alternatives. Dichotomous questions can be easily analyzed as they do not
have more than responses. There is the minimum chance of any bias on the respondents part
and hence the result are more credible.
The following are the different types calves used by the researcher.
2.5 REVIEW OF LITERATURE
2.5.1 THEORETICAL FRAMEWORK
The student researcher an article on Steel: domestic industry in a global market – address
before the convention of the iron and steel society – transcript
Authors: Yeung, Matthew C H1; Ging, Lee Chew2; Ennew, Christine T3
Source: journal of Targetting, Measurement and Analysis for Marketing,
Volume 11, Number 1, 1 August 2002, pp. 24-33(10)
Publisher: Palgrave Macmillan
The article mainly highlights on the fact that steel industry in the global market based
on foreign policy, but this group should not object if 1 do that. My comments will be based
on some principles of a free enterprise, market economy. These principles are accepted
widely on faith but often violated in practice. My remarks will fall into three categories:
history, economics, and international politics.
First, I will review briefly some recent history of government-industry relations,
especially government interventions in the affairs of the steel industries here and abroad.
Then I will explore some major economic problems that have arisen in the steel industry as a
result of government intervention. Finally, I will look at some of the major international
political problems facing our domestic steel industry, and the Reagan Administration’s
responses.
The Dismal History of Government-Steel Industry Relations.
The recent history of the relations between our government and the steel industry is
instructive; but, like lots of instruction, it is painful. In 1952 the Federal Wage Stabilization
Board made recommendations for a new contract between the major steel companies and the
united steelworkers. The companies refused to accept the wage board’s proposals, and the
union called the strike. President Truman issued an executive order seizing the steel plants,
and the secretary of commerce was made responsible for operating them. Fortunately, the

Supreme Court reversed the president’s action a month later. Labor and management
eventually worked out an agreement.
Thus began a pattern which has led to wages and benefits for steel workers far higher
than in most other industries. In addition government pressures on wages, or perhaps because
of the results of those pressures, there have been significant restrictions on imports of steel
during 9 of the last 16 years. We have had so-called “voluntary” export restraints by our
major steel suppliers; We have had trigger-price mechanisms 1 and 2; We have had a surge-
monitoring mechanism; We have had a special arrangement with the European community.
These devices, conceived as temporary, did not sole the industry’s problems, well intentioned
though they were.
At this moment, we face two new major initiatives for protection against steel
imports. In one, Bethelehem Steel and the United Steelworkers have filed a petition for
protection under Title 2, sections 203 of the Trade Act of 1947. This is a legitimate step
under our laws, and I want to emphasize that I am in no way criticizing it.
The U.S. International Trade Commission (ITC) will decide in early June whether
steel imports have been a significant cause of seriously injury to our steel industry and, if so,
will recommend action to the President in early July. It would be inappropriate for me to
comment on the merits of this case until the ITC has submitted its report and the President
has made his decision.
But the other proposal is much more serious, and I have no hesitation in speaking out
against it. In fact, I feel obliged to do so because the “Fair Trade in Steel Act” is dangerous to
the health of the industry. The “Fairy Trade in Steel Act” would limit steel imports to 15% of
consumption. Whatever you think of that, listen to this: the act would require the industry to
submit to the Secretary of Commerce an acceptable plan to invest “substantially all of the
cash flow from the steel sector for reinvestment in, and the modernization of, the steel sector.
“The bill further provides for oversight of these plans by the Secretary of Commerce and
requires him to make annual determinations as to whether the implementation of the
investment plan is satisfactory.

If such a bill had been on the books a couple of years ago, the diversification which
most major steel companies have embarked upon could not have taken place. If the bill is
enacted, the industry will cede to the government effective control over investment decisions-
precisely the situation in state-owned steel industries. This is bad enough on its face, but it is
even worse that the statute would direct the industry’s funds exclusively to steel making
instead of allowing the individual firms to find the most remunerative uses of their funds.
This kind of managed investment would not enable our firms to reduce costs to the level of
those in countries live Korea.

CHAPTER 3
3 ANALYSIS AND INTERPRETATION
3.1 Simple Percentage AnalysisTABLE-3.1 - TYPES OF STAINLESS STEEL USED BY THE
CUSTOMER
SL TYPES OF STAINLESS NUMBER OF INDUSTRIES PERCENTAGE
1
2
3
4
SHEET
COIL
BOTH
(SHEET& COIL)
ROD,SHEET &COIL
13
7
40
10
19%
10%
57%
14%
TOTAL 70 100%
INTERPRETATION
Among the total respondents most of them that is 57% use both the stainless steel
sheet and coil. 18% of the respondents use only the coil, 14% of the respondent use sheet
only, coil and rod and the remaining 10% of the respondents use the stainless steel and coil
only.
INFERENCE
From the table, it can be inferred that the customers mostly use the sheet and coil.

FIGURES -3.1- TYPES OF STAINLESS STEEL USED BY THE
CUSTOMER
TABLE-5.2 - GRADES OF THE STAINLESS STEEL USED BY THE
CUSTOMER
SL .
NO
GRADES OF SS NUMBER OF
INDUSTRIES
PERCENTAGE
1
2
3
SS 304
OTHERS
BOTH
36
9
25
51%
13%
36%
TOTAL 70 100%

INTERPRETATION
Table-5.2 shows the grades of the stainless steel used by the customers the SS304
grade being used by 36 respondents and 9 respondents use other grades of SS.
INFERENCE
It could be seen in Salem region most of the respondents are wet grinder
manufacturers. All of the respondent, who manufacture wet grinder use the SS304.
FIGURES-3.2 - GRADES OF THE STAINLESS STEEL USED BY THE
CUSTOMER

TABLE-3.3 - FREQUENCY OF PURCHASING BY THE CUSTOMER
SL.NO FREQUENCY OF
PURCHASE
NUMBER OF
INDUSTRIES
PERCENTAGE
1
2
3
4
5
MONTHLY
QUATERLY
HALF YEARLY
ANNUALY
WHEN NEEDS ARISES
16
10
-
1
43
23%
14%
-
1%
61%
TOTAL 70 100%
INTERPRETATION
Among the 70 respondents, 61% industries purchase the stainless steel when ever
needs arise, 23% of respondents purchase on a monthly basis, 14% of respondents purchase
every quarter and the rest of respondents (1%) annually.
INFERENCE
From the table it can be inferred that the frequency of purchase in most in the case of
customers who purchase whenever needs arises in Coimbatore region, there are number of
small-scale industries and price is the important factor for the small scale industries.

FIGURES-3.3 - THE FREQUENCY OF PURCHASING BY THE
CUSTOMERS
TABLE-5.4 THE MODE OF PURCHASE OF THE STAINLESS STEEL
CUSTOMER
SL.NO MODE NUMBER OF
INDUSTRIES
PERCENTAGE
1
2
3
CASH
CREDIT
BOTH
4
17
49
6%
24%
70%
TOTAL 70 100%

INTERPRETATION
Table-5.4 shows it is inferred / proposed / identified that the most of purchase of the
customers and the respondents 70% come under the category of both cash and credit purchase
of respondents come under credit basis and remaining 6% of respondents purchase the
material by cash.
INFERENCE
From the table, it can be inferred that most of the respondents purchase the material on
cash. And credit basis because the demand for material arise whenever needs come.
FIGURES-3.4 THE MODE OF PURCHASE OF THE STAINLESS
STEEL CUSTOMERS:
6%

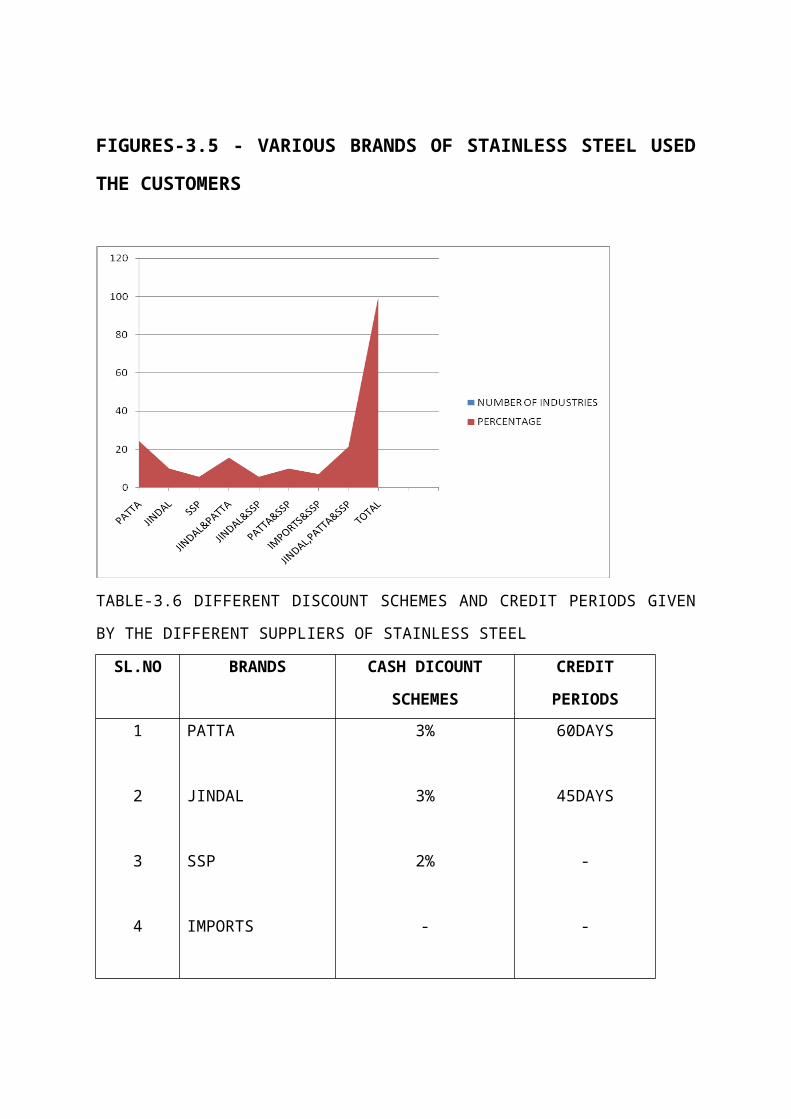
TABLE-3.5 VARIOUS BRANDS OF STAINLESS STEEL USED BY THE
CUSTOMERS
SL.NO BRANDS NUMBER OF INDUSTRIES
PERCENTAGE
1
2
3
4
5
6
7
8
PATTA
JINDAL
SSP
JINDAL&PATTA
JINDAL&SSP
PATTA&SSP
IMPORTS&SSP
JINDAL,PATTA&SSP
17
7
4
11
4
7
5
15
24%
10%
6%
16%
6%
10%
7%
21%
TOTAL 70 100
INTERPRETATION
Among the respondents 24% customers use PATTA stainless steel for their
requirement and it stands and it stands first among the industries, 10% and 6% of respondents
use JINDAL and SSP stainless steel using respectly. In Coimbatore JINDAL, PATTA and
are used by 21% and JINDAL and PATTA used by 16% respondents. Next to this comes
10% of the customers who use PATTA and SSP followed by 7% who use imports and SSP
and last category of 6% use JINDAL and SSP.
INFERENCE
PATTA is the most used brand among the customers.

FIGURES-3.5 - VARIOUS BRANDS OF STAINLESS STEEL USED THE
CUSTOMERS
TABLE-3.6 DIFFERENT DISCOUNT SCHEMES AND CREDIT PERIODS GIVEN BY
THE DIFFERENT SUPPLIERS OF STAINLESS STEEL
SL.NO BRANDS CASH DICOUNT
SCHEMES
CREDIT
PERIODS
1
2
3
4
PATTA
JINDAL
SSP
IMPORTS
3%
3%
2%
-
60DAYS
45DAYS
-
-

INTERPRATATION
Since the most of the other companies are giving more discounts than the SSP. When
the credit periods is considered .PATTA gives 60days from the purchasing date, JINDAL
gives 45days and the SSP and imports are not give the credit periods.
INFERENCE
PATTA gives attractive credit and discounts schemes than others.
FIGURES-3.6 - DIFFERENT DISCOUNT SCHEMES AND CREDIT
PERIODS GIVEN BY THE DIFFERENT SUPPLIERS OF STAINLESS
STEEL

TABLE-3.7 - CUSTOMER ANNUAL REQUIREMENT OF STAINLESS
STEEL
TYPES SHEET
(T)
COIL
(T)
ROD
(T)
TOTAL
BRANDS
PATTA
JINDAL
SSP
IMPORTS
215
247
197
36
460
232
206
39
76
24
-
16
751
503
403
91
TOTAL 695 937 116 1648
INTERPRETATION:
Among the respondents, 751 tones per year PATTA stainless steel used by the
customers,503 tones per year JINDAL stainless steel used ,403 tones per year SSP stainless
steel used ,only 91 tones per year imports stainless steel per year used by the customers.
INFERENCE:
PATTA stainless steel is highly using by the customers due to its low price and
attractive credit periods compare to other Brands.

FIGURES-3.7 - CUSTOMER ANNUAL REQUIREMENT OF
STAINLESS STEEL
3.2 CHI-SQUARE
TABLE-3. 8 CHI-SQUARE ANALYSIS FOR MODE OF PAYMENT
SL.NO MODE NUMBER OF INDUSTRIES
1
2
3
CASH
CREDIT
BOTH
4
17
49
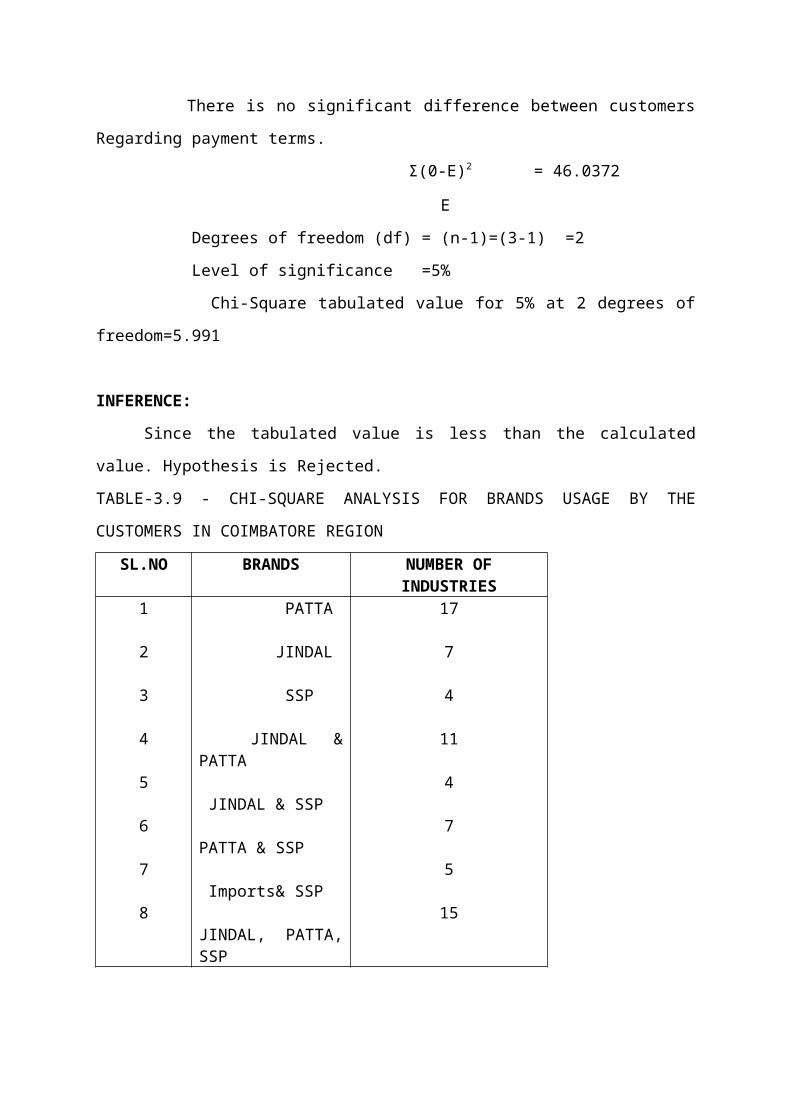
HYPOTHESIS:
There is no significant difference between customers Regarding payment terms.
Σ(0-E)2 = 46.0372
E

Degrees of freedom (df) = (n-1)=(3-1) =2
Level of significance =5%
Chi-Square tabulated value for 5% at 2 degrees of freedom=5.991
INFERENCE:
Since the tabulated value is less than the calculated value. Hypothesis is Rejected.
TABLE-3.9 - CHI-SQUARE ANALYSIS FOR BRANDS USAGE BY THE CUSTOMERS
IN COIMBATORE REGION
SL.NO BRANDS NUMBER OF INDUSTRIES
1
2
3
4
5
6
7
8
PATTA
JINDAL
SSP
JINDAL & PATTA
JINDAL & SSP
PATTA & SSP
Imports& SSP
JINDAL, PATTA, SSP
17
7
4
11
4
7
5
15

HYPOTHESIS:
All the Brands have equal appeal to industries
E= ∑× =8.75
N
∑(0-E)2 =20.275
E
degrees of freedom (d.f)=(n-1)=(8-1)=7
Level of significance=5%
Chi-square tabulated value for 5% at 7 degrees of freedom= 14.047
INFERENCE
Since the tabulated value less than calculated value. So hypothesis 1 rejected.
TABLE-3.10 - CUSTOMERS OPINION TOWARDS THE MARKETING ATTRIBUTES
OF PATTA
SL.NO FACTORS PREFERENCE
OF CUSTOMER
MEAN S.D C.V
5 4 3 2 1
1
2
3
4
5
Availability
Executive
Communication
Discount
Credit
After sales
service
39
35
40
26
17
22
20
20
42
47
8
10
8
2
4
1
5
1
0
1
0
0
1
0
1
4.41
4.21
3.5
4.34
4.11
0.746
0.936
1.180
0.531
0.687
16.91
22.3
16.71
12.21
16.71

INTERPRETATION
Table-5.10 shows the mean, standard deviation and co-efficient of variation for the
important marketing attributes of PATTA stainless steel. The scores are given in the order 5
means excellent, 4 means very good, 3 means good, 2 means bad and 1 means very bad.
From the table it could be observed the highest average score is for availability of
the mean lies in between 4 and 5 means very good and excellent. Since the value lies in lower
half of the interval. It could be interpreted that the availability of PATTA stainless steel is
considerably very good.
The next highest average score come from credit terms offered by PATTA the
mean value of credit terms lies in between 4 and 5 and it means very good and excellent.
Since the value lies in the lower half of the interval, it could be interpreted that the credit
terms of PATTA is considerably very good.
The average score of executive communication and after sales and service lie
between of 4 and 5 that is very good and excellent, since the value lies lower half of the
interval, it could be interpreted that the executes communication and after sales service is
very good.
The mean of discount lies between 3 and 4 means very good and good. The mean
value lies in the upper half of interval hence it could be interpreted that the cash discount of
PATTA is considerably very good.
It is also interesting to note that the coefficient of variation is the smallest among
the scores provided by the respondents for the credit terms of PATT aspect. Hence it may be
concluded that greater uniformity exists among them with regard to the credit terms.

TABLE- 3.11 - CUSTOMERS OPINION TOWARDS THE MARKETING
ATTRIBUTES OF JINDA
SL.NO FACTORS PREFERENCE OF
CUSTOMER
MEAN S.D C.V
5 4 3 2 1
1
2
3
4
5
Availability
Executive
Communication
Discount
Credit
After sales
service
1
10
19
7
10
10
50
21
13
10
50
5
10
40
20
9
5
15
5
27
0
0
5
5
3
3.04
3.39
3.49
3.17
2.96
0.571
0.703
1.284
0.955
1.120
18.7
17.8
36.79
30.12
38.04

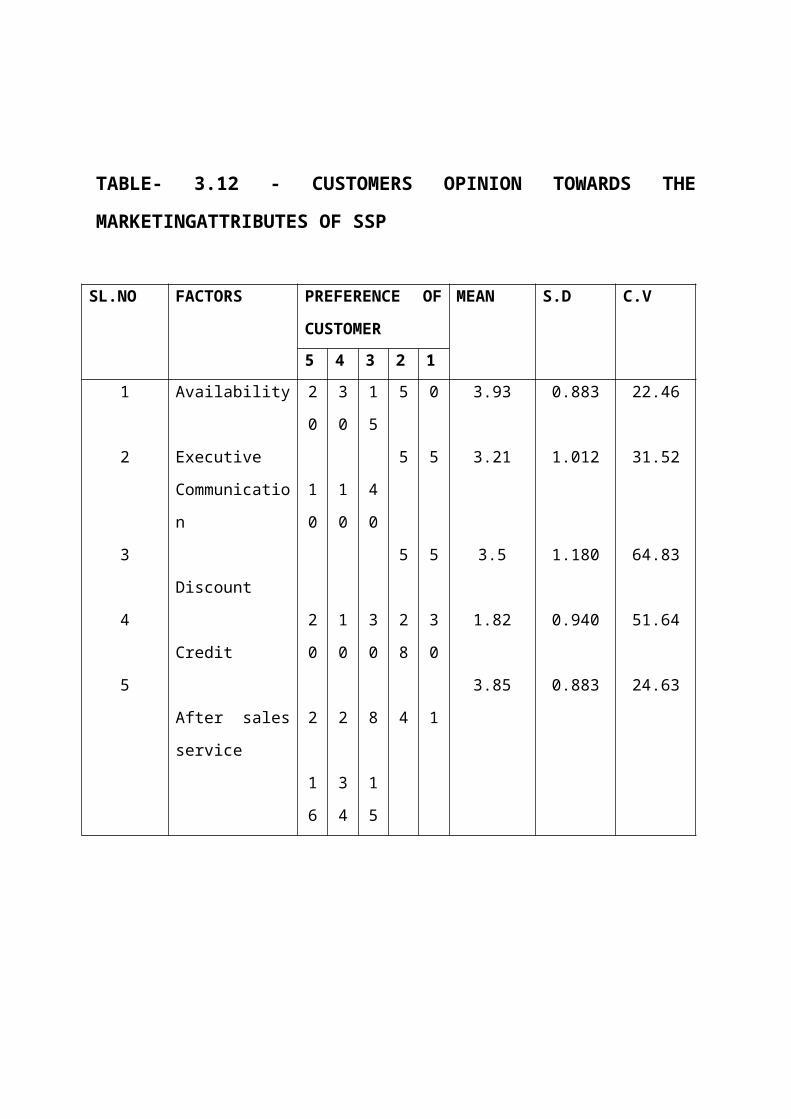
TABLE- 3.12 - CUSTOMERS OPINION TOWARDS THE
MARKETINGATTRIBUTES OF SSP
SL.NO FACTORS PREFERENCE OF
CUSTOMER
MEAN S.D C.V
5 4 3 2 1
1
2
3
4
5
Availability
Executive
Communication
Discount
Credit
After sales
service
20
10
20
2
16
30
10
10
2
34
15
40
30
8
15
5
5
5
28
4
0
5
5
30
1
3.93
3.21
3.5
1.82
3.85
0.883
1.012
1.180
0.940
0.883
22.46
31.52
64.83
51.64
24.63

TABLE- 3.13 - CUSTOMER OPINION TOWARDS THE MARKETING
ATTRIBUTES OF IMPORTS
SL.NO FACTORS PREFERENCE
OF CUSTOMER
MEAN S.D C.V
1 2 3 4 5
1
2
3
4
5
Availability
Executive
Communication
Discount
Credit
After sales
service
0
5
5
0
0
0
5
5
0
0
6
40
10
0
0
24
5
40
5
9
40
15
10
65
61
1.51
2.71
2.35
1.07
1.12
0.653
1.907
1.042
0.257
0.334
43.2
40.49
44.34
24.03
29.82

TABLE- 3.14 - CUSTOMER OPINION TOWARDS THE PRICE OF
EACH BRAND
SL.NO BRAND MEAN S.D C.V
1
2
3
4
SSP
Imports
JINDAL
PATTA
4.828
3.914
3.171
1.757
0.446
0.327
0.736
0.490
9.23
10.23
23.21
27.88
TABLE- 3.15 - CUSTOMERS OPINION TOWARDS THE QUALITY OF EACH BRAND
SL.NO BRAND MEAN S.D C.V
1
2
3
4
SSP
Imports
JINDAL
PATTA
4.41
3.11
4
1.68
0.870
0.747
0.736
0.727
19.73
24.01
18.40
43.27

TABLE- 3.16 - CUSTOMERS OPINION ON BRAND IMAGE OF EACH BRAND
SL.NO BRAND MEAN S.D C.V
1
2
3
4
SSP
Imports
JINDAL
Patta
4.514
3.071
3.34
1.21
0.6034
0.8835
0.843
0.582
13.36
28.76
25.23
48.17
TABLE- 3.17 - CUSTOMERS OVERALL ATTITUDES TOWARDS EACH BRAND OF
STAINLESS STEEL
SL.NO BRAND MEAN S.D C.V
1
2
3
4
SSP
Imports
JINDAL
PATTA
4.57
3.85
3.58
2.54
0.494
0.742
0.726
1.037
10.80
19.27
20.27
40.85
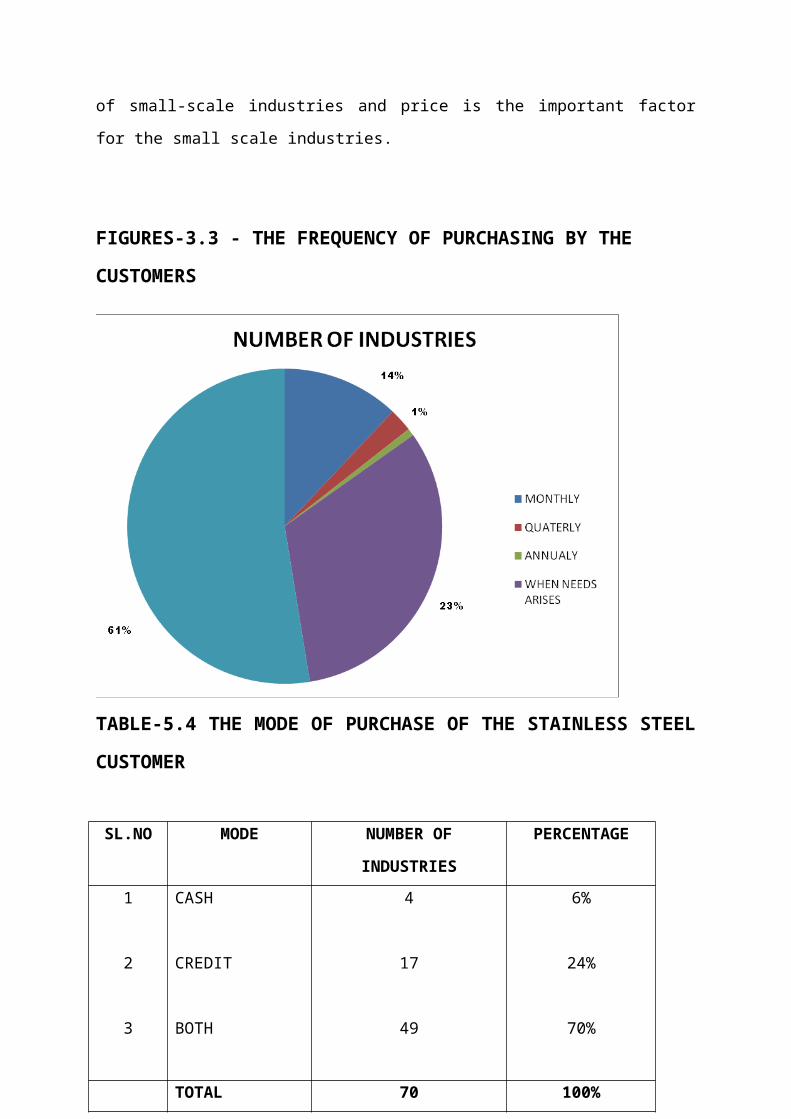
TABLE- 3.18 - CUSTOMERS PRODUCTION EXPANSION PLAN IN FUTURE
SL.NO EXPANSION
YEAR
NUMBER OF
INDUSTRIES
PERCENTAGE REQUIREMENT
(TONE)
1
2
3
4
0-1
1-2
2-3
3-4
14
51
3
2
20%
72%
5%
3%
63
276
15
13.5
TOTAL 70 100 367.5
TABLE- 3.19 - CUSTOMERS OPINION ON ADVERTISEMENT ABOUT STAINLESS
STEEL
SL.NO FACTORS NUMBER OF
RESPONDENTS
PERCENTAGE RANK
1
2
3
4
5
Strongly agree
Agree
Cant say
Dis agree
Strongly
disagree
61
7
1
1
-
88%
10%
1%
1%
-
1
11
111
111
-
TOTAL 70 100 -

INTERPRETATION
Table 5.19 shows the customers opinion on advertisement boosting the sale of
stainless steel. Among the total respondents, 88% strongly agree with the statement, 10% of
the respondents agree, 1% of the respondent cant say anything about that and the remaining
1% disagree. It can be stated that advertisement has its effect on stainless steel.
INFERENCE
Most of the respondents strongly agree that advertisement are an effective tool for
boosting the sales of stainless steel.
FIGURES- 3.19 - CUSTOMERS OPINION ON ADVERTISEMENT
ABOUT STAINLESS STEEL

TABLE- 3.20 - MEDIA PREFERENCE AMONG THE CUSTOMERS
SL.NO MEDIA NUMBER OF
RESPONDENTS
PERCENTAGE
1
2
3
4
Trade journal
News Papers
Television
Magazine
28
26
11
5
40%
37%
16%
7%
TOTAL 70 100%
INTERPRETATION
Table-5.20 shows the advertisement media preferred by the customers. Among the
total respondents, 40% preferred the trade journal for stainless steel advertisement, 37% of
respondents preferred the news paper and rest of the 15% and 7% respondents preferred the
television and magazine respectively.
INFERENCE
It could be easily observed from the table that best media trade journal and it is highly
rated with manufactures.
FIGURES- 3.20 - MEDIA PREFERECE AMONG THE CUSTOMERS

TABLE- 3.21 - SHOWING THE MEAN, STANDARD DEVIATION(S.D)
“t” VALUE AND LEVEL OF SIGNIFICANCE ON THE QUALITY OF
SSP AND OTHER BRANDS BY THE CUSTOMERS
SL.NO VARIABLE MEAN S.D “t”
VALUES
LS
1
2
Quality of
SSP
Quality of
other brands
4.41
2.933
0.870
1.205
8.3119 0.01
INTERPRETATION
Table-5.21 shows the mean, standard deviation (S.D) “t” value and level of
significance on the qulity of SSP and other brands by the customers. From the table, it could
be observed that, the quality level of SSP is significantly different from that of other brands.
INFERENCE
It can be inferred, the quality of SSP differs significantly from that of other brands.
Hence the quality level of SSP is higher than that of other brands.

FIGURES- 3.21 - SHOWING THE MEAN, STANDARD DEVIATION
(S.D) “t” VALUE AND LEVEL OF SIGNIFICANCE ON THE QUALITY
OF SSP AND OTHER BRANDS BY THE CUSTOMERS

TABLE- 3.22 - SHOWING THE MEAN STANDARD DEVIATION
(S.D)”t” VALUE OF SIGNIFICANCE ON The SSP AND OTHER
BRANDS BY THE CUSTOMERS
SL.NO VARIABLES MEAN S.D “t”
VALUES
LS
1
2
Price of SSP
Price of other
brands
4.828
3.00
0.446
1.108
12.80 0.01
INTERPRETATION
Table-5.22 shows mean, standard deviation (s.d), “t” value and level of significance
of the price of SSP and other brands by the customers. From the table it could be observed
that, the price level of SSP differs significantly from that of other brands.
INFERENCE
It can be inferred that, the price of SSP differs significantly from that of other brands.
Hence the price of SSP is higher than that of other brands.

FIGURES 3.22 – CUSTOMER ATTENDING THE MODERNISATION
PROGRAMME CONDUCTION SSP
CHAPTER 4
FINDING, SUGGESTIONS AND CONCLUSION
4.1 FINDINGS
With the help of analysis and interpretation the researcher has arrived at following findings
which are listed below:
1. From the total respondents, market potential for stainless steel is 1648 tone per
year.
2. Most of the respondents purchase both sheet and coil and only very few of them
purchase rod.
3. Among the total respondents 51.42% of customers use SS304 grade.
4. From the total respondents 61% respondents purchase the stainless steel
whenever needs arises.
5. 70% of the respondents come under cash and credit purchase.
6. From the respondents, it is found most of the industries use PATTA stainless
steel followed by PATTA, JINDAL, ad SSP in order and very few industries use
imports and SSP in coumarone region.
7. SSP is highly priced compared to that of other brands.
8. SSP has very good quality compared to that if other brands.
9. The availability of SSP is very good.
10. The company executive communication with the customers is good.
11. The discount scheme of SSP is good.
12. SSP has no credit scheme but JINDAL and PATTA has very good credit
schemes.
13. After sales service of SSP is very good compared with other brands.

14. SSP has very high brand image among stainless steel customers using other
brands.
15. Most of the respondents like strongly the SSP stainless steel due to its easy
fabrication.
16. Only 58% of the respondents have future expansion plan in their production.
17. Among the respondents who have plans for future expansion 53% respondents
will expand their business with in 1-2 year with annual requirement of 776 tones.
18. Of the respondents 87% are strongly agreed that advertisement will increase the
sales of stainless steel.
19. Most of the respondents purchase their materials from traders.
20. Most of the customers prefer trade journal as the best media for advertisement.
21. Only 58% respondents have attended modernization, programmed by SSP.
22. Marketing attributes of SSP such as price, availability, after sales service, credit
terms, communication, quality significantly differ with those of other brands.
23. Most of the customer prefers the personal selling as the best promotional measure
for stainless steel.
24. Discount scheme of SSP does not significantly differ from other brand.
25. This research proves that a positive relationship exists between the quality and
price level of SSP.
26. Respondents prefer to purchase the imported stainless steel when only SSP and
imports are available.

27. In Salem 92% respondents feel that PATTA is the market leader in the present
stainless steel market.
28. Price plays a very important factor in the purchase of stainless steel to end user
specification.
29. Most of the industries use 0.5 mm thickness level and very few respondents are
using (0.4-0.6) mm level of thickness.
30. SSP stainless steel is not available in retail quantity like 2, 3 and 5 tones.
31. SSP delivery is not prompt due to non-stock.
32. Customers “willing price” for SSP304SS grade is Rs 8786 per tone.

4.2 SUGGESTION AND RECOMMENDATION
1. The findings of the project shows that the demand for SSP is very low. So it
is better that the company can concentrate on the marketing of stainless steel by
taking in to consideration the aspects like price, availability, credit terms and after
sales service on a comparative basis with market leader PATTA.
2. The survey brings the fact that the customers select stainless steel on the basis of their
perception about price, availability, and service. So the company while deciding the
marketing strategies must keep this factor in mind.
3. The company should concentrate on wet grinder industries because there are more
numbers of each industries in Salem region.
4. The company should conduct periodical meeting and conference for customers to
identify and to solve their exceptions.
5. The company can introduce a low price and moderate quality stainless Steel. Because
end-users prefer low-price materials seminars may be conducted in various segment
of the market at eighteen to the product and to the customers.
6. The company can start retail outlets to supply small quantities like 23 tones to the
customers.
7. The company should advertise in trade journals explaining availability of various
grade and applications.
8. The company can invite all customers for modernization programs to the company
and can increase its sales by including them to purchase SSP materials.
9. The company can introduce sales executive facilities which are followed by other
competitive brands.
10. The company sales executive should meet all the customers regularly, so that they can
identify the problems faced by them.

11. The company should try to improve the awareness of SSP products features among
the end users.
12. More than 50% of the customers said that they have expansion plan in future within
1-2 years SSP must concentrate on this factor.
13. SS304 grades with 0.5 mm thickness is highly used by customers and SSP can market
this class of steel.
14. The company should always keep the stock level more because the customers
purchase whenever there is a need for those materials.
15. Catalogues may be regularly mailed to the customers who influence the purchase
decision for providing information regarding availability price charging and
commercial terms.

4.3 CONCLUSION
From the research we realize that SSP has superior quality and high brand image
compared with other brands but it has less usage in Salem region due to its high price. So the
company should try to introduce a new product with low price and moderate quality. The
customers feel that the price should be low. Because the end users prefer the product with
low price. Also SSP should produce 0.5 mm stainless steel and market it since the
specification is the need of the Salem market. To increase the sales, the company should try
to satisfy the traders since very important traders are the persons who directly contact the
customers and hence their satisfaction.

APPENDIX
QUESTIONNAIRE:
1. Name of the company?
2. Name of respondent?
3. Manufacturing product?
4. What type of stainless steel do you use?
a. Sheet.
b. Coil.
c. Both.
d. Rod.
5. What are the brands you use?
a. JINDAL.
b. Patta.
c. SSP.
d. Imports.
6. Specify the grade that you use?
7. Specify the width arid thickness of stainless steel you use?
8. Frequency of purchase?
a. Monthly
b. Quarterly
c. Half yearly
d. Annually
e. whenever needs arise
9. Mode of purchase?
a. cash
b. credit
c. both
d. if credit give details of each supplier
10. Do you get any special discount for cash payment? Yes, give details of each
supplier?
11. What is your annual requirement of stainless steel?
Sheet coil Rod
PATTA -------- -------- ---------
JINDAL -------- --------- ---------
SSP -------- --------- ---------
Imports -------- --------- ---------
12. Do you have any expansion plan in future?
1. Yes 2. No
IF ‘’’YES¹’ will be the expansion
a. 0-1 yr b.1-2yr c.2-3yr d.3-4yr
How much stainless steel will be required for your future plan? ...........tones

13. How do you rate the different suppliers on the following factors
JINDAL PATTA SSP Importer
Availability
Quality
Executives
communication
Discounts
Credit terms
After sale service
1. Excellent 2.Very Good 3.Good 4.Bad 5.Very Bad
14. Please mention your attitude to the following brands:
JINDAL PATTA SSP Importers
Like strongly
Like mildly
Whether like or
not
Dislike
Mildly dislike
Dislike Strongly
15. Advertisement will increase the sale of stainless steel?
a. Strongly agree
b. Agree
c. Can’t say
d. Disagree
e. Strongly disagree
16. Which media advertisement will increase the sales level of SSP?
a. T.V magazine
b. Trade journal
c. News paper

17. Please (√ ) the BRAND IMAGE for the following brands,
JINDAL Low 1 2 3 4 5 high
PATTA Low 1 2 3 4 5 high
SSP Low 1 2 3 4 5 high
Imports Low 1 2 3 4 5 high
18. Please ( √ ) the following brands for the PRICE factors?
JINDAL Low 1 2 3 4 5 high
PATTA Low 1 2 3 4 5 high
SSP Low 1 2 3 4 5 high
Imports Low 1 2 3 4 5 high
19. Would you like to change your current brand?
a. Yes
b. No
If yes, what is your choice why?

21. What do you feel about the durability of salem stainless steel?
a. Poor
b. Moderate
c. Good
d. Very good
22. How do you purchase Salem stainless steel?
a. Other shop
b. Middle man
c. Direct to the company
d. Sales man

23. Do you get Salem stainless steel without any delay?
yes
no
24. Would you like to give any suggestion on Salem stainless steel?
****** Thank You *****

REFERENCES:
Web sites:
1. www.sail.co.in
2. www.stainlessindia.org
3. www.steelrx.com
1. Philipkotler.(Marketing Management)
2. ROBERT E. STEVENS , DAVID LOUDON.(Marketing
Management)
BOOKS:
Kothari, C.R., Research Methodology - Methods & Techniques, New Age
international (P) Ltd., Publishers, New Delhi , Second Edition ,2004.