Embed Size (px)
Citation preview

A l t e r n a t i v e a n d R e n e w a b l e F u e l a n d V e h i c l e T e c h n o l o g y P r o g r a m
F I N A L P R O J E C T R E P O R T
ARV-10-044 Final Report
Ultra-Low Carbon Powertrain
AUGUST 2014
CEC-ARV-10-044
Prepared for: California Energy Commission
Prepared by: Cummins Inc

Prepared by: Primary Author(s): Anthony Perfetto Sam Geckler Cummins Inc. 1900 McKinley Avenue Columbus, IN 47201 812-377-3079 www.cummins.com Agreement Number: ARV-10-044 Prepared for: California Energy Commission Eric VanWinkle Agreement Manager
John Butler Office Manager Emerging Fuels & Technology Office
Randy Roesser Deputy Director Fuels and Transportation Division
Robert P. Oglesby Executive Director
DISCLAIMER
This report was prepared as the result of work sponsored by the California Energy Commission. It does not necessarily represent the views of the Energy Commission, its employees or the State of California. The Energy Commission, the State of California, its employees, contractors and subcontractors make no warrant, express or implied, and assume no legal liability for the information in this report; nor does any party represent that the uses of this information will not infringe upon privately owned rights. This report has not been approved or disapproved by the California Energy Commission nor has the California Energy Commission passed upon the accuracy or adequacy of the information in this report.

i
ACKNOWLEDGEMENTS
Cummins would like to thank Allison Transmission for their dedicated and innovative support
of the stop/start technology developed through this project. Their partnership made possible
significant CO2 reductions through elimination of engine idling at vehicle stop events, while still
providing excellent vehicle launch characteristics.
Cummins would also like to thank Freightliner Custom Chassis Corporation for the donation of
an MT45 step van for the duration of this project. We would also like to thank Valvoline for
support of this project with E85 compatible engine oils.
ii
PREFACE
Assembly Bill 118 (Núñez, Chapter 750, Statutes of 2007), created the Alternative and Renewable
Fuel and Vehicle Technology Program (ARFVT Program). The statute, subsequently amended by
AB 109 (Núñez) Chapter 313, Statutes of 2008), authorizes the California Energy Commission to
develop and deploy alternative and renewable fuels and advanced transportation technologies
to help attain the state’s climate change policies. The Energy Commission has an annual program
budget of about $100 million and provides financial support for projects that:
Develop and improve alternative and renewable low-carbon fuels.
Enhance alternative and renewable fuels for existing and developing engine technologies.
Produce alternative and renewable low-carbon fuels in California.
Decrease, on a full-fuel-cycle basis, the overall impact and carbon footprint of alternative
and renewable fuels and increase sustainability.
Expand fuel infrastructure, fueling stations, and equipment.
Improve light-, medium-, and heavy-duty vehicle technologies.
Retrofit medium- and heavy-duty on-road and nonroad vehicle fleets.
Expand infrastructure connected with existing fleets, public transit, and transportation
corridors.
Establish workforce training programs, conduct public education and promotion, and
create technology centers.
The Energy Commission issued solicitation PON-09-004 to provide funding opportunities under
the ARFVT Program for Medium & Heavy-Duty Advanced Vehicle Technology. To be eligible
for funding under PON-09-004, the projects must also be consistent with the Energy
Commission’s ARFVT Investment Plan, updated annually. In response to PON-09-004, the
recipient submitted application 41, which was proposed for funding in the Energy Commission’s
Notice of Proposed Awards 06/10/2010, and the agreement was executed as ARV-10-044 on
09/21/2011.

iii
ABSTRACT
This Ultra-Low Carbon Powertrain project report describes the design, development, and testing
of a prototype powertrain concept fueled by E85 and targeted to decrease CO2 emissions on a
full-fuel-cycle basis by over 50%. This project developed a downsized 2.8L engine for use in class
4-6 medium duty vehicles with power and torque capabilities appropriate for this market. A
stop/start system was integrated with an automatic transmission to reduce idle fuel consumption.
This project demonstrated that an E85 engine with a close coupled 3-way catalyst is feasible for
delivering 2010 criteria emissions levels allowing for a cost competitive platform. System
analysis, test cell testing, chassis dynamometer testing, and full vehicle demonstration were used
to predict and quantify the results. A peak engine brake thermal efficiency of over 42% was
achieved which enabled equivalent fuel economy to a gasoline powertrain and equivalent fuel
cost to a diesel powertrain. This project concluded that over 50% CO2 reduction was achieveable
on cellulosic biofuels relative to currently available gasoline and diesel vehicles.
Recommendations for future work were made to increase the level of field demonstration or
examine next steps for improved powertrain efficiency using this E85 powertrain concept as a
starting platform.
Keywords: California Energy Commission, writing, style manual, guide, guidelines, report,
papers, presentations, preparation, publication format, no period at end of list of keywords
Please use the following citation for this report:
Last name, First name, Second author, Third author. (Company Name). Publication year. Title of
Report in bold italics. California Energy Commission. Publication Number: CEC-ARV-
10-044.

iv
TABLE OF CONTENTS
Acknowledgements ................................................................................................................................... i
PREFACE ................................................................................................................................................... ii
ABSTRACT .............................................................................................................................................. iii
TABLE OF CONTENTS .......................................................................................................................... iv
List of Figures ........................................................................................................................................... vi
EXECUTIVE SUMMARY ........................................................................................................................ 9
CHAPTER 1: Project Purpose and Approach .................................................................................... 11
Project Purpose 1.1 ............................................................................................................................... 11
Approach 1.2 ......................................................................................................................................... 11
CHAPTER 2: Activies and Results ....................................................................................................... 13
Activities 2.1 .......................................................................................................................................... 13
Engine System Modeling and Analysis 2.1.1 ............................................................................... 13
Engine Design 2.1.2 .......................................................................................................................... 25
Engine Contols 2.1.3 ........................................................................................................................ 27
Stop/Start System Controls 2.1.4 .................................................................................................... 29
Test Cell Testing 2.1.5 ...................................................................................................................... 31
Mule Vehicle Development 2.1.6 ................................................................................................... 34
Vehicle Integration 2.1.7 .................................................................................................................. 35
Results 2.2 .............................................................................................................................................. 40
Steady State Engine Efficiency 2.2.1 .............................................................................................. 40
Transient Test Cell Results 2.2.2 ..................................................................................................... 45
Criteria Emissions Feasibility 2.2.3 ................................................................................................ 47
Chassis Roll Fuel Economy 2.2.4 .................................................................................................... 49
Vehicle Demonstration 2.2.5 ........................................................................................................... 56
CHAPTER 3: Advancements and Success .......................................................................................... 59
Advancements in Science and Technology 3.1 ................................................................................ 59
Public Assessment of Success and Benefits 3.2 ................................................................................ 59

v
CHAPTER 4: Conclusions and Recommendations .......................................................................... 61
Conclusions 4.1 ..................................................................................................................................... 61
Recommendations for Future Projects 4.2 ........................................................................................ 61
Acronyms .................................................................................................................................................. 63

vi
LIST OF FIGURES
Figure 1: Gasoline and Diesel Torque Curves w/ E85 Target Peak Torque 14
Figure 2: Gasoline and Diesel Power Curves w/ E85 Target Rated Power 14
Figure 3: BMEP Scatter-band 16
Figure 4: Maximum Torque vs. Displacement 17
Figure 5: Maximum Power vs. Engine Speed 17
Figure 6: Maximum BMEP Comparison 19
Figure 7: Power Density Comparison 19
Figure 8: Charge Motion vs. Flow Capacity for Various Intake Port Designs 23
Figure 9: E85 Target Torque Curve 24
Figure 10: Pent Roof Design with Spark Plug, Injector and Valve Location 27
Figure 11: Control Module Architecture 28
Figure 12: Sensors and Actuators 28
Figure 13: Start/Stop System Architecture for E85 Engine System 30
Figure 14: E85 Engine and Stop/Start System Intalled in Test Cell 32
Figure 15: Torque Peak Log-P Log-V Diagram 34
Figure 16: Stop/Start Mule Development Truck 35
Figure 17: Demonstration Vehicle 36
Figure 18: “Ultra-Low Carbon Powertrain” FEAD Layout 36
Figure 19: Vehicle Cooling Package Front View 37
Figure 20: Isometric Right and Left Side Views of the Engine 38
Figure 21: Right and Left Side Views of the Powertrain Package 38
Figure 22: Isometric Right and Left Side Views of the Powertrain Package Installed in the Frame
Rails 39
Figure 23: Top View of the Powertrain Package Installed in the Frame Rails 40
Figure 24: Comparison of Target and Demonstrated 2.8L Torque Curve 41
Figure 25: 2.8L Engine Fuel Map Brake Thermal Effiiciency 42
Figure 26: 2.8L Engine Fuel Map 50% Mass Fraction Burned Location (Crank Angle Degrees) 43

vii
Figure 27: Fuel price comparison for E85 and gasoline in the Sacramento area for January 2014
43
Figure 28: Fuel Cost Improvement Percentage of the E85 Engine Compared to a State of the Art
Gasoline Turbocharged Direct Injection Engine Accounting for a 12% Higher Cost E85 Energy
Content 44
Figure 29: Drive Cycle Route Metrics Used to Simulate and Test Fuel Economy Results for P&D
Operation 46
Figure 30: Drive Cycle Route Metrics Used to Simulate and Test Fuel Economy Results for P&D
Operation 46
Figure 31: Hybrid Truck Users Forum Pickup and Delivery Test Cycle 47
Figure 32: Heavy Duty “OTTO” Cycle Operating Points for the 2.8L E85 Torque Curve 48
Figure 33: Hot Cycle NOx Emissions Using E85 Fuel 49
Figure 34: Federal Test Procedure 75 Cycle Definition 50
Figure 35: Highway Fuel Economy Test Cycle Definition 51
Figure 36: Hybrid Truck Users Forum Pickup & Delivery Cycle Definition 51
Figure 37: CO2 Emissions Reduction for E85 Powertrain Relative to Alternate Powertrains Using
the Farmed Trees Ethanol Pathway 53
Figure 38: CO2 Emissions Reduction for E85 Powertrain Relative to Alternate Powertrains Using
the Corn Ethanol Pathway 53
Figure 39: Fuel Economy Results for All Three Powertrains Tested at 17.5k lbs GVW 55
Figure 40: Fuel Cost Results for All Three Powertrains Tested at 17.5k lbs GVW 55
Figure 41: Urban On-Road Vehicle Demonstration Route 57
Figure 42: Rural On-Road Vehicle Demonstration Route 57
Figure 43: ”Ultra-Low Carbon Powertrain” Demonstration Vehicle 58

viii
LIST OF TABLES
Table 1: 2.8L Optimized E85 Engine Torque Peak and Rated Power Targets ................................ 20
Table 2. ETHOS Engine Specifications .................................................................................................. 25
Table 3: Fuel Pathway Carbon Values for Various Fuels .................................................................. 52
9
EXECUTIVE SUMMARY
This Ultra-Low Carbon Powertrain project was chartered to decrease CO2 emissions on a full-
fuel-cycle basis by over 50% using cellulosic ethanol as part of an E85, 85% ethanol and 15%
gasoline, fuel. It was envisioned that the fuel properties of E85 could be used to their advantage
in a purpose built engine designed for this fuel. This engine would be downsized relative to
current engines to increase the specific load on the engine which increases the efficiency engine
over a typical vehicle drive cycle. The combination of direct injection of fuel into the cylinder and
utilizing a high compression ratio leverage the fuel properties to drive high engine efficiency.
A top down approach was used to determine the engine displacement for this design by looking
at the required torque and power for class 4-6 medium duty applications. Bounds were placed
on engine displacements which could meet these requirements. It worked out that the
displacement range suitable for this project also happened to be the same displacement of a clean
sheet diesel engine design being worked by Cummins as part of a Department of Energy grant.
The timing worked such that the requirements of the E85 engine could be considered during the
design phase of the diesel version to leverage the high cylinder pressure requirements for both
platforms. A suite of modeling tools were used to guide the E85 engine design to allow for
placement of all the required components, to develop specifications for the engine breathing
systems, and to assess the structural needs of the engine.
Test cell testing was used to develop the engine calibration and controls algorithms required to
hit the project goals. Test cell testing showed that engine efficiency results for this platform were
excellent and exceeded 42% brake thermal efficiency. Feasibility to achieve ARB 2010 criteria
emissions levels were also demonstrated using the engine dynamometer. Controls for the
stop/start system were fine tuned in the test cell to quickly and properly restart the engine as well
as control the alternator charging rate to take full advantage of engine decelaration events for
energy recovery to the batteries.
With the engine and stop/start system controls defined and tuned during the test cell testing
phase, a full vehicle was built up to begin testing the integrated powertrain in a real application.
Chassis dynamometer testing was conducted first to get a consistent comparison against current
gasoline and diesel powertrains using the same vehicle characteristics. Freightliner Custom
Chassis Corporation donated a gasoline MT45 Step Van to use for the baseline testing. This
vehicle then had the powertrain removed to allow for install of the E85 powertrain and perform
fuel economy and CO2 emissions testing on the same vehicle. Federal Express loaned a diesel
powered vehicle of very similar specifications to use for baseline comparison in the same test
environment. The results of this chassis dynamometer testing showed that across 4 different
vehicle weights reflective of class 4-6 vehicles and on 4 different drive cycles, the E85 powertrain
had similar fuel economy to the gasoline vehicle and similar fuel cost to the diesel power vehicle.
Achieving similar fuel economy to the gasoline vehicle was a remarkable accomplishment given
the fact that E85 has 30% less energy than gasoline per gallon of fuel. The chassis dynamometer
testing was also used to quantify the level of CO2 emissions reduction for the E85 powertrain,

10
and showed that the project goal of at least 50% reduction could be achieved. In fact a 75-80%
CO2 reduction was possible relative to the baseline powertrains when cellulosic ethanol was used
for the E85 blend.
Finally, a real world vehicle demonstration was conducted for 6 weeks in the Sacramento area.
The vehicle was run on an urban route running through downtown and a rural route out through
the countryside. These two routes help to bound the fuel economy potential of this powertrain,
and to show that both the engine and stop/start system are fit for these types of applications. The
vehicle was run with a GVW of approximately 14,000 lbs and confirmed the fuel economy results
achived on the chassis dynamometer are representative of real world operation.
This project demonstrated that it is possible to design a cost effective E85 platform than can
achieve the performance required for class 4-6 medium duty vehicles and provide significant CO2
reduction relative to the current powertrains available in this market. Future work should be
undertaken to further demonstrate this technology through customer field test as well as
increased market available of the fuel through adoption of more E85 fueling stations.

11
CHAPTER 1: Project Purpose and Approach
Project Purpose 1.1
The most prolific alternative fuel used in motor vehicles today is ethanol. While millions of
passenger cars are capable of using high blends of ethanol (so called “flex-fuel” vehicles) no full-
production medium-duty or heavy-duty vehicles have this capability. Cummins believes an
optimized E85 engine can be highly competitive on a total cost of ownership basis and deliver
over 50% CO2 emissions reduction relative to current production medium duty gasoline and
diesel powertrains. The goal of this agreement is to design and demonstrate a 2.8L E85
powertrain concept for medium-duty truck operation. The integrated system will be capable of
meeting California criteria emission levels within the time frame of the agreement and deliver
significant CO2 emissions reduction. The results of this project will establish a technology
development path for scalability for medium-heavy-duty vehicles.
Approach 1.2
The approach to this project includes developing a high power density E85 optimized combustion
system which takes full adavantage of the fuel properties to maximize the efficiency of the engine.
It also includes integrating a stop/start system with the engine and transmission such that the
engine can be shut down during idle events to minimize fuel consumption at vehicle stop events.
Cummins worked through a development path that included determining the powertrain
requirements through competitive benchmarking and system modeling work. This component
identified high level engine requirements such as power, torque, cylinder pressure, and the
displacement range that would be best suited to provide this performance. When the
displacement range was identified, it was discovered that it would be possible to partner with
another Cummins and DOE project at a suitable displacement node to leverage some lower cost
components during the design phase. The ATLAS project which was then ongoing had set out
to design a 2.8L diesel engine which had similar cylinder pressure and speed range requirements
as this project. With requirements defined, the Ultra-low Carbon Powertrain project, or the
ETHOS project as refered to internally at Cummins, entered the design phase along with the
ATLAS design team.
While hardware was being procured for the test cell engine build, controls algorithms were
rapidly be developed in the prototype space using bench testing and specific rig development.
These algorithms were then carried over to the test cell for further refinement on engine.
A test cell engine was built up to develop the engine calibration required to operate this high
efficiency engine. Steady state testing was done initially to develop the calibration response
surface. This surface was then used for further fine tuning of the controls algorithms to achieve
the desired transient response and emissions performance. Once proper emissions control was

12
demonstrated, the stop/start system components were added to the test cell engine to fine tune
their integration and operation algorithms.
While test cell testing and development of the E85 engine was ongoing, Cummins used and
available production diesel vehicle to develop the stop/start algorithms needed for this project.
Both the diesel engine and the E85 engine are controlled by the same Cummins Electronic Control
Module so the algorithms could be developed in the diesel enviornoment and then applied almost
directly to the E85 engine.
Finally a demonstration vehicle was put together with the full E85 powertrain. This
demonstration vehicle was used for chassis dynaomometer testing to compare to similar gasoline
and diesel baseline vehicles. It was then used for a real world demonstration in Sacramento to
confirm that the chassis dynamometer results would translate to real world results.

13
CHAPTER 2: Activies and Results
Activities 2.1
Engine System Modeling and Analysis 2.1.1
This document is formatted in the way that the final report should be formatted. Make sure to
use the same formatting in the final report.
Task Objective
The objective of this is to determine the major subsystem specifications for an optimized E85
engine targeted at the medium duty step-van market. The output of this task is a detailed
technical profile and specific engine architecture that will be used to guide the design effort in
Task 3.
Target Application and Maximum Torque and Power Requirements
This demonstration program is focused on the medium duty step-van pick-up and delivery
application. Vehicles are available for this application with gross vehicle weight ratings from 14K
to 24K pounds covering from Class 4 through Class 6.
These vehicles are sold with both gasoline and diesel engine variants today. The torque and
power curves that represent the most common diesel and gasoline options are shown in Figure 1
and Figure 2 below. As you can see in the figures, there is a significant difference in the
performance of these two engines although they serve the same market. This is primarily due to
the fact that the engines used in step -van applications also serve other applications which may
mean that they are not optimized for this particular application. Cummins collected voice of the
customer (VOC) data to determine what engine requirements would be optimal based on their
needs. Through this process, we learned that customers would prefer an engine that has a peak
torque of 440 pound-feet and a rated power of 250 horsepower, as shown by the target lines in
Figure 1 and Figure 2.

14
Figure 1: Gasoline and Diesel Torque Curves w/ E85 Target Peak Torque
Figure 2: Gasoline and Diesel Power Curves w/ E85 Target Rated Power
These targets require a peak torque and rated power that are both between that of current diesel
and gasoline options.
Optimal Engine Displacement to Meet the Performance Requirements
The goal is to select an engine displacement that will meet the peak torque and rated power
requirements while remaining efficient at the operating conditions typically seen by the
application. Medium duty step-van applications have the potential to burn a significant fraction
200
250
300
350
400
450
500
550
600
500 1500 2500 3500 4500 5500
Engi
ne T
orqu
e (lb
-ft)
Engine Speed (rpm)
Gasoline
Diesel
E85 Target
0.0
50.0
100.0
150.0
200.0
250.0
300.0
350.0
500 1500 2500 3500 4500 5500
Engi
ne P
ower
(hp)
Engine Speed (rpm)
Gasoline
Diesel
E85 Target
Source: Cummins
Source: Cummins

15
of fuel at high loads making it important to maintain efficiency up to and including the torque
curve.
To enable the highest efficiency possible, it is typically desirable to select the smallest
displacement possible. This concept is called ‘down-sizing’. To enable ‘down-sizing’ for the
optimized E85 engine, a turbocharger will be utilized to increase torque and power capability for
a given engine displacement. For a turbocharged E85 fueled engine, there are two primary factors
that limit engine efficiency along the torque curve. The first limiting factor is engine knock and
this is what limits maximum torque at low speeds (<2500 rpm).
Engine knock is when fuel auto-ignites causing a rapid rise in cylinder pressure which is
detrimental to engine durability. The goal is to design a combustion system that can run as
efficient as possible without inducing engine knock at low speeds. There are three primary levers
that that can be optimized to achieve this goal:
Compression Ratio – Optimal range for an E85 optimized engine is 12:1 to 14:1
Combustion phasing (spark ignition timing) – Desire to maintain optimal phasing
(advanced)
Intake boost – Increased boost increases torque but also increases the likelihood of knock.
For an E85 engine, the three levers can be optimized in multiple ways to create a scatter-band
defining the optimal area where an E85 engine’s torque curve can operate most efficiently at low
speeds.
The second limiting factor is turbine inlet temperature. As power increases, more energy is going
into the exhaust which raises turbine inlet temperatures. This becomes an issue at higher speeds
(>2500 rpm). There are two primary levers that can be used to address turbine inlet temperature
issues:
Use fuel enrichment – This technique would result in a significant fuel consumption
penalty and would make the exhaust after-treatment ineffective.
Reduce engine power – This technique selects the maximum torque at a given speed
achievable at the temperature limit without fuel enrichment.
For medium duty applications, fuel consumption and emissions along the torque curve are
critical so the only viable option is to reduce engine power. Because we must determine the
optimum displacement of the engine, we should consider a range of loads in terms of brake mean
effect pressure (BMEP). BMEP is a measure of load (torque) that is normalized by engine
displacement. Figure 3 depicts the range of possible maximum BMEP as a function of engine
speed for an E85 engine. The ‘bend’ in the BMEP scatter-band at higher speeds is due to power
reduction to maintain turbine inlet temperatures within the design limit.

16
Figure 3: BMEP Scatter-band
Because there are both peak torque and rated requirements, both can influence the engine
displacement that is selected. First, the optimal displacement to achieve peak torque will be
considered. Second, the optimal displacement determined for peak torque will be checked to
determine if the rated power requirement can be meet with that same displacement.
Peak (Maximum) Torque
It is desirable to achieve the torque peak in the engine speed range of 1300rpm to 1600rpm for
medium duty applications. This engine speed range is ideal because it minimizes engine friction
and provides for improved vehicle drivability (via good transient response). Torque peak speeds
of less than 1300rpm (for further friction reduction) are typically not practical for two reasons.
First, high torque at speeds less than 1300rpm increases vehicle drive-train vibration to a level
not acceptable to customers (drivers). Second, it is often cost prohibitive to match an air-handling
solution (turbocharger, etc.) that can deliver the required air-flow to achieve high torque at speeds
less than 1300rpm while still being capable of delivering rated power at higher speeds.
For this application, we are targeting a torque peak speed of 1400rpm which provides a good
compromise between friction reduction and air-handling hardware (which will be discussed in a
later section). By combining the BMEP scatter-band bounds at 1400rpm (from Figure 3) with a
range of displacements, a curve of displacement versus torque can be computed, as shown in
Figure 4 below.
14
16
18
20
22
24
26
28
30
32
34
800 1300 1800 2300 2800 3300 3800 4300
Bra
ke M
ean
Eff
ect
ive
Pre
ssu
re (
bar
)
Engine Speed (rpm)
Average BMEP
Source: Cummins

17
Figure 4: Maximum Torque vs. Displacement
Figure 5: Maximum Power vs. Engine Speed
0
100
200
300
400
500
600
700
800
900
1 1.3 1.6 1.9 2.2 2.5 2.8 3.1 3.4 3.7 4 4.3 4.6 4.9
Engi
ne
To
rqu
e (
po
un
d-f
ee
t)
Engine Displacement (L)
Lower BMEP Scatter-band Bound
Upper BMEP Scatter-band Bound
Maximum Torque Requirement
0
50
100
150
200
250
300
350
400
1400 1900 2400 2900 3400 3900 4400 4900
Engi
ne
Po
we
r (h
ors
ep
ow
er)
Engine Speed (rpm)
2.6L Displacement
3.2L Displacement
Max Power Reqt.
Max Speed Line
3850rpm
2750rpm
Source: Cummins
Source: Cummins

18
This analysis shows that a displacement between 2.6 to 3.2 liters is optimal to meet the 440 pound-
foot at 1400rpm peak torque requirement while maintaining high engine efficiency.
Rated (Maximum) Power:
With the optimal displacement for peak torque defined, the analysis should be turned to
evaluating the rated power requirement. Using the average BMEP line in Figure 3, the power
curves for the two extremes of engine displacement (2.6L and 3.2L) range can be calculated as
shown in Figure 5.
For this range of engine displacements, the rated power can be allowed to occur at speeds up to
4200rpm. This speed range limit is based on hardware limitations that occur when designing an
engine capable of high torque at low engine speeds and high cylinder pressures. As can be seen
in the figure above, both engines can meet the rated power target at a speed less than the
maximum speed range allowed for the engine.
This analysis shows that both the maximum torque and power requirements can both be met by
an engine with a range of displacements from 2.6 to 3.2L. For the optimized E85 engine, a
displacement of 2.8L was selected to enable commonality with a clean sheet engine design that is
currently active at Cummins as part of a US Department of Energy program. Because many of
the design criteria for an optimized E85 engine match those of an optimal diesel engine, there are
several advantages of basing the optimized E85 engine on a diesel platform. This base engine
sharing will be discussed in more detail in the following two sections.
2.8L E85 Engine Comparison to Currently Available Engines:
Figure 6 and Figure 7compare the maximum BMEP (torque normalized by displacement) and
power densities (power normalized by displacement) of the optimized E85 engine to the currently
available diesel and gasoline options.

19
Figure 6: Maximum BMEP Comparison
Figure 7: Power Density Comparison
The 2.8L optimized E85 engine has a significantly higher maximum BMEP and power density
when compared to the diesel and gasoline engine options. It is important to note that the power
density increase compared to the gasoline engine could be higher. However, the E85 engine is
targeting a lower maximum power based on customer requirements which results in a smaller
power density increase. In summary, these results show that the E85 engine is significantly
0
5
10
15
20
25
30
6.7L Diesel 2.8L Opt. E85 6.0L Gasoline
Max
imu
m B
MEP
(b
ar)
2 X 2.5 X
0
10
20
30
40
50
60
70
80
90
100
6.7L Diesel 2.8L Opt. E85 6.0L Gasoline
Po
we
r D
en
sity
(h
p/L
) 2.7 X 1.8 X
Source: Cummins
Source: Cummins

20
‘downsized’ which enables the greatest reduction in green house emissions possible while still
meeting engine performance requirements.
Engine Architecture Similarities between a Diesel and Optimized E85 Engine
As we evaluate all of the similarities between a diesel and an optimized E85 engine with respect
to medium duty applications two primary similarities stand out:
Maximum Cylinder Pressure Requirement
The cylinder pressure requirements for a diesel and E85 engine are similar in the range of 175-
200 bar. This pressure range is significantly higher than state-of-the-art gasoline engines that
have a pressure capability of 90-130 bar. Without the increased pressure capability, it would be
challenging to realize the efficiency potential possible with E85 fuel.
Durability
Because both the diesel and optimized E85 engine are designed for the medium duty market, they
are designed to meet the durability requirements. Gasoline engines that are used in the medium
duty market are typically not designed for the same durability. With the gasoline engines used
in the medium duty market today, it is common for one or two engine re-powers to be required
before the end of the vehicle’s useful life.
For these reasons, it is advantageous to use an architecture that is more similar to a state-of-the-
art diesel engine than a modern gasoline engine as the base for an optimized E85 engine. This
why this program is partnering with US DOE sponsored 2.8L clean sheet diesel engine program
at Cummins for base engine design. With an engine displacement of 2.8L, the following are the
torque peak and rated power targets:
Table 1: 2.8L Optimized E85 Engine Torque Peak and Rated Power Targets
Speed (rpm) BMEP (bar) Torque (lb-ft) Power (hp)
Torque Peak 1400 26.8 440 126
Rated Power 3200 24.9 410 250
The speed at which rated power is achieved was selected based on selecting a BMEP in the middle
of the scatter-band and selecting the speed at which this BMEP would achieve the maximum
power target.
Additional Synergies Associated with using the Diesel Platform
As discussed earlier, the optimized E85 engine will be based on a 2.8L diesel engine. This engine
is a clean sheet design being developed as part of a US Department of Energy demonstration
program. Many of the key technologies necessary to meet the engine performance requirements
to be met are common between the diesel and optimized E85 engine variants:
Source: Cummins

21
Cast aluminum cylinder head – For the diesel variant, aluminum is used for weight reduction.
For the E85 variant, there is an additional advantage to using cast aluminum in place of cast iron.
Aluminum improves heat transfer in the combustion face surface which reduces the propensity
for knock. While increased heat transfer by itself reduces efficiency, the optimization of
compression ratio and combustion timing enabled by the reduced likelihood of knock outweigh
the heat transfer losses resulting in a net gain in efficiency.
Cast aluminum block with steel cylinder liner inserts – The aluminum block construction
significantly reduces weight while the steel cylinder liner inserts maintain the durability
requirements of the medium duty market.
Cylinder pressure capability – The common crank-train and power cylinder design is capable of
supporting peak cylinder pressures up to 200bar.
Dual overhead cam valve-train – Will be utilized to implement variable valve timing
independently on both the intake and exhaust cams for the optimized E85 engine. This allows
for improved torque via increased cylinder burned exhaust scavenging at low speeds and
minimized pumping losses through-out the entire operating map. Can also be used during
transient operation to improve torque response.
Weight optimized design – The engine is designed to be a light-weight platform through the use
of lightweight materials (such as the aluminum block) and optimal design of components. The
optimized E85 engine will be approximately 700 pounds lighter than the 6.7L diesel engine option
which contributes to this program’s overall reduction in vehicle green house gas emissions for
the target duty cycle.
While many of the requirements of the diesel and E85 engine are common, there are requirements
that are not. By developing this new engine with both diesel and E85 combustion requirements
being considered at the same time, it is possible to protect the common elements of the design for
features that need to be different for each variant to achieve optimal performance and efficiency.
Components Optimized Specifically for the E85 Engine
While many of the components are common between the diesel and E85 variants of this engine,
there are several components and design requirements that are unique to the E85 version.
High Pressure E85 Direct Injection Fuel System
This engine will utilize direct injection of E85 fuel into the cylinder. By injecting the fuel directly
into the cylinder, full advantage of the high charge cooling capability of ethanol fuel can be
realized. The charge cooling of E85 is significantly greater than gasoline due to the higher latent
heat of vaporization. This charge cooling reduces in cylinder temperatures which in turn
mitigates engine knock. This charge cooling effect is required to achieving the BMEP scatter-
band shown in Figure 3. The specifications for the fuel system are:
Common rail injection system with 200 bar maximum injection pressure.
A high flow capacity high pressure fuel pump.
22
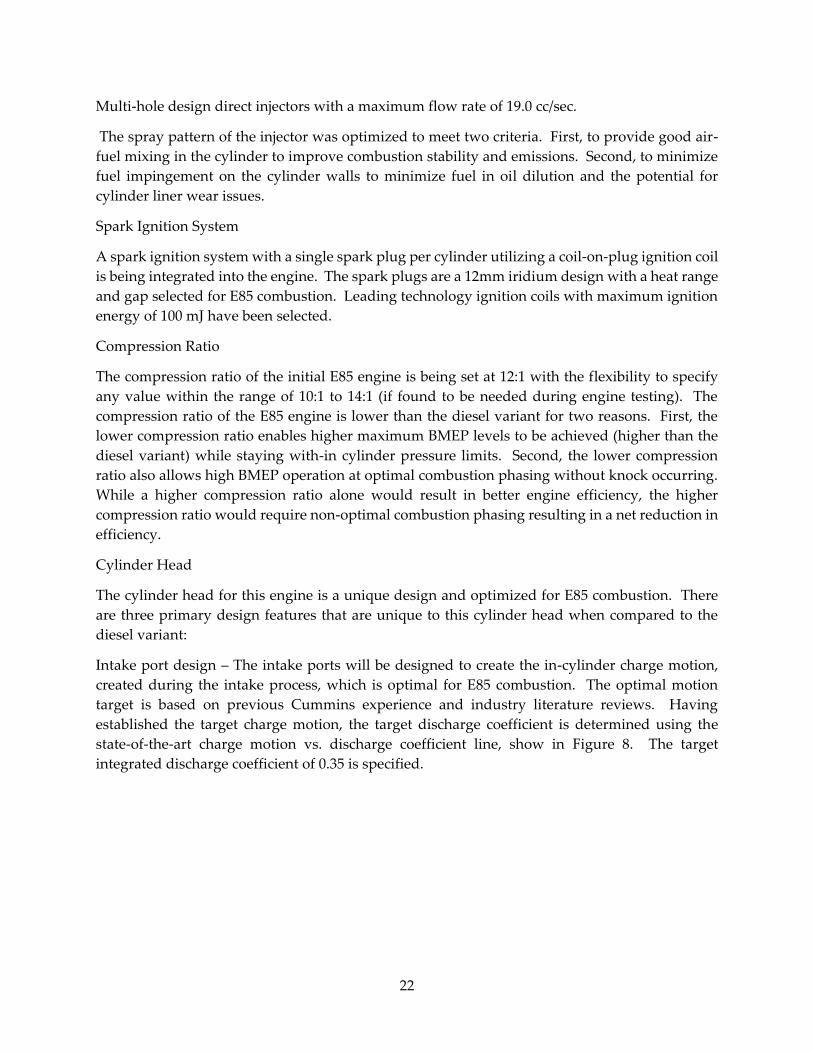
Multi-hole design direct injectors with a maximum flow rate of 19.0 cc/sec.
The spray pattern of the injector was optimized to meet two criteria. First, to provide good air-
fuel mixing in the cylinder to improve combustion stability and emissions. Second, to minimize
fuel impingement on the cylinder walls to minimize fuel in oil dilution and the potential for
cylinder liner wear issues.
Spark Ignition System
A spark ignition system with a single spark plug per cylinder utilizing a coil-on-plug ignition coil
is being integrated into the engine. The spark plugs are a 12mm iridium design with a heat range
and gap selected for E85 combustion. Leading technology ignition coils with maximum ignition
energy of 100 mJ have been selected.
Compression Ratio
The compression ratio of the initial E85 engine is being set at 12:1 with the flexibility to specify
any value within the range of 10:1 to 14:1 (if found to be needed during engine testing). The
compression ratio of the E85 engine is lower than the diesel variant for two reasons. First, the
lower compression ratio enables higher maximum BMEP levels to be achieved (higher than the
diesel variant) while staying with-in cylinder pressure limits. Second, the lower compression
ratio also allows high BMEP operation at optimal combustion phasing without knock occurring.
While a higher compression ratio alone would result in better engine efficiency, the higher
compression ratio would require non-optimal combustion phasing resulting in a net reduction in
efficiency.
Cylinder Head
The cylinder head for this engine is a unique design and optimized for E85 combustion. There
are three primary design features that are unique to this cylinder head when compared to the
diesel variant:
Intake port design – The intake ports will be designed to create the in-cylinder charge motion,
created during the intake process, which is optimal for E85 combustion. The optimal motion
target is based on previous Cummins experience and industry literature reviews. Having
established the target charge motion, the target discharge coefficient is determined using the
state-of-the-art charge motion vs. discharge coefficient line, show in Figure 8. The target
integrated discharge coefficient of 0.35 is specified.

23
Figure 8: Charge Motion vs. Flow Capacity for Various Intake Port Designs
Fuel injector mounting –the E85 direct injector is located with the nozzle located in a pocket
within the combustion phase surface between the two intake ports (i.e. side or laterally mounted).
This location was selected to meet injector cooling requirements within component packaging
constraints.
Center mounted spark plug – The cylinder head is being designed to accommodate a center
mounted spark plug. A 12mm plug is specified and the water cooling jacket is optimized to
provide proper cooling to mitigate spark plug “hot-spots” that can lead to engine knock.
Piston
The piston for the E85 optimized engine will also be constructed of aluminum for improved heat
transfer for the same reasons as the cylinder head. The piston bowl geometry is optimized to
achieve the 12:1 compression ratio target while maintaining the desired in-cylinder charge motion
during the compression process.
Stoichiometric Combustion with 3-Way Catalyst
The combustion system of this engine is designed for stoichiometric operation over the entire
engine operating map, including the torque curve. ARB 2010 heavy duty emissions requirements
will be met using three way catalyst (TWC) technology. The after-treatment will consist of both
a close-coupled unit mounted on the turbocharger outlet and a chassis mounted unit under the
vehicle body. This arrangement provides the best compromise between system efficiency and
packaging constraints. Cummins is working with a catalyst supplier to optimize the catalyst
wash-coat for this application.
Flo
w C
oe
ffic
ien
t
Charge Motion
Incr
easi
ng
Flo
w C
apac
ity
Increasing Charge Motion
State-of-the-Art Line
Source: Cummins

24
While it is true that increased efficiency may be possible by implementing a dual mode
combustion system (lean at light loads, stoichiometric at high loads), the project decided not to
pursue this path due to the increased level of catalyst technology development required to meet
the 2010 ARB emissions targets. However, since dual mode combustion application represents
additional improvements in CO2 emissions, Cummins considers this an excellent candidate for a
future follow on program.
Target Torque Curve – Optimized E85 Engine
Having established the turbocharger match and valve lift profiles, the GT-Power model was used
to determine the maximum torque that can be achieved at speeds less than 1500rpm. Figure 9
shows the results of this analysis.
It is worth noting that the torque of the E85 engine at speeds less than 1100rpm is significantly
less than both the gasoline and diesel engines currently used in this application. For this
application, single turbo was selected instead of a more complicated two-turbocharger or
turbocharger-supercharger configuration to minimize engine cost. With a single turbo,
compromises are required at low engine speeds limiting the available boost which in turn limits
the maximum torque possible. With limited boost, torque becomes a function of engine
displacement and with the E85 engine having less than half the displacement of the other two
engines it will always be at a disadvantage.
Figure 9: E85 Target Torque Curve
However, the capability to deliver high torque at speeds less than 1100 rpm is only an advantage
in applications that use manual transmissions to provide increased clutch engagement torque for
easier vehicle launches (i.e. with more torque you don’t have to be as ‘gentle’ with the clutch
pedal to launch the vehicle). For medium duty step-van applications, automatic transmissions
are the majority of the market share. The majority (well over 70%) of the vehicles sold into the
150
200
250
300
350
400
450
500
550
600
300 800 1300 1800 2300 2800 3300 3800 4300 4800 5300
Engi
ne
To
rqu
e (
lb-f
t)
Engine Speed (rpm)
6.0LGasoline
6.7L Diesel
2.8L E85 Target
Source: Cummins
25
medium duty step-van market are equipped with automatic transmissions. Because of this, the
E85 engine demonstration vehicle will also be equipped with an automatic transmission. With
an automatic transmission low speed torque is not required because the torque converter curve
does not allow the engine to operate at these conditions even if the engine is capable of it, as
shown in Figure 9.
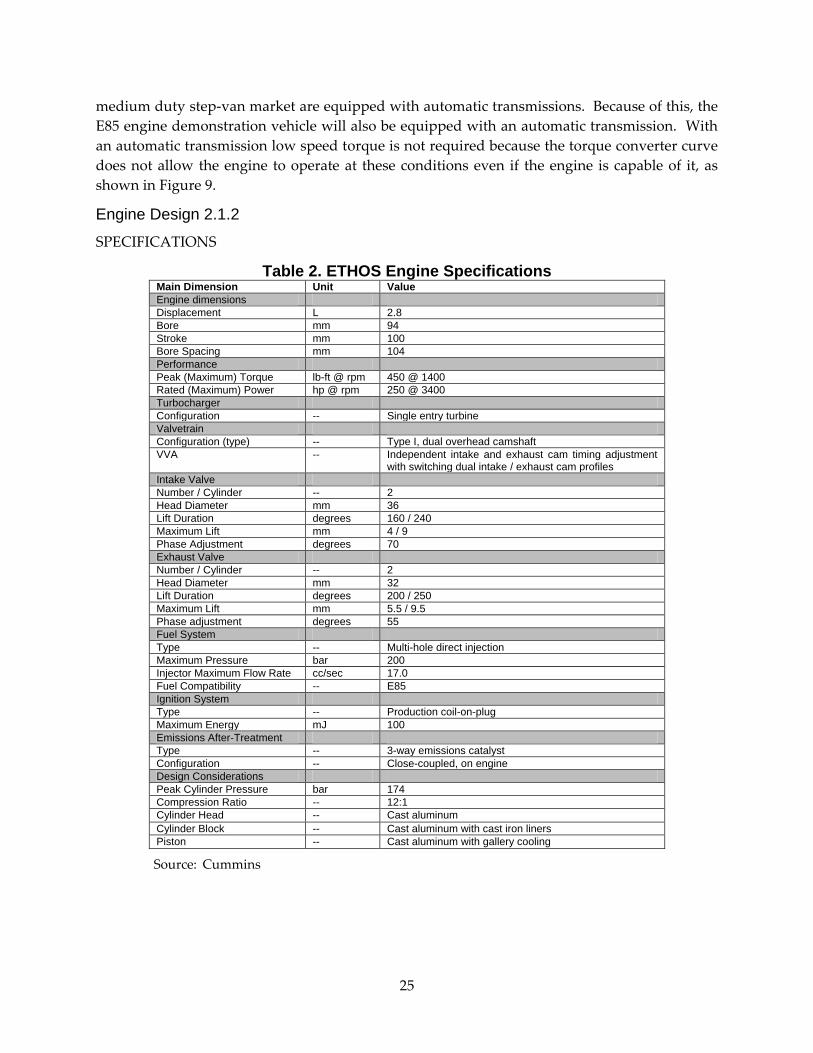
Engine Design 2.1.2
SPECIFICATIONS
Table 2. ETHOS Engine Specifications Main Dimension Unit Value
Engine dimensions
Displacement L 2.8
Bore mm 94
Stroke mm 100
Bore Spacing mm 104
Performance
Peak (Maximum) Torque lb-ft @ rpm 450 @ 1400
Rated (Maximum) Power hp @ rpm 250 @ 3400
Turbocharger
Configuration -- Single entry turbine
Valvetrain
Configuration (type) -- Type I, dual overhead camshaft
VVA -- Independent intake and exhaust cam timing adjustment with switching dual intake / exhaust cam profiles
Intake Valve
Number / Cylinder -- 2
Head Diameter mm 36
Lift Duration degrees 160 / 240
Maximum Lift mm 4 / 9
Phase Adjustment degrees 70
Exhaust Valve
Number / Cylinder -- 2
Head Diameter mm 32
Lift Duration degrees 200 / 250
Maximum Lift mm 5.5 / 9.5
Phase adjustment degrees 55
Fuel System
Type -- Multi-hole direct injection
Maximum Pressure bar 200
Injector Maximum Flow Rate cc/sec 17.0
Fuel Compatibility -- E85
Ignition System
Type -- Production coil-on-plug
Maximum Energy mJ 100
Emissions After-Treatment
Type -- 3-way emissions catalyst
Configuration -- Close-coupled, on engine
Design Considerations
Peak Cylinder Pressure bar 174
Compression Ratio -- 12:1
Cylinder Head -- Cast aluminum
Cylinder Block -- Cast aluminum with cast iron liners
Piston -- Cast aluminum with gallery cooling
Source: Cummins
26
COMPONENTS OPTIMIZED SPECIFICALLY FOR THE E85 ENGINE
High Pressure E85 Direct Injection Fuel System
The engine is equipped with a direct injection system capable of 200 bar injection pressure
coupled with multi-hole injectors with a maximum flow rate of 17.0 cc/sec. The spray pattern of
the injector is optimized to provide homogeneous mixing of the charge, minimize liner wall
wetting, and to eliminate any interference with open intake valves. By injecting the fuel directly
into the cylinder, full advantage of the high charge cooling capability of ethanol fuel is realized.
The charge cooling of E85 is significantly greater than gasoline due to the higher latent heat of
vaporization and the increased fuel mass required to deliver an equivalent amount of energy.
This charge cooling reduces in-cylinder temperatures which in turn mitigates engine knock.
Spark Ignition System
The ignition includes a single spark plug per cylinder utilizing a coil-on-plug configuration. The
spark plugs are a 12mm iridium design with a heat range and gap selected for low temperature
E85 combustion. A cold heat range spark plug was selected for two reasons. Since E85 does not
produce as much soot and smoke, spark plug fouling was not an issue running colder heat range
plugs. Also E85 is more susceptible to pre-ignition caused by hot plug temperatures. Using a
colder plug helps mitigate this path of pre-ignition on the engine. The spark plug gap was preset
by the manufacturer. The cylinder head is designed to accommodate a center mounted spark
plug. A “full wrap” water cooling jacket is optimized to provide proper cooling to mitigate spark
plug hot-spots that can lead to knock or ethanol pre-ignition.
Compression Ratio
Compression ratio (CR) of 12:1 is chosen based on 1-D modeling and simulation results. 12:1 CR
coupled with high boosting achieves 27 bar BMEP at 1400 RPM while keeping spark advance
close to MBT timing and within peak cylinder pressure limits.
A higher compression ratio alone would result in improved engine efficiency but the higher
compression ratio would require non-optimal combustion phasing which could result in a net
reduction in efficiency. For a downsized medium duty application which will spend a significant
amount of time on the torque curve, best efficiency is achieved when a lower than maximum
compression ratio is used such that torque curve combustion phasing is still near MBT timing.
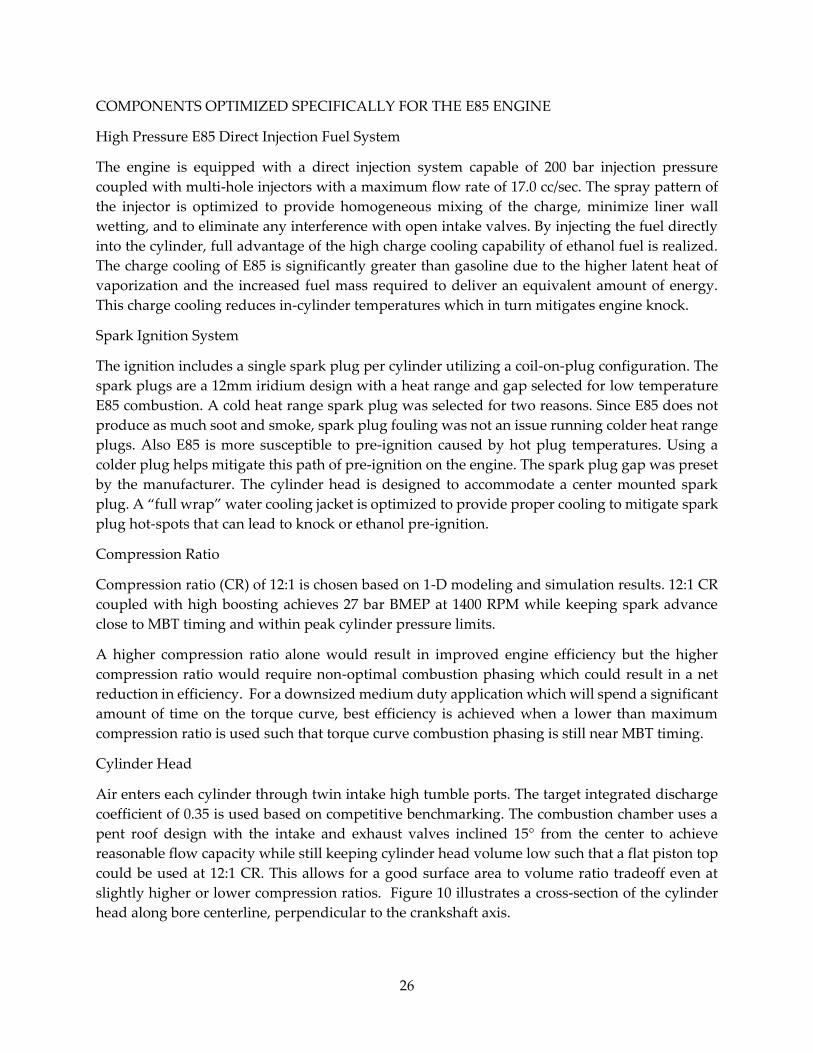
Cylinder Head
Air enters each cylinder through twin intake high tumble ports. The target integrated discharge
coefficient of 0.35 is used based on competitive benchmarking. The combustion chamber uses a
pent roof design with the intake and exhaust valves inclined 15° from the center to achieve
reasonable flow capacity while still keeping cylinder head volume low such that a flat piston top
could be used at 12:1 CR. This allows for a good surface area to volume ratio tradeoff even at
slightly higher or lower compression ratios. Figure 10 illustrates a cross-section of the cylinder
head along bore centerline, perpendicular to the crankshaft axis.

27
Figure 10: Pent Roof Design with Spark Plug, Injector and Valve Location
Fuel Injector Mounting – The E85 direct injector is located between and below the two intake
ports (i.e. side or laterally mounted). This location was selected to meet injector cooling
requirements within component packaging constraints. A recess is provided in the combustion
chamber surface at the injector nozzle tip for adequate clearance to the fuel spray pattern.
Variable Valve Timing and Actuation – A Type I (i.e. direct acting bucket tappet) valve train is
used in conjuction with dual overhead camshafts. This enables a state of the art VVA system
capable of independent valve phasing for intake and exhaust valves. The bucket tappets are also
configured to enable the use of two different valve lift profiles for the intake and exhaust valves.
Electronicly actuatated hyrdraulics are used to control the various valve train functions using
engine oil as the working fluid.
Piston
Gallery cooled cast aluminum pistons are used for maximum knock mitigation at high loads and
high cylinder pressures. A flat top piston with valve pocketing for all 4 valves to allow for nearly
6mm of valve opening at TDC is used which enables high valve overlap operation with minimal
surface area increase. A steel top ring carrier is employed to allow for continued operation at
high cylinder pressure with minimal top ring groove wear.
Stoichiometric Combustion with 3-Way CatalystThis combustion system is designed for
stoichiometric operation over the entire engine operating map, including the torque curve. The
exhaust catalyst system consists of a close-coupled unit, engine-mounted on the turbocharger
outlet.
Engine Contols 2.1.3
The engine control hardware consists of two Electronic Control Modules (ECM) and a suite of
sensors and actuators which communicate with the control units. The majority of the control
functions reside in ECM-A, while ECM-B provides expanded I/O required for some of the
additional functions unique for this engine such as variable valve timing. The modules
communicate bi-directionally via a CAN link.
Source: Cummins

28
Figure 11: Control Module Architecture
Numerous sensors and actuators are used for controlling the engine, identified in Figure 12. An
air flow sensor provides a direct measure of air at the entrance to the air box. Various pressure
and temperature sensors are used to estimate air flow at points along the air flow pathway and
are particularly useful in transient conditions such as when the engine is accelerating. These
sensors provide feedback to the control module for controlling air flow and fuel quantity for
proper combustion. The primary means of controlling air flow into the engine is the intake
throttle which is electronically actuated via motor control. A secondary airflow control means is
through the mechanical waste gate on the turbocharger. The waste gate is not electronically
controlled but actuates mechanically as a function of boost pressure. The waste gate opening
sequence was chosen to achieve the desired torque curve and transient response for this project.
Figure 12: Sensors and Actuators
CA
N
ECM-A
ECM-B
Sensors/Actuators
Sensors/Actuators
Rail Pressure
Manifold Temperature & Pressure
Mass Air Flow
Temperature
& Pressure
Compressor
Bypass Valve
Intake
Throttle
Fuel Pump
Ignition Coils Cam Profile
Selection
Solenoids
Phaser Control Valves
O2 Sensors
Source: Cummins
Source: Cummins

29
The variable valve system on the engine consists of dual, independent cam phasers with two
shuttle valves to regulate hydraulic pressure to the phaser actuators. Hall-effect position sensors
(not shown) located in proximity to the cams are used to measure the angle of the cams relative
to the crank shaft angle. The engine is also equipped with two discrete cam profiles (both intake
and exhaust) which are toggled using a hydraulic circuit regulated by the four solenoids on top
of the engine. This level of cam shaft control over the engine breathing characteristics allows for
reduced CO2 emissions relative to the lower cost fixed cam timing strategy.
The fuel system consists of four direct, in-cylinder fuel injectors (not shown), and a high pressure
pump which delivers fuel to a high pressure accumulator or “rail”. A pressure sensor mounted
on the rail provides feedback to the control module which is used to regulate to the desired
pressure using an electronically controlled valve on the pump. Fuel pressure is controlled to
achieve optimum fuel droplet size and air/fuel charge homogeneity while minimizing the power
consumption of the fuel delivery system.
The ignition system consists of four coil-on-plug units which are independently controlled by the
control modules by commanding variable dwell times synchronous with engine rotation to ignite
the respective cylinder fuel/air mixture at the desired time. A high energy ignition system with
a breakdown voltage limit of 40kV was chosen due to the increased cylinder pressure at which
this high compression engine will operate. This allows for improved ignitability of the dense
air/fuel charge providing smoother engine operation.
The exhaust system is equipped with two O2 sensors, which provides feedback to the control
modules for maintaining the desired air-to-fuel ratio for optimal combustion and high conversion
efficiency through the catalyst.
Stop/Start System Controls 2.1.4
The start/stop architecture for this program includes proven technology integrated with
proprietary controls to offer a cost competitive solution for fuel consumption and carbon
emissions reduction. This system provides excellent value with a payback period acceptable to
customers using vehicles in classes 4-6 to allow for good market acceptance of this system. A
schematic of the Start/Stop system architecture is found in Figure 13.

30
Figure 13: Start/Stop System Architecture for E85 Engine System
Ideally, a stop/start system allows the engine to shut down at every idle event. In order to
accomplish this goal, the batteries must be maintained at a specific level of charge such that
vehicle electrical loads can be supplied while the engine is shut down and there is enough battery
charge to crank the engine for a restart at the end of the shutdown event. The role of the alternator
in this system is to maintain the state of battery charge such that the maximum amount of engine
off operation can be achieved and the vehicle electrical accessories can always be powered.
A conventional alternator achieves the function of keeping the batteries charged by always
maintaining a voltage output slightly higher than the battery voltage. The conventional alternator
has no concern for engine operation; it only provides some level of charge to the batteries at all
time. The smart alternator being used for this project provides an intelligent charging strategy.
The smart alternator is a small cost increase above a conventional alternator but allows the engine
computer to control the output voltage of the alternator to increase or decrease the battery charge
rate. The alternator integrated into this system can be varied from a 10V output (no charging of
the batteries) to a 16V output (more rapid charging of the batteries). By applying software control
algorithms to the alternator charging strategy, increased fuel economy can be achieved.
Two prime mechanisms of intelligent alternator control have been applied to this project. The
first is to manage the battery/alternator system so as to allow regenerative energy capture during
deceleration events such as braking and/or coasting. This allows the system to recapture some of
the vehicle kinetic energy normally going to the vehicle brakes during the deceleration and
Source: Cummins

31
applying the energy to the batteries. The second application of intelligent control is to manage
the battery/alternator system load during engine propulsion mode.
The engine shutdown logic is used to shut down the engine during as many idling opportunities
as possible when the batteries are charged enough to allow for a shutdown. The engine will restart
when the driver releases the brake pedal to begin accelerating the vehicle or when the batteries
become discharged to a level that requires a restart. If the batteries are excessively discharged,
the life of the batteries may become degraded or a restart of the engine may be impossible.
Additional shut down logic is included to prevent the engine from shutting down if the driver is
performing a maneuver such as creeping up to a stop sign in a line of cars such that the
inconvenience of a rapid series of shut down and start up events is not encountered.
Test Cell Testing 2.1.5
A test cell engine was built up according to the design specifications presented earlier and
installed in the test cell to start performance development. A rapid prototype control system was
used initially to control the engine and test out the control algorithms. The control was ultimately
turned over to the same ECM configuration presented earlier and also planned to be used in the
vehicle.

32
Figure 14: E85 Engine and Stop/Start System Intalled in Test Cell
Three (3) sizes of single entry turbochargers were specified for this configuration to allow for
determining of the best match to the engine hardware. Certain difficult-to-model parameters
affect turbocharger sizing such as evaporation rate for ethanol in this type of combustion system.
Since the fuel is injected through a direct injection (DI) injector into the cylinder during the intake
stroke, the ease with which air enters the cylinder is also affected. This effect interacts with the
turbocharger system by changing the intake manifold pressure required for a particular speed
and load condition. The three turbochargers were tested on the engine configuration to obtain the
best turbocharger match to the requirements of the target torque curve. This turbocharger was
used to perform fuel mapping and optimization exercises which demonstrated it is a good match
across the speed and load range of interest.
Due to the modeling uncertainty around the turbocharger matching, turbochargers made from
readily available materials were specified for this matching work to minimize the cost spent on
hardware which would not ultimately be used for the final engine configuration. Upon
Source: Cummins

33
completion of the turbo matching exercise, the appropriate high temperature capable
turbocharger was ordered to allow for stoichiometric engine operation at high power.
A high energy ignition system was incorporated into this engine configuration due to the
challenge of igniting a very dense air-fuel charge at high cylinder pressure due to the 12:1
compression ratio. This ignition system choice has proved to be very reliable on the test engine
and gives good performance results. One challenge encountered during this testing phase is the
very low pre-ignition temperature of ethanol fuels. Typical spark plugs for gasoline applications
are designed to operate with a tip temperature around 800 deg Celsius to avoid carbon fouling
on the electrodes and resulting misfire events. Ethanol has a pre-ignition temperature threshold
which is much below 800 deg Celsius. The pre-ignition phenomenon where the air-fuel charge is
ignited before the spark event is particularly prominent at the lower engine speeds and high loads
of this high specific power platform. Cummins has worked with an ignition system supplier to
specify spark plugs which minimize the occurrence of pre-ignition at these conditions to allow
for attainment of the target torque curve.
A significant lever for producing good engine efficiency on this project has been the integration
of an efficient turbocharger with a cylinder head that exhibits excellent gas flow characteristics.
Using a turbocharger capable of higher temperatures than a diesel turbocharger typical to this
medium duty application allows for good exhaust energy recovery at low turbine inlet pressure.
In this situation with high turbocharger inlet temperature and low required boost pressure due
to the high volumetric efficiency of the combustion system design, some of the waste heat can be
recovered from the exhaust and used to push the piston down during the intake stroke. This is
contrary to many turbocharged or naturally aspirated engine designs which require the piston to
pull air into the cylinder. Figure 15 shows an example cylinder pressure trace taken near torque
peak speed and moderate load which shows a very good pumping loop where turbine inlet
pressure is much lower than intake manifold pressure. This higher intake manifold pressure
pushing the piston down during the intake stroke improves engine efficiency at high load.

34
Figure 15: Torque Peak Log-P Log-V Diagram
Mule Vehicle Development 2.1.6
In order to meet the delivery timeline for this project, it was not possible to wait on a functioning
E85 engine to begin component testing and controls development for the stop/start system. The
project team decided to use a production Freightliner M2 vehicle owned by Cummins and
powered by a Cummins ISB 6.7L diesel engine. Since the stop/start system for the E85 engine
was planned to be controlled by the Cummins Engine Control Module (ECM), the ISB engine was
a good fit already being controlled by a similar ECM. This allowed nearly all the controls
algorithms and software developed for stop/start on the diesel engine to be carried over directly
and implemented in the ECM for the E85 engine.
Source: Cummins

35
Figure 16: Stop/Start Mule Development Truck
The mule truck showing in Figure 16 used identical stop/start components except for the engine
starter which had to be larger than the E85 engine to accommodate the starting requirements of
the diesel engine. A standard production starter for this engine was used for stop/start
development purposes. The mule vehicle was used to develop the communication strategy and
controls for the starter, smart alternator, battery sensors, and transmission interface. This vehicle
allowed for stop/start development to be completed and ready to implement on the E85 engine
when the E85 demonstration vehicle was first assembled.
Vehicle Integration 2.1.7
Under Task 5.1 of the Statement of Work Cummins completed the vehicle selection, powertrain
layout in the vehicle, and the design work required for integration of the powertrain into the
vehicle. The goal of this project is to demonstrate this “Ultra-low Carbon Powertrain” in a
medium duty step van type vehicle which is commonly used in pickup and delivery type
applications. Cummins worked with Freightliner Custom Chassis Corporation (FCCC), who is a
well known chassis supplier for this type of vehicle, to procure a vehicle suitable for this project
development and demonstration. FCCC has provided an MT45 chassis with a Morgan Olson
body which can be seen in
Figure 17. The MT45 chassis can be loaded to 19.5K lbs to allow development work at the average
vehicle weight for classes 4-6.
Source: Cummins

36
Figure 17: Demonstration Vehicle
FCCC was also willing to provide models of the frame rails, cab area extending into the engine
bay, and work with Cummins to understand integration requirements for the various vehicle
subsystems. These integration requirements were used to size several of the Front End Accessory
Drive (FEAD) components which are mounted on the engine but used to supply various vehicle
subsystem needs. The sizing of these components affects the belt routing and design as well as
the space claim for the front end of the engine. The FEAD components include the air
conditioning compressor, alternator, power steering pump, water pump, and fan drive. The
completed FEAD layout can be seen in Figure 18.
Figure 18: “Ultra-Low Carbon Powertrain” FEAD Layout
The FEAD layout in Figure 18 appears to have 3 belts in the graphic. There is only 1 belt used to
drive the FEAD but this view of multiple belts is used to show the expected belt deflection in
Source: Cummins
Source: Morgan Olson

37
operation due to the torsional vibration of the crankshaft. This view is used to ensure the belt
does not cause wear on any unintended components when it moves outside the nominal belt
path.
The agreed budget for this project was minimized by using common components with the DOE
funded light-duty diesel project, ATLAS, when possible. This alignment is favorable due to the
cylinder pressure requirements of this E85 engine lining up very well with the diesel engine
cylinder pressure requirements, thereby reducing the development expense for many engine
components. However, one place where the commonality DOE and CEC funded programs has
added a challenge is in the fan hub location. The current fan hub location was chosen because it
centers the fan in the ATLAS demonstration vehicle. When the same fan hub location is placed
into this program’s demonstration vehicle, the fan does not line up optimally with the vehicle
cooling package as shown in the left picture of Figure 19.
It is not easy to change the fan hub location on the engine because it is integrated into the water
pump location which is integral to the block water passages. The method chosen to address this
issue was to use electric cooling fans on the demonstration vehicle as can be seen in the right
picture of Figure 19. This allows additional flexibility in the battery management strategy for the
start/stop system integration.
Figure 19: Vehicle Cooling Package Front View
In addition to changing the fan location on the engine and fan type in the vehicle, the power
steering pump needed design consideration for this application. The block was designed with
mounting of the ATLAS light-duty vehicle power steering pump, prior to this program’s vehicle
selection. This Class 4-6 demonstration vehicle requires a much larger power steering pump
because the vehicle weight is much higher than the ATLAS vehicle, and the power steering pump
will additionally be used to supply brake assist pressure for the braking system. Modification of
the mounting bracket to fit the larger power steering pump and relocation to a lower position on
the engine was required for this application.
There are four primary “fluid” connections for running the engine which must be connected to
and supplied from the vehicle. These are the air, coolant, fuel and exhaust systems. The
connections for these three systems were designed to integrate with this demonstration vehicle
and can be seen in Figure 20 which depicts the completed engine. The left picture in Figure 20
Source: Cummins

38
also shows the oil and fuel filter locations which have been designed for easy access in the vehicle
by locating them on top of the engine.
Figure 20: Isometric Right and Left Side Views of the Engine
Transmission integration to the engine required design of an adapter plate to mate the engine
integrated flywheel housing with the bell housing of the transmission. The engine block design
incorporates a flywheel housing cast into the back end of the block. This flywheel housing was
designed to integrate with the transmission used in the ATLAS vehicle, and requiring only a small
spacer, roughly one inch in length, to join the engine to transmission for the heavier class vehicle.
This integration can be seen in Figure 21. Somewhat visible in Figure 21 is the significant amount
of downsizing represented by this E85 engine. The engine is only marginally larger than the
transmission which could not be downsized due to the high torque and power curves provided
by this engine design.
Figure 21: Right and Left Side Views of the Powertrain Package
With the fluid connection locations defined on the engine and the transmission fitted to the
engine, the powertrain could now be located in the frame rails to start making connections to
these rails, to the cooling package, and to the other various systems. These various systems and
connections can be seen in Figure 22 and Figure 23.
Source: Cummins
Source: Cummins

39
Custom hoses were designed for all the fluid connections as shown. Engine side mounts from the
ATLAS vehicle can be used but frame side engine mounts were required to be designed from
scratch for this application. The transmission mounts and driveshaft length also had to be
designed specifically for this application. The fuel lines from the baseline gasoline vehicle will be
used with minor modifications. The fuel tank, low pressure fuel pump, and evaporative
emissions system remains located over the rear axle of the vehicle as it is in the baseline
configuration.
Figure 22: Isometric Right and Left Side Views of the Powertrain Package Installed in the Frame Rails
The powertrain package had to be located slightly further forward in the vehicle than ideally
desired due to interference from the driver foot well of the vehicle cab. The gasoline baseline
engine typical in this configuration has a central air intake system which does not interfere with
the vehicle foot well. With this 4 cylinder configuration, the intake manifold is on the driver’s
side of the engine and there is little clearance between the air inlet to the intake manifold and the
foot well. This forced the engine forward of the desired location, but did not drive any additional
design changes.
Source: Cummins

40
Figure 23: Top View of the Powertrain Package Installed in the Frame Rails
The exhaust connection from the engine to the vehicle was designed to connect in a similar
location to the gasoline baseline engine location. The small engine size allowed for a much closer
coupling of the aftertreatment to the engine than in the base gasoline vehicle configuration. This
allows for improved emissions reduction potential during the cold start emissions testing. A short
extension pipe is used to connect the exhaust outlet on the engine to the vehicle piping which
replaces the section of exhaust where two catalysts were required for the V8 gasoline baseline.
The air inlet plumbing for the engine was designed using the air filter box from a Ram 2500
pickup due to Cummins familiarity with this system. The air box houses the mass air flow meter
for incoming fresh air sensing. The accuracy of this sensor is very important for proper engine air
fuel ratio control. This sensing strategy is also very sensitive to air box mounting, type and
configuration. Using the Ram air filter box provides excellent accuracy of the mass airflow
sensing system for this program based upon the previous development of that system for
production application.
Results 2.2
Steady State Engine Efficiency 2.2.1
Steady state engine mapping was completed using the previously described hardware
and the high temperature capable best fit turbocharger. This turbocharger achieved the
full target torque curve while maintaining acceptable turbocharger inlet temperature
without fuel enrichment. The work completed while demonstrating the full torque curve
showed that fuel economy, combustion performance, and engine stability were excellent
Source: Cummins

41
over the entire engine map. Figure 24 shows the target torque curve with a few of the test
cell demonstration data points. The engine is able to operate with no spark retard and at
optimum combustion phasing at rated power due to the knock resistant engine design
and fuel properties. The engine efficiency targets established for this project have been
exceeded by the running engine over the majority of the engine operating space.
Figure 24: Comparison of Target and Demonstrated 2.8L Torque Curve
While the engine thermal efficiency results are excellent and generally much better than
the gasoline engine available in the class 4-6 market, the fuel properties cannot be
ignored. The low lower heating value of ethanol still requires a higher volumetric fuel
burn rate with the good engine efficiency. Of prime concern to a vehicle owner is what
the cost to operate the vehicle on ethanol would be relative to a similar vehicle being
operated on gasoline.
Figure 27 shows a comparison of the January 2014 fuel costs for the Sacramento area
between gasoline and E85. Even though the cost of E85 is lower than the cost of gasoline,
it’s still 12% more expensive on an energy basis.
0
100
200
300
400
500
600
600 1000 1400 1800 2200 2600 3000 3400 3800
Torq
ue
(lb
-ft)
Engine Speed (RPM)
Target Torque Curve
Demonstrated Capability
No Enrichment Required on E85
2.8L Target Torque Curve With Development Data
Source: Cummins

42
Figure 25: 2.8L Engine Fuel Map Brake Thermal Effiiciency
28303030323232
34 3434
3636 36
38
3838
3840 40
40
Speed (RPM)
To
rqu
e (
Nm
)
42.3%41.3%
39.9%
1000 1500 2000 2500 3000 3500
100
200
300
400
500
600
700ETHOS Torque Curve
Source: Cummins

43
Figure 26: 2.8L Engine Fuel Map 50% Mass Fraction Burned Location (Crank Angle Degrees)
Figure 27: Fuel price comparison for E85 and gasoline in the Sacramento area for January 2014
Source: Cummins
Source: Cummins

44
To assess the “Ultra-Low Carbon Powertrain” efficiency, Cummins compared our
obtained E85 results with published data from a state-of-the-art Gasoline Turbocharged
Direct Injection engine. Figure 28 has also had the numbers adjusted to account for the
fuel cost difference between E85 and gasoline. All E85 engine efficiency values were
reduced by 12% and then compared to the gasoline engine efficiency values. A positive
number in the figure represents the percent improvement of the E85 engine efficiency
over the gasoline engine efficiency.
Figure 28: Fuel Cost Improvement Percentage of the E85 Engine Compared to a State of the Art Gasoline Turbocharged Direct Injection Engine Accounting for a
12% Higher Cost E85 Energy Content
At low engine load values, the low engine friction capability of the gasoline engine as
well as the optimized designs present in the market today make it very difficult to exceed
the gasoline engine’s efficiency by 12% using the optimized E85 engine. The high
cylinder pressure requirements of an optimized E85 engine are a penalty in this lower
load region. However, this is also an area where the fuel burn rate of either engine is low
and a highly downsized engine such as this is unlikely to spend much time in the area of
the map where there is a negative improvement relative to the gasoline engine. It is worth
noting that the fuel price delta for California appears to be higher than many other areas
of the country. Some areas of the country are even reporting E85 pricing to be at parity
with gasoline pricing on an energy basis, which would further improve the fuel cost of
this platform in those areas of the country.
Source: Cummins

45
At medium and high engine load values, the optimized E85 engine efficiency exceeds the
efficiency of the gasoline engine by 12% or significantly more in large regions of the
operating space. The knock resistant engine design along with the favorable fuel
properties for E85 allow for the good results in this area. The intended market for this
engine has been the class 4-6 vehicle where the driver of such a vehicle will regularly
operate the engine at high loads. By achieving a favorable efficiency relative to the
gasoline engine at high loads where the volumetric fuel burn rate is high, the efficiency
benefit of this engine platform will be readily apparent to a vehicle driver or fleet owner.
This is all achieved while still delivering a better vehicle acceleration performance than
the gasoline engines currently available in this market.
Transient Test Cell Results 2.2.2
The test cell setup described in task 2.2.1 includes the E85 optimized engine, stop/start
components, and a motoring dynamometer to allow for transient cycle testing. The stop/start
components included in this testing were the 12V smart alternator, two 12V AGM batteries,
battery sensors to determine the battery state, a 12V engine mounted starter, and a load bank to
simulate the vehicle electrical loads applied to the batteries. Transient drive cycle testing was
conducted to simulate a 20,000 lb step van driving specific routes. The fuel burned during the
cycle was measured and totaled for each cycle to determine the vehicle fuel economy for each
cycle.
10 vehicle routes were used during the modeling phase to assess the fuel economy benefits of the
stop/start system. 2 of those same vehicle routes were repeated in the test cell to validate the fuel
economy improvement of the real system. The HTUF Pickup and Delivery (P&D) Route and
Route 5 shown in Figure 29 and Figure 30 were used as they represent a variety of P&D drive
cycles. Route 5 is an internal route from a Cummins field test data logger which has characteristics
found to represent a worst case type of P&D cycle in terms of fuel burned at idle. As can be
observed in Figure 29, Route 5 has a very high amount of idle time measured in either idle time
as a percentage of the total time or as idle time in seconds of idle per mile of driving. Cummins
believes this represents the entitlement for a stop/start system if all of the idle time on a route
such as this can be replaced with engine off operation. The actual amount of idle time that could
be eliminated is a function of the electrical load on the batteries during the engine off time, the
size of the battery pack, and the charging rate during the driving period of the cycle. For the
demonstration vehicle being used for this project, Cummins was able to achieve idle off operation
during all of this idle time so the route was simulated as such in the test cell. This represents best
case fuel economy improvement for a stop/start system on this route.

46
Figure 29: Drive Cycle Route Metrics Used to Simulate and Test Fuel Economy Results for P&D Operation
Figure 30: Drive Cycle Route Metrics Used to Simulate and Test Fuel Economy Results for P&D Operation
The test cell testing focused on validating the improvements which came from smart alternator
controls as well as reduced idle time through engine shut down. These two features were
evaluated independently and together to measure drive cycle fuel economy improvement. Fuel
economy performance was collected as a baseline for each of the two routes. The baseline drive
cycle has no idle shutdown events and includes the vehicle electrical load as well as conventional
alternator control. A conventional alternator control strategy was simulated using the smart
alternator hardware for the baseline cycle so that hardware switching was not required to
alternate from the conventional to smart alternator control strategies. Conventional alternator
control was simulated by setting the smart alternator hardware to target a system voltage of 13.5V
for the entire cycle which is equivalent to the control approach of a conventional alternator.
The engine shutdown events were originally intended to shut the engine down and then start
back up using the engine mounted starter. It was found that this operation of starting the engine
which was mechanically connected to a dynamometer imposed a much higher starting load on
the starter than what would occur in the vehicle. This imposed an unusual load on the batteries
and caused the starter to overheat easily. The cycle was then switched to simulate engine
shutdown events by allowing the dynamometer to hold the engine to idle speed with the fuel
turned off to the engine and the alternator charging disabled. The post processing work for each
cycle then included adding in an additional amount of fuel which represents the fuel used to get
the engine up to idle speed after each engine restart. This was a small amount of fuel but it was
2.7%
54.7%
33.8%
17.2%
50.9%
24.1%27.8%
61.8%
34.7%26.7%
2.3%9.1% 13.2% 9.2%
18.2%12.4%
17.4%
19.2%
12.4% 11.8%
16.8
11.2 19.0
33.0
81.5
28.2
84.4
49.5
29.720.4
-20
0
20
40
60
80
0%
10%
20%
30%
40%
50%
60%
70%
Route 1 Route 2 Route 3 HTUF Route 5 Route 6 Route 7 Route 8 Route 9 Route 10
Idle
Tim
e p
er
Mil
e
(s/m
ile
)
Du
ty C
ycle
(%
)
Idle / Stop (%)
Idle / Total (%)
Idle per mile (s/mile)
Source: Cummins
Source: Cummins

47
necessary for characterizing the fuel economy improvements associated with stop/start
operation.
The translation of the steady state fuel economy results to a route representing an actual
customer drive cycle has been done using the Hybrid Truck Users Forum (HTUF) Pickup
and Delivery (P&D) cycle. This route represents a low speed city delivery type drive
cycle common for delivery applications in the Class 4-6 market. As Figure 31 depicts the
majority of the cycle occurs below 30 MPH. The HTUF route has been setup in the test
cell to mimic the speed and load the engine would see when powering a 20,000 lb vehicle
driving this route. As the majority of this drive cycle is below 30 MPH the transmission
torque converter losses for an automatic transmission factor heavily into the fuel
economy results.
Figure 31: Hybrid Truck Users Forum Pickup and Delivery Test Cycle
Running our optimized E85 engine on the HTUF cycle resulted in a 9% mile per gallon
fuel penalty compared to the gasoline engine common in this market. This means that
the engine achieved 15-20% higher efficiency on E85 than the comparable gasoline engine
in this market.
Criteria Emissions Feasibility 2.2.3
Emissions performance was assessed using the Heavy Duty “OTTO” Cycle on the engine test
stand by measuring NOx, CO, and NMHC emissions. A fully warmed engine was operated to
fine tune air to fuel ratio control over the cycle as well as to screen several catalysts for best
performance. Figure 32 shows the “OTTO” cycle relative to the full torque curve for the 2.8L
0.0
10.0
20.0
30.0
40.0
50.0
60.0
0 500 1000 1500 2000 2500 3000 3500 4000 4500
Ve
hic
le S
pe
ed
(mp
h)
Time (sec)
Hybrid Truck Users Forum Pickup and Delivery Cycle
Source: Cummins

48
engine. An air-to-fuel ratio target equal to the stoichiometric ratio was used for the entire engine
operating space to achieve the best emissions performance. Using the optimum catalyst
emissions performance below the regulated limits was achieved for all measured emissions
constituents. Figure 33 shows the NOx emissions over the cycle. Emissions are generally near
zero except during a few events in the cycle where further air-to-fuel ratio control work could
improve the results further. As can be seen by the cumulative NOx emissions line, these few
areas of control challenges generate nearly all the emissions over the cycle. The cumulative NOx
axis is zoomed to show the opportunities for improvement in emissions control, however the total
emissions results are currently well below the regulated limits. Cold and Hot Heavy Duty
“OTTO” cycles were run to generate a composite emissions test with the selected catalyst
formulation. All system out emissions were below the 2010 ARB emissions limits for this non-
certified test cell measurement. The application of 3-way catalysts to this ethanol optimized
system achieves superior emissions results.
Figure 32: Heavy Duty “OTTO” Cycle Operating Points for the 2.8L E85 Torque Curve
0
50
100
150
200
250
300
350
400
450
500
700 1000 1300 1600 1900 2200 2500 2800 3100 3400 3700
Torq
ue
(lb
-ft)
Engine Speed (RPM)
2.8L Target Torque Curve With FTP Otto Cycle Data
Target Trq Curve
FTP Otto Cycle
Source: Cummins

49
Figure 33: Hot Cycle NOx Emissions Using E85 Fuel
Chassis Roll Fuel Economy 2.2.4
Vehicle testing was conducted on a chassis dynamometer at the Center for Automotive Research
at Ohio State University. Coast down coefficients were determined at the Transportation
Research Center such that the rolling and aerodynamic characteristics of the step van could be set
on the chassis dynamometer to match the real characteristics of the vehicle. The gasoline version
of the step van was used to determine the vehicle characteristics. This same vehicle was then
used for baseline gasoline testing prior to removal of the gasoline powertrain and installation of
the integrated system developed under this program. A diesel version of the same step van was
provided for evaluation by Federal Express so that diesel baseline fuel economy and emissions
data could be collected.
To cover the full class 4 – 6 vehicle weight range, simulated vehicle weights of 15k, 17.5k, 20k,
and 23k lbs were run on the dynamometer. Four vehicle drive cycles were selected for evaluation
at most of the weights covering Pickup and Delivery (P&D) and highway drive cycles. The EPA
Federal Test Procedure (FTP-75), Highway Fuel Economy Test (HFET), Hybrid Truck Users
Forum Pickup and Delivery (HTUF P&D), and a Cummins Pickup and Delivery cycle were used
to represent real world driving cycles. Several repeats at each vehicle mass and drive cycle were
collected to ensure consistent results.
0
0.2
0.4
0.6
0.8
1
1.2
1.4
0
200
400
600
800
1000
1200
1400
1600
1800
2000
0 200 400 600 800 1000 1200
NO
x (p
pm
)
Time (Seconds)
ETHOS Hot FTP NOx Emissions
NOx Concentration Cumulative NOxN
Ox C
um
ulative
(grams)
Source: Cummins

50
The stop/start system was included for all cycle operation on the E85 powertrain. Neither the
diesel nor the gasoline baseline systems included stop/start operation as this option is not
available for either of these applications. On the baseline systems the engine idles when the
vehicle speed is 0 MPH except for key-off events in the HTUF P&D cycle. The key-off events in
the HTUF P&D cycle were used to represent longer idle events where a conscientious driver
would already be turning off the engine to make a package delivery for instance. Both the
baseline and stop/start capable systems were shut down during the key-off period. The E85
powertrain with stop/start would shut down during all 0 MPH vehicle speed events except
during the start of the FTP cycle where engine coolant temperature had not reached the threshold
to allow stop/start activity. During stop/start events the key switch is left in the “run” position
such that vehicle electrical loads are draining the batteries. If left in this state long enough, the
engine would restart due to low battery level. There were no engine-off periods of sufficient
length in the tested cycles to cause the engine to restart for low battery level.
Figure 34: Federal Test Procedure 75 Cycle Definition
0
10
20
30
40
50
60
70
0 200 400 600 800 1000 1200 1400 1600 1800 2000 2200 2400 2600
Ve
hic
le S
pe
ed
(mp
h)
time (sec)
FTP 75, 3-Bag
10 min soakBag 1, 505 sec Bag 3, 505 secBag 2, 865 sec
Source: Cummins

51
Figure 35: Highway Fuel Economy Test Cycle Definition
Figure 36: Hybrid Truck Users Forum Pickup & Delivery Cycle Definition
The project goal for CO2 emissions is a 50% reduction relative to current powertrains on a well
to wheel basis. The project goal for fuel economy was to achieve a level that would allow for
0
10
20
30
40
50
60
70
0 100 200 300 400 500 600 700 800
Ve
hic
le S
pe
ed
(mp
h)
Time (sec)
HFET Cycle Definition
0
0.2
0.4
0.6
0.8
1
1.2
0.0
10.0
20.0
30.0
40.0
50.0
60.0
0 500 1000 1500 2000 2500 3000 3500 4000 4500
Engi
ne
Off
Fla
g (1
= T
rue
)
Ve
hic
le S
pe
ed
(mp
h)
Time (sec)
HTUF P&D Cycle Definition
Vehicle Speed
Engine Off Flag
Engine should be turned-off via keyswitch by vehicle operator when Engine Off Flag is True
Source: Cummins
Source: Cummins

52
good market adoption of the E85 powertrain. This means that the fuel cost should be competitive
to the powertrains currently in the market when the fuel economy and fuel cost are looked at
together. This target was rolled up in a $/mile measure and compared to the baseline powertrains.
CO2 emissions results measured during vehicle dynamometer testing represent a partial
accounting along the full well to wheel path. The measured CO2 emissions are a result of the
elemental carbon contained in the fuel being combusted and oxidized to CO2. Table 3 shows the
elemental carbon emissions contained in the various fuels being represented in this testing. The
elemental carbon values are very similar for the various fuels. The values for Corn Ethanol and
Cellulosic Ethanol from Farmed Trees represent the pure ethanol values for both elemental
carbon and well to tank carbon. When 15% California reformulated gasoline was added to these
values the following two rows are generated for an E85 blend. To calculate the full well to wheel
CO2 emissions that can be compared for CO2 reduction, the tank to wheel CO2 emissions
collected on the dynamometer must be adjusted by the following formula:
Well to wheels CO2 = (g/mile CO2 as measured)* (Elemental Carbon / Well to Tank Carbon)
This means that the measured CO2 while running on the dynamometer only accounts for the
elemental carbon contained in the fuel and not the fully burdened fuel pathway. For instance,
measured emissions from running the gasoline fuel vehicle would need to be increased by
roughly 36% to account for all the carbon emission coming from the processing and
transportation of diesel fuel allowing it to be available at the pump.
Table 3: Fuel Pathway Carbon Values for Various Fuels
Fuel
Elemental
Carbon
Well to Tank
Carbon
g CO2/ MJ g CO2/ MJ
California Reformulated Gasoline 72.90 98.95
California Ultra-Low Sulfur Diesel 74.10 98.03
Corn Ethanol 71.02 65.66
Cellulosic Ethanol from Farmed Trees 71.02 21.40
California E85 - Corn 71.34 70.65
California E85 - Farmed Trees 71.34 33.03
Source: Cummins

53
Figure 37: CO2 Emissions Reduction for E85 Powertrain Relative to Alternate Powertrains Using the Farmed Trees Ethanol Pathway
Figure 38: CO2 Emissions Reduction for E85 Powertrain Relative to Alternate Powertrains Using the Corn Ethanol Pathway
-100.0-95.0-90.0-85.0-80.0-75.0-70.0-65.0-60.0-55.0-50.0-45.0-40.0-35.0-30.0-25.0-20.0-15.0-10.0
-5.00.0
FTP HFET HTUF P&DCummins
P&D
%C
han
ge in
CO
2
CO2 Emissions Reduction With 17.5k GVWFarmed Trees Ethanol Pathway
Diesel Gasoline
-100.0-95.0-90.0-85.0-80.0-75.0-70.0-65.0-60.0-55.0-50.0-45.0-40.0-35.0-30.0-25.0-20.0-15.0-10.0
-5.00.0
FTP HFET HTUF P&DCummins
P&D
%C
han
ge in
CO
2
CO2 Emissions Reduction With 17.5k GVWCorn Ethanol Pathway
Diesel Gasoline
Source: Cummins
Source: Cummins

54
Figure 37 and Figure 38 show the well to wheel CO2 comparisons for the E85 powertrain to the
baseline systems assuming a farmed trees pathway in Figure 37 and a corn pathway in Figure 38.
This comparison was made at a 17.5k lb GVW which falls in the middle of Class 5. When
comparing the CO2 emissions of the E85 powertrain to the diesel baseline, 70-75% emissions
reduction is seen across the various drive cycles assuming farmed trees ethanol and 35-45%
reduction assuming corn ethanol. When comparing the CO2 emissions of the E85 powertrain to
the gasoline baseline, 75-80% emissions reduction is seen across the various drive cycles assuming
farmed trees ethanol and 50-57% reduction assuming corn ethanol. These results significantly
exceed the project target of 50% CO2 reduction on cellulosic ethanol in an E85 blend. These
results also show that nearly 50% CO2 reduction is possible even when considering the corn
based ethanol path which is currently the primary path for ethanol in the market.
Although it is unreasonable to expect simliar fuel economy to the diesel powertrain considering
the diesel engine has both good efficiency and a fuel with a very high energy content per gallon,
indeed the mile per gallon results for the diesel powertrain exceed both the converted gasoline
and E85 engine in all cycles. The fuel economy comparison of the three powertrains at 17.5k lbs
GVW can be seen in Figure 39. Figure 39 error bars are plus and minus three sigma of cycle
results. Cummins is pleased to share that even though E85 has approixmately 30% less energy
per gallon than gasoline, fuel economy of the E85 powertrain is equal or better than a
conventional V8 engine. To compute the fuel cost Cummins assumed values of $4.40/gallon,
$3.80/gallon, and $3.19/gallon for diesel, gasoline, and E85 respectively. The E85 powertrain was
able to achieve equivalent fuel cost in $/mile compared to the diesel engine and noticeably better
operating cost compared to the gasoline engine as seen in Figure 40.

55
Figure 39: Fuel Economy Results for All Three Powertrains Tested at 17.5k lbs GVW
Figure 40: Fuel Cost Results for All Three Powertrains Tested at 17.5k lbs GVW
0.0
1.0
2.0
3.0
4.0
5.0
6.0
7.0
8.0
9.0
10.0
11.0
12.0
13.0
FTP HFET HTUF P&D Cummins P&D
Fu
el E
con
om
y (
MP
G)
Drive Cycle Fuel Economy With 17.5k GVW Step Van
Diesel Gasoline E85
0.00
0.05
0.10
0.15
0.20
0.25
0.30
0.35
0.40
0.45
0.50
0.55
0.60
0.65
0.70
0.75
FTP HFET HTUF P&D Cummins P&D
Op
era
tin
g C
ost
($/m
ile)
Drive Cycle Operating Cost With 17.5k GVW Step Van
Diesel Gasoline E85
Source: Cummins
Source: Cummins

56
Vehicle Demonstration 2.2.5
The wrap-up of the Ultra-Low Carbon Powertrain project was a full vehicle demonstration to
verify the performance of the system in the real world and show publicly the system developed
through this project. The demonstration was conducted in the Sacramento area with a Gross
Vehicle Weight (GVW) of 13,700 lbs. The empty weight of this vehicle was ~9000 lbs such that
the additional weight would be slightly more than a typical delivery weight for this type of
package delivery vehicle. This weight would be very typical for a highly loaded Class 4 vehicle
or a partially loaded Class 5 vehicle. The weight reduction of the powertrain of nearly 700 lbs
relative to the diesel powertrain translates directly to lower vehicle weight in real world
operation.
Two routes were defined for the vehicle demonstration phase. An urban route which runs past
the Capitol building and through downtown was selected to represent in town drive cycles. This
route has a very high number of vehicle stop events and has a low average vehicle speed. A rural
route was also selected which runs up through the city of Woodland to represent a rural delivery
route. This route has a higher average vehicle speed and includes a lower number of stops. These
two routes help span the normal expected operation for typical class 4 and 5 delivery vehicles as
well as highlighting the benefits of stop/start in delivery drive cycles.
Figure 41 and Figure 42 show the urban and rural routes respectively. 2000 miles were driven
total during the 6 week vehicle on-road demonstration. The urban route averaged 7.1 MPG while
the rural route averaged 8.0 MPG. These fuel economy results align well with the chassis roll fuel
economy results and the lower vehicle weight run for the on-road demonstration. The urban
route covered 23 miles with a typical vehicle speed between 20 and 30 MPH. This route averaged
over 40 stops per hour with around 14% of the drive time spent at stop. The rural route covered
48 miles with a typical vehicle speed between 40 and 50 MPH. This route averaged nearly 10
stops per hour with only 5% of the drive time spent at stop. These cycle metrics fall within the
range of the 10 cycles used to investigate the fuel economy potential of a stop/start system during
the development phase of this project.

57
Figure 41: Urban On-Road Vehicle Demonstration Route
Figure 42: Rural On-Road Vehicle Demonstration Route
Source: Cummins
Source: Cummins

58
Figure 43: ”Ultra-Low Carbon Powertrain” Demonstration Vehicle
Source: Cummins

59
CHAPTER 3: Advancements and Success
Advancements in Science and Technology 3.1
The major goal for this project was to deliver a 50% CO2 reduction on a well-to-wheels basis for
the E85 powertrain compared to current competitive options, while keeping the projected cost
good enough to achieve good market penetration with this powertrain concept. This CO2
reduction goal has been greatly exceeded using cellulosic based bio-fuels. Unfortunately, these
fuels are not yet commercially available although this powertrain technology now exists to make
good use of these fuels when they become available. While the goal of this project was CO2
reduction on cellulosic biofuels, the powertrain efficiency was good enough that the results are
still very interesting when using current production corn based ethanol.
While many of the components used to achieve this level of powertrain efficiency are not
technological developments associated with this project, the combustion system design and
arrangement of available components exhibited a step forward in technological capability. The
combustion system achieved over 42% brake thermal efficiency which is excellent for
stoichiometric spark ignited combustion. This allows for the use of a 3-way catalyst which allows
for a lower system cost than a diesel engine which would typically achieve this level of efficiency.
This low system cost can allow for good market penetration of this powertrain with diesel like
efficiency and torque curve, but gasoline like NVH properties. The power density achieved on
this engine is significantly greater than currently available in this market. This project achieved
90 hp/L where current offerings are typically less than 60 hp/L.
The stop/start system developed and implemented on this project is novel and a technological
step forward for this market due to the adaptation of a heavy duty automatic transmission.
Stop/start systems currently available in other medium duty markets are currently limited to
manual transmissions, but manual transmission powertrains are not common in the North
American medium duty market space.
Public Assessment of Success and Benefits 3.2
Cummins proposed and conducted the grant program by conceiving and developing multiple
technologies for greenhouse gase reduction in the context of medium duty truck application. The
program focused on the integrated design of these technologies for maximum CO2 benefit. Part
of the program involved Cummins putting the vehicle on the road in California as a
demonstration of the technology and to begin assessing market interest in this path of low carbon
powertrain development. Furthermore Cummins has made public announcements with planned
presentations on the primary program results as an additional method to raise awareness of the
benefits demonstated under the program. Additonal briefings with regulatory agenices are also
scheduled to provide updates on the program successes and to inform additional stakeholders.
However, at the time of preparing this final report, it is not yet clear if this technology path will
gain market acceptance for higher volume penetration. Therefore, Cummins endevours to project

60
the larger benefits potentially available from wide spread adoption of this technology. Additioal
benefits are potentially available by scaling this technology and augmenting it which will also be
discussed.
The class 4-6 medium duty truck market in North America is roughly 90,000 units per year. This
powertrain was designed and demonstrated capable to power these units and offer a cost and
performance competitive powertrain option for this vehicle space. If these units average 20,000
miles per year with 2/3 of these vehicles currently being diesel achieving 7.9 MPG and the other
1/3 being gasoline achieving 5.5 MPG, approximately 150 Million gallons of diesel fuel
consumption and 110 Million gallons of gasoline consumption could be avoided. Complete
change over of these 90,000 units would require 290 Million gallons of E85 with an assumed 6.2
MPG. This changeover in fuel would save 1.7 Millon tons of CO2 emissions if the ethanol for the
E85 production came from corn or 2.6 Millon tons of CO2 emissions if the ethanol was produced
from farmed trees.
If the class 4-6 medium duty truck market in California were 15,000 units per year with an even
split between diesel and gasoline powertrains, the same assumptions would mean approximately
19 Million gallons of diesel fuel consumption and 27 Million gallons of gasoline consumption
could be avoided. Complete change over of these 15,000 units would require 48 Million gallons
of E85 with an assumed 6.2 MPG. This changeover in fuel would save 308 thousand tons of CO2
emissions if the ethanol for the E85 production came from corn or 459 thousand tons of CO2
emissions if the ethanol was produced from farmed trees.
While CO2 emissions are easily demonstratable as a result of this project work, criteria emissions
reductions are less easily quantified. Both diesel and gasoline engines currently have very similar
criteria emissions regulations and the E85 powertrain was designed to target similar emissions
levels. The project worked conducted under this program confirmed the expectation that engine
dyno certification to 2010 emission levels is cost effectively feasible. Further it is worth
considering the difficulty in improving emission of this E85 powertrain, to emissions levels lower
than the currently applicable 2010 standards, compared to a diesel powertrain. Based upon
current three-way catalyst equipped engine dyno certified products and data collected in this
program, it is possible to project that lower emission certification levels are possible and possibly
more easily than on a lean combustion system such as diesel. One clear emissions benefit of the
ETHOS E85 powertrain, including stop/start, is the elimination of idle emissions, which are the
highest in urban areas where frequent stops are common. The stopping of the engine at idle is
also a driver and pedestrian benefit by reducing the minimizing the vehicle noise at idle. This
makes it easier for drivers to be more alert to pedestrians and for pedestrians on the street
experience less noise pollution at traffic lights.
Cummins believes the “Ultra-Low Carbon Powertrain Program” provided a clear vision of a
technology pathway that can make significant contribution to air quality programs throughout
the United States and particularly California. If the market acceptance of E85 with the
performance this powertrain demonstrates can grow, and if the fuel volume growth to support it
grows from second generation fuels, it is possible that this technology pallet, and evolutions of it,
will grow to be a measurable contributor to the future of transportation technology.

61
CHAPTER 4: Conclusions and Recommendations
Conclusions 4.1
This E85 powertrain project has exceeded the goal of 50% CO2 reduction on cellulosic ethanol
relative to currently available gasoline and diesel powertrains. The fuel economy demonstrated
by this platform will match current gasoline offerings to achieve the same tank mileage and a
much lower cost to operate based on the state fuel cost assumptions. The efficiency of this
platform allows for a fuel cost very similar to a diesel platform but it is expected the E85
powertrain cost would be lower than the diesel system cost based on the integration of lower cost
3-way catalyst aftertreatment technology. The torque and power capabilities of this platform
achieve the targets required for good vehicle acceptance. The stop/start system integration with
quick vehicle launch capability should also meet customer driveability requirements. The cost
and performance of this platform should allow for good market penetration if this platform were
to go to production assuming the volume of E85 filling stations continues to increase. This project
shows that the current increase in E85 filling stations and the research currently being done to
bring cellulosic ethanol to market could be paired with this powertrain technology to deliver a
cost effective solution for reducing CO2 emissions while still providing good customer value.
Recommendations for Future Projects 4.2
While the results demonstrated during this project are very good on their own, several options to
further this work have been considered.
Increasing awareness of the current results, capabilities, and future possibilities for the
powertrain as it exists today would be a good next step. This could include refinement to allow
for longer term demonstration with potential customers and demonstration at industry trade
events. These activities would help generate market pull for this type of technology which could
allow for business case development for production by Cummins, as well as to continue roll out
of E85 fuel stations to make the fuel more readily available. Market demand and fueling
availability would be two big hurdles that could be better understood by taking the technology
to a next level of vehicle demonstration.
A second option is to evaluate the fuel economy and CO2 reduction benefits at the other end of
the displacement and compression ratio trade-off. One goal of this project was develop a highly
downsized engine to maximize drive cycle BMEP and therefore operate at high efficiency. By
operating at high BMEP, a lower compression ratio is required to achieve peak torque
requirements while staying within the cylinder pressure limits. It is possible to go to much higher
compression ratio on a larger displacement engine that would run at lower BMEP and achieve
the same torque and power requirements. This engine could also be combined with cooled EGR,
a known efficiency improver in knock limited engines. EGR acts as a displacement reducer and
would be an air handling challenge to include on the current high BMEP engine. The combination

62
of cooled EGR and higher compression ratio could result in a futher step change increase in fuel
economy improvement and CO2 reduction.
A third option for future project work could be to increase the amount of electrication on the
current engine. Because the E85 engine has a significantly lower aftertreatment cost compared to
a current diesel engine some amount of increased electrification could be added and still have a
powertrain that is cost competitive with currently available powertrains. A good next step would
be to add torque assist with increased energy recovery during decelerations and increase energy
storage. System optimization down this path could provide a powertrain with similar cost to the
current diesel system but much better fuel cost and further improved CO2 reduction relative to
the current project.

63
Acronyms
Alternative Fuel Vehicle (AFV)
Alternative and Renewable Fuels and Vehicle Technology Program (ARFVTP)
American Society for Testing and Materials (ASTM)
Commission Agreement Manager (CAM)
California Code of Regulations (CCR)
California Environmental Quality Act (CEQA)
Greenhouse gas (GHG)
United States Environmental Protection Agency (U.S. EPA)