Embed Size (px)
Citation preview

arX
iv:a
stro
-ph/
0206
214v
1 1
3 Ju
n 20
02
Astrometry with Hubble Space Telescope: A Parallax of the
Fundamental Distance Calibrator δ Cephei 1
G. Fritz Benedict1, B. E. McArthur1, L.W. Fredrick12, T. E. Harrison13, C. L. Slesnick12, J. Rhee12,
R. J. Patterson12, M. F. Skrutskie12 O. G. Franz2, L. H. Wasserman2, W. H. Jefferys6,
E. Nelan5, W. van Altena7, P. J. Shelus1, P.D. Hemenway8, R. L. Duncombe9, D. Story10,
A. L. Whipple10, and A. J. Bradley11
Received ; accepted
1Based on observations made with the NASA/ESA Hubble Space Telescope, obtained at the Space
Telescope Science Institute, which is operated by the Association of Universities for Research in Astronomy,
Inc., under NASA contract NAS5-26555
1McDonald Observatory, University of Texas, Austin, TX 78712
2Lowell Observatory, 1400 West Mars Hill Rd., Flagstaff, AZ 86001
5Space Telescope Science Institute, 3700 San Martin Dr., Baltimore, MD 21218
6 Department of Astronomy, University of Texas, Austin, TX 78712
7 Department of Astronomy, Yale University, PO Box 208101, New Haven, CT 06520
8Department of Oceanography, University of Rhode Island, Kingston, RI 02881
9Department of Aerospace Engineering, University of Texas, Austin, TX 78712
10 Jackson and Tull, Aerospace Engineering Division 7375 Executive Place, Suite 200, Seabrook, Md.
20706
11Spacecraft System Engineering Services, PO Box 91, Annapolis Junction, MD 20706
12 Department of Astronomy, University of Virginia, PO Box 3818, Charlottesville, VA 22903
13Department of Astronomy, New Mexico State University, Las Cruces, New Mexico 88003

– 2 –
ABSTRACT
We present an absolute parallax and relative proper motion for the fundamental distance
scale calibrator, δ Cep. We obtain these with astrometric data from FGS 3, a white-light
interferometer on HST. Utilizing spectrophotometric estimates of the absolute parallaxes of our
astrometric reference stars and constraining δ Cep and reference star HD 213307 to belong to
the same association (Cep OB6, de Zeeuw et al. 1999), we find πabs = 3.66 ± 0.15 mas. The
larger than typical astrometric residuals for the nearby astrometric reference star HD 213307 are
found to satisfy Keplerian motion with P = 1.07 ± 0.02 years, a perturbation and period that
could be due to a F0V companion ∼ 7 mas distant from and ∼4 magnitudes fainter than the
primary. Spectral classifications and VRIJHKT2M and DDO51 photometry of the astrometric
reference frame surrounding δ Cep indicate that field extinction is high and variable along this
line of sight. However the extinction suffered by the reference star nearest (in angular separation
and distance) to δ Cep, HD 213307, is lower and nearly the same as for δ Cep. Correcting
for color differences, we find <AV > = 0.23 ± 0.03 for δ Cep, hence, an absolute magnitude
MV = −3.47 ± 0.10. Adopting an average V magnitude, <V> = 15.03 ± 0.03, for Cepheids
with log P = 0.73 in the LMC from Udalski et al. (1999), we find a V-band distance modulus
for the LMC, m-M = 18.50± 0.13 or, 18.58± 0.15, where the latter value results from a highly
uncertain metallicity correction (Freedman et al. 2001). These agree with our previous RR Lyr
HST parallax-based determination of the distance modulus of the LMC.
Subject headings: astrometry — interferometry — stars: distances — stars: individual (δ Cep)
— stars: binary — distance scale calibration — LMC
– 3 –
1. Introduction
Many of the methods used to determine the distances to remote galaxies and ultimately the size,
age, and shape of the Universe itself depend on our knowledge of the distances to local objects. The
most important of these are the Cepheid variable stars. Considerable effort has gone into determining the
absolute magnitudes, MV , of these objects (see the comprehensive review by Feast, 1999). Given that the
distances of all local Cepheids, except Polaris, are in excess of 250pc, most of these MV determinations
rely on large-number statistics, for example Groenewegen & Oudmaijer (2000), Lanoix, Paturel, & Garnier
(1999), and Feast (1997). Gieren et al. (1993) used Cepheid surface brightness to estimate distances and
absolute magnitudes. For Cepheid variables, these determinations are complicated by dependence on color
and metallicity. Only recently have relatively high-precision trigonometric parallaxes been available for a
very few Cepheids (the prototype, δ Cep and Polaris) from HIPPARCOS (δ Cep = HIP 110991, Perryman
et al.(1997)). We have determined the parallax of δ Cep with FGS 3 on Hubble Space Telescope with
significantly higher precision. Additionally, our extensive investigation of the astrometric reference stars
provides an independent estimation of the line of sight extinction to δ Cep, a significant contributor to the
uncertainty in its absolute magnitude, MV .
In this paper we briefly discuss (Section 2) data acquisition, analysis, and an improved FGS 3
calibration; present the results of spectrophotometry of the astrometric reference stars required to correct
our relative parallax to absolute (Section 3); and derive an absolute parallax for δ Cep (Section 4.4). Finally,
we calculate an absolute magnitude for δ Cep (Section 5.3) and apply it to derive a distance modulus for
the Large Magellanic Cloud (Section 5.4).
Bradley et al. (1991) and Nelan et al. 2001 provide an overview of the FGS 3 instrument and Benedict
et al. (1999) describe the fringe tracking (POS) mode astrometric capabilities of FGS 3, along with data
acquisition and reduction strategies used in the present study. We time-tag our data with a modified Julian
Date, mJD = JD - 2444000.5.
2. Observations and Data Reduction
Figure 1 shows the distribution in RA and Dec of the five reference stars and δ Cep. Seven sets of data
were acquired, spanning 2.44 years, for a total of 127 measurements of δ Cep and reference stars. Each data
set required approximately 40 minutes of spacecraft time. The data were reduced and calibrated as detailed

– 4 –
in Benedict et al. (1999) and McArthur et al.(2001). In a recent paper (Benedict et al. 2002) we described
a technique used for these data in which we employ a neutral density filter to relate astrometry of very
bright targets to faint reference stars. At each epoch we measured reference stars and the target, δ Cep,
multiple times. We do this to correct for intra-orbit drift of the type seen in the cross filter calibration data
in our recent paper reporting a parallax for RR Lyr (Benedict et al. 2002, Fig. 1). Data sets 2 and 5 were
each also afflicted with an episode of non-monotonic drift, possibly due to mechanism (filter wheel) motion.
Fortunately, the strategy of multiple repeats of the observation sequence within each data set permitted
generally satisfactory correction.
All of these observations were acquired with FGS 3, and all before 1998. Since 1999, the prime
astrometer aboard HST has been FGS 1r, installed during the 1999 servicing mission. To calibrate the
Optical Field Angle Distortion (OFAD) for FGS 1r we have, during the last three years, secured over 30
observation sets of M35, our calibration target field. These new observations have extended our time base to
over ten years and allowed us to refine the proper motions of calibration stars in M35. This has resulted in a
more precise star catalog, which in turn has allowed us to improve our FGS 3 OFAD. Applying this revised
calibration to the Barnard’s Star data presented in Benedict et al. (1999), we find a parallax difference of
0.07 mas and a proper motion difference of 0.7 mas yr−1, each a change of about one part in 10,000. We
use this new calibration for these δ Cep data.
3. Spectrophotometric Absolute Parallaxes of the Astrometric Reference Stars
Because the parallax determined for δ Cep will be measured with respect to reference frame stars which
have their own parallaxes, we must either apply a statistically derived correction from relative to absolute
parallax (van Altena, Lee & Hoffleit 1995, hereafter YPC95) or, preferably, estimate the absolute parallaxes
of the reference frame stars seen in Figure 1. With colors, spectral type, and luminosity class for a star one
can estimate the absolute magnitude, MV , and V-band absorption, AV . The absolute parallax is then,
πabs = 10−(V−MV +5−AV )/5 (1)
The luminosity class is generally more difficult to determine than the spectral type (temperature class).
However, the derived absolute magnitudes are critically dependent on the luminosity class. To confirm
the luminosity classes we employ the technique used by Majewski et al. (2000) to discriminate between
giants and dwarfs for stars later than ∼ G5, an approach whose theoretical underpinnings are discussed by

– 5 –
Paltoglou & Bell (1994).
3.1. Photometry
Our band-passes for reference star photometry include: BVRI, JHK (from preliminary 2MASS1 data),
and Washington/DDO filters M, 51, and T2 (obtained at McDonald Observatory with the 0.8m Prime
Focus Camera). We transform the 2MASS JHK to the Bessell (1988) system using the transformations
provided in Carpenter (2001). In Tables 1 and 2 we list the visible, infrared, and Washington/DDO
photometry for the δ Cep reference stars, DC-2 through DC-7. DC-2 was too bright for 2MASS and our
Washington/DDO and RI photometric techniques.
3.2. Spectroscopy
The spectra from which we estimated spectral type and luminosity class come from the New Mexico
State University Apache Point Observatory2. For all but reference star DC-2 classifications were obtained
by a combination of template matching and line ratios. Differing classifications for reference star DC-2 (HD
213307) have been reported in the literature. We consider the classifications of both Lutz & Lutz (1977) and
Savage et al. (1985). Table 3 contains a list of the spectral types and luminosity classes for our reference
stars, rank ordered by estimated distance. We discuss our estimation of the <AV > in the next subsection.
In Figure 2 we plot the Washington-DDO photometry along with a dividing line between dwarfs and
giants (Paltoglou & Bell 1994 ). The boundary between giants and dwarfs is actually far ’fuzzier’ than
suggested by the solid line and complicated by the photometric transition from dwarfs to giants through
subgiants. This soft boundary is readily apparent in Majewski et al. (2000) Fig. 14. Objects just above the
heavy line are statistically more likely to be giants than objects just below the line. Reference stars DC-2
and DC-5 have spectral types that are too early for this discriminant to work properly. The photometry is
consistent with a giant or subgiant classification for the other reference stars.
1 The Two Micron All Sky Survey is a joint project of the University of Massachusetts and the Infrared
Processing and Analysis Center/California Institute of Technology
2 The Apache Point Observatory 3.5 m telescope is owned and operated by the Astrophysical Research
Consortium.

– 6 –
3.3. Interstellar Extinction
To determine interstellar extinction we first plot these stars on several color-color diagrams. A
comparison of the relationships between spectral type and intrinsic color against measured colors provides
an estimate of reddening. Figure 3 contains V-R vs V-K and V-I vs V-K color-color diagrams and reddening
vectors for AV = 1.0. Also plotted are mappings between spectral type and luminosity class V and III
from Bessell & Brett (1988) and Cox (2000, hereafter AQ00), again with reddening vectors and the loci of
luminosity classes V and III stars. Figure 3, along with the estimated spectral types, provides measures of
the reddening for each reference star.
Assuming an R = 3.1 galactic reddening law (Savage & Mathis 1977), we derive AV values by
comparing the measured colors (Tables 1 and 2) with intrinsic V-R, V-I, J-K, and V-K colors from Bessell
& Brett (1988) and AQ00. Specifically, we estimate AV from four different ratios, each derived from the
Savage & Mathis (1977) reddening law: AV /E(V-R) = 4.83; AV /E(V-K) = 1.05; AV /E(J-K) = 5.80; and
AV /E(V-I) = 2.26. These AV are collected in Table 4. Colors and spectral types are inconsistent with a
field-wide average <AV > for the δ Cep field. The spatial distribution of the average reddening star to star
is shown in Figure 1. A simple uniform extinction would predict a correlation between AV and distance,
with more distant objects having higher AV . This correlation is absent in Table 3, suggesting that either the
extinction or the distances are in error. Alternatively, a patchy distribution of the ISM would destroy any
correlation, a distinct possibility for this field at Galactic latitude, l = 0.5. As we shall see, the reddening
for reference star DC-2 (discussed in Section 4.4), is of critical importance to an estimate of the reddening
at the location of δ Cep.
3.4. Reference Frame Absolute Parallaxes
We have prior knowledge that reference star DC-2 is thought to be physically associated with δ
Cep. Hoffleit & Jaschek 1982 ( = BSC82) note common proper motion with δ Cep and that DC-2 =
ADS15987C (δ Cep = ADS15987A), while de Zeeuw et al. (1999) include both δ Cep and DC-2 in the
newly discovered Cep OB6 association. Consequently, we first explored the astrometric properties of the
four remaining reference stars, solving for parallax and proper motion of each in turn relative to a reference
frame defined by the other three reference stars. We obtained no significant improvement in χ2 by allowing
any reference star (other than DC-2) to have a proper motion relative to the other three. In each case the
spectrophotometric parallaxes discussed below entered the solution as observations.
– 7 –
We derive absolute parallaxes with MV values from AQ00 and the <AV > obtained from the
photometry. These are listed in Table 3, with three possible values for reference star DC-2, two depending
on past spectral classifications. The last value for DC-2 is derived by constraining it to belong to the Cep
OB6 association (see section 4.4 below). The weighted average absolute parallax for the reference frame is
< πabs >= 0.77 mas, including the highest weight parallax determination for DC-2, and 0.63 mas without
DC-2. Statistically, DC-2 has very little weight in our reference frame. Nonetheless, it is astrometrically
critical, as discussed in (Section 4.4), below.
4. Absolute Parallax of δ Cep
4.1. The Astrometric Model
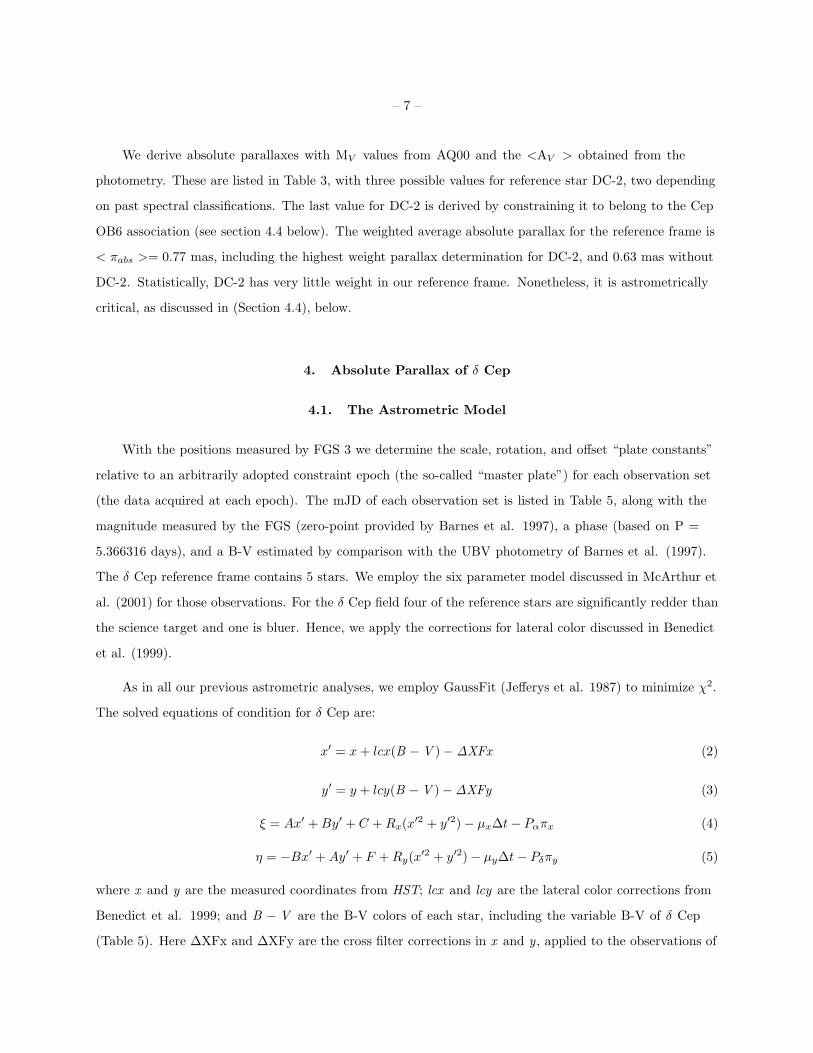
With the positions measured by FGS 3 we determine the scale, rotation, and offset “plate constants”
relative to an arbitrarily adopted constraint epoch (the so-called “master plate”) for each observation set
(the data acquired at each epoch). The mJD of each observation set is listed in Table 5, along with the
magnitude measured by the FGS (zero-point provided by Barnes et al. 1997), a phase (based on P =
5.366316 days), and a B-V estimated by comparison with the UBV photometry of Barnes et al. (1997).
The δ Cep reference frame contains 5 stars. We employ the six parameter model discussed in McArthur et
al. (2001) for those observations. For the δ Cep field four of the reference stars are significantly redder than
the science target and one is bluer. Hence, we apply the corrections for lateral color discussed in Benedict
et al. (1999).
As in all our previous astrometric analyses, we employ GaussFit (Jefferys et al. 1987) to minimize χ2.
The solved equations of condition for δ Cep are:
x′ = x+ lcx(B −V )−∆XFx (2)
y′ = y + lcy(B −V )−∆XFy (3)
ξ = Ax′ +By′ + C +Rx(x′2 + y′2)− µx∆t− Pαπx (4)
η = −Bx′ +Ay′ + F +Ry(x′2 + y′2)− µy∆t− Pδπy (5)
where x and y are the measured coordinates from HST; lcx and lcy are the lateral color corrections from
Benedict et al. 1999; and B − V are the B-V colors of each star, including the variable B-V of δ Cep
(Table 5). Here ∆XFx and ∆XFy are the cross filter corrections in x and y, applied to the observations of

– 8 –
δ Cep and reference star DC-2. δ Cep has a full range of 0.2 < B-V < 0.6. For this analysis we linearly
interpolate between the 1995 and 1998 cross filter calibrations (see Table 1, Benedict et al. 2002) as a
function of δ Cep color. A and B are scale and rotation plate constants, C and F are offsets; Rx and Ry
are radial terms; µx and µy are proper motions; ∆t is the epoch difference from the mean epoch; Pα and
Pδ are parallax factors; and πx and πy are the parallaxes in RA and Dec. We obtain the parallax factors
from a JPL Earth orbit predictor (Standish 1990), upgraded to version DE405. Orientation to the sky is
obtained from ground-based astrometry (USNO-A2.0 catalog, Monet 1998) with uncertainties in the field
orientation ±0.05.
4.2. Assessing Reference Frame Residuals
The Optical Field Angle Distortion calibration (McArthur et al. 1997) reduces as-built HST telescope
and FGS 3 distortions with magnitude ∼ 1′′ to below 2 mas over much of the FGS 3 field of regard. From
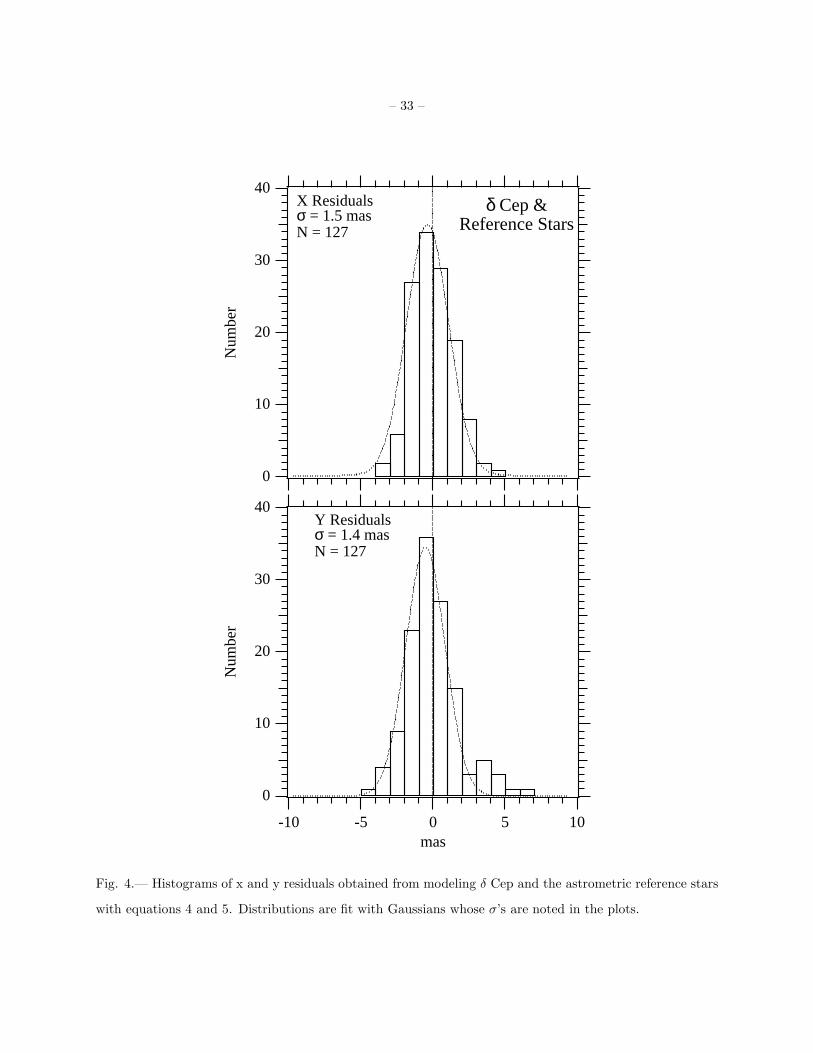
histograms of the astrometric residuals (Figure 4) we conclude that we have obtained correction at the
∼ 1.5 mas level. The resulting reference frame ‘catalog’ in ξ and η standard coordinates (Table 6) was
determined with < σξ >= 0.3 and < ση >= 0.3 mas.
Noting that the residual histograms have larger dispersions than we typically achieve, we plotted the δ
Cep reference frame residuals against a number of spacecraft, instrumental, and astronomical parameters
to determine if there might be unmodeled - but possibly correctable - systematic effects at the 1 mas
level. The plots against residual included x and y position within the pickle; radial distance from the
pickle center; reference star V magnitude and B-V color; and epoch of observation. Except for reference
star DC-2 ( = HD 213307) discussed below, we saw no obvious trends, other than an expected increase in
positional uncertainty with reference star magnitude. The largest residuals are associated with observations
of reference stars DC-5 and DC-7 made during the two orbits with anomalous drift, discussed in Section 2.
4.3. A New Companion for HD 213307?
BSC82 notes a possible very short period companion (P<1d) to reference star DC-2 = HD 213307.
Such a companion would be undetectable by the FGS, either directly (changes in fringe structure) or
indirectly (astrometric perturbation of the primary). Nonetheless, for DC-2 we found clear long-term and
non-linear trends in the residuals with time. Because HST provides only relative proper motions, we do not

– 9 –
expect full agreement with the HIPPARCOS absolute proper motions. However, the agreement between
HIPPARCOS and HST for δ Cep was within the errors, while that for DC-2 was not (Table 8). To assess
the possibility that the residuals are caused by a perturbation due to a longer-period unseen companion we
employed the model from our past binary star work (Benedict et al. 2001),
ξ = Ax′ +By′ + C +Rx(x′2 + y′2)− µx∆t− Pαπx −ORBITx (6)
η = −Bx′ +Ay′ + F +Ry(x′2 + y′2)− µy∆t− Pδπy −ORBITy (7)
where ORBIT is a function of the traditional astrometric orbital elements. Due to the small number of
epochs and observations we were unable to treat HD 213307 as we did Wolf 1062A (Benedict et al. 2001)
and simultaneously solve for all the terms in equations 6 and 7. To obtain a solution we constrained all
but the parallax, proper motion, and ORBIT parameters to values previously determined using equations 4
and 5. The resulting orbital elements in Table 7 should be taken as highly preliminary. Figure 6 shows the
residuals from the solution provided by equations 6 and 7 and the fitted orbit. Introducing these parameters
to the modeling process reduced the residual histogram dispersions seen in Figure 4 from σx = 1.5 to
σx = 1.4 mas and from σy = 1.4 mas to σy = 1.0 mas.
With M = 4M⊙ adopted as the mass of the B7-8 primary (AQ00), the perturbation orbit size, α = 2.0
mas, and the period, P = 1.06 years yield a component B mass, MB ∼ 1.6M⊙. If the companion is on the
main sequence, this F0 V star would be approximately 7 mas (1.9 AU) distant from and ∼3.8 mag fainter
than the primary, consistent with the absence of a previous detection. Radial velocity variations of the
primary would have an amplitude, K1 ∼ 15 km s−1 , difficult to detect in a B7-8 III/IV star with vsini =
135 km s−1 (BSC82).
4.4. The Absolute Parallax of δ Cep and HD 213307
In a quasi-Bayesian approach the lateral color and cross-filter calibration values were entered into the
model as observations with associated errors. The reference star spectrophotometric absolute parallaxes also
were input as observations with associated errors, not as hardwired quantities known to infinite precision.
This approach allows us to incorporate any measurements relevant to our investigation. These include the
HIPPARCOS parallaxes and proper motions of δ Cep and HD 213307 (HIP 110988) with errors.
Even though DC-2 is a binary with a poorly determined orbit, we find that we must include this

– 10 –
reference star in the solution. An ideal astrometric reference frame would surround δ Cep. From Figure 1
it is clear that DC-2 is necessary to minimize extrapolation of the scale determined by the bulk of the
offset reference frame. Without DC-2 the reference frame geometry is even less ideal. DC-2 also provides
a constraint on the cross filter calibration, because both DC-2 and δ Cep were observed with the neutral
density filter. Following a suggestion from the referee, we constrained the difference in parallax between δ
Cep and DC-2, using our prior knowledge of their proximity (see Section 3.4). From de Zeeuw et al. 1999
figure 25 we can estimate that the 1σ dispersion in Galactic longitude for the OB association thought to
contain both δ Cep and DC-2 is 3. One can therefore infer that the 1σ dispersion in distance in this group
is 3/radian ∼5%. Hence, the 1σ dispersion in the parallax difference between two group members (e.g.
DC-2 and δ Cep) is
∆π = 5%×√2× 3.7 mas = 0.26 mas (8)
where we have here adopted the mean parallax of Cep OB6, < π >= 3.7 mas, from de Zeeuw et al. 1999.
This estimated difference allows us to assign a higher statistical weight to reference star DC-2 than if we
had adopted either past spectral typing (lines 1 and 2 in Table 3) or the HIPPARCOS value. The parallax
difference between δ Cep and DC-2 becomes an observation with associated error fed to our model, an
observation used to estimate the parallax difference between the two stars, while solving for the parallax of
δ Cep.
We obtain for δ Cep an absolute parallax, πabs = 3.66 ± 0.15 mas, and for DC-2, πabs = 3.65 ± 0.15.
Introducing the Cep OB6 parallax dispersion constraint and the HIPPARCOS parallax and proper motion
measurements with their associated errors allows us to obtain a statistically significant result from a
reference frame with very poor geometry. Our final δ Cep parallax differs by ∼ 1σHIP and by ∼ 3σHST from
that measured by HIPPARCOS, πabs = 3.32 ± 0.58 mas. Nordgren et al. (2002) have used long-baseline
interferometry to measure the angular diameter of δ Cep and other Cepheids. Their calibration of the
Barnes-Evans (1976) relationship (surface brightness vs color index) yields a distance to δ Cep of 272 ± 6
pc and a parallax πabs = 3.68± 0.08 mas. We note that our δ Cep absolute parallax and that of Nordgren
et al. agree within each other’s errors.
In Figure 5 we compare δ Cep astrometric parallax results from HST, HIPPARCOS, and Allegheny
Observatory (AO). We plot the AO re-determination reported in Gatewood et al. (1998), not the original
result (Gatewood et al. 1993). Also plotted is the Nordgren et al. (2002) result. Parallax and proper
motion results from HST, HIPPARCOS, and AO are collected in Table 8. Parallax and proper motion
results for reference star DC-2 are also presented in Table 8, because it was measured by HIPPARCOS.

– 11 –
5. Discussion and Summary
5.1. HST Parallax Accuracy
Our parallax precision, an indication of our internal, random error, is often less than 0.4 mas. To
assess our accuracy, or external error, we must compare our parallaxes with results from independent
measurements. Following Gatewood, Kiewiet de Jonge, & Persinger (1998), we plot all parallaxes obtained
by the HST Astrometry Science Team with FGS 3 against those obtained by HIPPARCOS. Data for these
seven objects are collected in Table 9 and shown in Figure 7. We have not included four Hyades stars whose
parallaxes are considered preliminary (van Altena et al. 1997). The dashed line is a weighted regression
that takes into account errors in both input data sets.
The regression indicates a 2.5σ scale difference between the HIPPARCOS and HST results. In addition,
the fit χ2 suggests that either the HIPPARCOS or HST errors are overstated. Some, but not all of this
discrepancy can be explained by pointing out that our log-log plot artificially spreads out these data which
are effectively in two clumps, large and small parallaxes. Further exploring this issue, we have conducted
a fully Bayesian analysis of the data in question, with an additional factor that represents the degree to
which the presumed errors agree with the fit. We find that the input standard deviations of the HST and
HIPPARCOS data points may have been overstated by a factor of ∼ 1.5. It is not possible to decide which
errors, HST or the HIPPARCOS, or some combination of the two, are overstated. However, HIPPARCOS
errors have been subjected to many tests confirming their validity. Hence, it is likely that HST errors are
overstated.
Regarding the scale difference, we compare two hypotheses; the null hypothesis (a = 0, b = 1) and the
complex hypothesis (a 6= 0, b 6= 1). We find that the Bayes factor against the null hypothesis (that the
straight line in Figure 7 is correctly described by a = 0, b = 1) and in favor of a more complex hypothesis is
about 30, depending on the priors we put on a and b. These 30:1 odds provide only modest support for the
complex hypothesis, that there is a systematic scale deviation between the HST and HIPPARCOS results.
We point out that the amount of data is very small, and that much of the scale difference (if real) depends
upon the two largest parallaxes, which have a great deal of leverage.
Measured proper motions provide another argument against the reality of this scale difference. Because
it is desirable to reduce the impact of proper motion errors on an HST – HIPPARCOS comparison, we
consider only two of the objects in Table 9 (Proxima Cen and Barnard’s Star). They have proper motion

– 12 –
vector lengths exceeding 3800 mas yr−1. HST yields proper motions relative to a local reference frame and
HIPPARCOS produced absolute proper motions. The dissimilar approaches can result in unequal proper
motions for the same object. However, comparing HST with HIPPARCOS, the average difference between
these proper motion vectors is -0.01%, indicating a negligible scale difference.
5.2. The Lutz-Kelker Bias
When using a trigonometric parallax to estimate the absolute magnitude of a star, a correction should
be made for the Lutz-Kelker (LK) bias (Lutz & Kelker 1973). Because of the galactic latitude and distance
of δ Cep, and the scale height of the stellar population of which it is a member, we use a uniform space
density for calculating the LK bias. An LK algorithm modified by Hanson (1979) that includes the power
law of the parent population is used. A correction of -0.015 ± 0.01 mag is derived for the LKH bias
correction to the HST parallax of δ Cep. The LKH bias is small because σπ
π ∼ 4% is small.
5.3. The Absolute Magnitude of δ Cep
To obtain the intrinsic absolute magnitude of δ Cep we require the intensity-averaged apparent
magnitude, the absolute parallax, and an estimate of interstellar extinction. To estimate the extinction we
turn to reference star DC-2 (HD 213307). For this star we obtain an absolute parallax, πabs = 3.65 mas,
between the two estimates depending on past spectral type and luminosity class determinations (Table 3).
From SIMBAD we collected B-V for all B8 III and B7 IV stars with V ≤ 4 (presumably the nearest and
least reddened members of their respective classes). The average for B8 III was <B-V> = -0.09 and for B7
IV <B-V> = -0.13. We adopt an intermediate (B-V)0 = -0.11. From the measured color, B-V = -0.04, we
obtain a color excess, E(B-V) = 0.07. Because a blue star can yield a different ratio of total to selective
absorbtion, R, than a redder star, depending on the amount of color excess, we employ the formulation
(Laney & Stobie 1993),
R = 3.07 + 0.28× (B − V )0 + 0.04× E(B − V ) (9)
and obtain for DC-2 < AV > = 0.21 ± 0.03. The absolute magnitude of HD 213307 is then MV = -1.10.
Given that the distance to δ Cep and DC-2 are the same within the errors, we adopt the same color excess,
E(B-V) = 0.07 for δ Cep, yielding (B-V)0 = 0.59 and R = 3.24. Therefore, < AV > = 0.23 ± 0.03 for δ

– 13 –
Cep. Our determination agrees with < AV > = 0.25 ± 0.06 from Fernie et al. (1995)3. Because differential
reddening effects are smaller at the I-band, we use a Savage & Mathis R = 3.1 reddening law to provide AI
= 0.14.
We next require the intensity-averaged magnitude of δ Cep. From Feast & Catchpole (1997) we
obtain an intensity weighted average <V> = 3.954. From the photometry of Moffett & Barnes (1985),
we adopt a Johnson I-band intensity averaged magnitude, <I> = 2.993. With the HST absolute parallax
from Section 4.4 and < AV > = 0.23 ± 0.03, we derive MV = −3.47± 0.10, including the LKH bias and
associated uncertainty. Similarly, MI(CK) = −4.14± 0.10, where we have transformed the Johnson to the
Cousins-Kron photometric system as per Bessell (1979). The intensity-averaged photometry and absolute
magnitudes are collected into Table 10. Using surface-brightness techniques, Gieren et al. (1993) obtain for
δ Cep an absolute visual magnitude MV = −3.63± 0.13 and, for log P = 0.73, MV = −3.55 ± 0.11 from
their Period-Luminosity (P-L) calibration for 100 Cepheids. Using a large number of relatively imprecise
HIPPARCOS parallaxes, Feast & Catchpole (1997) and Lanoix, Paturel, & Garnier (1999) derive slightly
different P-L calibrations for Cepheid variable stars. For log P = 0.73, Feast obtains MV = -3.48 and
Lanoix et al., MV = -3.46. All determinations agree with our value within the errors.
5.4. The Distance Modulus of the LMC
Uncertainty in the distance to the Large Magellanic Cloud (LMC) contributes a substantial fraction of
the uncertainty in the Hubble Constant (Mould et al. 2000). The HST Key Project on the Extragalactic
Distance Scale (Freedman et al. 2001, Mould et al. 2000) and the Type Ia Supernovae Calibration Team
(Saha et al. 1999) have adopted the distance modulus value m-M = 18.5. Values from 18.1 to 18.8 are
reported in the current literature, with those less than 18.5 supporting the short distance scale and those
greater than 18.5, the long distance scale. Comprehensive reviews of the methods can be found in Carretta
et al. (2000), Gibson (1999), and Cole (1998).
Ideally, our absolute magnitude values for δ Cep, MV = −3.47 ± 0.10 and MI(CK) = −4.14 ± 0.10,
combined with apparent magnitudes for LMC Cepheids (corrected for reddening internal to the LMC) at
log P = 0.73 would yield a unique LMC distance modulus. However, there are several complications that
render such a distance modulus suspect. The first of these is cosmic dispersion in Cepheid properties due
3http://ddo.astro.utoronto.ca/cepheids.html

– 14 –
to the finite width of the instability strip. As shown in figure 5.13 of Binney & Merrifield (1998), lines of
constant period are not horizontal in the HR diagram. This complication motivates the determination of
Period-Luminosity-Color (P-L-C) relationships. Udalski et al. (1999) find a dispersion σ = 0.07 magnitude
about the P-L-C relation for LMC Cepheids. The scatter about any P-L relation decreases markedly
as one utilizes progressively redder band passes that are less affected by internal reddening (Udalski et
al. 1999 and Tanvir 1999 ). A reddening-free magnitude, W, yields the P-L relationship with the least
dispersion, Udalski et al. (1999) finding σ = 0.08 mag. Assuming that the remaining scatter in a P-L-C
or reddening-free P-L relationship is cosmic scatter, we adopt 0.075 mag as the cosmic dispersion in the
intrinsic properties of Cepheid variables, including the defining member of the class, δ Cep.
Varying amounts of line blanketing due to intrinsic metallicity differences can also affect the apparent
magnitude of a star. A comprehensive discussion of its effect on the Cepheid P-L relation is presented by
Freedman et al. 2001. We adopt their correction, used for both V and I band and differential with respect
to the LMC, of -0.2 ± 0.2 mag dex−1. Specific to our calibration of the LMC P-L relation, for δ Cep
Andrievsky et al. 2002 find [O/H] = +0.01. The LMC has [O/H] ∼ -0.4 (Kennicutt et al. 1998). Hence, if
δ Cep had LMC metallicity, it would be 0.08 ± 0.08 mag brighter in V and I.
We adopt the OGLE LMC V and I P-L relations (Udalski et al. 1999) because they are based on a very
large number of Cepheids. Utilizing these to generate apparent, absorption-corrected Cepheid magnitudes
at log P = 0.73, we obtain LMC V-band distance moduli m-M = 18.50 ± 0.13 or, corrected for metallicity,
m-M = 18.58 ± 0.15. The corresponding I-band moduli are m-M = 18.53 ± 0.13 and m-M = 18.61 ±
0.15, respectively. The errors include an RSS-ed 0.075 magnitude cosmic dispersion. We list these distance
moduli in Table 11. Distance moduli corrected for metallicity are listed in the rightmost column as m-M =
f(Z). At this stage in its maturity, this term introduces as much uncertainty as correction.
All estimates agree within their respective errors with our recent determinations from HST astrometry
of RR Lyr (Benedict et al. 2002). There we obtained values of 18.53 ± 0.10 and 18.38 ± 0.10, where the
range comes from differing <V0(RR)> values for LMC RR Lyr variables found in the literature. We note
that the errors associated with the Benedict et al. (2001) LMC distance moduli derived from RR Lyr
neglected cosmic dispersion. According to Popowski & Gould (1998) this amounts to ∼ 0.14 magnitudes,
increasing our distance moduli errors to 0.18 magnitude. Table 12 and Figure 8 summarize LMC distance
modulus determinations based on HST astrometry and compare them with weighted averages of a number
of results based on RR Lyr and Cepheid variables. A more comprehensive version of this figure, along

– 15 –
with the corresponding complete table and references, summarizing over 80 determinations based on 21
independent methods, can be found on the web4. All LMC distance moduli based on HST astrometry
are consistent with the LMC m-M = 18.50 ± 0.10 value adopted by the HST Distance Scale Key Project
(Freedman et al. 2001).
5.5. Summary
HST astrometry yields an absolute trigonometric parallax for δ Cep, πabs = 3.66 ± 0.15 mas. This
high-precision result requires an extremely small Lutz-Kelker bias correction, -0.015 ± 0.01 magnitude.
To reduce our astrometric residuals to near-typical levels requires that we model reference star DC-2 as a
binary and constrain it and δ Cep to belong to the same stellar group, Cep OB6. Our astrometric results
for DC-2 yield an extinction for that star of < AV > = 0.21 ± 0.03. Correcting for color-dependent R
differences, we find < AV > = 0.23 ± 0.03 for δ Cep. The dominant contributor to the error in the resulting
absolute magnitude for δ Cep, MV = −3.47± 0.10, remains the parallax. We find an LMC V-band distance
modulus m-M = 18.50 ± 0.13, uncorrected for metallicity. This value is in agreement with our previous
determinations with HST astrometry of RR Lyr and the value adopted by the HST Distance Scale Key
Project (Freedman et al. 2001).
Support for this work was provided by NASA through grants GTO NAG5-1603 from the Space
Telescope Science Institute, which is operated by the Association of Universities for Research in Astronomy,
Inc., under NASA contract NAS5-26555. These results are based partially on observations obtained
with the Apache Point Observatory 3.5m telescope, which is owned and operated by the Astrophysical
Research Consortium. This publication makes use of data products from the Two Micron All Sky Survey,
which is a joint project of the University of Massachusetts and the Infrared Processing and Analysis
Center/California Institute of Technology, funded by the National Aeronautics and Space Administration
and the National Science Foundation. This research has made use of the SIMBAD database, operated at
CDS, Strasbourg, France; the NASA/IPAC Extragalactic Database (NED) which is operated by the Jet
Propulsion Laboratory, California Institute of Technology, under contract with the National Aeronautics
and Space Administration; and NASA’s Astrophysics Data System Abstract Service. Thanks to Tom
Barnes for helpful discussions and an early review of the text. Thanks to the many people in Danbury
4http://clyde.as.utexas.edu/SpAstNEW/head.ps

– 16 –
CT who have surfed through many waves of change (once Perkin-Elmer, then Hughes Aerospace, then
Raytheon, now Goodrich) and continue to support the FGS, especially Linda Abramowicz-Reed. Finally,
we thank Andy Gould for his careful and critical refereeing, and for his suggestion to relate the reference
star DC-2 and δ Cep parallaxes to each other through their membership in Cep OB6.

– 17 –
REFERENCES
Andrievsky, S. M. et al. 2002, A&A, 381, 32
Barnes, T. G. & Evans, D. S. 1976, MNRAS, 174, 489
Barnes, T. G., Fernley, J. A., Frueh, M. L., Navas, J. G., Moffett, T. J., & Skillen, I. 1997, PASP, 109, 645
Benedict, G. F., McArthur, B., Nelan, E., Story, D., Whipple, A. L., Shelus, P. J., Jefferys, W. H.,
Hemenway, P. D., Franz, O. G., Wasserman, L. H., Duncombe, R. L., van Altena, W., & Fredrick,
L. W. 1998, AJ, 116, 429
Benedict, G. F., McArthur, B., Chappell, D. W., Nelan, E., Jefferys, W. H., van Altena, W., Lee, J.,
Cornell, D., Shelus, P. J., Hemenway, P. D., Franz, O. G., Wasserman, L. H., Duncombe, R. L.,
Story, D., Whipple, A., & Fredrick, L. W. 1999, AJ, 118, 1086
Benedict, G. F., McArthur, B. E., Franz, O. G., Wasserman, L. H., Nelan, E., Lee, J., Fredrick, L. W.,
Jefferys, W. H., van Altena, W., Robinson, E. L., Spiesman, W. J., Shelus, P. J., Hemenway, P. D.,
Duncombe, R. L., Story, D., Whipple, A. L., & Bradley, A. 2000, AJ, 119, 2382
Benedict, G. F., McArthur, B. E., Franz, O. G., Wasserman, L. H., Henry, T. J., Takato, T., Strateva, I. V.,
Crawford, J. L., Ianna, P. A., McCarthy, D. W., Nelan, E., Jefferys, W. H., van Altena, W., Shelus,
P. J., Hemenway, P. D., Duncombe, R. L., Story, D., Whipple, A. L., Bradley, A. J., & Fredrick,
L. W. 2001, AJ, 121, 1607
Benedict, G. F., McArthur, B. E., Fredrick, L. W., Harrison, T. E., Lee, J., Slesnick, C. L., Rhee, J.,
Patterson, R. J., Nelan, E., Jefferys, W. H., van Altena, W., Shelus, P. J., Franz, O. G., Wasserman,
L. H., Hemenway, P. D., Duncombe, R. L., Story, D., Whipple, A. L., & Bradley 2002, AJ, 123, 473
Bessell, M. S. 1979, PASP, 91, 589
Bessell, M. S. & Brett, J. M. 1988, PASP, 100, 1134
Binney, J. & Merrifield, M. 1998, Galactic astronomy. Princeton, NJ : Princeton University Press, 1998
Bradley, A., Abramowicz-Reed, L., Story, D., Benedict, G. & Jefferys, W. 1991, PASP, 103, 317
Carpenter, J. M. 2001, AJ, 121, 2851

– 18 –
Carretta, E., Gratton, R. G., Clementini, G., & Fusi Pecci, F. 2000a, ApJ, 533, 215
Cole, A. A., 1998, ApJ, 500, L137
Cox, A. N. 2000, Allen’s astrophysical quantities, 4th ed. Publisher: New York: AIP Press, Springer, 2000.
Edited by Arthur N. Cox. (AQ00)
D’Antona, F. & Mazzitelli, I. 1990, ARA&A, 28, 139
de Zeeuw, P. T., Hoogerwerf, R., de Bruijne, J. H. J., Brown, A. G. A., & Blaauw, A. 1999, AJ, 117, 354
Feast, M. W. 1997, MNRAS, 284, 761
Feast, M. W. & Catchpole, R. M. 1997, MNRAS, 286, L1
Feast, M. 1999, PASP, 111, 775
Fernie, J. D., Evans, N. R., Beattie, B., & Seager, S. 1995, Information Bulletin on Variable Stars, 4148, 1
Fernley, J., Barnes, T. G., Skillen, I., Hawley, S. L., Hanley, C. J., Evans, D. W., Solano, E., & Garrido, R.
1998, A&A, 330, 515
Franz, O. G., Henry, T. J., Wasserman, L. H., Benedict, G. F., Ianna, P. A., Kirkpatrick, J. D., McCarthy,
D. W., Bradley, A. J., Duncombe, R. L., Fredrick, L. W., Hemenway, P. D., Jefferys, W. H.,
McArthur, B. E., Nelan, E. P., Shelus, P. J., Story, D. B., van Altena, W. F., & Whipple, A. L. 1998,
AJ, 116, 1432
Freedman, W. L., Madore, B. F., Gibson, B. K., Ferrarese, L., Kelson, D. D., Sakai, S., Mould, J. R.,
Kennicutt, R. C., Jr., Ford, H. C., Graham, J. A., Huchra, J. P., Hughes, S. M. G., Illingworth, G.
D., Macri, L. M., & Stetson, P. B., 2001, ApJ, 553, 47
Gatewood, G., de Jonge, K. J., & Stephenson, B. 1993, PASP, 105, 1101
Gatewood, G., Kiewiet de Jonge, J., & Persinger, T. 1998, AJ, 116, 1501
Gieren, W. P., Barnes, T. G., & Moffett, T. J. 1993, ApJ, 418, 135
Gibson, B. K. 1999 preprint (astro-ph/9910547)
Groenewegen, M. A. T., & Oudmaijer, R. D., 2000, A&A, 356, 849
– 19 –
Hanson, R. B. 1979, MNRAS, 186, 875
Harrison, T. E., McNamara, B. J., Szkody, P. , McArthur, B. E., Benedict, G. F., Klemola, A. R. &
Gilliland, R. L. 1999, ApJ, 515, L93
Hoffleit, D. & Jaschek, C. 1982, The Bright Star Catalogue, New Haven: Yale University Observatory (4th
edition), 1982 (BSC82)
Jefferys, W., Fitzpatrick, J., and McArthur, B. 1987, Celest. Mech. 41, 39.
Kennicutt, R. C. et al. 1998, ApJ, 498, 181
Laney, C. D. & Stobie, R. S. 1993, MNRAS, 263, 921
Lanoix, P., Paturel, G., & Garnier, R. 1999, MNRAS, 308, 969
Lutz, T. E. & Lutz, J. H. 1977, AJ, 82, 431
Lutz, T. E. & Kelker, D. H. 1973, PASP, 85, 573
Majewski, S. R., Ostheimer, J. C., Kunkel, W. E., & Patterson, R. J. 2000, AJ, 120, 2550
McArthur, B., Benedict, G. F., Jefferys, W. H., and Nelan, E. 1997. in Proc. 1997 HST Calibration
Workshop, ed. S. Casertano, R. Jedrzejewski, T. Keyes, and M. Stevens, STScI Publication,
Baltimore, MD
McArthur, B. E., Benedict, G. F., Lee, J., Lu, C.-L., van Altena, W. F., Deliyannis, C. P., Girard, T.,
Fredrick, L. W., Nelan, E., Duncombe, R. L., Hemenway, P. D., Jefferys, W. H., Shelus, P. J., Franz,
O. G., & Wasserman, L. H. 1999, ApJ, 520, L59
McArthur, B. E., Benedict, G. F., Lee, J., van Altena, W. F., Slesnick, C. L., Rhee, J., Patterson, R. J.,
Fredrick, L. W., Harrison, T. E., Spiesman, W. J., Nelan, E., Duncombe, R. L., Hemenway, P. D.,
Jefferys, W. H., Shelus, P. J., Franz, O. G., & Wasserman, L. H. 2001, ApJ, 560, 907
Moffett, T. J. & Barnes, T. G. 1985, ApJS, 58, 843
Monet, D. G. 1998, American Astronomical Society Meeting, 193, 112.003

– 20 –
Mould, J. R, Huchra, J. P., Freedman, W. L., Kennicutt, R. C., Jr., Ferrarese, L., Ford, H. C., Gibson, B.
K., Graham, J. A., Hughes, S. M. G., Illingworth, G. D., Kelson, D. D., Macri, L. M., Madore, B.
F., Sakai, S., Sebo, K. M., Silbermann, N. A.,& Stetson, P. B. 2000, ApJ, 529, 786
Nelan, E. 2001, Fine Guidance Sensor Instrument Handbook (version 10; Baltimore: STScI)
Nordgren, T. E, Lane, B. F., Hindsley, R. B., & Kervella, P. 2002, astro-ph/0203130, to appear in AJ
Paltoglou, G. & Bell, R. A. 1994, MNRAS, 268, 793
Perryman, M. A. C., Lindegren, L., Kovalevsky, J., Hoeg, E., Bastian, U., Bernacca, P. L., Creze, M.,
Donati, F., Grenon, M., van Leeuwen, F., van der Marel, H., Mignard, F., Murray, C. A., Le Poole,
R. S., Schrijver, H., Turon, C., Arenou, F., Froeschle, M., & Petersen, C. S. 1997, A&A, 323, L49
Popowski, P. & Gould, A. 1998, ApJ, 506, 259
Saha, A., Sandage, A., Tammann, G. A., Labhardt, L., Macchetto, F. D., & Panagia, N., 1999, ApJ, 522
802
Savage, B. D. & Mathis, J. S. 1979, ARA&A, 17, 73
Savage, B. D., Massa, D., Meade, M., & Wesselius, P. R. 1985, ApJS, 59, 397
Standish, E. M., Jr. 1990, A&A, 233, 252
Tanvir, N. R. 1999, ASP Conf. Ser. 167: Harmonizing Cosmic Distance Scales in a Post-HIPPARCOS Era,
Eds. D. Egret & A. Heck, 84
Udalski, A., Szymanski, M., Kubiak, M., Pietrzynski, G., Soszynski, I., Wozniak, P., & Zebrun, K. 1999,
Acta Astronomica, 49, 201
van Altena, W. F., Lu, C.-L., Lee, J. T., Girard, T. M., Guo, X., Deliyannis, C., Platais, I., Kozhurina-
Platais, V., McArthur, B., Benedict, G. F., Duncombe, R. L., Hemenway, P. D., Jefferys, W. H.,
King, J. R., Nelan, E., Shelus, P. S., Story, D., Whipple, A., Franz, O. G., Wasserman, L., Fredrick,
L. W., Hanson, R. B., Klemola, A. R., Jones, B. F., Mendez, R., Tsay, W.-S., & Bradley, A. 1997,
ApJ, 486, L123
Wegner, W. 2000, MNRAS, 319, 771
– 21 –
This manuscript was prepared with the AAS LATEX macros v4.0.

– 22 –
Table 1. Astrometric Reference Stars: Photometry
ID V B-V V-R V-I V-K
DC-2a 6.30±0.02 -0.04±0.02
DC-3 13.47±0.02 1.60±0.10 1.10±0.04 2.17±0.04 4.22±0.06
DC-4 12.68±0.02 1.83±0.10 1.34±0.03 2.56±0.03 4.93±0.06
DC-5 13.68±0.02 1.34±0.10 0.96±0.04 1.94±0.04 3.69±0.06
DC-7 14.18±0.02 1.60±0.10 1.11±0.04 2.22±0.04 4.19±0.07
aLutz & Lutz (1977)
Table 2. Astrometric Reference Stars: Near-IR and Washington-DDO Photometry
ID K J-H J-K M-T2 M-51
DC-2 -0.17±0.02 0.02±0.02
DC-3 9.25±0.02 0.76±0.02 0.93±0.03 2.22±0.02 -0.07±0.02
DC-4 7.75±0.02 0.93±0.02 1.21±0.03 2.58±0.01 -0.1±0.01
DC-5 9.99±0.02 0.71±0.02 0.84±0.03 1.97±0.02 0.01±0.03
DC-7 9.99±0.02 0.67±0.02 0.88±0.03 2.25±0.01 -0.05±0.02

– 23 –
Table 3. Astrometric Reference Stars: Spectral Classifications and Spectrophotometric Parallaxes
,,
ID SpT V MV AV πabs (mas)
DC-2 B7 IVa 6.30 -0.85±0.4b 0.28 4.2±0.8
DC-2 B8 IIIc 6.30 -1.35±0.4b 0.09 3.2±0.6
DC-2 B7-8 III-IVd 6.30 -1.10±0.1 0.21 3.70±0.26
DC-3 K1 III 13.47 0.6±0.4 1.63 0.6±0.1
DC-7 G8 III 14.18 0.8±0.4 2.05 0.5±0.1
DC-4 K3 III 12.68 0.3±0.4 2.07 0.9±0.2
DC-5 G1 III 13.68 0.9±0.4 2.13 0.7±0.1
aLutz & Lutz (1977)
bWegner (2000)
cSavage, Massa, Meade, & Wesselius (1985)
dfrom membership in CepOB6 (de Zeeuw et al. 1999)
Table 4. Astrometric Reference Stars: AV from Spectrophotometry
ID AV (V-I) AV (V-R) AV (V-K) AV (J-K) < AV >a
DC-3 1.83 1.43 1.80 1.45 1.63±0.12
DC-7 2.35 1.98 2.13 1.74 2.05±0.15
DC-4 2.06 1.90 2.03 2.32 2.07±0.10
DC-5 2.37 2.02 1.96 2.15 2.13±0.10
<AV >b 2.15 1.83 1.98 1.91 1.97 ± 0.13
aaverage by star
baverage by color index

– 24 –
Table 5. δ Cep Log of Observations
Data Set mJD phase a V b B-V c
1 49908.60462 0.870 3.967 0.63
2 49942.7928 0.241 3.910 0.64
3 50087.07986 0.128 3.775 0.55
4 50104.13513 0.306 3.989 0.69
5 50630.66157 0.423 4.103 0.77
6 50668.40227 0.456 4.131 0.79
7 50799.52478 0.891 3.862 0.57
aPhase based on P = 5.d366316, T0 = 43673.644 (mJD) (Barnes
et al. (1997))
bDifferential FGS photometry. Zero point from Barnes et al.
(1997).
cEstimated from phase and Barnes et al. (1997) photometry.

– 25 –
Table 6. δ Cep and Reference Stars: Astrometry
ID ξ a η a µxb µy
b
δ Cep 45.2774±0.0003 104.9195±0.0003 0.0174±0.0002 0.0050±0.0002
DC-2 37.4174±0.0003 64.9353±0.0003 0.0215±0.0003 0.0037±0.0003
DC-3c 0.0000±0.0003 0.0000±0.0004
DC-4 131.7161±0.0002 116.1802±0.0003
DC-5 88.9765±0.0003 -27.4270±0.0003
DC-6 167.0683±0.0003 76.5763±0.0003
aξ and η are positions in arcseconds relative to DC-3
bµx and µy are relative motions in arcsec yr−1
cRA = 22h 29m 04.59s Dec = +5847’ 40.′′7, J2000, epoch = mJD 50104.1363
Table 7. HD 213307 - Elements of Perturbation Orbit
Parameter Value
α(mas) 2.0± 0.2
P(days) 390 ± 9
P(years) 1.07 ± 0.1
T0 2002.3 ± 0.1
e 0.35 ± 0.09
i() 36 ± 14
Ω() 100 ± 8
ω() 259 ± 7

– 26 –
Table 8. Final δ Cep and HD 213307 (DC-2) Absolute Parallax and Relative Proper Motion Compared to
Previous Results
Parameter δ Cep HD 213307
HST study duration 2.44 y
number of observation sets 7
ref. stars < V > 12.06
ref. stars < B − V > 1.3
ref. stars < V > excl. DC-2 13.50
ref. stars < B − V > excl. DC-2 1.6
HST Absolute Parallax 3.66 ± 0.15 3.65 ± 0.15 mas
HIPPARCOS Absolute Parallax 3.32 ± 0.58 3.43 ± 0.64 mas
AO Absolute Parallax 2.8 ± 0.7 mas
HST Relative Proper Motion 17.4 ± 0.7 21.8 ± 1.2 mas y−1
in pos. angle 73± 3 80± 5
HIPPARCOS Absolute Proper Motion 16.9 ± 3.1 16.1 ± 2.7mas y−1
in pos. angle 79± 14 74± 12

– 27 –
Table 9. HST and HIPPARCOS Absolute Parallaxes
Object HST HIP HST Reference
Prox Cen 769.7 ± 0.3 mas 772.33 ± 2.42 Benedict et al. 1999
Barnard’s Star 545.5 ± 0.3 549.3 ± 1.58 Benedict et al. 1999
Feige 24 14.6 ± 0.4 13.44 ± 3.62 Benedict et al. 2000
Wolf 1062 98.0 ± 0.4 98.56 ± 2.66 Benedict et al. 2001
RR Lyr 3.60 ± 0.20 4.38 ± 0.59 Benedict et al. 2002
δ Cep 3.66 ± 0.15 3.32 ± 0.58 this paper
HD 213307 3.65 ± 0.15 3.43 ± 0.64 this paper

– 28 –
Table 10. δ Cep Intensity-Weighted Magnitudes
mag Ja CKb DDOc
< V > 3.95 3.95 3.95
< I > 2.99 3.18
< V >-< I > 0.96 0.75
AV 0.23d 0.25
AI 0.14d
< V0 > 3.73 3.73 3.70
< I0 > 2.84 3.06
MV -3.47±0.10 -3.47±0.10
MI -4.34±0.10 -4.14±0.10
a Johnson VI photometry from Moffett & Barnes (1985)
b Transformation per Bessel (1979).
cfrom http://ddo.astro.utoronto.ca/cepheids.html
dEstimated from Section 5.3 and Savage & Mathis (1977) reddening curve.
Table 11. LMC Distance Moduli from the OGLEaCepheid Period-Luminosity Relation
, ,
Wavelength a b m m-Mb m-M = f(Z)b,c
V -2.760±0.031 17.04±0.021 15.03±0.03 18.50±0.13 18.58±0.15
I -2.962±0.021 16.56±0.014 14.40±0.02 18.53±0.13 18.61±0.15
a Udalski et al. (1999), m = a·log P + b
bErrors are RSS of m error from PL, absolute magnitude (M) error, and 0.075 magnitude
cosmic dispersion.
cFreedman et al. 2001 metallicity correction, ∆(m-M) = -0.2±0.2 mag dex−1

– 29 –
Table 12. V-band LMC Distance Moduli
No. Object Source m-M
1 δ Cep this paper, m-M = f(Z) 18.58 ± 0.15a
2 RR Lyrae Benedict et al. 2002 18.53 ± 0.18b
3 all Cepheids Benedict et al. 2002, table 10 18.53 ± 0.07c
4 δ Cep this paper, m-M6=f(Z) 18.50 ± 0.13d
5 all RR Lyr Benedict et al. 2002, table 10 18.45 ± 0.08e
6 RR Lyrae Benedict et al. 2002 18.38 ± 0.18f
aLMC Cepheid <V> from Udalski et al. (1999); Freedman et al. 2001 metallicity correction.
bCaretta et al. (2000) LMC <VRR(0) > = 19.14 (includes +0.03, < [Fe/H] > correction).
cWeighted average. Error is standard deviation of the mean from four independent techniques.
dLMC Cepheid <V> from Udalski et al. (1999); no metallicity correction.
eWeighted average. Error is standard deviation of the mean from five independent techniques.
fUdalski et al. (1999) LMC <VRR(0) > = 18.94 (+0.05, < [FeH] > correction) = 18.99

– 30 –
150
100
50
0
-50
Dec
(")
150 100 50 0 -50RA (")
δ Cep
DC-2AV=0.21
DC-3AV=1.61
DC-4AV=2.08
DC-5AV=2.14
DC-7AV=2.05
Fig. 1.— δ Cep and astrometric reference stars. Symbol size is indicative of V magnitude (Table 1). The
numbers within each identification box are the per-star <AV > from Table 4, Section 3.3 and E(B-V) per
100 pc from Table 3.

– 31 –
-0.3
-0.2
-0.1
0.0
0.1
M -
51
2.52.01.51.0M-T2
34
5
7
AV = 1.0
δ Cep Reference Stars
Fig. 2.— M-DDO51 (M-51) vs M-T2 color-color diagram for reference stars DC-3 through DC-7. The solid
line is the division between luminosity class V and luminosity class III stars. Giants are above the line,
dwarfs below. The reddening vector is for AV = 1.0. The numbers are the reference star ID’s plotted at the
observed values. The circles are de-reddened values, based on the per-star <AV > from Table 4.

– 32 –
2.0
1.5
1.0
0.5
0.0
V-R
F5VG0VG5V
K0V
K5V
M0V
G0IIIG5III
K0III
K5IIIM0IIIM2III
DC-4
DC-5
DC-3
DC-7
Av = 1.0
3
2
1
0
V-I
54321V-K
F5VG0VG5V
K0V
K5V
M0V
G0IIIG5IIIK0III
K5IIIM0III
M2III
DC-3
DC-4
DC-5
DC-7
Av = 1.0
Fig. 3.— V-R vs V-K and V-I vs V-K color-color diagrams for reference stars DC-3 through DC-7. The
dashed line is the locus of dwarf (luminosity class V) stars of various spectral types; the dot-dashed line is
for giants (luminosity class III). The reddening vector is for an AV = 1.
– 33 –
40
30
20
10
0
Num
ber
X Residualsσ = 1.5 masN = 127
δ Cep &Reference Stars
40
30
20
10
0
Num
ber
-10 -5 0 5 10mas
Y Residualsσ = 1.4 masN = 127
Fig. 4.— Histograms of x and y residuals obtained from modeling δ Cep and the astrometric reference stars
with equations 4 and 5. Distributions are fit with Gaussians whose σ’s are noted in the plots.

– 34 –
HST HIP AO BE
δ Cep5
4
3
2
1
0
Fig. 5.— Absolute parallax determinations for δ Cep. We compare astrometric results from HST,
HIPPARCOS, and a recent determination from Allegheny Observatory (AO, Gatewood et al. 1998).
Nordgren et al. (2002) have derived a parallax from a new calibration of the Barnes-Evans relation, denoted
BE.

– 35 –
-4
-2
0
2
4
mas
-4 -2 0 2 4 mas
N
E
MA ~ 4.0 MO, MB ~ 1.6 M
O
α =2.0 mas, i = 35°K1 = 15 km s-1
HD 213307π = 3.66 mas
Fig. 6.— Reference star DC-2 (HD 213307) astrometric residuals from modeling with equations 6 and 7.
Each observational epoch (denoted Data Set in Table 5) is coded with a unique symbol. The emphasized
symbols are plotted on the derived orbit at the epoch of observation. The orbit is preliminary, and suggests
a M = 1.6M⊙ companion.
– 36 –
1
2
4
68
10
2
4
68
100
2
4
68
1000
HS
T P
aral
lax
(mas
)
12 3 4 5 6
102 3 4 5 6
1002 3 4 5 6
1000HIPPARCOS Parallax (mas)
-6
-4
-2
0
2
4
6
HIP
Res
(m
as)
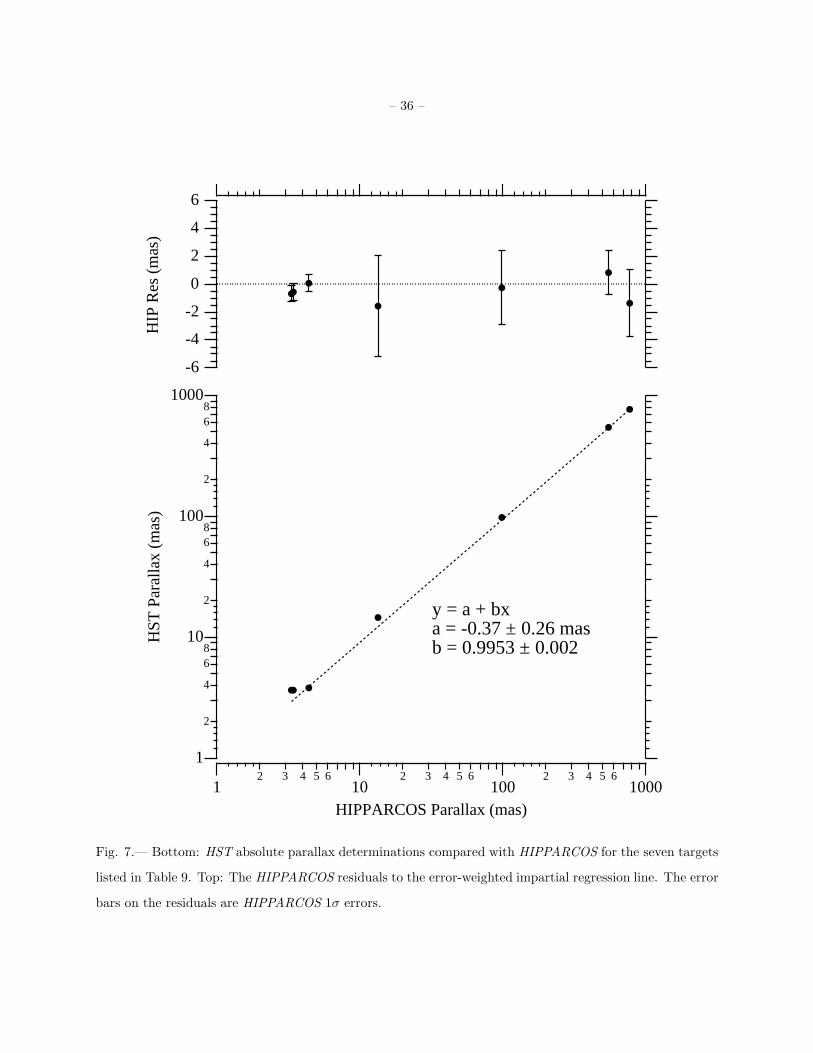
y = a + bxa = -0.37 ± 0.26 masb = 0.9953 ± 0.002
Fig. 7.— Bottom: HST absolute parallax determinations compared with HIPPARCOS for the seven targets
listed in Table 9. Top: The HIPPARCOS residuals to the error-weighted impartial regression line. The error
bars on the residuals are HIPPARCOS 1σ errors.

– 37 –
18.718.618.518.418.318.2LMC Distance Modulus
1
2
3
4
5
1 δ Cep - this paper, Udalski (1999), m-M=f(Z)2 RR Lyr - HST, Carretta (2000)3 <Cepheids>4 δ Cep - this paper, Udalski (1999)5 <RR Lyr>6 RR Lyr - HST, Udalski (1999)
6
Fig. 8.— Recent determinations of the V-band distance modulus of the Large Magellanic Cloud (see
Table 12). Values labeled 3 and 5 are weighted averages of a number of independent determinations using
Cepheids (3) and RR Lyr variables (5).