Embed Size (px)
Citation preview
Lesson Element
Biological Psychology Core Study
Area: Developmental Psychology
Key Theme – Regions of the brain Casey et al. (2011) Behavioural and neural correlates of delay of gratification 40 years later
Instructions and answers for teachers
These instructions and answers to suggested activities cover the student activity section which can be found on page 5. This Lesson element supports OCR AS and A Level Psychology.
When distributing the activity section to the students either as a printed copy or as a Word file you will need to remove the teacher instructions section.
AimThe aim of this lesson element is to provide a structured activity that will enable learners to cover the specification requirements for the Casey et al. core study.
January 2016 1
This activity offers an opportunity for English skills development.
This activity offers an opportunity for maths skills development.
This is a challenging task and would be interesting to get different students to read their answers out.
Objectives‘Tell the story’ of the core study in terms of:
Background.
Method
o Design
o Sample
o Materials/apparatus
o Procedure.
Results.
Conclusions.
AbstractCasey examined areas of the brain involved in self-regulation (self-control to tempting or alluring stimuli) in a sample of adults who had performed the delay of gratification task 4 decades ago as pre-schoolers. Nearly 60 individuals, now in their mid-forties, were tested on “hot” (smiling face) and “cool” (fearful face) versions of a go/no-go task to assess whether delay of gratification in childhood determines the ability to control impulses as adults. Individuals who were less able to delay gratification in preschool and consistently showed low self-control abilities in their twenties and thirties (on self-report scales measuring levels of self-control) performed more poorly than did high delayers when having to suppress a response to a happy face but not to a neutral or fearful face. This finding suggests that sensitivity to environmental hot cues plays a significant role in individuals’ ability to suppress actions towards alluring stimuli. 26 of these participants underwent functional imaging (brain scanning) to see if there were differences (between high and low delayers of gratification) in brain activity in an area called frontostriatal circuitry when taking the task. One area (prefrontal cortex) was more active in high delayers than low delayers on no-go and go trails, whereas, the ventral striatum showed higher activity (recruitment) in low delayers. Casey concluded that, resistance to temptation as measured originally by the delay of gratification (cookie) task as a child, is a relatively stable (consistent) individual difference that predicts reliable biases in frontostriatal circuitries that integrate motivational and control processes.
TaskWrite a tweet (max 140 characters) to summarise the Abstract.
January 2016 2
Research Methods Opportunity – What is the purpose of an abstract?
Using your notes, textbooks and/or OCR core study guide, complete the following tasks...
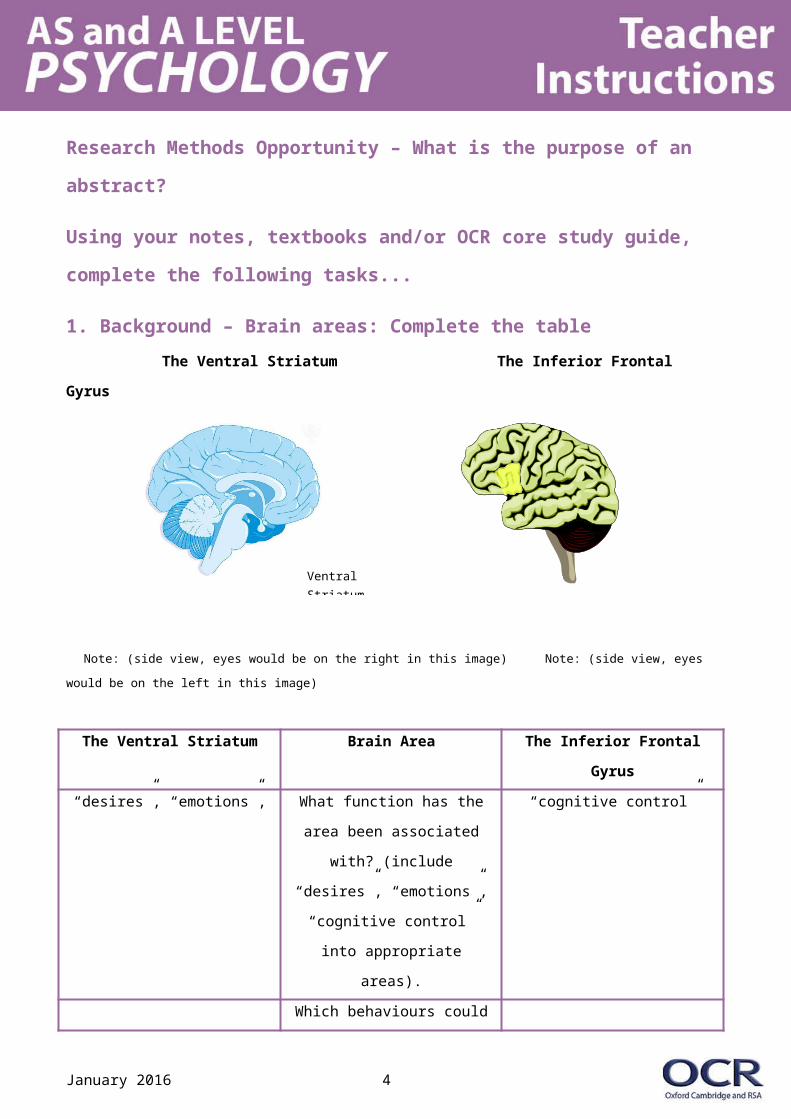
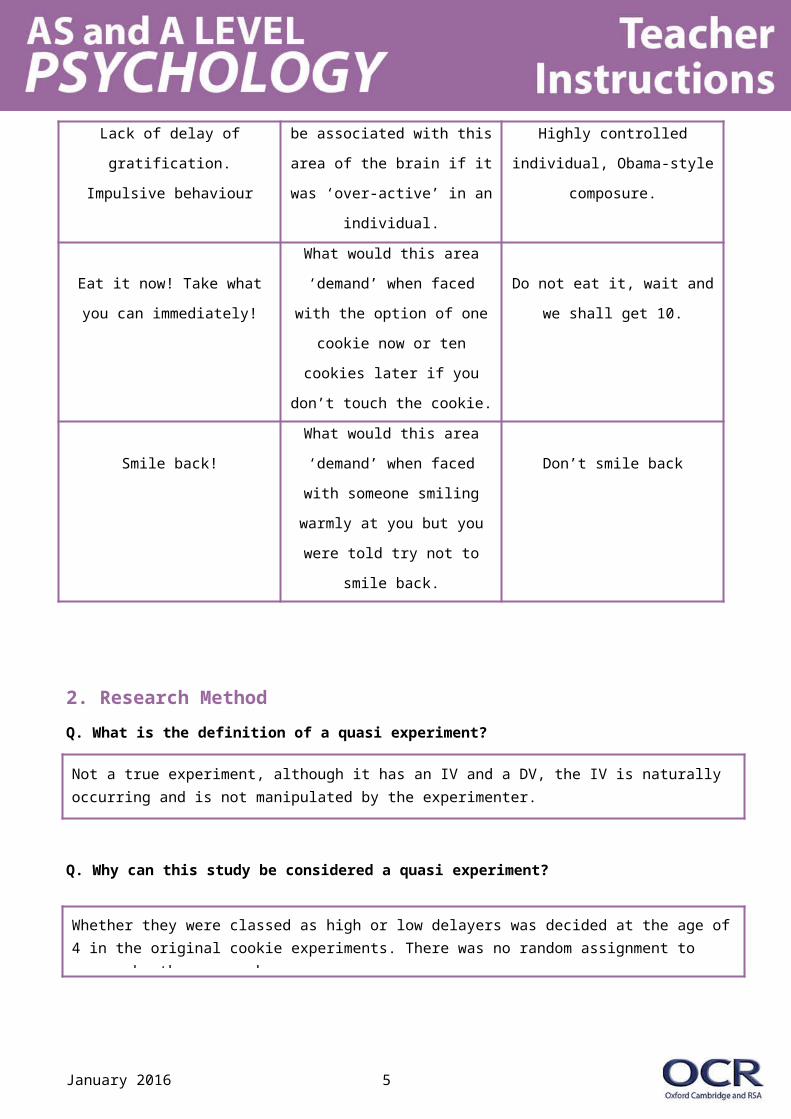
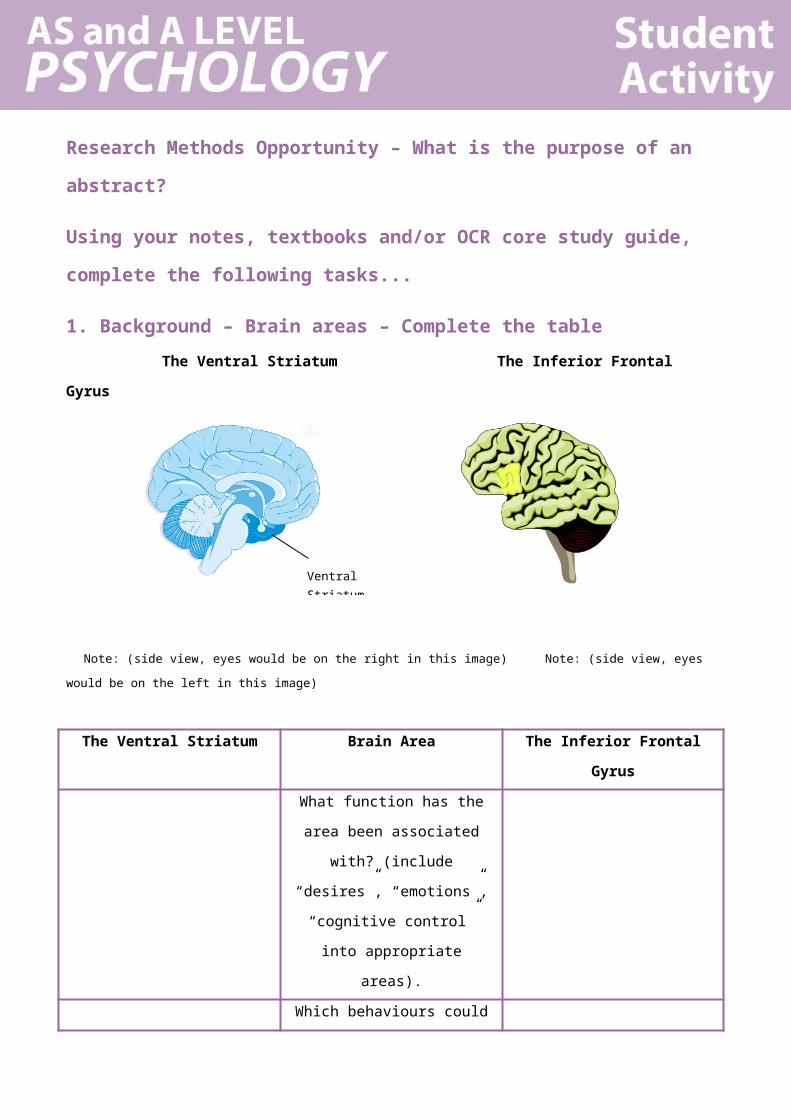
1. Background – Brain areas: Complete the tableThe Ventral Striatum The Inferior Frontal Gyrus
Note: (side view, eyes would be on the right in this image) Note: (side view, eyes would be on the left in this image)
The Ventral Striatum Brain Area The Inferior Frontal Gyrus
“desires”, “emotions”, What function has the area
been associated with? (include
“desires”, “emotions”, “cognitive
control” into appropriate areas).
“cognitive control”
Lack of delay of gratification.
Impulsive behaviour
Which behaviours could be
associated with this area of the
brain if it was ‘over-active’ in an
individual.
Highly controlled individual,
Obama-style composure.
Eat it now! Take what you can
immediately!
What would this area ‘demand’
when faced with the option of
one cookie now or ten cookies
later if you don’t touch the
cookie.
Do not eat it, wait and we shall
get 10.
Smile back!
What would this area ‘demand’
when faced with someone
smiling warmly at you but you
were told try not to smile back.
Don’t smile back
January 2016 3
Ventral Striatum
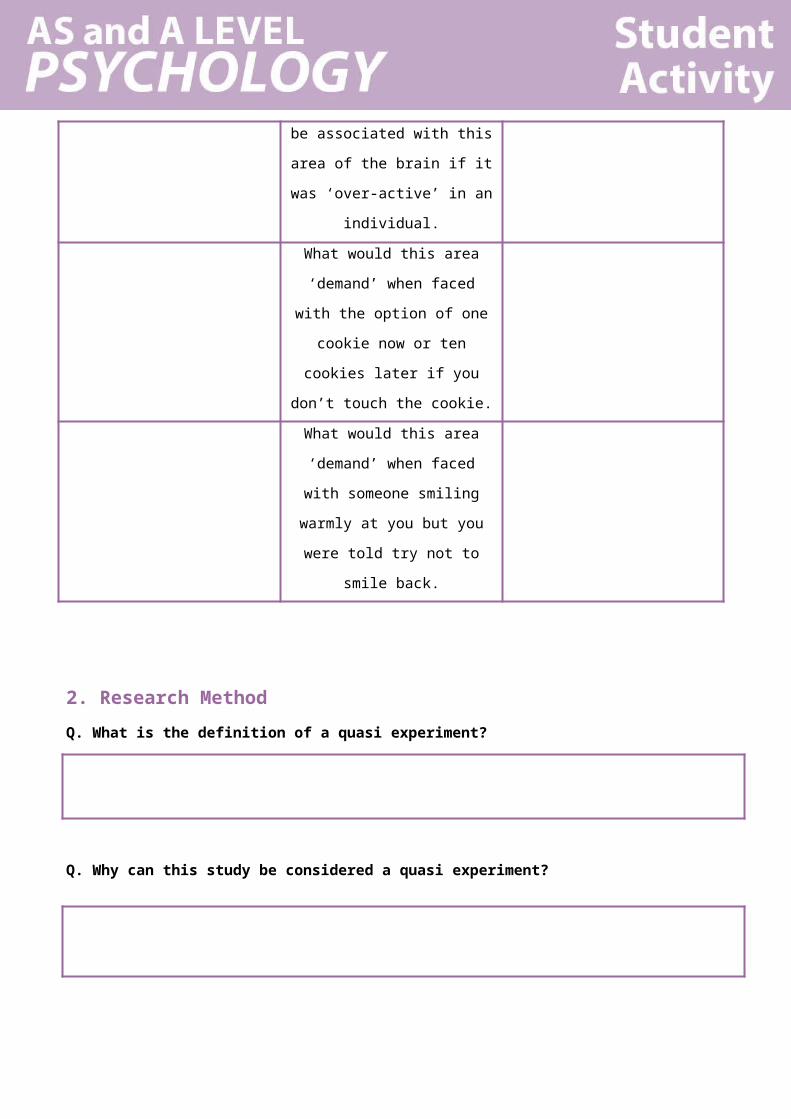
2. Research MethodQ. What is the definition of a quasi experiment?
Q. Why can this study be considered a quasi experiment?
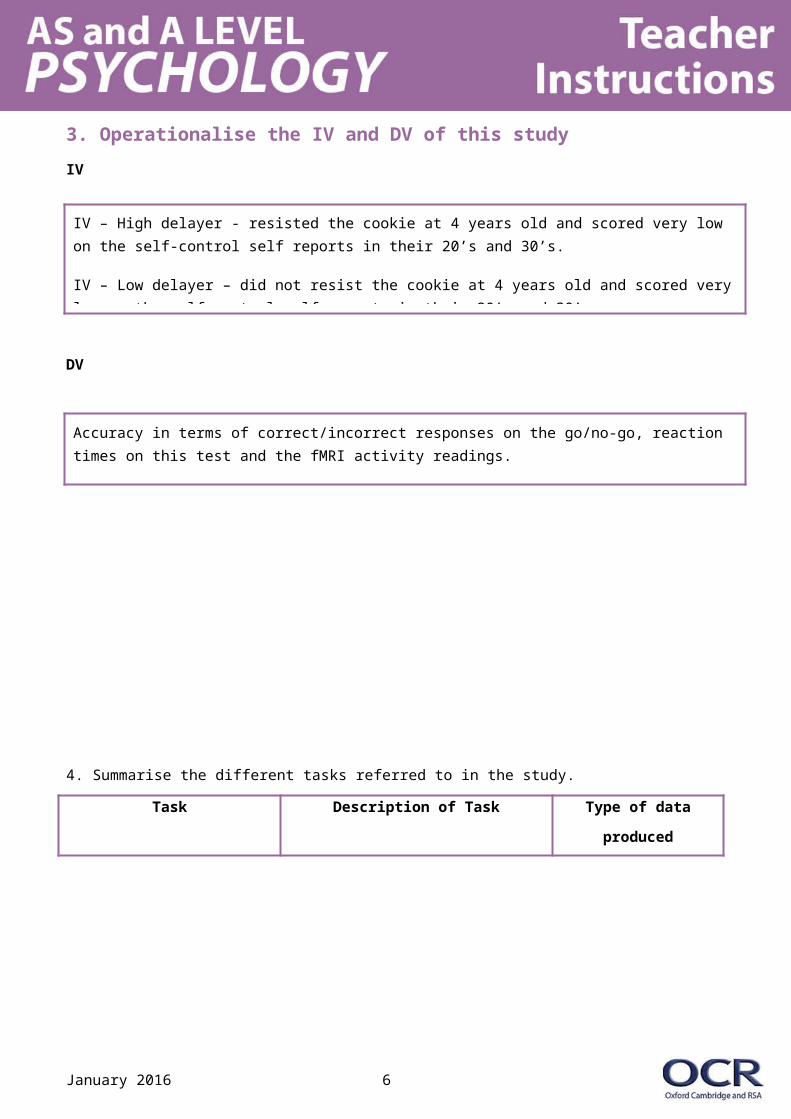
3. Operationalise the IV and DV of this studyIV
DV
January 2016 4
Whether they were classed as high or low delayers was decided at the age of 4 in the original cookie experiments. There was no random assignment to groups by the researchers.
Not a true experiment, although it has an IV and a DV, the IV is naturally occurring and is not manipulated by the experimenter.
IV – High delayer - resisted the cookie at 4 years old and scored very low on the self-control self reports in their 20’s and 30’s.
IV – Low delayer – did not resist the cookie at 4 years old and scored very low on the self-control self reports in their 20’s and 30’s.
Accuracy in terms of correct/incorrect responses on the go/no-go, reaction times on this test and the fMRI activity readings.
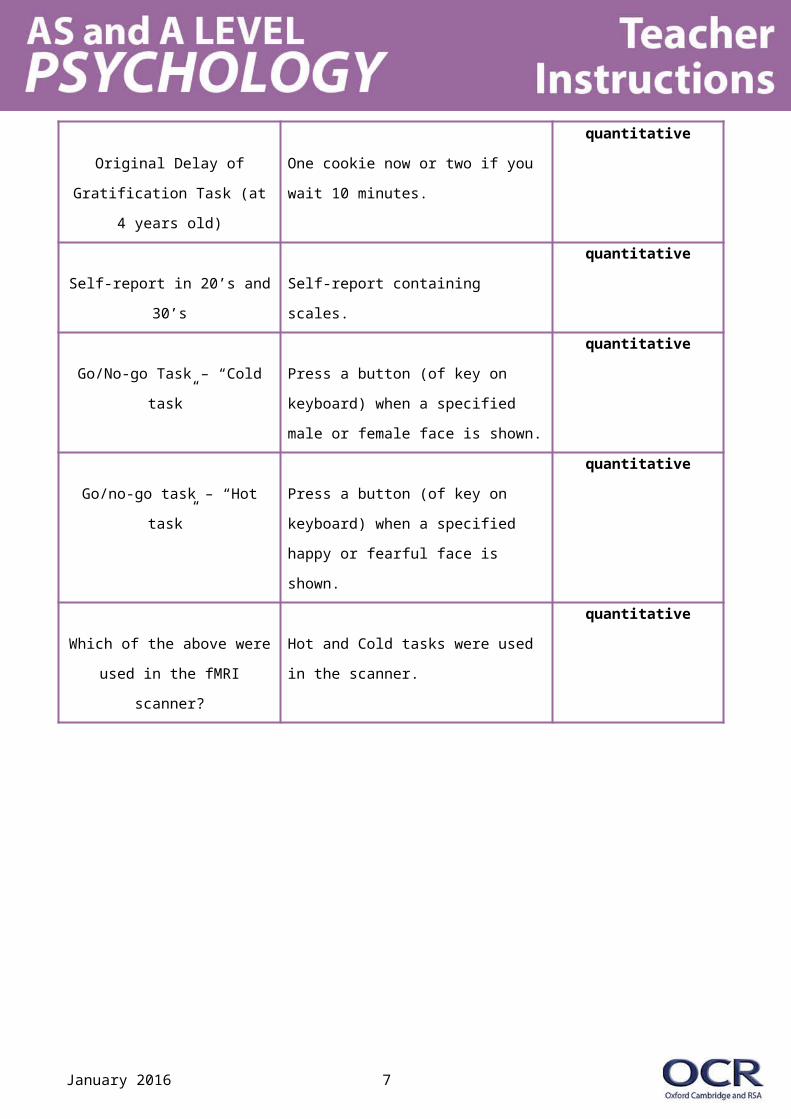
4. Summarise the different tasks referred to in the study.
Task Description of Task Type of data produced
Original Delay of Gratification
Task (at 4 years old)
One cookie now or two if you wait 10
minutes.
quantitative
Self-report in 20’s and 30’s Self-report containing scales.
quantitative
Go/No-go Task – “Cold task” Press a button (of key on keyboard)
when a specified male or female face is
shown.
quantitative
Go/no-go task – “Hot task” Press a button (of key on keyboard)
when a specified happy or fearful face
is shown.
quantitative
Which of the above were used
in the fMRI scanner?
Hot and Cold tasks were used in the
scanner.
quantitative
January 2016 5
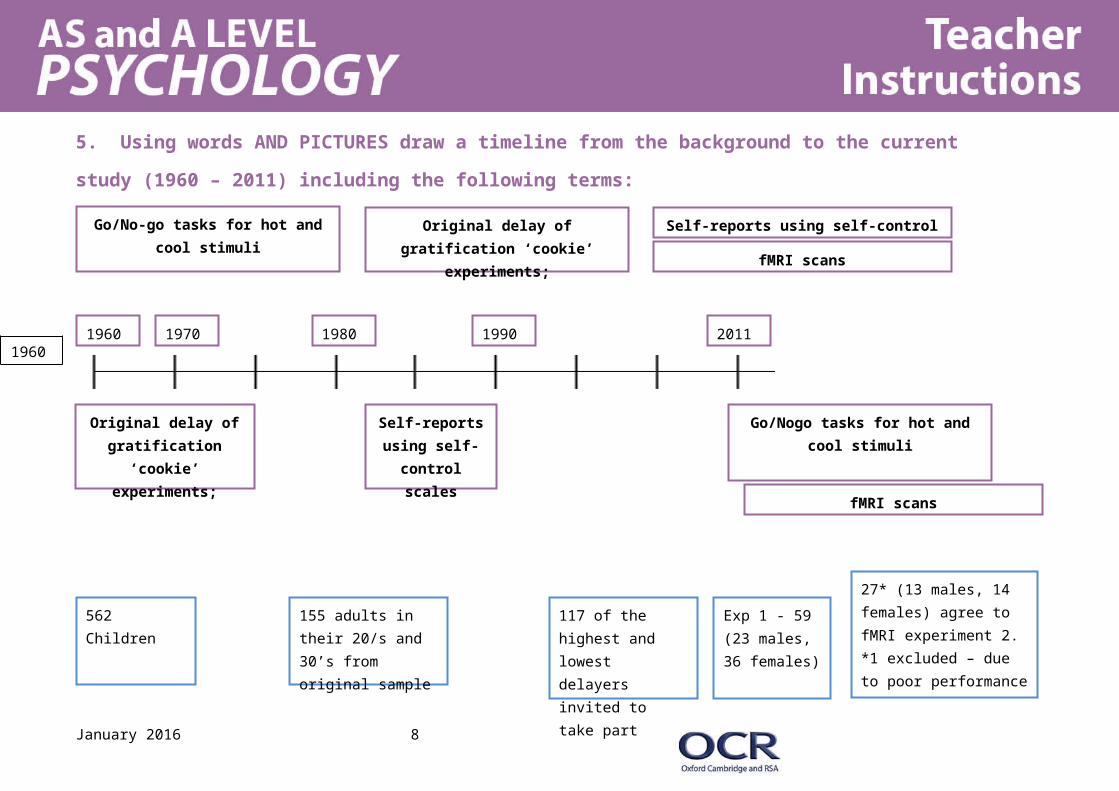
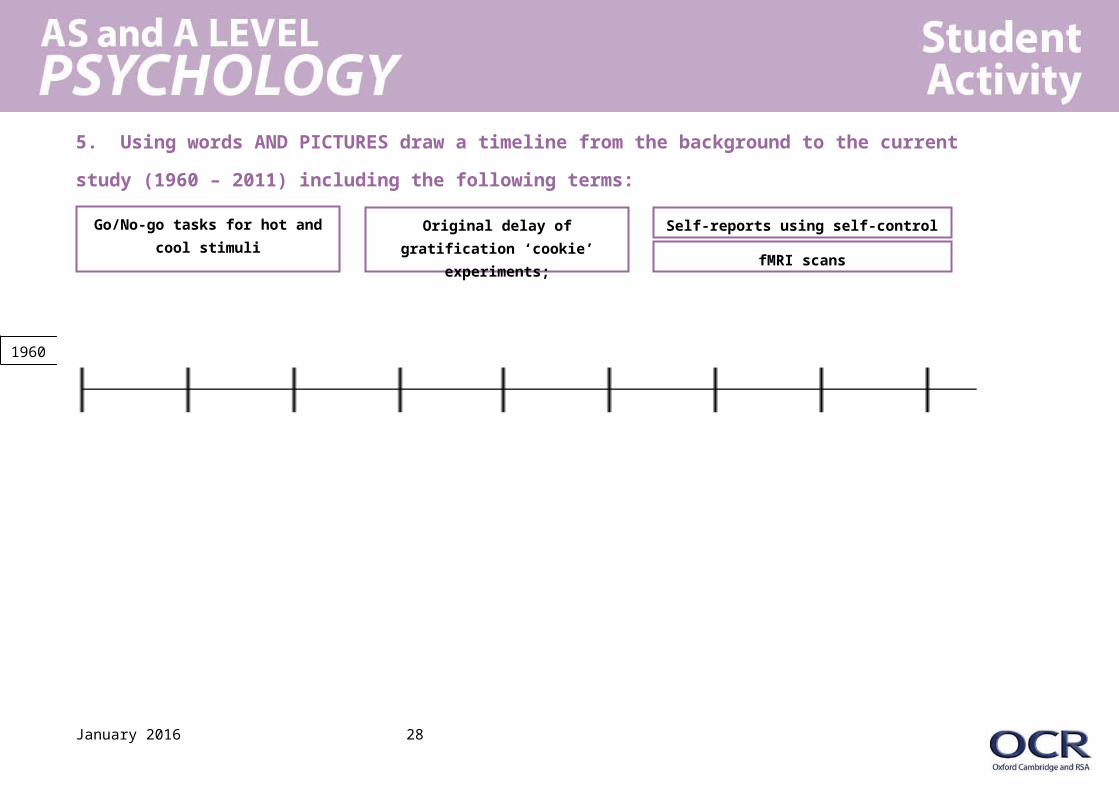
5. Using words AND PICTURES draw a timeline from the background to the current study (1960 – 2011) including the following terms:
6. Now add (using a different colour) details to represent how the sample changed over that time.
January 2016 6
562 Children 155 adults in their 20/s and 30’s from original sample
117 of the highest and lowest delayers invited to take part
Exp 1 - 59 (23 males, 36 females)
27* (13 males, 14 females) agree to fMRI experiment 2. *1 excluded – due to poor performance
19601960 1970 1980 1990 2011
Go/No-go tasks for hot and cool stimuli
Original delay of gratification ‘cookie’ experiments;
Self-reports using self-control scales
fMRI scans
Original delay of gratification ‘cookie’
experiments;
Self-reports using self-
control scales
Go/Nogo tasks for hot and cool stimuli
fMRI scans
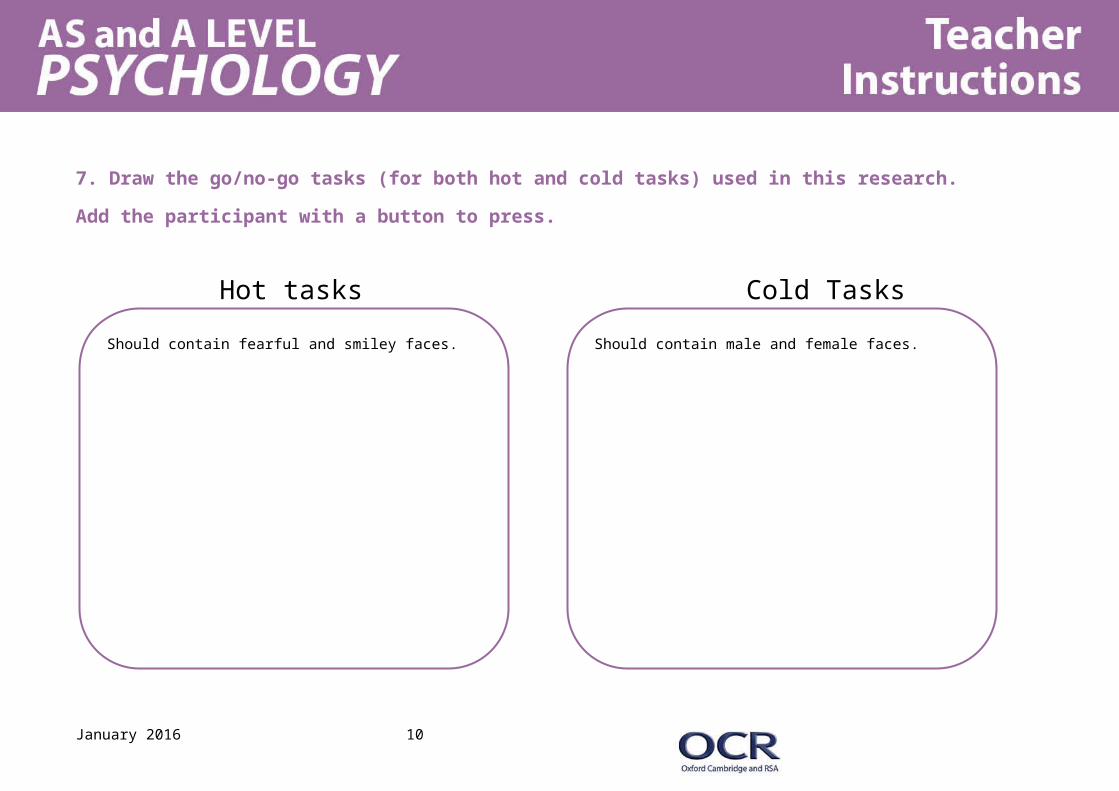
7. Draw the go/no-go tasks (for both hot and cold tasks) used in this research. Add the participant with a button to press.
Hot tasks Cold Tasks
January 2016 7
Should contain fearful and smiley faces. Should contain male and female faces.
8. Draw a rough bar chart (as you do not have the raw data) to visually represent the different findings.
Outside the scanner
Reaction Times: a) “Go tasks” (click when you see an X face (male, female, happy, fearful)
Finding:
There were no effects of delay group on reactiontime measures to correct “go” trials.
Visually represent this task in this box:
January 2016 8
High Delayers
Low Delayers
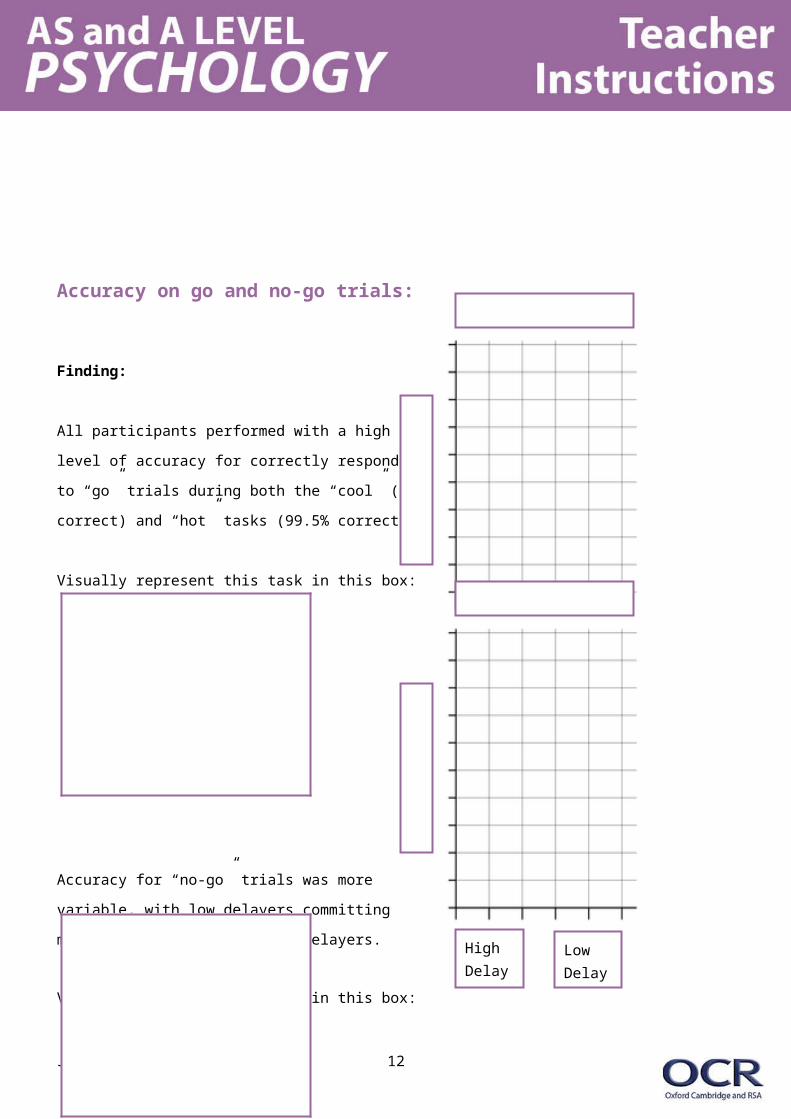
Accuracy on go and no-go trials:
Finding:
All participants performed with a high
level of accuracy for correctly responding
to “go” trials during both the “cool” (99.8%
correct) and “hot” tasks (99.5% correct).
Visually represent this task in this box:
Accuracy for “no-go” trials was more
variable, with low delayers committing
more false alarms than high delayers.
Visually represent this task in this box:
January 2016 9
Cool Hot
High Delay
Low Delay
January 2016 10

Accuracy on cool vs. hot tasks
Finding:
Low and high delayers performed comparably
on the “cool” task but the low delayers trended
towards performing more poorly on the “hot” task
than the high delayers
Visually represent this task in this box:
Only the low delay group showed a
significant decrement in performance
for the “hot” trials relative to the “cool” trials.
Visually represent this task in this box:
January 2016 11
Cool Task
Hot Task
Hot trials
Cool Trials
Accuracy of Low Delay group
January 2016 12

Experiment 2 - Inside the ScannerFinding:
Reaction times (inside the scanner)
The two delay groups did not differ significantly in reaction times in correct “go” trials (P ≥ 0.4).
Stats Question!Q. What does (P ≥ 0.4) mean?
Accuracy on go and no/go trials inside the scanner:
Overall accuracy rates for the “hot” (emotions) go/no-go task were uniformly high for “go” trials (mean
98.2% correct hits) with more variable performance to “no-go” trials (12.4% false alarm rate).
Q. Why, as in experiment 1, are the “hot” go trials not producing significant differences between the high and low delay groups?
As in Experiment 1, low delayers committed more false alarms than high delayers (but not significantly).
January 2016 13
The difference was only significant with a 40% chance of error which is not close to the 5% psychologist work to as a minimum.
Because the low delayers have no problem with “go” trials because their impulsivity benefits this task.

Experiment 2 - fMRI imaging results
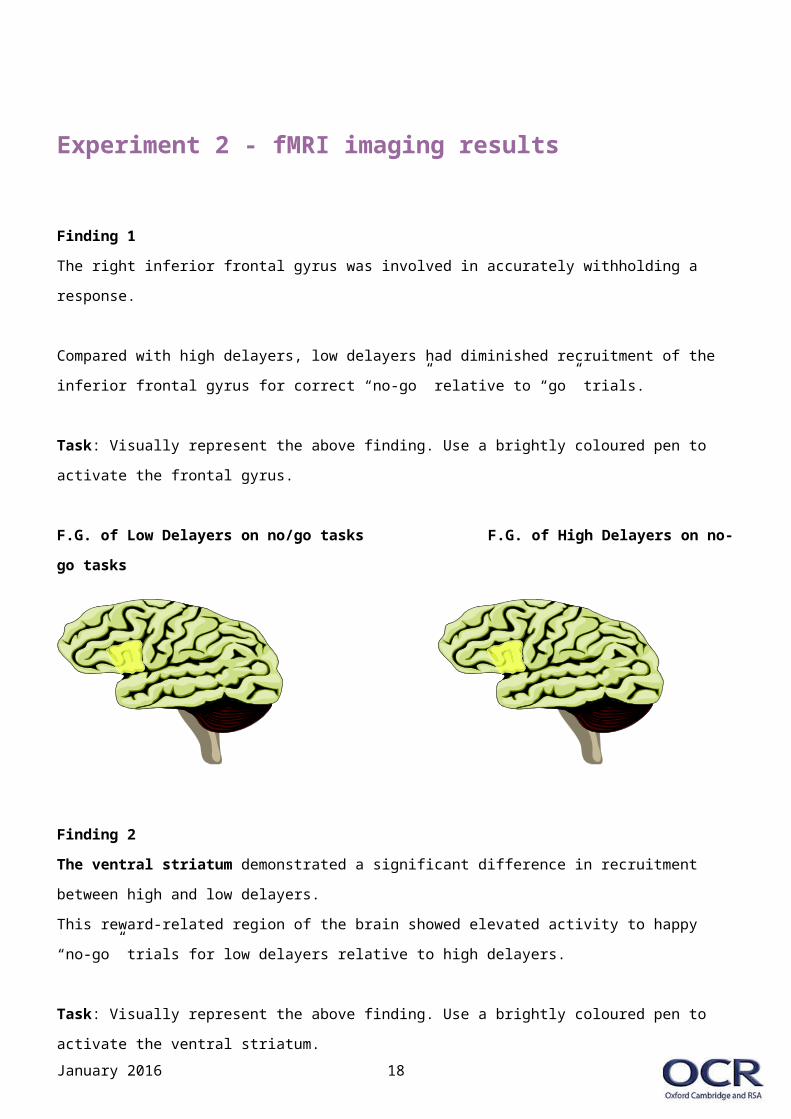
Finding 1The right inferior frontal gyrus was involved in accurately withholding a response.
Compared with high delayers, low delayers had diminished recruitment of the inferior frontal gyrus for
correct “no-go” relative to “go” trials.
Task: Visually represent the above finding. Use a brightly coloured pen to activate the frontal gyrus.
F.G. of Low Delayers on no/go tasks F.G. of High Delayers on no-go tasks
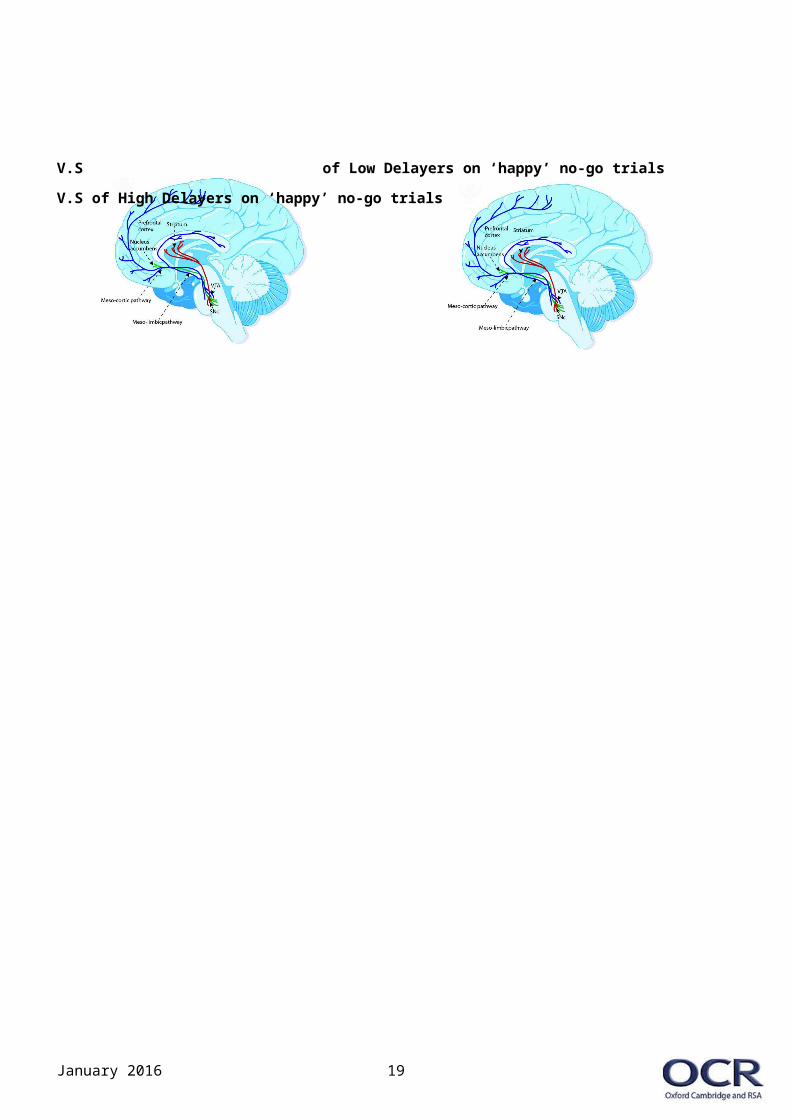
Finding 2The ventral striatum demonstrated a significant difference in recruitment between high and low
delayers.
This reward-related region of the brain showed elevated activity to happy “no-go” trials for low delayers
relative to high delayers.
Task: Visually represent the above finding. Use a brightly coloured pen to activate the ventral striatum.
V.S of Low Delayers on ‘happy’ no-go trials V.S of High Delayers on ‘happy’ no-go trials
January 2016 14
Summarise the Conclusions of the study using these questions
Q1. What does the study show about people’s individual differences to “hot” cues (or alluring stimuli)?
Q2. What does the fact that participants who performed poorly on the original delay of gratification task
at the age of four also showed differences on the current study mean about the ability to delay
gratification?
Q3. What does the study show us about the effect that different levels of alluring stimuli can have in
highlighting our individual differences?
Q4. Overall, what does this study tell us about human individual differences in terms of our ability to
resist temptation and delay gratification for future gain?
That there are individual differences that seem set from at least the age of 4 which impact our reactions to alluring stimuli. High delayers can resist these consistently whereas low delayers find it difficult to resist these cues and not behaviourally react.
Original delay if gratification task is a relatively stable individual difference that predicts biases in
frontostriatal circuitries that join motivational and control processes.
Ability to resist temptation depends on context. The more tempting the stimuli, the more obvious
individual differences are when they are trying to suppress the temptation.
Individuals at 4 years old continue to show reduced self-control abilities as adults in suppressing responses to positive social cues.
We’d like to know your view on the resources we produce. By clicking on ‘Like’ or ‘Dislike’ you can help us to ensure that our resources work for you. When the email template pops up please add additional comments if you wish and then just click ‘Send’. Thank you.
If you do not currently offer this OCR qualification but would like to do so, please complete the Expression of Interest Form which can be found here: www.ocr.org.uk/expression-of-interest
OCR Resources: the small print
OCR’s resources are provided to support the teaching of OCR specifications, but in no way constitute an endorsed teaching method that is required by the Board, and the
decision to use them lies with the individual teacher. Whilst every effort is made to ensure the accuracy of the content, OCR cannot be held responsible for any errors or omissions
within these resources.
© OCR 2016 - This resource may be freely copied and distributed, as long as the OCR logo and this message remain intact and OCR is acknowledged as the originator of this work.
OCR acknowledges the use of the following content: Maths and English icons: Air0ne/Shutterstock.com: Pages 3,12,, 16, 25 Image of Brain Designua/Shutterstock.com, Median
sagittal section of the brain, BSIP/Universal Images GroupPlease get in touch if you want to discuss the accessibility of resources we offer to support delivery of our qualifications: [email protected]

Lesson Element Biological Psychology Core Study Key Theme – Regions of the brain Casey et al. (2011) Behavioural and neural correlates of delay of gratification 40 years later: Procedure
AbstractCasey examined areas of the brain involved in self-regulation (self-control to tempting or alluring stimuli) in a sample of adults who had performed the delay of gratification task 4 decades ago as pre-schoolers. Nearly 60 individuals, now in their mid-forties, were tested on “hot” (smiling face) and “cool” (fearful face) versions of a go/no-go task to assess whether delay of gratification in childhood determines the ability to control impulses as adults. Individuals who were less able to delay gratification in preschool and consistently showed low self-control abilities in their twenties and thirties (on self-report scales measuring levels of self-control) performed more poorly than did high delayers when having to suppress a response to a happy face but not to a neutral or fearful face. This finding suggests that sensitivity to environmental hot cues plays a significant role in individuals’ ability to suppress actions towards alluring stimuli. 26 of these participants underwent functional imaging (brain scanning) to see if there were differences (between high and low delayers of gratification) in brain activity in an area called frontostriatal circuitry when taking the task. One area (prefrontal cortex) was more active in high delayers than low delayers on no-go and go trails, whereas, the ventral striatum showed higher activity (recruitment) in low delayers. Casey concluded that, resistance to temptation as measured originally by the delay of gratification (cookie) task as a child, is a relatively stable (consistent) individual difference that predicts reliable biases in frontostriatal circuitries that integrate motivational and control processes.
TaskWrite a tweet (max 140 characters) to summarise the Abstract.
Research Methods Opportunity – What is the purpose of an abstract?
Using your notes, textbooks and/or OCR core study guide, complete the following tasks...
1. Background – Brain areas – Complete the tableThe Ventral Striatum The Inferior Frontal Gyrus
Note: (side view, eyes would be on the right in this image) Note: (side view, eyes would be on the left in this image)
The Ventral Striatum Brain Area The Inferior Frontal Gyrus
What function has the area
been associated with? (include
“desires”, “emotions”, “cognitive
control” into appropriate areas).
Which behaviours could be
associated with this area of the
brain if it was ‘over-active’ in an
individual.
What would this area ‘demand’
when faced with the option of
one cookie now or ten cookies
later if you don’t touch the
cookie.
What would this area ‘demand’
when faced with someone
smiling warmly at you but you
were told try not to smile back.
Ventral Striatum
2. Research MethodQ. What is the definition of a quasi experiment?
Q. Why can this study be considered a quasi experiment?
3. Operationalise the IV and DV of this studyIV
DV
4. Summarise the different tasks referred to in the study.
Task Description of Task Type of data produced
Original Delay of Gratification
Task (at four years old)
Self-report in 20s and 30s
Go/no-go task – “Cold task”
Go/no-go task – “Hot task”
Which of the above were used
in the fMRI scanner?

5. Using words AND PICTURES draw a timeline from the background to the current study (1960 – 2011) including the following terms:
6. Now add (using a different colour) details to represent how the sample changed over that time.
January 2016 21
1960
Go/No-go tasks for hot and cool stimuli
Original delay of gratification ‘cookie’ experiments;
Self-reports using self-control scales
fMRI scans
7. Draw the go/no-go tasks (for both hot and cold tasks) used in this research. Add the participant with a button to press.
Hot tasks Cold Tasks
January 2016 22
8. Draw a rough bar chart (as you do not have the raw data) to visually represent the different findings.
Outside the scanner
Reaction Times: a) “Go tasks” (click when you see an X face (male, female, happy, fearful)
Finding:
There were no effects of delay group on reactiontime measures to correct “go” trials.
Visually represent this task in this box:
January 2016 23
High Delayers
Low Delayers
Accuracy on go and no/go trials
Finding:
All participants performed with a high
level of accuracy for correctly responding
to “go” trials during both the “cool” (99.8%
correct) and “hot” tasks (99.5% correct).
Visually represent this task in this box:
Accuracy for “no-go” trials was more
variable, with low delayers committing
more false alarms than high delayers.
Visually represent this task in this box:
January 2016 24
Cool Hot
High Delay
Low Delay
January 2016 25
Accuracy on cool vs. hot tasks
Finding:
Low and high delayers performed comparably
on the “cool” task but the low delayers trended
towards performing more poorly on the “hot” task
than the high delayers
Visually represent this task in this box:
Only the low delay group showed a
significant decrement in performance
for the “hot” trials relative to the “cool” trials.
Visually represent this task in this box:
January 2016 26
Cool Task
Hot Task
Hot trials
Cool Trials
Accuracy of Low Delay group
January 2016 27
Experiment 2 - Inside the ScannerFinding:
Reaction times (inside the scanner)
The two delay groups did not differ significantly in reaction times in correct “go” trials (P ≥ 0.4).
Stats Question!Q. What does (P ≥ 0.4) mean?
Accuracy on go and no/go trials inside the scanner:
Overall accuracy rates for the “hot” (emotions) go/no-go task were uniformly high for “go” trials (mean
98.2% correct hits) with more variable performance to “no-go” trials (12.4% false alarm rate).
Q. Why, as in experiment 1, are the “hot” go trials not producing significant differences between the high and low delay groups?
As in Experiment 1, low delayers committed more false alarms than high delayers (but not significantly).
January 2016 28
Experiment 2 - fMRI imaging results
Finding 1The right inferior frontal gyrus was involved in accurately withholding a response.
Compared with high delayers, low delayers had diminished recruitment of the inferior frontal gyrus for
correct “no-go” relative to “go” trials.
Task: Visually represent the above finding. Use a brightly coloured pen to activate the frontal gyrus.
F.G. of Low Delayers on no/go tasks F.G. of High Delayers on no/go tasks
Finding 2The ventral striatum demonstrated a significant difference in recruitment between high and low
delayers.
This reward-related region of the brain showed elevated activity to happy “no-go” trials for low delayers
relative to high delayers.
Task: Visually represent the above finding. Use a brightly coloured pen to activate the ventral striatum.
V.S of Low Delayers on ‘happy’ no-go trials V.S of High Delayers on ‘happy’ no-go trials
January 2016 29
Summarise the Conclusions of the study using these questions
Q1. What does the study show about people’s individual differences to “hot” cues (or alluring
stimuli)?
Q2. What does the fact mean that participants who performed poorly on the original delay of
gratification task at the age of four also showed differences on the current study about the ability to
delay gratification?
Q3. What does the study show us about the effect that different levels of alluring stimuli can have in
highlighting our individual differences?
Q4. Overall, what does this study tell us about human individual differences in terms of our ability to
resist temptation and delay gratification for future gain?