Embed Size (px)
Citation preview
Sample Assessment Materials Pearson Edexcel Level 3 Advanced Subsidiary GCE in Statistics (8ST0)First teaching from September 2017First certifi cation from 2018 Issue 1
ASStatistics

Edexcel, BTEC and LCCI qualifications
Edexcel, BTEC and LCCI qualifications are awarded by Pearson, the UK’s largest awarding body offering academic and vocational qualifications that are globally recognised and benchmarked. For further information, please visit our qualification website at qualifications.pearson.com. Alternatively, you can get in touch with us using the details on our contact us page at qualifications.pearson.com/contactus
About Pearson
Pearson is the world's leading learning company, with 35,000 employees in more than 70 countries working to help people of all ages to make measurable progress in their lives through learning. We put the learner at the centre of everything we do, because wherever learning flourishes, so do people. Find out more about how we can help you and your learners at qualifications.pearson.com
References to third party material made in this sample assessment materials are made in good faith. Pearson does not endorse, approve or accept responsibility for the content of materials, which may be subject to change, or any opinions expressed therein. (Material may include textbooks, journals, magazines and other publications and websites.)
All information in this document is correct at time of publication.
Original Origami Artwork designed by Beth Johnson and folded by Mark BolithoOrigami photography: Pearson Education Ltd/Naki Kouyioumtzis
ISBN 978 1 4469 4615 2
All the material in this publication is copyright© Pearson Education Limited 2017
Contents
Introduction 1
General marking guidance 3
Paper 1 – sample assessment question paper 5
Paper 1 – sample mark scheme 25
Paper 2 – sample assessment question paper 39
Paper 2 – sample mark scheme 63
Edexcel, BTEC and LCCI qualifications
Edexcel, BTEC and LCCI qualifications are awarded by Pearson, the UK’s largest awarding body offering academic and vocational qualifications that are globally recognised and benchmarked. For further information, please visit our qualification website at qualifications.pearson.com. Alternatively, you can get in touch with us using the details on our contact us page at qualifications.pearson.com/contactus
About Pearson
Pearson is the world's leading learning company, with 35,000 employees in more than 70 countries working to help people of all ages to make measurable progress in their lives through learning. We put the learner at the centre of everything we do, because wherever learning flourishes, so do people. Find out more about how we can help you and your learners at qualifications.pearson.com
References to third party material made in this sample assessment materials are made in good faith. Pearson does not endorse, approve or accept responsibility for the content of materials, which may be subject to change, or any opinions expressed therein. (Material may include textbooks, journals, magazines and other publications and websites.)
All information in this document is correct at time of publication.
Original Origami Artwork designed by Beth Johnson and folded by Mark BolithoOrigami photography: Pearson Education Ltd/Naki Kouyioumtzis
ISBN 978 1 4469 4615 2
All the material in this publication is copyright© Pearson Education Limited 2017

Introduction
The Pearson Edexcel Level 3 Advanced Subsidiary GCE in Statistics is designed for use in schools and colleges. It is part of a suite of AS/A Level qualifications offered by Pearson.
These sample assessment materials have been developed to support this qualification and will be used as the benchmark to develop the assessment students will take.
The booklet ‘Statistical formulae and tables’ will be provided for use with these assessments and can be downloaded from our website, qualifications.pearson.com.
1Pearson Edexcel Level 3 Advanced Subsidiary GCE in Statistics – Sample Assessment Materials Issue 1 – September 2017 © Pearson Education Limited 2017

2 Pearson Edexcel Level 3 Advanced Subsidiary GCE in Statistics – Sample Assessment Materials Issue 1 – September 2017 © Pearson Education Limited 2017
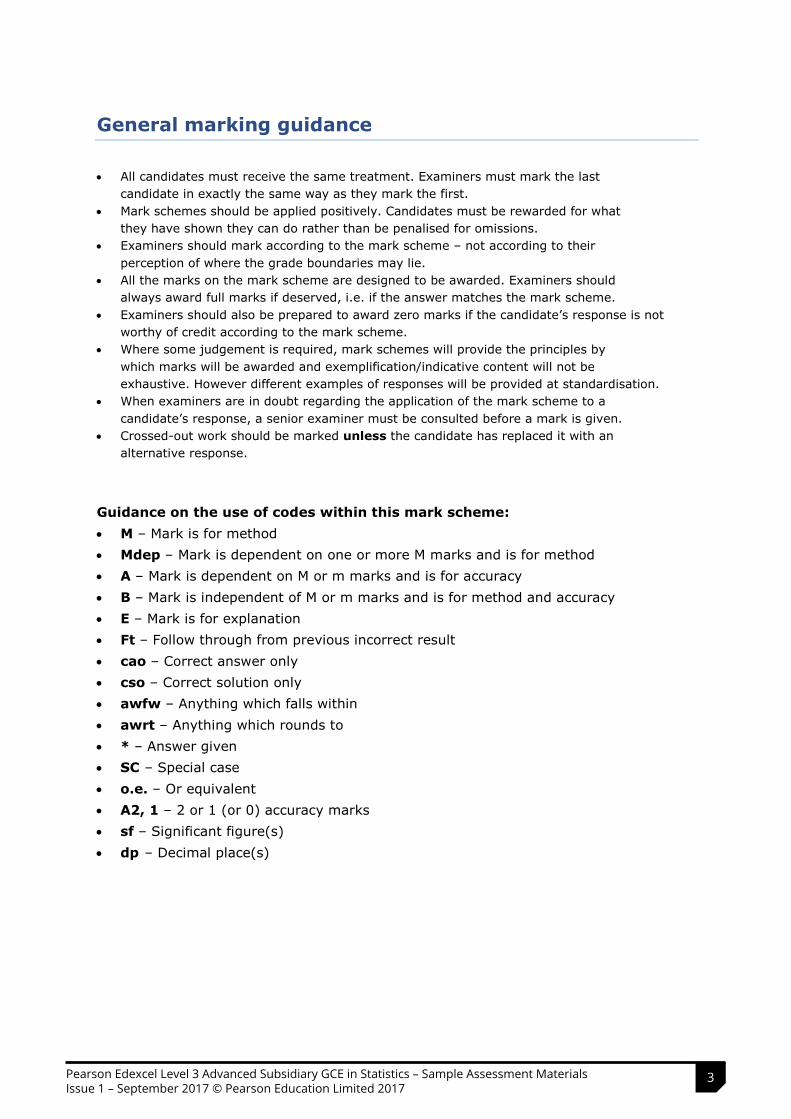
General marking guidance
• All candidates must receive the same treatment. Examiners must mark the lastcandidate in exactly the same way as they mark the first.
• Mark schemes should be applied positively. Candidates must be rewarded for whatthey have shown they can do rather than be penalised for omissions.
• Examiners should mark according to the mark scheme – not according to theirperception of where the grade boundaries may lie.
• All the marks on the mark scheme are designed to be awarded. Examiners shouldalways award full marks if deserved, i.e. if the answer matches the mark scheme.
• Examiners should also be prepared to award zero marks if the candidate’s response is not worthy of credit according to the mark scheme.
• Where some judgement is required, mark schemes will provide the principles bywhich marks will be awarded and exemplification/indicative content will not beexhaustive. However different examples of responses will be provided at standardisation.
• When examiners are in doubt regarding the application of the mark scheme to acandidate’s response, a senior examiner must be consulted before a mark is given.
• Crossed-out work should be marked unless the candidate has replaced it with analternative response.
Guidance on the use of codes within this mark scheme:• M – Mark is for method• Mdep – Mark is dependent on one or more M marks and is for method• A – Mark is dependent on M or m marks and is for accuracy• B – Mark is independent of M or m marks and is for method and accuracy• E – Mark is for explanation• Ft – Follow through from previous incorrect result• cao – Correct answer only• cso – Correct solution only• awfw – Anything which falls within• awrt – Anything which rounds to• * – Answer given• SC – Special case• o.e. – Or equivalent• A2, 1 – 2 or 1 (or 0) accuracy marks• sf – Significant figure(s)• dp – Decimal place(s)
3Pearson Edexcel Level 3 Advanced Subsidiary GCE in Statistics – Sample Assessment Materials Issue 1 – September 2017 © Pearson Education Limited 2017
No method shown
Where the question specifically requires a particular method to be used, we must usually see evidence of use of this method.
Where the answer can be reasonably obtained without showing working and it is very unlikely that the correct answer can be obtained by using an incorrect method, we must award full marks. However, the obvious penalty to candidates showing no working is that incorrect answers, however close, earn no marks.
Where a question asks the candidate to state or write down a result, no method need be shown for full marks.
Where the permitted calculator has functions which reasonably allow the solution of the question directly, the correct answer without working earns full marks, unless it is given to less than the degree of accuracy accepted in the mark scheme, when it gains no marks.
Otherwise we require evidence of a correct method for any marks to be awarded.
Centre Number Candidate Number
Write your name hereSurname Other names
Total Marks
Paper Reference
StatisticsAdvanced SubsidiaryPaper 1
8ST0/01
*S59172A0120*S59172A©2017 Pearson Education Ltd.
1/1/1/1/1/
Turn over
Candidates may use any calculator permitted by Pearson regulations. Calculators must not have the facility for algebraic manipulation, differentiation and integration, or have retrievable mathematical formulae stored in them.
Instructions• Use black ink or ball-point pen.• If pencil is used for diagrams/sketches/graphs it must be dark (HB or B).• Fill in the boxes at the top of this page with your name, centre number and candidate number.• Answer all questions and ensure that your answers to parts of questions are clearly labelled.• Answer the questions in the spaces provided – there may be more space than you need.• You should show sufficient working to make your methods clear. Answers without working may not gain full credit.• Inexact answers should be given to three significant figures unless otherwise stated.
Information• A booklet ‘Statistical Formulae and Tables’ is provided.• There are 7 questions in this question paper. The total mark for this paper is 60. • The marks for each question are shown in brackets – use this as a guide as to how much time to spend on each question.
Advice• Read each question carefully before you start to answer it.• Try to answer every question.• Check your answers if you have time at the end.• If you change your mind about an answer, cross it out and put your new answer and any working underneath.
You must have:Statistical Formulae and Tables booklet, calculator
Sample Assessment Material for first teaching September 2017
Time: 1 hour 30 minutes
Pearson Edexcel Level 3 GCE
4 Pearson Edexcel Level 3 Advanced Subsidiary GCE in Statistics – Sample Assessment Materials Issue 1 – September 2017 © Pearson Education Limited 2017

No method shown
Where the question specifically requires a particular method to be used, we must usually see evidence of use of this method.
Where the answer can be reasonably obtained without showing working and it is very unlikely that the correct answer can be obtained by using an incorrect method, we must award full marks. However, the obvious penalty to candidates showing no working is that incorrect answers, however close, earn no marks.
Where a question asks the candidate to state or write down a result, no method need be shown for full marks.
Where the permitted calculator has functions which reasonably allow the solution of the question directly, the correct answer without working earns full marks, unless it is given to less than the degree of accuracy accepted in the mark scheme, when it gains no marks.
Otherwise we require evidence of a correct method for any marks to be awarded.
Centre Number Candidate Number
Write your name hereSurname Other names
Total Marks
Paper Reference
StatisticsAdvanced SubsidiaryPaper 1
8ST0/01
*S59172A0120*S59172A©2017 Pearson Education Ltd.
1/1/1/1/1/
Turn over
Candidates may use any calculator permitted by Pearson regulations. Calculators must not have the facility for algebraic manipulation, differentiation and integration, or have retrievable mathematical formulae stored in them.
Instructions• Use black ink or ball-point pen.• If pencil is used for diagrams/sketches/graphs it must be dark (HB or B).• Fill in the boxes at the top of this page with your name, centre number and candidate number.• Answer all questions and ensure that your answers to parts of questions are clearly labelled.• Answer the questions in the spaces provided – there may be more space than you need.• You should show sufficient working to make your methods clear. Answers without working may not gain full credit.• Inexact answers should be given to three significant figures unless otherwise stated.
Information• A booklet ‘Statistical Formulae and Tables’ is provided.• There are 7 questions in this question paper. The total mark for this paper is 60. • The marks for each question are shown in brackets – use this as a guide as to how much time to spend on each question.
Advice• Read each question carefully before you start to answer it.• Try to answer every question.• Check your answers if you have time at the end.• If you change your mind about an answer, cross it out and put your new answer and any working underneath.
You must have:Statistical Formulae and Tables booklet, calculator
Sample Assessment Material for first teaching September 2017
Time: 1 hour 30 minutes
Pearson Edexcel Level 3 GCE
5Pearson Edexcel Level 3 Advanced Subsidiary GCE in Statistics – Sample Assessment Materials Issue 1 – September 2017 © Pearson Education Limited 2017
2
*S59172A0220*
D
O N
OT W
RITE IN TH
IS AREA
D
O N
OT W
RITE IN TH
IS AREA
D
O N
OT W
RITE IN TH
IS AREA
D
O N
OT
WRI
TE IN
TH
IS A
REA
D
O N
OT
WRI
TE IN
TH
IS A
REA
D
O N
OT
WRI
TE IN
TH
IS A
REA
Answer ALL questions. Write your answers in the spaces provided.
1 The police force responsible for the Greater London area is the Metropolitan Police Service (commonly referred to as ‘the Met’). The Met employs over 32 000 police officers at 141 stations across Greater London.
In February 2017, a new Commissioner of Police was appointed. The statistics office of the Met is now investigating police officers’ opinions on the change-over and general management of the Met.
It is decided that data needs to be collected in 30-minute face-to-face interviews with police officers in order to get the detail required for the survey.
Explain how you would select a cluster sample of 200 police officers from Greater London.(3)
_____________________________________________________________________________________
_____________________________________________________________________________________
_____________________________________________________________________________________
_____________________________________________________________________________________
_____________________________________________________________________________________
_____________________________________________________________________________________
_____________________________________________________________________________________
_____________________________________________________________________________________
_____________________________________________________________________________________
_____________________________________________________________________________________
_____________________________________________________________________________________
_____________________________________________________________________________________
_____________________________________________________________________________________
_____________________________________________________________________________________
_____________________________________________________________________________________
_____________________________________________________________________________________
_____________________________________________________________________________________
_____________________________________________________________________________________
_____________________________________________________________________________________
_____________________________________________________________________________________
_____________________________________________________________________________________
_____________________________________________________________________________________
_____________________________________________________________________________________
_____________________________________________________________________________________
_____________________________________________________________________________________
(Total for Question 1 is 3 marks)
3
*S59172A0320* Turn over
D
O N
OT W
RITE IN TH
IS AREA
D
O N
OT W
RITE IN TH
IS AREA
D
O N
OT W
RITE IN TH
IS AREA
D
O N
OT
WRI
TE IN
TH
IS A
REA
D
O N
OT
WRI
TE IN
TH
IS A
REA
D
O N
OT
WRI
TE IN
TH
IS A
REA
2 An owl sanctuary is designing some information signs for visitors.
The tawny owls and the long-eared owls are in adjacent enclosures, so it is decided that they will have a shared sign that includes facts and figures about both species.
Trevor, an employee at the sanctuary, decides that he would like information on the sign that gives a comparison of the lengths of the two species. He measures the length of each adult bird at the sanctuary (in cm) and records it.
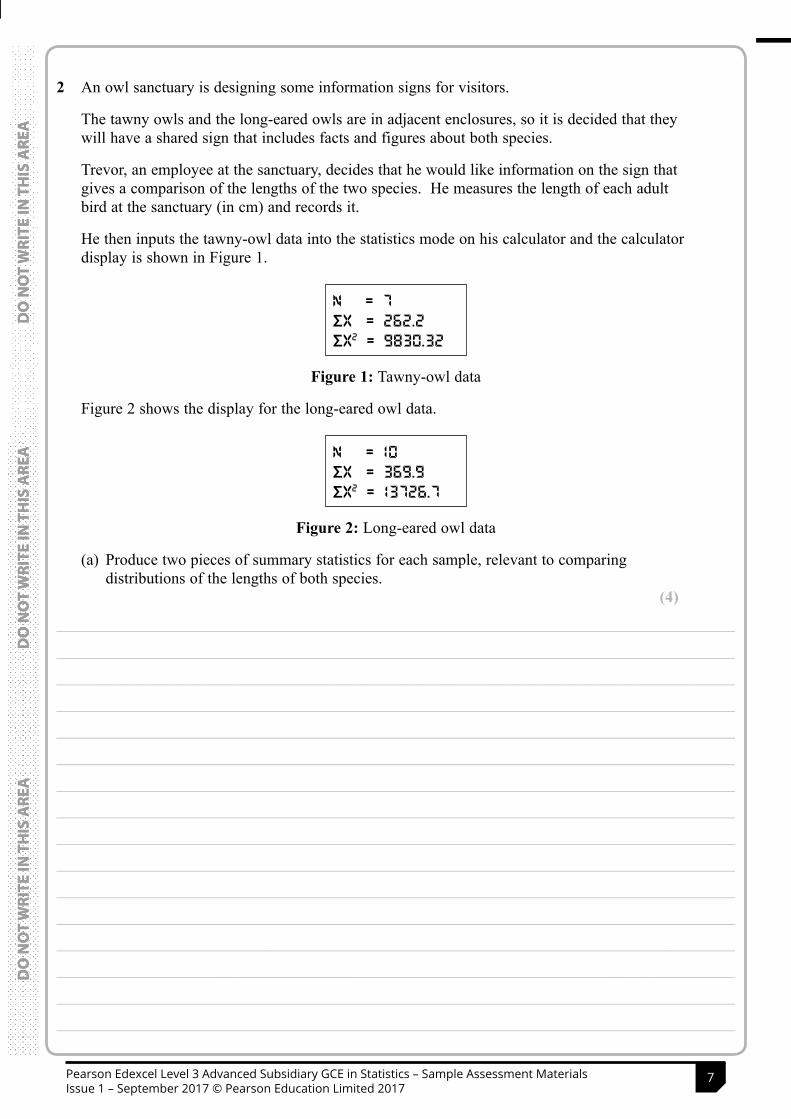
He then inputs the tawny-owl data into the statistics mode on his calculator and the calculator display is shown in Figure 1.
Figure 1: Tawny-owl data
Figure 2 shows the display for the long-eared owl data.
Figure 2: Long-eared owl data
(a) Produce two pieces of summary statistics for each sample, relevant to comparing distributions of the lengths of both species.
(4)
_____________________________________________________________________________________
_____________________________________________________________________________________
_____________________________________________________________________________________
_____________________________________________________________________________________
_____________________________________________________________________________________
_____________________________________________________________________________________
_____________________________________________________________________________________
_____________________________________________________________________________________
_____________________________________________________________________________________
_____________________________________________________________________________________
_____________________________________________________________________________________
_____________________________________________________________________________________
_____________________________________________________________________________________
_____________________________________________________________________________________
_____________________________________________________________________________________
_____________________________________________________________________________________
6 Pearson Edexcel Level 3 Advanced Subsidiary GCE in Statistics – Sample Assessment Materials Issue 1 – September 2017 © Pearson Education Limited 2017
2
*S59172A0220*
D
O N
OT W
RITE IN TH
IS AREA
D
O N
OT W
RITE IN TH
IS AREA
D
O N
OT W
RITE IN TH
IS AREA
D
O N
OT
WRI
TE IN
TH
IS A
REA
D
O N
OT
WRI
TE IN
TH
IS A
REA
D
O N
OT
WRI
TE IN
TH
IS A
REA
Answer ALL questions. Write your answers in the spaces provided.
1 The police force responsible for the Greater London area is the Metropolitan Police Service (commonly referred to as ‘the Met’). The Met employs over 32 000 police officers at 141 stations across Greater London.
In February 2017, a new Commissioner of Police was appointed. The statistics office of the Met is now investigating police officers’ opinions on the change-over and general management of the Met.
It is decided that data needs to be collected in 30-minute face-to-face interviews with police officers in order to get the detail required for the survey.
Explain how you would select a cluster sample of 200 police officers from Greater London.(3)
_____________________________________________________________________________________
_____________________________________________________________________________________
_____________________________________________________________________________________
_____________________________________________________________________________________
_____________________________________________________________________________________
_____________________________________________________________________________________
_____________________________________________________________________________________
_____________________________________________________________________________________
_____________________________________________________________________________________
_____________________________________________________________________________________
_____________________________________________________________________________________
_____________________________________________________________________________________
_____________________________________________________________________________________
_____________________________________________________________________________________
_____________________________________________________________________________________
_____________________________________________________________________________________
_____________________________________________________________________________________
_____________________________________________________________________________________
_____________________________________________________________________________________
_____________________________________________________________________________________
_____________________________________________________________________________________
_____________________________________________________________________________________
_____________________________________________________________________________________
_____________________________________________________________________________________
_____________________________________________________________________________________
(Total for Question 1 is 3 marks)
3
*S59172A0320* Turn over
D
O N
OT W
RITE IN TH
IS AREA
D
O N
OT W
RITE IN TH
IS AREA
D
O N
OT W
RITE IN TH
IS AREA
D
O N
OT
WRI
TE IN
TH
IS A
REA
D
O N
OT
WRI
TE IN
TH
IS A
REA
D
O N
OT
WRI
TE IN
TH
IS A
REA
2 An owl sanctuary is designing some information signs for visitors.
The tawny owls and the long-eared owls are in adjacent enclosures, so it is decided that they will have a shared sign that includes facts and figures about both species.
Trevor, an employee at the sanctuary, decides that he would like information on the sign that gives a comparison of the lengths of the two species. He measures the length of each adult bird at the sanctuary (in cm) and records it.
He then inputs the tawny-owl data into the statistics mode on his calculator and the calculator display is shown in Figure 1.
Figure 1: Tawny-owl data
Figure 2 shows the display for the long-eared owl data.
Figure 2: Long-eared owl data
(a) Produce two pieces of summary statistics for each sample, relevant to comparing distributions of the lengths of both species.
(4)
_____________________________________________________________________________________
_____________________________________________________________________________________
_____________________________________________________________________________________
_____________________________________________________________________________________
_____________________________________________________________________________________
_____________________________________________________________________________________
_____________________________________________________________________________________
_____________________________________________________________________________________
_____________________________________________________________________________________
_____________________________________________________________________________________
_____________________________________________________________________________________
_____________________________________________________________________________________
_____________________________________________________________________________________
_____________________________________________________________________________________
_____________________________________________________________________________________
_____________________________________________________________________________________
7Pearson Edexcel Level 3 Advanced Subsidiary GCE in Statistics – Sample Assessment Materials Issue 1 – September 2017 © Pearson Education Limited 2017
4
*S59172A0420*
D
O N
OT W
RITE IN TH
IS AREA
D
O N
OT W
RITE IN TH
IS AREA
D
O N
OT W
RITE IN TH
IS AREA
D
O N
OT
WRI
TE IN
TH
IS A
REA
D
O N
OT
WRI
TE IN
TH
IS A
REA
D
O N
OT
WRI
TE IN
TH
IS A
REA
(b) Compare the two distributions, presenting your answer in a suitable form for a sign aimed at the general public. You should state any assumptions made and reasoning for how valid you think those assumptions are.
(6)
_____________________________________________________________________________________
_____________________________________________________________________________________
_____________________________________________________________________________________
_____________________________________________________________________________________
_____________________________________________________________________________________
_____________________________________________________________________________________
_____________________________________________________________________________________
_____________________________________________________________________________________
_____________________________________________________________________________________
_____________________________________________________________________________________
_____________________________________________________________________________________
_____________________________________________________________________________________
_____________________________________________________________________________________
_____________________________________________________________________________________
_____________________________________________________________________________________
_____________________________________________________________________________________
_____________________________________________________________________________________
_____________________________________________________________________________________
_____________________________________________________________________________________
_____________________________________________________________________________________
_____________________________________________________________________________________
_____________________________________________________________________________________
_____________________________________________________________________________________
_____________________________________________________________________________________
_____________________________________________________________________________________
_____________________________________________________________________________________
_____________________________________________________________________________________
_____________________________________________________________________________________
_____________________________________________________________________________________
_____________________________________________________________________________________
_____________________________________________________________________________________
_____________________________________________________________________________________
(Total for Question 2 is 10 marks)
5
*S59172A0520* Turn over
D
O N
OT W
RITE IN TH
IS AREA
D
O N
OT W
RITE IN TH
IS AREA
D
O N
OT W
RITE IN TH
IS AREA
D
O N
OT
WRI
TE IN
TH
IS A
REA
D
O N
OT
WRI
TE IN
TH
IS A
REA
D
O N
OT
WRI
TE IN
TH
IS A
REA
3 Long-term observation of the production of components of a particular machine led the quality control officer, Karen, to believe that the lengths of these components were normally distributed with a standard deviation of 0.24 mm.
The machine has been set to produce components with mean length 12.50 mm but the machine’s operator suspects that it may need further adjustment.
A sample of 12 components has mean length of 12.68 mm.
(a) Use the 5% significance level to test the hypothesis that the mean length of such components is equal to 12.50 mm.
You should assume that Karen’s belief is true.(8)
_____________________________________________________________________________________
_____________________________________________________________________________________
_____________________________________________________________________________________
_____________________________________________________________________________________
_____________________________________________________________________________________
_____________________________________________________________________________________
_____________________________________________________________________________________
_____________________________________________________________________________________
_____________________________________________________________________________________
_____________________________________________________________________________________
_____________________________________________________________________________________
_____________________________________________________________________________________
_____________________________________________________________________________________
_____________________________________________________________________________________
_____________________________________________________________________________________
_____________________________________________________________________________________
_____________________________________________________________________________________
_____________________________________________________________________________________
_____________________________________________________________________________________
_____________________________________________________________________________________
_____________________________________________________________________________________
_____________________________________________________________________________________
_____________________________________________________________________________________
_____________________________________________________________________________________
_____________________________________________________________________________________
_____________________________________________________________________________________
_____________________________________________________________________________________
8 Pearson Edexcel Level 3 Advanced Subsidiary GCE in Statistics – Sample Assessment Materials Issue 1 – September 2017 © Pearson Education Limited 2017
4
*S59172A0420*
D
O N
OT W
RITE IN TH
IS AREA
D
O N
OT W
RITE IN TH
IS AREA
D
O N
OT W
RITE IN TH
IS AREA
D
O N
OT
WRI
TE IN
TH
IS A
REA
D
O N
OT
WRI
TE IN
TH
IS A
REA
D
O N
OT
WRI
TE IN
TH
IS A
REA
(b) Compare the two distributions, presenting your answer in a suitable form for a sign aimed at the general public. You should state any assumptions made and reasoning for how valid you think those assumptions are.
(6)
_____________________________________________________________________________________
_____________________________________________________________________________________
_____________________________________________________________________________________
_____________________________________________________________________________________
_____________________________________________________________________________________
_____________________________________________________________________________________
_____________________________________________________________________________________
_____________________________________________________________________________________
_____________________________________________________________________________________
_____________________________________________________________________________________
_____________________________________________________________________________________
_____________________________________________________________________________________
_____________________________________________________________________________________
_____________________________________________________________________________________
_____________________________________________________________________________________
_____________________________________________________________________________________
_____________________________________________________________________________________
_____________________________________________________________________________________
_____________________________________________________________________________________
_____________________________________________________________________________________
_____________________________________________________________________________________
_____________________________________________________________________________________
_____________________________________________________________________________________
_____________________________________________________________________________________
_____________________________________________________________________________________
_____________________________________________________________________________________
_____________________________________________________________________________________
_____________________________________________________________________________________
_____________________________________________________________________________________
_____________________________________________________________________________________
_____________________________________________________________________________________
_____________________________________________________________________________________
(Total for Question 2 is 10 marks)
5
*S59172A0520* Turn over
D
O N
OT W
RITE IN TH
IS AREA
D
O N
OT W
RITE IN TH
IS AREA
D
O N
OT W
RITE IN TH
IS AREA
D
O N
OT
WRI
TE IN
TH
IS A
REA
D
O N
OT
WRI
TE IN
TH
IS A
REA
D
O N
OT
WRI
TE IN
TH
IS A
REA
3 Long-term observation of the production of components of a particular machine led the quality control officer, Karen, to believe that the lengths of these components were normally distributed with a standard deviation of 0.24 mm.
The machine has been set to produce components with mean length 12.50 mm but the machine’s operator suspects that it may need further adjustment.
A sample of 12 components has mean length of 12.68 mm.
(a) Use the 5% significance level to test the hypothesis that the mean length of such components is equal to 12.50 mm.
You should assume that Karen’s belief is true.(8)
_____________________________________________________________________________________
_____________________________________________________________________________________
_____________________________________________________________________________________
_____________________________________________________________________________________
_____________________________________________________________________________________
_____________________________________________________________________________________
_____________________________________________________________________________________
_____________________________________________________________________________________
_____________________________________________________________________________________
_____________________________________________________________________________________
_____________________________________________________________________________________
_____________________________________________________________________________________
_____________________________________________________________________________________
_____________________________________________________________________________________
_____________________________________________________________________________________
_____________________________________________________________________________________
_____________________________________________________________________________________
_____________________________________________________________________________________
_____________________________________________________________________________________
_____________________________________________________________________________________
_____________________________________________________________________________________
_____________________________________________________________________________________
_____________________________________________________________________________________
_____________________________________________________________________________________
_____________________________________________________________________________________
_____________________________________________________________________________________
_____________________________________________________________________________________
9Pearson Edexcel Level 3 Advanced Subsidiary GCE in Statistics – Sample Assessment Materials Issue 1 – September 2017 © Pearson Education Limited 2017
6
*S59172A0620*
D
O N
OT W
RITE IN TH
IS AREA
D
O N
OT W
RITE IN TH
IS AREA
D
O N
OT W
RITE IN TH
IS AREA
D
O N
OT
WRI
TE IN
TH
IS A
REA
D
O N
OT
WRI
TE IN
TH
IS A
REA
D
O N
OT
WRI
TE IN
TH
IS A
REA
(b) Karen analysed this sample of 12 components from this machine and found that the smallest length was 12.3 mm and the greatest length was 13.7 mm.
Explain whether this information affects the validity of the test carried out in part (a).(2)
_____________________________________________________________________________________
_____________________________________________________________________________________
_____________________________________________________________________________________
_____________________________________________________________________________________
_____________________________________________________________________________________
_____________________________________________________________________________________
_____________________________________________________________________________________
_____________________________________________________________________________________
_____________________________________________________________________________________
_____________________________________________________________________________________
(Total for Question 3 is 10 marks)
7
*S59172A0720* Turn over
D
O N
OT W
RITE IN TH
IS AREA
D
O N
OT W
RITE IN TH
IS AREA
D
O N
OT W
RITE IN TH
IS AREA
D
O N
OT
WRI
TE IN
TH
IS A
REA
D
O N
OT
WRI
TE IN
TH
IS A
REA
D
O N
OT
WRI
TE IN
TH
IS A
REA
4 Sitara, a market gardener, plants lettuce seeds in 1-square metre patches. Research suggests that 95% of the seeds will germinate under ideal soil conditions. You may assume that germination is independent from seed to seed.
If more than 45 lettuces grow in a single patch, the quality of the lettuces is likely to be reduced.
(a) If Sitara plants 50 seeds per patch, find the probability that a randomly chosen patch will have more than 45 lettuce seeds germinating. You should use an exact distribution.
(2)
_____________________________________________________________________________________
_____________________________________________________________________________________
_____________________________________________________________________________________
_____________________________________________________________________________________
_____________________________________________________________________________________
_____________________________________________________________________________________
_____________________________________________________________________________________
_____________________________________________________________________________________
_____________________________________________________________________________________
_____________________________________________________________________________________
_____________________________________________________________________________________
_____________________________________________________________________________________
_____________________________________________________________________________________
_____________________________________________________________________________________
_____________________________________________________________________________________
(b) Explain why more than 45 seeds germinating in a patch may not be an issue in practice.
(1)
_____________________________________________________________________________________
_____________________________________________________________________________________
_____________________________________________________________________________________
_____________________________________________________________________________________
_____________________________________________________________________________________
_____________________________________________________________________________________
_____________________________________________________________________________________
_____________________________________________________________________________________
_____________________________________________________________________________________
_____________________________________________________________________________________
_____________________________________________________________________________________
_____________________________________________________________________________________
10 Pearson Edexcel Level 3 Advanced Subsidiary GCE in Statistics – Sample Assessment Materials Issue 1 – September 2017 © Pearson Education Limited 2017
6
*S59172A0620*
D
O N
OT W
RITE IN TH
IS AREA
D
O N
OT W
RITE IN TH
IS AREA
D
O N
OT W
RITE IN TH
IS AREA
D
O N
OT
WRI
TE IN
TH
IS A
REA
D
O N
OT
WRI
TE IN
TH
IS A
REA
D
O N
OT
WRI
TE IN
TH
IS A
REA
(b) Karen analysed this sample of 12 components from this machine and found that the smallest length was 12.3 mm and the greatest length was 13.7 mm.
Explain whether this information affects the validity of the test carried out in part (a).(2)
_____________________________________________________________________________________
_____________________________________________________________________________________
_____________________________________________________________________________________
_____________________________________________________________________________________
_____________________________________________________________________________________
_____________________________________________________________________________________
_____________________________________________________________________________________
_____________________________________________________________________________________
_____________________________________________________________________________________
_____________________________________________________________________________________
(Total for Question 3 is 10 marks)
7
*S59172A0720* Turn over
D
O N
OT W
RITE IN TH
IS AREA
D
O N
OT W
RITE IN TH
IS AREA
D
O N
OT W
RITE IN TH
IS AREA
D
O N
OT
WRI
TE IN
TH
IS A
REA
D
O N
OT
WRI
TE IN
TH
IS A
REA
D
O N
OT
WRI
TE IN
TH
IS A
REA
4 Sitara, a market gardener, plants lettuce seeds in 1-square metre patches. Research suggests that 95% of the seeds will germinate under ideal soil conditions. You may assume that germination is independent from seed to seed.
If more than 45 lettuces grow in a single patch, the quality of the lettuces is likely to be reduced.
(a) If Sitara plants 50 seeds per patch, find the probability that a randomly chosen patch will have more than 45 lettuce seeds germinating. You should use an exact distribution.
(2)
_____________________________________________________________________________________
_____________________________________________________________________________________
_____________________________________________________________________________________
_____________________________________________________________________________________
_____________________________________________________________________________________
_____________________________________________________________________________________
_____________________________________________________________________________________
_____________________________________________________________________________________
_____________________________________________________________________________________
_____________________________________________________________________________________
_____________________________________________________________________________________
_____________________________________________________________________________________
_____________________________________________________________________________________
_____________________________________________________________________________________
_____________________________________________________________________________________
(b) Explain why more than 45 seeds germinating in a patch may not be an issue in practice.
(1)
_____________________________________________________________________________________
_____________________________________________________________________________________
_____________________________________________________________________________________
_____________________________________________________________________________________
_____________________________________________________________________________________
_____________________________________________________________________________________
_____________________________________________________________________________________
_____________________________________________________________________________________
_____________________________________________________________________________________
_____________________________________________________________________________________
_____________________________________________________________________________________
_____________________________________________________________________________________
11Pearson Edexcel Level 3 Advanced Subsidiary GCE in Statistics – Sample Assessment Materials Issue 1 – September 2017 © Pearson Education Limited 2017
8
*S59172A0820*
D
O N
OT W
RITE IN TH
IS AREA
D
O N
OT W
RITE IN TH
IS AREA
D
O N
OT W
RITE IN TH
IS AREA
D
O N
OT
WRI
TE IN
TH
IS A
REA
D
O N
OT
WRI
TE IN
TH
IS A
REA
D
O N
OT
WRI
TE IN
TH
IS A
REA
(c) Sitara counts the number of seeds that have not germinated in each of 20 randomly selected patches. From her results, the following summary statistics are calculated:
Mean number of seeds that have not germinated per patch = 2.91
Standard deviation of the number of seeds that have not germinated per patch = 3.09
In the context of the question, what does this further information suggest to you?(4)
_____________________________________________________________________________________
_____________________________________________________________________________________
_____________________________________________________________________________________
_____________________________________________________________________________________
_____________________________________________________________________________________
_____________________________________________________________________________________
_____________________________________________________________________________________
_____________________________________________________________________________________
_____________________________________________________________________________________
_____________________________________________________________________________________
_____________________________________________________________________________________
_____________________________________________________________________________________
_____________________________________________________________________________________
_____________________________________________________________________________________
_____________________________________________________________________________________
_____________________________________________________________________________________
_____________________________________________________________________________________
_____________________________________________________________________________________
_____________________________________________________________________________________
_____________________________________________________________________________________
_____________________________________________________________________________________
_____________________________________________________________________________________
_____________________________________________________________________________________
_____________________________________________________________________________________
_____________________________________________________________________________________
_____________________________________________________________________________________
_____________________________________________________________________________________
_____________________________________________________________________________________
_____________________________________________________________________________________
(Total for Question 4 is 7 marks)
9
*S59172A0920* Turn over
D
O N
OT W
RITE IN TH
IS AREA
D
O N
OT W
RITE IN TH
IS AREA
D
O N
OT W
RITE IN TH
IS AREA
D
O N
OT
WRI
TE IN
TH
IS A
REA
D
O N
OT
WRI
TE IN
TH
IS A
REA
D
O N
OT
WRI
TE IN
TH
IS A
REA
5 Sam is researching heights of students as part of a biology project.
She wants to investigate whether the average height of female students in her college has changed from last year when the median height of female students was 163.2 cm.
Sam obtains a sample of 12 female students, and then measures each student in the sample.
The heights, in cm, are recorded below:
170.2 174.6 181.3 164.3 160.8 179.6
190.6 161.7 164.2 188.2 185.3 177.7
(a) Making any necessary assumptions, investigate, using the sign-test and the 5% level of significance, whether there is evidence of a change from 163.2 cm in the median height of female students at the college.
(7)
_____________________________________________________________________________________
_____________________________________________________________________________________
_____________________________________________________________________________________
_____________________________________________________________________________________
_____________________________________________________________________________________
_____________________________________________________________________________________
_____________________________________________________________________________________
_____________________________________________________________________________________
_____________________________________________________________________________________
_____________________________________________________________________________________
_____________________________________________________________________________________
_____________________________________________________________________________________
_____________________________________________________________________________________
_____________________________________________________________________________________
_____________________________________________________________________________________
_____________________________________________________________________________________
_____________________________________________________________________________________
_____________________________________________________________________________________
_____________________________________________________________________________________
_____________________________________________________________________________________
_____________________________________________________________________________________
_____________________________________________________________________________________
_____________________________________________________________________________________
_____________________________________________________________________________________
12 Pearson Edexcel Level 3 Advanced Subsidiary GCE in Statistics – Sample Assessment Materials Issue 1 – September 2017 © Pearson Education Limited 2017
8
*S59172A0820*
D
O N
OT W
RITE IN TH
IS AREA
D
O N
OT W
RITE IN TH
IS AREA
D
O N
OT W
RITE IN TH
IS AREA
D
O N
OT
WRI
TE IN
TH
IS A
REA
D
O N
OT
WRI
TE IN
TH
IS A
REA
D
O N
OT
WRI
TE IN
TH
IS A
REA
(c) Sitara counts the number of seeds that have not germinated in each of 20 randomly selected patches. From her results, the following summary statistics are calculated:
Mean number of seeds that have not germinated per patch = 2.91
Standard deviation of the number of seeds that have not germinated per patch = 3.09
In the context of the question, what does this further information suggest to you?(4)
_____________________________________________________________________________________
_____________________________________________________________________________________
_____________________________________________________________________________________
_____________________________________________________________________________________
_____________________________________________________________________________________
_____________________________________________________________________________________
_____________________________________________________________________________________
_____________________________________________________________________________________
_____________________________________________________________________________________
_____________________________________________________________________________________
_____________________________________________________________________________________
_____________________________________________________________________________________
_____________________________________________________________________________________
_____________________________________________________________________________________
_____________________________________________________________________________________
_____________________________________________________________________________________
_____________________________________________________________________________________
_____________________________________________________________________________________
_____________________________________________________________________________________
_____________________________________________________________________________________
_____________________________________________________________________________________
_____________________________________________________________________________________
_____________________________________________________________________________________
_____________________________________________________________________________________
_____________________________________________________________________________________
_____________________________________________________________________________________
_____________________________________________________________________________________
_____________________________________________________________________________________
_____________________________________________________________________________________
(Total for Question 4 is 7 marks)
9
*S59172A0920* Turn over
D
O N
OT W
RITE IN TH
IS AREA
D
O N
OT W
RITE IN TH
IS AREA
D
O N
OT W
RITE IN TH
IS AREA
D
O N
OT
WRI
TE IN
TH
IS A
REA
D
O N
OT
WRI
TE IN
TH
IS A
REA
D
O N
OT
WRI
TE IN
TH
IS A
REA
5 Sam is researching heights of students as part of a biology project.
She wants to investigate whether the average height of female students in her college has changed from last year when the median height of female students was 163.2 cm.
Sam obtains a sample of 12 female students, and then measures each student in the sample.
The heights, in cm, are recorded below:
170.2 174.6 181.3 164.3 160.8 179.6
190.6 161.7 164.2 188.2 185.3 177.7
(a) Making any necessary assumptions, investigate, using the sign-test and the 5% level of significance, whether there is evidence of a change from 163.2 cm in the median height of female students at the college.
(7)
_____________________________________________________________________________________
_____________________________________________________________________________________
_____________________________________________________________________________________
_____________________________________________________________________________________
_____________________________________________________________________________________
_____________________________________________________________________________________
_____________________________________________________________________________________
_____________________________________________________________________________________
_____________________________________________________________________________________
_____________________________________________________________________________________
_____________________________________________________________________________________
_____________________________________________________________________________________
_____________________________________________________________________________________
_____________________________________________________________________________________
_____________________________________________________________________________________
_____________________________________________________________________________________
_____________________________________________________________________________________
_____________________________________________________________________________________
_____________________________________________________________________________________
_____________________________________________________________________________________
_____________________________________________________________________________________
_____________________________________________________________________________________
_____________________________________________________________________________________
_____________________________________________________________________________________
13Pearson Edexcel Level 3 Advanced Subsidiary GCE in Statistics – Sample Assessment Materials Issue 1 – September 2017 © Pearson Education Limited 2017
10
*S59172A01020*
D
O N
OT W
RITE IN TH
IS AREA
D
O N
OT W
RITE IN TH
IS AREA
D
O N
OT W
RITE IN TH
IS AREA
D
O N
OT
WRI
TE IN
TH
IS A
REA
D
O N
OT
WRI
TE IN
TH
IS A
REA
D
O N
OT
WRI
TE IN
TH
IS A
REA
_____________________________________________________________________________________
_____________________________________________________________________________________
_____________________________________________________________________________________
_____________________________________________________________________________________
_____________________________________________________________________________________
_____________________________________________________________________________________
_____________________________________________________________________________________
_____________________________________________________________________________________
_____________________________________________________________________________________
_____________________________________________________________________________________
_____________________________________________________________________________________
_____________________________________________________________________________________
_____________________________________________________________________________________
_____________________________________________________________________________________
_____________________________________________________________________________________
_____________________________________________________________________________________
_____________________________________________________________________________________
_____________________________________________________________________________________
(b) Sam reveals that the 12 female students in her sample are all members of the college basketball squad.
Comment on the validity of the assumptions you made in part (a).(1)
_____________________________________________________________________________________
_____________________________________________________________________________________
_____________________________________________________________________________________
_____________________________________________________________________________________
_____________________________________________________________________________________
_____________________________________________________________________________________
_____________________________________________________________________________________
_____________________________________________________________________________________
_____________________________________________________________________________________
_____________________________________________________________________________________
_____________________________________________________________________________________
_____________________________________________________________________________________
_____________________________________________________________________________________
(Total for Question 5 is 8 marks)
11
*S59172A01120* Turn over
D
O N
OT W
RITE IN TH
IS AREA
D
O N
OT W
RITE IN TH
IS AREA
D
O N
OT W
RITE IN TH
IS AREA
D
O N
OT
WRI
TE IN
TH
IS A
REA
D
O N
OT
WRI
TE IN
TH
IS A
REA
D
O N
OT
WRI
TE IN
TH
IS A
REA
6 Kevin is a biologist who is studying slugs in the UK. He is particularly interested in how the seasons of the year affect the activity levels of different species of slug.
He wants to see if there is a relationship between the species of slug and the season of the year that the slug was sighted. He decides that he will investigate this relationship with a χ2 test.
(a) If Kevin were to collect his own sample data, how would you recommend he obtains this data? Include any steps he should take to reduce the risk of bias.
(3)
_____________________________________________________________________________________
_____________________________________________________________________________________
_____________________________________________________________________________________
_____________________________________________________________________________________
_____________________________________________________________________________________
_____________________________________________________________________________________
_____________________________________________________________________________________
_____________________________________________________________________________________
_____________________________________________________________________________________
_____________________________________________________________________________________
_____________________________________________________________________________________
_____________________________________________________________________________________
_____________________________________________________________________________________
_____________________________________________________________________________________
_____________________________________________________________________________________
_____________________________________________________________________________________
_____________________________________________________________________________________
_____________________________________________________________________________________
_____________________________________________________________________________________
_____________________________________________________________________________________
_____________________________________________________________________________________
_____________________________________________________________________________________
_____________________________________________________________________________________
_____________________________________________________________________________________
_____________________________________________________________________________________
_____________________________________________________________________________________
_____________________________________________________________________________________
_____________________________________________________________________________________
_____________________________________________________________________________________
_____________________________________________________________________________________
14 Pearson Edexcel Level 3 Advanced Subsidiary GCE in Statistics – Sample Assessment Materials Issue 1 – September 2017 © Pearson Education Limited 2017
10
*S59172A01020*
D
O N
OT W
RITE IN TH
IS AREA
D
O N
OT W
RITE IN TH
IS AREA
D
O N
OT W
RITE IN TH
IS AREA
D
O N
OT
WRI
TE IN
TH
IS A
REA
D
O N
OT
WRI
TE IN
TH
IS A
REA
D
O N
OT
WRI
TE IN
TH
IS A
REA
_____________________________________________________________________________________
_____________________________________________________________________________________
_____________________________________________________________________________________
_____________________________________________________________________________________
_____________________________________________________________________________________
_____________________________________________________________________________________
_____________________________________________________________________________________
_____________________________________________________________________________________
_____________________________________________________________________________________
_____________________________________________________________________________________
_____________________________________________________________________________________
_____________________________________________________________________________________
_____________________________________________________________________________________
_____________________________________________________________________________________
_____________________________________________________________________________________
_____________________________________________________________________________________
_____________________________________________________________________________________
_____________________________________________________________________________________
(b) Sam reveals that the 12 female students in her sample are all members of the college basketball squad.
Comment on the validity of the assumptions you made in part (a).(1)
_____________________________________________________________________________________
_____________________________________________________________________________________
_____________________________________________________________________________________
_____________________________________________________________________________________
_____________________________________________________________________________________
_____________________________________________________________________________________
_____________________________________________________________________________________
_____________________________________________________________________________________
_____________________________________________________________________________________
_____________________________________________________________________________________
_____________________________________________________________________________________
_____________________________________________________________________________________
_____________________________________________________________________________________
(Total for Question 5 is 8 marks)
11
*S59172A01120* Turn over
D
O N
OT W
RITE IN TH
IS AREA
D
O N
OT W
RITE IN TH
IS AREA
D
O N
OT W
RITE IN TH
IS AREA
D
O N
OT
WRI
TE IN
TH
IS A
REA
D
O N
OT
WRI
TE IN
TH
IS A
REA
D
O N
OT
WRI
TE IN
TH
IS A
REA
6 Kevin is a biologist who is studying slugs in the UK. He is particularly interested in how the seasons of the year affect the activity levels of different species of slug.
He wants to see if there is a relationship between the species of slug and the season of the year that the slug was sighted. He decides that he will investigate this relationship with a χ2 test.
(a) If Kevin were to collect his own sample data, how would you recommend he obtains this data? Include any steps he should take to reduce the risk of bias.
(3)
_____________________________________________________________________________________
_____________________________________________________________________________________
_____________________________________________________________________________________
_____________________________________________________________________________________
_____________________________________________________________________________________
_____________________________________________________________________________________
_____________________________________________________________________________________
_____________________________________________________________________________________
_____________________________________________________________________________________
_____________________________________________________________________________________
_____________________________________________________________________________________
_____________________________________________________________________________________
_____________________________________________________________________________________
_____________________________________________________________________________________
_____________________________________________________________________________________
_____________________________________________________________________________________
_____________________________________________________________________________________
_____________________________________________________________________________________
_____________________________________________________________________________________
_____________________________________________________________________________________
_____________________________________________________________________________________
_____________________________________________________________________________________
_____________________________________________________________________________________
_____________________________________________________________________________________
_____________________________________________________________________________________
_____________________________________________________________________________________
_____________________________________________________________________________________
_____________________________________________________________________________________
_____________________________________________________________________________________
_____________________________________________________________________________________
15Pearson Edexcel Level 3 Advanced Subsidiary GCE in Statistics – Sample Assessment Materials Issue 1 – September 2017 © Pearson Education Limited 2017
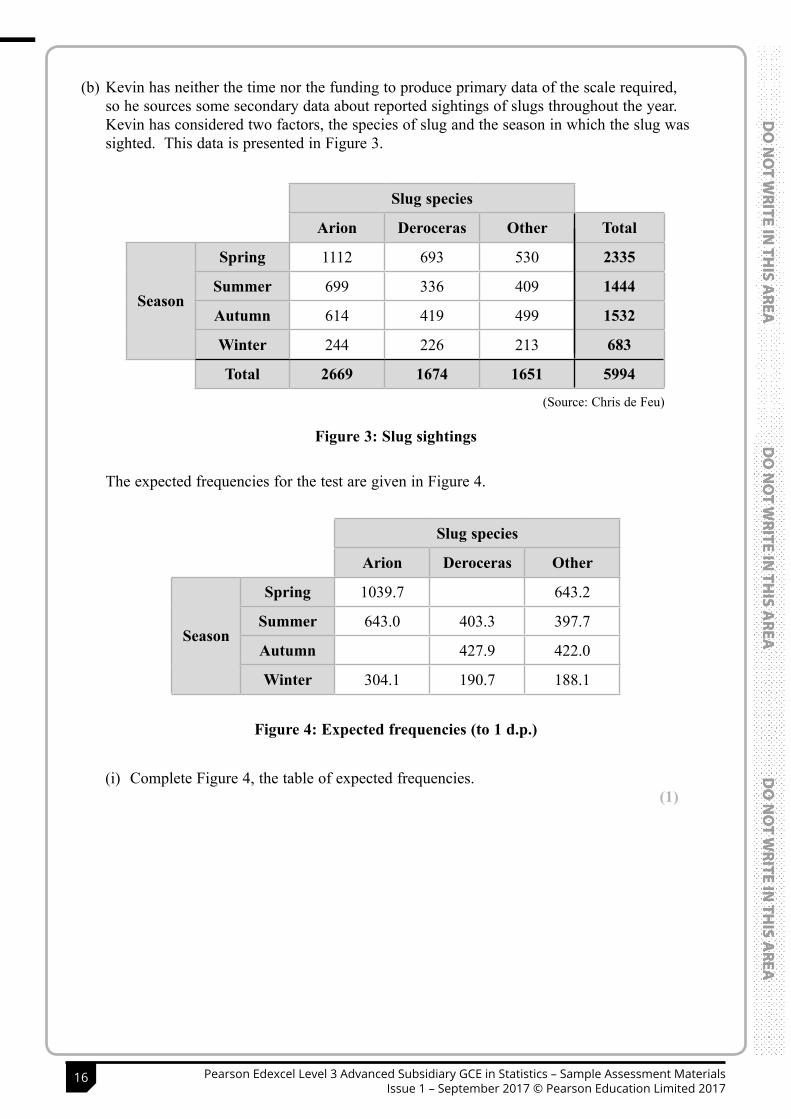
12
*S59172A01220*
D
O N
OT W
RITE IN TH
IS AREA
D
O N
OT W
RITE IN TH
IS AREA
D
O N
OT W
RITE IN TH
IS AREA
D
O N
OT
WRI
TE IN
TH
IS A
REA
D
O N
OT
WRI
TE IN
TH
IS A
REA
D
O N
OT
WRI
TE IN
TH
IS A
REA
(b) Kevin has neither the time nor the funding to produce primary data of the scale required, so he sources some secondary data about reported sightings of slugs throughout the year. Kevin has considered two factors, the species of slug and the season in which the slug was sighted. This data is presented in Figure 3.
Slug species
Arion Deroceras Other Total
Season
Spring 1112 693 530 2335
Summer 699 336 409 1444
Autumn 614 419 499 1532
Winter 244 226 213 683
Total 2669 1674 1651 5994
(Source: Chris de Feu)
Figure 3: Slug sightings
The expected frequencies for the test are given in Figure 4.
Slug species
Arion Deroceras Other
Season
Spring 1039.7 643.2
Summer 643.0 403.3 397.7
Autumn 427.9 422.0
Winter 304.1 190.7 188.1
Figure 4: Expected frequencies (to 1 d.p.)
(i) Complete Figure 4, the table of expected frequencies.(1)
13
*S59172A01320* Turn over
D
O N
OT W
RITE IN TH
IS AREA
D
O N
OT W
RITE IN TH
IS AREA
D
O N
OT W
RITE IN TH
IS AREA
D
O N
OT
WRI
TE IN
TH
IS A
REA
D
O N
OT
WRI
TE IN
TH
IS A
REA
D
O N
OT
WRI
TE IN
TH
IS A
REA
The contributions to the χ2 test statistic are given in Figure 5.
Slug species
Arion Deroceras Other
Season
Spring 5.03 2.57 19.92
Summer 11.23 0.32
Autumn 6.82 0.19 14.05
Winter 11.88 6.53
Figure 5: Contributions to the χ2 test statistic (to 2 d.p.)
(ii) Complete Figure 5, the table of contributions to the χ2 test statistic.(2)
(c) Kevin’s test statistic is χ2 = 86.7 (3 s.f)
Use this information to carry out Kevin’s test.(4)
_____________________________________________________________________________________
_____________________________________________________________________________________
_____________________________________________________________________________________
_____________________________________________________________________________________
_____________________________________________________________________________________
_____________________________________________________________________________________
_____________________________________________________________________________________
_____________________________________________________________________________________
_____________________________________________________________________________________
_____________________________________________________________________________________
_____________________________________________________________________________________
_____________________________________________________________________________________
_____________________________________________________________________________________
_____________________________________________________________________________________
_____________________________________________________________________________________
_____________________________________________________________________________________
_____________________________________________________________________________________
_____________________________________________________________________________________
_____________________________________________________________________________________
16 Pearson Edexcel Level 3 Advanced Subsidiary GCE in Statistics – Sample Assessment Materials Issue 1 – September 2017 © Pearson Education Limited 2017
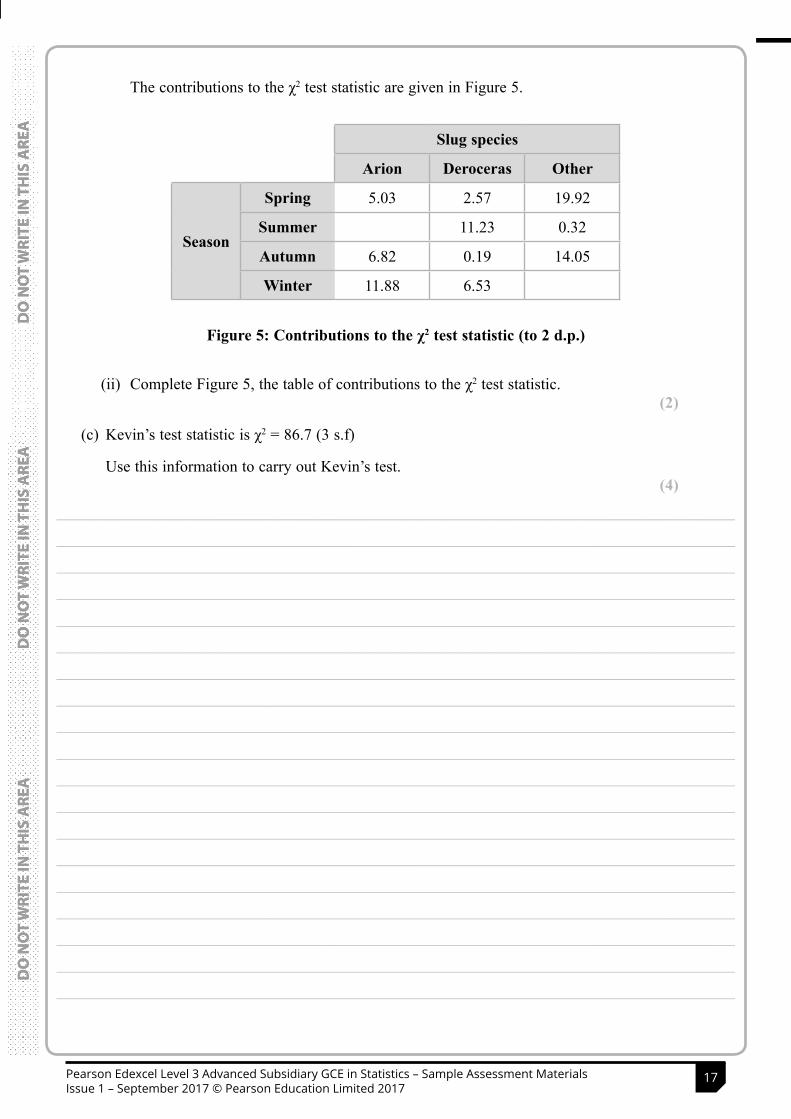
12
*S59172A01220*
D
O N
OT W
RITE IN TH
IS AREA
D
O N
OT W
RITE IN TH
IS AREA
D
O N
OT W
RITE IN TH
IS AREA
D
O N
OT
WRI
TE IN
TH
IS A
REA
D
O N
OT
WRI
TE IN
TH
IS A
REA
D
O N
OT
WRI
TE IN
TH
IS A
REA
(b) Kevin has neither the time nor the funding to produce primary data of the scale required, so he sources some secondary data about reported sightings of slugs throughout the year. Kevin has considered two factors, the species of slug and the season in which the slug was sighted. This data is presented in Figure 3.
Slug species
Arion Deroceras Other Total
Season
Spring 1112 693 530 2335
Summer 699 336 409 1444
Autumn 614 419 499 1532
Winter 244 226 213 683
Total 2669 1674 1651 5994
(Source: Chris de Feu)
Figure 3: Slug sightings
The expected frequencies for the test are given in Figure 4.
Slug species
Arion Deroceras Other
Season
Spring 1039.7 643.2
Summer 643.0 403.3 397.7
Autumn 427.9 422.0
Winter 304.1 190.7 188.1
Figure 4: Expected frequencies (to 1 d.p.)
(i) Complete Figure 4, the table of expected frequencies.(1)
13
*S59172A01320* Turn over
D
O N
OT W
RITE IN TH
IS AREA
D
O N
OT W
RITE IN TH
IS AREA
D
O N
OT W
RITE IN TH
IS AREA
D
O N
OT
WRI
TE IN
TH
IS A
REA
D
O N
OT
WRI
TE IN
TH
IS A
REA
D
O N
OT
WRI
TE IN
TH
IS A
REA
The contributions to the χ2 test statistic are given in Figure 5.
Slug species
Arion Deroceras Other
Season
Spring 5.03 2.57 19.92
Summer 11.23 0.32
Autumn 6.82 0.19 14.05
Winter 11.88 6.53
Figure 5: Contributions to the χ2 test statistic (to 2 d.p.)
(ii) Complete Figure 5, the table of contributions to the χ2 test statistic.(2)
(c) Kevin’s test statistic is χ2 = 86.7 (3 s.f)
Use this information to carry out Kevin’s test.(4)
_____________________________________________________________________________________
_____________________________________________________________________________________
_____________________________________________________________________________________
_____________________________________________________________________________________
_____________________________________________________________________________________
_____________________________________________________________________________________
_____________________________________________________________________________________
_____________________________________________________________________________________
_____________________________________________________________________________________
_____________________________________________________________________________________
_____________________________________________________________________________________
_____________________________________________________________________________________
_____________________________________________________________________________________
_____________________________________________________________________________________
_____________________________________________________________________________________
_____________________________________________________________________________________
_____________________________________________________________________________________
_____________________________________________________________________________________
_____________________________________________________________________________________
17Pearson Edexcel Level 3 Advanced Subsidiary GCE in Statistics – Sample Assessment Materials Issue 1 – September 2017 © Pearson Education Limited 2017
14
*S59172A01420*
D
O N
OT W
RITE IN TH
IS AREA
D
O N
OT W
RITE IN TH
IS AREA
D
O N
OT W
RITE IN TH
IS AREA
D
O N
OT
WRI
TE IN
TH
IS A
REA
D
O N
OT
WRI
TE IN
TH
IS A
REA
D
O N
OT
WRI
TE IN
TH
IS A
REA
(d) With reference to Figures 3, 4 and 5, comment on the relationship between the species of slug and the season of the year that the slug was sighted.
(3)
_____________________________________________________________________________________
_____________________________________________________________________________________
_____________________________________________________________________________________
_____________________________________________________________________________________
_____________________________________________________________________________________
_____________________________________________________________________________________
_____________________________________________________________________________________
_____________________________________________________________________________________
_____________________________________________________________________________________
_____________________________________________________________________________________
_____________________________________________________________________________________
_____________________________________________________________________________________
_____________________________________________________________________________________
_____________________________________________________________________________________
_____________________________________________________________________________________
_____________________________________________________________________________________
_____________________________________________________________________________________
_____________________________________________________________________________________
_____________________________________________________________________________________
_____________________________________________________________________________________
_____________________________________________________________________________________
_____________________________________________________________________________________
_____________________________________________________________________________________
_____________________________________________________________________________________
_____________________________________________________________________________________
_____________________________________________________________________________________
_____________________________________________________________________________________
_____________________________________________________________________________________
_____________________________________________________________________________________
_____________________________________________________________________________________
_____________________________________________________________________________________
_____________________________________________________________________________________
(Total for Question 6 is 13 marks)
15
*S59172A01520* Turn over
D
O N
OT W
RITE IN TH
IS AREA
D
O N
OT W
RITE IN TH
IS AREA
D
O N
OT W
RITE IN TH
IS AREA
D
O N
OT
WRI
TE IN
TH
IS A
REA
D
O N
OT
WRI
TE IN
TH
IS A
REA
D
O N
OT
WRI
TE IN
TH
IS A
REA
7 Iggy is investigating the effect of nitrogen fertiliser treatments on the yield of a particular crop in East Anglia.
She has set up an experiment across a number of fields. At the beginning of the season, each field is given a treatment of fertiliser to a specified rate (in kilograms per hectare). At the end of the season, the crop yield (in kilograms per hectare) is recorded.
Iggy records her data in in a spreadsheet. She then uses the software to produce a scatter plot, which is given in Figure 6.
16000
14000
12000
10000
8000
6000
4000
2000
00 50 100 150 200 250 300
Nitrogen fertiliser rates (kg/ha)
Cro
p yi
eld
(kg/
ha)
(Source: Adapted from research data)
Figure 6
(a) Explain why the data points are in distinct vertical lines.(1)
_____________________________________________________________________________________
_____________________________________________________________________________________
_____________________________________________________________________________________
_____________________________________________________________________________________
_____________________________________________________________________________________
_____________________________________________________________________________________
_____________________________________________________________________________________
_____________________________________________________________________________________
_____________________________________________________________________________________
_____________________________________________________________________________________
_____________________________________________________________________________________
_____________________________________________________________________________________
18 Pearson Edexcel Level 3 Advanced Subsidiary GCE in Statistics – Sample Assessment Materials Issue 1 – September 2017 © Pearson Education Limited 2017
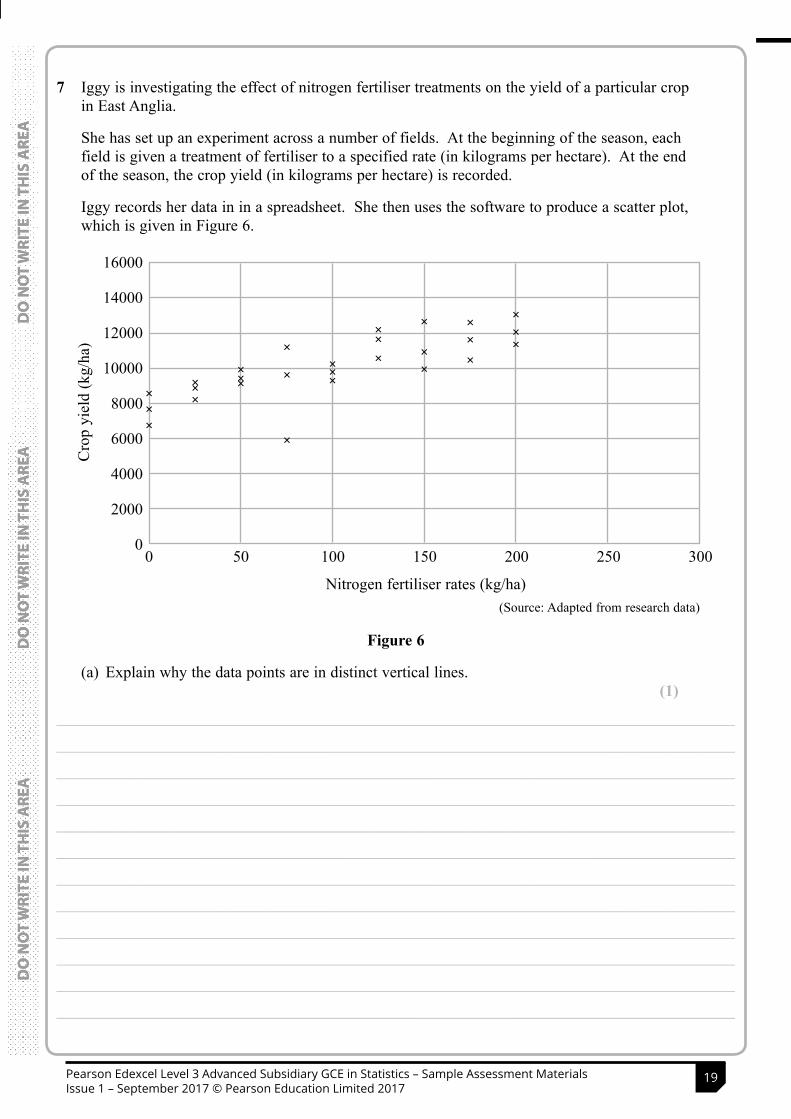
14
*S59172A01420*
D
O N
OT W
RITE IN TH
IS AREA
D
O N
OT W
RITE IN TH
IS AREA
D
O N
OT W
RITE IN TH
IS AREA
D
O N
OT
WRI
TE IN
TH
IS A
REA
D
O N
OT
WRI
TE IN
TH
IS A
REA
D
O N
OT
WRI
TE IN
TH
IS A
REA
(d) With reference to Figures 3, 4 and 5, comment on the relationship between the species of slug and the season of the year that the slug was sighted.
(3)
_____________________________________________________________________________________
_____________________________________________________________________________________
_____________________________________________________________________________________
_____________________________________________________________________________________
_____________________________________________________________________________________
_____________________________________________________________________________________
_____________________________________________________________________________________
_____________________________________________________________________________________
_____________________________________________________________________________________
_____________________________________________________________________________________
_____________________________________________________________________________________
_____________________________________________________________________________________
_____________________________________________________________________________________
_____________________________________________________________________________________
_____________________________________________________________________________________
_____________________________________________________________________________________
_____________________________________________________________________________________
_____________________________________________________________________________________
_____________________________________________________________________________________
_____________________________________________________________________________________
_____________________________________________________________________________________
_____________________________________________________________________________________
_____________________________________________________________________________________
_____________________________________________________________________________________
_____________________________________________________________________________________
_____________________________________________________________________________________
_____________________________________________________________________________________
_____________________________________________________________________________________
_____________________________________________________________________________________
_____________________________________________________________________________________
_____________________________________________________________________________________
_____________________________________________________________________________________
(Total for Question 6 is 13 marks)
15
*S59172A01520* Turn over
D
O N
OT W
RITE IN TH
IS AREA
D
O N
OT W
RITE IN TH
IS AREA
D
O N
OT W
RITE IN TH
IS AREA
D
O N
OT
WRI
TE IN
TH
IS A
REA
D
O N
OT
WRI
TE IN
TH
IS A
REA
D
O N
OT
WRI
TE IN
TH
IS A
REA
7 Iggy is investigating the effect of nitrogen fertiliser treatments on the yield of a particular crop in East Anglia.
She has set up an experiment across a number of fields. At the beginning of the season, each field is given a treatment of fertiliser to a specified rate (in kilograms per hectare). At the end of the season, the crop yield (in kilograms per hectare) is recorded.
Iggy records her data in in a spreadsheet. She then uses the software to produce a scatter plot, which is given in Figure 6.
16000
14000
12000
10000
8000
6000
4000
2000
00 50 100 150 200 250 300
Nitrogen fertiliser rates (kg/ha)
Cro
p yi
eld
(kg/
ha)
(Source: Adapted from research data)
Figure 6
(a) Explain why the data points are in distinct vertical lines.(1)
_____________________________________________________________________________________
_____________________________________________________________________________________
_____________________________________________________________________________________
_____________________________________________________________________________________
_____________________________________________________________________________________
_____________________________________________________________________________________
_____________________________________________________________________________________
_____________________________________________________________________________________
_____________________________________________________________________________________
_____________________________________________________________________________________
_____________________________________________________________________________________
_____________________________________________________________________________________
19Pearson Edexcel Level 3 Advanced Subsidiary GCE in Statistics – Sample Assessment Materials Issue 1 – September 2017 © Pearson Education Limited 2017
16
*S59172A01620*
D
O N
OT W
RITE IN TH
IS AREA
D
O N
OT W
RITE IN TH
IS AREA
D
O N
OT W
RITE IN TH
IS AREA
D
O N
OT
WRI
TE IN
TH
IS A
REA
D
O N
OT
WRI
TE IN
TH
IS A
REA
D
O N
OT
WRI
TE IN
TH
IS A
REA
(b) Iggy is considering whether to remove the outlier representing the lowest crop yield.
Suggest a possible explanation of this outlier and state whether you would exclude this data point.
(2)
_____________________________________________________________________________________
_____________________________________________________________________________________
_____________________________________________________________________________________
_____________________________________________________________________________________
_____________________________________________________________________________________
_____________________________________________________________________________________
_____________________________________________________________________________________
_____________________________________________________________________________________
_____________________________________________________________________________________
_____________________________________________________________________________________
_____________________________________________________________________________________
_____________________________________________________________________________________
_____________________________________________________________________________________
(c) Iggy uses the spreadsheet software to calculate Pearson’s product moment correlation coefficient, r = 0.696, correct to 3 s.f.
She carries out a hypothesis test, and states that there is evidence, at the 5% level of significance, of a positive correlation between nitrogen fertiliser rates and crop yield.
Comment on the validity of her test.(2)
_____________________________________________________________________________________
_____________________________________________________________________________________
_____________________________________________________________________________________
_____________________________________________________________________________________
_____________________________________________________________________________________
_____________________________________________________________________________________
_____________________________________________________________________________________
_____________________________________________________________________________________
_____________________________________________________________________________________
_____________________________________________________________________________________
_____________________________________________________________________________________
_____________________________________________________________________________________
_____________________________________________________________________________________
_____________________________________________________________________________________
17
*S59172A01720* Turn over
D
O N
OT W
RITE IN TH
IS AREA
D
O N
OT W
RITE IN TH
IS AREA
D
O N
OT W
RITE IN TH
IS AREA
D
O N
OT
WRI
TE IN
TH
IS A
REA
D
O N
OT
WRI
TE IN
TH
IS A
REA
D
O N
OT
WRI
TE IN
TH
IS A
REA
The spreadsheet software shows the least squares regression line to be
y = 21.6x + 7930
where x = Nitrogen fertiliser rate (kg/ha)
and y = Crop yield (kg/ha)
This line is plotted on the scatter plot in Figure 7.
16000
14000
12000
10000
8000
6000
4000
2000
00 50 100 150 200 250 300
Nitrogen fertiliser rates (kg/ha)
Cro
p yi
eld
(kg/
ha)
(Source: Adapted from research data)
Figure 7
Iggy states in a report:
‘If we use 300 kg/ha of nitrogen fertiliser, then the crop yield will be
21.6 ´ 300 + 7930 = 14410 kg/ha’
(d) Give two criticisms of her statement regarding her predicted crop yield.(2)
_____________________________________________________________________________________
_____________________________________________________________________________________
_____________________________________________________________________________________
_____________________________________________________________________________________
_____________________________________________________________________________________
_____________________________________________________________________________________
_____________________________________________________________________________________
_____________________________________________________________________________________
_____________________________________________________________________________________
20 Pearson Edexcel Level 3 Advanced Subsidiary GCE in Statistics – Sample Assessment Materials Issue 1 – September 2017 © Pearson Education Limited 2017
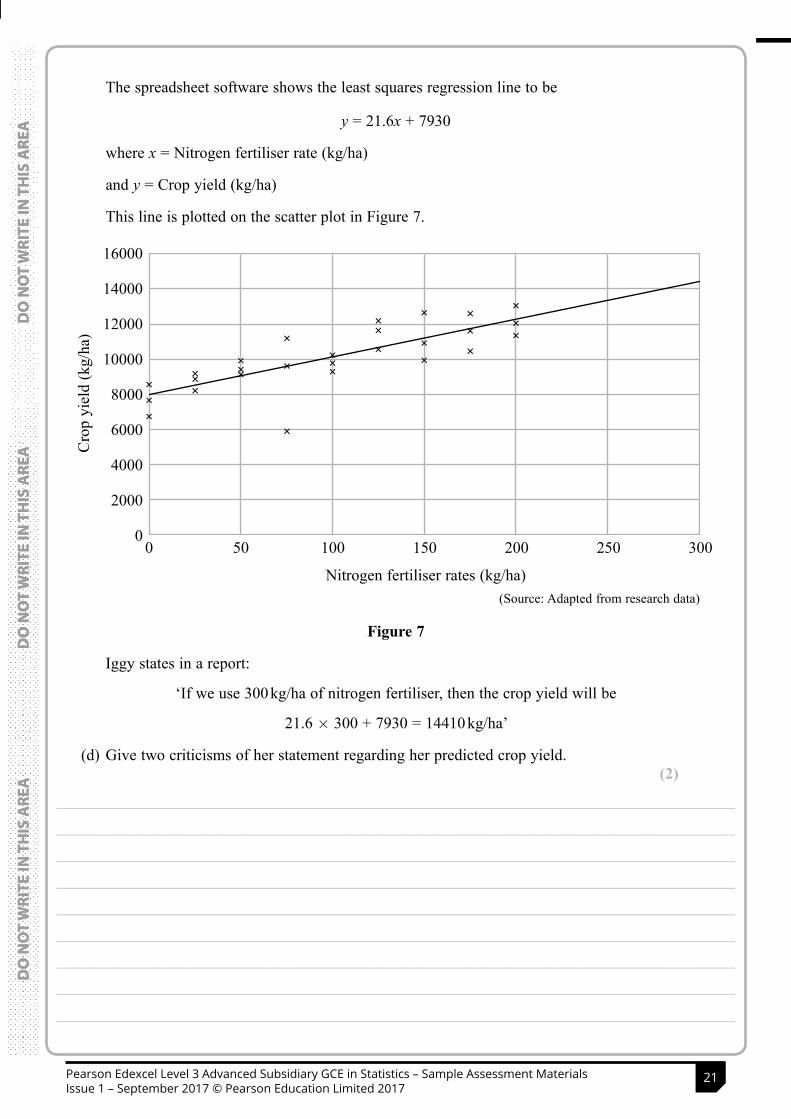
16
*S59172A01620*
D
O N
OT W
RITE IN TH
IS AREA
D
O N
OT W
RITE IN TH
IS AREA
D
O N
OT W
RITE IN TH
IS AREA
D
O N
OT
WRI
TE IN
TH
IS A
REA
D
O N
OT
WRI
TE IN
TH
IS A
REA
D
O N
OT
WRI
TE IN
TH
IS A
REA
(b) Iggy is considering whether to remove the outlier representing the lowest crop yield.
Suggest a possible explanation of this outlier and state whether you would exclude this data point.
(2)
_____________________________________________________________________________________
_____________________________________________________________________________________
_____________________________________________________________________________________
_____________________________________________________________________________________
_____________________________________________________________________________________
_____________________________________________________________________________________
_____________________________________________________________________________________
_____________________________________________________________________________________
_____________________________________________________________________________________
_____________________________________________________________________________________
_____________________________________________________________________________________
_____________________________________________________________________________________
_____________________________________________________________________________________
(c) Iggy uses the spreadsheet software to calculate Pearson’s product moment correlation coefficient, r = 0.696, correct to 3 s.f.
She carries out a hypothesis test, and states that there is evidence, at the 5% level of significance, of a positive correlation between nitrogen fertiliser rates and crop yield.
Comment on the validity of her test.(2)
_____________________________________________________________________________________
_____________________________________________________________________________________
_____________________________________________________________________________________
_____________________________________________________________________________________
_____________________________________________________________________________________
_____________________________________________________________________________________
_____________________________________________________________________________________
_____________________________________________________________________________________
_____________________________________________________________________________________
_____________________________________________________________________________________
_____________________________________________________________________________________
_____________________________________________________________________________________
_____________________________________________________________________________________
_____________________________________________________________________________________
17
*S59172A01720* Turn over
D
O N
OT W
RITE IN TH
IS AREA
D
O N
OT W
RITE IN TH
IS AREA
D
O N
OT W
RITE IN TH
IS AREA
D
O N
OT
WRI
TE IN
TH
IS A
REA
D
O N
OT
WRI
TE IN
TH
IS A
REA
D
O N
OT
WRI
TE IN
TH
IS A
REA
The spreadsheet software shows the least squares regression line to be
y = 21.6x + 7930
where x = Nitrogen fertiliser rate (kg/ha)
and y = Crop yield (kg/ha)
This line is plotted on the scatter plot in Figure 7.
16000
14000
12000
10000
8000
6000
4000
2000
00 50 100 150 200 250 300
Nitrogen fertiliser rates (kg/ha)
Cro
p yi
eld
(kg/
ha)
(Source: Adapted from research data)
Figure 7
Iggy states in a report:
‘If we use 300 kg/ha of nitrogen fertiliser, then the crop yield will be
21.6 ´ 300 + 7930 = 14410 kg/ha’
(d) Give two criticisms of her statement regarding her predicted crop yield.(2)
_____________________________________________________________________________________
_____________________________________________________________________________________
_____________________________________________________________________________________
_____________________________________________________________________________________
_____________________________________________________________________________________
_____________________________________________________________________________________
_____________________________________________________________________________________
_____________________________________________________________________________________
_____________________________________________________________________________________
21Pearson Edexcel Level 3 Advanced Subsidiary GCE in Statistics – Sample Assessment Materials Issue 1 – September 2017 © Pearson Education Limited 2017
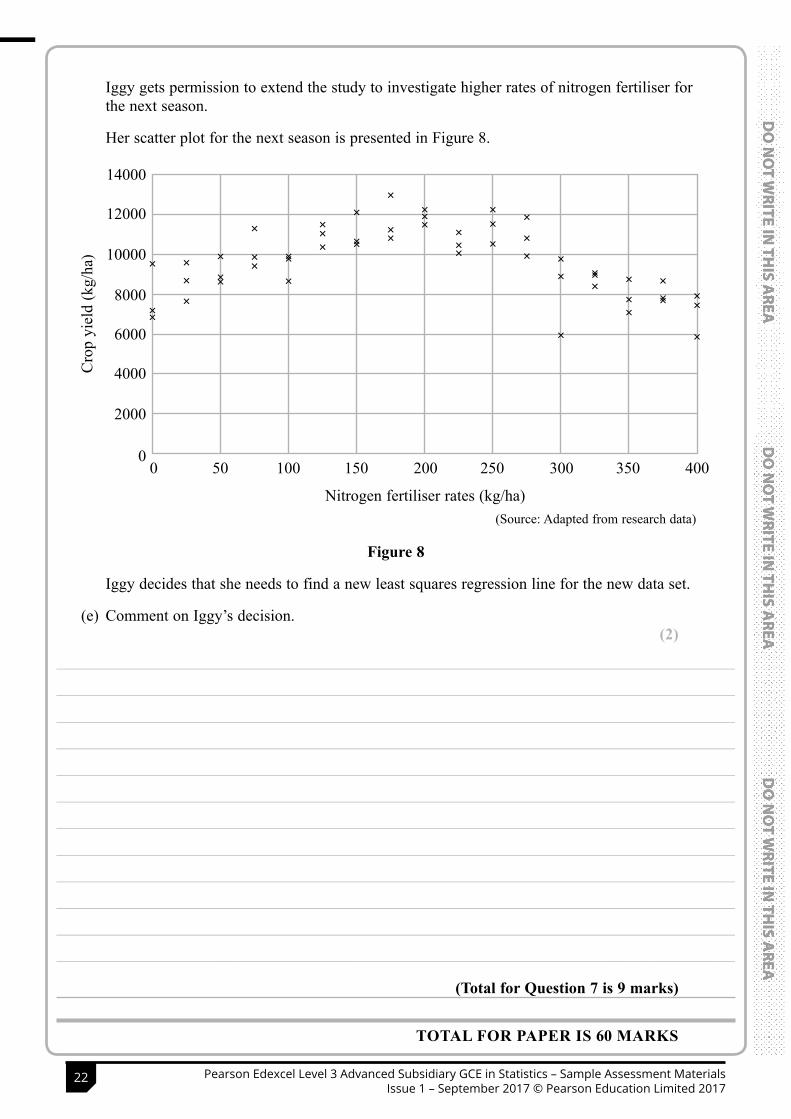
18
*S59172A01820*
D
O N
OT W
RITE IN TH
IS AREA
D
O N
OT W
RITE IN TH
IS AREA
D
O N
OT W
RITE IN TH
IS AREA
D
O N
OT
WRI
TE IN
TH
IS A
REA
D
O N
OT
WRI
TE IN
TH
IS A
REA
D
O N
OT
WRI
TE IN
TH
IS A
REA
Iggy gets permission to extend the study to investigate higher rates of nitrogen fertiliser for the next season.
Her scatter plot for the next season is presented in Figure 8.
14000
12000
10000
8000
6000
4000
2000
00 50 100 150 200 250 300
Nitrogen fertiliser rates (kg/ha)
Cro
p yi
eld
(kg/
ha)
350 400
(Source: Adapted from research data)
Figure 8
Iggy decides that she needs to find a new least squares regression line for the new data set.
(e) Comment on Iggy’s decision.(2)
_____________________________________________________________________________________
_____________________________________________________________________________________
_____________________________________________________________________________________
_____________________________________________________________________________________
_____________________________________________________________________________________
_____________________________________________________________________________________
_____________________________________________________________________________________
_____________________________________________________________________________________
_____________________________________________________________________________________
_____________________________________________________________________________________
_____________________________________________________________________________________
_____________________________________________________________________________________
(Total for Question 7 is 9 marks)
TOTAL FOR PAPER IS 60 MARKS
19
*S59172A01920*
D
O N
OT W
RITE IN TH
IS AREA
D
O N
OT W
RITE IN TH
IS AREA
D
O N
OT W
RITE IN TH
IS AREA
D
O N
OT
WRI
TE IN
TH
IS A
REA
D
O N
OT
WRI
TE IN
TH
IS A
REA
D
O N
OT
WRI
TE IN
TH
IS A
REA
BLANK PAGE
22 Pearson Edexcel Level 3 Advanced Subsidiary GCE in Statistics – Sample Assessment Materials Issue 1 – September 2017 © Pearson Education Limited 2017

18
*S59172A01820*
D
O N
OT W
RITE IN TH
IS AREA
D
O N
OT W
RITE IN TH
IS AREA
D
O N
OT W
RITE IN TH
IS AREA
D
O N
OT
WRI
TE IN
TH
IS A
REA
D
O N
OT
WRI
TE IN
TH
IS A
REA
D
O N
OT
WRI
TE IN
TH
IS A
REA
Iggy gets permission to extend the study to investigate higher rates of nitrogen fertiliser for the next season.
Her scatter plot for the next season is presented in Figure 8.
14000
12000
10000
8000
6000
4000
2000
00 50 100 150 200 250 300
Nitrogen fertiliser rates (kg/ha)
Cro
p yi
eld
(kg/
ha)
350 400
(Source: Adapted from research data)
Figure 8
Iggy decides that she needs to find a new least squares regression line for the new data set.
(e) Comment on Iggy’s decision.(2)
_____________________________________________________________________________________
_____________________________________________________________________________________
_____________________________________________________________________________________
_____________________________________________________________________________________
_____________________________________________________________________________________
_____________________________________________________________________________________
_____________________________________________________________________________________
_____________________________________________________________________________________
_____________________________________________________________________________________
_____________________________________________________________________________________
_____________________________________________________________________________________
_____________________________________________________________________________________
(Total for Question 7 is 9 marks)
TOTAL FOR PAPER IS 60 MARKS
19
*S59172A01920*
D
O N
OT W
RITE IN TH
IS AREA
D
O N
OT W
RITE IN TH
IS AREA
D
O N
OT W
RITE IN TH
IS AREA
D
O N
OT
WRI
TE IN
TH
IS A
REA
D
O N
OT
WRI
TE IN
TH
IS A
REA
D
O N
OT
WRI
TE IN
TH
IS A
REA
BLANK PAGE
23Pearson Edexcel Level 3 Advanced Subsidiary GCE in Statistics – Sample Assessment Materials Issue 1 – September 2017 © Pearson Education Limited 2017

20
*S59172A02020*
D
O N
OT W
RITE IN TH
IS AREA
D
O N
OT W
RITE IN TH
IS AREA
D
O N
OT W
RITE IN TH
IS AREA
BLANK PAGE
24 Pearson Edexcel Level 3 Advanced Subsidiary GCE in Statistics – Sample Assessment Materials Issue 1 – September 2017 © Pearson Education Limited 2017
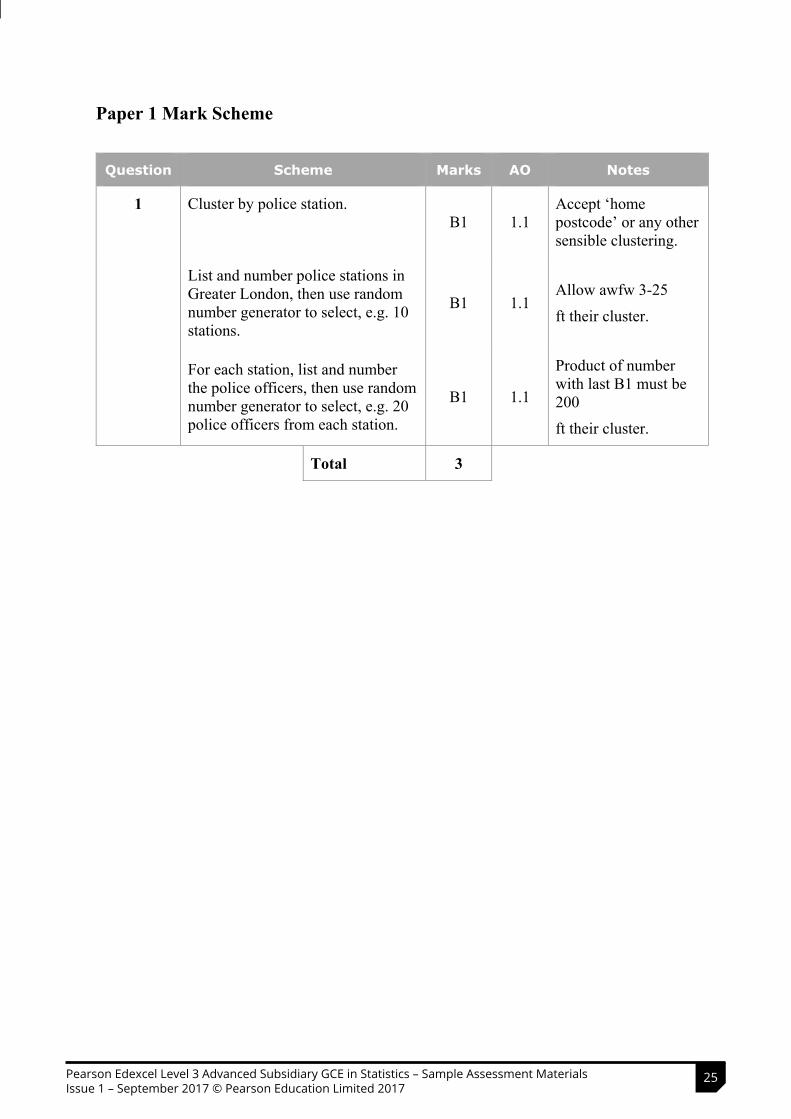
20
*S59172A02020*
D
O N
OT W
RITE IN TH
IS AREA
D
O N
OT W
RITE IN TH
IS AREA
D
O N
OT W
RITE IN TH
IS AREA
BLANK PAGE
Paper 1 Mark Scheme
Question Scheme Marks AO Notes
1 Cluster by police station. B1 1.1
Accept ‘home postcode’ or any other sensible clustering.
List and number police stations in Greater London, then use random number generator to select, e.g. 10 stations.
B1 1.1 Allow awfw 3-25
ft their cluster.
For each station, list and number the police officers, then use random number generator to select, e.g. 20 police officers from each station.
B1 1.1
Product of number with last B1 must be 200
ft their cluster.
Total 3
25Pearson Edexcel Level 3 Advanced Subsidiary GCE in Statistics – Sample Assessment Materials Issue 1 – September 2017 © Pearson Education Limited 2017
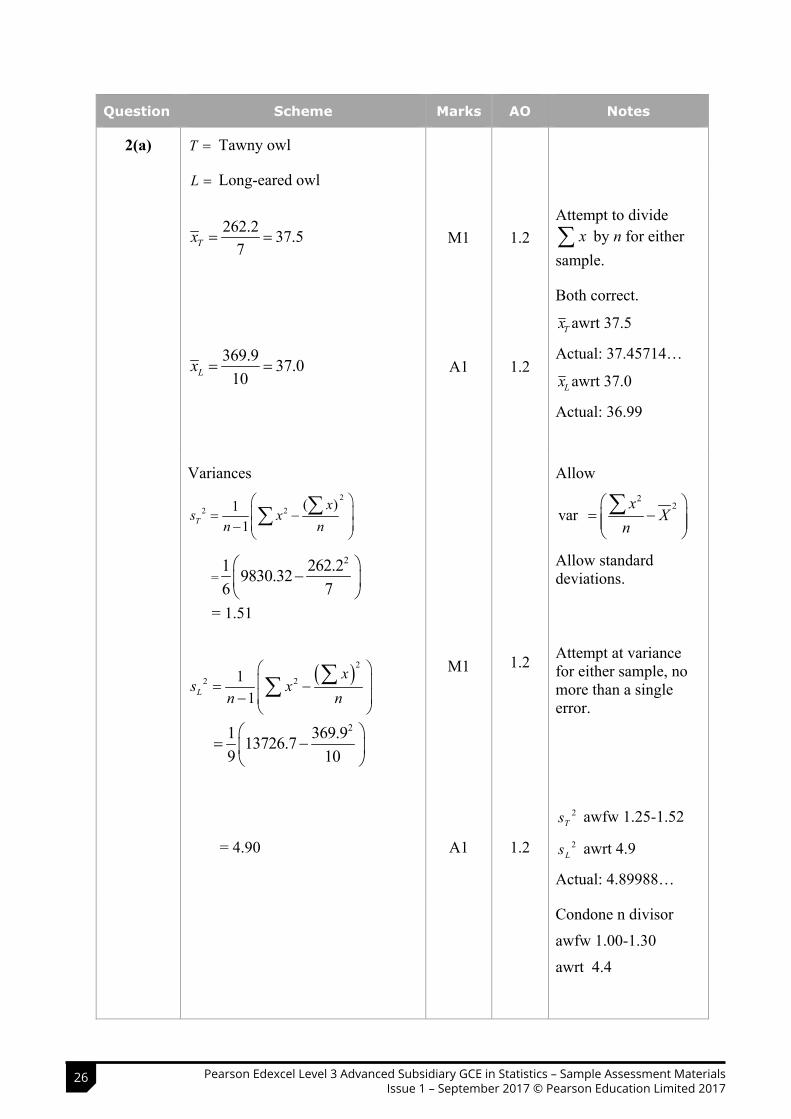
Question Scheme Marks AO Notes
2(a) T Tawny owl
L Long-eared owl
262.2 37.57
Tx M1 1.2 Attempt to divide
x by n for either sample.
369.9 37.010Lx A1 1.2
Both correct.
Tx awrt 37.5
Actual: 37.45714…
Lx awrt 37.0
Actual: 36.99
Variances2
2 2 ( )11T
xs x
n n
=21 262.29830.32
6 7
= 1.51
2
2 211L
xs x
n n
21 369.913726.79 10
M1 1.2
Allow2
2var
xX
n
Allow standard deviations.
Attempt at variance for either sample, no more than a single error.
= 4.90 A1 1.2
2Ts awfw 1.25-1.52
2Ls awrt 4.9
Actual: 4.89988…
Condone n divisor
awfw 1.00-1.30
awrt 4.4
26 Pearson Edexcel Level 3 Advanced Subsidiary GCE in Statistics – Sample Assessment Materials Issue 1 – September 2017 © Pearson Education Limited 2017
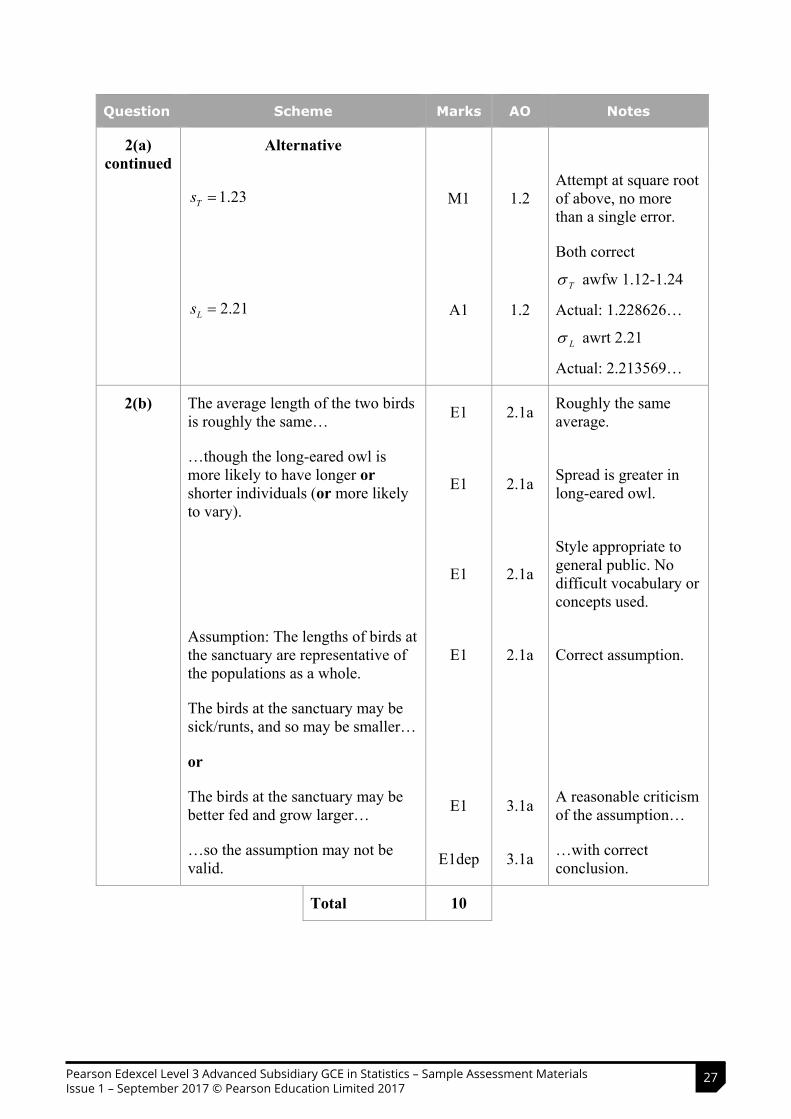
Question Scheme Marks AO Notes
2(a)continued
Alternative
1.23Ts M1 1.2 Attempt at square root of above, no more than a single error.
2.21Ls A1 1.2
Both correct
T awfw 1.12-1.24
Actual: 1.228626…
L awrt 2.21
Actual: 2.213569…
2(b) The average length of the two birds is roughly the same… E1 2.1a Roughly the same
average.
…though the long-eared owl is more likely to have longer orshorter individuals (or more likely to vary).
E1 2.1a Spread is greater in long-eared owl.
E1 2.1a
Style appropriate to general public. No difficult vocabulary or concepts used.
Assumption: The lengths of birds at the sanctuary are representative of the populations as a whole.
E1 2.1a Correct assumption.
The birds at the sanctuary may be sick/runts, and so may be smaller…
or
The birds at the sanctuary may be better fed and grow larger… E1 3.1a A reasonable criticism
of the assumption…
…so the assumption may not be valid. E1dep 3.1a …with correct
conclusion.
Total 10
27Pearson Edexcel Level 3 Advanced Subsidiary GCE in Statistics – Sample Assessment Materials Issue 1 – September 2017 © Pearson Education Limited 2017
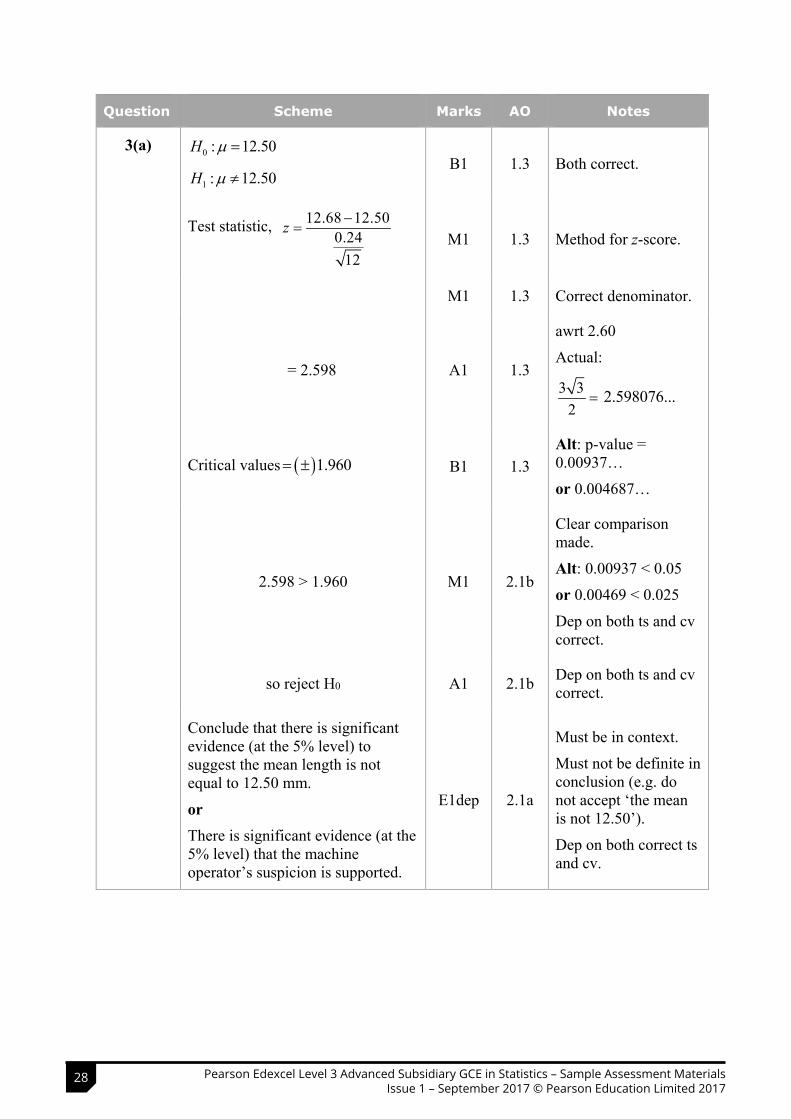
Question Scheme Marks AO Notes
3(a) 0 : 12.50H
1 : 12.50H B1 1.3 Both correct.
Test statistic, 12.68 12.500.24
12
z
M1 1.3 Method for z-score.
M1 1.3 Correct denominator.
= 2.598 A1 1.3
awrt 2.60
Actual:
3 32
2.598076...
Critical values 1.960 B1 1.3 Alt: p-value = 0.00937…
or 0.004687…
2.598 > 1.960 M1 2.1b
Clear comparison made.
Alt: 0.00937 < 0.05
or 0.00469 < 0.025
Dep on both ts and cv correct.
so reject H0 A1 2.1b Dep on both ts and cv correct.
Conclude that there is significant evidence (at the 5% level) to suggest the mean length is not equal to 12.50 mm.
orThere is significant evidence (at the 5% level) that the machine operator’s suspicion is supported.
E1dep 2.1a
Must be in context.
Must not be definite in conclusion (e.g. do not accept ‘the mean is not 12.50’).
Dep on both correct ts and cv.
28 Pearson Edexcel Level 3 Advanced Subsidiary GCE in Statistics – Sample Assessment Materials Issue 1 – September 2017 © Pearson Education Limited 2017
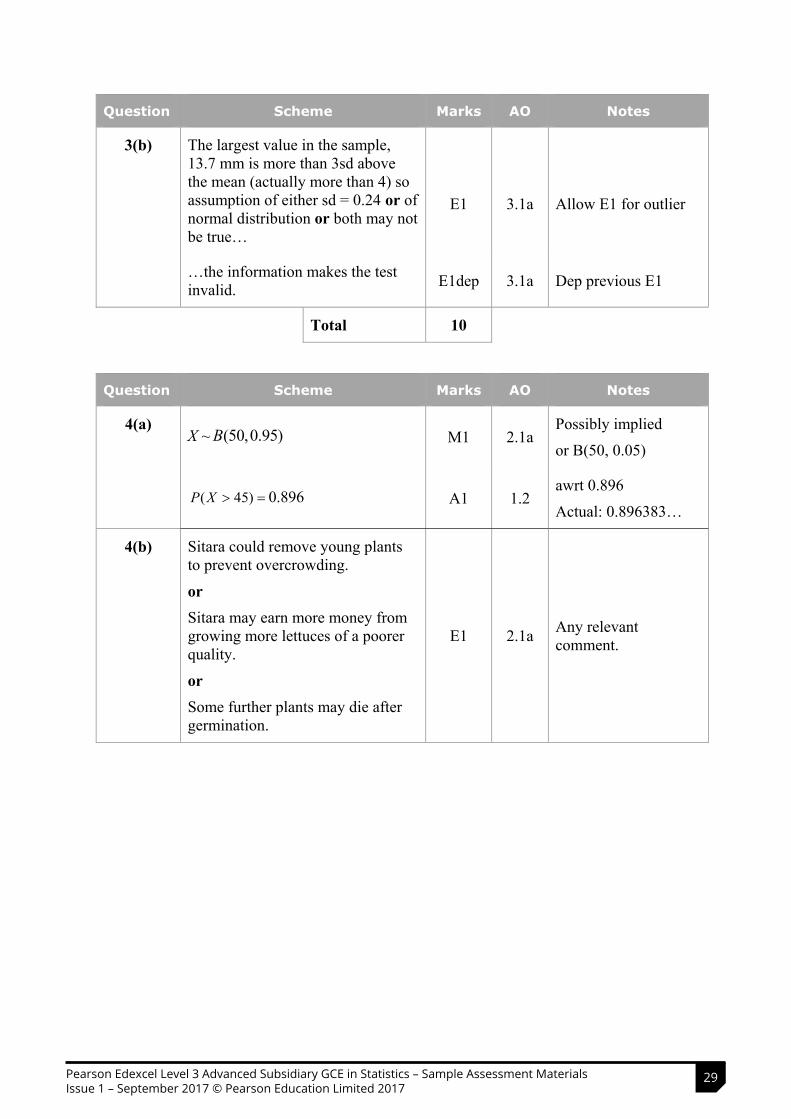
Question Scheme Marks AO Notes
3(b) The largest value in the sample, 13.7 mm is more than 3sd above the mean (actually more than 4) so assumption of either sd = 0.24 or of normal distribution or both may not be true…
E1 3.1a Allow E1 for outlier
…the information makes the test invalid. E1dep 3.1a Dep previous E1
Total 10
Question Scheme Marks AO Notes
4(a)X ~ (50,0.95)B M1 2.1a
Possibly implied
or B(50, 0.05)
( 45)P X 0.896 A1 1.2 awrt 0.896
Actual: 0.896383…
4(b) Sitara could remove young plants to prevent overcrowding.
orSitara may earn more money from growing more lettuces of a poorer quality.
orSome further plants may die after germination.
E1 2.1a Any relevant comment.
29Pearson Edexcel Level 3 Advanced Subsidiary GCE in Statistics – Sample Assessment Materials Issue 1 – September 2017 © Pearson Education Limited 2017
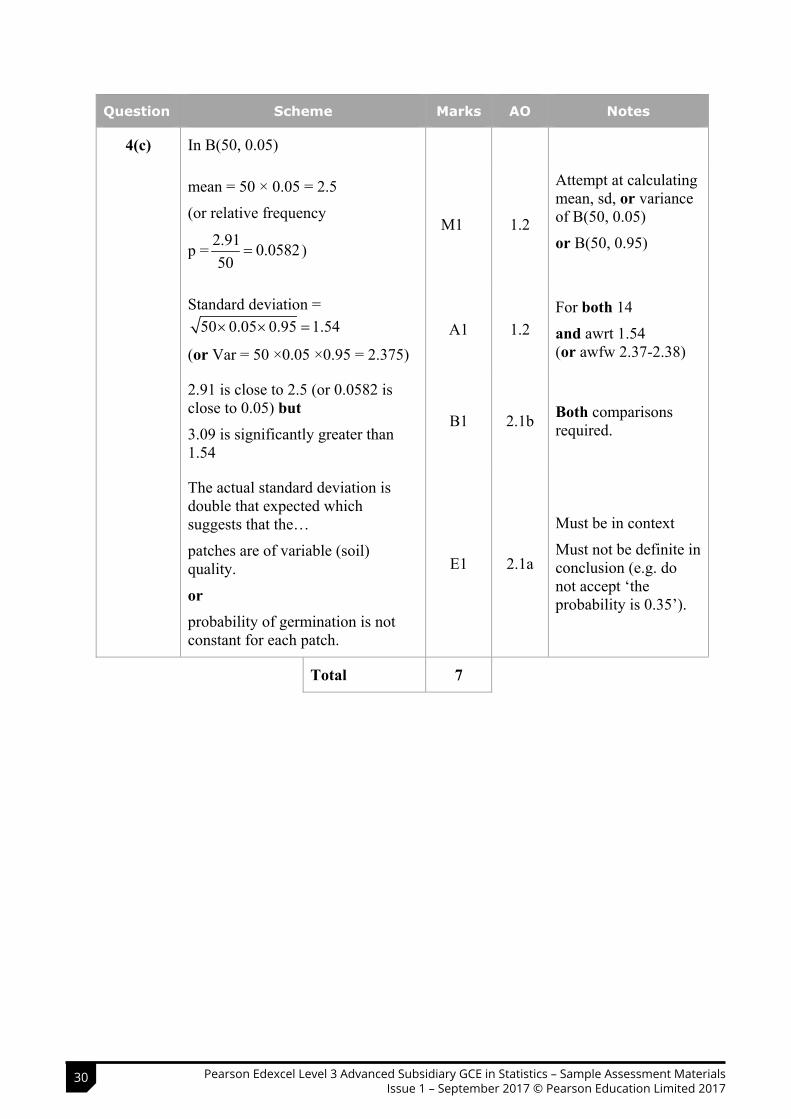
Question Scheme Marks AO Notes
4(c) In B(50, 0.05)
mean = 50 × 0.05 = 2.5
(or relative frequency
p = 2.91 0.058250
) M1 1.2
Attempt at calculating mean, sd, or variance of B(50, 0.05)
or B(50, 0.95)
Standard deviation = 50 0.05 0.95 1.54
(or Var = 50 ×0.05 ×0.95 = 2.375) A1 1.2
For both 14
and awrt 1.54 (or awfw 2.37-2.38)
2.91 is close to 2.5 (or 0.0582 is close to 0.05) but3.09 is significantly greater than 1.54
B1 2.1b Both comparisons required.
The actual standard deviation is double that expected which suggests that the…
patches are of variable (soil) quality.
orprobability of germination is not constant for each patch.
E1 2.1a
Must be in context
Must not be definite in conclusion (e.g. do not accept ‘the probability is 0.35’).
Total 7
30 Pearson Edexcel Level 3 Advanced Subsidiary GCE in Statistics – Sample Assessment Materials Issue 1 – September 2017 © Pearson Education Limited 2017
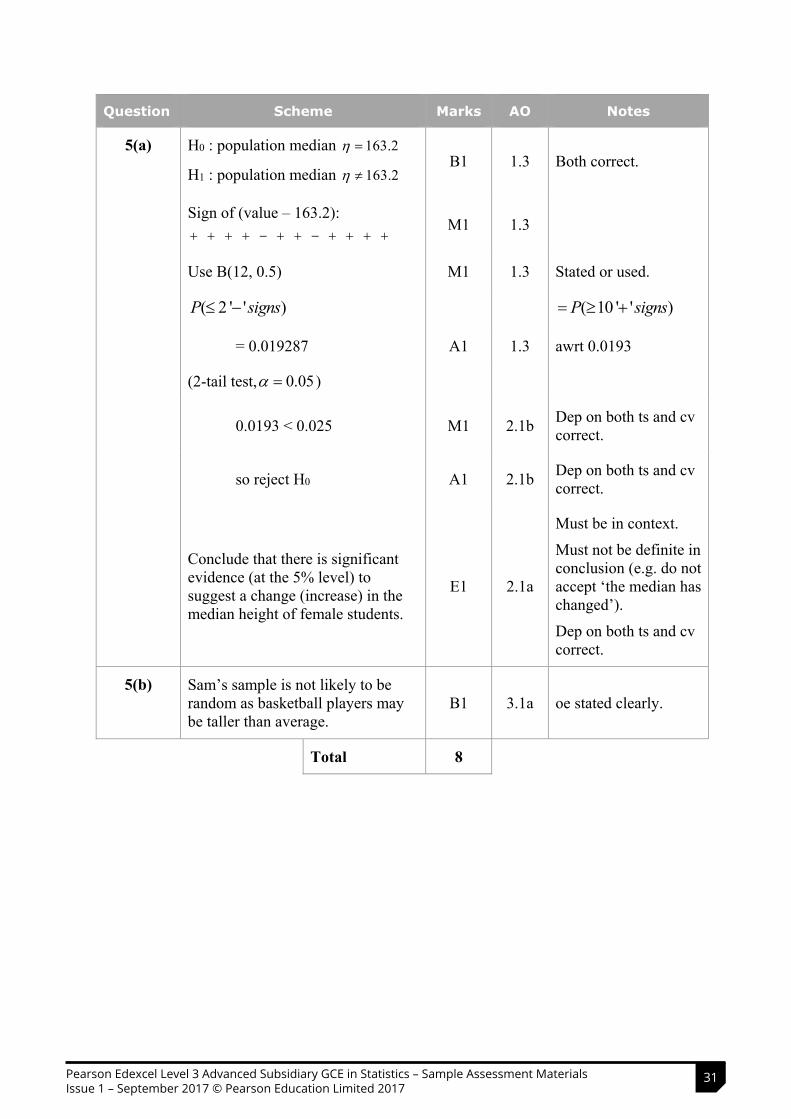
Question Scheme Marks AO Notes
5(a) H0 : population median 163.2
H1 : population median 163.2 B1 1.3 Both correct.
Sign of (value – 163.2):
M1 1.3
Use B(12, 0.5) M1 1.3 Stated or used.
( 2 ' ' )P signs ( 10 ' ' )P signs
= 0.019287 A1 1.3 awrt 0.0193
(2-tail test, 0.05 )
0.0193 < 0.025 M1 2.1b Dep on both ts and cv correct.
so reject H0 A1 2.1b Dep on both ts and cv correct.
Conclude that there is significant evidence (at the 5% level) to suggest a change (increase) in the median height of female students.
E1 2.1a
Must be in context.
Must not be definite in conclusion (e.g. do not accept ‘the median has changed’).
Dep on both ts and cv correct.
5(b) Sam’s sample is not likely to be random as basketball players may be taller than average.
B1 3.1a oe stated clearly.
Total 8
31Pearson Edexcel Level 3 Advanced Subsidiary GCE in Statistics – Sample Assessment Materials Issue 1 – September 2017 © Pearson Education Limited 2017
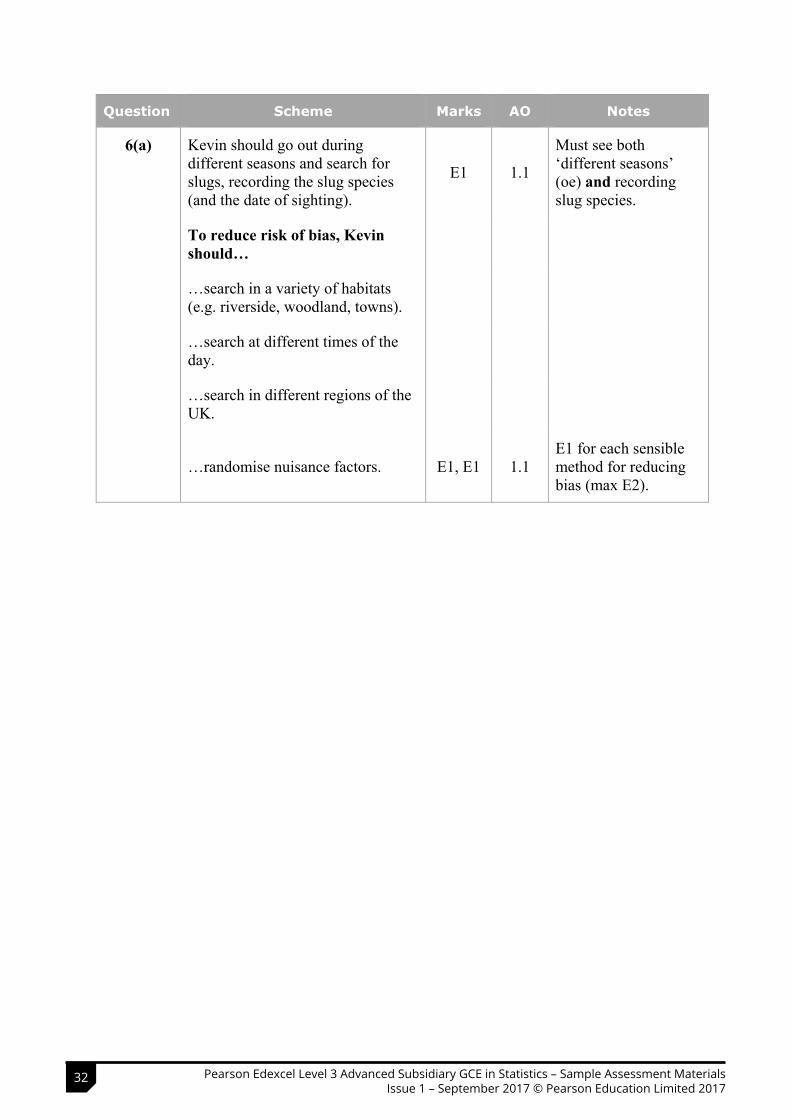
Question Scheme Marks AO Notes
6(a) Kevin should go out during different seasons and search for slugs, recording the slug species (and the date of sighting).
E1 1.1
Must see both ‘different seasons’ (oe) and recording slug species.
To reduce risk of bias, Kevin should…
…search in a variety of habitats (e.g. riverside, woodland, towns).
…search at different times of the day.
…search in different regions of the UK.
…randomise nuisance factors. E1, E1 1.1 E1 for each sensible method for reducing bias (max E2).
32 Pearson Edexcel Level 3 Advanced Subsidiary GCE in Statistics – Sample Assessment Materials Issue 1 – September 2017 © Pearson Education Limited 2017
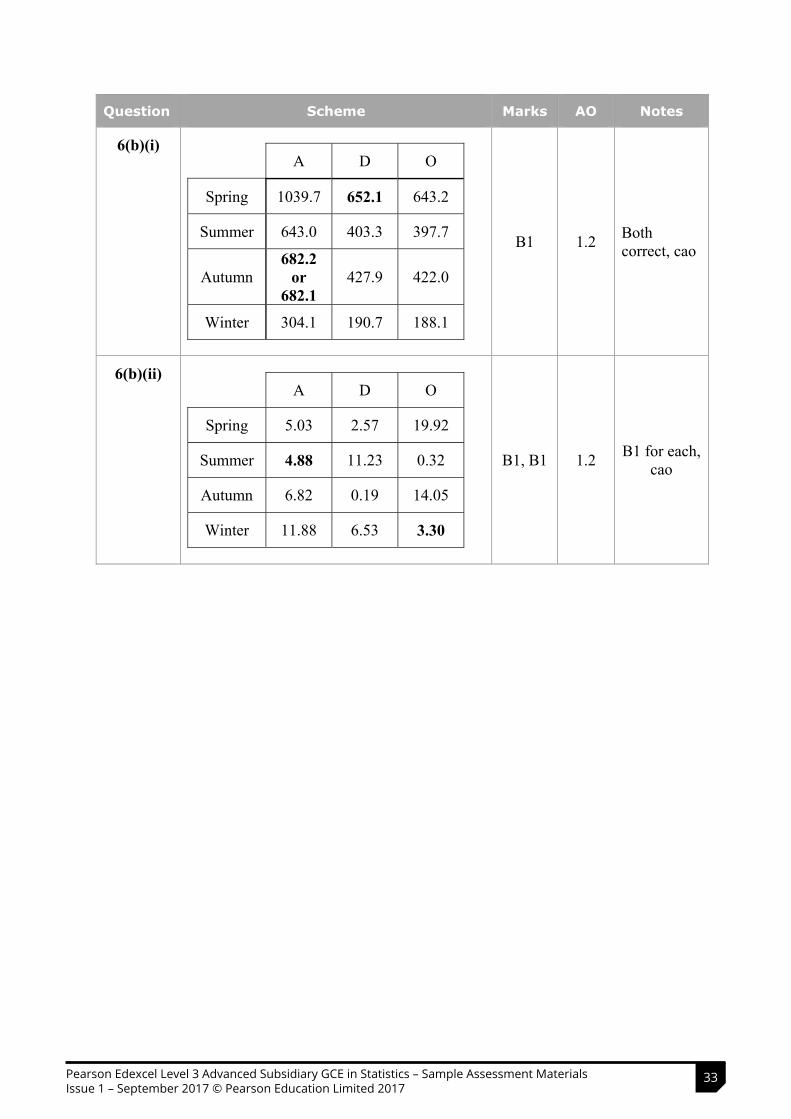
Question Scheme Marks AO Notes
6(b)(i) A D O
Spring 1039.7 652.1 643.2
Summer 643.0 403.3 397.7
Autumn 682.2
or682.1
427.9 422.0
Winter 304.1 190.7 188.1
B1 1.2 Bothcorrect, cao
6(b)(ii) A D O
Spring 5.03 2.57 19.92
Summer 4.88 11.23 0.32
Autumn 6.82 0.19 14.05
Winter 11.88 6.53 3.30
B1, B1 1.2 B1 for each, cao
33Pearson Edexcel Level 3 Advanced Subsidiary GCE in Statistics – Sample Assessment Materials Issue 1 – September 2017 © Pearson Education Limited 2017
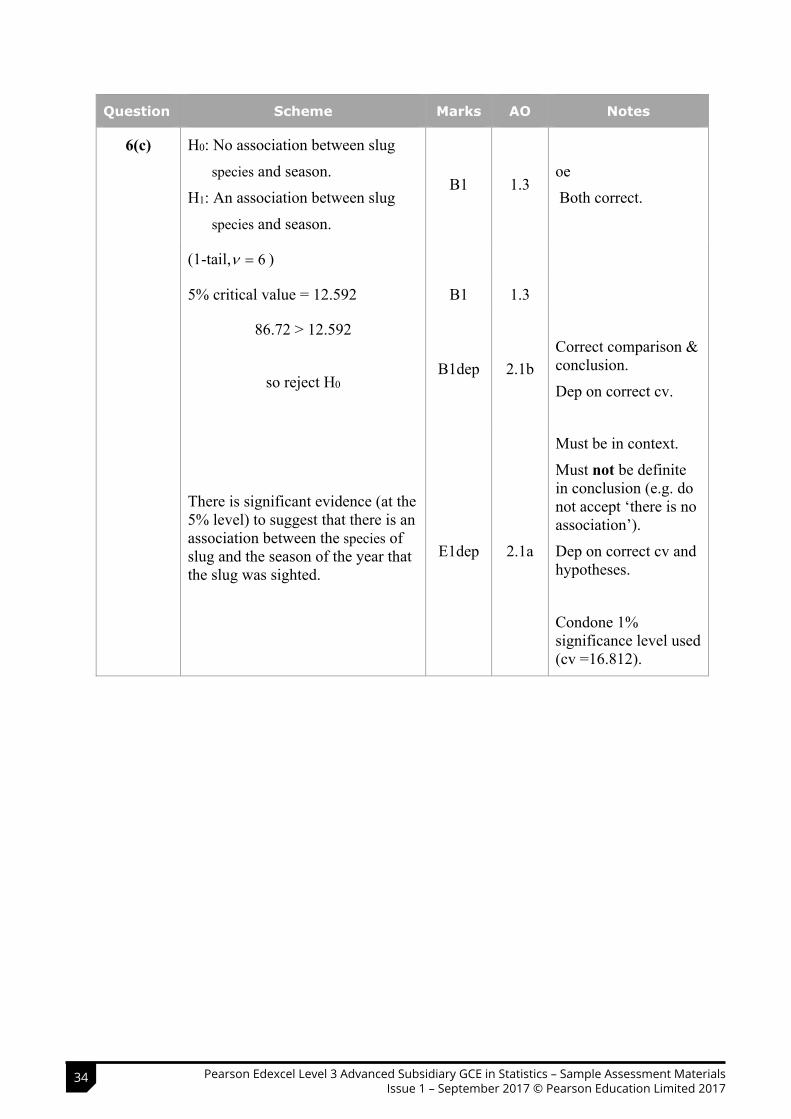
Question Scheme Marks AO Notes
6(c) H0: No association between slug
species and season.
H1: An association between slug
species and season.
B1 1.3 oe
Both correct.
(1-tail, 6 )
5% critical value = 12.592 B1 1.3
86.72 > 12.592
so reject H0B1dep 2.1b
Correct comparison & conclusion.
Dep on correct cv.
There is significant evidence (at the 5% level) to suggest that there is an association between the species of slug and the season of the year that the slug was sighted.
E1dep 2.1a
Must be in context.
Must not be definite in conclusion (e.g. do not accept ‘there is no association’).
Dep on correct cv and hypotheses.
Condone 1% significance level used (cv =16.812).
34 Pearson Edexcel Level 3 Advanced Subsidiary GCE in Statistics – Sample Assessment Materials Issue 1 – September 2017 © Pearson Education Limited 2017
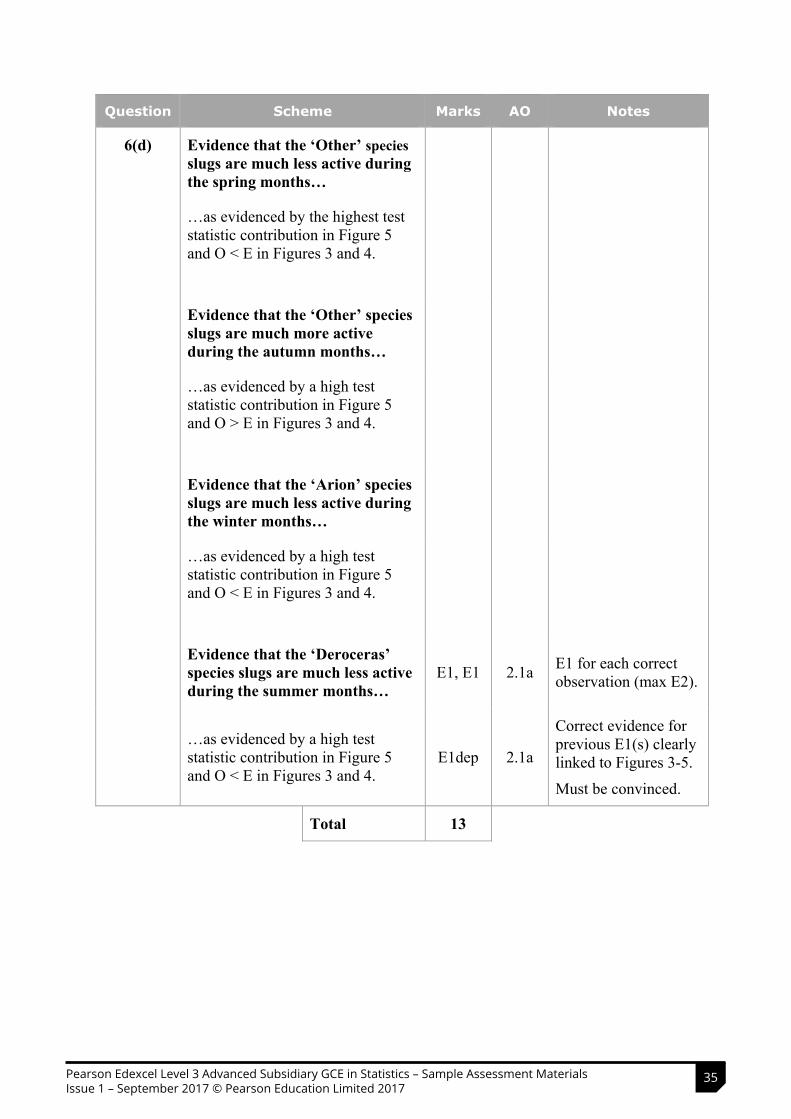
Question Scheme Marks AO Notes
6(d) Evidence that the ‘Other’ speciesslugs are much less active during the spring months…
…as evidenced by the highest test statistic contribution in Figure 5 and O < E in Figures 3 and 4.
Evidence that the ‘Other’ species slugs are much more active during the autumn months…
…as evidenced by a high test statistic contribution in Figure 5 and O > E in Figures 3 and 4.
Evidence that the ‘Arion’ species slugs are much less active during the winter months…
…as evidenced by a high test statistic contribution in Figure 5 and O < E in Figures 3 and 4.
Evidence that the ‘Deroceras’ species slugs are much less active during the summer months…
E1, E1 2.1a E1 for each correct observation (max E2).
…as evidenced by a high test statistic contribution in Figure 5 and O < E in Figures 3 and 4.
E1dep 2.1a
Correct evidence for previous E1(s) clearly linked to Figures 3-5.
Must be convinced.
Total 13
35Pearson Edexcel Level 3 Advanced Subsidiary GCE in Statistics – Sample Assessment Materials Issue 1 – September 2017 © Pearson Education Limited 2017
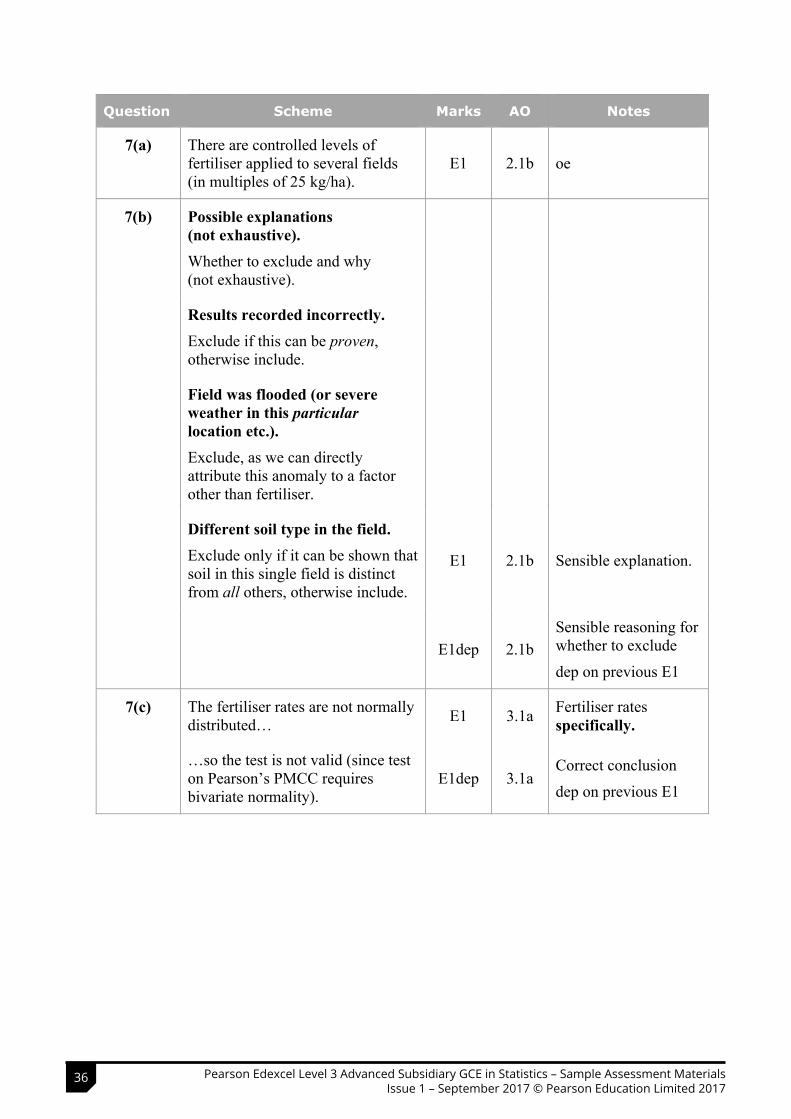
Question Scheme Marks AO Notes
7(a) There are controlled levels of fertiliser applied to several fields (in multiples of 25 kg/ha).
E1 2.1b oe
7(b) Possible explanations (not exhaustive). Whether to exclude and why(not exhaustive).
Results recorded incorrectly. Exclude if this can be proven,otherwise include.
Field was flooded (or severe weather in this particularlocation etc.). Exclude, as we can directly attribute this anomaly to a factor other than fertiliser.
Different soil type in the field. Exclude only if it can be shown that soil in this single field is distinct from all others, otherwise include.
E1 2.1b Sensible explanation.
E1dep 2.1b Sensible reasoning for whether to exclude
dep on previous E1
7(c) The fertiliser rates are not normally distributed… E1 3.1a Fertiliser rates
specifically.
…so the test is not valid (since test on Pearson’s PMCC requires bivariate normality).
E1dep 3.1a Correct conclusion
dep on previous E1
36 Pearson Edexcel Level 3 Advanced Subsidiary GCE in Statistics – Sample Assessment Materials Issue 1 – September 2017 © Pearson Education Limited 2017
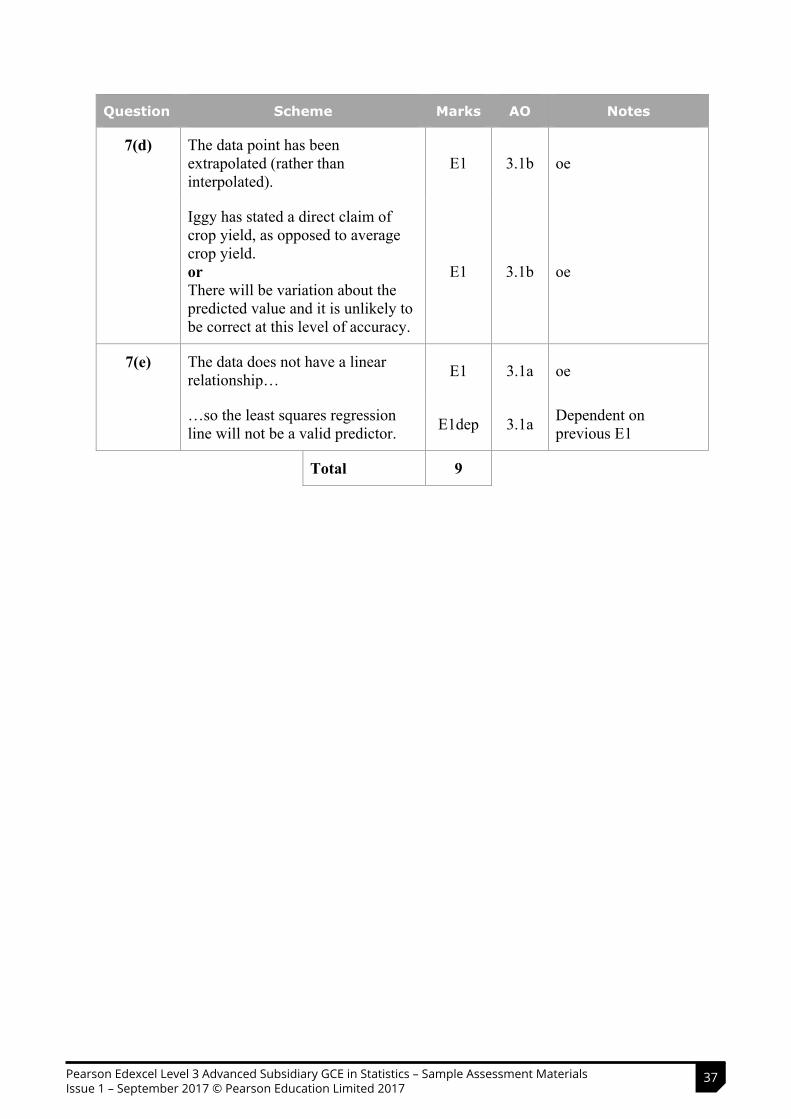
Question Scheme Marks AO Notes
7(d) The data point has been extrapolated (rather than interpolated).
E1 3.1b oe
Iggy has stated a direct claim of crop yield, as opposed to average crop yield. orThere will be variation about the predicted value and it is unlikely to be correct at this level of accuracy.
E1 3.1b oe
7(e) The data does not have a linear relationship… E1 3.1a oe
…so the least squares regression line will not be a valid predictor. E1dep 3.1a Dependent on
previous E1
Total 9
37Pearson Edexcel Level 3 Advanced Subsidiary GCE in Statistics – Sample Assessment Materials Issue 1 – September 2017 © Pearson Education Limited 2017

Centre Number Candidate Number
Write your name hereSurname Other names
Total Marks
Paper Reference
StatisticsAdvanced SubsidiaryPaper 2
8ST0/02
*S59173A0124*S59173A©2017 Pearson Education Ltd.
1/1/1/1/
Turn over
Candidates may use any calculator permitted by Pearson regulations. Calculators must not have the facility for algebraic manipulation, differentiation and integration, or have retrievable mathematical formulae stored in them.
Instructions• Use black ink or ball-point pen.• If pencil is used for diagrams/sketches/graphs it must be dark (HB or B).• Fill in the boxes at the top of this page with your name, centre number and candidate number.• Answer all questions and ensure that your answers to parts of questions are clearly labelled.• Answer the questions in the spaces provided – there may be more space than you need.• You should show sufficient working to make your methods clear. Answers without working may not gain full credit.• Inexact answers should be given to three significant figures unless otherwise stated.
Information• A booklet ‘Statistical formulae and tables’ is provided.• There are 8 questions in this question paper. The total mark for this paper is 60. • The marks for each question are shown in brackets – use this as a guide as to how much time to spend on each question.
Advice• Read each question carefully before you start to answer it.• Try to answer every question.• Check your answers if you have time at the end.• If you change your mind about an answer, cross it out and put your new answer and any working underneath.
You must have:Statistical formulae and tables booklet, calculator
Sample Assessment Material for first teaching September 2017
Time: 1 hour 30 minutes
Pearson Edexcel Level 3 GCE
38 Pearson Edexcel Level 3 Advanced Subsidiary GCE in Statistics – Sample Assessment Materials Issue 1 – September 2017 © Pearson Education Limited 2017
Centre Number Candidate Number
Write your name hereSurname Other names
Total Marks
Paper Reference
StatisticsAdvanced SubsidiaryPaper 2
8ST0/02
*S59173A0124*S59173A©2017 Pearson Education Ltd.
1/1/1/1/
Turn over
Candidates may use any calculator permitted by Pearson regulations. Calculators must not have the facility for algebraic manipulation, differentiation and integration, or have retrievable mathematical formulae stored in them.
Instructions• Use black ink or ball-point pen.• If pencil is used for diagrams/sketches/graphs it must be dark (HB or B).• Fill in the boxes at the top of this page with your name, centre number and candidate number.• Answer all questions and ensure that your answers to parts of questions are clearly labelled.• Answer the questions in the spaces provided – there may be more space than you need.• You should show sufficient working to make your methods clear. Answers without working may not gain full credit.• Inexact answers should be given to three significant figures unless otherwise stated.
Information• A booklet ‘Statistical formulae and tables’ is provided.• There are 8 questions in this question paper. The total mark for this paper is 60. • The marks for each question are shown in brackets – use this as a guide as to how much time to spend on each question.
Advice• Read each question carefully before you start to answer it.• Try to answer every question.• Check your answers if you have time at the end.• If you change your mind about an answer, cross it out and put your new answer and any working underneath.
You must have:Statistical formulae and tables booklet, calculator
Sample Assessment Material for first teaching September 2017
Time: 1 hour 30 minutes
Pearson Edexcel Level 3 GCE
39Pearson Edexcel Level 3 Advanced Subsidiary GCE in Statistics – Sample Assessment Materials Issue 1 – September 2017 © Pearson Education Limited 2017
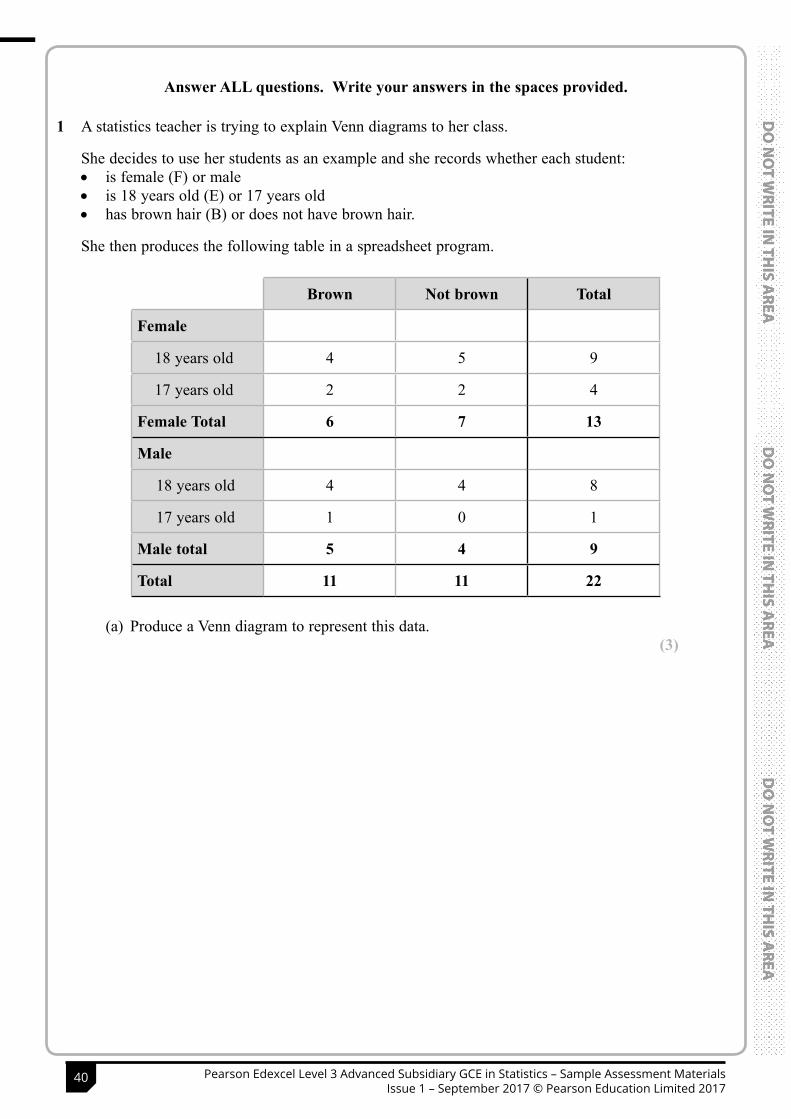
2
*S59173A0224*
D
O N
OT W
RITE IN TH
IS AREA
D
O N
OT W
RITE IN TH
IS AREA
D
O N
OT W
RITE IN TH
IS AREA
D
O N
OT
WRI
TE IN
TH
IS A
REA
D
O N
OT
WRI
TE IN
TH
IS A
REA
D
O N
OT
WRI
TE IN
TH
IS A
REA
Answer ALL questions. Write your answers in the spaces provided.
1 A statistics teacher is trying to explain Venn diagrams to her class.
She decides to use her students as an example and she records whether each student: • is female (F) or male • is 18 years old (E) or 17 years old • has brown hair (B) or does not have brown hair.
She then produces the following table in a spreadsheet program.
Brown Not brown Total
Female
18 years old 4 5 9
17 years old 2 2 4
Female Total 6 7 13
Male
18 years old 4 4 8
17 years old 1 0 1
Male total 5 4 9
Total 11 11 22
(a) Produce a Venn diagram to represent this data.(3)
3
*S59173A0324* Turn over
D
O N
OT W
RITE IN TH
IS AREA
D
O N
OT W
RITE IN TH
IS AREA
D
O N
OT W
RITE IN TH
IS AREA
D
O N
OT
WRI
TE IN
TH
IS A
REA
D
O N
OT
WRI
TE IN
TH
IS A
REA
D
O N
OT
WRI
TE IN
TH
IS A
REA
40 Pearson Edexcel Level 3 Advanced Subsidiary GCE in Statistics – Sample Assessment Materials Issue 1 – September 2017 © Pearson Education Limited 2017

2
*S59173A0224*
D
O N
OT W
RITE IN TH
IS AREA
D
O N
OT W
RITE IN TH
IS AREA
D
O N
OT W
RITE IN TH
IS AREA
D
O N
OT
WRI
TE IN
TH
IS A
REA
D
O N
OT
WRI
TE IN
TH
IS A
REA
D
O N
OT
WRI
TE IN
TH
IS A
REA
Answer ALL questions. Write your answers in the spaces provided.
1 A statistics teacher is trying to explain Venn diagrams to her class.
She decides to use her students as an example and she records whether each student: • is female (F) or male • is 18 years old (E) or 17 years old • has brown hair (B) or does not have brown hair.
She then produces the following table in a spreadsheet program.
Brown Not brown Total
Female
18 years old 4 5 9
17 years old 2 2 4
Female Total 6 7 13
Male
18 years old 4 4 8
17 years old 1 0 1
Male total 5 4 9
Total 11 11 22
(a) Produce a Venn diagram to represent this data.(3)
3
*S59173A0324* Turn over
D
O N
OT W
RITE IN TH
IS AREA
D
O N
OT W
RITE IN TH
IS AREA
D
O N
OT W
RITE IN TH
IS AREA
D
O N
OT
WRI
TE IN
TH
IS A
REA
D
O N
OT
WRI
TE IN
TH
IS A
REA
D
O N
OT
WRI
TE IN
TH
IS A
REA
41Pearson Edexcel Level 3 Advanced Subsidiary GCE in Statistics – Sample Assessment Materials Issue 1 – September 2017 © Pearson Education Limited 2017
4
*S59173A0424*
D
O N
OT W
RITE IN TH
IS AREA
D
O N
OT W
RITE IN TH
IS AREA
D
O N
OT W
RITE IN TH
IS AREA
D
O N
OT
WRI
TE IN
TH
IS A
REA
D
O N
OT
WRI
TE IN
TH
IS A
REA
D
O N
OT
WRI
TE IN
TH
IS A
REA
(b) If a student is chosen at random, find
(i) P ( F ∩ E )(1)
_____________________________________________________________________________________
_____________________________________________________________________________________
_____________________________________________________________________________________
_____________________________________________________________________________________
_____________________________________________________________________________________
_____________________________________________________________________________________
_____________________________________________________________________________________
_____________________________________________________________________________________
_____________________________________________________________________________________
_____________________________________________________________________________________
_____________________________________________________________________________________
_____________________________________________________________________________________
_____________________________________________________________________________________
_____________________________________________________________________________________
_____________________________________________________________________________________
(ii) P ( B|F ∩ E )(2)
_____________________________________________________________________________________
_____________________________________________________________________________________
_____________________________________________________________________________________
_____________________________________________________________________________________
_____________________________________________________________________________________
_____________________________________________________________________________________
_____________________________________________________________________________________
_____________________________________________________________________________________
_____________________________________________________________________________________
_____________________________________________________________________________________
_____________________________________________________________________________________
_____________________________________________________________________________________
_____________________________________________________________________________________
_____________________________________________________________________________________
_____________________________________________________________________________________
5
*S59173A0524* Turn over
D
O N
OT W
RITE IN TH
IS AREA
D
O N
OT W
RITE IN TH
IS AREA
D
O N
OT W
RITE IN TH
IS AREA
D
O N
OT
WRI
TE IN
TH
IS A
REA
D
O N
OT
WRI
TE IN
TH
IS A
REA
D
O N
OT
WRI
TE IN
TH
IS A
REA
(c) In the context of the question, explain what P ( B|F ∩ E ) represents.(1)
_____________________________________________________________________________________
_____________________________________________________________________________________
_____________________________________________________________________________________
_____________________________________________________________________________________
_____________________________________________________________________________________
_____________________________________________________________________________________
_____________________________________________________________________________________
_____________________________________________________________________________________
_____________________________________________________________________________________
_____________________________________________________________________________________
_____________________________________________________________________________________
_____________________________________________________________________________________
_____________________________________________________________________________________
_____________________________________________________________________________________
_____________________________________________________________________________________
_____________________________________________________________________________________
_____________________________________________________________________________________
_____________________________________________________________________________________
_____________________________________________________________________________________
_____________________________________________________________________________________
_____________________________________________________________________________________
_____________________________________________________________________________________
_____________________________________________________________________________________
_____________________________________________________________________________________
_____________________________________________________________________________________
_____________________________________________________________________________________
_____________________________________________________________________________________
_____________________________________________________________________________________
_____________________________________________________________________________________
_____________________________________________________________________________________
_____________________________________________________________________________________
_____________________________________________________________________________________
_____________________________________________________________________________________
(Total for Question 1 is 7 marks)
42 Pearson Edexcel Level 3 Advanced Subsidiary GCE in Statistics – Sample Assessment Materials Issue 1 – September 2017 © Pearson Education Limited 2017

4
*S59173A0424*
D
O N
OT W
RITE IN TH
IS AREA
D
O N
OT W
RITE IN TH
IS AREA
D
O N
OT W
RITE IN TH
IS AREA
D
O N
OT
WRI
TE IN
TH
IS A
REA
D
O N
OT
WRI
TE IN
TH
IS A
REA
D
O N
OT
WRI
TE IN
TH
IS A
REA
(b) If a student is chosen at random, find
(i) P ( F ∩ E )(1)
_____________________________________________________________________________________
_____________________________________________________________________________________
_____________________________________________________________________________________
_____________________________________________________________________________________
_____________________________________________________________________________________
_____________________________________________________________________________________
_____________________________________________________________________________________
_____________________________________________________________________________________
_____________________________________________________________________________________
_____________________________________________________________________________________
_____________________________________________________________________________________
_____________________________________________________________________________________
_____________________________________________________________________________________
_____________________________________________________________________________________
_____________________________________________________________________________________
(ii) P ( B|F ∩ E )(2)
_____________________________________________________________________________________
_____________________________________________________________________________________
_____________________________________________________________________________________
_____________________________________________________________________________________
_____________________________________________________________________________________
_____________________________________________________________________________________
_____________________________________________________________________________________
_____________________________________________________________________________________
_____________________________________________________________________________________
_____________________________________________________________________________________
_____________________________________________________________________________________
_____________________________________________________________________________________
_____________________________________________________________________________________
_____________________________________________________________________________________
_____________________________________________________________________________________
5
*S59173A0524* Turn over
D
O N
OT W
RITE IN TH
IS AREA
D
O N
OT W
RITE IN TH
IS AREA
D
O N
OT W
RITE IN TH
IS AREA
D
O N
OT
WRI
TE IN
TH
IS A
REA
D
O N
OT
WRI
TE IN
TH
IS A
REA
D
O N
OT
WRI
TE IN
TH
IS A
REA
(c) In the context of the question, explain what P ( B|F ∩ E ) represents.(1)
_____________________________________________________________________________________
_____________________________________________________________________________________
_____________________________________________________________________________________
_____________________________________________________________________________________
_____________________________________________________________________________________
_____________________________________________________________________________________
_____________________________________________________________________________________
_____________________________________________________________________________________
_____________________________________________________________________________________
_____________________________________________________________________________________
_____________________________________________________________________________________
_____________________________________________________________________________________
_____________________________________________________________________________________
_____________________________________________________________________________________
_____________________________________________________________________________________
_____________________________________________________________________________________
_____________________________________________________________________________________
_____________________________________________________________________________________
_____________________________________________________________________________________
_____________________________________________________________________________________
_____________________________________________________________________________________
_____________________________________________________________________________________
_____________________________________________________________________________________
_____________________________________________________________________________________
_____________________________________________________________________________________
_____________________________________________________________________________________
_____________________________________________________________________________________
_____________________________________________________________________________________
_____________________________________________________________________________________
_____________________________________________________________________________________
_____________________________________________________________________________________
_____________________________________________________________________________________
_____________________________________________________________________________________
(Total for Question 1 is 7 marks)
43Pearson Edexcel Level 3 Advanced Subsidiary GCE in Statistics – Sample Assessment Materials Issue 1 – September 2017 © Pearson Education Limited 2017
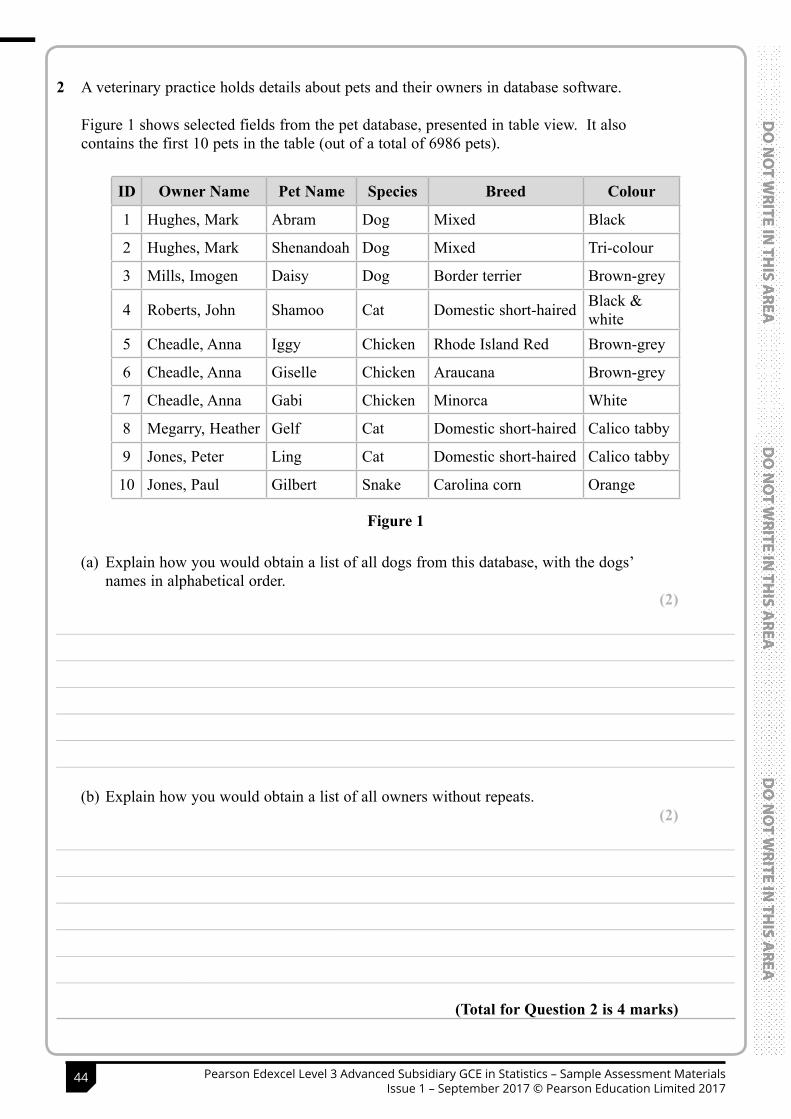
6
*S59173A0624*
D
O N
OT W
RITE IN TH
IS AREA
D
O N
OT W
RITE IN TH
IS AREA
D
O N
OT W
RITE IN TH
IS AREA
D
O N
OT
WRI
TE IN
TH
IS A
REA
D
O N
OT
WRI
TE IN
TH
IS A
REA
D
O N
OT
WRI
TE IN
TH
IS A
REA
2 A veterinary practice holds details about pets and their owners in database software.
Figure 1 shows selected fields from the pet database, presented in table view. It also contains the first 10 pets in the table (out of a total of 6986 pets).
ID Owner Name Pet Name Species Breed Colour
1 Hughes, Mark Abram Dog Mixed Black
2 Hughes, Mark Shenandoah Dog Mixed Tri-colour
3 Mills, Imogen Daisy Dog Border terrier Brown-grey
4 Roberts, John Shamoo Cat Domestic short-haired Black & white
5 Cheadle, Anna Iggy Chicken Rhode Island Red Brown-grey
6 Cheadle, Anna Giselle Chicken Araucana Brown-grey
7 Cheadle, Anna Gabi Chicken Minorca White
8 Megarry, Heather Gelf Cat Domestic short-haired Calico tabby
9 Jones, Peter Ling Cat Domestic short-haired Calico tabby
10 Jones, Paul Gilbert Snake Carolina corn Orange
Figure 1
(a) Explain how you would obtain a list of all dogs from this database, with the dogs’ names in alphabetical order.
(2)
_____________________________________________________________________________________
_____________________________________________________________________________________
_____________________________________________________________________________________
_____________________________________________________________________________________
_____________________________________________________________________________________
_____________________________________________________________________________________
(b) Explain how you would obtain a list of all owners without repeats.(2)
_____________________________________________________________________________________
_____________________________________________________________________________________
_____________________________________________________________________________________
_____________________________________________________________________________________
_____________________________________________________________________________________
_____________________________________________________________________________________
(Total for Question 2 is 4 marks)
7
*S59173A0724* Turn over
D
O N
OT W
RITE IN TH
IS AREA
D
O N
OT W
RITE IN TH
IS AREA
D
O N
OT W
RITE IN TH
IS AREA
D
O N
OT
WRI
TE IN
TH
IS A
REA
D
O N
OT
WRI
TE IN
TH
IS A
REA
D
O N
OT
WRI
TE IN
TH
IS A
REA
3 The diagram in Figure 2 is taken from HM Treasury’s ‘National Infrastructure Plan 2013’. It shows the value of future projects (projects ‘in the pipeline’) according to sector.
Pipeline value by sector
Commun
icatio
ns
1 000 000
100 000
10 000
1000
100
10
1
Energy
Flood
Intell
ectua
l Cap
ital
Transpo
rtWast
eWate
r
Capital Value £ million
Source: HM Treasury Major Infrastructure Tracking unit
Figure 2
Explain, in the context of the question, how Figure 2 may be misleading to a reader.(4)
_____________________________________________________________________________________
_____________________________________________________________________________________
_____________________________________________________________________________________
_____________________________________________________________________________________
_____________________________________________________________________________________
_____________________________________________________________________________________
_____________________________________________________________________________________
_____________________________________________________________________________________
_____________________________________________________________________________________
_____________________________________________________________________________________
_____________________________________________________________________________________
_____________________________________________________________________________________
(Total for Question 3 is 4 marks)
44 Pearson Edexcel Level 3 Advanced Subsidiary GCE in Statistics – Sample Assessment Materials Issue 1 – September 2017 © Pearson Education Limited 2017
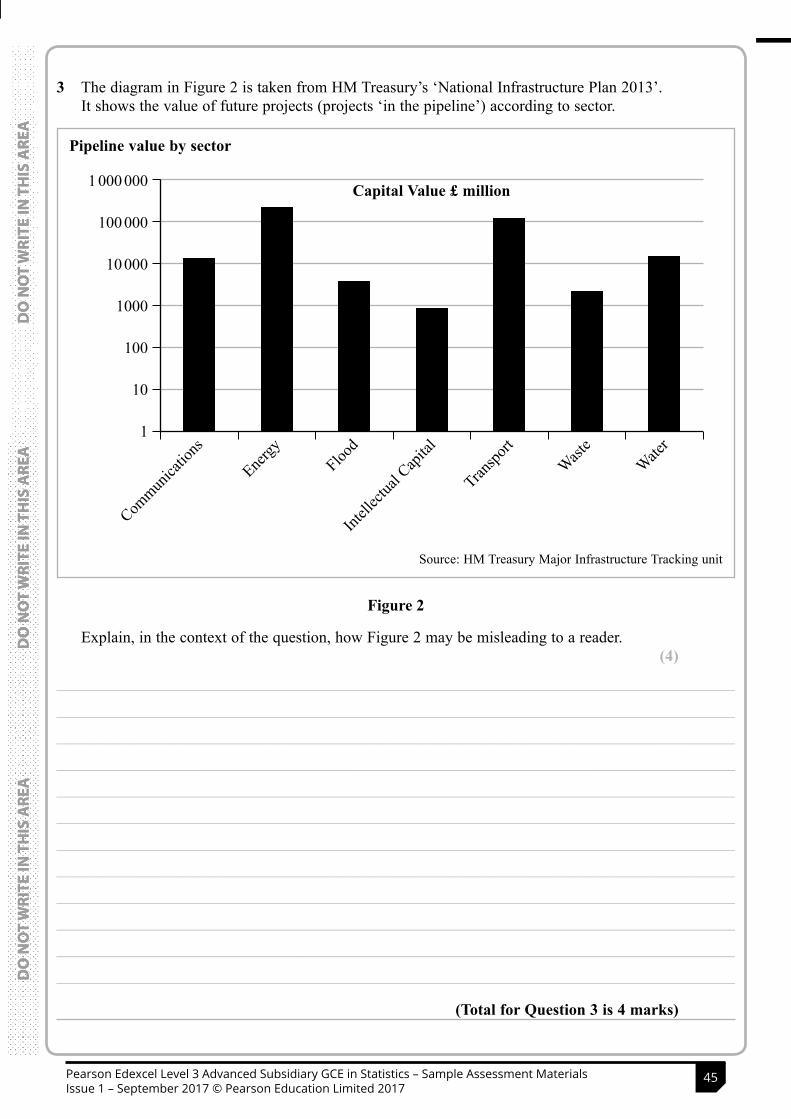
6
*S59173A0624*
D
O N
OT W
RITE IN TH
IS AREA
D
O N
OT W
RITE IN TH
IS AREA
D
O N
OT W
RITE IN TH
IS AREA
D
O N
OT
WRI
TE IN
TH
IS A
REA
D
O N
OT
WRI
TE IN
TH
IS A
REA
D
O N
OT
WRI
TE IN
TH
IS A
REA
2 A veterinary practice holds details about pets and their owners in database software.
Figure 1 shows selected fields from the pet database, presented in table view. It also contains the first 10 pets in the table (out of a total of 6986 pets).
ID Owner Name Pet Name Species Breed Colour
1 Hughes, Mark Abram Dog Mixed Black
2 Hughes, Mark Shenandoah Dog Mixed Tri-colour
3 Mills, Imogen Daisy Dog Border terrier Brown-grey
4 Roberts, John Shamoo Cat Domestic short-haired Black & white
5 Cheadle, Anna Iggy Chicken Rhode Island Red Brown-grey
6 Cheadle, Anna Giselle Chicken Araucana Brown-grey
7 Cheadle, Anna Gabi Chicken Minorca White
8 Megarry, Heather Gelf Cat Domestic short-haired Calico tabby
9 Jones, Peter Ling Cat Domestic short-haired Calico tabby
10 Jones, Paul Gilbert Snake Carolina corn Orange
Figure 1
(a) Explain how you would obtain a list of all dogs from this database, with the dogs’ names in alphabetical order.
(2)
_____________________________________________________________________________________
_____________________________________________________________________________________
_____________________________________________________________________________________
_____________________________________________________________________________________
_____________________________________________________________________________________
_____________________________________________________________________________________
(b) Explain how you would obtain a list of all owners without repeats.(2)
_____________________________________________________________________________________
_____________________________________________________________________________________
_____________________________________________________________________________________
_____________________________________________________________________________________
_____________________________________________________________________________________
_____________________________________________________________________________________
(Total for Question 2 is 4 marks)
7
*S59173A0724* Turn over
D
O N
OT W
RITE IN TH
IS AREA
D
O N
OT W
RITE IN TH
IS AREA
D
O N
OT W
RITE IN TH
IS AREA
D
O N
OT
WRI
TE IN
TH
IS A
REA
D
O N
OT
WRI
TE IN
TH
IS A
REA
D
O N
OT
WRI
TE IN
TH
IS A
REA
3 The diagram in Figure 2 is taken from HM Treasury’s ‘National Infrastructure Plan 2013’. It shows the value of future projects (projects ‘in the pipeline’) according to sector.
Pipeline value by sector
Commun
icatio
ns
1 000 000
100 000
10 000
1000
100
10
1
Energy
Flood
Intell
ectua
l Cap
ital
Transpo
rtWast
eWate
r
Capital Value £ million
Source: HM Treasury Major Infrastructure Tracking unit
Figure 2
Explain, in the context of the question, how Figure 2 may be misleading to a reader.(4)
_____________________________________________________________________________________
_____________________________________________________________________________________
_____________________________________________________________________________________
_____________________________________________________________________________________
_____________________________________________________________________________________
_____________________________________________________________________________________
_____________________________________________________________________________________
_____________________________________________________________________________________
_____________________________________________________________________________________
_____________________________________________________________________________________
_____________________________________________________________________________________
_____________________________________________________________________________________
(Total for Question 3 is 4 marks)
45Pearson Edexcel Level 3 Advanced Subsidiary GCE in Statistics – Sample Assessment Materials Issue 1 – September 2017 © Pearson Education Limited 2017
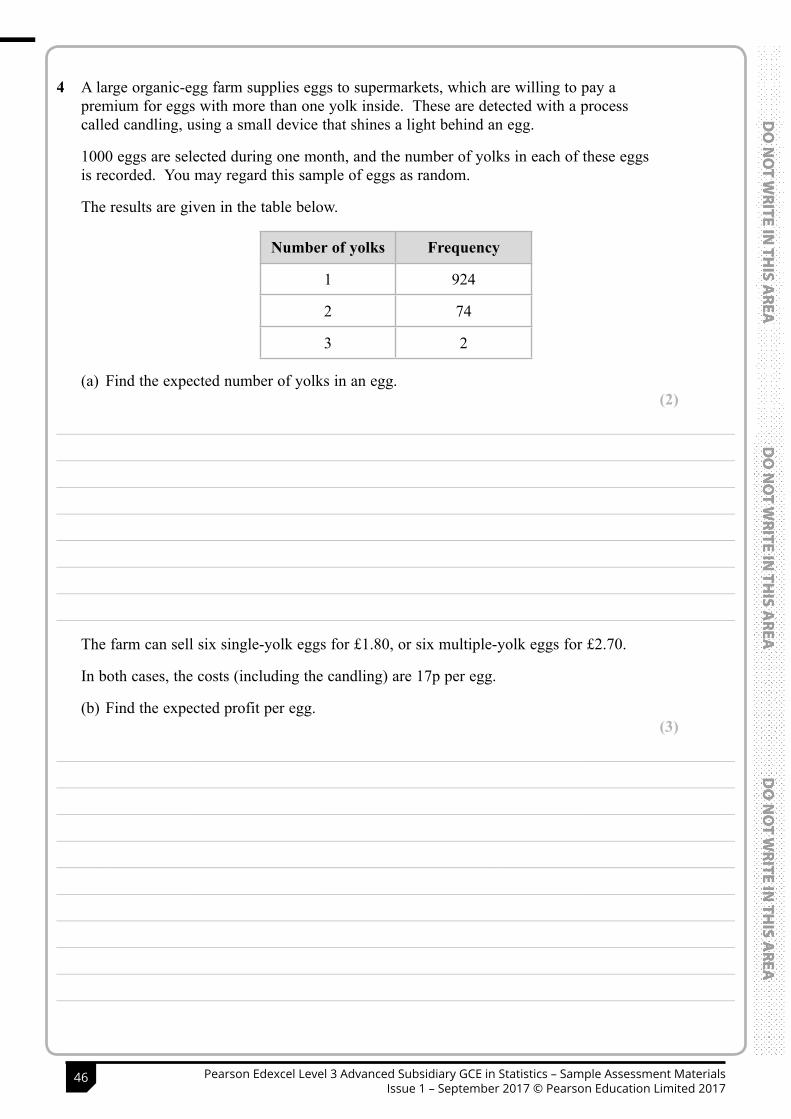
8
*S59173A0824*
D
O N
OT W
RITE IN TH
IS AREA
D
O N
OT W
RITE IN TH
IS AREA
D
O N
OT W
RITE IN TH
IS AREA
D
O N
OT
WRI
TE IN
TH
IS A
REA
D
O N
OT
WRI
TE IN
TH
IS A
REA
D
O N
OT
WRI
TE IN
TH
IS A
REA
4 A large organic-egg farm supplies eggs to supermarkets, which are willing to pay a premium for eggs with more than one yolk inside. These are detected with a process called candling, using a small device that shines a light behind an egg.
1000 eggs are selected during one month, and the number of yolks in each of these eggs is recorded. You may regard this sample of eggs as random.
The results are given in the table below.
Number of yolks Frequency
1 924
2 74
3 2
(a) Find the expected number of yolks in an egg.(2)
_____________________________________________________________________________________
_____________________________________________________________________________________
_____________________________________________________________________________________
_____________________________________________________________________________________
_____________________________________________________________________________________
_____________________________________________________________________________________
_____________________________________________________________________________________
_____________________________________________________________________________________
The farm can sell six single-yolk eggs for £1.80, or six multiple-yolk eggs for £2.70.
In both cases, the costs (including the candling) are 17p per egg.
(b) Find the expected profit per egg.(3)
_____________________________________________________________________________________
_____________________________________________________________________________________
_____________________________________________________________________________________
_____________________________________________________________________________________
_____________________________________________________________________________________
_____________________________________________________________________________________
_____________________________________________________________________________________
_____________________________________________________________________________________
_____________________________________________________________________________________
_____________________________________________________________________________________
9
*S59173A0924* Turn over
D
O N
OT W
RITE IN TH
IS AREA
D
O N
OT W
RITE IN TH
IS AREA
D
O N
OT W
RITE IN TH
IS AREA
D
O N
OT
WRI
TE IN
TH
IS A
REA
D
O N
OT
WRI
TE IN
TH
IS A
REA
D
O N
OT
WRI
TE IN
TH
IS A
REA
(c) Given that the cost of the candling accounts for 2p of the 17p costs per egg, would you recommend the farm proceed with the candling technique?
Explain your answer.(2)
_____________________________________________________________________________________
_____________________________________________________________________________________
_____________________________________________________________________________________
_____________________________________________________________________________________
_____________________________________________________________________________________
_____________________________________________________________________________________
_____________________________________________________________________________________
_____________________________________________________________________________________
_____________________________________________________________________________________
_____________________________________________________________________________________
_____________________________________________________________________________________
_____________________________________________________________________________________
_____________________________________________________________________________________
_____________________________________________________________________________________
_____________________________________________________________________________________
_____________________________________________________________________________________
_____________________________________________________________________________________
_____________________________________________________________________________________
_____________________________________________________________________________________
_____________________________________________________________________________________
_____________________________________________________________________________________
_____________________________________________________________________________________
_____________________________________________________________________________________
_____________________________________________________________________________________
_____________________________________________________________________________________
_____________________________________________________________________________________
_____________________________________________________________________________________
_____________________________________________________________________________________
_____________________________________________________________________________________
_____________________________________________________________________________________
_____________________________________________________________________________________
(Total for Question 4 is 7 marks)
46 Pearson Edexcel Level 3 Advanced Subsidiary GCE in Statistics – Sample Assessment Materials Issue 1 – September 2017 © Pearson Education Limited 2017
8
*S59173A0824*
D
O N
OT W
RITE IN TH
IS AREA
D
O N
OT W
RITE IN TH
IS AREA
D
O N
OT W
RITE IN TH
IS AREA
D
O N
OT
WRI
TE IN
TH
IS A
REA
D
O N
OT
WRI
TE IN
TH
IS A
REA
D
O N
OT
WRI
TE IN
TH
IS A
REA
4 A large organic-egg farm supplies eggs to supermarkets, which are willing to pay a premium for eggs with more than one yolk inside. These are detected with a process called candling, using a small device that shines a light behind an egg.
1000 eggs are selected during one month, and the number of yolks in each of these eggs is recorded. You may regard this sample of eggs as random.
The results are given in the table below.
Number of yolks Frequency
1 924
2 74
3 2
(a) Find the expected number of yolks in an egg.(2)
_____________________________________________________________________________________
_____________________________________________________________________________________
_____________________________________________________________________________________
_____________________________________________________________________________________
_____________________________________________________________________________________
_____________________________________________________________________________________
_____________________________________________________________________________________
_____________________________________________________________________________________
The farm can sell six single-yolk eggs for £1.80, or six multiple-yolk eggs for £2.70.
In both cases, the costs (including the candling) are 17p per egg.
(b) Find the expected profit per egg.(3)
_____________________________________________________________________________________
_____________________________________________________________________________________
_____________________________________________________________________________________
_____________________________________________________________________________________
_____________________________________________________________________________________
_____________________________________________________________________________________
_____________________________________________________________________________________
_____________________________________________________________________________________
_____________________________________________________________________________________
_____________________________________________________________________________________
9
*S59173A0924* Turn over
D
O N
OT W
RITE IN TH
IS AREA
D
O N
OT W
RITE IN TH
IS AREA
D
O N
OT W
RITE IN TH
IS AREA
D
O N
OT
WRI
TE IN
TH
IS A
REA
D
O N
OT
WRI
TE IN
TH
IS A
REA
D
O N
OT
WRI
TE IN
TH
IS A
REA
(c) Given that the cost of the candling accounts for 2p of the 17p costs per egg, would you recommend the farm proceed with the candling technique?
Explain your answer.(2)
_____________________________________________________________________________________
_____________________________________________________________________________________
_____________________________________________________________________________________
_____________________________________________________________________________________
_____________________________________________________________________________________
_____________________________________________________________________________________
_____________________________________________________________________________________
_____________________________________________________________________________________
_____________________________________________________________________________________
_____________________________________________________________________________________
_____________________________________________________________________________________
_____________________________________________________________________________________
_____________________________________________________________________________________
_____________________________________________________________________________________
_____________________________________________________________________________________
_____________________________________________________________________________________
_____________________________________________________________________________________
_____________________________________________________________________________________
_____________________________________________________________________________________
_____________________________________________________________________________________
_____________________________________________________________________________________
_____________________________________________________________________________________
_____________________________________________________________________________________
_____________________________________________________________________________________
_____________________________________________________________________________________
_____________________________________________________________________________________
_____________________________________________________________________________________
_____________________________________________________________________________________
_____________________________________________________________________________________
_____________________________________________________________________________________
_____________________________________________________________________________________
(Total for Question 4 is 7 marks)
47Pearson Edexcel Level 3 Advanced Subsidiary GCE in Statistics – Sample Assessment Materials Issue 1 – September 2017 © Pearson Education Limited 2017
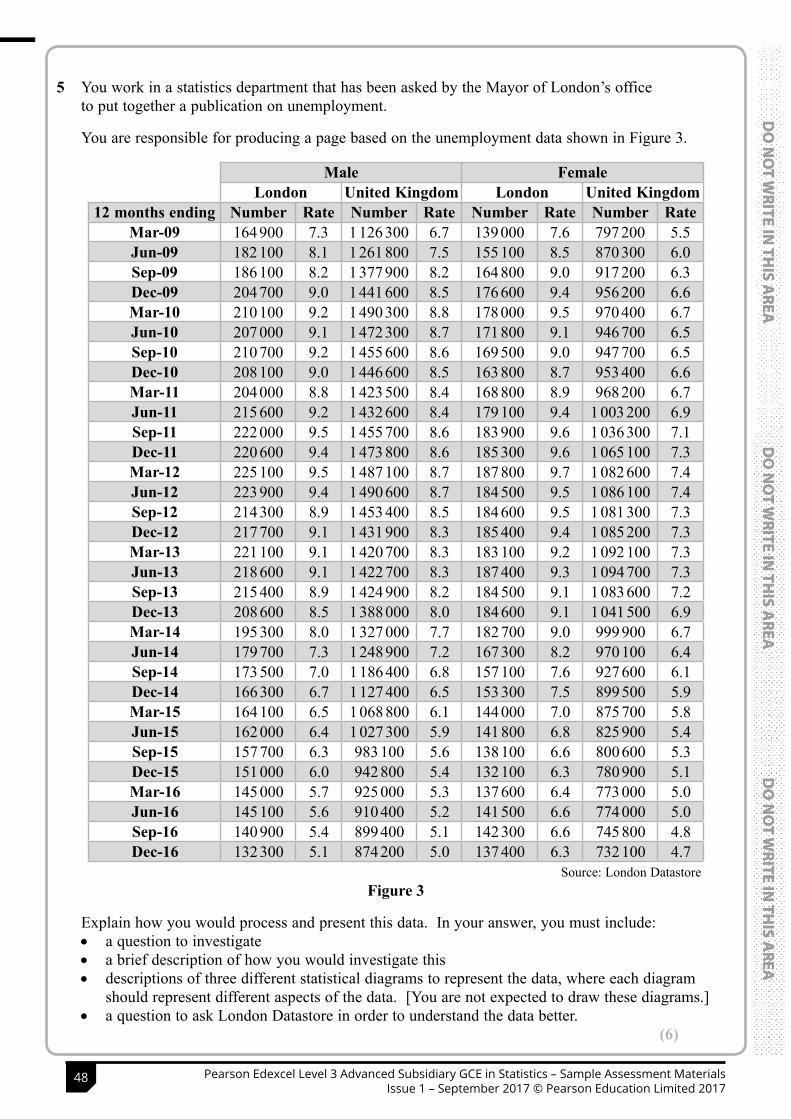
10
*S59173A01024*
D
O N
OT W
RITE IN TH
IS AREA
D
O N
OT W
RITE IN TH
IS AREA
D
O N
OT W
RITE IN TH
IS AREA
D
O N
OT
WRI
TE IN
TH
IS A
REA
D
O N
OT
WRI
TE IN
TH
IS A
REA
D
O N
OT
WRI
TE IN
TH
IS A
REA
5 You work in a statistics department that has been asked by the Mayor of London’s office to put together a publication on unemployment.
You are responsible for producing a page based on the unemployment data shown in Figure 3.
Male FemaleLondon United Kingdom London United Kingdom
12 months ending Number Rate Number Rate Number Rate Number RateMar-09 164 900 7.3 1 126 300 6.7 139 000 7.6 797 200 5.5Jun-09 182 100 8.1 1 261 800 7.5 155 100 8.5 870 300 6.0Sep-09 186 100 8.2 1 377 900 8.2 164 800 9.0 917 200 6.3Dec-09 204 700 9.0 1 441 600 8.5 176 600 9.4 956 200 6.6Mar-10 210 100 9.2 1 490 300 8.8 178 000 9.5 970 400 6.7Jun-10 207 000 9.1 1 472 300 8.7 171 800 9.1 946 700 6.5Sep-10 210 700 9.2 1 455 600 8.6 169 500 9.0 947 700 6.5Dec-10 208 100 9.0 1 446 600 8.5 163 800 8.7 953 400 6.6Mar-11 204 000 8.8 1 423 500 8.4 168 800 8.9 968 200 6.7Jun-11 215 600 9.2 1 432 600 8.4 179 100 9.4 1 003 200 6.9Sep-11 222 000 9.5 1 455 700 8.6 183 900 9.6 1 036 300 7.1Dec-11 220 600 9.4 1 473 800 8.6 185 300 9.6 1 065 100 7.3Mar-12 225 100 9.5 1 487 100 8.7 187 800 9.7 1 082 600 7.4Jun-12 223 900 9.4 1 490 600 8.7 184 500 9.5 1 086 100 7.4Sep-12 214 300 8.9 1 453 400 8.5 184 600 9.5 1 081 300 7.3Dec-12 217 700 9.1 1 431 900 8.3 185 400 9.4 1 085 200 7.3Mar-13 221 100 9.1 1 420 700 8.3 183 100 9.2 1 092 100 7.3Jun-13 218 600 9.1 1 422 700 8.3 187 400 9.3 1 094 700 7.3Sep-13 215 400 8.9 1 424 900 8.2 184 500 9.1 1 083 600 7.2Dec-13 208 600 8.5 1 388 000 8.0 184 600 9.1 1 041 500 6.9Mar-14 195 300 8.0 1 327 000 7.7 182 700 9.0 999 900 6.7Jun-14 179 700 7.3 1 248 900 7.2 167 300 8.2 970 100 6.4Sep-14 173 500 7.0 1 186 400 6.8 157 100 7.6 927 600 6.1Dec-14 166 300 6.7 1 127 400 6.5 153 300 7.5 899 500 5.9Mar-15 164 100 6.5 1 068 800 6.1 144 000 7.0 875 700 5.8Jun-15 162 000 6.4 1 027 300 5.9 141 800 6.8 825 900 5.4Sep-15 157 700 6.3 983 100 5.6 138 100 6.6 800 600 5.3Dec-15 151 000 6.0 942 800 5.4 132 100 6.3 780 900 5.1Mar-16 145 000 5.7 925 000 5.3 137 600 6.4 773 000 5.0Jun-16 145 100 5.6 910 400 5.2 141 500 6.6 774 000 5.0Sep-16 140 900 5.4 899 400 5.1 142 300 6.6 745 800 4.8Dec-16 132 300 5.1 874 200 5.0 137 400 6.3 732 100 4.7
Source: London DatastoreFigure 3
Explain how you would process and present this data. In your answer, you must include: • a question to investigate • a brief description of how you would investigate this • descriptions of three different statistical diagrams to represent the data, where each diagram
should represent different aspects of the data. [You are not expected to draw these diagrams.] • a question to ask London Datastore in order to understand the data better.
(6)
11
*S59173A01124* Turn over
D
O N
OT W
RITE IN TH
IS AREA
D
O N
OT W
RITE IN TH
IS AREA
D
O N
OT W
RITE IN TH
IS AREA
D
O N
OT
WRI
TE IN
TH
IS A
REA
D
O N
OT
WRI
TE IN
TH
IS A
REA
D
O N
OT
WRI
TE IN
TH
IS A
REA
_____________________________________________________________________________________
_____________________________________________________________________________________
_____________________________________________________________________________________
_____________________________________________________________________________________
_____________________________________________________________________________________
_____________________________________________________________________________________
_____________________________________________________________________________________
_____________________________________________________________________________________
_____________________________________________________________________________________
_____________________________________________________________________________________
_____________________________________________________________________________________
_____________________________________________________________________________________
_____________________________________________________________________________________
_____________________________________________________________________________________
_____________________________________________________________________________________
_____________________________________________________________________________________
_____________________________________________________________________________________
_____________________________________________________________________________________
_____________________________________________________________________________________
_____________________________________________________________________________________
_____________________________________________________________________________________
_____________________________________________________________________________________
_____________________________________________________________________________________
_____________________________________________________________________________________
_____________________________________________________________________________________
_____________________________________________________________________________________
_____________________________________________________________________________________
_____________________________________________________________________________________
_____________________________________________________________________________________
_____________________________________________________________________________________
_____________________________________________________________________________________
_____________________________________________________________________________________
_____________________________________________________________________________________
_____________________________________________________________________________________
_____________________________________________________________________________________
_____________________________________________________________________________________
48 Pearson Edexcel Level 3 Advanced Subsidiary GCE in Statistics – Sample Assessment Materials Issue 1 – September 2017 © Pearson Education Limited 2017

10
*S59173A01024*
D
O N
OT W
RITE IN TH
IS AREA
D
O N
OT W
RITE IN TH
IS AREA
D
O N
OT W
RITE IN TH
IS AREA
D
O N
OT
WRI
TE IN
TH
IS A
REA
D
O N
OT
WRI
TE IN
TH
IS A
REA
D
O N
OT
WRI
TE IN
TH
IS A
REA
5 You work in a statistics department that has been asked by the Mayor of London’s office to put together a publication on unemployment.
You are responsible for producing a page based on the unemployment data shown in Figure 3.
Male FemaleLondon United Kingdom London United Kingdom
12 months ending Number Rate Number Rate Number Rate Number RateMar-09 164 900 7.3 1 126 300 6.7 139 000 7.6 797 200 5.5Jun-09 182 100 8.1 1 261 800 7.5 155 100 8.5 870 300 6.0Sep-09 186 100 8.2 1 377 900 8.2 164 800 9.0 917 200 6.3Dec-09 204 700 9.0 1 441 600 8.5 176 600 9.4 956 200 6.6Mar-10 210 100 9.2 1 490 300 8.8 178 000 9.5 970 400 6.7Jun-10 207 000 9.1 1 472 300 8.7 171 800 9.1 946 700 6.5Sep-10 210 700 9.2 1 455 600 8.6 169 500 9.0 947 700 6.5Dec-10 208 100 9.0 1 446 600 8.5 163 800 8.7 953 400 6.6Mar-11 204 000 8.8 1 423 500 8.4 168 800 8.9 968 200 6.7Jun-11 215 600 9.2 1 432 600 8.4 179 100 9.4 1 003 200 6.9Sep-11 222 000 9.5 1 455 700 8.6 183 900 9.6 1 036 300 7.1Dec-11 220 600 9.4 1 473 800 8.6 185 300 9.6 1 065 100 7.3Mar-12 225 100 9.5 1 487 100 8.7 187 800 9.7 1 082 600 7.4Jun-12 223 900 9.4 1 490 600 8.7 184 500 9.5 1 086 100 7.4Sep-12 214 300 8.9 1 453 400 8.5 184 600 9.5 1 081 300 7.3Dec-12 217 700 9.1 1 431 900 8.3 185 400 9.4 1 085 200 7.3Mar-13 221 100 9.1 1 420 700 8.3 183 100 9.2 1 092 100 7.3Jun-13 218 600 9.1 1 422 700 8.3 187 400 9.3 1 094 700 7.3Sep-13 215 400 8.9 1 424 900 8.2 184 500 9.1 1 083 600 7.2Dec-13 208 600 8.5 1 388 000 8.0 184 600 9.1 1 041 500 6.9Mar-14 195 300 8.0 1 327 000 7.7 182 700 9.0 999 900 6.7Jun-14 179 700 7.3 1 248 900 7.2 167 300 8.2 970 100 6.4Sep-14 173 500 7.0 1 186 400 6.8 157 100 7.6 927 600 6.1Dec-14 166 300 6.7 1 127 400 6.5 153 300 7.5 899 500 5.9Mar-15 164 100 6.5 1 068 800 6.1 144 000 7.0 875 700 5.8Jun-15 162 000 6.4 1 027 300 5.9 141 800 6.8 825 900 5.4Sep-15 157 700 6.3 983 100 5.6 138 100 6.6 800 600 5.3Dec-15 151 000 6.0 942 800 5.4 132 100 6.3 780 900 5.1Mar-16 145 000 5.7 925 000 5.3 137 600 6.4 773 000 5.0Jun-16 145 100 5.6 910 400 5.2 141 500 6.6 774 000 5.0Sep-16 140 900 5.4 899 400 5.1 142 300 6.6 745 800 4.8Dec-16 132 300 5.1 874 200 5.0 137 400 6.3 732 100 4.7
Source: London DatastoreFigure 3
Explain how you would process and present this data. In your answer, you must include: • a question to investigate • a brief description of how you would investigate this • descriptions of three different statistical diagrams to represent the data, where each diagram
should represent different aspects of the data. [You are not expected to draw these diagrams.] • a question to ask London Datastore in order to understand the data better.
(6)
11
*S59173A01124* Turn over
D
O N
OT W
RITE IN TH
IS AREA
D
O N
OT W
RITE IN TH
IS AREA
D
O N
OT W
RITE IN TH
IS AREA
D
O N
OT
WRI
TE IN
TH
IS A
REA
D
O N
OT
WRI
TE IN
TH
IS A
REA
D
O N
OT
WRI
TE IN
TH
IS A
REA
_____________________________________________________________________________________
_____________________________________________________________________________________
_____________________________________________________________________________________
_____________________________________________________________________________________
_____________________________________________________________________________________
_____________________________________________________________________________________
_____________________________________________________________________________________
_____________________________________________________________________________________
_____________________________________________________________________________________
_____________________________________________________________________________________
_____________________________________________________________________________________
_____________________________________________________________________________________
_____________________________________________________________________________________
_____________________________________________________________________________________
_____________________________________________________________________________________
_____________________________________________________________________________________
_____________________________________________________________________________________
_____________________________________________________________________________________
_____________________________________________________________________________________
_____________________________________________________________________________________
_____________________________________________________________________________________
_____________________________________________________________________________________
_____________________________________________________________________________________
_____________________________________________________________________________________
_____________________________________________________________________________________
_____________________________________________________________________________________
_____________________________________________________________________________________
_____________________________________________________________________________________
_____________________________________________________________________________________
_____________________________________________________________________________________
_____________________________________________________________________________________
_____________________________________________________________________________________
_____________________________________________________________________________________
_____________________________________________________________________________________
_____________________________________________________________________________________
_____________________________________________________________________________________
49Pearson Edexcel Level 3 Advanced Subsidiary GCE in Statistics – Sample Assessment Materials Issue 1 – September 2017 © Pearson Education Limited 2017
12
*S59173A01224*
D
O N
OT W
RITE IN TH
IS AREA
D
O N
OT W
RITE IN TH
IS AREA
D
O N
OT W
RITE IN TH
IS AREA
D
O N
OT
WRI
TE IN
TH
IS A
REA
D
O N
OT
WRI
TE IN
TH
IS A
REA
D
O N
OT
WRI
TE IN
TH
IS A
REA
_____________________________________________________________________________________
_____________________________________________________________________________________
_____________________________________________________________________________________
_____________________________________________________________________________________
_____________________________________________________________________________________
_____________________________________________________________________________________
_____________________________________________________________________________________
_____________________________________________________________________________________
_____________________________________________________________________________________
_____________________________________________________________________________________
_____________________________________________________________________________________
_____________________________________________________________________________________
_____________________________________________________________________________________
_____________________________________________________________________________________
_____________________________________________________________________________________
_____________________________________________________________________________________
_____________________________________________________________________________________
_____________________________________________________________________________________
_____________________________________________________________________________________
_____________________________________________________________________________________
_____________________________________________________________________________________
_____________________________________________________________________________________
_____________________________________________________________________________________
_____________________________________________________________________________________
_____________________________________________________________________________________
_____________________________________________________________________________________
_____________________________________________________________________________________
_____________________________________________________________________________________
_____________________________________________________________________________________
_____________________________________________________________________________________
_____________________________________________________________________________________
_____________________________________________________________________________________
_____________________________________________________________________________________
_____________________________________________________________________________________
_____________________________________________________________________________________
_____________________________________________________________________________________
13
*S59173A01324* Turn over
D
O N
OT W
RITE IN TH
IS AREA
D
O N
OT W
RITE IN TH
IS AREA
D
O N
OT W
RITE IN TH
IS AREA
D
O N
OT
WRI
TE IN
TH
IS A
REA
D
O N
OT
WRI
TE IN
TH
IS A
REA
D
O N
OT
WRI
TE IN
TH
IS A
REA
_____________________________________________________________________________________
_____________________________________________________________________________________
_____________________________________________________________________________________
_____________________________________________________________________________________
_____________________________________________________________________________________
_____________________________________________________________________________________
_____________________________________________________________________________________
_____________________________________________________________________________________
_____________________________________________________________________________________
_____________________________________________________________________________________
_____________________________________________________________________________________
_____________________________________________________________________________________
_____________________________________________________________________________________
_____________________________________________________________________________________
_____________________________________________________________________________________
_____________________________________________________________________________________
_____________________________________________________________________________________
_____________________________________________________________________________________
_____________________________________________________________________________________
_____________________________________________________________________________________
_____________________________________________________________________________________
_____________________________________________________________________________________
_____________________________________________________________________________________
_____________________________________________________________________________________
_____________________________________________________________________________________
_____________________________________________________________________________________
_____________________________________________________________________________________
_____________________________________________________________________________________
_____________________________________________________________________________________
_____________________________________________________________________________________
_____________________________________________________________________________________
_____________________________________________________________________________________
_____________________________________________________________________________________
_____________________________________________________________________________________
_____________________________________________________________________________________
(Total for Question 5 is 6 marks)
50 Pearson Edexcel Level 3 Advanced Subsidiary GCE in Statistics – Sample Assessment Materials Issue 1 – September 2017 © Pearson Education Limited 2017
12
*S59173A01224*
D
O N
OT W
RITE IN TH
IS AREA
D
O N
OT W
RITE IN TH
IS AREA
D
O N
OT W
RITE IN TH
IS AREA
D
O N
OT
WRI
TE IN
TH
IS A
REA
D
O N
OT
WRI
TE IN
TH
IS A
REA
D
O N
OT
WRI
TE IN
TH
IS A
REA
_____________________________________________________________________________________
_____________________________________________________________________________________
_____________________________________________________________________________________
_____________________________________________________________________________________
_____________________________________________________________________________________
_____________________________________________________________________________________
_____________________________________________________________________________________
_____________________________________________________________________________________
_____________________________________________________________________________________
_____________________________________________________________________________________
_____________________________________________________________________________________
_____________________________________________________________________________________
_____________________________________________________________________________________
_____________________________________________________________________________________
_____________________________________________________________________________________
_____________________________________________________________________________________
_____________________________________________________________________________________
_____________________________________________________________________________________
_____________________________________________________________________________________
_____________________________________________________________________________________
_____________________________________________________________________________________
_____________________________________________________________________________________
_____________________________________________________________________________________
_____________________________________________________________________________________
_____________________________________________________________________________________
_____________________________________________________________________________________
_____________________________________________________________________________________
_____________________________________________________________________________________
_____________________________________________________________________________________
_____________________________________________________________________________________
_____________________________________________________________________________________
_____________________________________________________________________________________
_____________________________________________________________________________________
_____________________________________________________________________________________
_____________________________________________________________________________________
_____________________________________________________________________________________
13
*S59173A01324* Turn over
D
O N
OT W
RITE IN TH
IS AREA
D
O N
OT W
RITE IN TH
IS AREA
D
O N
OT W
RITE IN TH
IS AREA
D
O N
OT
WRI
TE IN
TH
IS A
REA
D
O N
OT
WRI
TE IN
TH
IS A
REA
D
O N
OT
WRI
TE IN
TH
IS A
REA
_____________________________________________________________________________________
_____________________________________________________________________________________
_____________________________________________________________________________________
_____________________________________________________________________________________
_____________________________________________________________________________________
_____________________________________________________________________________________
_____________________________________________________________________________________
_____________________________________________________________________________________
_____________________________________________________________________________________
_____________________________________________________________________________________
_____________________________________________________________________________________
_____________________________________________________________________________________
_____________________________________________________________________________________
_____________________________________________________________________________________
_____________________________________________________________________________________
_____________________________________________________________________________________
_____________________________________________________________________________________
_____________________________________________________________________________________
_____________________________________________________________________________________
_____________________________________________________________________________________
_____________________________________________________________________________________
_____________________________________________________________________________________
_____________________________________________________________________________________
_____________________________________________________________________________________
_____________________________________________________________________________________
_____________________________________________________________________________________
_____________________________________________________________________________________
_____________________________________________________________________________________
_____________________________________________________________________________________
_____________________________________________________________________________________
_____________________________________________________________________________________
_____________________________________________________________________________________
_____________________________________________________________________________________
_____________________________________________________________________________________
_____________________________________________________________________________________
(Total for Question 5 is 6 marks)
51Pearson Edexcel Level 3 Advanced Subsidiary GCE in Statistics – Sample Assessment Materials Issue 1 – September 2017 © Pearson Education Limited 2017
14
*S59173A01424*
D
O N
OT W
RITE IN TH
IS AREA
D
O N
OT W
RITE IN TH
IS AREA
D
O N
OT W
RITE IN TH
IS AREA
D
O N
OT
WRI
TE IN
TH
IS A
REA
D
O N
OT
WRI
TE IN
TH
IS A
REA
D
O N
OT
WRI
TE IN
TH
IS A
REA
6 Jeremy works for a company that manufactures golf balls. The quality of these balls is such that 19.4 per cent have small imperfections on the surface.
A large golf club orders 5000 balls, which may be regarded as a random sample. The golf club needs to know the probability that more than 20 per cent will have
such imperfections.
Use an approximate distribution to estimate this probability.
NOTE: You will not receive any marks if you use the exact binomial distribution function on your calculator.
(5)
_____________________________________________________________________________________
_____________________________________________________________________________________
_____________________________________________________________________________________
_____________________________________________________________________________________
_____________________________________________________________________________________
_____________________________________________________________________________________
_____________________________________________________________________________________
_____________________________________________________________________________________
_____________________________________________________________________________________
_____________________________________________________________________________________
_____________________________________________________________________________________
_____________________________________________________________________________________
_____________________________________________________________________________________
_____________________________________________________________________________________
_____________________________________________________________________________________
_____________________________________________________________________________________
_____________________________________________________________________________________
_____________________________________________________________________________________
_____________________________________________________________________________________
_____________________________________________________________________________________
_____________________________________________________________________________________
_____________________________________________________________________________________
_____________________________________________________________________________________
_____________________________________________________________________________________
_____________________________________________________________________________________
_____________________________________________________________________________________
_____________________________________________________________________________________
(Total for Question 6 is 5 marks)
15
*S59173A01524* Turn over
D
O N
OT W
RITE IN TH
IS AREA
D
O N
OT W
RITE IN TH
IS AREA
D
O N
OT W
RITE IN TH
IS AREA
D
O N
OT
WRI
TE IN
TH
IS A
REA
D
O N
OT
WRI
TE IN
TH
IS A
REA
D
O N
OT
WRI
TE IN
TH
IS A
REA
7 An oil company that operates 10 offshore platforms wants to implement a programme to improve the fitness of its offshore platform workers.
As a first step, the company plans to administer a health and fitness test to a sample selected from all of its employees in order to assess current levels of fitness.
The company has a total of 9000 employees.
(a) Describe how random numbers could be used to select a systematic sample of 20 employees.
(2)
_____________________________________________________________________________________
_____________________________________________________________________________________
_____________________________________________________________________________________
_____________________________________________________________________________________
_____________________________________________________________________________________
_____________________________________________________________________________________
_____________________________________________________________________________________
_____________________________________________________________________________________
_____________________________________________________________________________________
_____________________________________________________________________________________
_____________________________________________________________________________________
_____________________________________________________________________________________
_____________________________________________________________________________________
_____________________________________________________________________________________
(b) Give a reason why this sampling method might not be representative of the company’s offshore platform workers.
(1)
_____________________________________________________________________________________
_____________________________________________________________________________________
_____________________________________________________________________________________
_____________________________________________________________________________________
_____________________________________________________________________________________
_____________________________________________________________________________________
_____________________________________________________________________________________
_____________________________________________________________________________________
_____________________________________________________________________________________
_____________________________________________________________________________________
_____________________________________________________________________________________
_____________________________________________________________________________________
52 Pearson Edexcel Level 3 Advanced Subsidiary GCE in Statistics – Sample Assessment Materials Issue 1 – September 2017 © Pearson Education Limited 2017
14
*S59173A01424*
D
O N
OT W
RITE IN TH
IS AREA
D
O N
OT W
RITE IN TH
IS AREA
D
O N
OT W
RITE IN TH
IS AREA
D
O N
OT
WRI
TE IN
TH
IS A
REA
D
O N
OT
WRI
TE IN
TH
IS A
REA
D
O N
OT
WRI
TE IN
TH
IS A
REA
6 Jeremy works for a company that manufactures golf balls. The quality of these balls is such that 19.4 per cent have small imperfections on the surface.
A large golf club orders 5000 balls, which may be regarded as a random sample. The golf club needs to know the probability that more than 20 per cent will have
such imperfections.
Use an approximate distribution to estimate this probability.
NOTE: You will not receive any marks if you use the exact binomial distribution function on your calculator.
(5)
_____________________________________________________________________________________
_____________________________________________________________________________________
_____________________________________________________________________________________
_____________________________________________________________________________________
_____________________________________________________________________________________
_____________________________________________________________________________________
_____________________________________________________________________________________
_____________________________________________________________________________________
_____________________________________________________________________________________
_____________________________________________________________________________________
_____________________________________________________________________________________
_____________________________________________________________________________________
_____________________________________________________________________________________
_____________________________________________________________________________________
_____________________________________________________________________________________
_____________________________________________________________________________________
_____________________________________________________________________________________
_____________________________________________________________________________________
_____________________________________________________________________________________
_____________________________________________________________________________________
_____________________________________________________________________________________
_____________________________________________________________________________________
_____________________________________________________________________________________
_____________________________________________________________________________________
_____________________________________________________________________________________
_____________________________________________________________________________________
_____________________________________________________________________________________
(Total for Question 6 is 5 marks)
15
*S59173A01524* Turn over
D
O N
OT W
RITE IN TH
IS AREA
D
O N
OT W
RITE IN TH
IS AREA
D
O N
OT W
RITE IN TH
IS AREA
D
O N
OT
WRI
TE IN
TH
IS A
REA
D
O N
OT
WRI
TE IN
TH
IS A
REA
D
O N
OT
WRI
TE IN
TH
IS A
REA
7 An oil company that operates 10 offshore platforms wants to implement a programme to improve the fitness of its offshore platform workers.
As a first step, the company plans to administer a health and fitness test to a sample selected from all of its employees in order to assess current levels of fitness.
The company has a total of 9000 employees.
(a) Describe how random numbers could be used to select a systematic sample of 20 employees.
(2)
_____________________________________________________________________________________
_____________________________________________________________________________________
_____________________________________________________________________________________
_____________________________________________________________________________________
_____________________________________________________________________________________
_____________________________________________________________________________________
_____________________________________________________________________________________
_____________________________________________________________________________________
_____________________________________________________________________________________
_____________________________________________________________________________________
_____________________________________________________________________________________
_____________________________________________________________________________________
_____________________________________________________________________________________
_____________________________________________________________________________________
(b) Give a reason why this sampling method might not be representative of the company’s offshore platform workers.
(1)
_____________________________________________________________________________________
_____________________________________________________________________________________
_____________________________________________________________________________________
_____________________________________________________________________________________
_____________________________________________________________________________________
_____________________________________________________________________________________
_____________________________________________________________________________________
_____________________________________________________________________________________
_____________________________________________________________________________________
_____________________________________________________________________________________
_____________________________________________________________________________________
_____________________________________________________________________________________
53Pearson Edexcel Level 3 Advanced Subsidiary GCE in Statistics – Sample Assessment Materials Issue 1 – September 2017 © Pearson Education Limited 2017
16
*S59173A01624*
D
O N
OT W
RITE IN TH
IS AREA
D
O N
OT W
RITE IN TH
IS AREA
D
O N
OT W
RITE IN TH
IS AREA
D
O N
OT
WRI
TE IN
TH
IS A
REA
D
O N
OT
WRI
TE IN
TH
IS A
REA
D
O N
OT
WRI
TE IN
TH
IS A
REA
It is decided that a simple random sample of 20 workers should be selected from a single offshore platform, Platform Alpha, which has 400 workers.
Each selected worker is tested for several measures of health and fitness.
A fitness expert recommends that VO2 max (maximum volume of oxygen) is the best single measure of general fitness.
The VO2 max measurements, x ml/kg/min, for the sample of 20 workers from Platform Alpha are given below.
37.9 38.6 38.8 32.2 39.4 44.5 31.5 42.2 48.6 35.4
39.7 33.4 41.3 34.4 37.3 37.4 32.6 36.0 39.4 35.1
This data produces the following summary statistics, correct to 3 significant figures.
x = 37.8 s = 4.29
It is suggested that VO2 max measurements are likely to be normally distributed.
(c) By considering x ± s and x ± 2s , comment on the suitability of a normal distribution as a model for VO2 max measurements.
(4)
_____________________________________________________________________________________
_____________________________________________________________________________________
_____________________________________________________________________________________
_____________________________________________________________________________________
_____________________________________________________________________________________
_____________________________________________________________________________________
_____________________________________________________________________________________
_____________________________________________________________________________________
_____________________________________________________________________________________
_____________________________________________________________________________________
_____________________________________________________________________________________
_____________________________________________________________________________________
_____________________________________________________________________________________
_____________________________________________________________________________________
_____________________________________________________________________________________
_____________________________________________________________________________________
_____________________________________________________________________________________
_____________________________________________________________________________________
_____________________________________________________________________________________
_____________________________________________________________________________________
_____________________________________________________________________________________
17
*S59173A01724*
D
O N
OT W
RITE IN TH
IS AREA
D
O N
OT W
RITE IN TH
IS AREA
D
O N
OT W
RITE IN TH
IS AREA
D
O N
OT
WRI
TE IN
TH
IS A
REA
D
O N
OT
WRI
TE IN
TH
IS A
REA
D
O N
OT
WRI
TE IN
TH
IS A
REA
Turn over
The fitness expert suggests that a healthy adult male should have a VO2 max level of at least 35 ml/kg/min.
(d) Using a normal distribution model, calculate an estimate of the proportion of workers on Platform Alpha who would be considered as ‘healthy’ using the information given by the expert.
(2)
_____________________________________________________________________________________
_____________________________________________________________________________________
_____________________________________________________________________________________
_____________________________________________________________________________________
_____________________________________________________________________________________
_____________________________________________________________________________________
_____________________________________________________________________________________
_____________________________________________________________________________________
_____________________________________________________________________________________
_____________________________________________________________________________________
_____________________________________________________________________________________
_____________________________________________________________________________________
_____________________________________________________________________________________
_____________________________________________________________________________________
_____________________________________________________________________________________
_____________________________________________________________________________________
_____________________________________________________________________________________
_____________________________________________________________________________________
_____________________________________________________________________________________
_____________________________________________________________________________________
_____________________________________________________________________________________
_____________________________________________________________________________________
_____________________________________________________________________________________
_____________________________________________________________________________________
_____________________________________________________________________________________
_____________________________________________________________________________________
_____________________________________________________________________________________
_____________________________________________________________________________________
_____________________________________________________________________________________
_____________________________________________________________________________________
_____________________________________________________________________________________
54 Pearson Edexcel Level 3 Advanced Subsidiary GCE in Statistics – Sample Assessment Materials Issue 1 – September 2017 © Pearson Education Limited 2017
16
*S59173A01624*
D
O N
OT W
RITE IN TH
IS AREA
D
O N
OT W
RITE IN TH
IS AREA
D
O N
OT W
RITE IN TH
IS AREA
D
O N
OT
WRI
TE IN
TH
IS A
REA
D
O N
OT
WRI
TE IN
TH
IS A
REA
D
O N
OT
WRI
TE IN
TH
IS A
REA
It is decided that a simple random sample of 20 workers should be selected from a single offshore platform, Platform Alpha, which has 400 workers.
Each selected worker is tested for several measures of health and fitness.
A fitness expert recommends that VO2 max (maximum volume of oxygen) is the best single measure of general fitness.
The VO2 max measurements, x ml/kg/min, for the sample of 20 workers from Platform Alpha are given below.
37.9 38.6 38.8 32.2 39.4 44.5 31.5 42.2 48.6 35.4
39.7 33.4 41.3 34.4 37.3 37.4 32.6 36.0 39.4 35.1
This data produces the following summary statistics, correct to 3 significant figures.
x = 37.8 s = 4.29
It is suggested that VO2 max measurements are likely to be normally distributed.
(c) By considering x ± s and x ± 2s , comment on the suitability of a normal distribution as a model for VO2 max measurements.
(4)
_____________________________________________________________________________________
_____________________________________________________________________________________
_____________________________________________________________________________________
_____________________________________________________________________________________
_____________________________________________________________________________________
_____________________________________________________________________________________
_____________________________________________________________________________________
_____________________________________________________________________________________
_____________________________________________________________________________________
_____________________________________________________________________________________
_____________________________________________________________________________________
_____________________________________________________________________________________
_____________________________________________________________________________________
_____________________________________________________________________________________
_____________________________________________________________________________________
_____________________________________________________________________________________
_____________________________________________________________________________________
_____________________________________________________________________________________
_____________________________________________________________________________________
_____________________________________________________________________________________
_____________________________________________________________________________________
17
*S59173A01724*
D
O N
OT W
RITE IN TH
IS AREA
D
O N
OT W
RITE IN TH
IS AREA
D
O N
OT W
RITE IN TH
IS AREA
D
O N
OT
WRI
TE IN
TH
IS A
REA
D
O N
OT
WRI
TE IN
TH
IS A
REA
D
O N
OT
WRI
TE IN
TH
IS A
REA
Turn over
The fitness expert suggests that a healthy adult male should have a VO2 max level of at least 35 ml/kg/min.
(d) Using a normal distribution model, calculate an estimate of the proportion of workers on Platform Alpha who would be considered as ‘healthy’ using the information given by the expert.
(2)
_____________________________________________________________________________________
_____________________________________________________________________________________
_____________________________________________________________________________________
_____________________________________________________________________________________
_____________________________________________________________________________________
_____________________________________________________________________________________
_____________________________________________________________________________________
_____________________________________________________________________________________
_____________________________________________________________________________________
_____________________________________________________________________________________
_____________________________________________________________________________________
_____________________________________________________________________________________
_____________________________________________________________________________________
_____________________________________________________________________________________
_____________________________________________________________________________________
_____________________________________________________________________________________
_____________________________________________________________________________________
_____________________________________________________________________________________
_____________________________________________________________________________________
_____________________________________________________________________________________
_____________________________________________________________________________________
_____________________________________________________________________________________
_____________________________________________________________________________________
_____________________________________________________________________________________
_____________________________________________________________________________________
_____________________________________________________________________________________
_____________________________________________________________________________________
_____________________________________________________________________________________
_____________________________________________________________________________________
_____________________________________________________________________________________
_____________________________________________________________________________________
55Pearson Edexcel Level 3 Advanced Subsidiary GCE in Statistics – Sample Assessment Materials Issue 1 – September 2017 © Pearson Education Limited 2017
18
*S59173A01824*
D
O N
OT W
RITE IN TH
IS AREA
D
O N
OT W
RITE IN TH
IS AREA
D
O N
OT W
RITE IN TH
IS AREA
D
O N
OT
WRI
TE IN
TH
IS A
REA
D
O N
OT
WRI
TE IN
TH
IS A
REA
D
O N
OT
WRI
TE IN
TH
IS A
REA
A simple random sample of 20 workers is then selected from each of the other nine offshore platforms owned by the company. Each of the selected workers has a VO2 max measurement taken.
This data is used to produce the following summary statistics for all 10 offshore platforms, correct to 3 s.f.
x = 35.7 s = 4.61
Assuming that the VO2 max measurements for employees on each platform are similarly distributed, the company calculates that it is 98.6% sure that the mean VO2 max measurement for all workers on all 10 platforms will lie in the ‘healthy’ range.
Using this result, the company concludes that the fitness programme will not be necessary.
(e) Give two reasons why this conclusion may not be valid.(2)
_____________________________________________________________________________________
_____________________________________________________________________________________
_____________________________________________________________________________________
_____________________________________________________________________________________
_____________________________________________________________________________________
_____________________________________________________________________________________
_____________________________________________________________________________________
_____________________________________________________________________________________
_____________________________________________________________________________________
_____________________________________________________________________________________
_____________________________________________________________________________________
_____________________________________________________________________________________
_____________________________________________________________________________________
_____________________________________________________________________________________
_____________________________________________________________________________________
_____________________________________________________________________________________
_____________________________________________________________________________________
_____________________________________________________________________________________
_____________________________________________________________________________________
_____________________________________________________________________________________
_____________________________________________________________________________________
_____________________________________________________________________________________
_____________________________________________________________________________________
_____________________________________________________________________________________
19
*S59173A01924*
D
O N
OT W
RITE IN TH
IS AREA
D
O N
OT W
RITE IN TH
IS AREA
D
O N
OT W
RITE IN TH
IS AREA
D
O N
OT
WRI
TE IN
TH
IS A
REA
D
O N
OT
WRI
TE IN
TH
IS A
REA
D
O N
OT
WRI
TE IN
TH
IS A
REA
(f) Excluding any points already covered in this question concerning the sampling process, the modelling process and the conclusions drawn, make two further criticisms of the company’s investigation into the health and fitness of its offshore platform workers.
Additionally, make one suggestion as to how you might improve the investigation.(3)
_____________________________________________________________________________________
_____________________________________________________________________________________
_____________________________________________________________________________________
_____________________________________________________________________________________
_____________________________________________________________________________________
_____________________________________________________________________________________
_____________________________________________________________________________________
_____________________________________________________________________________________
_____________________________________________________________________________________
_____________________________________________________________________________________
_____________________________________________________________________________________
_____________________________________________________________________________________
_____________________________________________________________________________________
_____________________________________________________________________________________
_____________________________________________________________________________________
_____________________________________________________________________________________
_____________________________________________________________________________________
_____________________________________________________________________________________
_____________________________________________________________________________________
_____________________________________________________________________________________
_____________________________________________________________________________________
_____________________________________________________________________________________
_____________________________________________________________________________________
_____________________________________________________________________________________
_____________________________________________________________________________________
_____________________________________________________________________________________
_____________________________________________________________________________________
_____________________________________________________________________________________
_____________________________________________________________________________________
_____________________________________________________________________________________
(Total for Question 7 is 14 marks)
Turn over 56 Pearson Edexcel Level 3 Advanced Subsidiary GCE in Statistics – Sample Assessment Materials
Issue 1 – September 2017 © Pearson Education Limited 2017
18
*S59173A01824*
D
O N
OT W
RITE IN TH
IS AREA
D
O N
OT W
RITE IN TH
IS AREA
D
O N
OT W
RITE IN TH
IS AREA
D
O N
OT
WRI
TE IN
TH
IS A
REA
D
O N
OT
WRI
TE IN
TH
IS A
REA
D
O N
OT
WRI
TE IN
TH
IS A
REA
A simple random sample of 20 workers is then selected from each of the other nine offshore platforms owned by the company. Each of the selected workers has a VO2 max measurement taken.
This data is used to produce the following summary statistics for all 10 offshore platforms, correct to 3 s.f.
x = 35.7 s = 4.61
Assuming that the VO2 max measurements for employees on each platform are similarly distributed, the company calculates that it is 98.6% sure that the mean VO2 max measurement for all workers on all 10 platforms will lie in the ‘healthy’ range.
Using this result, the company concludes that the fitness programme will not be necessary.
(e) Give two reasons why this conclusion may not be valid.(2)
_____________________________________________________________________________________
_____________________________________________________________________________________
_____________________________________________________________________________________
_____________________________________________________________________________________
_____________________________________________________________________________________
_____________________________________________________________________________________
_____________________________________________________________________________________
_____________________________________________________________________________________
_____________________________________________________________________________________
_____________________________________________________________________________________
_____________________________________________________________________________________
_____________________________________________________________________________________
_____________________________________________________________________________________
_____________________________________________________________________________________
_____________________________________________________________________________________
_____________________________________________________________________________________
_____________________________________________________________________________________
_____________________________________________________________________________________
_____________________________________________________________________________________
_____________________________________________________________________________________
_____________________________________________________________________________________
_____________________________________________________________________________________
_____________________________________________________________________________________
_____________________________________________________________________________________
19
*S59173A01924*
D
O N
OT W
RITE IN TH
IS AREA
D
O N
OT W
RITE IN TH
IS AREA
D
O N
OT W
RITE IN TH
IS AREA
D
O N
OT
WRI
TE IN
TH
IS A
REA
D
O N
OT
WRI
TE IN
TH
IS A
REA
D
O N
OT
WRI
TE IN
TH
IS A
REA
(f) Excluding any points already covered in this question concerning the sampling process, the modelling process and the conclusions drawn, make two further criticisms of the company’s investigation into the health and fitness of its offshore platform workers.
Additionally, make one suggestion as to how you might improve the investigation.(3)
_____________________________________________________________________________________
_____________________________________________________________________________________
_____________________________________________________________________________________
_____________________________________________________________________________________
_____________________________________________________________________________________
_____________________________________________________________________________________
_____________________________________________________________________________________
_____________________________________________________________________________________
_____________________________________________________________________________________
_____________________________________________________________________________________
_____________________________________________________________________________________
_____________________________________________________________________________________
_____________________________________________________________________________________
_____________________________________________________________________________________
_____________________________________________________________________________________
_____________________________________________________________________________________
_____________________________________________________________________________________
_____________________________________________________________________________________
_____________________________________________________________________________________
_____________________________________________________________________________________
_____________________________________________________________________________________
_____________________________________________________________________________________
_____________________________________________________________________________________
_____________________________________________________________________________________
_____________________________________________________________________________________
_____________________________________________________________________________________
_____________________________________________________________________________________
_____________________________________________________________________________________
_____________________________________________________________________________________
_____________________________________________________________________________________
(Total for Question 7 is 14 marks)
Turn over 57Pearson Edexcel Level 3 Advanced Subsidiary GCE in Statistics – Sample Assessment Materials
Issue 1 – September 2017 © Pearson Education Limited 2017
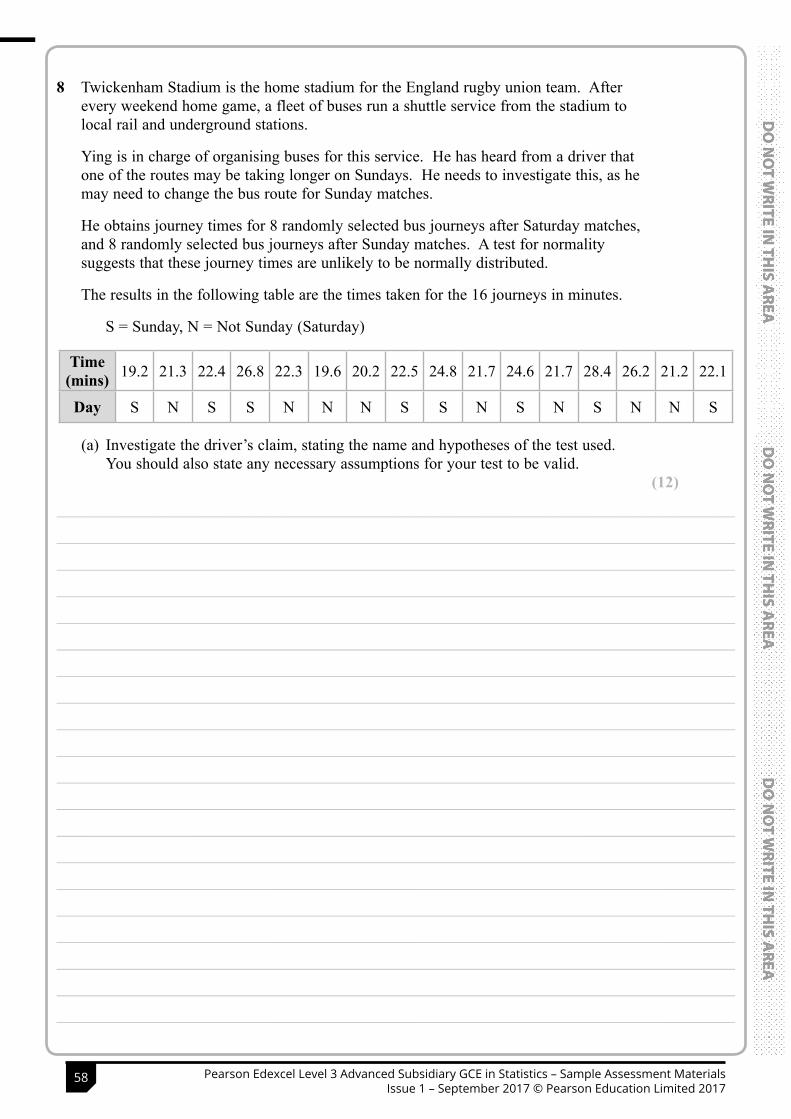
20
*S59173A02024*
D
O N
OT W
RITE IN TH
IS AREA
D
O N
OT W
RITE IN TH
IS AREA
D
O N
OT W
RITE IN TH
IS AREA
D
O N
OT
WRI
TE IN
TH
IS A
REA
D
O N
OT
WRI
TE IN
TH
IS A
REA
D
O N
OT
WRI
TE IN
TH
IS A
REA
8 Twickenham Stadium is the home stadium for the England rugby union team. After every weekend home game, a fleet of buses run a shuttle service from the stadium to local rail and underground stations.
Ying is in charge of organising buses for this service. He has heard from a driver that one of the routes may be taking longer on Sundays. He needs to investigate this, as he may need to change the bus route for Sunday matches.
He obtains journey times for 8 randomly selected bus journeys after Saturday matches, and 8 randomly selected bus journeys after Sunday matches. A test for normality suggests that these journey times are unlikely to be normally distributed.
The results in the following table are the times taken for the 16 journeys in minutes.
S = Sunday, N = Not Sunday (Saturday)
Time (mins) 19.2 21.3 22.4 26.8 22.3 19.6 20.2 22.5 24.8 21.7 24.6 21.7 28.4 26.2 21.2 22.1
Day S N S S N N N S S N S N S N N S
(a) Investigate the driver’s claim, stating the name and hypotheses of the test used. You should also state any necessary assumptions for your test to be valid.
(12)
_____________________________________________________________________________________
_____________________________________________________________________________________
_____________________________________________________________________________________
_____________________________________________________________________________________
_____________________________________________________________________________________
_____________________________________________________________________________________
_____________________________________________________________________________________
_____________________________________________________________________________________
_____________________________________________________________________________________
_____________________________________________________________________________________
_____________________________________________________________________________________
_____________________________________________________________________________________
_____________________________________________________________________________________
_____________________________________________________________________________________
_____________________________________________________________________________________
_____________________________________________________________________________________
_____________________________________________________________________________________
_____________________________________________________________________________________
_____________________________________________________________________________________
_____________________________________________________________________________________
21
*S59173A02124*
D
O N
OT W
RITE IN TH
IS AREA
D
O N
OT W
RITE IN TH
IS AREA
D
O N
OT W
RITE IN TH
IS AREA
D
O N
OT
WRI
TE IN
TH
IS A
REA
D
O N
OT
WRI
TE IN
TH
IS A
REA
D
O N
OT
WRI
TE IN
TH
IS A
REA
Turn over
_____________________________________________________________________________________
_____________________________________________________________________________________
_____________________________________________________________________________________
_____________________________________________________________________________________
_____________________________________________________________________________________
_____________________________________________________________________________________
_____________________________________________________________________________________
_____________________________________________________________________________________
_____________________________________________________________________________________
_____________________________________________________________________________________
_____________________________________________________________________________________
_____________________________________________________________________________________
_____________________________________________________________________________________
_____________________________________________________________________________________
_____________________________________________________________________________________
_____________________________________________________________________________________
_____________________________________________________________________________________
_____________________________________________________________________________________
_____________________________________________________________________________________
_____________________________________________________________________________________
_____________________________________________________________________________________
_____________________________________________________________________________________
_____________________________________________________________________________________
_____________________________________________________________________________________
_____________________________________________________________________________________
_____________________________________________________________________________________
_____________________________________________________________________________________
_____________________________________________________________________________________
_____________________________________________________________________________________
_____________________________________________________________________________________
_____________________________________________________________________________________
_____________________________________________________________________________________
_____________________________________________________________________________________
_____________________________________________________________________________________
_____________________________________________________________________________________
_____________________________________________________________________________________
58 Pearson Edexcel Level 3 Advanced Subsidiary GCE in Statistics – Sample Assessment Materials Issue 1 – September 2017 © Pearson Education Limited 2017
20
*S59173A02024*
D
O N
OT W
RITE IN TH
IS AREA
D
O N
OT W
RITE IN TH
IS AREA
D
O N
OT W
RITE IN TH
IS AREA
D
O N
OT
WRI
TE IN
TH
IS A
REA
D
O N
OT
WRI
TE IN
TH
IS A
REA
D
O N
OT
WRI
TE IN
TH
IS A
REA
8 Twickenham Stadium is the home stadium for the England rugby union team. After every weekend home game, a fleet of buses run a shuttle service from the stadium to local rail and underground stations.
Ying is in charge of organising buses for this service. He has heard from a driver that one of the routes may be taking longer on Sundays. He needs to investigate this, as he may need to change the bus route for Sunday matches.
He obtains journey times for 8 randomly selected bus journeys after Saturday matches, and 8 randomly selected bus journeys after Sunday matches. A test for normality suggests that these journey times are unlikely to be normally distributed.
The results in the following table are the times taken for the 16 journeys in minutes.
S = Sunday, N = Not Sunday (Saturday)
Time (mins) 19.2 21.3 22.4 26.8 22.3 19.6 20.2 22.5 24.8 21.7 24.6 21.7 28.4 26.2 21.2 22.1
Day S N S S N N N S S N S N S N N S
(a) Investigate the driver’s claim, stating the name and hypotheses of the test used. You should also state any necessary assumptions for your test to be valid.
(12)
_____________________________________________________________________________________
_____________________________________________________________________________________
_____________________________________________________________________________________
_____________________________________________________________________________________
_____________________________________________________________________________________
_____________________________________________________________________________________
_____________________________________________________________________________________
_____________________________________________________________________________________
_____________________________________________________________________________________
_____________________________________________________________________________________
_____________________________________________________________________________________
_____________________________________________________________________________________
_____________________________________________________________________________________
_____________________________________________________________________________________
_____________________________________________________________________________________
_____________________________________________________________________________________
_____________________________________________________________________________________
_____________________________________________________________________________________
_____________________________________________________________________________________
_____________________________________________________________________________________
21
*S59173A02124*
D
O N
OT W
RITE IN TH
IS AREA
D
O N
OT W
RITE IN TH
IS AREA
D
O N
OT W
RITE IN TH
IS AREA
D
O N
OT
WRI
TE IN
TH
IS A
REA
D
O N
OT
WRI
TE IN
TH
IS A
REA
D
O N
OT
WRI
TE IN
TH
IS A
REA
Turn over
_____________________________________________________________________________________
_____________________________________________________________________________________
_____________________________________________________________________________________
_____________________________________________________________________________________
_____________________________________________________________________________________
_____________________________________________________________________________________
_____________________________________________________________________________________
_____________________________________________________________________________________
_____________________________________________________________________________________
_____________________________________________________________________________________
_____________________________________________________________________________________
_____________________________________________________________________________________
_____________________________________________________________________________________
_____________________________________________________________________________________
_____________________________________________________________________________________
_____________________________________________________________________________________
_____________________________________________________________________________________
_____________________________________________________________________________________
_____________________________________________________________________________________
_____________________________________________________________________________________
_____________________________________________________________________________________
_____________________________________________________________________________________
_____________________________________________________________________________________
_____________________________________________________________________________________
_____________________________________________________________________________________
_____________________________________________________________________________________
_____________________________________________________________________________________
_____________________________________________________________________________________
_____________________________________________________________________________________
_____________________________________________________________________________________
_____________________________________________________________________________________
_____________________________________________________________________________________
_____________________________________________________________________________________
_____________________________________________________________________________________
_____________________________________________________________________________________
_____________________________________________________________________________________
59Pearson Edexcel Level 3 Advanced Subsidiary GCE in Statistics – Sample Assessment Materials Issue 1 – September 2017 © Pearson Education Limited 2017

22
*S59173A02224*
D
O N
OT W
RITE IN TH
IS AREA
D
O N
OT W
RITE IN TH
IS AREA
D
O N
OT W
RITE IN TH
IS AREA
D
O N
OT
WRI
TE IN
TH
IS A
REA
D
O N
OT
WRI
TE IN
TH
IS A
REA
D
O N
OT
WRI
TE IN
TH
IS A
REA
_____________________________________________________________________________________
_____________________________________________________________________________________
_____________________________________________________________________________________
_____________________________________________________________________________________
_____________________________________________________________________________________
_____________________________________________________________________________________
_____________________________________________________________________________________
_____________________________________________________________________________________
_____________________________________________________________________________________
_____________________________________________________________________________________
_____________________________________________________________________________________
_____________________________________________________________________________________
_____________________________________________________________________________________
_____________________________________________________________________________________
_____________________________________________________________________________________
_____________________________________________________________________________________
_____________________________________________________________________________________
_____________________________________________________________________________________
_____________________________________________________________________________________
_____________________________________________________________________________________
_____________________________________________________________________________________
_____________________________________________________________________________________
_____________________________________________________________________________________
_____________________________________________________________________________________
_____________________________________________________________________________________
_____________________________________________________________________________________
_____________________________________________________________________________________
_____________________________________________________________________________________
_____________________________________________________________________________________
_____________________________________________________________________________________
_____________________________________________________________________________________
_____________________________________________________________________________________
_____________________________________________________________________________________
_____________________________________________________________________________________
_____________________________________________________________________________________
_____________________________________________________________________________________
23
*S59173A02324*
D
O N
OT W
RITE IN TH
IS AREA
D
O N
OT W
RITE IN TH
IS AREA
D
O N
OT W
RITE IN TH
IS AREA
D
O N
OT
WRI
TE IN
TH
IS A
REA
D
O N
OT
WRI
TE IN
TH
IS A
REA
D
O N
OT
WRI
TE IN
TH
IS A
REA
(b) Explain why the analysis carried out in part (a) would be insufficient for making a decision on changing the bus route for Sunday matches in real life.
(1)
_____________________________________________________________________________________
_____________________________________________________________________________________
_____________________________________________________________________________________
_____________________________________________________________________________________
_____________________________________________________________________________________
_____________________________________________________________________________________
_____________________________________________________________________________________
_____________________________________________________________________________________
_____________________________________________________________________________________
_____________________________________________________________________________________
_____________________________________________________________________________________
_____________________________________________________________________________________
_____________________________________________________________________________________
_____________________________________________________________________________________
_____________________________________________________________________________________
_____________________________________________________________________________________
_____________________________________________________________________________________
_____________________________________________________________________________________
_____________________________________________________________________________________
_____________________________________________________________________________________
_____________________________________________________________________________________
_____________________________________________________________________________________
_____________________________________________________________________________________
_____________________________________________________________________________________
_____________________________________________________________________________________
_____________________________________________________________________________________
_____________________________________________________________________________________
_____________________________________________________________________________________
_____________________________________________________________________________________
_____________________________________________________________________________________
_____________________________________________________________________________________
(Total for Question 8 is 13 marks)
TOTAL FOR PAPER IS 60 MARKS
60 Pearson Edexcel Level 3 Advanced Subsidiary GCE in Statistics – Sample Assessment Materials Issue 1 – September 2017 © Pearson Education Limited 2017
22
*S59173A02224*
D
O N
OT W
RITE IN TH
IS AREA
D
O N
OT W
RITE IN TH
IS AREA
D
O N
OT W
RITE IN TH
IS AREA
D
O N
OT
WRI
TE IN
TH
IS A
REA
D
O N
OT
WRI
TE IN
TH
IS A
REA
D
O N
OT
WRI
TE IN
TH
IS A
REA
_____________________________________________________________________________________
_____________________________________________________________________________________
_____________________________________________________________________________________
_____________________________________________________________________________________
_____________________________________________________________________________________
_____________________________________________________________________________________
_____________________________________________________________________________________
_____________________________________________________________________________________
_____________________________________________________________________________________
_____________________________________________________________________________________
_____________________________________________________________________________________
_____________________________________________________________________________________
_____________________________________________________________________________________
_____________________________________________________________________________________
_____________________________________________________________________________________
_____________________________________________________________________________________
_____________________________________________________________________________________
_____________________________________________________________________________________
_____________________________________________________________________________________
_____________________________________________________________________________________
_____________________________________________________________________________________
_____________________________________________________________________________________
_____________________________________________________________________________________
_____________________________________________________________________________________
_____________________________________________________________________________________
_____________________________________________________________________________________
_____________________________________________________________________________________
_____________________________________________________________________________________
_____________________________________________________________________________________
_____________________________________________________________________________________
_____________________________________________________________________________________
_____________________________________________________________________________________
_____________________________________________________________________________________
_____________________________________________________________________________________
_____________________________________________________________________________________
_____________________________________________________________________________________
23
*S59173A02324*
D
O N
OT W
RITE IN TH
IS AREA
D
O N
OT W
RITE IN TH
IS AREA
D
O N
OT W
RITE IN TH
IS AREA
D
O N
OT
WRI
TE IN
TH
IS A
REA
D
O N
OT
WRI
TE IN
TH
IS A
REA
D
O N
OT
WRI
TE IN
TH
IS A
REA
(b) Explain why the analysis carried out in part (a) would be insufficient for making a decision on changing the bus route for Sunday matches in real life.
(1)
_____________________________________________________________________________________
_____________________________________________________________________________________
_____________________________________________________________________________________
_____________________________________________________________________________________
_____________________________________________________________________________________
_____________________________________________________________________________________
_____________________________________________________________________________________
_____________________________________________________________________________________
_____________________________________________________________________________________
_____________________________________________________________________________________
_____________________________________________________________________________________
_____________________________________________________________________________________
_____________________________________________________________________________________
_____________________________________________________________________________________
_____________________________________________________________________________________
_____________________________________________________________________________________
_____________________________________________________________________________________
_____________________________________________________________________________________
_____________________________________________________________________________________
_____________________________________________________________________________________
_____________________________________________________________________________________
_____________________________________________________________________________________
_____________________________________________________________________________________
_____________________________________________________________________________________
_____________________________________________________________________________________
_____________________________________________________________________________________
_____________________________________________________________________________________
_____________________________________________________________________________________
_____________________________________________________________________________________
_____________________________________________________________________________________
_____________________________________________________________________________________
(Total for Question 8 is 13 marks)
TOTAL FOR PAPER IS 60 MARKS
61Pearson Edexcel Level 3 Advanced Subsidiary GCE in Statistics – Sample Assessment Materials Issue 1 – September 2017 © Pearson Education Limited 2017
24
*S59173A02424*
D
O N
OT W
RITE IN TH
IS AREA
D
O N
OT W
RITE IN TH
IS AREA
D
O N
OT W
RITE IN TH
IS AREA
BLANK PAGE
62 Pearson Edexcel Level 3 Advanced Subsidiary GCE in Statistics – Sample Assessment Materials Issue 1 – September 2017 © Pearson Education Limited 2017
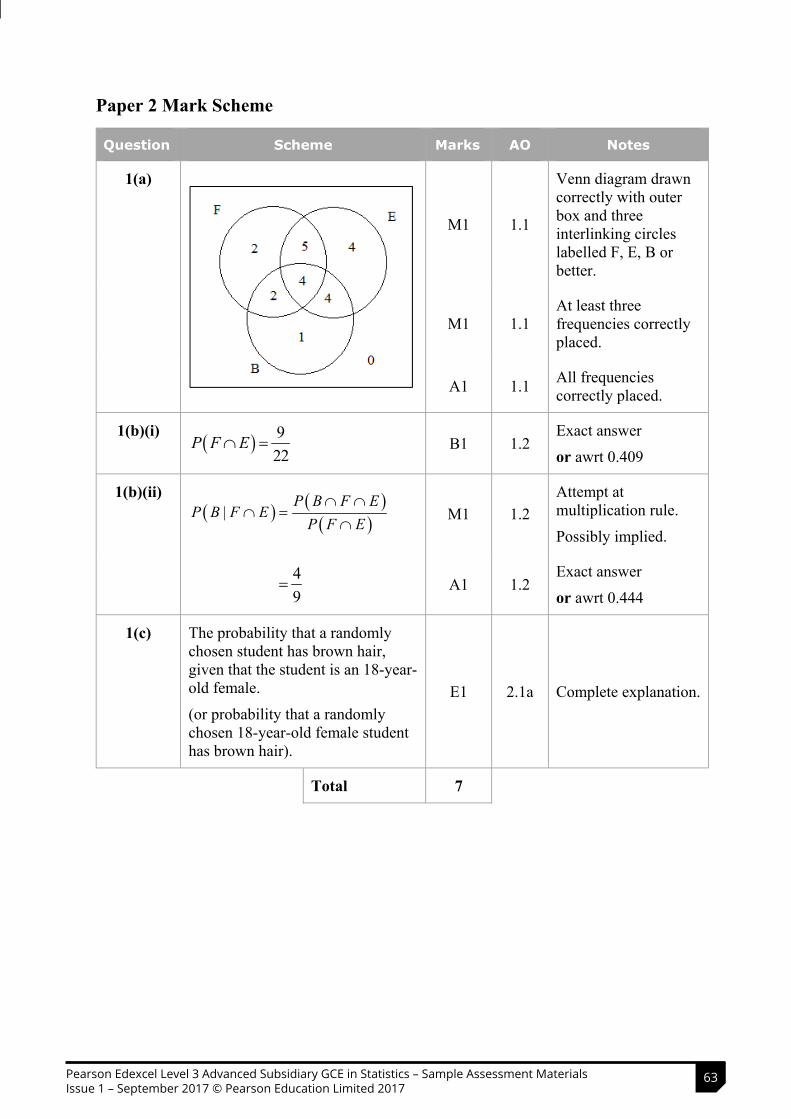
24
*S59173A02424*
D
O N
OT W
RITE IN TH
IS AREA
D
O N
OT W
RITE IN TH
IS AREA
D
O N
OT W
RITE IN TH
IS AREA
BLANK PAGE
Paper 2 Mark Scheme
Question Scheme Marks AO Notes
1(a)
M1 1.1
Venn diagram drawn correctly with outer box and three interlinking circles labelled F, E, B or better.
M1 1.1 At least three frequencies correctly placed.
A1 1.1 All frequencies correctly placed.
1(b)(i) 9
22P F E B1 1.2
Exact answer
or awrt 0.409
1(b)(ii)
|
P B F EP B F E
P F E
M1 1.2 Attempt at multiplication rule.
Possibly implied.
49
A1 1.2 Exact answer
or awrt 0.444
1(c) The probability that a randomly chosen student has brown hair, given that the student is an 18-year-old female.
(or probability that a randomly chosen 18-year-old female student has brown hair).
E1 2.1a Complete explanation.
Total 7
63Pearson Edexcel Level 3 Advanced Subsidiary GCE in Statistics – Sample Assessment Materials Issue 1 – September 2017 © Pearson Education Limited 2017
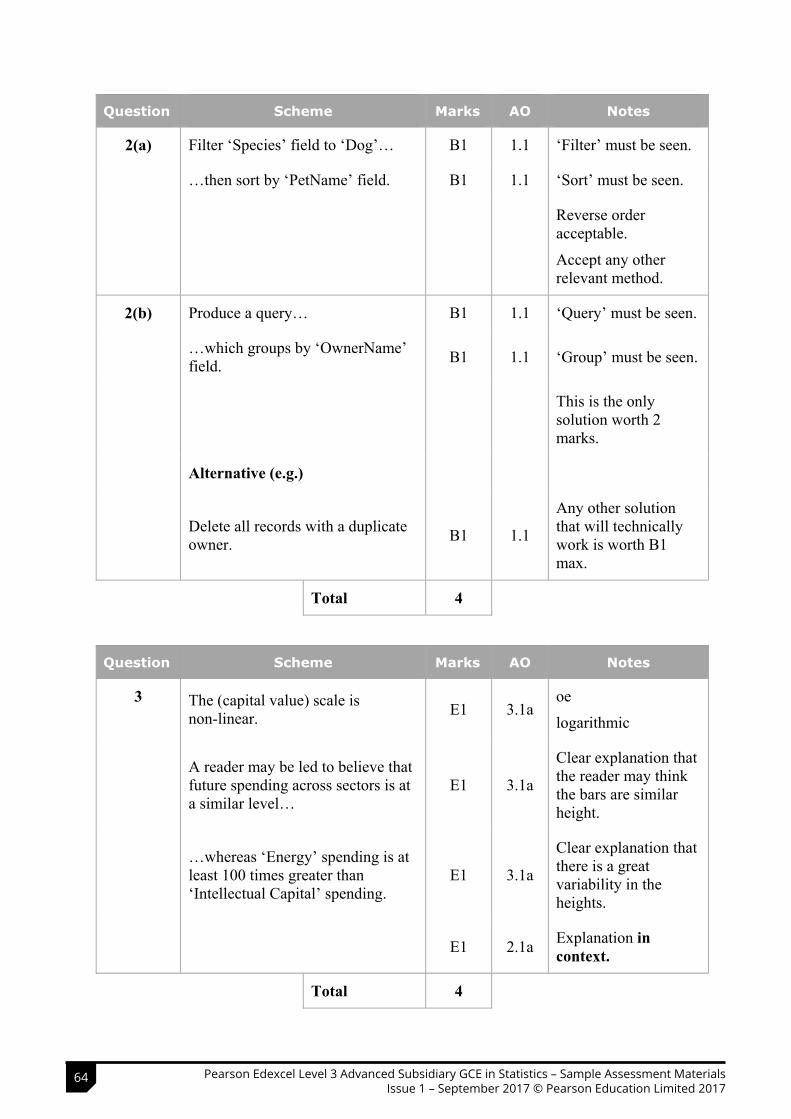
Question Scheme Marks AO Notes
2(a) Filter ‘Species’ field to ‘Dog’… B1 1.1 ‘Filter’ must be seen.
…then sort by ‘PetName’ field. B1 1.1 ‘Sort’ must be seen.
Reverse order acceptable.
Accept any other relevant method.
2(b) Produce a query… B1 1.1 ‘Query’ must be seen.
…which groups by ‘OwnerName’ field. B1 1.1 ‘Group’ must be seen.
This is the only solution worth 2 marks.
Alternative (e.g.)
Delete all records with a duplicate owner. B1 1.1
Any other solution that will technically work is worth B1 max.
Total 4
Question Scheme Marks AO Notes
3 The (capital value) scale is non-linear. E1 3.1a
oe
logarithmic
A reader may be led to believe that future spending across sectors is at a similar level…
E1 3.1a
Clear explanation that the reader may think the bars are similar height.
…whereas ‘Energy’ spending is at least 100 times greater than ‘Intellectual Capital’ spending.
E1 3.1a
Clear explanation that there is a great variability in the heights.
E1 2.1a Explanation incontext.
Total 4
64 Pearson Edexcel Level 3 Advanced Subsidiary GCE in Statistics – Sample Assessment Materials Issue 1 – September 2017 © Pearson Education Limited 2017
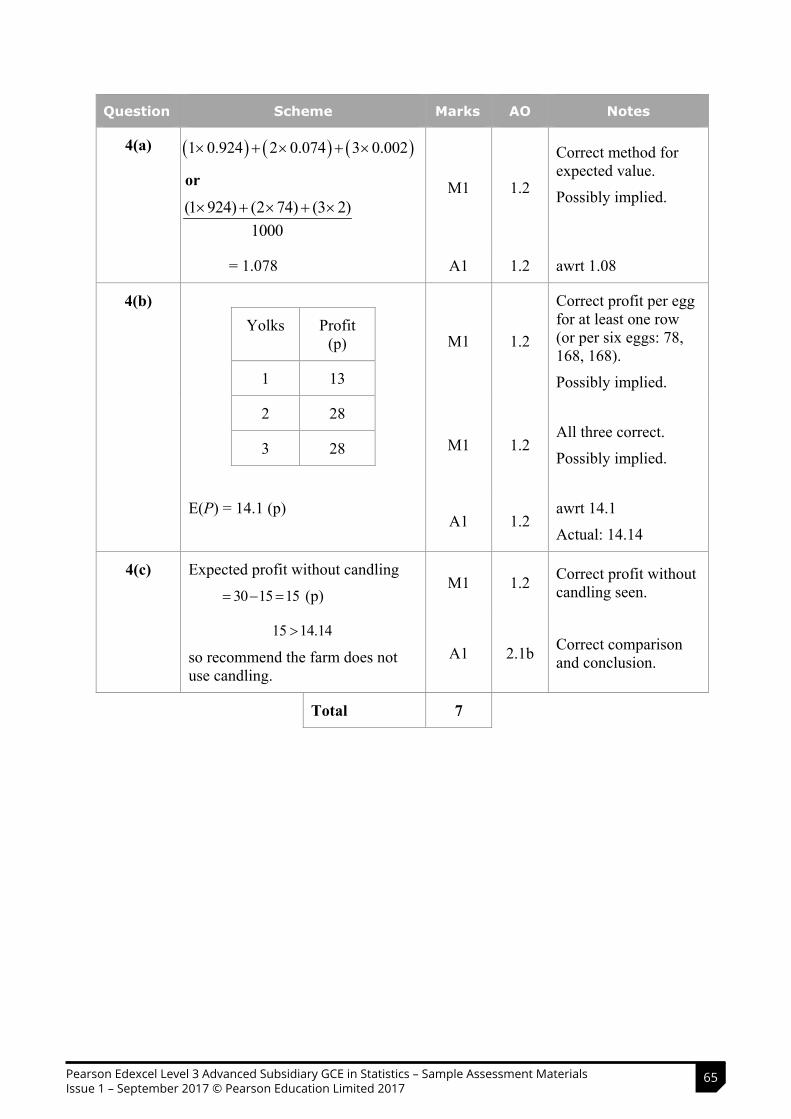
Question Scheme Marks AO Notes
4(a) 1 0.924 2 0.074 3 0.002
or
(1 924) (2 74) (3 2)1000
M1 1.2
Correct method for expected value.
Possibly implied.
= 1.078 A1 1.2 awrt 1.08
4(b)Yolks Profit
(p)
1 13
2 28
3 28
M1 1.2
Correct profit per egg for at least one row(or per six eggs: 78, 168, 168).
Possibly implied.
M1 1.2 All three correct.
Possibly implied.
E(P) = 14.1 (p) A1 1.2
awrt 14.1
Actual: 14.14
4(c) Expected profit without candling
30 15 15 (p) M1 1.2 Correct profit without
candling seen.
15 14.14
so recommend the farm does not use candling.
A1 2.1b Correct comparison and conclusion.
Total 7
65Pearson Edexcel Level 3 Advanced Subsidiary GCE in Statistics – Sample Assessment Materials Issue 1 – September 2017 © Pearson Education Limited 2017
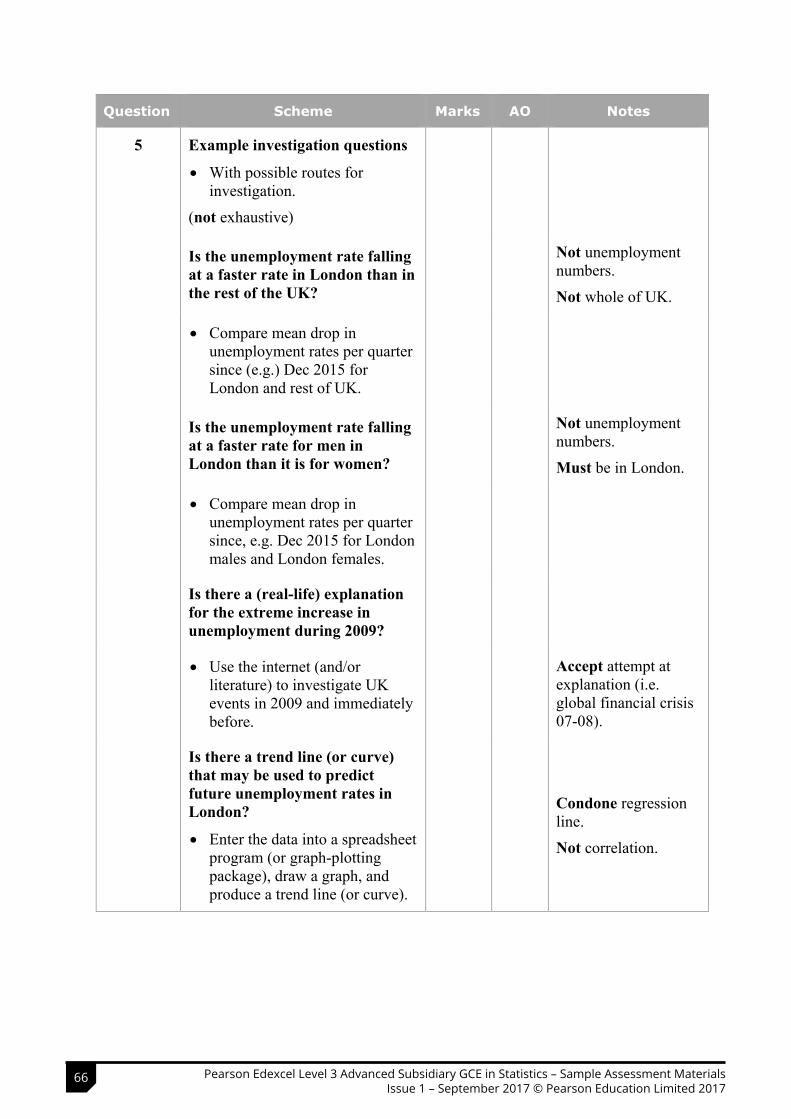
Question Scheme Marks AO Notes
5 Example investigation questions
With possible routes for investigation.
(not exhaustive)
Is the unemployment rate falling at a faster rate in London than in the rest of the UK?
Not unemployment numbers.
Not whole of UK.
Compare mean drop in unemployment rates per quarter since (e.g.) Dec 2015 for London and rest of UK.
Is the unemployment rate falling at a faster rate for men in London than it is for women?
Not unemployment numbers.
Must be in London.
Compare mean drop in unemployment rates per quarter since, e.g. Dec 2015 for London males and London females.
Is there a (real-life) explanation for the extreme increase in unemployment during 2009?
Use the internet (and/or literature) to investigate UK events in 2009 and immediately before.
Accept attempt at explanation (i.e. global financial crisis 07-08).
Is there a trend line (or curve) that may be used to predict future unemployment rates in London?
Enter the data into a spreadsheet program (or graph-plotting package), draw a graph, and produce a trend line (or curve).
Condone regression line.
Not correlation.
66 Pearson Edexcel Level 3 Advanced Subsidiary GCE in Statistics – Sample Assessment Materials Issue 1 – September 2017 © Pearson Education Limited 2017
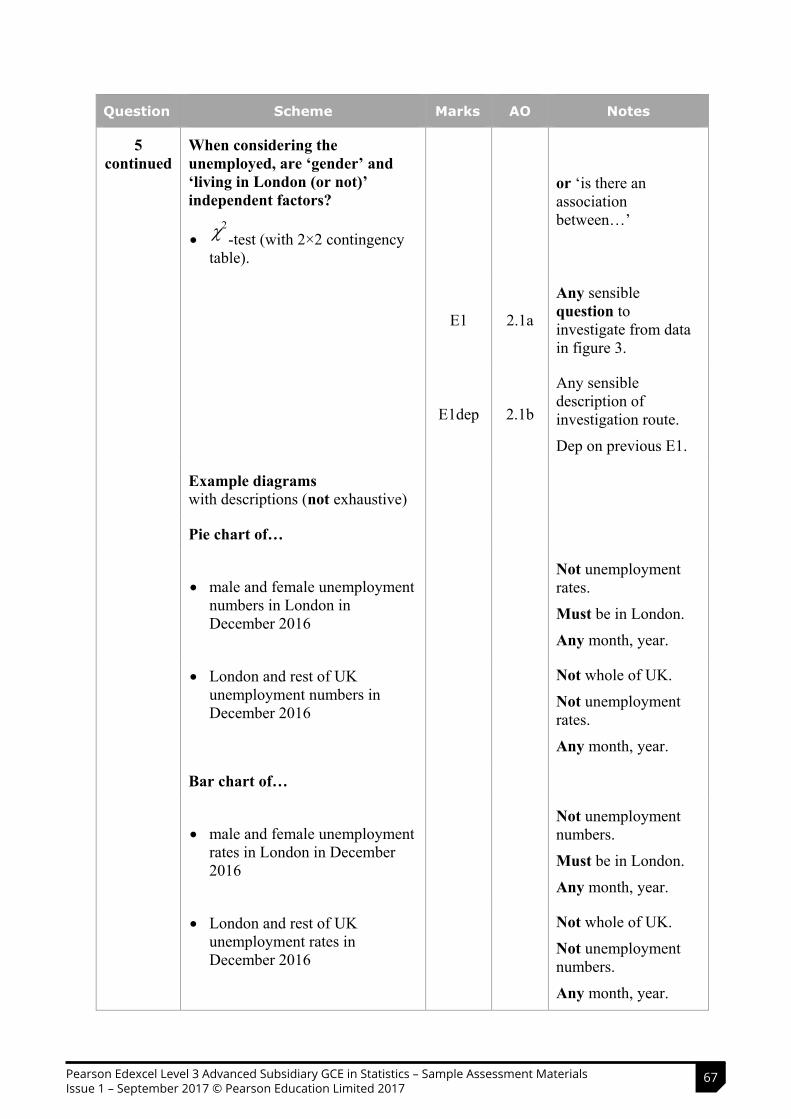
Question Scheme Marks AO Notes
5continued
When considering the unemployed, are ‘gender’ and ‘living in London (or not)’ independent factors?
2 -test (with 2×2 contingency
table).
or ‘is there an associationbetween…’
E1 2.1a
Any sensible question to investigate from data in figure 3.
E1dep 2.1b
Any sensible description of investigation route.
Dep on previous E1.
Example diagrams with descriptions (not exhaustive)
Pie chart of…
male and female unemployment numbers in London in December 2016
Not unemployment rates.
Must be in London.
Any month, year.
London and rest of UK unemployment numbers in December 2016
Not whole of UK.
Not unemployment rates.
Any month, year.
Bar chart of…
male and female unemployment rates in London in December 2016
Not unemployment numbers.
Must be in London.
Any month, year.
London and rest of UK unemployment rates in December 2016
Not whole of UK.
Not unemployment numbers.
Any month, year.
67Pearson Edexcel Level 3 Advanced Subsidiary GCE in Statistics – Sample Assessment Materials Issue 1 – September 2017 © Pearson Education Limited 2017
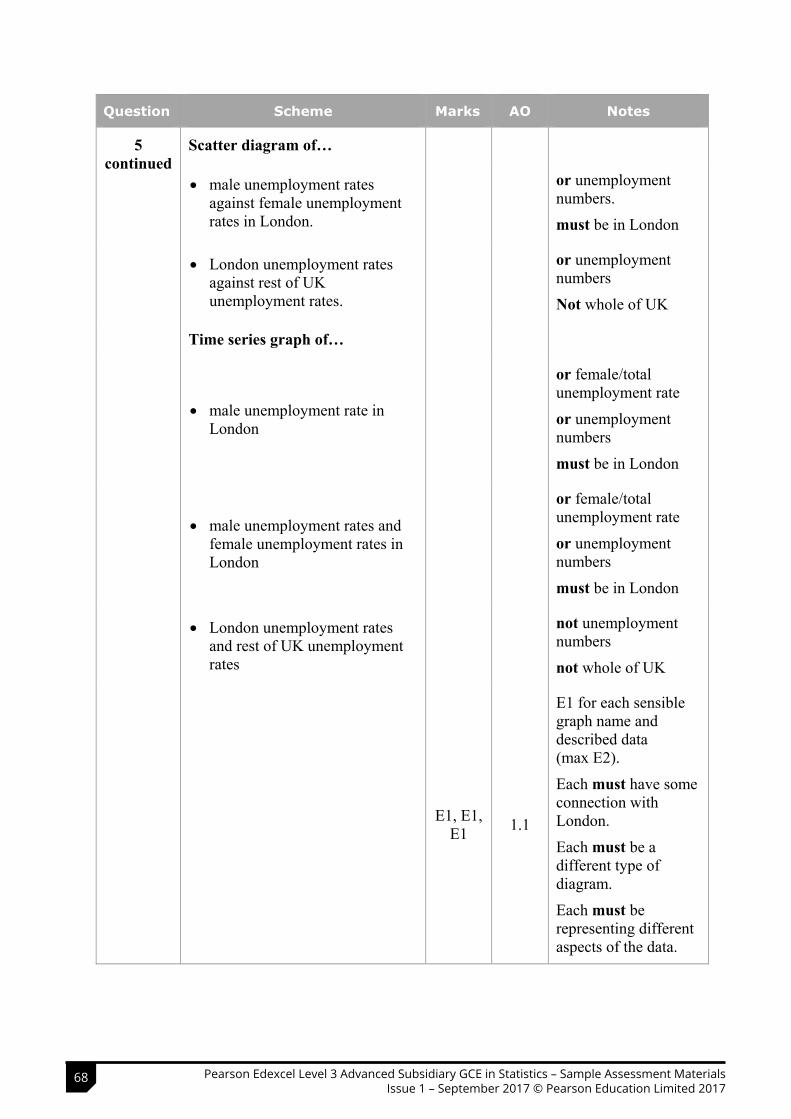
Question Scheme Marks AO Notes
5continued
Scatter diagram of…
male unemployment rates against female unemployment rates in London.
or unemployment numbers.
must be in London
London unemployment rates against rest of UK unemployment rates.
or unemployment numbers
Not whole of UK
Time series graph of…
male unemployment rate in London
or female/total unemployment rate
or unemployment numbers
must be in London
male unemployment rates and female unemployment rates in London
or female/total unemployment rate
or unemployment numbers
must be in London
London unemployment rates and rest of UK unemployment rates
not unemployment numbers
not whole of UK
E1, E1, E1 1.1
E1 for each sensible graph name and described data(max E2).
Each must have some connection with London.
Each must be a different type of diagram.
Each must be representing different aspects of the data.
68 Pearson Edexcel Level 3 Advanced Subsidiary GCE in Statistics – Sample Assessment Materials Issue 1 – September 2017 © Pearson Education Limited 2017
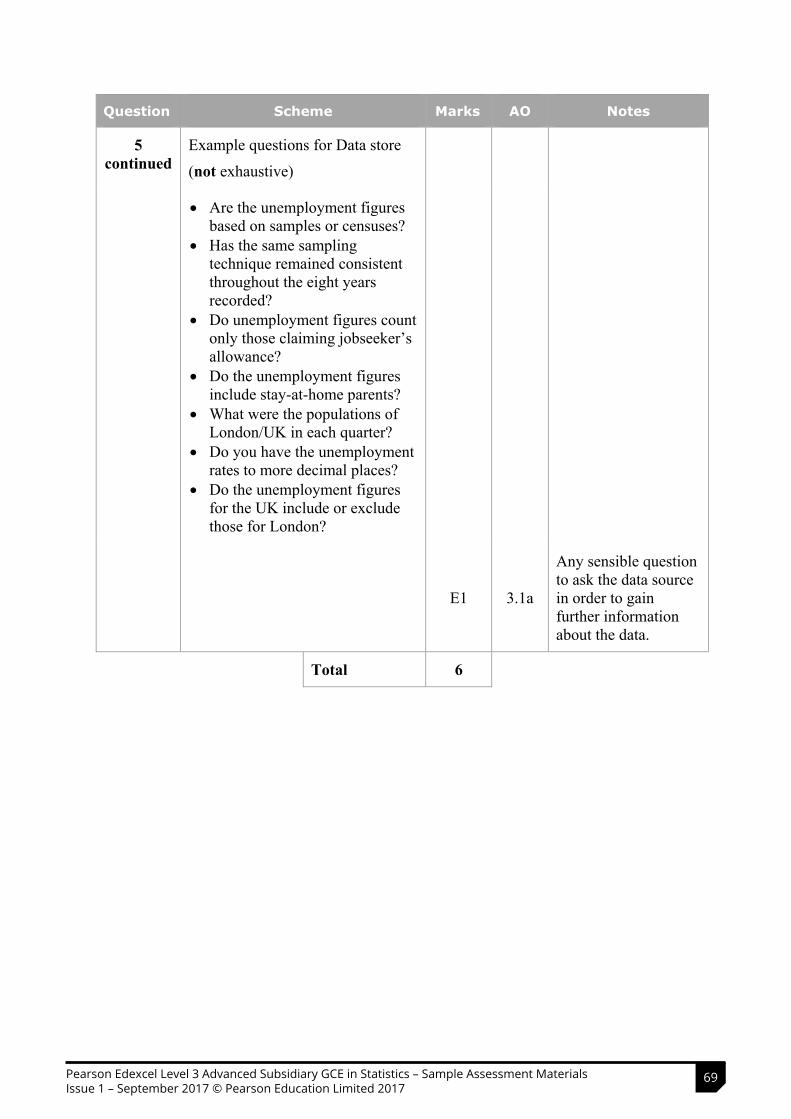
Question Scheme Marks AO Notes
5continued
Example questions for Data store
(not exhaustive)
Are the unemployment figures based on samples or censuses?
Has the same sampling technique remained consistent throughout the eight years recorded?
Do unemployment figures count only those claiming jobseeker’s allowance?
Do the unemployment figures include stay-at-home parents?
What were the populations of London/UK in each quarter?
Do you have the unemployment rates to more decimal places?
Do the unemployment figures for the UK include or exclude those for London?
E1 3.1a
Any sensible question to ask the data source in order to gain further information about the data.
Total 6
69Pearson Edexcel Level 3 Advanced Subsidiary GCE in Statistics – Sample Assessment Materials Issue 1 – September 2017 © Pearson Education Limited 2017
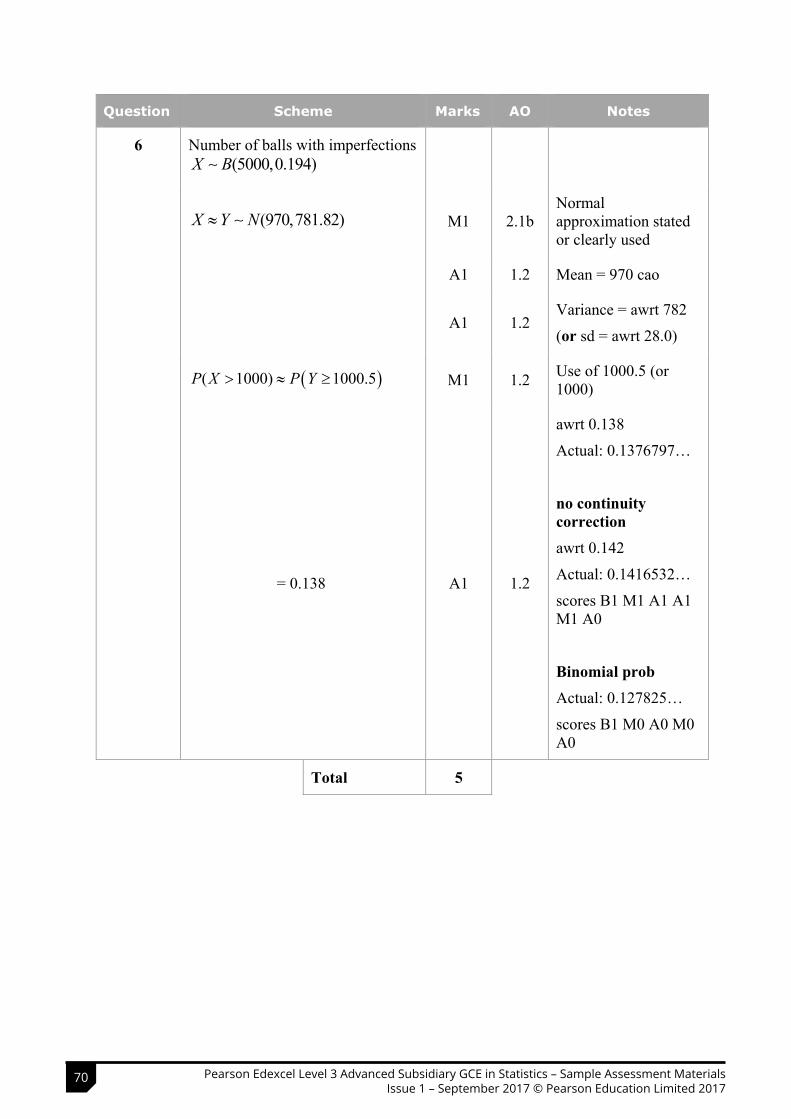
Question Scheme Marks AO Notes
6 Number of balls with imperfections (5000,0.194)X B
(970,781.82)X Y N M1 2.1b Normal approximation stated or clearly used
A1 1.2 Mean = 970 cao
A1 1.2 Variance = awrt 782
(or sd = awrt 28.0)
( 1000) 1000.5P X P Y M1 1.2 Use of 1000.5 (or 1000)
= 0.138 A1 1.2
awrt 0.138
Actual: 0.1376797…
no continuity correction awrt 0.142
Actual: 0.1416532…
scores B1 M1 A1 A1 M1 A0
Binomial probActual: 0.127825…
scores B1 M0 A0 M0 A0
Total 5
70 Pearson Edexcel Level 3 Advanced Subsidiary GCE in Statistics – Sample Assessment Materials Issue 1 – September 2017 © Pearson Education Limited 2017
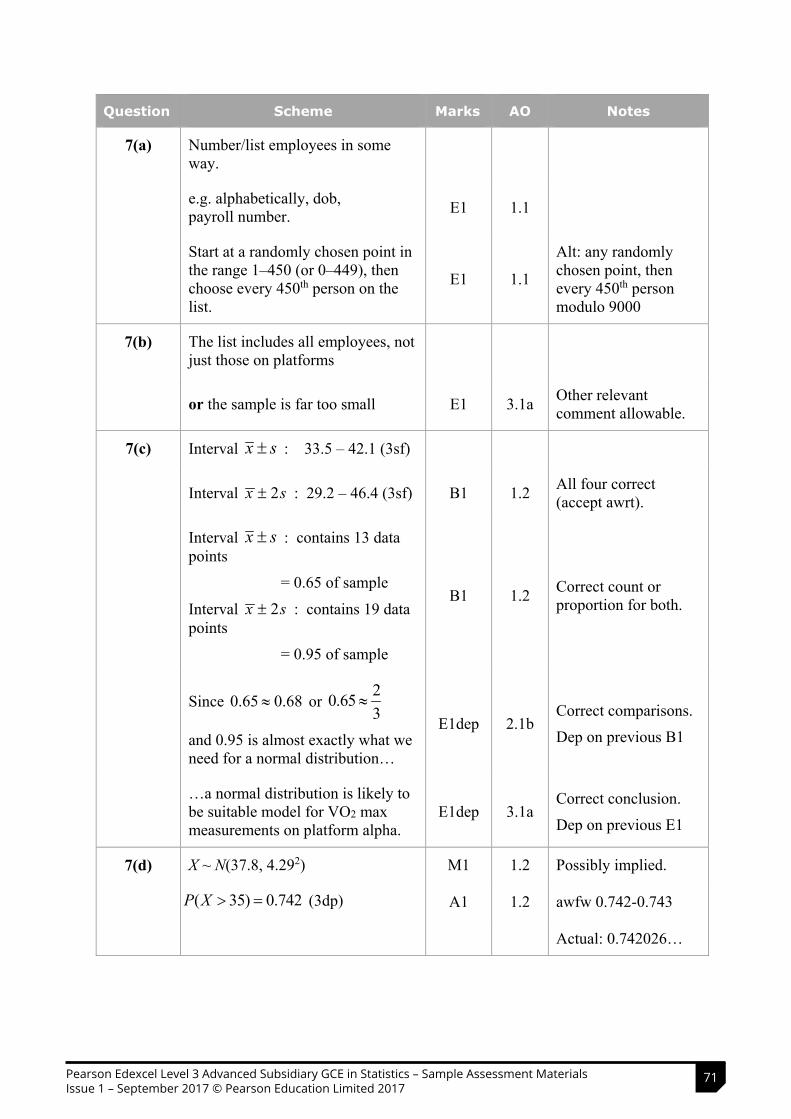
Question Scheme Marks AO Notes
7(a) Number/list employees in some way.
e.g. alphabetically, dob,payroll number. E1 1.1
Start at a randomly chosen point in the range 1–450 (or 0–449), then choose every 450th person on the list.
E1 1.1
Alt: any randomly chosen point, then every 450th person modulo 9000
7(b) The list includes all employees, not just those on platforms
or the sample is far too small E1 3.1a Other relevant comment allowable.
7(c) Interval x s : 33.5 – 42.1 (3sf)
Interval 2x s : 29.2 – 46.4 (3sf) B1 1.2 All four correct (accept awrt).
Interval x s : contains 13 data points
= 0.65 of sample
Interval 2x s : contains 19 data points
= 0.95 of sample
B1 1.2 Correct count or proportion for both.
Since 0.65 0.68 or 20.653
and 0.95 is almost exactly what we need for a normal distribution…
E1dep 2.1b Correct comparisons.
Dep on previous B1
…a normal distribution is likely to be suitable model for VO2 max measurements on platform alpha.
E1dep 3.1a Correct conclusion.
Dep on previous E1
7(d) X ~ N(37.8, 4.292) M1 1.2 Possibly implied.
( 35) 0.742 P X (3dp) A1 1.2 awfw 0.742-0.743
Actual: 0.742026…
71Pearson Edexcel Level 3 Advanced Subsidiary GCE in Statistics – Sample Assessment Materials Issue 1 – September 2017 © Pearson Education Limited 2017
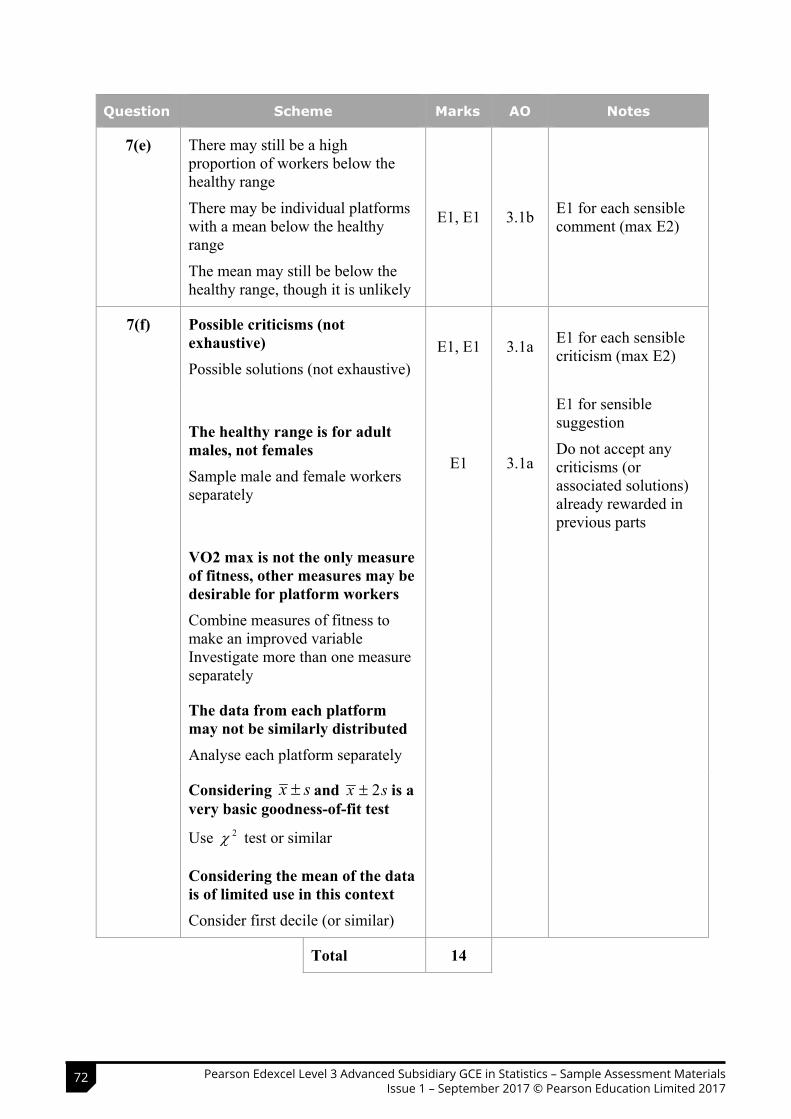
Question Scheme Marks AO Notes
7(e) There may still be a high proportion of workers below the healthy range
There may be individual platforms with a mean below the healthy range
The mean may still be below the healthy range, though it is unlikely
E1, E1 3.1b E1 for each sensible comment (max E2)
7(f) Possible criticisms (not exhaustive)Possible solutions (not exhaustive)
E1, E1 3.1a E1 for each sensible criticism (max E2)
The healthy range is for adult males, not females Sample male and female workers separately
E1 3.1a
E1 for sensible suggestion
Do not accept any criticisms (or associated solutions) already rewarded in previous parts
VO2 max is not the only measure of fitness, other measures may be desirable for platform workers Combine measures of fitness to make an improved variable Investigate more than one measure separately
The data from each platform may not be similarly distributed Analyse each platform separately
Considering x s and 2x s is a very basic goodness-of-fit test
Use 2 test or similar
Considering the mean of the data is of limited use in this context Consider first decile (or similar)
Total 14
72 Pearson Edexcel Level 3 Advanced Subsidiary GCE in Statistics – Sample Assessment Materials Issue 1 – September 2017 © Pearson Education Limited 2017
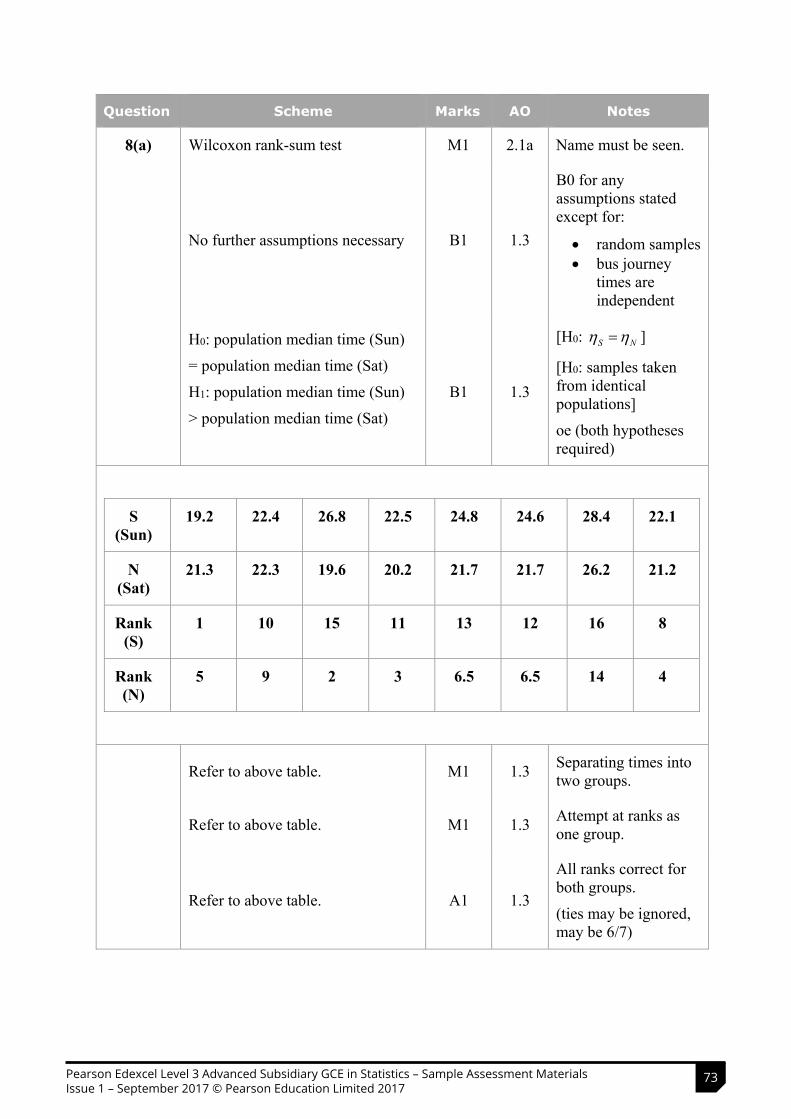
Question Scheme Marks AO Notes
8(a) Wilcoxon rank-sum test M1 2.1a Name must be seen.
No further assumptions necessary B1 1.3
B0 for any assumptions stated except for:
random samples bus journey
times are independent
H0: population median time (Sun)
= population median time (Sat)
H1: population median time (Sun)
> population median time (Sat)
B1 1.3
[H0: S N ]
[H0: samples taken from identical populations]
oe (both hypotheses required)
S(Sun)
19.2 22.4 26.8 22.5 24.8 24.6 28.4 22.1
N(Sat)
21.3 22.3 19.6 20.2 21.7 21.7 26.2 21.2
Rank (S)
1 10 15 11 13 12 16 8
Rank (N)
5 9 2 3 6.5 6.5 14 4
Refer to above table. M1 1.3 Separating times into two groups.
Refer to above table. M1 1.3 Attempt at ranks as one group.
Refer to above table. A1 1.3
All ranks correct for both groups.
(ties may be ignored, may be 6/7)
73Pearson Edexcel Level 3 Advanced Subsidiary GCE in Statistics – Sample Assessment Materials Issue 1 – September 2017 © Pearson Education Limited 2017
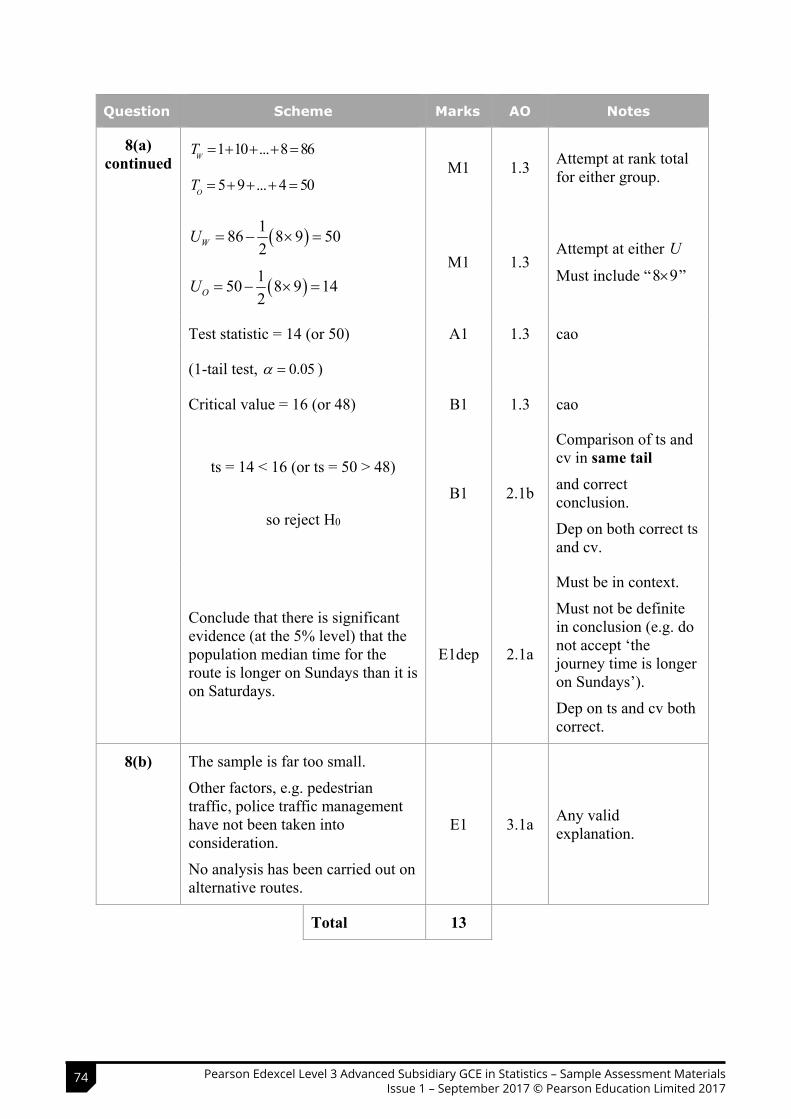
Question Scheme Marks AO Notes
8(a)continued
1 10 ... 8 86WT
5 9 ... 4 50OT M1 1.3 Attempt at rank total
for either group.
186 8 9 502WU
150 8 9 142OU
M1 1.3 Attempt at either U
Must include “8 9 ”
Test statistic = 14 (or 50) A1 1.3 cao
(1-tail test, 0.05 )
Critical value = 16 (or 48) B1 1.3 cao
ts = 14 < 16 (or ts = 50 > 48)
so reject H0
B1 2.1b
Comparison of ts and cv in same tail and correct conclusion.
Dep on both correct ts and cv.
Conclude that there is significantevidence (at the 5% level) that the population median time for the route is longer on Sundays than it is on Saturdays.
E1dep 2.1a
Must be in context.
Must not be definite in conclusion (e.g. do not accept ‘the journey time is longer on Sundays’).
Dep on ts and cv both correct.
8(b) The sample is far too small.
Other factors, e.g. pedestrian traffic, police traffic management have not been taken into consideration.
No analysis has been carried out on alternative routes.
E1 3.1a Any valid explanation.
Total 13
74 Pearson Edexcel Level 3 Advanced Subsidiary GCE in Statistics – Sample Assessment Materials Issue 1 – September 2017 © Pearson Education Limited 2017

75Pearson Edexcel Level 3 Advanced Subsidiary GCE in Statistics – Sample Assessment Materials Issue 1 – September 2017 © Pearson Education Limited 2017
For information about Edexcel, BTEC or LCCI qualifications visit qualifications.pearson.com
Edexcel is a registered trademark of Pearson Education Limited
Pearson Education Limited. Registered in England and Wales No. 872828 Registered Office: 80 Strand, London WC2R 0RL VAT Reg No GB 278 537121