Embed Size (px)
Citation preview
i
NORTHCENTRAL UNIVERSITY
AS THE PENDULUM SWINGS:
IMPACT OF INCLUSION ON ACADEMIC PERFORMANCE AND BEHAVIOR
REFERRALS
A Dissertation submitted to
The graduate faculty of the Department of Psychology
In candidacy for the degree of
DOCTOR OF PHILOSOPHY
By
Jeanne D. Upchurch
Prescott, Arizona
May 2007

i
ABSTRACT
As the Pendulum Swings:
Impact of Inclusion on Academic Performance and Behavioral Referrals
By
Jeanne D. Upchurch
Northcentral University
This dissertation summarizes an archival longitudinal study to examine the influence
inclusion practices have on academic achievement and behavioral referrals. This was a
twelve-year study (1993 – 2004) with three different phases (Pre-inclusion, Inclusion,
and Follow-up inclusion). Data was collected on academic achievement (TASS scores)
and behavior referrals (discipline counts) for 350 schools over the twelve year period.
Significant results show a decline in academics and an increase in behavioral referrals
associated with the number of special needs students in a general classroom.

ii
NORTHCENTRAL UNIVERSITY
APPROVAL
We, the undersigned, certify we have read this dissertation and approve it as
adequate in scope and quality for the degree of Doctor of Philosophy.
Candidate: __________________________________________________
Title of Dissertation: As the Pendulum Swings: Impact of Inclusion on Academic
Performance and Behavioral Referrals
Dissertation Committee:
____________________________________________ ________________
Richard R. Jones, Ph.D. Date
_____________________________________________ __________________
Robert E. Haussmann, Ph.D. Date
_____________________________________________ __________________
David Hugo Wigutoff, Ph.D. Date
_____________________________________________ __________________
Date
_____________________________________________ ___________________
Date

iii
CONTENTS
CHAPTER 1 ...................................................................................................................... 1
Introduction....................................................................................................................... 1
CHAPTER 1 ...................................................................................................................... 4
Statement of the Problem................................................................................................. 4
Definition of Key Terms ................................................................................................... 7
Brief Literature Review.................................................................................................... 8
Highlights and Limitations ............................................................................................ 10
Research Expectations.................................................................................................... 12
CHAPTER 2 .................................................................................................................... 14
Literature......................................................................................................................... 14
Case Studies..................................................................................................................... 14
Survey Studies ................................................................................................................. 15
Bibliographic Reviews .................................................................................................... 16
Experimental Studies...................................................................................................... 18
Summary.......................................................................................................................... 23
CHAPTER 3 .................................................................................................................... 25
Methodology .................................................................................................................... 25
Hypotheses ....................................................................................................................... 25
Longitudinal Design and Sampling Frame................................................................... 26
Access to Data.................................................................................................................. 28
The Inclusion Variable ................................................................................................... 29
Dependent Variables....................................................................................................... 30
Sources of Data................................................................................................................ 32

iv
Pilot Study........................................................................................................................ 32
Table 1.................................................................................................................. 35
Data Analysis................................................................................................................... 37
Table 2.................................................................................................................. 37
Ethical Issues ................................................................................................................... 38
CHAPTER 4 FINDINGS ............................................................................................... 40
Overview .......................................................................................................................... 40
Table 3.................................................................................................................. 42
Table 4.................................................................................................................. 42
Percentage Passing............................................................................................................ 43
Table 6.................................................................................................................. 44
Table 7.................................................................................................................. 46
Table8................................................................................................................... 46
Table 9.................................................................................................................. 47
Standardized Reading Scores............................................................................................ 48
Table 10................................................................................................................ 49
Table 11................................................................................................................ 50
Table 12................................................................................................................ 51
Table 13................................................................................................................ 51
Figure 2 ................................................................................................................ 52
Figure 3 ................................................................................................................ 53
Figure 4 ................................................................................................................ 54
Standardized Math Scores................................................................................................. 54
Table 14................................................................................................................ 54
Table 15................................................................................................................ 56
Table 16................................................................................................................ 57
Table 17................................................................................................................ 57
Figure 6 ................................................................................................................ 59
Discipline-count Ratios..................................................................................................... 60
Table 18................................................................................................................ 60

v
Table 19................................................................................................................ 62
Table 20................................................................................................................ 62
Table 21................................................................................................................ 63
Figure 10 .............................................................................................................. 66
Graduate-number Ratios ................................................................................................... 66
Table 22................................................................................................................ 66
Table 23................................................................................................................ 67
Figure 11 .............................................................................................................. 68
Dropout Ratios .................................................................................................................. 68
Table 24................................................................................................................ 68
Table 25................................................................................................................ 69
Academic Achievement and Behavior.............................................................................. 69
Table 26................................................................................................................ 70
Table 27................................................................................................................ 71
Other correlation findings ................................................................................................. 72
Table 29................................................................................................................ 72
Table 30................................................................................................................ 73
Table 31................................................................................................................ 73
CHAPTER 5 .................................................................................................................... 75
Summary.......................................................................................................................... 75
Conclusions...................................................................................................................... 78
Recommendations ........................................................................................................... 80
REFERENCES................................................................................................................ 82
1
Chapter 1
Introduction
Prior to the 1970’s many disabled children were educated outside the public
school system, and those who were in public schools were usually separated from
students without disabilities (Fisher, Frey, & Thousand, 2003). In 1975, the principle of
normalization, “making maximum use of the regular school system with minimum resort
to separate facilities” (Kisanji, 1999, p. 5) led to Public Law 94-142. This new law
introduced the concept of Least Restrictive Environment (LRE) (Fisher, Frey, &
Thousand), which emphasized the need to maximize integration of special-needs children
into the public school system and the regular classroom. LRE encouraged public schools
to offer more opportunities to the disabled child.
LRE soon gave rise to the “Regular Education Initiative” (REI) movement,
which questioned the special education system that had evolved (Manset & Semmel,
1997). REI proponents advocated creating an education system that taught to students’
individual differences while consolidating special-education programming. They argued
that regular classroom teachers must begin sharing the responsibility for children in the
lower ends of the continua of academic and social skills. In addition, they believed that if
the general education system were redesigned, it would no longer be necessary to label
students as disabled nor would there be a need for external programming, such as special
education. Following the REI movement Brown, Nietupski, and Hamre-Nietupski (1976)
introduced the Criterion of Ultimate Functioning. This principle suggested that teachers
were to provide age-appropriate activities in a natural environment.

2
In conjunction with the Criterion of Ultimate Functioning, Community-based
Instruction (CBI) encouraged educators to educate the disabled outside the special-
education classrooms (Falvey, 1986). Then came the Individuals with Disabilities Act
Amendments of 1997 (IDEA), which supported the concept of mainstreaming: educating
a student with special education needs in both special-education classrooms and in
regular classrooms. IDEA mandated that students with disabilities be placed in a least-
restricted environment and that all handicapped children be offered a free, appropriate
education. In response to the mainstreaming mandates, educators were providing services
to the special-needs students in pull-out programs (Daniel & King, 1997). In these
programs, students with special needs were removed from the regular classroom to
receive whatever additional individualized instruction they may need.
REI proponents continued to argue that pull-out programs were removing special-
needs students from their peers, a practice tantamount to segregation. In response came
Public Laws 99-457 (1986) and 101-476 (1990), which mandated that educators integrate
programming into the regular classroom for students with disabilities. This legislation
transformed mainstreaming into inclusion: educating a child with special education needs
full-time in the regular classroom. Inclusion was the result of the growth and evolution of
the special-education system over the previous two decades and of opposition to what it
had become.
“Despite the radical nature of these policy changes, which contained potential
dismantling special education programs altogether, there remained slim research for the
full inclusion of students with mild disabilities” (Manset and Semmel, 1997, p. 5).
Proponents of inclusion believed that inclusive programming is a moral issue that does
3
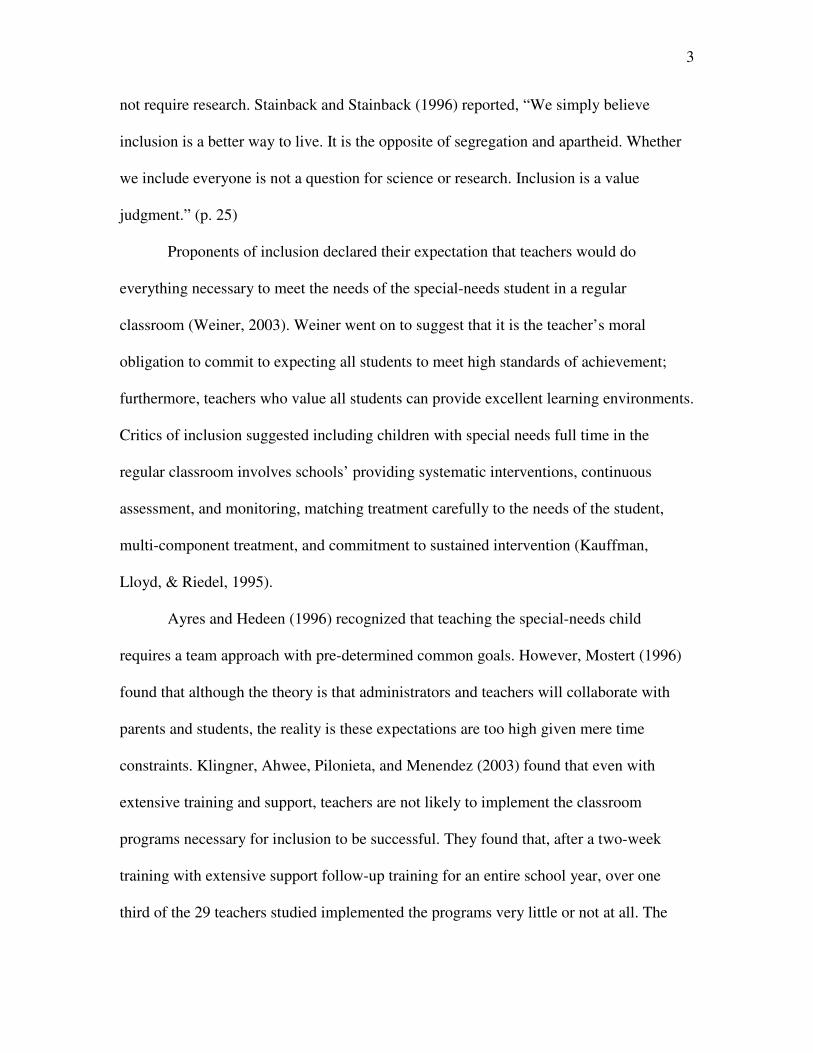
not require research. Stainback and Stainback (1996) reported, “We simply believe
inclusion is a better way to live. It is the opposite of segregation and apartheid. Whether
we include everyone is not a question for science or research. Inclusion is a value
judgment.” (p. 25)
Proponents of inclusion declared their expectation that teachers would do
everything necessary to meet the needs of the special-needs student in a regular
classroom (Weiner, 2003). Weiner went on to suggest that it is the teacher’s moral
obligation to commit to expecting all students to meet high standards of achievement;
furthermore, teachers who value all students can provide excellent learning environments.
Critics of inclusion suggested including children with special needs full time in the
regular classroom involves schools’ providing systematic interventions, continuous
assessment, and monitoring, matching treatment carefully to the needs of the student,
multi-component treatment, and commitment to sustained intervention (Kauffman,
Lloyd, & Riedel, 1995).
Ayres and Hedeen (1996) recognized that teaching the special-needs child
requires a team approach with pre-determined common goals. However, Mostert (1996)
found that although the theory is that administrators and teachers will collaborate with
parents and students, the reality is these expectations are too high given mere time
constraints. Klingner, Ahwee, Pilonieta, and Menendez (2003) found that even with
extensive training and support, teachers are not likely to implement the classroom
programs necessary for inclusion to be successful. They found that, after a two-week
training with extensive support follow-up training for an entire school year, over one
third of the 29 teachers studied implemented the programs very little or not at all. The
4
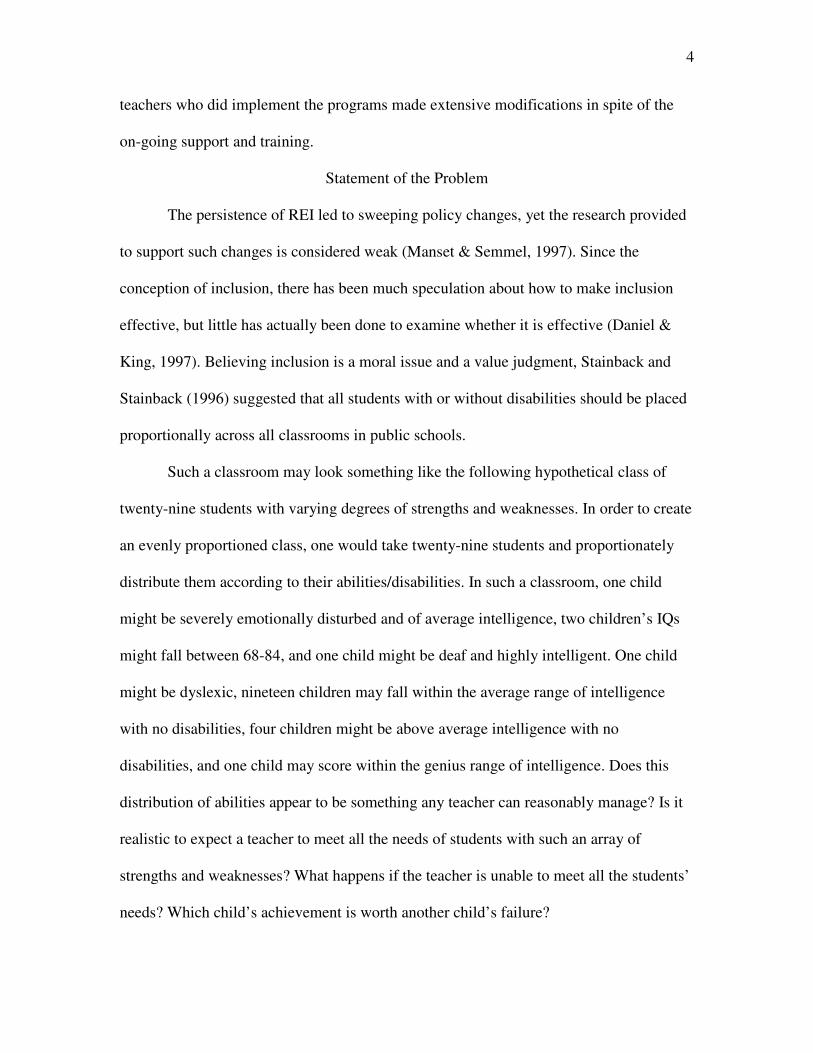
teachers who did implement the programs made extensive modifications in spite of the
on-going support and training.
Statement of the Problem
The persistence of REI led to sweeping policy changes, yet the research provided
to support such changes is considered weak (Manset & Semmel, 1997). Since the
conception of inclusion, there has been much speculation about how to make inclusion
effective, but little has actually been done to examine whether it is effective (Daniel &
King, 1997). Believing inclusion is a moral issue and a value judgment, Stainback and
Stainback (1996) suggested that all students with or without disabilities should be placed
proportionally across all classrooms in public schools.
Such a classroom may look something like the following hypothetical class of
twenty-nine students with varying degrees of strengths and weaknesses. In order to create
an evenly proportioned class, one would take twenty-nine students and proportionately
distribute them according to their abilities/disabilities. In such a classroom, one child
might be severely emotionally disturbed and of average intelligence, two children’s IQs
might fall between 68-84, and one child might be deaf and highly intelligent. One child
might be dyslexic, nineteen children may fall within the average range of intelligence
with no disabilities, four children might be above average intelligence with no
disabilities, and one child may score within the genius range of intelligence. Does this
distribution of abilities appear to be something any teacher can reasonably manage? Is it
realistic to expect a teacher to meet all the needs of students with such an array of
strengths and weaknesses? What happens if the teacher is unable to meet all the students’
needs? Which child’s achievement is worth another child’s failure?

5
Looking into the truly inclusive classroom may explain the unrealistic challenges
placed upon the teacher for just one hour. Let us say that the teacher asks all the students
to open their reading books. She chooses Susan, the dyslexic child, to read the first
paragraph. While Susan is struggling with the first sentence, Tommy, the severely
emotionally disturbed child, gets out of his seat and urinates in the corner. Mike, Cathy,
and Bobby (all of average intelligence) are snickering at Susan’s inability to read and
Frank (near genius) has fallen asleep out of boredom and is snoring so loudly that Betty
(below average intelligence) cannot hear the reader. All of this is being interpreted
through sign language for Sam because he is deaf. What has been taught in this hour, one
sixth of a school day? What has been learned? Who gets the teacher’s attention?
One hopes that the teacher would first address the child urinating in the corner
then ask the three children who are snickering to be quiet while gently prodding the
young man who has fallen asleep. Any attention-seeking child would quickly learn that to
get the teacher’s attention one must act out while others may just be grateful that they
were not chosen to read.
Given this harsh and extreme view of what is being asked of teachers, the
importance of putting the theory of inclusion to the test becomes apparent. Since the
Individuals with Disabilities Act Amendments of 1997, inclusion has been implemented
and much has been speculated about improving the practice of inclusion, yet the research
examining the impact of inclusion on grade performance and behavior has been limited
and has had mixed reviews (Daniel & King, 1997). It could be argued that the
implementation of inclusion was based on an emotional and moral argument with little
consideration for the actual reality of an inclusive classroom. The expectation that

6
teachers could rise above the challenges may have been naive. Ten years have passed
since the implementation of these educational standards and researchers have begun to
address the challenges provided in the inclusive classroom. Information about the impact
inclusion has on students is beginning to emerge, and it appears the time has come to
examine the actual effect of inclusion on student performance and behavior.
This study’s general hypothesis is that inclusion has a negative relationship to
satisfactory learning and a positive relationship to unsatisfactory acting-out behaviors.
These expectations are based on the assumption that if a teacher is spending much of his
or her time addressing diverse and severe learning disabilities, as well as behavioral
problems, then teaching and learning activity and effort will be lessened. In addition,
teachers may be unable to meet the variety of needs presented by both general and special
education students in inclusive classrooms. Students who do not understand what is being
taught or who need to be challenged more could become bored and frustrated,
exacerbating behavioral problems in the classroom. Tyler-Wood, Cereijo, and Pemberton
(2004) state, “… confronted with a curriculum that is above or below their instructional
needs, students may engage in a range of inappropriate behaviors …” (p. 30). They
suggest that offering sound instructional techniques in a structured classroom can lower
the number of behavioral referrals. However, offering consistent structure to a class
comprised of students with inconsistent needs may be frustrating to both teachers and
students.
Behavioral problems tend to increase with students whose frustration/boredom
levels are constantly increasing due to unmet needs. Tyler-Wood et al. (2004) state that
by definition, behaviorally challenged students need programs that include both academic

7
and nonacademic support. Childhood and early adolescence is partially defined by
emotional immaturity; therefore, a child faced with these emotional challenges cannot be
expected to deal with them effectively in every instance. Flannery and Lewis-Palmer
(2003) found that disruption, inappropriate language, harassment, theft, defiance, and
fighting are the major problem behaviors in schools today. A teacher cannot be expected
to address such acting-out behaviors efficiently, appropriately, and effectively because
children at different emotional levels respond differently to any given intervention
technique. If teachers are spending more time addressing problem behaviors than
teaching academics and students are not learning, then it is time to the effectiveness of
inclusion.
Definition of Key Terms
Least Restrictive Environment (LRE) – In 1975 Congress passed Public Law 94-
142 guaranteeing the educational right of individuals with disabilities to receive a free
appropriate public education. LRE is the right for a student to be educated to the
maximum extent appropriate with students who are not disabled.
Regular Education Initiative (REI) – LRE gave rise to this movement, which
questioned the special education system that had evolved. REI lead to sweeping policy
changes.
Special Education - This refers to the population served by programs for students
with disabilities. Assessment decisions for students in special education programs are
made by their Admission, Review, and Dismissal (ARD) committee.
8
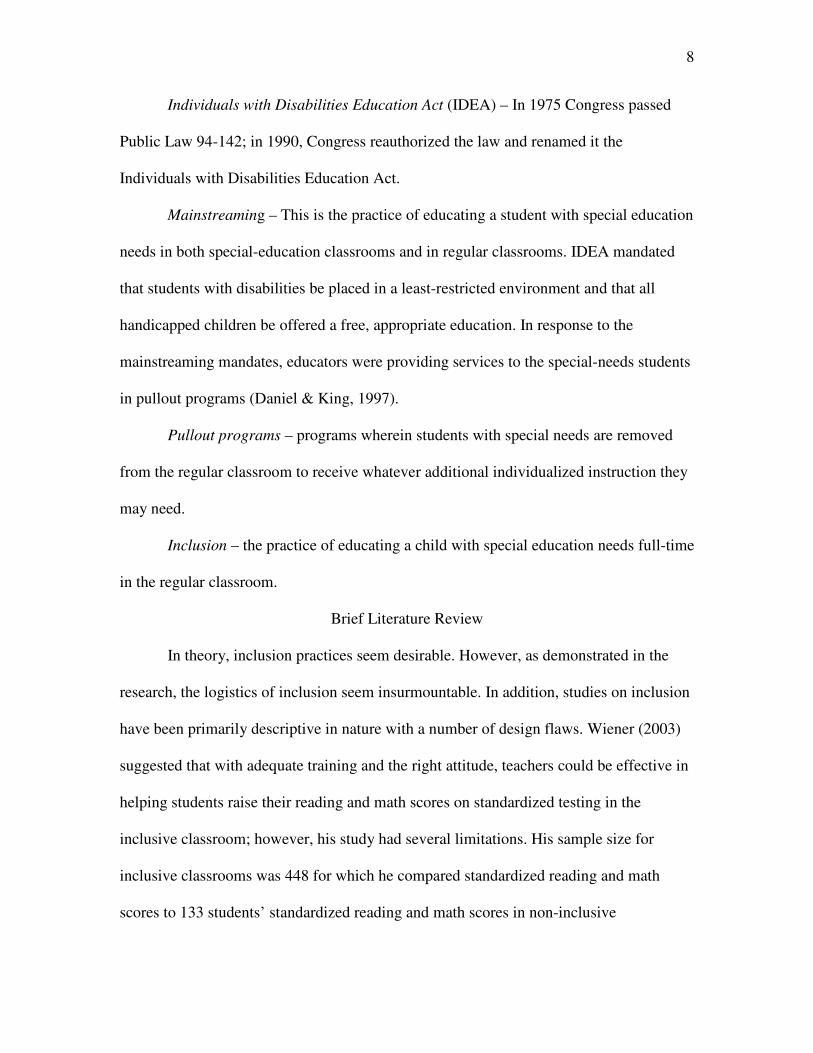
Individuals with Disabilities Education Act (IDEA) – In 1975 Congress passed
Public Law 94-142; in 1990, Congress reauthorized the law and renamed it the
Individuals with Disabilities Education Act.
Mainstreaming – This is the practice of educating a student with special education
needs in both special-education classrooms and in regular classrooms. IDEA mandated
that students with disabilities be placed in a least-restricted environment and that all
handicapped children be offered a free, appropriate education. In response to the
mainstreaming mandates, educators were providing services to the special-needs students
in pullout programs (Daniel & King, 1997).
Pullout programs – programs wherein students with special needs are removed
from the regular classroom to receive whatever additional individualized instruction they
may need.
Inclusion – the practice of educating a child with special education needs full-time
in the regular classroom.
Brief Literature Review
In theory, inclusion practices seem desirable. However, as demonstrated in the
research, the logistics of inclusion seem insurmountable. In addition, studies on inclusion
have been primarily descriptive in nature with a number of design flaws. Wiener (2003)
suggested that with adequate training and the right attitude, teachers could be effective in
helping students raise their reading and math scores on standardized testing in the
inclusive classroom; however, his study had several limitations. His sample size for
inclusive classrooms was 448 for which he compared standardized reading and math
scores to 133 students’ standardized reading and math scores in non-inclusive

9
classrooms. The difference in sample sizes would be enough to lead the trained reader to
question the results of his study. In addition, he did not clearly define the basis for which
students were placed in inclusive classrooms, therefore leaving room to question whether
the students’ abilities could be matched. He also used biased operational definitions,
defining Level I schools as having teachers who “assume little responsibility” (p. 13) and
Level III schools as employing teachers who were “dynamic, responsive, engaging, and
dedicated” (p. 14). Finally, the data he collected was predominately subjective and
obtained from only those teachers willing to be interviewed, which raises the question of
response bias.
Klingner et al. (2003) also used subjective data, but standardized the rating scale
to determine if two-week training with extensive follow-up support would improve the
implementation of inclusion practices. Using standardized data helped control for
response bias, yet their small sample size was a detriment when comparing different
levels of implementation of inclusion practices. In addition, many of what they defined as
“Low Implementation” (p. 414) teachers came from the same school, so they were unable
to determine if the results were related to the individual teacher’s teaching skills or if the
school had an overall bias to inclusion and was therefore not offering enough support to
the teachers.
Boudah, Schumacher, and Deshler (1997) studied whether using the Collaborative
Instructional Model would increase teachers’ instructional time, they found that teachers
continued to spend more time in non-instructional activities. McDonnell, Thorson,
Disher, Mathot-Buckner, Mendel, and Ray (2003) looked at the standardized scores of
students from five different schools that had a high level of commitment to inclusion.

10
They found that the scores for students with disabilities were higher than scores prior to
inclusion. Tapasak and Walther-Thomas (1999) looked at one school during the first year
of inclusion and had students rate themselves. They found that primary level students
rated themselves in a positive manner yet students in secondary schools rated themselves
in a negative manner. In addition, they found that secondary students with disabilities
averages were C’s and D’s. In their study, they looked at a school in the first year of
inclusion and therefore were not able to control for a learning curve among the faculty
implementing new programs. The McDonnell et al. (2003) study only looked at schools
that identified themselves as having a high level of commitment; therefore, these schools
had an abundance of support staff.
All of these studies employed small sample sizes. In addition, many of the studies
cited did not randomly select students or control for the variability of academic ability of
students selected. Finally, most of the studies looked at inclusion in elementary level
schools. In summary, the studies conducted on the effectiveness of inclusion suffer from
small and unmatched samples, lack of clarity about the way students were placed in
inclusive classrooms, the use of biased operational definitions or no definitions at all,
data obtained from subjective sources, and a scarcity of comparative samples.
Highlights and Limitations
The following study examined the impact of inclusion on standardized test scores
and behavioral referrals. The hypothesis was that inclusion has a negative relationship to
standardized scores and a positive relationship to inappropriate acting-out behaviors.
Simply stated, it was believed that inclusion leads to lower standardized test scores and
higher behavioral referrals. More specifically this study included 360 schools in a

11
southern state. The selection of these schools was based on the size and grade level of
each school.
Each student’s inclusion level was tracked for every school beginning in year
2002, the first year of reporting inclusion level via the database. Levels of inclusion were
broken down into tiers as defined by the state of Texas. These guidelines identify four
categories of inclusion that vary depending on the percentage of classroom hours a
special needs child spends outside the general classroom working on core curriculum.
The categories are:
• Level I < 21%,
• Level II 21-49%,
• Level III 50-59%, and
• Level IV > 59%.
Note that these categories mean that Level I is the highest level of inclusion (least
amount of time outside a general classroom) and Level IV is the lowest level of inclusion
(most amount of time outside a general classroom).
Standardized test scores and behavioral referrals for all students in each school
were used and were compared to determine the impact of inclusion over a twelve-year
period, including four years prior to inclusion and eight years after inclusion. Behavioral
acting-out was defined as a behavior significant enough to receive a referral, as defined
by the school and was determined by the number of referrals made for students in a
school year. Behavioral data was not reported until 1999; therefore, data obtained for this
variable begins in 1999. In addition to the standardized test scores and number of
behavioral referrals, data included student drop out rate, student graduation rate, teacher

12
population, and budget for each of the twelve years. These data were all available from
public records.
All of the students’ standardized test scores and behavioral referrals were tracked.
Practices of inclusion, as determined by the way a school determines placement of
special-needs students in the general classroom, were represented for each student from
the 360 schools. The current standardized test scores and number of referrals within each
of the 360 schools were compared to the standardized test scores and number of referrals
from the same schools for periods prior to inclusion implementation, during
implementation, and following full implementation of inclusion. Additional details of the
research methods and procedures are presented below in chapter three.
Research Expectations
In summary, the following study was retrospective in nature and used existing
data on academic achievement (AA) and behavioral referrals (BR) to examine the impact
of inclusion on these two dependent variables. The study was a archival longitudinal
project based on a twelve-year time span: 1993-2004. The focus was before, during, and
after the implementation of inclusion. Student AA scores were collected and examined
across the twelve years, comparing the averages before, during, and after the
implementation of inclusion. BR’s were collected in years 1999-2004, comparing the
averages during and after implementation of inclusion. School size and school grade
levels (primary and secondary schools were used) were the factors used for a stratified
random sample in this design and 30 schools for each factor were randomly selected from
the state, resulting in a total of 360 schools having been used. This study was unique to
13
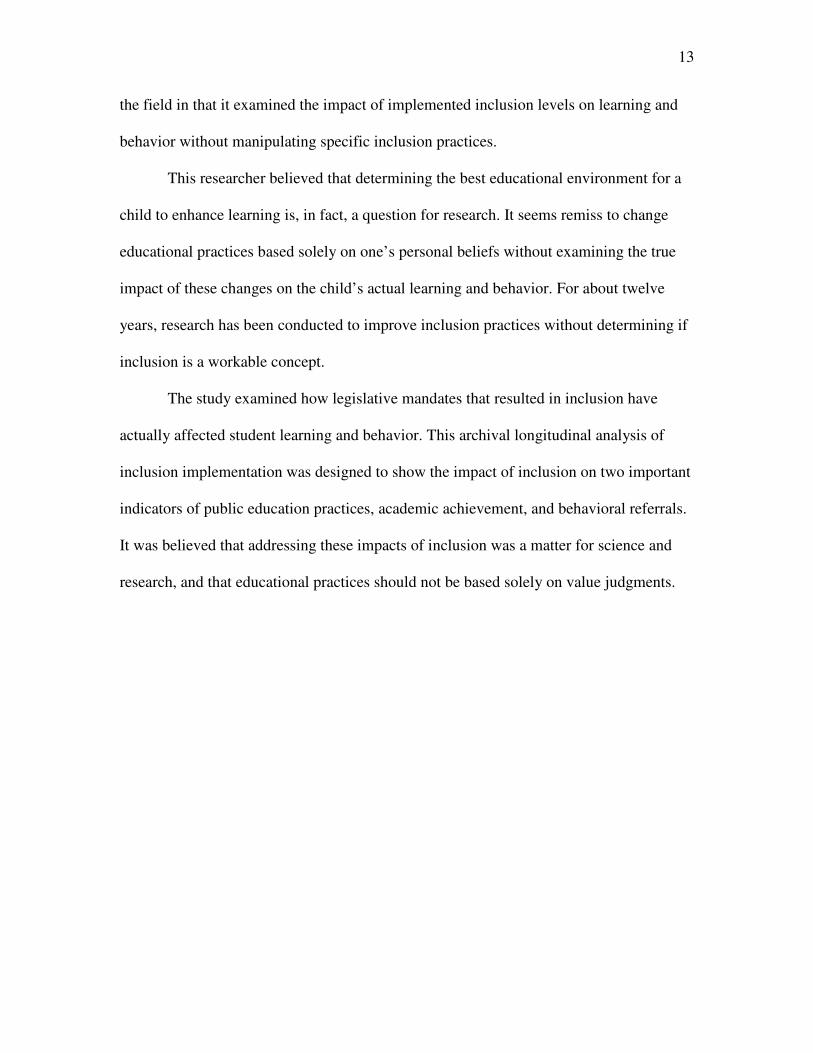
the field in that it examined the impact of implemented inclusion levels on learning and
behavior without manipulating specific inclusion practices.
This researcher believed that determining the best educational environment for a
child to enhance learning is, in fact, a question for research. It seems remiss to change
educational practices based solely on one’s personal beliefs without examining the true
impact of these changes on the child’s actual learning and behavior. For about twelve
years, research has been conducted to improve inclusion practices without determining if
inclusion is a workable concept.
The study examined how legislative mandates that resulted in inclusion have
actually affected student learning and behavior. This archival longitudinal analysis of
inclusion implementation was designed to show the impact of inclusion on two important
indicators of public education practices, academic achievement, and behavioral referrals.
It was believed that addressing these impacts of inclusion was a matter for science and
research, and that educational practices should not be based solely on value judgments.

14
Chapter 2
Review of the Literature
The literature on inclusion and its effectiveness includes different research
approaches to address issues about the impact of inclusion practices. Some researchers
provide information via case studies while others perform archival research. Other studies
use quasi-experimental designs, and some employ true experimental designs. The
experimental designs provide insight into the effectiveness of inclusion, although the
methodology used is often questionable. Nonetheless, all of these approaches offer a
useful stepping-stone for further studies about inclusion.
Case Studies
Some research concerning the effectiveness of inclusion has been based on case
studies (Dore, Dion, Wagner, & Brunet, 2002; Nagalieri & Kaufmann, 2000). Nagalieri
and Kaufman were interested in how inclusion affected the gifted child. They argued that
existing testing tools were not properly identifying the gifted child; therefore, effective
educational methods were not being used. Nagalieri and Kaufman recognized the gifted
child as a special needs child and suggested that different testing tools must be developed
in order to properly assess the gifted student’s needs. They observed one gifted child and
identified an additional testing measure, the Cognitive Assessment System (CAS) that
could better describe a gifted student’s needs. They proposed that current testing and
placement procedures were ineffective in identifying exceptional creative planning skills
in gifted children and the educational needs that follow. They suggested incorporating
other tests in the assessment of gifted children, such as CAS, which is based on the
Planning, Attention, Simultaneous, and Successive theory developed by Nagalieri (1999).
15
Although their study offered possible effective ways of identifying the gifted child, it did
little to determine the impact of inclusion on the gifted child.
Dore, Dion, Wagner, and Brunet (2002) observed two special-needs students in a
self-contained class and then moved to an inclusive classroom. They were examining the
interaction special-needs students actually had with students in a general classroom as
well as the teacher’s perception of the impact inclusion had on teaching. Dore et al.
(2002) used observations and teacher interviews to determine that one of the two students
did become involved in general classroom activities. Social interaction increased
minimally but was superficial, and teachers stated they made little modification to their
classrooms to include these two students. Dore et al. (2002) did suggest that although
these interviews led to satisfactory feedback, there were many moments in which the two
students were distracting to the class. They stated, “The relative absence of social
integration suggests that these modifications, although acceptable to teachers, are not
sufficient to meet the needs of adolescents with MR” (p. 259). Although Dore et al.
(2002) did examine the concept of inclusion directly in the classroom; their study was
based on two students in one classroom.
Survey Studies
Two survey questionnaires were given to 597 students to determine attitudinal
change teachers experience from contact with special-needs students in the general
classroom (“Attitudes of pre-school teachers,” 2003). It was found that the amount of
contact a teacher has with a disabled individual does not appear to change teacher
attitudes towards persons with disabilities. The results of this study reported that pre-
service teachers in general had negative attitudes towards students with disabilities. The

16
report concluded that teachers must receive adequate preparation for working with
students with disabilities.
Cook, Semmel, and Gerber (1999) also used surveys to assess attitudes of forty-
nine principals and sixty-four special education teachers regarding inclusion of special-
needs students in the general classroom. They found that principals believed that
achievement increases when special-needs students are included in general classrooms
and that inclusion was the best placement, whereas the special education teachers
disagreed. Special education teachers agreed that resources devoted to special-needs
students must be protected, while the principals disagreed. Cook et al. (1999) concluded
that the differences in answers “may pose a possible explanation for inclusion policies
being increasingly implemented and not generally producing improved outcomes” (p. 9).
They suggested that administrators consider attending to special education teachers’
concerns about inclusion. These studies had large samples and identified attitudinal
impact of inclusion, but they addressed neither academic performance nor behavioral
impact.
Bibliographic Reviews
Although case studies and surveys have been used in the research on inclusion
much of the research discussed is archival in nature. Salend and Duhaney (1999)
reviewed the literature and concluded that the effectiveness of inclusion has mixed
reviews. They found that the placement of special-needs students does not appear to
interfere with academic achievement and that teachers’ responses to inclusion were
complex, involving a multitude of variables. The teachers reportedly complained of too
little time, expertise, training, and/or resources to practice inclusion effectively. These

17
authors found that services offered in the inclusive classroom did not match the
individual services provided in the special-education classroom. In addition, providing
services that were more specialized required pulling the special-needs students out of the
general classroom, which in turn led to additional ridicule and embarrassment for those
students. Finally, these negative experiences were compounded by the teachers’ lack of
adequately adapting instructional activities for the special-needs student.
Petch-Hogan and Haggard (1999) compared the arguments for and against
inclusion and concluded, “Whether inclusion becomes a part of the special education
continuum for placement of students with disabilities or initiates a Unitarian school
system, educators must rethink, restructure, and reorganize the need for their present
delivery system to benefit students” (p. 4). Doran (2003) explored resources available and
suggested adequate instruments to better study the effectiveness of inclusion. He stated
that legislation requires all schools to provide yearly analysis of progress and specifies
the methodology to be used. However, he argued that accountability plans need more
analytical methods to depict student learning and to help identify improvement plans.
Hagan-Burke and Jefferson (2002) reviewed the movements in special education
reforms and discussed how special education reform continued to influence school
practices. They suggested the need for schools to place students in inclusive classrooms
on an individual basis. In addition, they recommended the development of measurable
goals and objectives so that the effectiveness of inclusion may be better evaluated.
Ayres and Hedeen (1996) completed a literature review suggesting the need for a
team approach when teaching behaviorally challenged students in inclusive classrooms.
They reported that inclusion would work if a team of general and special educators,
18
parents, classmates, and administration establish a shared vision and proactive prevention
plans. They suggested that it is important to understand that behaviors are means of
communication, and stressed the importance of identifying what behaviors may be trying
to communicate. Ayres and Hedeen (1996) summarized several class scenarios and
provided possible team-approach responses. Much of what has been suggested in these
literature reviews is based on analysis and theory, not derived from evidence-based
studies.
Experimental Studies
Palsha and Wesley (1998) set out to improve the global quality of early childhood
programs, stating this is the first step to the success of inclusion. They presented a model
for preparing community-based consultants to work on-site with staff from early
childhood education programs to improve the teachers’ knowledge, skills, and support to
facilitate inclusion. They utilized the Infant-Toddler Environment Rating Scale, the Early
Childhood Environment Rating Scale, and the Family Day Care Rating Scale to measure
these global qualities in the learning environment (Palsha & Wesley, 1998).
They provided free on-site consultation, training, and environmental
improvements for 73 staff of 25 sites in 15 communities. Every September for three years
an intensive two-day in-service session afforded consultants training in effective
consultant techniques. Following the training, consultants were placed in community
childcare centers to teach consultees how to administer environmental rating scales
appropriately. After the rating scale, training the consultants and consultees administered
the scale to establish an initial profile of the classroom environment. The consultant and
consultee then reviewed the scores and devised a plan to enhance the learning

19
environment. After this scale-training period, the consultant continued extensive on-site
technical assistance over a 6-12 month period. After each visit, the consultant completed
a contact summary form referencing progress on the plan of action.
The effectiveness of this in-service education model was evaluated via surveys
and environmental-rating-scale scores (Palsha and Wesley, 1998). The surveys were
administered to the consultees at the end of consultation offering them an opportunity to
rate the consultants’ skills and the impact of the training. The environmental change was
evaluated by collecting the environmental rating scales before consultation occurred
(initial score), once after consultation ended (concluding score), and again after 6-12
months following the end of consultation (follow-up score).
All items on the scales for the initial, concluding, and follow-up period were
summed and averaged to produce a total item mean score. Palsha and Wesley (1998)
used the total average scores to determine the overall quality of care before and after
consultation. In addition, each site’s scores on the rating scales were averaged to produce
an initial, concluding, and follow-up score for each scale to examine scale domains. They
recognized two statistical challenges characteristic of their design: first, a small sample
size and second, conducting multiple tests to examine the separate scale domains. They
chose to use the paired t-test as the “most robust procedure to check for statistical
differences” (p. 6). Palsha and Wesley concluded that there was improvement in the
overall quality of care after the community based consulting.
A four part experimental design was used to examine the effects of a collaborative
instructional model in inclusive secondary classes containing students with mild
disabilities (MD) and low-achieving students (LA) (Boudah, Schumacher, and Deshler,
20
1997). After receiving training in the collaborative model, teachers’ instructional actions,
their satisfaction with the model, student engagement, student use of four strategic skills,
and student performance were measured. These measures were compared to a control
group for which the teachers did not receive training in the Collaborative Instructional
Model. Four comparisons were made between baseline and intervention conditions. The
first comparison addressed teacher instructional actions and the other three addressed
student performance.
Boudah et al. (1997) used the pre- and post-scores to evaluate differences in the
effects of the CI Model on MD and LA performance. In addition, teacher implementation
of the CI Model on MD and LA students’ performance was compared with the control
group. A post-test only design was used because the control group was unlikely to have
experienced any intervention gains in the period between pre- and post-testing. They
concluded that the CI Model teachers spent more time in non-instructional than
instructional activity and their levels of student engagement were low. In addition, their
students did not show significant pre/post gains in performance.
The impact of inclusive educational programs was evaluated on the achievement
of students with developmental disabilities and peers without disabilities (McDonnell et
al., 2003). Performance differences were examined between students without disabilities
in an inclusive classroom and students without disabilities in a general education
classroom. In addition, a pre- and post-test design was used to assess performance on the
Scales of Independent Behavior (SIB) for students with developmental disabilities. A
post-test-only design was used with a control group of students without disabilities in the
general classroom.

21
The changes in the pre- and post-test on the SIB were analyzed using a two-tailed
Wilcoxon Signed Rank Test, examining the means of the cluster scores of each student’s
pre and posttest. The results showed that cluster scores on the SIB increased after
inclusion practices were implemented for thirteen of the fourteen students with
disabilities. In addition, the mean reading/language art scores for students without
disabilities in inclusive classrooms did not differ from comparison students, suggesting
that inclusion did not affect their learning.
Tapasak and Walther-Thomas (1999) completed a first-year evaluation of an
inclusive education program. The study was conducted in an urban elementary school
wherein students with disabilities attended inclusive classrooms full-time. Pre- and post-
testing of all measurement instruments occurred at the beginning and end of the school
year. Five different assessment tools were used to measure socio-metrics and self-
perceptions, as well as student report cards and teachers’ comments. Interestingly,
primary level students rated themselves in a positive manner while students in secondary
schools rated themselves in a negative manner. In addition, grade averages for secondary
students with disabilities were C’s and D’s. These researchers studied only the first year
of inclusion, precluding any analysis of a learning curve for the faculty implementing the
new programs.
In addition, an evaluation of students’ self-perception after implementing a new
program, Circle of Friends, using a two-phase procedure was completed by Frederickson
and Turner (2003). Phase I was a between-group design in which one group of children
received the intervention while another served as a comparison group. In Phase II the
comparison group from Phase I received the intervention. Prior to Phase I a baseline
22
assessment was administered to all participants. The intervention implemented in both
Phase I and II consisted of a Circle of Friends Group for six weeks. After Phase I both the
experimental and comparison group were given four different measurement tools to
assess social interaction. They were unable to conclude that the Circle of Friends model
improved behavioral conduct.
Fisher and Meyer (2002) also used paired t-tests and Analyses of Variance to
measure the outcomes of child development and social competence in inclusive vs. self-
contained classrooms. They assessed 40 students in two groups across a two-year time
span comparing the developmental and social achievements of students in inclusive
classrooms to students in self-contained classrooms. Scales of Independent Behavior
(SIB) and the Assessment of Social Competence (ASC) were given to the participants,
matched in pairs by chronological age and SIB scores at first testing. They were then
retested after two school years.
The students were enrolled in one of two types of classrooms, inclusive or self –
contained. The students in inclusive classrooms had been participating in inclusive
education for three to eleven years, whereas students in self-contained classes had been in
such an environment their entire school lives. Therefore, the first assessment was not a
pure baseline, but should have been considered a “pre-intervention” (p. 168) assessment.
During this pre-intervention assessment, their teacher or another adult who knew
them completed the SIB for students. Pairs of students from the inclusive and self-
contained classes were matched on chronological age and SIB score. Two-tailed t-tests
compared pre-intervention SIB and ASC scores means between the matched pairs, with
no significant differences. Fisher and Meyer (2002) concluded that the two groups were

23
matched appropriately at the onset of their study. They found differences in the pre-post
mean gains on the SIB within groups were significantly greater for the inclusive students,
but no significant differences within groups for the ASC scores. In the between groups
comparisons, some significantly higher scores for the inclusive students occurred for the
SIB but not for the ASC.
Summary
The methods used to study inclusion have been diverse and evidence about the
impact of inclusion has been inconsistent. Boudah et al. (1997) and McDonnell et al.
(2003) tested the theory but could not support a conclusion that inclusion is effective.
Others have laid the groundwork for longitudinal studies by offering tools that could
more accurately examine the effectiveness of inclusion (Doran, 2003; Hogan- Burke et
al., 2002; Seland, 2000). Palsha and Wesley (1998) explored improving the inclusive
learning environment whereas Boudah et al. (1997), Tapasak and Walther-Thomas
(1999), and McDonnell et al. (2003) examined the impact of inclusion on self-perception
and social interaction. Weiner (2003) and McDonnell et al. (2003) positions were that
academic scores would increase with the implementation of inclusion practices. Weiner
(2003) suggested that teachers were morally obligated to commit academic achievement
to all students. Tyler-Wood et al. (2004) reported that high curriculum demands led to
behavioral problems; they posited that behaviorally challenged students need both
academic and nonacademic support.
Stainback and Stainback (1996) recommended that all students, with or without
disabilities, be placed proportionally across all classrooms in public schools, but Dore et
al. (2002) concluded that the relative absence of social integration in the inclusive
24
classroom resulted in insufficiently addressing the requirements of adolescents with
special needs. Flannery and Lewis-Palmer (2003) suggested that children with different
emotional needs respond differently to a given intervention technique and “Attitudes of
pre-school teachers” (2003) found that teachers not trained in working with special needs
students have a negative attitude towards these students. Kauffman, Lloyd, and Riedel
(1995) summarized that inclusion required systematic interventions. These researchers all
theorized that inclusion might have a negative affect on behavior.
The research discussed in the following chapters is intended to show whether
inclusion has a demonstrable impact on academic achievement and behavioral referrals in
a large educational system in the southern United States. The basic question in this
research was “how does inclusion impact academic achievement and behavior referrals?”
Although this study cannot definitively claim causality, it examines the influence
inclusion, as it has been implemented in the State of Texas, may have on academic
achievement and student behavior.

25
Chapter 3
Methodology
Problem and Research Question
The literature reviewed in Chapter 2 described various aspects of inclusion, but
revealed little evidence about a causal relationship between the practice of inclusion and
indicators of educational outcomes. Petch-Hogan and Haggard (1999) recommended,
after an extensive literature review, that the focus of future research on inclusion should
be to examine the impact of inclusion on students’ academic achievement and social
behavior. The present dissertation study addressed this recommendation with a
longitudinal quasi-experimental study of the impact of inclusion on student achievement
and classroom behavior in a large southern state. Simply stated, the research question
asked whether the implementation of inclusion practices had a detectable influence on
academic performance and classroom behavior of students.
Hypotheses
The study was designed to test the relationship between the implementation of
inclusion in schools and changes in student academic achievement and classroom
behavior. The null hypothesis was that there would be no statistically significant
relationship between implementation of inclusion and student achievement and behavior.
The alternative hypothesis was that a statistically significant relationship existed between
the implementation of inclusion and student achievement and behavior. Said differently,
support for the alternative hypothesis would indicate that inclusion practices lead to
increases/decreases in academic performance and increases/decreases in classroom
behavioral problems; in essence, inclusion had an impact on behavior and academic

26
performance. This researcher’s expectations were that there truly was a negative
relationship between inclusion and grades and a positive relationship between inclusion
and behavior. However, the most important aspect of this research was to determine if
inclusion impacts academics and behavior. Therefore, it was deemed prudent to
implement a two-tailed design.
Archival Longitudinal Design and Sampling Frame
The study utilized a twelve-year archival longitudinal quasi-experimental design
with samples of schools from 100 education districts in the state of Texas. The time
frame included three four-year phases, as follows.
1993-1996 – Pre-inclusion years
1997-2000 – Implementation years
2001-2004 – Follow-up years
The rationale for these three, four-year phases included the following
considerations. Inclusion was mandated to start in 1997, and allowing four years to
implement inclusion practices in the schools, 1997-2000 defined the implementation
phase. An equivalent number of years for the pre and post phases were desirable to
balance the archival longitudinal design, resulting in 1993-1996 as a Pre-inclusion phase
and 2001-2004 as a Follow-up phase. Defined this way, the three phases ended just
before the earliest year this dissertation study could be started (2005). These
considerations resulted in a twelve-year, archival longitudinal design within which
outcome-measures of academic achievement were compared among the four pre-
inclusion years, the four implementation inclusion years and the four follow-up years.

27
However, behavioral data was not collected by the state until 1999; therefore, behavioral
data reflects only the last two phases of inclusion.
These comparisons were made between school-level measures of academic
achievement and classroom behavior; hence, schools were the units of analysis in the
design. Stratified random sampling of schools was based on size and grade levels of
schools. The rationale for stratifying school-size was that the writer’s discussions with
Texas Region VII school personnel suggested that inclusion-implementation varied
according to the resources of the schools, which in turn depended on community size, and
community size determined school size (D. Fleming, Personal Communication,
November 1, 2005). Hence, resources for implementing inclusion were associated with
school size, so school size was used in the stratified sampling frame for the study.
The rationale for stratified sampling based on grade level of schools derived from
research suggesting that inclusion practices differentially impact students at different ages
and grade levels. For example, Tapasak and Walther-Thomas (1999) found that inclusion
practices were associated with negative self-ratings from older students and positive self-
ratings from younger elementary students, due in part to developmental differences in
older students. In addition, much of the research on inclusion to date has been focused
primarily on elementary schools. Hence, comparisons of inclusion effects for elementary,
junior high, and high school grade levels in a single study with comparable outcome
measures (academic achievement and classroom behavior) should contribute usefully to
the body of research on inclusion.
Stratification on school-size included:
• small schools (50-400 students),

28
• medium schools (401 – 700 students),
• large schools (701 – 1000 students), and
• extra large schools (>1000 students).
Extremely small schools (< 50 students) were not sampled to avoid outliers that
might unduly bias the statistical analyses. Stratification of schools on grade levels
included grades K-5 (elementary), grades 6-8 (junior high), and grades 9-12 (high
school). Within each of the twelve cells of the sampling frame (four for size and three for
grade) thirty schools were sampled randomly from the available schools in each of the
nine strata, creating a total of 360 schools for each of the twelve years of the archival
longitudinal design.
The 360 schools sampled for the first of the twelve years were used in each
subsequent year, to provide repeated measurements on the same schools from year to
year. When, over the twelve years, schools ceased to operate, replacement schools within
the same strata were randomly sampled as needed. Some schools varied in size within the
twelve-year time frame, but the variation did not appear to occur more than one to three
years per school, therefore the school was considered a certain size based on the size
during the majority of the years. Hence, the year-to-year samples of schools contained
mostly the same repeatedly measured schools within the twelve strata, with an occasional
replacement school of equivalent size and grade level as needed. Therefore, while years
could be described as a repeated measures factor, the units of analysis (schools) from
year to year were mostly, but not exactly, the same within each of the twelve strata for
school size and grade level.
Access to Data
29
Access to the school-level data needed for the study was obtained from Texas
Education Agency (TEA). While the needed data were publicly available and readily
accessible, the writer had developed a professional relationship with staff at TEA to
facilitate the collection and use of the required data. This researcher had spoken with
several TEA staff members about the proposed study and these individuals had agreed to
assist the writer as needed to obtain required data or information for the study. Additional
details about accessing the TEA data sources are presented below following discussion of
the measures of the inclusion variable and school-level measures of the dependent
variables.
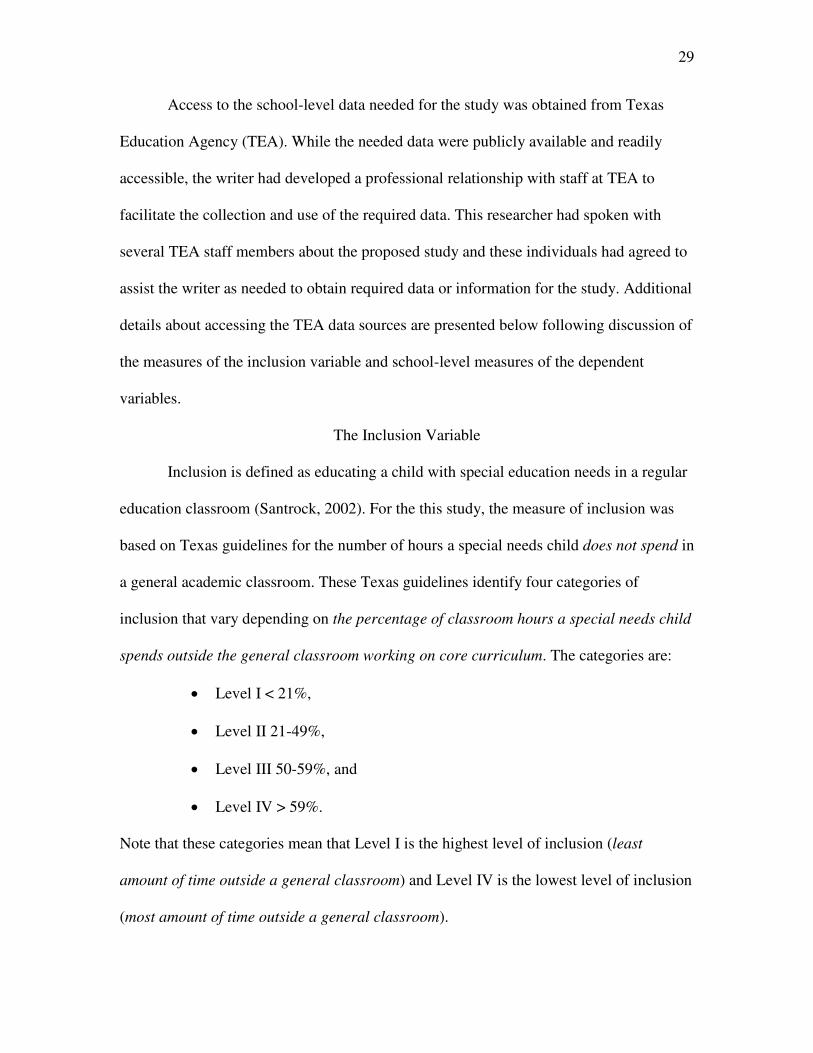
The Inclusion Variable
Inclusion is defined as educating a child with special education needs in a regular
education classroom (Santrock, 2002). For the this study, the measure of inclusion was
based on Texas guidelines for the number of hours a special needs child does not spend in
a general academic classroom. These Texas guidelines identify four categories of
inclusion that vary depending on the percentage of classroom hours a special needs child
spends outside the general classroom working on core curriculum. The categories are:
• Level I < 21%,
• Level II 21-49%,
• Level III 50-59%, and
• Level IV > 59%.
Note that these categories mean that Level I is the highest level of inclusion (least
amount of time outside a general classroom) and Level IV is the lowest level of inclusion
(most amount of time outside a general classroom).

30
Since 1997, the year that inclusion was mandated, each special needs child
reenrolled in a Texas school was assigned to one of these four inclusion categories each
year, prior to 1997, the four-level inclusion guidelines did not exist in the Texas school
system. These inclusion level scores (I through IV) were not reported until 2002 by the
Texas Education Agency (TEA) database for all the special needs children. However, the
data was collected in each of the sampled schools for each of the years (2002-2004) to
examine any possible trend that can be further investigated. Then, the average inclusion-
level score was calculated for the special-needs students in each school and each year.
Dependent Variables
Two categories of dependent variables were used in the study. The first category
included school-level measures of the two primary-outcome dependent variables for the
study:
a) the percent of students passing standardized academic achievement tests and the
Texas Learning Index, or TLI, a score that describes how far a student's
performance is above or below the passing standard, and
b) the number of disciplinary counts and referrals, defined by the Texas Education
Code, per school year for each school sampled.
The TLI (a) is provided for both the TAAS reading and mathematics tests at
Grades 3 through 8 and at the exit level, Grade 10. A mean TLI score was obtained for
each grade (3rd
-10th
) and each school. The labels used throughout this chapter for these
two dependent variables are AA (Academic Achievement) and BR (Behavioral Referrals
for disciplinary reasons).
31
Academic achievement was based on the Texas Assessment of Academic Skills
(TAAS). The TAAS was used in Texas schools until 2003 to measure statewide reading,
writing, and mathematics (TEA, 2005). TAKS replaced the TAAS in 2003 to assess the
statewide curriculum in reading, writing, English, mathematics, science, and social
studies. The TLI for the TAAS were provided through the academic year 2003.
The BR dependent variable was based on the Texas standards for “Students with
Disciplinary Placements” (TEA, 2006). Chapter 37 of the Texas Education Code requires
a tracking system for disciplinary actions taken for any student (AEIS). A disciplinary
action is defined as removing a student from a classroom for at least one school day.
These removals are reported on a document called the 425-Record that includes the
campus enrollment, campus disciplinary assignment, and various codes for the
disciplinary action and reason for the action. Each district reports the 425-Records at the
end of each school year, each record representing a student’s removal from regular
classroom for at least one day because of disciplinary action (TEA, 2005). Students
removed from the classroom more than once during a school year will have multiple 425-
Records for the year. TEA began collecting disciplinary data in 1999. The data from
these 425-Records were accessed via a special request from TEA, allowing for a BR
dependent variable measure for each sampled school for years 1999-2004 of the study.
Therefore, the unit of analysis for this dependent variable was for the last six years of the
study. The focus was to determine if BR varied when compared with the different levels
of inclusion using the average inclusion-level score calculated for the special-needs
students per school per year. In addition, in 2000, Texas began collecting data on the
number of behavioral referrals made in a school. These referrals were representative of a

32
problematic behavior that led to removal from the classroom but not to placement in
alternative education.
The second category of dependent variables included school-level information
about the regular/special education teacher population, regular/special education budget,
student dropout rates, and student graduation rate for each sampled school for each year.
TEA reports the total population of teachers, student dropout and graduation rates for
each school and year. These data were analyzed to determine if teacher or student
attrition varied across the three inclusion phases covered in the twelve-year archival
longitudinal design of the proposed study.
Sources of Data
Access to academic achievement and behavior referral data for the study was
obtained via the TEA Person Identification Database (PID). The PID is a database used to
store and manage information about students, teachers, schools, and districts in Texas.
The Public Education Information Management System (PEIMS) allows public access to
the academic achievement (TAAS scores) measures and behavioral referral information.
The PID system allows users to assemble data from different source files for individual
schools without violating individual student confidentiality. All of the data needed for the
study was accessed from PID and PEIMS. Therefore, with public access to the data
sources provided by the PID and the PEIMS, and the writer’s collaboration with the TEA
personnel, all of the data needed to conduct the study was retrieved from TEA databases.
Pilot Study
A pilot study was conducted to evaluate the usability of the PEIMS archived data
needed for the study. For various reasons, experience has shown that reports from

33
individual schools may be less than complete, resulting in missing data. The extent of this
missing data problem in the PEIMS was evaluated in the pilot study, and necessary
adjustments to the research procedures were made as needed.
An expected problem was the likely absence of blocks of data for a sampled
school. However, this did not occur in the pilot. Although blocks of missing data were
not found it was noted that small schools’ reports were more inconsistent than the larger
schools. TEA personnel explained the data-masking procedures used for reporting
information that contributes to small-school inconsistency. Data are masked either by
leaving the field blank, resulting in missing data, or entering –999 in the field for any
number involving five or fewer students. This possibility obviously would occur in
smaller schools having fewer students in a reporting category.
The most notable variable for which there was masked data was inclusion level.
TEA advised that a common practice in handling masked data in research is to replace
–999 with 2.5. The reasoning is that –999 indicates some number between 0 and 5, so 2.5
is the midpoint and a reasonable imputed value to replace the –999 TEA no-data code.
On the basis of the finding about missing data in the pilot study, the extent of the problem
was not sufficient to remove small schools from the study. It was also decided to add an
extra large school size to the study to increase the variance in the school size independent
variable.
The pilot revealed consistent missing data in 1993 for certain grades. All schools
sampled in the pilot provided some data for 1993, but not for all grades. Given that data
would be averaged over all grades within each school for the main study, and the average

34
would simply not include missing data, it was decided that the 1993 missing-data
problem did not require dropping 1993 from the study.
The pilot study also discovered that the term Intermediate sometimes referred to
schools with grade levels K-5 and sometimes referred to schools with grade levels 6-8.
This meant that schools in the main study should be classified on the basis of actual grade
levels rather than descriptive terms such as Intermediate. Sampling of schools in the main
study ensured even representation across all school grades from K through 12 regardless
of labels such as Elementary, Intermediate, etc. The pilot also revealed that data reported
in PEIMS were available for grades 3-11 only, simply meaning that grades 1, 2 and 12
were not represented in the school averages for the dependent variables.
The most significant discovery in the pilot study was the way the TAAS/TAKS
scores were reported for general education and special education students. For regular
education students, the available data for each school is the percentage of students in a
grade that passed the test, not the average score for the students taking the test in each
grade. This percent-passing score was available consistently for regular education
students in grades 3-11 who took the reading and math tests, and who took and passed all
the subtests of the TAAS/TAKS. For special-needs students, a different percentage score
was reported. This score was the percentage of all special education students from all
grades in the school passing a specified subtest or combination of all subtests. Ostensibly,
this percentage would prevent identification of individuals in classes with few special
education students included with the general education students. Despite these two
different ways of representing a school’s passing percentages for regular and special-
needs students, the average percentage score over grades for the general education

35
students and the school-wide percentage for special education students was deemed to be
an appropriate school-level dependent variable measure in the proposed study.
In addition, after completion of the pilot study, the researcher was able to obtain
access to the Texas Learning Index, or TLI, a score that describes how far a student's
performance is above or below the passing standard. The TLI was provided for both the
TAAS reading and mathematics tests at Grades Three through Eight and at the exit level
(Tenth Grade). The TLI was developed to allow students, parents, and schools both to
relate student performance to a passing standard and to compare student performance
from year to year.
The pilot study also showed that the PEIMS website (TEA, 2006) included, for
each school in each year, the total number of students, the total number of special
education students, the number of regular education teachers, and the number of special
education teachers. These data were used as covariates in the analyses to adjust findings
that might be influenced by these student- or teacher-census numbers. The PEIMS site
did not provide some data that required special requests, such as inclusion level,
discipline referral, drop out rates, and graduation rates. These special-request data were
obtainable by the researcher via her professional contacts with TEA personnel. In sum,
the pilot study produced 33 school-level measures of independent and dependent
variables, as well as descriptive characteristics of the schools; they are listed below in
Table 1.
Table 1. Independent and dependent variables as labeled in the data file(s)
Variable name Variable definition Variable type Years data reported
Year School year: 1993 - 2004 Independent
Schsize School size as defined by number of students: small <401, medium 401-700, large 701-1,000, extra large >1,000
Independent 1993-2004

36
Schnam School name as designated by numbers 1-360 independent 1993-2004
Totnumst Total number of students on campus independent 1993-2004
Totspeed Number of special ed students on campus independent 1993-2004
Disccou Total number of disciplinary referrals on campus
dependent 2000-2004
Discplac Total number of discipline placements for the campus
dependent 1999-2003
Budgre Percent of budget allotted for regular ed dependent 1993-2004
Budgsp Percent of budget allotted for special ed dependent 1993-2004
Teapopre Number of regular classroom teachers dependent 1993-2004
teapopsp Number of special ed teachers dependent 1993-2004
spsttea Number of special ed students per special ed teacher
dependent 1993-2004
Noinclu No inclusion: special ed students are not included in regular classes
independent 1993-2004
inclu1 Inclusion Level I (PEIMS code 41): number of special ed students who spend <21% of their time outside the regular classroom
independent 2002-2004
inclu2 Inclusion Level II (PEIMS code 42): number of special ed students who spend 21 to 49% of their time outside the regular classroom
independent 2002-2004
inclu3 Inclusion Level III (PEIMS code 43): number of special ed students who spend 50 to 60% of their time outside the regular classroom
independent 2002-2004
inclu4 Inclusion Level IV (PEIMS code 44): number of special ed students who spend >60% of their time outside the regular classroom
independent 2002-2004
inclu Number of special ed students included at all levels (inclu1+inclu2+inclu3+inclu4)
independent 2002-2004
Avgtlired Average student performance based on the passing standard for reading test
dependent 1994-2002
Avgtlimth Average student performance based on the passing standard for math test for all students in that grade
dependent 1994-2002
ssall percent of students that passed all tests including reading, math, writing, science, and social studies in that grade
dependent 1994-2002
Gradnum Number of graduates in each high school dependent 1994-2002
Dropout Number of students dropping out of each high school
dependent 1994-2002
Discratio Computed ratio: discou/totnumst dependent 1994-2002 discratiosp Computed ratio: discou/totspeed dependent 1994-2002
spedratio Computed ratio: totspeed/totnumst dependent 1994-2002
incluration Computed ratio: inclu/totspeed independent 2002-2004
teareratio Computed ratio: teapopre/totnumst dependent
teaspratio Computed ratio: teapopsp/totspeed dependent
bugreratio Computed ratio: budgre/totnumst dependent
bugspratio Computed ratio: budgsp/totspeed dependent
Gradratio Computed ratio: gradnum/totnumst dependent 1993-2004
dropoutratio Computed ratio: dropout/totnumst dependent 1994-2004
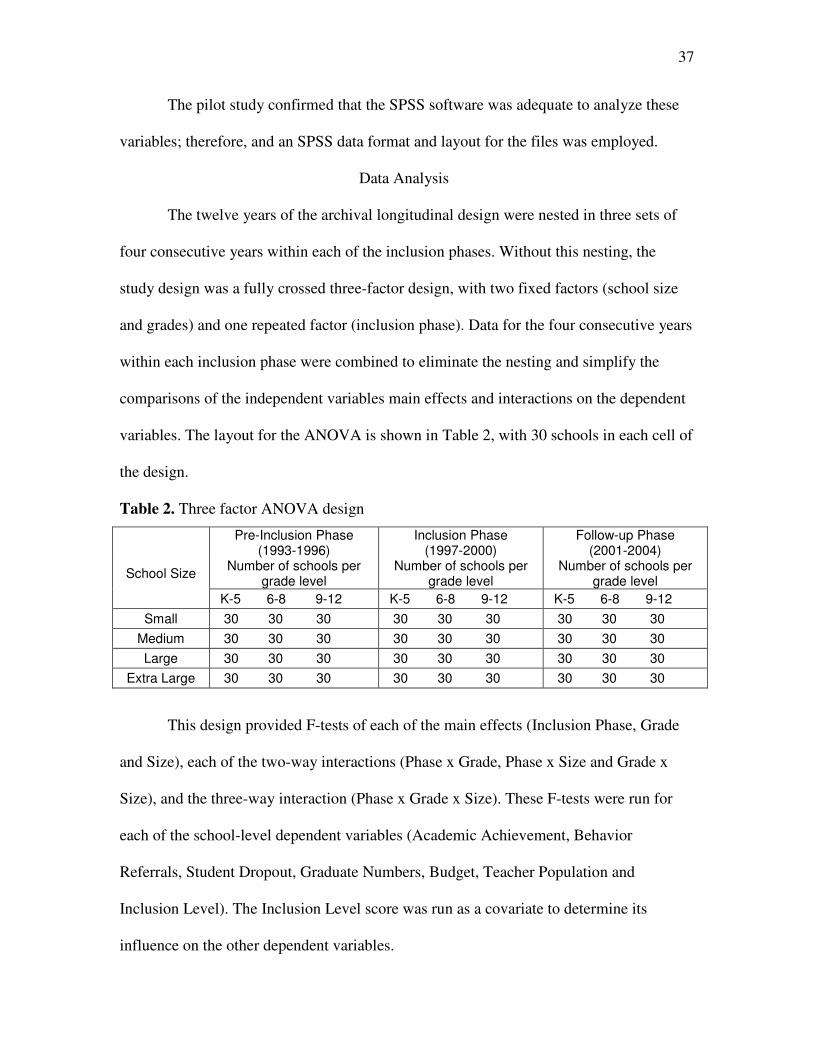
37
The pilot study confirmed that the SPSS software was adequate to analyze these
variables; therefore, and an SPSS data format and layout for the files was employed.
Data Analysis
The twelve years of the archival longitudinal design were nested in three sets of
four consecutive years within each of the inclusion phases. Without this nesting, the
study design was a fully crossed three-factor design, with two fixed factors (school size
and grades) and one repeated factor (inclusion phase). Data for the four consecutive years
within each inclusion phase were combined to eliminate the nesting and simplify the
comparisons of the independent variables main effects and interactions on the dependent
variables. The layout for the ANOVA is shown in Table 2, with 30 schools in each cell of
the design.
Table 2. Three factor ANOVA design
Pre-Inclusion Phase (1993-1996)
Inclusion Phase (1997-2000)
Follow-up Phase (2001-2004)
School Size Number of schools per
grade level Number of schools per
grade level Number of schools per
grade level
K-5 6-8 9-12 K-5 6-8 9-12 K-5 6-8 9-12
Small 30 30 30 30 30 30 30 30 30
Medium 30 30 30 30 30 30 30 30 30
Large 30 30 30 30 30 30 30 30 30
Extra Large 30 30 30 30 30 30 30 30 30
This design provided F-tests of each of the main effects (Inclusion Phase, Grade
and Size), each of the two-way interactions (Phase x Grade, Phase x Size and Grade x
Size), and the three-way interaction (Phase x Grade x Size). These F-tests were run for
each of the school-level dependent variables (Academic Achievement, Behavior
Referrals, Student Dropout, Graduate Numbers, Budget, Teacher Population and
Inclusion Level). The Inclusion Level score was run as a covariate to determine its
influence on the other dependent variables.

38
Ethical Issues
All data was accessed from public records, with no personal identifiers for any
individuals. Personal identifiers are removed by Texas’ Public Education Information
Management System (PEIMS) prior to making the data available to the public. Hence, no
informed consent for students was needed to access the archived data to be used in this
dissertation research. Under Federal regulations, 45 CFR 46.101 (b), certain research is
considered exempt from the IRB review because the research is considered low-risk (The
National Cancer Institute, 2005). The National Cancer Institute (2005) states there are
five exempt categories for research:
• research conducted in commonly acceptable educational settings,
• research using educational tests that are assessable in such a manner that
students are not identified directly or through identifiers,
• research that utilizes the collection of data via public sources,
• research that is subject to the approval of the Federal Department that
examines the benefit of service programs, and
• research focused on food-quality and consumer acceptance.
Research using educational tests is not exempt if personal identifiers must be used for the
purpose of the research.
This dissertation research included a commonly accepted educational setting and
utilized data from public records with no student identifiers. Of necessity, research that
involves children is held to strict guidelines, this study falls within several of the NCI
exemptions (The National Cancer Institute, 2005). The writer also recognizes the
importance of upholding the ethical integrity of research by properly documenting data

39
and results, and maintaining records so other researchers can examine and replicate the
research.
40
Chapter 4: Findings
Overview
The study was a twelve-year archival longitudinal project covering three four-year
phases before, during, and after the implementation of inclusion: 1993-1996, Pre-
inclusion years; 1997-2000, Implementation years; and 2001-2004, Follow-up years.
Inclusion was federally mandated to begin in 1997, and the study design provided four
years to implement inclusion. An equivalent number of years for pre-inclusion and post-
inclusion were desirable to balance the archival longitudinal design, resulting in the three
four-year phases for the study. Hence, the study retrospectively used archived
standardized TAAS and TAKS scores for reading and math, and counts of behavioral
referrals to measure discipline, to examine the impact of inclusion on these dependent
variables.
All data were retrieved from Texas Education Agency via the Academic
Excellence Indicator System and The Public Education Information Management System
(PEIMS). These archives provided the percentage of both regular and special-education
students passing the TAAS/TAKS, the average Texas Learning Index (TLI), discipline
counts, and discipline placement. In addition, descriptive school-level data that might be
associated with the relationship between inclusion and student performance were
obtained from the TEA archives: budgets allocated to regular education and to special
education, regular and special education teacher populations, and graduation and dropout
rates for the high schools in the study sample.
The units of analysis were 360 schools throughout the State of Texas, 30 schools
for each grade level for every designated size. These schools were randomly selected

41
from more than 100 school districts around the entire state which included urban and
rural settings and covered a diversity of socioeconomic and cultural factors. The student
bodies of the sampled schools were small (50-400), medium (401-700), large (701-1000),
and extra large (> 1000), and included grade levels for elementary (K-5), junior high (6-
8), and high (9-12) schools.
The findings presented in this chapter include:
(1) descriptive information about the schools in the sample,
(2) summary statistics for measures of the dependent variables for the schools
classified according to the three-factor design of the study (Inclusion Phases,
School Sizes and School Grade Levels),
(3) inferential statistical tests of differences between means of the dependent
variables for the main and interaction effects of the three factors, and
(4) figures showing the statistically significant differences in means over
inclusion phases time associated with the factors.
Sample Descriptive Statistics
Tables 3 and 4 show the range of student and teacher populations, as well as the
percentage of the entire school budget allotted for general and special education. These
descriptive statistics are provided for year 1993 (beginning year of the study) and 2004
(final year of the study) to show average growth occurring in these schools indicative of
other schools across the nation. Table 3 shows descriptive statistics for all 360 schools in
1993 with an average number of students in a school of 748, the average number of
special education students of 80; a mean 71% of budgets was allotted to general
education, while 11% was the mean overall budget allotted to special education. The

42
average number of general teachers for each school was 33 and five was the average
number of special-education teachers.
Table 3. Descriptive statistics for schools in 1993
Minimum Maximum Mean SD
Total student N
87 3639 748 480
Total special-education student N
8 463 80 49
Percent of budget for general education
16 100 71 14
Percent of budget for special-education
1 44 11 6
General education teacher N
1 159 33 20
Special-education teacher N
0 35 5 4
The means were higher for year 2004 (Table 4), with an average number of
students per school of 773, an average number of special education students of 95, a
mean 67% of the budget allocated for general education and an average 13% of the
budget allotted to special education. Finally, the average number of general education
teachers per school was 35; the average number of special-education teachers was six.
Table 4. Descriptive statistics for schools in 2004
Minimum Maximum Mean SD Total student N
59 4776 773 552
Total special-education student N
12 599 95 66
Percent of budget for general education
13 96 67 12
Percent of budget for special-education
2 33 13 5
Regular education teacher N
2 174 35 22
Special-education teacher N
0 34 6 4
Although the randomly selected schools represented all grade levels, TAAS and
TAKS scores were only reported for Grade Levels Three through Eight and Ten, the
43
other data collected were representative of all grades in each school. The original plan for
the study was to use thirty schools of each size in each grade level across all three phases
of the study (Table 5). However, some of the initially selected schools were closed or
reconfigured during the twelve years and some had missing data, so the N actually varied
around the 360 total.
This three-factor ANOVA design afforded the opportunity to examine the
influence of inclusion on academic achievement and behavior, by comparing the means
of the dependent variables among the three inclusion phases and, at the same time
observing whether the influence varied between school size and grade level. The three
components of academic achievement were the percent of students passing TAAS or
TAKS, and the TAAS TLI for reading and math for every school in each of the three
phases of the study. Behavior was measured by the number of discipline counts for every
school in two phases, Implementation and Follow-up; the counts were not available for
the Pre-inclusion phase.
In high schools, dropout and graduation numbers were also considered. Ratios
were computed for discipline counts, graduation numbers, dropout numbers, teacher
populations (special education and regular education), and budget allocations (special
education and regular education) to adjust for varying school sizes. In addition, a
correlation analysis was performed to examine the influence of inclusion levels (the
number of special-needs students in a general classroom) on the percentage of students
passing the TAAS and on discipline counts during the post-inclusion phase.
Percentage Passing

44
Table 5 below shows the means, standard deviations, and Ns of percent passing
scores for each school size within each grade level, within the three phases of inclusion.
Utilizing the data from Table 5, differences among means were tested with the mixed
model ANOVA; the statistically significant relationships between percent passing and the
factors are plotted graphically in Figure 1.
Grade levels are as follows:
• elementary - grades 3 - 5/6
• junior high - grades 6/7 - 8
• high school – grades 9 -12
School sizes are as follows:
• small - 50-400 students
• medium - 401-700 students
• large - 701-1000 students
• extra large – more than 1000 students
Table 5. Descriptive statistics for percentage of students passing
Grade Level School Size Mean SD N
Small 56.54 12.13 25
Medium
63.34 14.49 37
Large 67.04 14.05 33
X-Large 50.82 15.16 24
Elementary
Total 60.41 15.14 119
Small 62.21 10.14 32
Medium
52.56 17.98 22
Large 58.53 16.41 34
X-Large 53.30 16.47 31
Junior High
Total 57.05 15.62 119
Small 60.66 9.67 31
Medium
56.46 10.92 30
Large 53.26 10.06 28
X-Large 53.85 14.63 29
Pre-inclusion Phase
High School
Total 55.98 11.82 118

45
Small 60.05 10.72 88
Medium
58.09 15.04 90
Large 59.93 14.92 95
X-Large 52.78 15.35 84
Total
Total 57.88 14.34 356
Small 77.31 9.46 25
Medium
78.37 13.41 37
Large 81.06 13.44 33
X-Large 66.60 13.51 24
Elementary
Total 76.52 13.58 119
Small 78.68 9.75 32
Medium 69.74 12.74 22
Large 72.98 13.80 34
X-Large 69.55 14.43 31
Junior High
Total 73.02 13.19 119
Small 77.49 10.74 31
Medium 75.18 9.02 30
Large 75.65 8.32 28
X-Large 71.45 11.87 29
High School
Total 74.86 10.27 118
Small 77.87 9.94 88
Medium 74.99 12.32 90
Large 76.59 12.66 95
X-Large 69.36 13.31 84
Implementation Phase
Total
Total 74.80 12.48 356
Small 80.55 8.45 25
Medium 79.81 13.83 37
Elementary Large 81.49 11.22 33
X-Large 70.62 13.13 24
Total 78.58 12.54 119
Small 78.67 7.55 32
Medium 71.11 12.34 22
Junior High Large 73.44 14.49 34
X-Large 71.39 12.75 31
Follow-up Phase Total 73.88 12.31 119
Small 66.93 10.19 31
Medium 66.64 9.25 30
High School Large 66.02 7.73 28
X-Large 64.01 15.10 29
Total 65.83 10.84 118
Small 75.07 10.62 88
Medium 73.01 13.38 90
Total Large 74.05 13.13 95
X-Large 68.62 13.96 84
Total 72.81 13.00 356
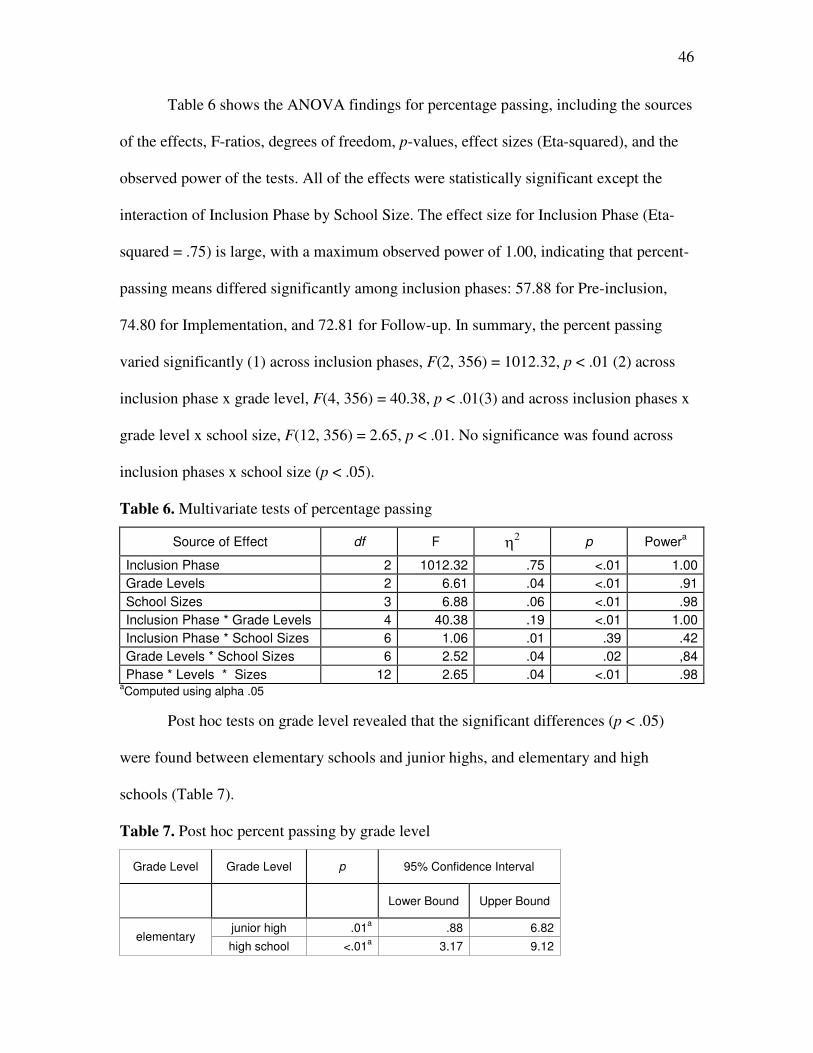
46
Table 6 shows the ANOVA findings for percentage passing, including the sources
of the effects, F-ratios, degrees of freedom, p-values, effect sizes (Eta-squared), and the
observed power of the tests. All of the effects were statistically significant except the
interaction of Inclusion Phase by School Size. The effect size for Inclusion Phase (Eta-
squared = .75) is large, with a maximum observed power of 1.00, indicating that percent-
passing means differed significantly among inclusion phases: 57.88 for Pre-inclusion,
74.80 for Implementation, and 72.81 for Follow-up. In summary, the percent passing
varied significantly (1) across inclusion phases, F(2, 356) = 1012.32, p < .01 (2) across
inclusion phase x grade level, F(4, 356) = 40.38, p < .01(3) and across inclusion phases x
grade level x school size, F(12, 356) = 2.65, p < .01. No significance was found across
inclusion phases x school size (p < .05).
Table 6. Multivariate tests of percentage passing
Source of Effect df F η2 p Power
a
Inclusion Phase 2 1012.32 .75 <.01 1.00
Grade Levels 2 6.61 .04 <.01 .91
School Sizes 3 6.88 .06 <.01 .98
Inclusion Phase * Grade Levels 4 40.38 .19 <.01 1.00
Inclusion Phase * School Sizes 6 1.06 .01 .39 .42
Grade Levels * School Sizes 6 2.52 .04 .02 ,84
Phase * Levels * Sizes 12 2.65 .04 <.01 .98 aComputed using alpha .05
Post hoc tests on grade level revealed that the significant differences (p < .05)
were found between elementary schools and junior highs, and elementary and high
schools (Table 7).
Table 7. Post hoc percent passing by grade level
Grade Level Grade Level p 95% Confidence Interval
Lower Bound Upper Bound
junior high .01a .88 6.82
elementary high school <.01
a 3.17 9.12
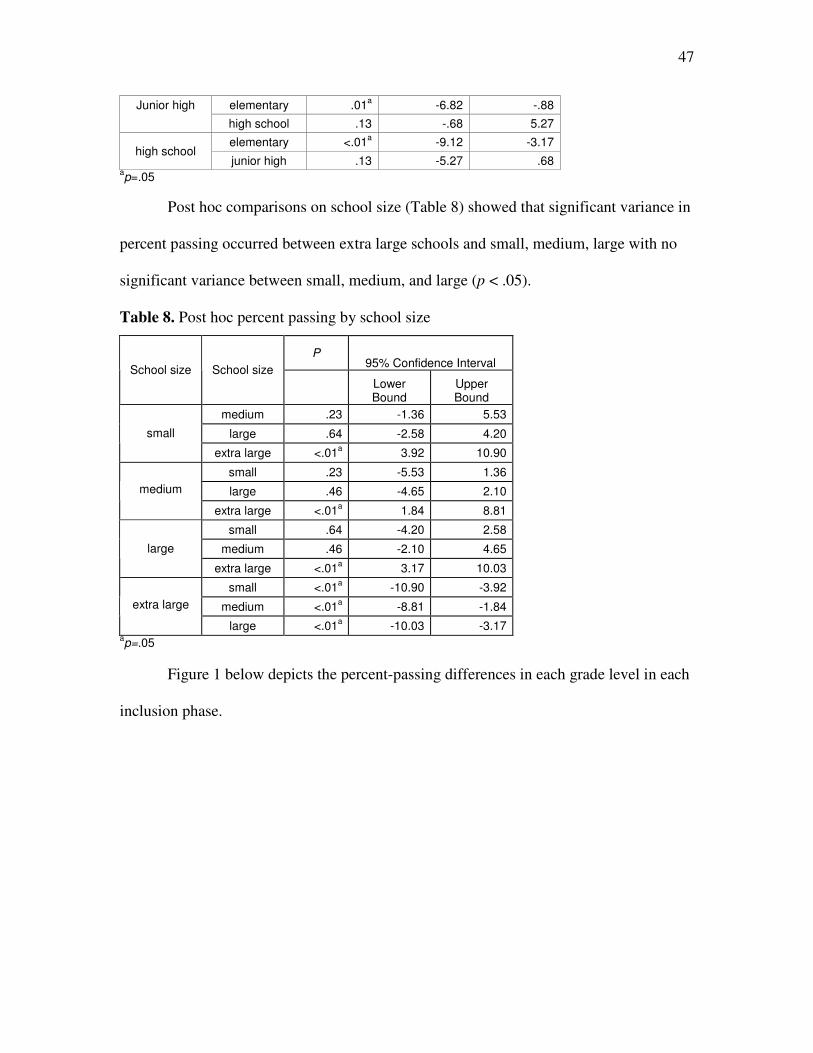
47
Junior high elementary .01a -6.82 -.88
high school .13 -.68 5.27
elementary <.01a -9.12 -3.17
high school junior high .13 -5.27 .68
ap=.05
Post hoc comparisons on school size (Table 8) showed that significant variance in
percent passing occurred between extra large schools and small, medium, large with no
significant variance between small, medium, and large (p < .05).
Table 8. Post hoc percent passing by school size
P 95% Confidence Interval
School size School size
Lower Bound
Upper Bound
medium .23 -1.36 5.53
large .64 -2.58 4.20 small
extra large <.01a 3.92 10.90
small .23 -5.53 1.36
large .46 -4.65 2.10 medium
extra large <.01a 1.84 8.81
small .64 -4.20 2.58
medium .46 -2.10 4.65 large
extra large <.01a 3.17 10.03
small <.01a -10.90 -3.92
medium <.01a -8.81 -1.84 extra large
large <.01a -10.03 -3.17
ap=.05
Figure 1 below depicts the percent-passing differences in each grade level in each
inclusion phase.

48
Figure 1. Percent passing of students passing in all schools in each inclusion phase
Standardized Reading Scores
Table 9 below shows the means, standard deviations, and Ns of reading scores for
each school size within each grade level, within the three phases of inclusion. The
differences among these means were tested with the mixed model ANOVA (Table 10)
and the statistically significant relationships between reading scores and the factors were
plotted graphically in Figures 2, 3, and 4.
Follow up Implementation Pre inclusion
Inclusion Phase
80%
75%
70%
65%
60%
55%
Perc
en
t o
f S
tud
en
ts P
ass
ing
2 = jh
3 = hs
1 = el
grade level
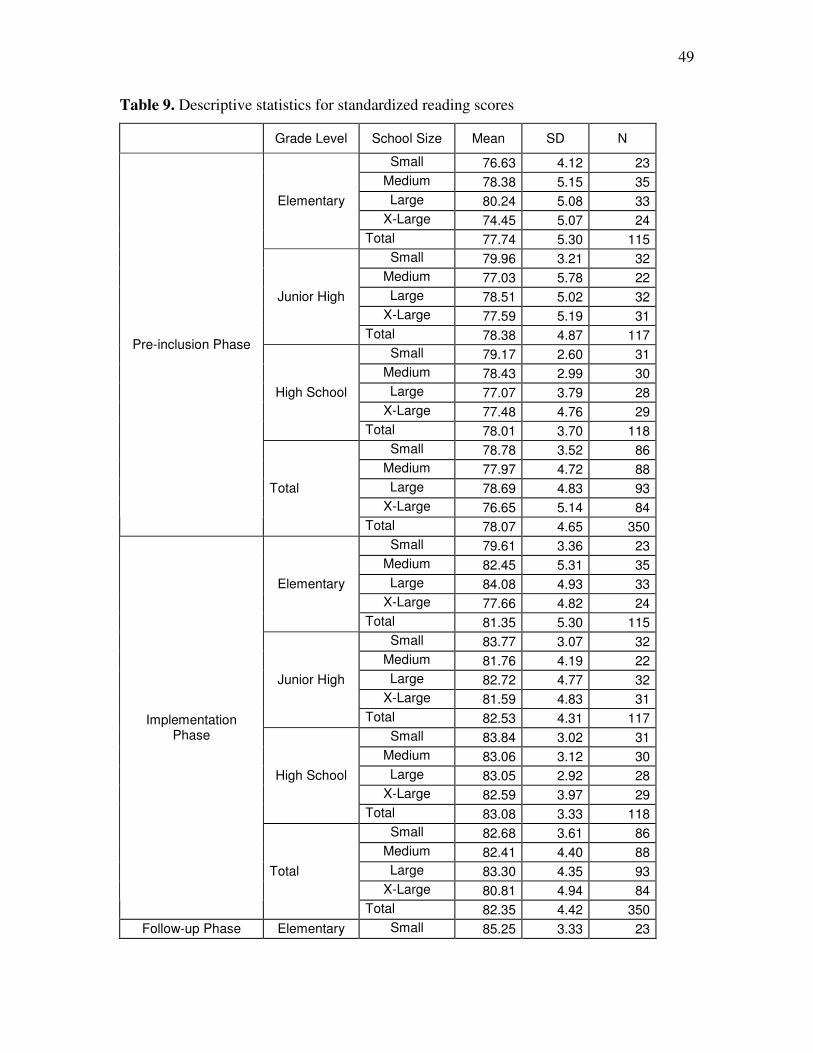
49
Table 9. Descriptive statistics for standardized reading scores
Grade Level School Size Mean SD N
Small 76.63 4.12 23
Medium 78.38 5.15 35
Large 80.24 5.08 33
X-Large 74.45 5.07 24
Elementary
Total 77.74 5.30 115
Small 79.96 3.21 32
Medium 77.03 5.78 22
Large 78.51 5.02 32
X-Large 77.59 5.19 31
Junior High
Total 78.38 4.87 117
Small 79.17 2.60 31
Medium 78.43 2.99 30
Large 77.07 3.79 28
X-Large 77.48 4.76 29
High School
Total 78.01 3.70 118
Small 78.78 3.52 86
Medium 77.97 4.72 88
Large 78.69 4.83 93
X-Large 76.65 5.14 84
Pre-inclusion Phase
Total
Total 78.07 4.65 350
Small 79.61 3.36 23
Medium 82.45 5.31 35
Large 84.08 4.93 33
X-Large 77.66 4.82 24
Elementary
Total 81.35 5.30 115
Small 83.77 3.07 32
Medium 81.76 4.19 22
Large 82.72 4.77 32
X-Large 81.59 4.83 31
Junior High
Total 82.53 4.31 117
Small 83.84 3.02 31
Medium 83.06 3.12 30
Large 83.05 2.92 28
X-Large 82.59 3.97 29
High School
Total 83.08 3.33 118
Small 82.68 3.61 86
Medium 82.41 4.40 88
Large 83.30 4.35 93
X-Large 80.81 4.94 84
Implementation Phase
Total
Total 82.35 4.42 350
Follow-up Phase Elementary Small 85.25 3.33 23

50
Medium 85.47 4.87 35
Large 86.36 4.65 33
X-Large 81.48 4.20 24
Total 84.85 4.69 115
Small 88.60 2.52 32
Medium 86.50 3.62 22
Large 86.75 4.51 32
X-Large 86.10 4.11 31
Junior High
Total 87.04 3.86 117
Small 86.78 2.28 31
Medium 86.49 3.02 30
Large 86.29 2.10 28
X-Large 85.62 3.82 29
High School
Total 86.26 2.90 118
Small 87.05 2.97 86
Medium 86.03 4.00 88
Large 86.47 3.96 93
X-Large 84.61 4.47 84
Total
Total 86.07 3.97 350
Table 10 shows the ANOVA findings for reading scores, including the sources of
the effects, F-ratios, degrees of freedom, p-values, effect sizes (Eta-squared), and the
observed power of the tests. All of the effects were statistically significant. The effect
size for the Inclusion Phase (Eta-squared = .85) is large, with a maximum observed
power of 1.00, indicating that reading score means differed significantly among inclusion
phases., i.e. 78.07 for Pre-inclusion, 82.35 for Implementation, and 86.07 for Follow-up.
To summarize, reading scores varied significantly (1) across inclusion phases, F(2, 350)
= 1857.45, p < .01, (2) across inclusion phase x grade level, F(4, 350) = 10.71, p < .01
(3) across inclusion phases x school size, F(6, 350) = 2.30, p = .03 and (4) across
inclusion phases x grade level x school size, F(12, 350) = 2.66, p < .01.
Table 10. Multivariate tests of standardized reading scores
Source of Effect df F η2 p Power
a
Inclusion Phase 2 1857.45 .85 <.01 1.00
Grade Levels 2 5.82 .03 <.01 .87
School Sizes 3 6.12 .05 <.01 .96

51
Inclusion Phase * Grade Levels 4 10.71 .06 <.01 1.00
Inclusion Phase * School Sizes 6 2.30 .02 .03 .80
Grade Levels * School Sizes 6 3.98 .07 <.01 .97
Phase * Levels * Sizes 12 2.66 .05 <.01 .98 aComputed using alpha = .05
Post hoc comparisons by grade level (Table 11) showed significant variance in
reading scores occurring between elementary schools and junior highs, as well as high
schools (p < .05). However, there was no significant difference between junior high and
high school reading scores.
Table 11. Post hoc reading scores by grade level
95% Confidence Interval
Grade Level Grade Level p Lower Bound Upper Bound
junior high .01a -2.34 -.33 elementary
high school .02a -2.19 -.19
Junior high elementary .01a .33 2.34
high school .78 -.85 1.14
elementary .02a .19 2.19 high school
junior high .78 -1.14 .85 ap < .05
Post hoc comparisons by school size (Table 12) showed significant variance
occurring between the extra large schools and all other sizes with no significant variance
between small, medium, and large (p < .05).
Table 12. Post hoc reading scores by school size
95% Confidence Interval
School Size School Size p Lower Bound Upper Bound
medium .29 -.53 1.79
Large .98 -1.13 1.16 small
extra large <.01a .97 3.32
small .29 -1.79 .53
large .29 -1.75 .53 medium
extra large .01a .35 2.68
small .98 -1.16 1.13
Large medium .29 -.53 1.75
extra large <.01a .98 3.28

52
small <.01a -3.32 -.97
extra large medium .01a -2.69 -.35
large <.01a -3.28 -.98
ap<.05
Figures 2, 3, and 4 show how reading scores varied in each inclusion phase
between school sizes.
Figure 2. Elementary school reading score means in each inclusion phase
Follow up Implementation Pre inclusion
Inclusion Phase
87.50
85.00
82.50
80.00
77.50
75.00
Me
an
Re
ad
ing
Sc
ore
s
4 3 2 1
school size = sm
= md
= lg
= xl

53
Figure 3. Middle school reading score means in each inclusion phase
Follow up Implementation Pre inclusion
Inclusion Phase
90.00
87.50
85.00
82.50
80.00
77.50
Mean
Read
ing
Sco
res
4 3 2 1
school size = sm
= md
= lg
= xl

54
Figure 4. High school reading score means in each inclusion phase
Standardized Math Scores
Table 13 below shows the means, standard deviations, and Ns of math scores for
each school size within each grade level, within the three phases of inclusion.
Table 13. Descriptive statistics for standardized math scores
Grade Level School Size Mean SD N
Small 71.42 4.17 23
Medium 72.99 5.09 35
Large 75.29 4.83 33
X-Large 69.85 5.37 24
Elementary
Total 72.68 5.24 115
Small 73.68 3.40 32
Medium 70.54 5.72 22
Large 72.08 5.30 34
Pre-inclusion Phase
Junior High
X-Large 70.25 5.52 31
Follow up Implementation Pre inclusion
Inclusion Phase
87.50
85.00
82.50
80.00
77.50
Me
an
Re
ad
ing
Sc
ore
s
4 3 2 1
school size = sm
= md
= lg
= xl
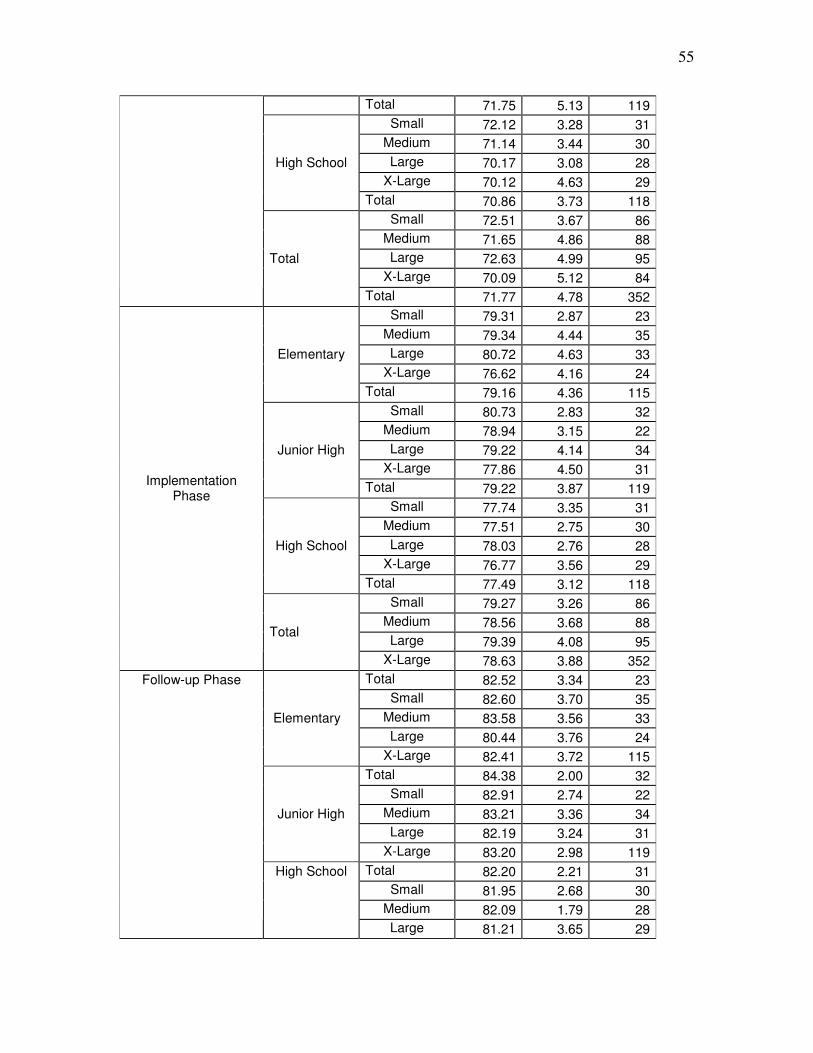
55
Total 71.75 5.13 119
Small 72.12 3.28 31
Medium 71.14 3.44 30
Large 70.17 3.08 28
X-Large 70.12 4.63 29
High School
Total 70.86 3.73 118
Small 72.51 3.67 86
Medium 71.65 4.86 88
Large 72.63 4.99 95
X-Large 70.09 5.12 84
Total
Total 71.77 4.78 352
Small 79.31 2.87 23
Medium 79.34 4.44 35
Large 80.72 4.63 33
X-Large 76.62 4.16 24
Elementary
Total 79.16 4.36 115
Small 80.73 2.83 32
Medium 78.94 3.15 22
Large 79.22 4.14 34
X-Large 77.86 4.50 31
Junior High
Total 79.22 3.87 119
Small 77.74 3.35 31
Medium 77.51 2.75 30
Large 78.03 2.76 28
X-Large 76.77 3.56 29
High School
Total 77.49 3.12 118
Small 79.27 3.26 86
Medium 78.56 3.68 88
Large 79.39 4.08 95
Implementation Phase
Total
X-Large 78.63 3.88 352
Total 82.52 3.34 23
Small 82.60 3.70 35
Medium 83.58 3.56 33
Large 80.44 3.76 24
Elementary
X-Large 82.41 3.72 115
Total 84.38 2.00 32
Small 82.91 2.74 22
Medium 83.21 3.36 34
Large 82.19 3.24 31
Junior High
X-Large 83.20 2.98 119
Total 82.20 2.21 31
Small 81.95 2.68 30
Medium 82.09 1.79 28
Follow-up Phase
High School
Large 81.21 3.65 29

56
X-Large 81.84 2.68 118
Total 83.09 2.66 86
Small 82.41 3.15 88
Medium 83.01 3.09 95
Large 81.35 3.57 84
Total
X-Large 82.50 3.19 352
Differences among the means depicted in Table 13 were tested with the mixed
model ANOVA and the statistically significant relationships between math scores and the
factors were plotted graphically (Figures 5, 6, and 7). Table 14 shows the ANOVA
findings for math scores, including the sources of the effects, F-ratios, degrees of
freedom, p-values, effect sizes (Eta-squared), and the observed power of the tests. The
effect size for Inclusion Phase (Eta-squared = .90) is large, with a maximum observed
power of 1.00, indicating that math-score means differed significantly among inclusion
phases, i.e. 71.77 for Pre-inclusion, 78.63 for Implementation, and 82.50 for Follow-up.
In summary, standardized math scores varied significantly (1) across inclusion phases,
F(2, 352) = 2966.79, p < .01, (2) across inclusion phases x grade level, F(4, 352) = 6.97,
p < .01, and (3) across inclusion phases x grade level x school size, F(12, 352) = 3.09, p <
.01. No significance was found across inclusion phases x school size.
Table 14. Multivariate tests of standardized math scores
Source of Effect df F η2 p Power
a
Inclusion Phase 2 2966.79 .90 <.01 1.00
Grade Levels 2 4.57 .03 .01 .76
School Sizes 3 6.77 .06 <.01 .98
Inclusion Phase * Grade Levels 4 6.97 .04 <.01 .99
Inclusion Phase * School Sizes 6 .75 .01 .61 .30
Grade Levels * School Sizes 6 2.16 .05 .04 .77
Phase * Levels * Sizes 12 3.09 .05 <.01 .99 aComputed using alpha = .05

57
Post hoc comparisons by grade level (Table 15) showed that significant variance
in math scores occurred between high school and the other two grade levels, yet no
significance was found between elementary and junior high schools (p < .05).
Table 15. Post hoc math scores by grade level
Grade Level Grade Level p 95% Confidence Interval
Lower Bound Upper Bound
junior high .95 -.88 .93 elementary
high school <.01a .41 2.23
Junior high elementary .95 -.93 .88
high school .01a .39 2.19
elementary <.01a -2.22 -.41 high school
junior high .01a -2.19 -.39
ap<.05
The post hoc comparison by school size (Table 16) showed that significant variance in
math scores was between extra large schools and all others with no significant variance
between small, medium, and large schools (p < .05).
Table 16. Post hoc math scores by school size
School Size School Size p 95% Confidence Interval
Lower Bound Upper Bound
2 .20 -.36 1.75
3 .92 -1.08 .98 1
4 <.01a 1.04 3.17
1 .20 -1.75 .36
3 .16 -1.77 .28 2
4 .01a .35 2.47
1 .92 -.98 1.08
2 .16 -.28 1.77 3
4 <.01a 1.12 3.19
1 <.01a -3.17 -1.04
2 .01a -2.47 -.35 4
3 <.01a -3.19 -1.12
a p<.05
Figures 5, 6, and 7 show how math scores varied among school sizes within
inclusion phases and grade levels.

58
Figure 5. Elementary school math score means in each inclusion phase
Follow up Implementation Pre inclusion
Inclusion Phase
82.50
80.00
77.50
75.00
72.50
70.00
Me
an
Ma
th S
co
res
4 3 2 1
school size = sm
= md
= lg
= xl

59
Figure 6. Middle school math score means in each inclusion phase
Follow up Implementation Pre inclusion
Inclusion Phase
84.00
82.00
80.00
78.00
76.00
74.00
72.00
70.00
Me
an
Ma
th S
co
res
4 3 2 1
school size = sm
= md
= lg
= xl

60
Figure 7. High school math score means in each inclusion phase
Discipline-count Ratios
Discipline count ratios, the number of discipline counts/number of total students,
were computed used in order to factor out school size; these ratios were then used to
describe behavior. Table 18 below shows the means, standard deviations, and Ns for
discipline-count ratios for each school size within the three school grade levels, within
the Implementation and Follow-up phases of inclusion. Differences among the means
depicted in Table 17 were tested with a mixed model ANOVA.
Table 17. Descriptive statistics for discipline-count ratio
Grade Level School Size Mean SD N
Small .12 .21 24 Implementation Phase
Elementary
Medium .06 .07 36
Follow up Implementation Pre inclusion
Inclusion Phase
82.00
80.00
78.00
76.00
74.00
72.00
70.00
Me
an
Ma
th S
co
res
4 3 2 1
school size = sm
= md
= lg
= xl
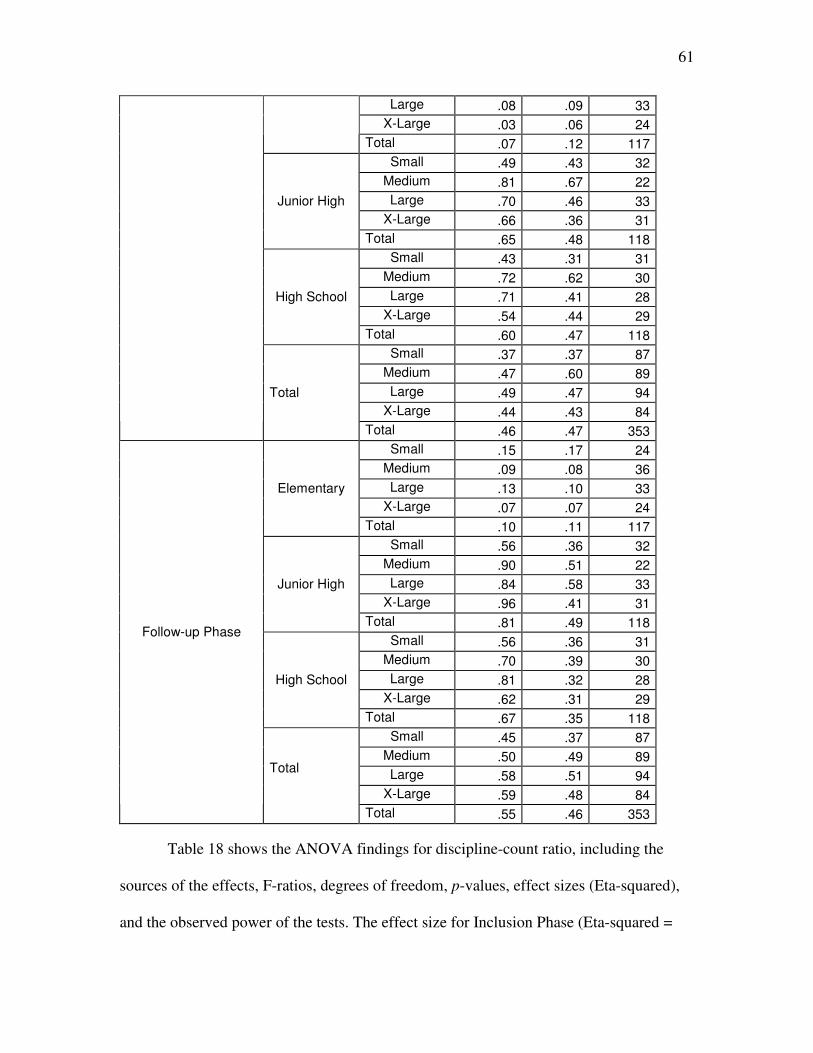
61
Large .08 .09 33
X-Large .03 .06 24
Total .07 .12 117
Small .49 .43 32
Medium .81 .67 22
Large .70 .46 33
X-Large .66 .36 31
Junior High
Total .65 .48 118
Small .43 .31 31
Medium .72 .62 30
Large .71 .41 28
X-Large .54 .44 29
High School
Total .60 .47 118
Small .37 .37 87
Medium .47 .60 89
Large .49 .47 94
X-Large .44 .43 84
Total
Total .46 .47 353
Small .15 .17 24
Medium .09 .08 36
Large .13 .10 33
X-Large .07 .07 24
Elementary
Total .10 .11 117
Small .56 .36 32
Medium .90 .51 22
Large .84 .58 33
X-Large .96 .41 31
Junior High
Total .81 .49 118
Small .56 .36 31
Medium .70 .39 30
Large .81 .32 28
X-Large .62 .31 29
High School
Total .67 .35 118
Small .45 .37 87
Medium .50 .49 89
Large .58 .51 94
X-Large .59 .48 84
Follow-up Phase
Total
Total .55 .46 353
Table 18 shows the ANOVA findings for discipline-count ratio, including the
sources of the effects, F-ratios, degrees of freedom, p-values, effect sizes (Eta-squared),
and the observed power of the tests. The effect size for Inclusion Phase (Eta-squared =
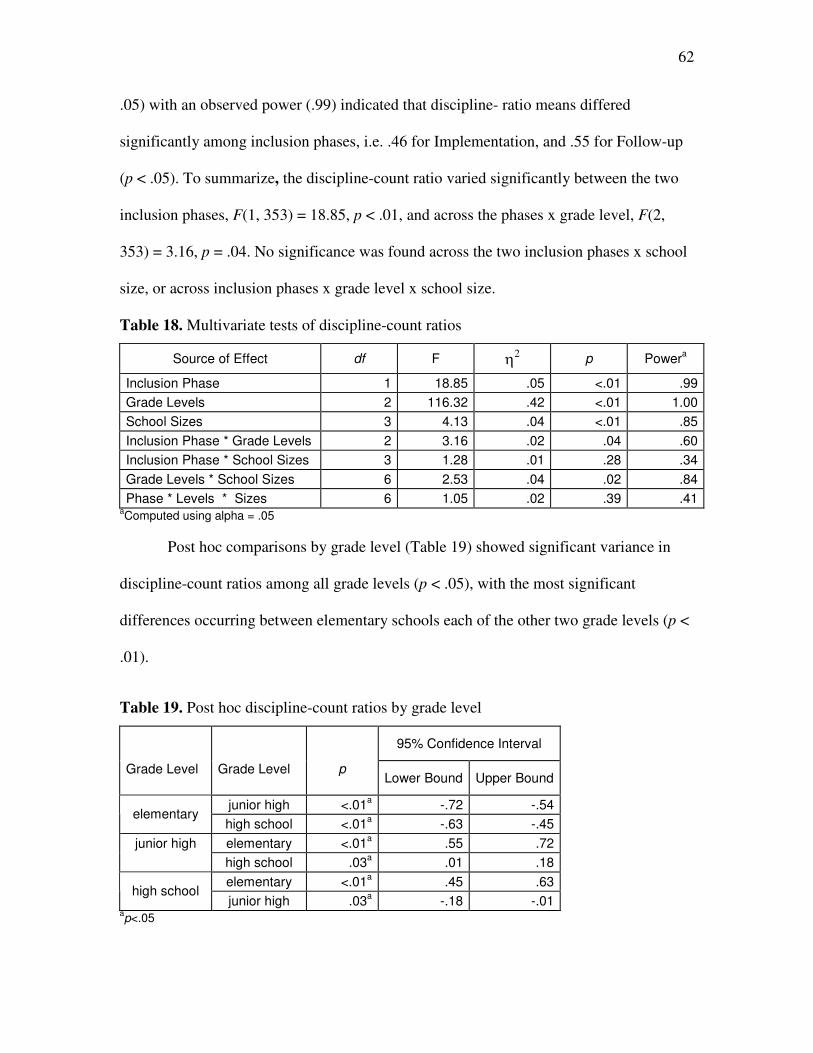
62
.05) with an observed power (.99) indicated that discipline- ratio means differed
significantly among inclusion phases, i.e. .46 for Implementation, and .55 for Follow-up
(p < .05). To summarize, the discipline-count ratio varied significantly between the two
inclusion phases, F(1, 353) = 18.85, p < .01, and across the phases x grade level, F(2,
353) = 3.16, p = .04. No significance was found across the two inclusion phases x school
size, or across inclusion phases x grade level x school size.
Table 18. Multivariate tests of discipline-count ratios
Source of Effect df F η2 p Power
a
Inclusion Phase 1 18.85 .05 <.01 .99
Grade Levels 2 116.32 .42 <.01 1.00
School Sizes 3 4.13 .04 <.01 .85
Inclusion Phase * Grade Levels 2 3.16 .02 .04 .60
Inclusion Phase * School Sizes 3 1.28 .01 .28 .34
Grade Levels * School Sizes 6 2.53 .04 .02 .84
Phase * Levels * Sizes 6 1.05 .02 .39 .41 aComputed using alpha = .05
Post hoc comparisons by grade level (Table 19) showed significant variance in
discipline-count ratios among all grade levels (p < .05), with the most significant
differences occurring between elementary schools each of the other two grade levels (p <
.01).
Table 19. Post hoc discipline-count ratios by grade level
95% Confidence Interval
Grade Level Grade Level p Lower Bound Upper Bound
junior high <.01a -.72 -.54
elementary high school <.01
a -.63 -.45
junior high elementary <.01a .55 .72
high school .03a .01 .18
elementary <.01a .45 .63
high school junior high .03
a -.18 -.01
ap<.05

63
The post hoc comparrisons by school size reported in Table 20 showed significant
variance occurring between small schools and large schools, and between small schools
and extra large schools (p ≤ .05).
Table 20. Post hoc discipline-count ratios by school size
95% Confidence Interval
School Size
School Size
p Lower Bound Upper Bound
medium .07 -.19 .01
large .02a -.21 -.02 Small
extra large .05a -.20 -.00
small .07 -.01 .19
large .69 -.12 .08 Medium
extra large .90 -.11 .09
small .02a .02 .21
medium .69 -.08 .12 Large
extra large .79 -.08 .11
small .05a .00 .20
medium .90 -.10 .11 extra large
large .79 -.11 .08 ap ≤.05
Figures 8, 9, and 10 show how discipline-count ratio varied between grade levels
within two inclusion phases and school sizes.

64
Figure 8. Elementary school discipline-count ratio means in the implementation and
follow-up phases
Follow up Implementation
Inclusion Phase
.14
.12
.10
.08
.06
.04
.02
Me
an
Dis
cip
lin
e-c
ou
nt
Ra
tio
4 3 2 1
school size = sm
= md = lg
= xl
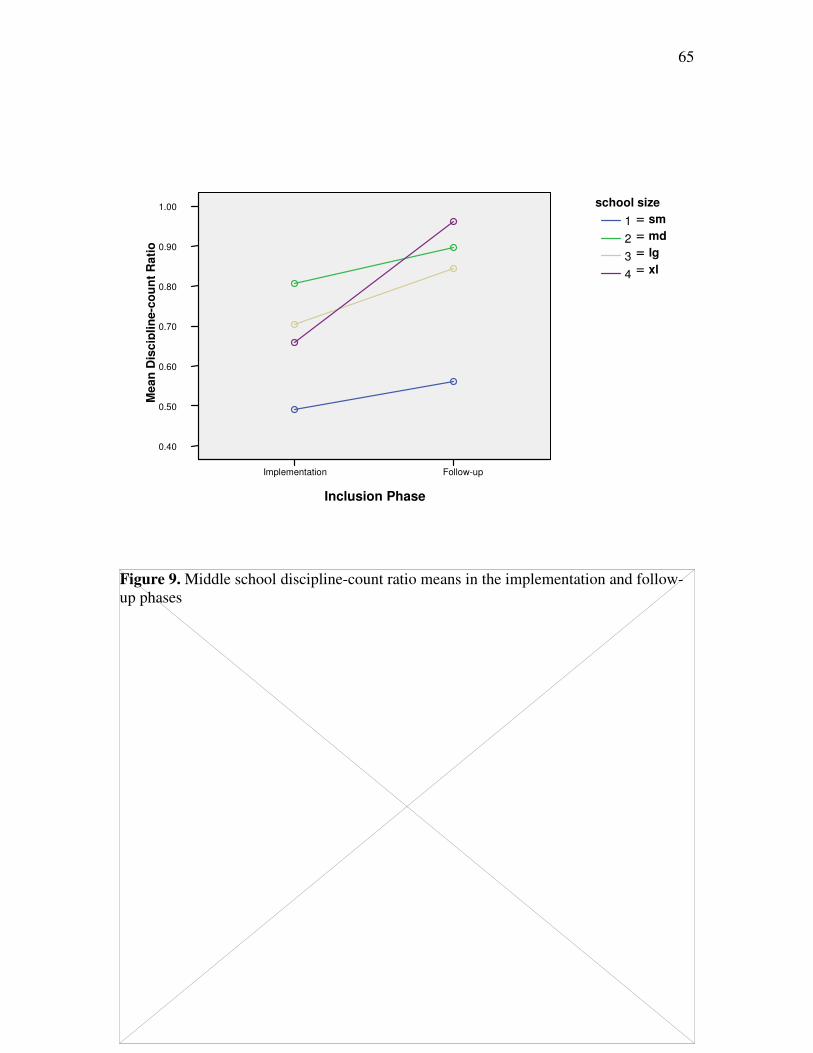
65
Figure 9. Middle school discipline-count ratio means in the implementation and follow-
up phases
Follow-up Implementation
Inclusion Phase
1.00
0.90
0.80
0.70
0.60
0.50
0.40
Me
an
Dis
cip
lin
e-c
ou
nt
Ra
tio
4 3 2 1
school size
= sm = md = lg = xl

66
Figure 10. High school discipline-count ratio means in the implementation and follow-up
phases
Graduate-number Ratios
Graduate-number ratios, the number of high school graduates/numbers of total
students, were used to factor out school size. Table 21 below shows the means, standard
deviations, and Ns for the high school graduate ratios for the four school sizes within the
three phases of inclusion.
Table 21. High school graduate-number ratio descriptive statistics
School Size M SD N
Small .17 .07 30
Medium .18 .03 30
Pre Inclusion Phase Large .18 .03 27
X-large .18 .03 29
Follow-up Implementation
Inclusion Phase
0.80
0.70
0.60
0.50
0.40
M
ea
n D
iscip
lin
e-c
ou
nt
Ra
tio
e 4
3 2 1
school size = sm
= md
= lg
= xl
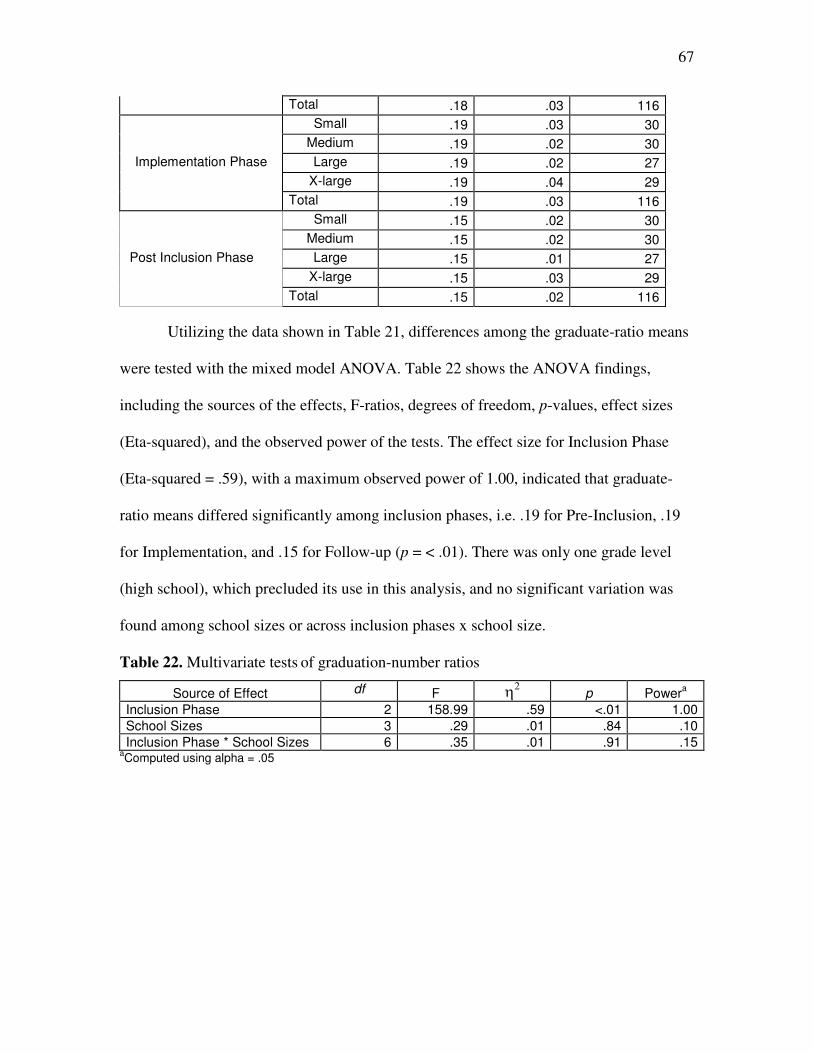
67
Total .18 .03 116
Small .19 .03 30
Medium .19 .02 30
Implementation Phase Large .19 .02 27
X-large .19 .04 29
Total .19 .03 116
Small .15 .02 30
Medium .15 .02 30
Post Inclusion Phase Large .15 .01 27
X-large .15 .03 29
Total .15 .02 116
Utilizing the data shown in Table 21, differences among the graduate-ratio means
were tested with the mixed model ANOVA. Table 22 shows the ANOVA findings,
including the sources of the effects, F-ratios, degrees of freedom, p-values, effect sizes
(Eta-squared), and the observed power of the tests. The effect size for Inclusion Phase
(Eta-squared = .59), with a maximum observed power of 1.00, indicated that graduate-
ratio means differed significantly among inclusion phases, i.e. .19 for Pre-Inclusion, .19
for Implementation, and .15 for Follow-up (p = < .01). There was only one grade level
(high school), which precluded its use in this analysis, and no significant variation was
found among school sizes or across inclusion phases x school size.
Table 22. Multivariate tests of graduation-number ratios
Source of Effect df F η2 p Power
a
Inclusion Phase 2 158.99 .59 <.01 1.00
School Sizes 3 .29 .01 .84 .10
Inclusion Phase * School Sizes 6 .35 .01 .91 .15 aComputed using alpha = .05

68
Figure 11. High school graduation-number ratio means
Dropout Ratios
Dropout ratios, the number of high school dropouts/number of total students, were
used in order to factor out school size. Table 23 below shows the means, standard
deviations, and Ns for dropout ratios for the four school sizes within the three phases of
inclusion.
Table 23. Dropout-ratio descriptive statistics
School Size M SD N
Pre-Inclusion Phase Small .02 .01 31
Medium .03 .02 30
Large .03 .02 28
X-large .03 .02 29
Total .03 .02 118
Small .01 .01 31
Follow-up Implementation Pre-inclusion
Inclusion Phase
0.20
0.18
0.16
Me
an
Gra
du
ate
-nu
mb
er R
atio
4 3 2 1
school size = sm
= md
= lg
= xl
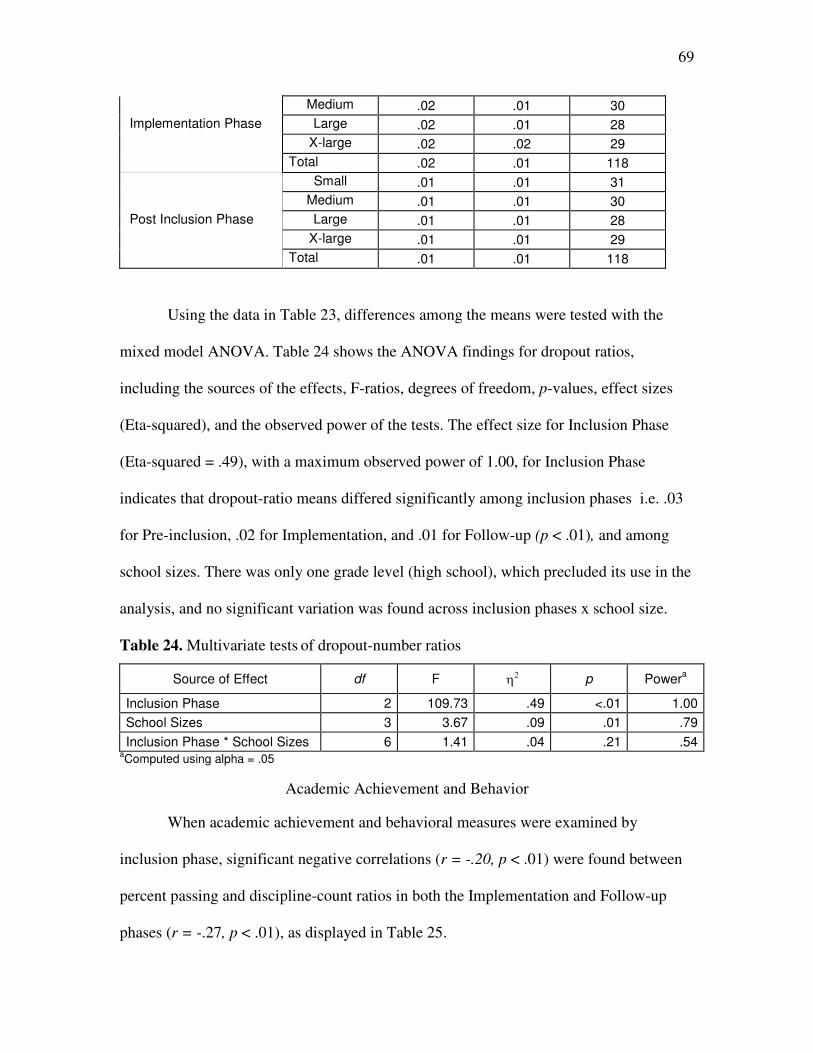
69
Medium .02 .01 30
Implementation Phase Large .02 .01 28
X-large .02 .02 29
Total .02 .01 118
Small .01 .01 31
Medium .01 .01 30
Post Inclusion Phase Large .01 .01 28
X-large .01 .01 29
Total .01 .01 118
Using the data in Table 23, differences among the means were tested with the
mixed model ANOVA. Table 24 shows the ANOVA findings for dropout ratios,
including the sources of the effects, F-ratios, degrees of freedom, p-values, effect sizes
(Eta-squared), and the observed power of the tests. The effect size for Inclusion Phase
(Eta-squared = .49), with a maximum observed power of 1.00, for Inclusion Phase
indicates that dropout-ratio means differed significantly among inclusion phases i.e. .03
for Pre-inclusion, .02 for Implementation, and .01 for Follow-up (p < .01), and among
school sizes. There was only one grade level (high school), which precluded its use in the
analysis, and no significant variation was found across inclusion phases x school size.
Table 24. Multivariate tests of dropout-number ratios
Source of Effect df F η2 p Power
a
Inclusion Phase 2 109.73 .49 <.01 1.00
School Sizes 3 3.67 .09 .01 .79
Inclusion Phase * School Sizes 6 1.41 .04 .21 .54 aComputed using alpha = .05
Academic Achievement and Behavior
When academic achievement and behavioral measures were examined by
inclusion phase, significant negative correlations (r = -.20, p < .01) were found between
percent passing and discipline-count ratios in both the Implementation and Follow-up
phases (r = -.27, p < .01), as displayed in Table 25.
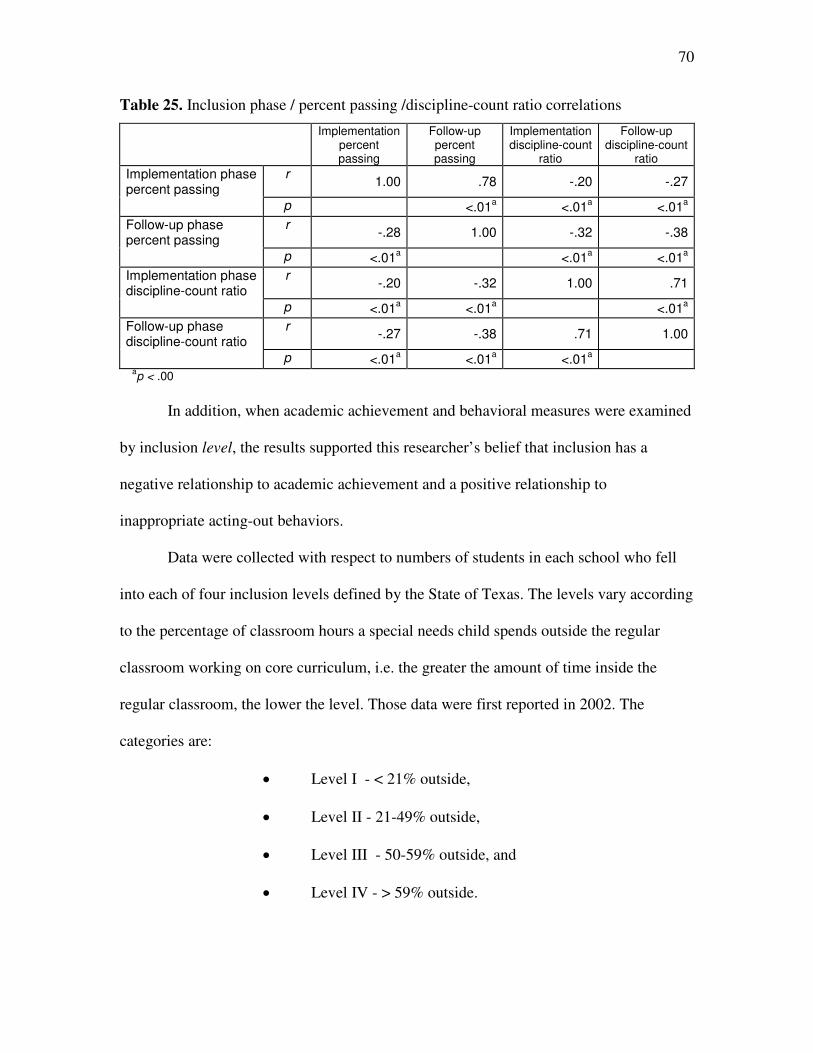
70
Table 25. Inclusion phase / percent passing /discipline-count ratio correlations
Implementation percent passing
Follow-up percent passing
Implementation discipline-count
ratio
Follow-up discipline-count
ratio
Implementation phase percent passing
r 1.00 .78 -.20 -.27
p <.01a <.01
a <.01
a
Follow-up phase percent passing
r -.28 1.00 -.32 -.38
p <.01a <.01
a <.01
a
Implementation phase discipline-count ratio
r -.20 -.32 1.00 .71
p <.01a <.01
a <.01
a
Follow-up phase discipline-count ratio
r -.27 -.38 .71 1.00
p <.01a <.01
a <.01
a
ap < .00
In addition, when academic achievement and behavioral measures were examined
by inclusion level, the results supported this researcher’s belief that inclusion has a
negative relationship to academic achievement and a positive relationship to
inappropriate acting-out behaviors.
Data were collected with respect to numbers of students in each school who fell
into each of four inclusion levels defined by the State of Texas. The levels vary according
to the percentage of classroom hours a special needs child spends outside the regular
classroom working on core curriculum, i.e. the greater the amount of time inside the
regular classroom, the lower the level. Those data were first reported in 2002. The
categories are:
• Level I - < 21% outside,
• Level II - 21-49% outside,
• Level III - 50-59% outside, and
• Level IV - > 59% outside.

71
An inclusion-level ratio (number of students in each level/total number of
students) was computed to adjust for school size. As the number of special education
students included in the general classroom increased, the percent of students passing
decreased as indicated in Table 26. Significant negative correlations between Follow-up
percent passing and inclusion-level ratio were found for all three reporting years (r = -.28,
p < .01 in 2002; r = -.27, p < .01 in 2003; and r = -.27, p < .01 in 2004).
Table 26. Percent passing / inclusion-level ratio correlations
Follow-up percent passing
Inclusion level ratio in
2002
Inclusion level ratio in
2003
Inclusion level ratio in
2004
Follow-up percent R 1.00 -.28 -.27 -.27
passing P <.01a <.01
a <.01
a
Inclusion level ratio R -.28 1.00 .83 .71
In 2002 P <.01a <.01
a <.01
a
Inclusion level ratio R -.27 .83 1.00 .85
In 2003 P <.01a <.01
a <.01
a
Inclusion level ratio R -.70 .72 .85 1.00
In 2004 P <.01a <.01
a <.01
a
ap <.01
Table 27 shows the significant positive correlations (r = .23, p < .01 in 2002; r =
.24, p < .01 in 2003; and r = .26, p < .01 in 2004) between discipline-count ratio and
inclusion-level ratio. As the number of students included in the general classroom
increased, so did the undesirable behavior.
Table 27. Discipline-count-ratio/inclusion by year correlations
Follow-up discipline-count ratio
2002 2003 2004
Follow-up discipline- r 1.00 .23 .24 .26
count ratio p <.01a <.01
a <.01
a
2002 r .23 1.00 .82 .72
p <.01a <.01
a <.01
a
2003 r .24 .83 1.00 .85
p <.01a <.01
a <.01
a
2004 r .26 .72 .85 1.00
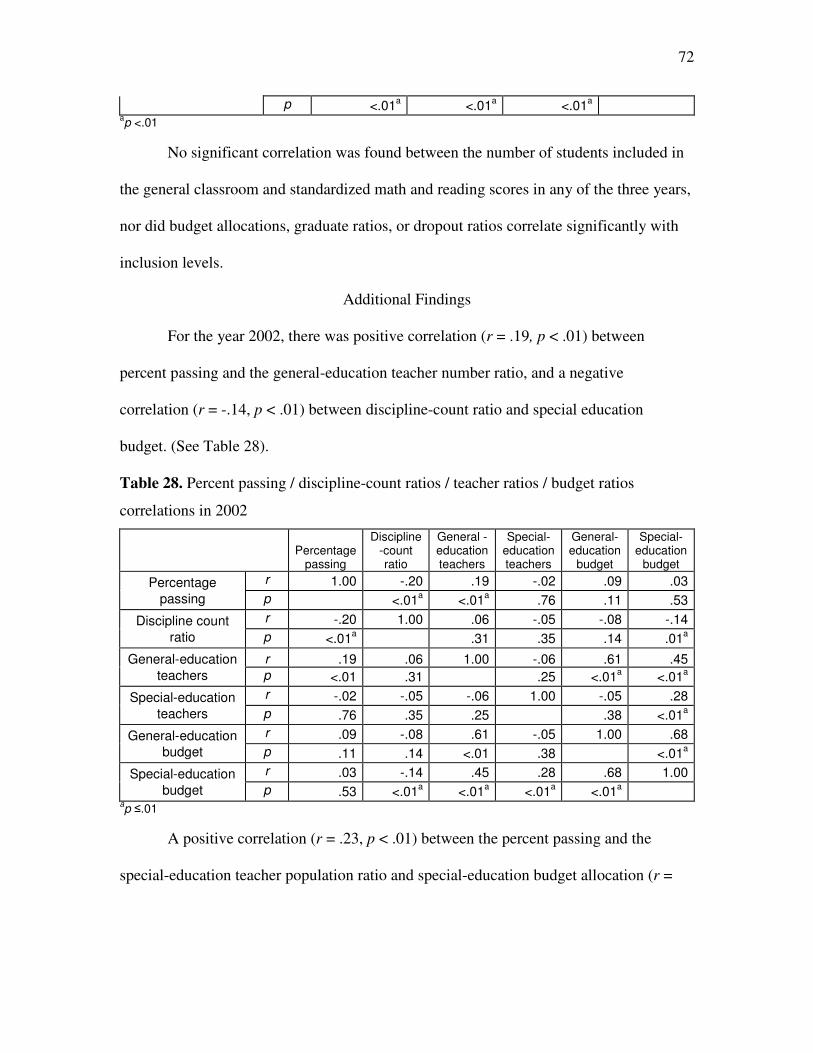
72
p <.01a <.01
a <.01
a
ap <.01
No significant correlation was found between the number of students included in
the general classroom and standardized math and reading scores in any of the three years,
nor did budget allocations, graduate ratios, or dropout ratios correlate significantly with
inclusion levels.
Additional Findings
For the year 2002, there was positive correlation (r = .19, p < .01) between
percent passing and the general-education teacher number ratio, and a negative
correlation (r = -.14, p < .01) between discipline-count ratio and special education
budget. (See Table 28).
Table 28. Percent passing / discipline-count ratios / teacher ratios / budget ratios
correlations in 2002
Percentage
passing
Discipline-count ratio
General -education teachers
Special-education teachers
General-education
budget
Special-education
budget
Percentage r 1.00 -.20 .19 -.02 .09 .03
passing p <.01a <.01
a .76 .11 .53
Discipline count r -.20 1.00 .06 -.05 -.08 -.14
ratio p <.01a .31 .35 .14 .01
a
General-education r .19 .06 1.00 -.06 .61 .45
teachers p <.01 .31 .25 <.01a <.01
a
Special-education r -.02 -.05 -.06 1.00 -.05 .28
teachers p .76 .35 .25 .38 <.01a
General-education r .09 -.08 .61 -.05 1.00 .68
budget p .11 .14 <.01 .38 <.01a
Special-education r .03 -.14 .45 .28 .68 1.00
budget p .53 <.01a <.01
a <.01
a <.01
a
ap ≤.01
A positive correlation (r = .23, p < .01) between the percent passing and the
special-education teacher population ratio and special-education budget allocation (r =
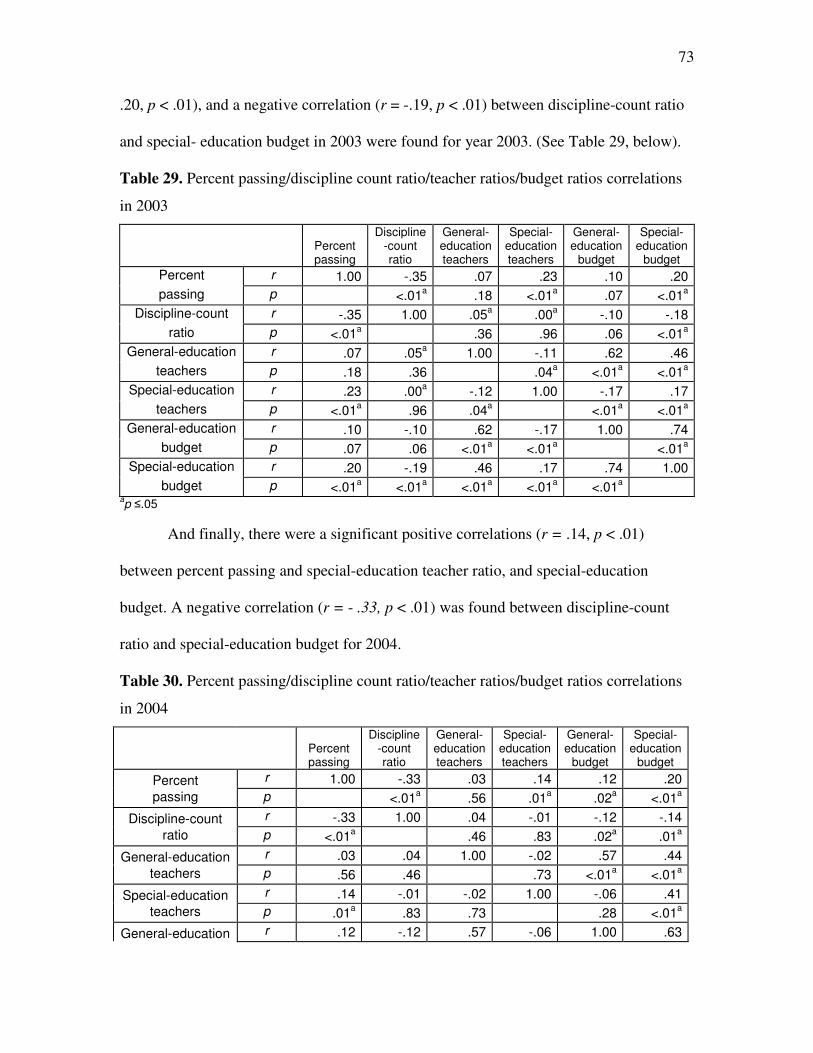
73
.20, p < .01), and a negative correlation (r = -.19, p < .01) between discipline-count ratio
and special- education budget in 2003 were found for year 2003. (See Table 29, below).
Table 29. Percent passing/discipline count ratio/teacher ratios/budget ratios correlations
in 2003
Percent passing
Discipline-count ratio
General-education teachers
Special-education teachers
General-education
budget
Special-education
budget
Percent r 1.00 -.35 .07 .23 .10 .20
passing p <.01a .18 <.01
a .07 <.01
a
Discipline-count r -.35 1.00 .05a .00
a -.10 -.18
ratio p <.01a .36 .96 .06 <.01
a
General-education r .07 .05a 1.00 -.11 .62 .46
teachers p .18 .36 .04a <.01
a <.01
a
Special-education r .23 .00a -.12 1.00 -.17 .17
teachers p <.01a .96 .04
a <.01
a <.01
a
General-education r .10 -.10 .62 -.17 1.00 .74
budget p .07 .06 <.01a <.01
a <.01
a
Special-education r .20 -.19 .46 .17 .74 1.00
budget p <.01a <.01
a <.01
a <.01
a <.01
a
ap ≤.05
And finally, there were a significant positive correlations (r = .14, p < .01)
between percent passing and special-education teacher ratio, and special-education
budget. A negative correlation (r = - .33, p < .01) was found between discipline-count
ratio and special-education budget for 2004.
Table 30. Percent passing/discipline count ratio/teacher ratios/budget ratios correlations
in 2004
Percent passing
Discipline-count ratio
General-education teachers
Special-education teachers
General-education
budget
Special-education
budget
Percent r 1.00 -.33 .03 .14 .12 .20
passing p <.01a .56 .01
a .02
a <.01
a
Discipline-count r -.33 1.00 .04 -.01 -.12 -.14
ratio p <.01a .46 .83 .02
a .01
a
General-education r .03 .04 1.00 -.02 .57 .44
teachers p .56 .46 .73 <.01a <.01
a
Special-education r .14 -.01 -.02 1.00 -.06 .41
teachers p .01a .83 .73 .28 <.01
a
General-education r .12 -.12 .57 -.06 1.00 .63

74
budget p .02a .02
a .00
a .28 .00
a
Special-education r .20 -.14 .44 .41 .63 1.00
budget p .00a .01
a .00
a .00
a .00
a
ap <.05
75
Chapter 5
Summary
The findings of this study supported many of the speculations and findings of past
research. Standardized math and reading scores did increase significantly throughout the
implementation and follow-up phases of inclusion. These findings are consistent with the
Weiner (2003) and McDonnell et al. (2003) positions that academic scores increase with
the implementation of inclusion practices. They do not support the hypothesis of this
study that standardized scores would be negatively impacted by inclusion.
However, a closer examination of the reading and math scores revealed that in
elementary and junior high schools a significant increase occurred only during the
Implementation Phase; there were no significant increases in standardized scores during
the Follow-up Phase. In high schools, the percentage of students passing decreased
significantly in the follow-up years.
The research hypothesis was supported when the percentage of students passing,
rather than standard scores, was examined vis a vis inclusion phases and in relation to the
amount of time special-needs children spent in the general classroom (inclusion level).
With respect to inclusion phases, there were significant negative correlations between
academic achievement and behavior in both the Implementation and the Follow-up
Phases (p <.01). Again, in high schools, the percentage of students passing decreased
significantly in the Follow-up phase. Testing percentage of students passing with
Inclusion Levels, significant negative correlations, again at the p <.01 level, were found:

76
the more time special-needs students spent in the general classroom, the lower the percent
of students who passed the standardized tests.
Weiner (2003) suggested that teachers were morally obligated to commit
academic achievement to all students. Tyler-Wood et al. (2004) reported that high
curriculum demands led to behavioral problems; they posited that behaviorally
challenged students need both academic and nonacademic support.
In the present study, behavioral counts increased significantly across the final two
phases, adding additional support to the research hypothesis. In addition, significant
correlations were found between inclusion level and discipline counts; as the time special
needs students spent in the general classroom increased, behavioral counts increased. In
high schools, discipline counts increased significantly with increases in inclusion level,
and as they increased, both the percent of students passing and the numbers of those
graduating significantly decreased.
Finally, a significant negative correlation (p < .01) was found between discipline
counts and the percent of the school budget allotted to special education, as the special-
education budget decreased, discipline counts increased. However, no correlation was
found between discipline count and the number of special-education teachers. Evidence
of increased special-education budgets with no accompanying increase in special-
education teachers supports the Tyler-Wood et al. speculation that nonacademic support
is required for the behaviorally challenged student. Their argument is further supported
with the finding here that the percentage of students passing (academic achievement)
positively correlated (p < .01) with both teacher population and budget allocation: as

77
teacher population and budgets increased, the percent of students passing increased, as
well.
Stainback and Stainback (1996) recommended that all students, with or without
disabilities, be placed proportionally across all classrooms in public schools, but Dore et
al. (2002) concluded that the relative absence of social integration in the inclusive
classroom resulted in insufficiently addressing the requirements of adolescents with
special needs. Flannery and Lewis-Palmer (2003) suggested that children with different
emotional needs respond differently to a given intervention technique and “Attitudes of
pre-school teachers” (2003) found that teachers not trained in working with special needs
students have a negative attitude towards these students. Kauffman, Lloyd, and Riedel
(1995) summarized that inclusion required systematic interventions. These researchers all
theorized that inclusion might have a negative affect on behavior. The significant
increase in discipline counts during the Follow-up Phase reported here supported their
theories.
At the outset, this researcher speculated that it was unrealistic to expect a teacher
to be able to address the variety of students’ needs in an inclusive classroom and that in
fact, the teacher would be forced to address the most severe issue first. Previous research
showed that teachers in an inclusive classroom spent less time in instructional activities
(Boudah et al, 1997). Flannery and Lewis-Palmer (2003) found that the major problem
behaviors in schools were disruption, inappropriate language, harassment, theft, defiance,
and fighting. A teacher cannot be expected to efficiently, appropriately, and effectively
address the myriad of acting-out behaviors, because children at different emotional levels
78
respond differently to any given intervention technique. The findings in this study
support these arguments.
Conclusions
The basic question in this research was “how does inclusion impact academic
achievement and behavior referrals?” Although this study cannot definitively claim
causality, it does offer strong evidence that inclusion, as it has been implemented in the
State of Texas, may have been a contributing factor to lower academic achievement and
increased inappropriate student behavior.
The increase in standardized test scores might be attributed to anecdotal evidence
that an ever-increasing amount of classroom time has been spent “teaching to the test”
(TAKS), and the emphasis placed on raising scores has raised teacher and student anxiety
levels as well. As of this writing, there is a move in the Texas legislature to do away with
the TAKS completely.
The significant decrease in percent of high school students passing in the last
phase of this study leads questions about the reason for such a decline. The greatest
decrease was found in extra-large high schools, and a trend of lowered increases was
found in extra-large elementary and junior high schools. The sample schools came from
all regions of the state; metropolitan and rural areas, as well as a vast array of ethnicity
and socio-economic levels were represented. Given the fair representation of region,
ethnicity, and financial viability, it may be assumed that school size was the dominant
factor in the results for extra-large schools. Perhaps greater numbers of students present
greater educational challenges for inclusion.

79
Post hoc results revealed that the greatest variance for reading and math scores
was accounted for in the elementary schools. This may be a result of the challenge of
initiating reading and math skills in these early developmental years paired with the
challenges inherent in the inclusive classroom: stress, distraction, etc. The fact that
percent of students passing was negatively correlated with behavioral referrals and
inclusion level might also be attributed to such challenges, as might the positive
correlations between behavioral referrals and inclusion level.
During the last phase of this study, there was a significant decline in the number
of high school students who graduated, but there was also a decline in the number of high
school dropouts. The fact that dropout numbers are not consistent with the findings
associated with discipline counts and graduation numbers leads to the conclusion that
there were reporting anomalies. Given the consistent findings that behavior referrals
increased while graduate numbers and percent passing decreased (objective measures
based on count), it is believed that the dropout numbers (subjective measures based on
self-reports) were not accurate. It is possible that students who did not complete four
years of high school failed to report that they dropped out, or erroneously reported that
they moved or were being home schooled, and therefore, they were not classified in the
TEA system as dropouts.
The negative correlations between academic achievement and behavior reported
herein clearly reveal the need for further research into current educational practices.
Stainback and Stainback (1996) argued that inclusion was not a matter of research but
instead a moral obligation, “a better way to live”. Cook et al. (1999) stated that special
education teachers were concerned about protecting the resources devoted to special

80
needs students. This current research project found a significant negative correlation
between special education budget and behavioral referrals. Petch-Hogan and Haggard
(1999) reported “Whether inclusion becomes a part of the special education continuum
for placement of students with disabilities or initiates a Unitarian school system,
educators must rethink, restructure, and reorganize the need for there present delivery
system to benefit students” (p. 4). Hagan-Burke and Jefferson (2002) recommended the
development of measurable goals and objectives so that the effectiveness of inclusion
may be better evaluated. Although it may initially appear that academic scores in reading
and math significantly improved, a more in-depth examination of the percentage of
students passing and behavioral referrals reveals an obvious downward trend. This
downward trend suggest that we take heed to Cook et al (1999), Petch-Hogan (1999) and
Haggard, and Hagan-Burke and Jefferson (2002).
Recommendations
Given these findings, it is important to examine current educational mandates and
evaluate the true effectiveness of these policies. LRE gives special-needs students the
right to be educated to the maximum extent appropriate with students who are not
disabled. Without proper research-based programs, it is not possible to determine
appropriate educational approaches for special-needs students. Nagalieri and Kaufman
(2000) suggested that the current educational tools were not adequate to properly evaluate
and place special needs students. REI proponents argued that pullout programs were
removing special-needs students from their peers, a practice that led to segregation. Yet,
Tapasak and Walther-Thomas (1999) found that secondary special needs students rated
themselves in a negative manner after being placed in an inclusive classroom. However,

81
Public Law 99-457 and Public Law 101-476 mandated that educators integrate
programming for students with disabilities into the regular classroom. That legislation
transformed mainstreaming into inclusion with absolutely no research to support the
change. This current research validates the importance of research before
implementation.
In 1972, April was designated “Autism Awareness Month” and in April of 2006,
Fox News reported, “the increase in diagnosed cases of autism will draw more kids into
special-education classes at earlier ages.” In April 2007, the Center for Disease Control
(CDC) reported “It is important that we treat common developmental disabilities, and
especially ASDs (autism spectrum disorders), as conditions of urgent public health
concern, do all we can to identify children’s learning needs, and start intervention as early
as possible to give all children the chance to reach their full potential.” Can this be
accomplished under the current mandate of inclusion? Time is short, and there is an ever-
increasing imperative for valid, research-based methods for educating these and other
special-needs children in the public school system.
Future research must be focused on special educational programs that have
proven to be effective and ways to expand on them. We have spent more than a decade
putting into practice an idea that had no empirical data to support its mandate. We can no
longer afford to place students in one-size-fits-all classrooms. Every child deserves
individualized attention in the form of research-based practices.
82
References
A guide to the admission, review and dismissal process. (2002). [Pamphlet]. Austin,
Texas: Division of Special Education Texas Education Agency.
Attitudes of pre-school teachers towards persons with disabilities. (2003). College
Student Journal, 4(37), 515-22.
Ayres, B. J., & Hedeen, D. L. (1996). Been there, done that, didn’t work alternative
solutions for behavioral problems. Educational Leadership, 53, 48-50.
Boudah, D. J., Schumacher, J. B., & Deshler, D. D. (1997). Collaborative instruction: is it
an effective option for inclusion in secondary classrooms? Learning Disability
Quarterly, 20, 293-316.
Brown, L., Nietupski, J., & Hamre-Nietupski, S. (1976). The criterion of ultimate
functioning and public school services for severely handicapped children. In M.
A. Thomas (ED.), Hey, don’t forget about me! Education’s investment in the
severely, profoundly, and multiply handicapped: A report (2-15). Reston, VA:
Council for Exceptional Children.
Cheney, D., & Muscott, H. S. (1996). Preventing school failure for students with
emotional and behavioral disabilities through responsible inclusion. Preventing
School Failure, 40, 109-116.
Cook, B. G., Semmel, M. I., & Gerber, M. M. (1999). Attitudes of principals and special
education teachers toward inclusion of students with mild disabilities: Critical
differences of opinion. Remedial and Special Education, 20(4), 199-207.
83
Daniel, L., & King, D. (1997). Impact of inclusion on academic achievement, student
behavior, and self-esteem, and parental attitudes. The Journal of Educational
Research, 91(2), 67-80.
Doran, H. C. (2003). Adding value to accountability. Educational Leadership, 3(61),
55-59.
Dore, R., Dion, E., Wagner, S., & Brunet, J. (2002). High school inclusion of adolescents
with mental retardation: A multiple case study. Education and Training in Mental
Retardation and Developmental Disabilities, 37(3), 253-261.
ED.gov. (n.d.). Retrieved June 28, 2005, from OSEP Sponsored Web Sites Web site:
http://www.ed.gov/print/parents/needs/speced/resources.html
Falvey, M. A. (1986). Community-based curriculum: Instructional strategies for students
with severe handicaps. Baltimore: Paul H. Brookes
Fisher, D., Frey, N., & Thousand, J. (2003). What do special educators need to know and
be prepared to do for inclusive schooling to work? Teachers Education and
Special Education, 26(1), 42-50.
Fisher, M. & Meyer, L. (2002). Development and social competence after two years for
students enrolled in inclusive and self-contained educational programs. Research
& Practice for Persons with Severe Disabilities, 27(3), 165-174.
Flannery, K., & Lewis-Palmer, T. (2003). A description of elementary classroom
discipline referral patterns. Preventing School Failure, 48(1), 18-26.
Fleming, D. (2005, November 1). Personal communication. Personal Interview presented
at Region VII.
84
Fredrickson, N., & Turner, J. (2003). Utilizing the classroom peer group to address
children’s social needs: An evaluation of the circle of friends intervention
approach. The journal of Special Education, 4(36), 234-245.
Green, S., & Salkind, N. (2003). Using SPSS for Windows and Macintosh (3rd ed.).
Upper Saddle River, New Jersey: Prentice Hall.
Hagan-Burke, S., & Jefferson, G. L. (2002). Using data to promote academic benefit for
included students with mild disabilities. Preventing School Failure, 46(3),
112-118.
Heiman,G. (2002). Research Methods in Psychology (3rd
ed.). New York, NY: Houghton
Mifflin.
Hochberg, S. (n.d.). Texas TAKS Tests. Retrieved July 2, 2005, from
http://www.scotthochberg.com/taas.html
Kauffman, J. M., Lloyd, J. W., & Riedel, T. M. (1995). Inclusion of all students with
emotional or behavioral disorders? Lets think again. Phi Delta Kappan, 76,
542-546.
Kisanji, J. (1999). Historical and theoretical basis of inclusive education. Presented in
Inclusive Education in Namibia: The Challenge for Teacher Education. Rossing
Foundation, Khomasdal, Windhoek, Namibia.
Klingner, J. K., Ahwee, S., Pilonieta, P., & Menendez, R. (2003). Barriers and facilitators
in scaling up research-based practices. Exceptional Children, 69(4), 411-429.

85
McDonnell, J., Thorson, N., Disher, S., Mathot-Buckner, C., Mendel, J., & Ray, L.,
(2003). The achievement of students with developmental disabilities and their
peers without disabilities in inclusive settings: an exploratory study. Education
and Treatment of Children, 26(3), 224-236.
Moore, M. (Ed.). (2003). The Basic Practice of Statistics (3rd
ed.). New York: W. H.
Freeman and Company.
Mostert, M. P. (1996). Interprofessional collaboration in schools: Benefits and barriers in
practice. Preventing School Failure, 40, 135-138.
Naglieri, J. A., & Kaufman, J. C. (2000). Understanding intelligence, giftedness and
creativity using the PASS theory. Roeper Review, 23(3), 151-156.
Palsha, S. A., & Wesley, P. W. (1998). Improving quality in early childhood
environments through on-site consultation. Topics in Early Childhood Special
Education, 4(18), 243-253.
Petch-Hogan, B., & Haggard, D. (1999). The inclusion debate continues. Kappa Delta Pi
Record, 35(3), 128-131.
Salend, S. J., & Duhaney, L. M. (1999). The impact of inclusion on students with and
without disabilities and their educators. Remedial and Special Education, 20(2),
114-126.
Santrock, J. W. (2002). Life-Span Development (8th
ed.). New York: Mcgraw Hill.
Stainback, S., & Stainback, W. (1996). Inclusion: A guide for educators. Baltimore, MD:
Brookes Publishing. (ERIC Document Reproduction Service No. ED461198)
86
Tapasak, R. C., & Walther-Thomas, C. S. (1999). Evaluation of the first year inclusion
program: Student perceptions and classroom performance. Remedial and Special
Education, 4(20), 216-225.
TEA. (n.d.). Retrieved June 28, 2005, from
http://www.tea.state.tx.us/student.assessment/reporting/index.html
Tyler-Wood, T., Cereijo, M., & Pemberton, J. (2004). Comparison of discipline referrals
for students with emotional/behavioral disorders under differing instructional
arrangements. Preventing School Failure, 48(4), 30-33.
Weiner, H. M. (2003). Effective inclusion professional development in the context of the
classroom. Teaching Exceptional Children, 35(6), 12-18.


![Acceleration and rotation in a pendulum ride, measured ... · swings [3] and also in many amusement rides. In this article we focus on a pendulum ride, with an added rotation: the](https://img.pdfslide.net/doc/110x75/60181be4058c1d502c02dcda/acceleration-and-rotation-in-a-pendulum-ride-measured-swings-3-and-also-in.jpg)