Embed Size (px)
Citation preview
arX
iv:1
507.
0301
0v3
[ast
ro-p
h.H
E]
14 J
an 2
016
ASASSN-15lh:A Highly Super-Luminous Supernova
Subo Dong,1∗ B. J. Shappee,2,3 J. L. Prieto,4,5 S. W. Jha,6 K. Z. Stanek,7,8
T. W.-S. Holoien,7,8 C. S. Kochanek,7,8 T. A. Thompson,7,8 N. Morrell,9
I. B. Thompson,2 U. Basu,7 J. F. Beacom,7,8,10 D. Bersier,11 J. Brimacombe,12
J. S. Brown,7 F. Bufano,13 Ping Chen,14 E. Conseil,15 A. B. Danilet,7 E. Falco,16
D. Grupe,17 S. Kiyota,18 G. Masi,19 B. Nicholls,20 F. Olivares E.,21,5 G. Pignata,21,5
G. Pojmanski,22 G. V. Simonian,7 D. M. Szczygiel,22 P. R. Wozniak23
1 Kavli Institute for Astronomy and Astrophysics, Peking University, Yi He Yuan Road 5, HaiDian District, Beijing 100871, China2 Carnegie Observatories, 813 Santa Barbara Street, Pasadena, CA 91101, USA3 Hubble and Carnegie-Princeton Fellow4 Nucleo de Astronomıa de la Facultad de Ingenierıa, Universidad Diego Portales, Av. Ejercito441, Santiago, Chile5 Millennium Institute of Astrophysics, Santiago, Chile6 Department of Physics and Astronomy, Rutgers, The State University of New Jersey, 136Frelinghuysen Road, Piscataway, NJ 08854, USA7 Department of Astronomy, The Ohio State University, 140 W. 18th Ave., Columbus, OH43210, USA8 Center for Cosmology and AstroParticle Physics (CCAPP), The Ohio State University, 191W. Woodruff Ave., Columbus, OH 43210, USA9 Las Campanas Observatory, Carnegie Observatories, Casilla 601, La Serena, Chile,10 Department of Physics, The Ohio State University, 191 W. Woodruff Ave., Columbus, OH43210, USA11 Astrophysics Research Institute, Liverpool John Moores University, 146 Brownlow Hill, Liv-erpool L3 5RF, UK12 Coral Towers Observatory, Cairns, Queensland 4870, Australia13 INAF-Osservatorio Astrofisico di Catania, Via S.Sofia 78, 95123, Catania, Italy14 Department of Astronomy, Peking University, Yi He Yuan Road5, Hai Dian District, 100871,P. R. China15 Association Francaise des Observateurs d’Etoiles Variables (AFOEV), Observatoire de Stras-bourg 11, rue de l’Universit, F-67000 Strasbourg, France
1
16 Harvard-Smithsonian Center for Astrophysics, 60 Garden St., Cambridge, MA 02138, USA.17 Department of Earth and Space Science, Morehead State University, 235 Martindale Dr.,Morehead, KY 40351, USA18 Variable Star Observers League in Japan (VSOLJ), 7-1 Kitahatsutomi, Kamagaya, Chiba273-0126, Japan19 The Virtual Telescope Project, Via Madonna de Loco 47, 03023Ceccano, Italy20 Mt Vernon Observatory, 6 Mt Vernon pl, Nelson, New Zealand21 Departamento Ciencias Fisicas, Universidad Andres Bello,Av. Republica 252, Santiago,Chile22 Warsaw University Astronomical Observatory, Al. Ujazdowskie 4, 00-478 Warsaw, Poland23 Los Alamos National Laboratory, Mail Stop B244, Los Alamos,NM 87545, USA
∗To whom correspondence should be addressed; E-mail: [email protected].
We report the discovery of ASASSN-15lh (SN 2015L), which we interpret as
the most luminous supernova yet found. At redshiftz = 0.2326, ASASSN-
15lh reached an absolute magnitude ofMu,AB = −23.5 ± 0.1 and bolometric
luminosity Lbol = (2.2±0.2)×1045 ergs s−1, which is more than twice as lumi-
nous as any previously known supernova. It has several majorfeatures char-
acteristic of the hydrogen-poor super-luminous supernovae (SLSNe-I), whose
energy sources and progenitors are currently poorly understood. In contrast
to most previously known SLSNe-I that reside in star-forming dwarf galax-
ies, ASASSN-15lh appears to be hosted by a luminous galaxy (MK ≃ −25.5)
with little star formation. In the 4 months since first detection, ASASSN-15lh
radiated (1.1±0.2)×1052 ergs, challenging the magnetar model for its engine.
Only within the past two decades has the most luminous class of supernovae (super-luminous
supernovae, SLSNe) been identified (e.g., (1)). Compared with the most commonly discovered
SNe (Type Ia), SLSNe are more luminous by over two magnitudesat peak and rarer by at
least 3 orders of magnitude (2). Like normal SNe, SLSNe are classified by their spectra as
either SLSN-I (hydrogen-poor) or SLSN-II (hydrogen-rich). Yet the physical characteristics of
2
SLSNe may not be simple extensions from their low-luminosity counterparts (1). In particular,
the power source for SLSNe-I is poorly understood (3). Adding to the puzzle, SLSNe tend to
explode in low-luminosity, star-forming dwarf galaxies (4–6). The recent advent of wide-area,
un-targeted transient surveys has made the systematic discovery and investigation of the SLSNe
population possible (e.g., see (7) and (8) and references therein).
The All-Sky Automated Survey for SuperNovae (ASAS-SN1; (9)) scans the visible sky
every 2–3 nights to depths ofV ≃ 16.5− 17.3mag using a global network of 14 cm telescopes
(9) in an un-targeted search for new transients, particularlybright supernovae.
On 2015 June 142, ASAS-SN triggered on a new source located at RA= 22h02m15.s45
Dec= −61◦39′34.′′6 (J2000), coinciding with a galaxy of then unknown redshift,APMUKS(BJ)
B215839.70−615403.9 (10). Upon confirmation with our follow-up telescopes, we designated
this new source ASASSN-15lh and published its coordinates (11).
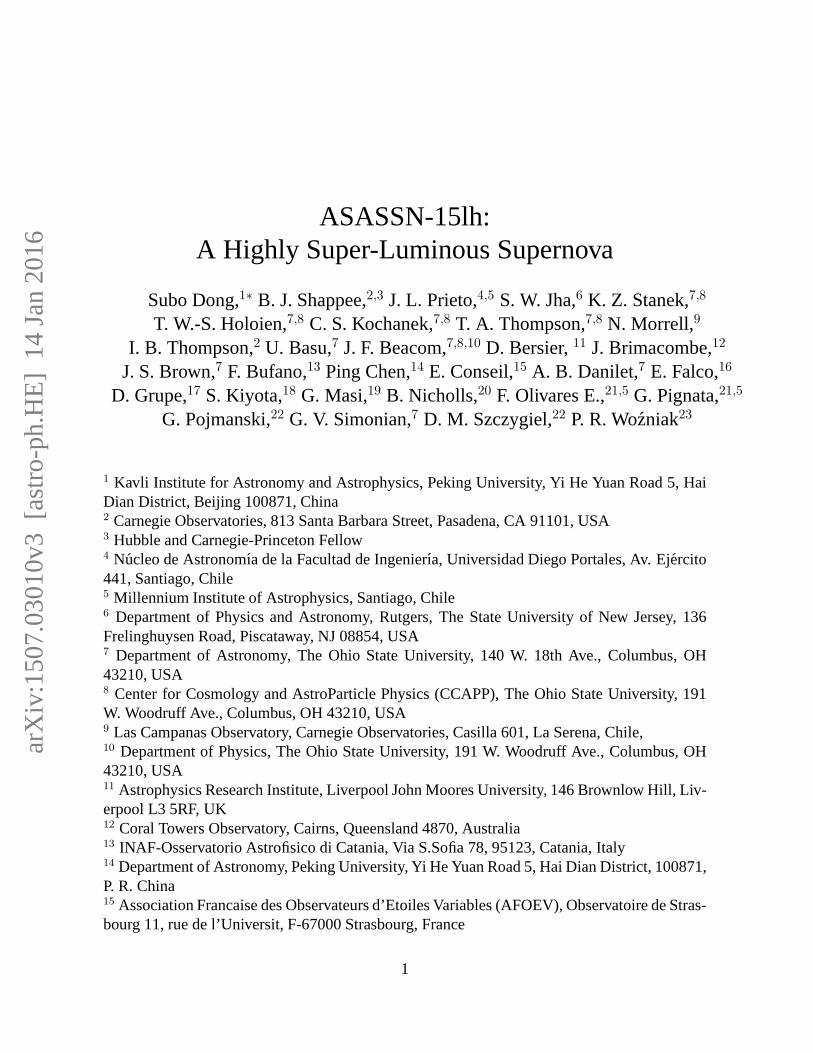
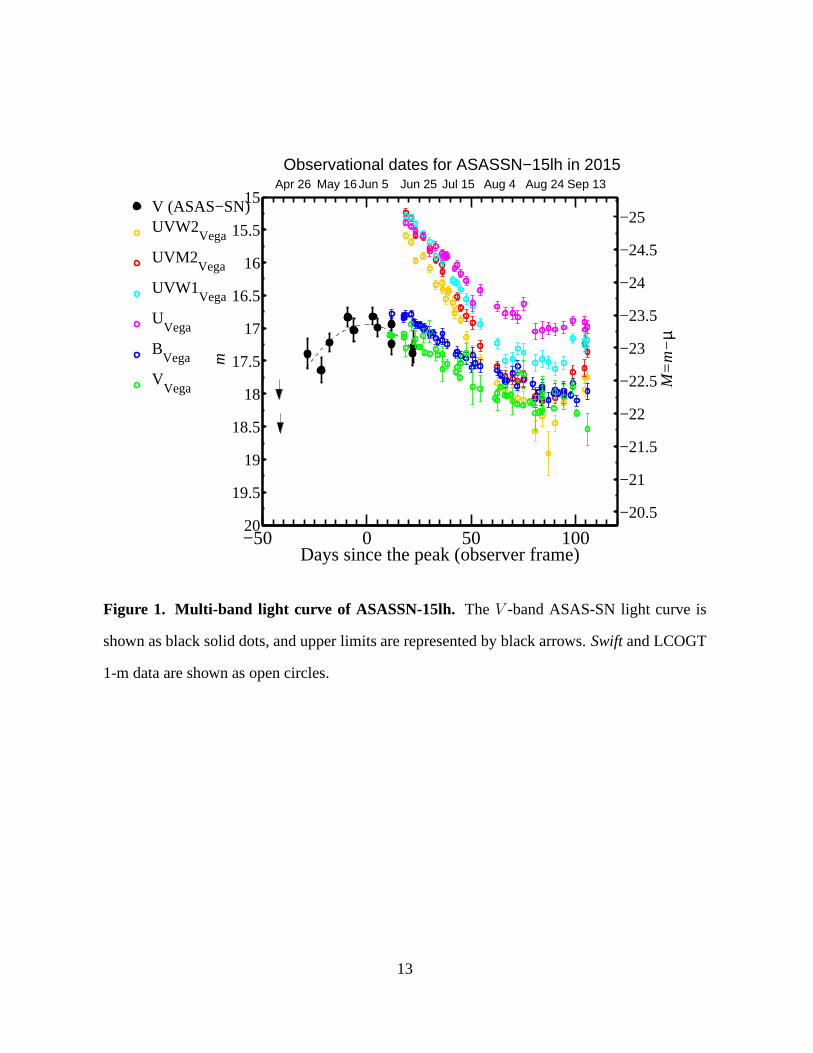
By combining multiple epochs of ASAS-SN images we extended the detections to fainter
fluxes, finding pre-discovery images of ASASSN-15lh from May8, 2015 (V = 17.39 ± 0.23
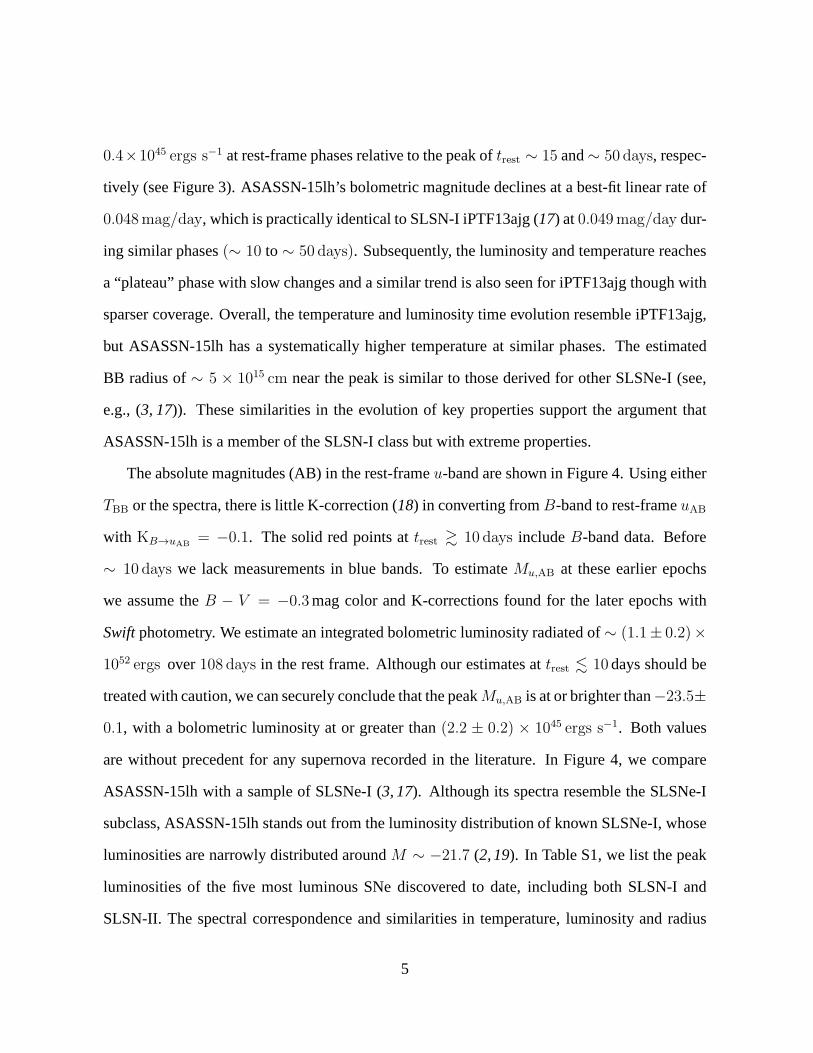
mag), and Figure 1 shows the light curve through 2015 September 19. The ASAS-SN light
curve peaked atV = 16.9 ± 0.1 on approximatelytpeak ∼ JD2457179 (June 05, 2015) based
on a parabolic fit to the lightcurve (dashed line, Fig. 1). Follow-up images were taken with the
Las Cumbres Observatory Global Telescope Network (LCOGT) 1-m telescopes, and theBV
light-curves with the galaxy contribution subtracted are also shown.
We obtained an optical spectrum (3700 − 9200 A) of ASASSN-15lh on 2015 June 21 with
the du Pont 100-inch telescope. The steep spectral slope with relatively high blue flux motivated
SwiftUVOT/XRT (12) target-of-opportunity observations starting on June 24,2015. The 6-band
Swift light curve spanning from the UV to the optical (1928A−5468A) is shown in Figure 1.
TheSwiftspectral energy distribution (SED), peaking in the UV, indicates the source has a high
1http://www.astronomy.ohio-state.edu/∼assassin/2UT dates are used throughout this paper
3
temperature. We derive a3σ X-ray flux limit of < 1.6×10⁻¹⁴ ergs s−1 cm−2 (0.3-10 keV) from
a total XRT exposure of 81 ks taken between 2015 June 24 and Sep18.
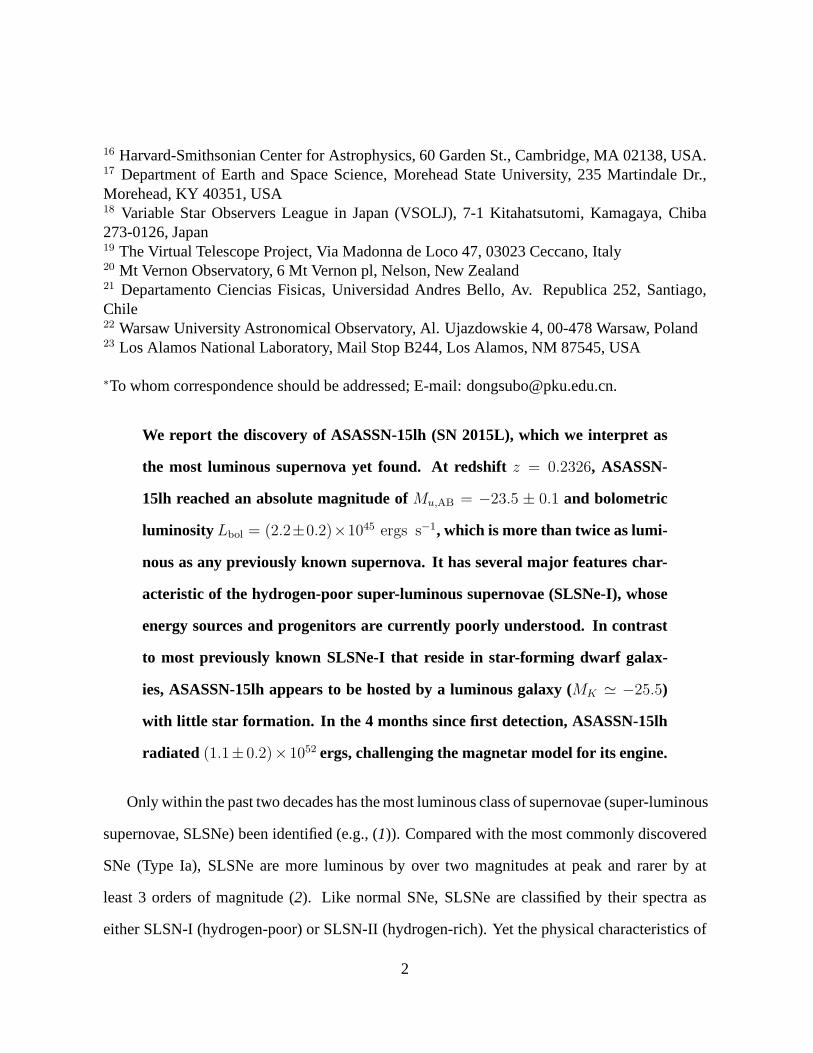
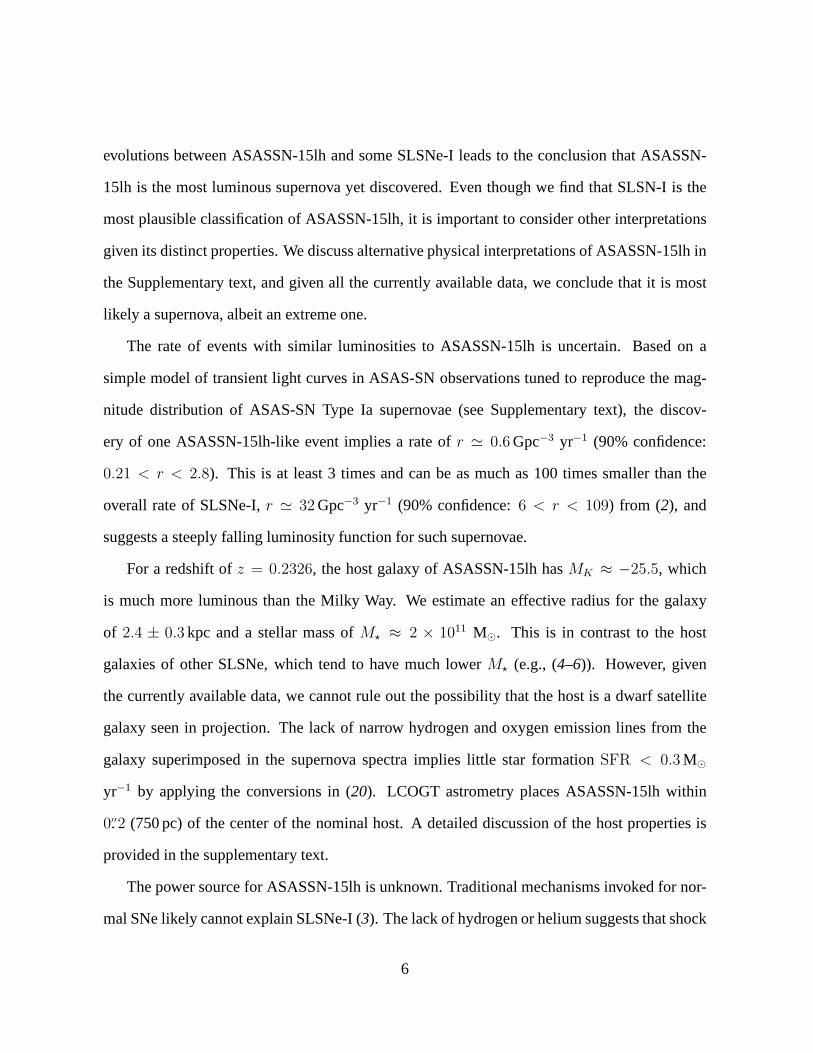
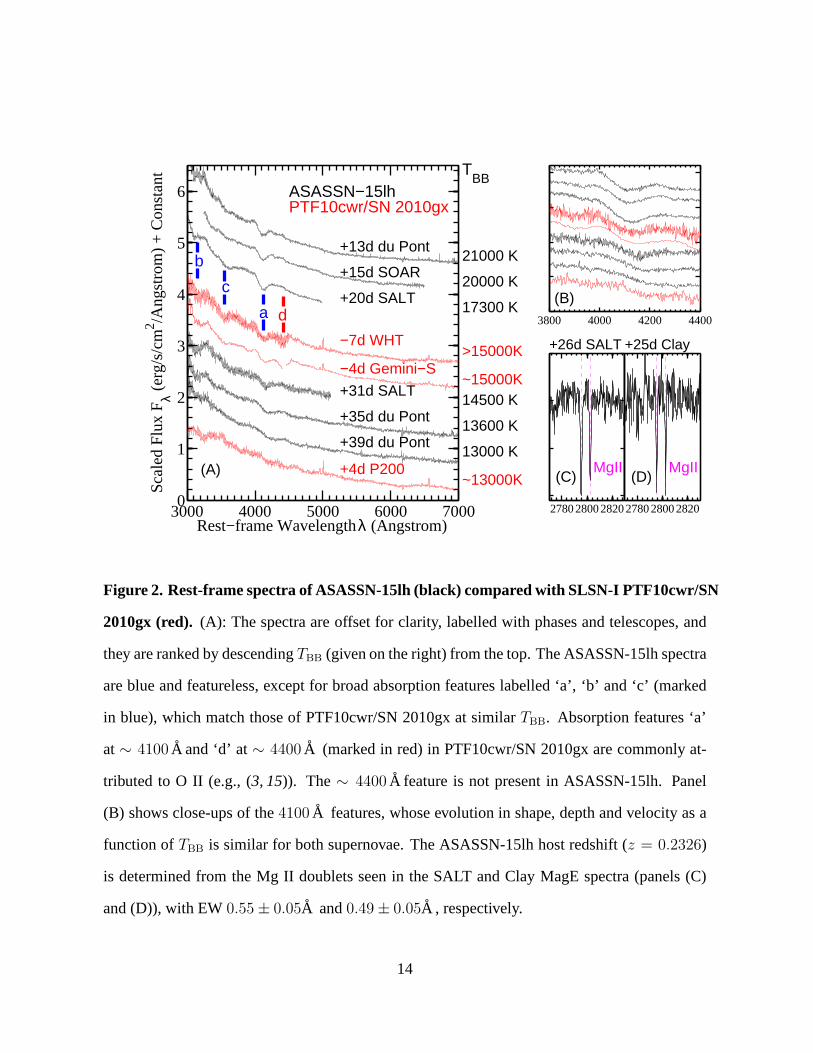
The du Pont spectrum is mostly featureless (Figure 2, panel (A), first from the top) ex-
cept for a deep, broad absorption trough near∼ 5100 A (observer frame).SNID (13), a com-
monly used SN classification software that has a spectral library of most types of supernovae
except SLSN, failed to find a good SN match. However, we noticed a resemblance between
the trough and a feature attributed to O II absorption near4100 A (rest frame) in the spectrum
of PTF10cwr/SN2010gx, a SLSN-I atz = 0.230 (3, 14, 15). Assuming that the ASASSN-
15lh absorption trough (FWHM∼ 104 km s−1) was also due to the same feature indicated a
similar redshift ofz ∼ 0.23. An optical spectrum (3250 − 6150 A) obtained on the Southern
African Large Telescope (SALT) revealed a clear Mg II absorption doublet (λλ2796, 2803)
at z = 0.232, confirming the redshift expected from our tentative line identification. Subse-
quent Magellan/Clay (July 6) and SALT (July 7) spectra refined the redshift toz = 0.2326
(panels (C) and (D), Figure 2). The available rest frame spectra show continua with steep
spectral slope, relatively high blue fluxes and several broad absorption features also seen in
PTF10cwr/SN2010gx (features ‘a’, ‘b’ and ‘c’ labeled in panel (A) of Figure 2) and with-
out hydrogen or helium features, consistent with the main spectral features of SLSNe-I (1, 3).
The broad absorption feature near4400 A (‘d’ in Figure 2) seen in PTF10cwr/SN2010gx is
not present in ASASSN-15lh. ASASSN-15lh thus has some distinct spectral characteristics in
comparison with PTF10cwr/SN2010gx and some other SLSNe-I (3).
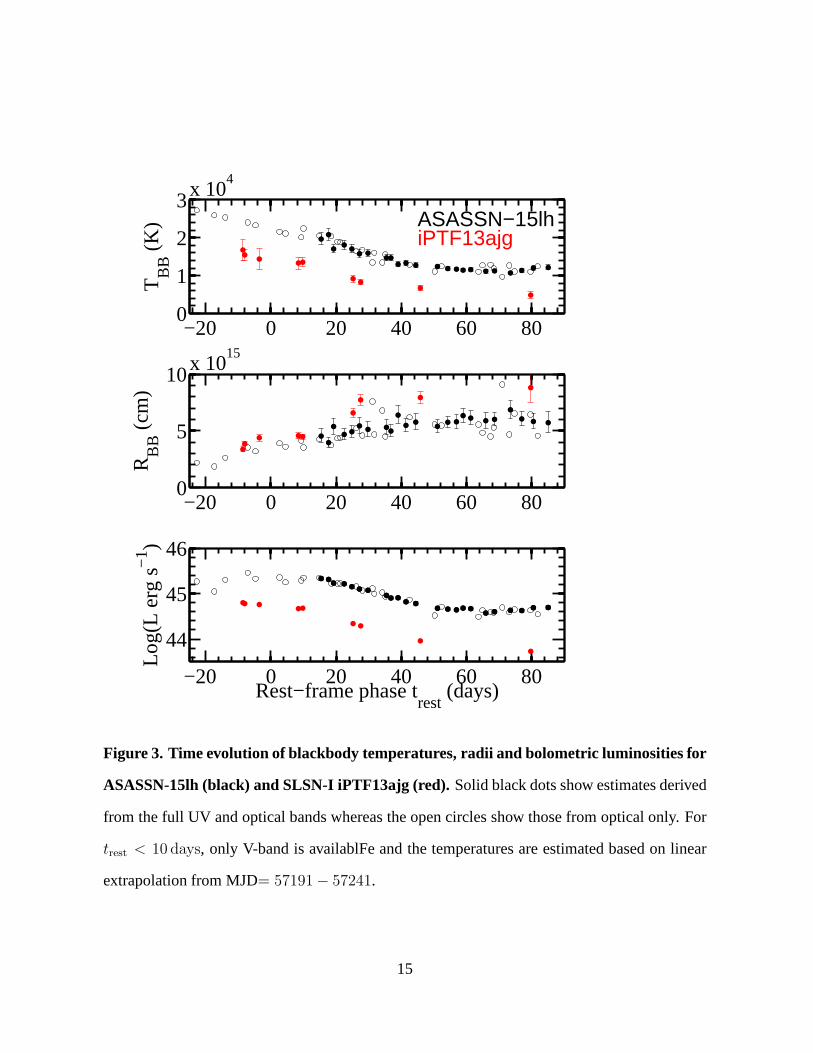
Using a luminosity distance of1171Mpc (standardPlanck cosmology atz = 0.2326),
Galactic extinction ofE(B − V ) = 0.03mag (16), assuming no host extinction (thus the
luminosity derived is likely a lower limit), and fitting theSwift and LCOGT flux measure-
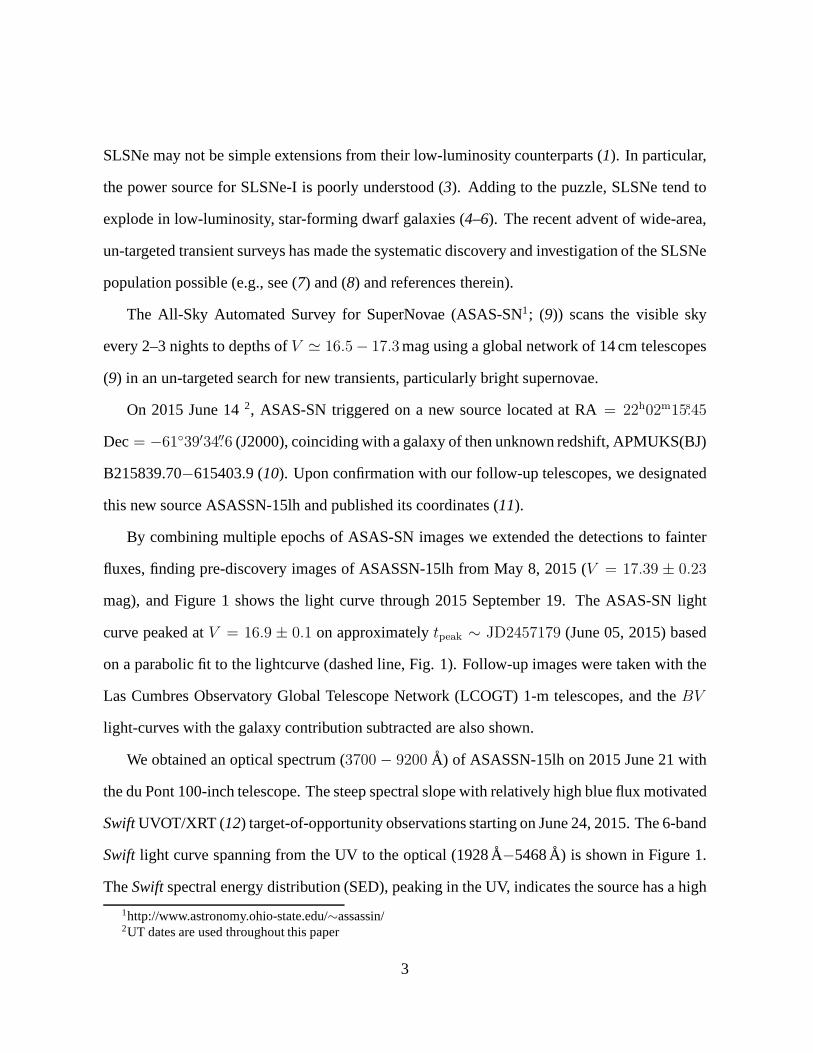
ments to a simple blackbody (BB) model, we obtain declining rest-frame temperatures of
TBB from 2.1 × 10⁴ K to 1.3 × 10⁴ K and bolometric luminosities ofLbol = 2.2 × 1045 to
4
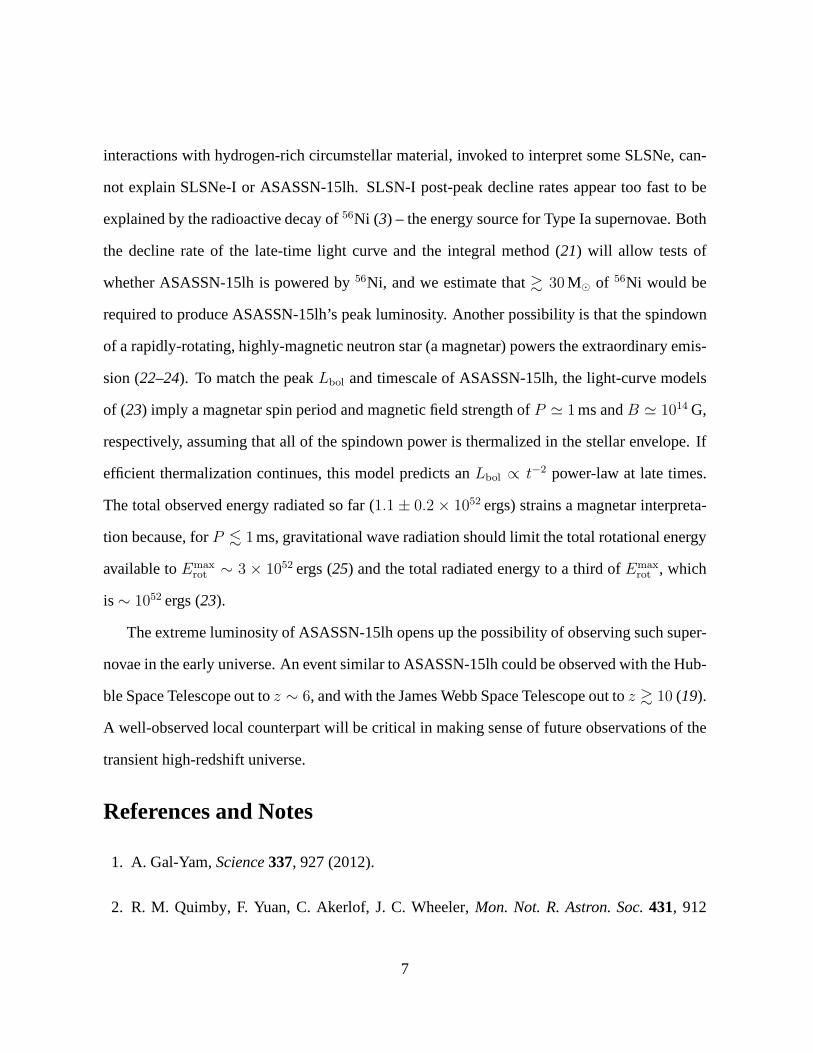
0.4×1045 ergs s−1 at rest-frame phases relative to the peak oftrest ∼ 15 and∼ 50 days, respec-
tively (see Figure 3). ASASSN-15lh’s bolometric magnitudedeclines at a best-fit linear rate of
0.048mag/day, which is practically identical to SLSN-I iPTF13ajg (17) at0.049mag/day dur-
ing similar phases(∼ 10 to ∼ 50 days). Subsequently, the luminosity and temperature reaches
a “plateau” phase with slow changes and a similar trend is also seen for iPTF13ajg though with
sparser coverage. Overall, the temperature and luminositytime evolution resemble iPTF13ajg,
but ASASSN-15lh has a systematically higher temperature atsimilar phases. The estimated
BB radius of∼ 5 × 1015 cm near the peak is similar to those derived for other SLSNe-I (see,
e.g., (3, 17)). These similarities in the evolution of key properties support the argument that
ASASSN-15lh is a member of the SLSN-I class but with extreme properties.
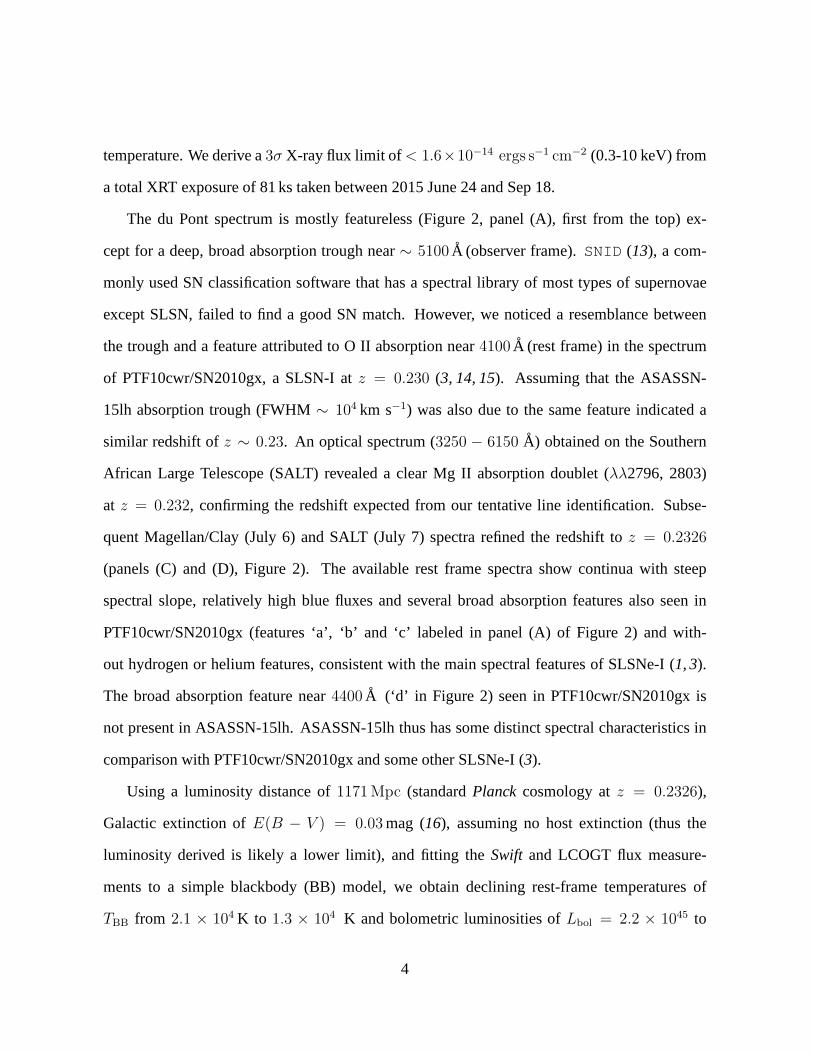
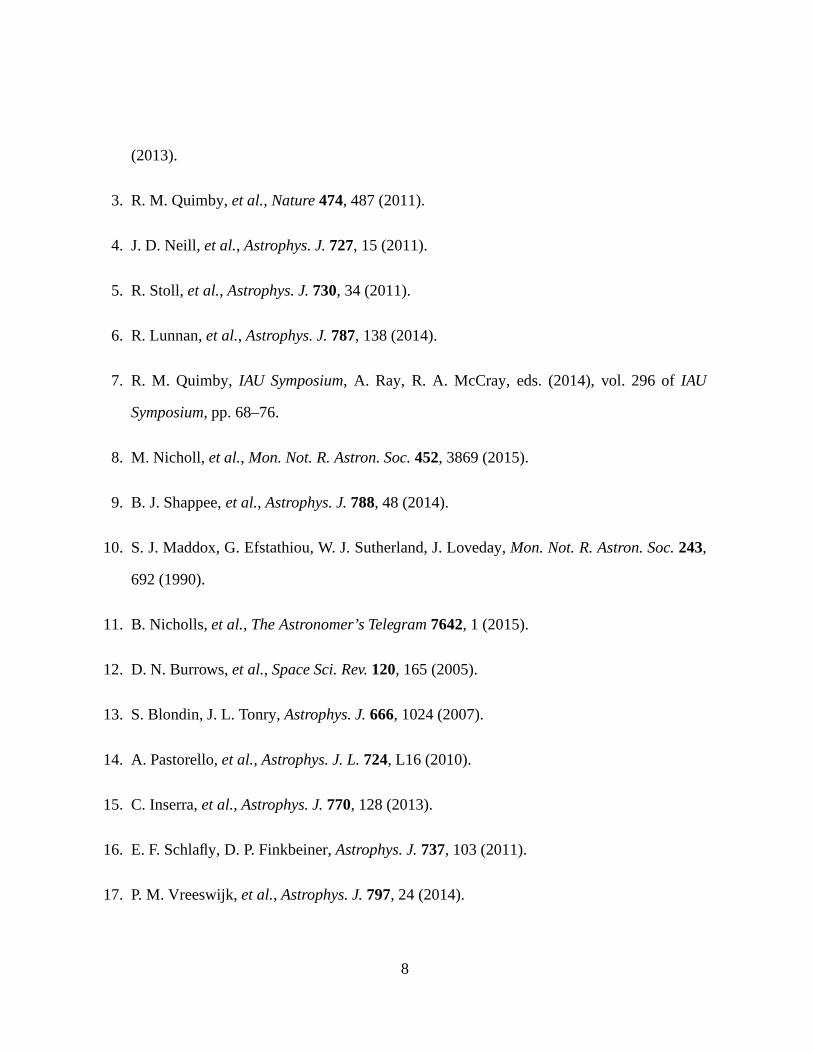
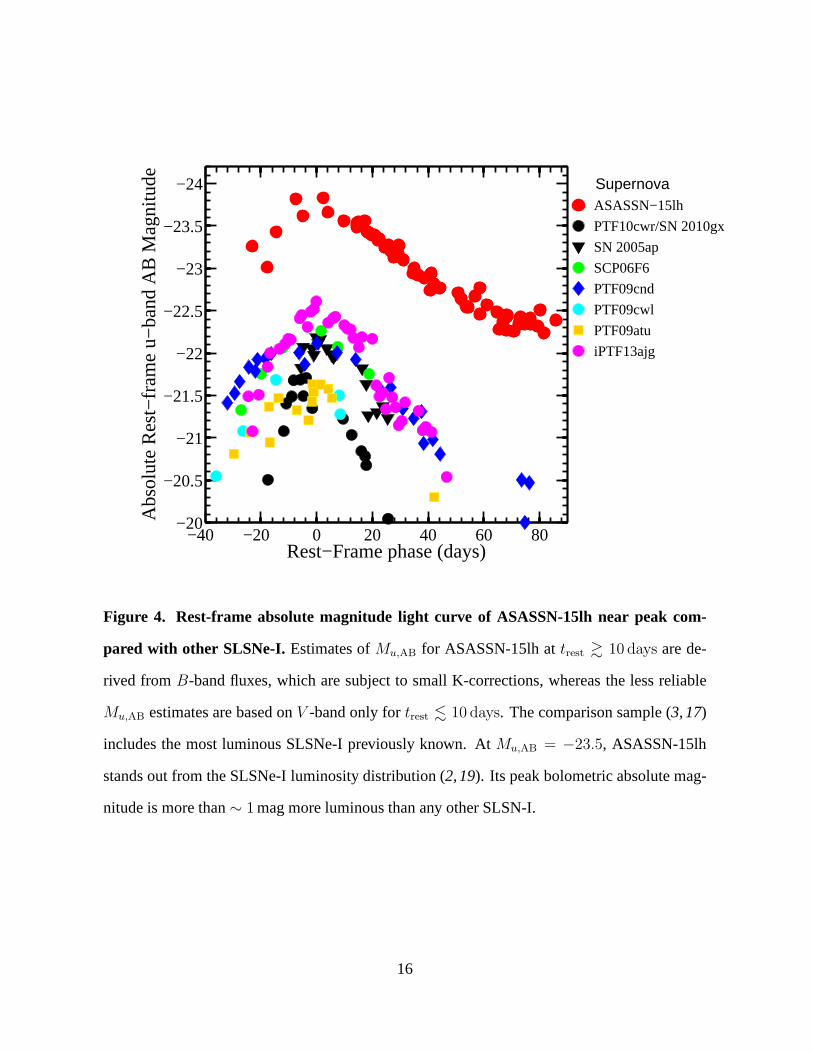
The absolute magnitudes (AB) in the rest-frameu-band are shown in Figure 4. Using either
TBB or the spectra, there is little K-correction (18) in converting fromB-band to rest-frameuAB
with KB→uAB= −0.1. The solid red points attrest & 10 days includeB-band data. Before
∼ 10 days we lack measurements in blue bands. To estimateMu,AB at these earlier epochs
we assume theB − V = −0.3mag color and K-corrections found for the later epochs with
Swiftphotometry. We estimate an integrated bolometric luminosity radiated of∼ (1.1± 0.2)×
1052 ergs over108 days in the rest frame. Although our estimates attrest . 10days should be
treated with caution, we can securely conclude that the peakMu,AB is at or brighter than−23.5±
0.1, with a bolometric luminosity at or greater than(2.2 ± 0.2) × 1045 ergs s−1. Both values
are without precedent for any supernova recorded in the literature. In Figure 4, we compare
ASASSN-15lh with a sample of SLSNe-I (3, 17). Although its spectra resemble the SLSNe-I
subclass, ASASSN-15lh stands out from the luminosity distribution of known SLSNe-I, whose
luminosities are narrowly distributed aroundM ∼ −21.7 (2, 19). In Table S1, we list the peak
luminosities of the five most luminous SNe discovered to date, including both SLSN-I and
SLSN-II. The spectral correspondence and similarities in temperature, luminosity and radius
5
evolutions between ASASSN-15lh and some SLSNe-I leads to the conclusion that ASASSN-
15lh is the most luminous supernova yet discovered. Even though we find that SLSN-I is the
most plausible classification of ASASSN-15lh, it is important to consider other interpretations
given its distinct properties. We discuss alternative physical interpretations of ASASSN-15lh in
the Supplementary text, and given all the currently available data, we conclude that it is most
likely a supernova, albeit an extreme one.
The rate of events with similar luminosities to ASASSN-15lhis uncertain. Based on a
simple model of transient light curves in ASAS-SN observations tuned to reproduce the mag-
nitude distribution of ASAS-SN Type Ia supernovae (see Supplementary text), the discov-
ery of one ASASSN-15lh-like event implies a rate ofr ≃ 0.6Gpc−3 yr−1 (90% confidence:
0.21 < r < 2.8). This is at least 3 times and can be as much as 100 times smaller than the
overall rate of SLSNe-I,r ≃ 32Gpc−3 yr−1 (90% confidence:6 < r < 109) from (2), and
suggests a steeply falling luminosity function for such supernovae.
For a redshift ofz = 0.2326, the host galaxy of ASASSN-15lh hasMK ≈ −25.5, which
is much more luminous than the Milky Way. We estimate an effective radius for the galaxy
of 2.4 ± 0.3 kpc and a stellar mass ofM⋆ ≈ 2 × 10¹¹ M⊙. This is in contrast to the host
galaxies of other SLSNe, which tend to have much lowerM⋆ (e.g., (4–6)). However, given
the currently available data, we cannot rule out the possibility that the host is a dwarf satellite
galaxy seen in projection. The lack of narrow hydrogen and oxygen emission lines from the
galaxy superimposed in the supernova spectra implies little star formationSFR < 0.3M⊙
yr−1 by applying the conversions in (20). LCOGT astrometry places ASASSN-15lh within
0.′′2 (750 pc) of the center of the nominal host. A detailed discussion of the host properties is
provided in the supplementary text.
The power source for ASASSN-15lh is unknown. Traditional mechanisms invoked for nor-
mal SNe likely cannot explain SLSNe-I (3). The lack of hydrogen or helium suggests that shock
6
interactions with hydrogen-rich circumstellar material,invoked to interpret some SLSNe, can-
not explain SLSNe-I or ASASSN-15lh. SLSN-I post-peak decline rates appear too fast to be
explained by the radioactive decay of56Ni (3) – the energy source for Type Ia supernovae. Both
the decline rate of the late-time light curve and the integral method (21) will allow tests of
whether ASASSN-15lh is powered by56Ni, and we estimate that& 30M⊙ of 56Ni would be
required to produce ASASSN-15lh’s peak luminosity. Another possibility is that the spindown
of a rapidly-rotating, highly-magnetic neutron star (a magnetar) powers the extraordinary emis-
sion (22–24). To match the peakLbol and timescale of ASASSN-15lh, the light-curve models
of (23) imply a magnetar spin period and magnetic field strength ofP ≃ 1ms andB ≃ 1014 G,
respectively, assuming that all of the spindown power is thermalized in the stellar envelope. If
efficient thermalization continues, this model predicts anLbol ∝ t−2 power-law at late times.
The total observed energy radiated so far (1.1 ± 0.2 × 1052 ergs) strains a magnetar interpreta-
tion because, forP . 1ms, gravitational wave radiation should limit the total rotational energy
available toEmaxrot ∼ 3 × 1052 ergs (25) and the total radiated energy to a third ofEmax
rot , which
is ∼ 1052 ergs (23).
The extreme luminosity of ASASSN-15lh opens up the possibility of observing such super-
novae in the early universe. An event similar to ASASSN-15lhcould be observed with the Hub-
ble Space Telescope out toz ∼ 6, and with the James Webb Space Telescope out toz & 10 (19).
A well-observed local counterpart will be critical in making sense of future observations of the
transient high-redshift universe.
References and Notes
1. A. Gal-Yam,Science337, 927 (2012).
2. R. M. Quimby, F. Yuan, C. Akerlof, J. C. Wheeler,Mon. Not. R. Astron. Soc.431, 912
7
(2013).
3. R. M. Quimby,et al., Nature474, 487 (2011).
4. J. D. Neill,et al., Astrophys. J.727, 15 (2011).
5. R. Stoll,et al., Astrophys. J.730, 34 (2011).
6. R. Lunnan,et al., Astrophys. J.787, 138 (2014).
7. R. M. Quimby,IAU Symposium, A. Ray, R. A. McCray, eds. (2014), vol. 296 ofIAU
Symposium, pp. 68–76.
8. M. Nicholl, et al., Mon. Not. R. Astron. Soc.452, 3869 (2015).
9. B. J. Shappee,et al., Astrophys. J.788, 48 (2014).
10. S. J. Maddox, G. Efstathiou, W. J. Sutherland, J. Loveday, Mon. Not. R. Astron. Soc.243,
692 (1990).
11. B. Nicholls,et al., The Astronomer’s Telegram7642, 1 (2015).
12. D. N. Burrows,et al., Space Sci. Rev.120, 165 (2005).
13. S. Blondin, J. L. Tonry,Astrophys. J.666, 1024 (2007).
14. A. Pastorello,et al., Astrophys. J. L.724, L16 (2010).
15. C. Inserra,et al., Astrophys. J.770, 128 (2013).
16. E. F. Schlafly, D. P. Finkbeiner,Astrophys. J.737, 103 (2011).
17. P. M. Vreeswijk,et al., Astrophys. J.797, 24 (2014).
8
18. D. W. Hogg, I. K. Baldry, M. R. Blanton, D. J. Eisenstein,ArXiv Astrophysics e-
prints:astro-ph/0210394(2002).
19. C. Inserra, S. J. Smartt,Astrophys. J.796, 87 (2014).
20. S. Savaglio, K. Glazebrook, D. Le Borgne,Astrophys. J.691, 182 (2009).
21. B. Katz, D. Kushnir, S. Dong,ArXiv e-prints, arXiv:1301.6766(2013).
22. P. Bodenheimer, J. P. Ostriker,Astrophys. J.191, 465 (1974).
23. D. Kasen, L. Bildsten,Astrophys. J.717, 245 (2010).
24. S. E. Woosley,Astrophys. J. Lett.719, L204 (2010).
25. B. D. Metzger, D. Giannios, T. A. Thompson, N. Bucciantini, E. Quataert,Mon. Not. R. As-
tron. Soc.413, 2031 (2011).
26. O. Yaron, A. Gal-Yam,Pub. Astron. Soc. Pac.124, 668 (2012).
27. C. Alard,Astron. Astrophys.144, 363 (2000).
28. T. S. Poole,et al., Mon. Not. R. Astron. Soc.383, 627 (2008).
29. A. A. Breeveld,et al., Mon. Not. R. Astron. Soc.406, 1687 (2010).
30. P. J. Brown,The Astronomer’s Telegram8086, 1 (2015).
31. R. Margutti,The Astronomer’s Telegram8089, 1 (2015).
32. D. Lang, D. W. Hogg, K. Mierle, M. Blanton, S. Roweis,Astronomical Journal139, 1782
(2010).
9
33. A. A. Henden, S. Levine, D. Terrell, D. L. Welch,American Astronomical Society Meeting
Abstracts(2015), vol. 225 ofAmerican Astronomical Society Meeting Abstracts, p. 336.16.
34. S. M. Crawford,et al., Society of Photo-Optical Instrumentation Engineers (SPIE) Con-
ference Series(2010), vol. 7737 ofSociety of Photo-Optical Instrumentation Engineers
(SPIE) Conference Series, p. 25.
35. A. J. Drake,et al., Astrophys. J.696, 870 (2009).
36. R. G. McMahon,et al., The Messenger154, 35 (2013).
37. E. Bertin, S. Arnouts,Astronomy and Astrophysics, Supplement117, 393 (1996).
38. P. Melchior, A. Drlica-Wagner, K. Bechtol, E. Rykoff, W.H. D. E. Survey,The As-
tronomer’s Telegram7843, 1 (2015).
39. M. Kriek,et al., Astrophys. J.700, 221 (2009).
40. G. Bruzual, S. Charlot,Mon. Not. R. Astron. Soc.344, 1000 (2003).
41. C. Y. Peng, L. C. Ho, C. D. Impey, H.-W. Rix,Astronomical Journal124, 266 (2002).
42. T.-W. Chen,et al., The Astrophysical Journal Letters763, L28 (2013).
43. R. Lunnan,et al., Astrophys. J.804, 90 (2015).
44. T.-W. Chen,et al., Mon. Not. R. Astron. Soc.452, 1567 (2015).
45. R. M. Quimby,et al., The Astronomer’s Telegram4121, 1 (2012).
46. V. Stanishev,et al., Astron. Astrophys.469, 645 (2007).
47. A. Clocchiatti, N. B. Suntzeff, R. Covarrubias, P. Candia, Astronomical Journal141, 163
(2011).
10
48. M. C. Bersten, M. Hamuy,Astrophys. J.701, 200 (2009).
49. N. B. Suntzeff, P. Bouchet,Astronomical Journal99, 650 (1990).
50. T. C. Licquia, J. A. Newman, J. Brinchmann,Astrophys. J.809, 96 (2015).
51. C. S. Kochanek,Saas-Fee Advanced Course 33: Gravitational Lensing: Strong, Weak and
Micro, G. Meylan,et al., eds. (2006), pp. 91–268.
52. C. L. MacLeod,et al., Astrophys. J.721, 1014 (2010).
53. D. E. Vanden Berk,et al., Astrophys. J.601, 692 (2004).
54. B. M. Peterson,An Introduction to Active Galactic Nuclei(1997).
55. A. J. Drake,et al., Astrophys. J.735, 106 (2011).
56. I. Arcavi,et al., Astrophys. J.793, 38 (2014).
57. S. Gezari,et al., Nature485, 217 (2012).
58. L. E. Strubbe, N. Murray,ArXiv e-prints:1509.04277(2015).
59. T. W.-S. Holoien,et al., Mon. Not. R. Astron. Soc.445, 3263 (2014).
60. T. W.-S. Holoien,et al., ArXiv e-prints:1507.01598(2015).
61. J. Vinko,et al., Astrophys. J.798, 12 (2015).
62. R. Chornock,et al., Astrophys. J.780, 44 (2014).
63. N. Haring, H.-W. Rix,Astrophys. J. Lett.604, L89 (2004).
64. S. Benetti,et al., Mon. Not. R. Astron. Soc.441, 289 (2014).
65. A. A. Miller, et al., Astrophys. J.690, 1303 (2009).
11
Acknowledgement
We acknowledge: Bing Zhang, Luis Ho, Avishay Gal-Yam, Boaz Katz for comments; NSF
AST-1515927, OSU CCAPP, Mt. Cuba Astronomical Foundation,TAP, SAO, CAS Grant No.
XDB09000000 (SD); NASA Hubble Fellowship (BJS); FONDECYT grant 1151445, MAS
project IC120009 (JLP); NSF CAREER award AST-0847157 (SWJ); DOE DE-FG02-97ER25308
(TWSH); NSF PHY-1404311 (JFB); FONDECYT 3140326 (FOE) and LANL Laboratory Di-
rected Research and Development program (PRW). All data used in this paper are made public
including the photometric data (see Supplement tables) andspectroscopic data are available at
public repository WISeREP (26) (http://wiserep.weizmann.ac.il). Materials and methods are
available as supplementary materials on Science Online.
12
−50 0 50 100Days since the peak (observer frame)
Sep 13Aug 24Aug 4Jul 15Jun 25Jun 5May 16Apr 26
Observational dates for ASASSN−15lh in 2015
V (ASAS−SN)UVW2
Vega
UVM2Vega
UVW1Vega
UVega
BVega
VVega
15
15.5
16
16.5
17
17.5
18
18.5
19
19.5
20
m−25
−24.5
−24
−23.5
−23
−22.5
−22
−21.5
−21
−20.5
M=
m−
µ
Figure 1. Multi-band light curve of ASASSN-15lh. TheV -band ASAS-SN light curve is
shown as black solid dots, and upper limits are represented by black arrows.Swiftand LCOGT
1-m data are shown as open circles.
13
3000 4000 5000 6000 70000
1
2
3
4
5
6
(A)
ASASSN−15lhPTF10cwr/SN 2010gx
a
b
c
d
TBB
13000 K+39d du Pont
13600 K+35d du Pont
14500 K+31d SALT
17300 K+20d SALT
20000 K+15d SOAR
21000 K+13d du Pont
~13000K+4d P200
~15000K−4d Gemini−S
>15000K−7d WHT
Rest−frame Wavelength λ (Angstrom)
Sca
led
Flu
x F λ (
erg/
s/cm
2 /Ang
stro
m)
+ C
onst
ant
3800 4000 4200 4400
(B)
278028002820
MgII
+26d SALT
(C)
278028002820
MgII
+25d Clay
(D)
Figure 2. Rest-frame spectra of ASASSN-15lh (black) compared with SLSN-I PTF10cwr/SN
2010gx (red). (A): The spectra are offset for clarity, labelled with phases and telescopes, and
they are ranked by descendingTBB (given on the right) from the top. The ASASSN-15lh spectra
are blue and featureless, except for broad absorption features labelled ‘a’, ‘b’ and ‘c’ (marked
in blue), which match those of PTF10cwr/SN 2010gx at similarTBB. Absorption features ‘a’
at∼ 4100 A and ‘d’ at∼ 4400 A (marked in red) in PTF10cwr/SN 2010gx are commonly at-
tributed to O II (e.g., (3, 15)). The∼ 4400 A feature is not present in ASASSN-15lh. Panel
(B) shows close-ups of the4100 A features, whose evolution in shape, depth and velocity as a
function ofTBB is similar for both supernovae. The ASASSN-15lh host redshift (z = 0.2326)
is determined from the Mg II doublets seen in the SALT and ClayMagE spectra (panels (C)
and (D)), with EW0.55± 0.05A and0.49± 0.05A , respectively.
14
−20 0 20 40 60 800
1
2
3x 10⁴
TB
B (
K) ASASSN−15lh
iPTF13ajg
−20 0 20 40 60 800
5
10x 1015
RB
B (
cm)
−20 0 20 40 60 80
44
45
46
Rest−frame phase trest
(days)
Log(
L er
g s−
1 )
Figure 3. Time evolution of blackbody temperatures, radii and bolometric luminosities for
ASASSN-15lh (black) and SLSN-I iPTF13ajg (red).Solid black dots show estimates derived
from the full UV and optical bands whereas the open circles show those from optical only. For
trest < 10 days, only V-band is availablFe and the temperatures are estimated based on linear
extrapolation from MJD= 57191− 57241.
15
−40 −20 0 20 40 60 80
−24
−23.5
−23
−22.5
−22
−21.5
−21
−20.5
−20
Rest−Frame phase (days)
Abs
olut
e R
est−
fram
e u−
band
AB
Mag
nitu
de
SupernovaASASSN−15lh
PTF10cwr/SN 2010gx
SN 2005ap
SCP06F6
PTF09cnd
PTF09cwl
PTF09atu
iPTF13ajg
Figure 4. Rest-frame absolute magnitude light curve of ASASSN-15lh near peak com-
pared with other SLSNe-I. Estimates ofMu,AB for ASASSN-15lh attrest & 10 days are de-
rived fromB-band fluxes, which are subject to small K-corrections, whereas the less reliable
Mu,AB estimates are based onV -band only fortrest . 10 days. The comparison sample (3, 17)
includes the most luminous SLSNe-I previously known. AtMu,AB = −23.5, ASASSN-15lh
stands out from the SLSNe-I luminosity distribution (2,19). Its peak bolometric absolute mag-
nitude is more than∼ 1mag more luminous than any other SLSN-I.
16
Supplementary Materials for
ASASSN-15lh: A Highly Super-Luminous Supernova
Subo Dong,1∗ B. J. Shappee,2,3 J. L. Prieto,4,5 S. W. Jha,6 K. Z. Stanek,7,8
T. W.-S. Holoien,7,8 C. S. Kochanek,7,8 T. A. Thompson,7,8 N. Morrell,9
I. B. Thompson,2 U. Basu,7 J. F. Beacom,7,8,10 D. Bersier,11 J. Brimacombe,12
J. S. Brown,7 F. Bufano,13 Ping Chen,14 E. Conseil,15 A. B. Danilet,7 E. Falco,16
D. Grupe,17 S. Kiyota,18 G. Masi,19 B. Nicholls,20 F. Olivares E.,21,5 G. Pignata,21,5
G. Pojmanski,22 G. V. Simonian,7 D. M. Szczygiel,22 P. R. Wozniak23
Correspondence to: [email protected].
This PDF file includes:
Materials and Methods
Supplementary text
Figure S1, S2, S3, S4, S5
Table S1, S2, S3, S4, S5, S6
References (27–65)
1
1 Data Acquisitions & Reductions
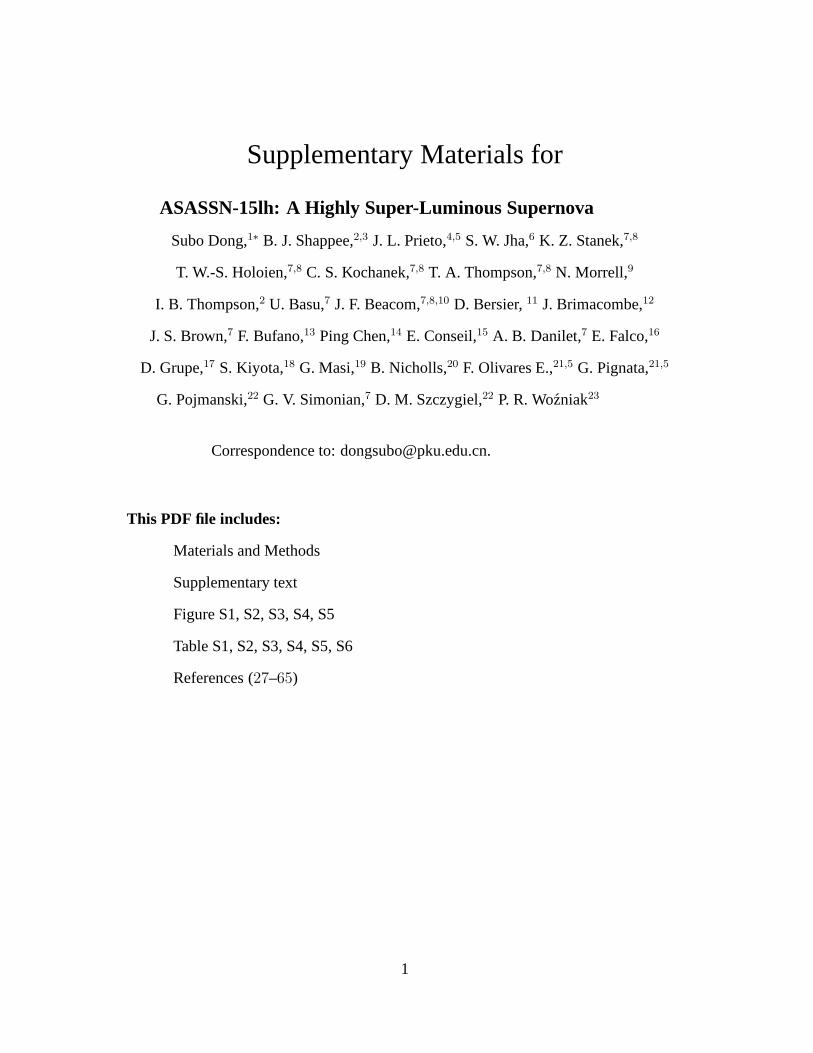
The ASAS-SN images were processed by the fully automatic ASAS-SN pipeline (Shappee et
al. in prep.) which uses the ISIS image subtraction package (27). Upon careful examination, we
marginally detected ASASSN-15lh in a number of pre-discovery images from two cameras (5
and 6) on the ASAS-SN southern unit, Cassius. Fig. S1 presents the reference images for both
cameras constructed from data obtained between May and December 2014. These reference
images allow us to remove any host-galaxy light. To recover amore robust light curve of the
event, we combined individual 90-second subtracted imagesthat were taken within 7.5 days of
each other and acquired on the same camera (averaging2− 8 images). We find that ASASSN-
15lh was first detected in a stack of 6 images acquired betweenMay 4-11, 2015 (V ∼ 17.4
mag). The derived JohnsonV magnitudes are reported in Table S4. In Fig. S1 we show an
example from before and after peak, one from each camera, demonstrating the quality of our
subtractions and detections of ASASSN-15lh.
Following the discovery of the transient, we obtained a series of 32SwiftXRT and UVOT
target-of-opportunity (ToO) observations between 2015 June 24 and 2015 September 19. The
UVOT observations were obtained in 6 filters:V (5468A), B (4392A), U (3465A), UVW1
(2600A), UVM2 (2246A), andUVW2 (1928A) (28). We used a5.′′0 radius region to extract
source counts and a∼ 40.′′0 radius region to extract background counts via the softwaretask
UVOTSOURCE. We then used the UVOT calibrations from (28) and (29) to convert the measured
count rates into magnitudes and fluxes. The magnitudes are reported in the Vega system in
Table S5. We analyzed all available X-ray data obtained by the Swift XRT until 2015 September
18. In this 81 ks exposure we found a 3 sigma upper limit at a level of 3.2×10⁻⁴ counts s−1 in the
Swift XRT. Using a standard power-law spectrum with a 0.3-10keV spectral slopeαX =1.0 and
galactic absorption, this upper limit converts to1.6 × 10−14 ergs s−1 cm−2. The SWIFT multi-
2
band photometry plays an important in deriving the bolometric luminosity and SED evolutions.
Three months since the first SWIFT observations, the SWIFT colors have evolved redder and
UV fluxes have dropped by∼ 2mag. Since phasettest ∼ 50 days, the fluxes from optical and
UV have kept approximately constant, entering into a plateau phase with an increase in UV
fluxes near∼ 80 days (see also (30,31)).
We retrieved the reduced (bias subtracted and flat-fielded) LCOGTBV images from the
LCOGT image archive. We solved for the astrometry of the images using astrometry.net (32)
and ran PSF fitting photometry with DoPHOT to extract the photometry of ASASSN-15lh. The
magnitude zero points were obtained from photometry of stars in the field from the AAVSO
Photometric All-Sky Survey (APASS; (33)). The magnitudes are reported in Table S6.
Note that in order to derive the fluxes of the supernova, we subtract the host galaxy fluxes
(derived in the following section) from the SWIFT and LCOGT for B andV bands. As can
be seen from the host SED discussed in the section below, the host is red and thus its fluxes
in bands bluer thanB are negligible as compared to those of the supernova at the epochs of
interest.
The single-slit spectra from the Wide Field Reimaging CCD Camera (WFCCD) on 2015
June 21 on the du Pont 100-inch Telescope and the Goodman Spectrograph on the Southern
Astrophysical Research Telescope (SOAR) were obtained at the parallactic angle and reduced
with standard routines in the IRAFtwodspec andonedspec packages. The reductions
included bias subtraction, flat-fielding, 1-D spectral extraction, wavelength calibration using an
arc lamp, and flux calibration using a spectroscopic standard usually taken the same night.
The Southern African Large Telescope (SALT) observations were obtained with the Robert
Stobie Spectrograph (RSS), using an atmospheric dispersion corrector and1.′′5 longslit oriented
at a position angle of 127.7◦ east of north to include a bright reference star on the slit. The
spectrum taken on UT 2015-Jun-30.17 had 2100 sec of total exposure with the PG0900 grating
3
in two tilt positions to fill chip gaps and cover the wavelength range 3250-6150A at a spectral
resolutionR = λ/∆λ ≈ 900. The UT 2015-07-06.99 spectrum used the PG3000 grating in
two tilt positions, covering the wavelength range 3340-4080 A with a total exposure of 2400
sec and spectral resolutionR ≈ 2600. These data were reduced with a custom pipeline that
incorporates routines from PyRAF and PySALT (34).
We calibrate all spectra by extracting synthetic photometric magnitudes for each filter in the
spectral range and then finding the best linear fit to the observed magnitudes interpolated to the
spectral epoch. For spectra where only a single filter fit within the spectral range, the spectrum
was scaled by a constant. The calibrated spectra are shown inFig. 2 and the digital versions are
made available in the public WISeREP (26) repository.
2 Host Galaxy Properties
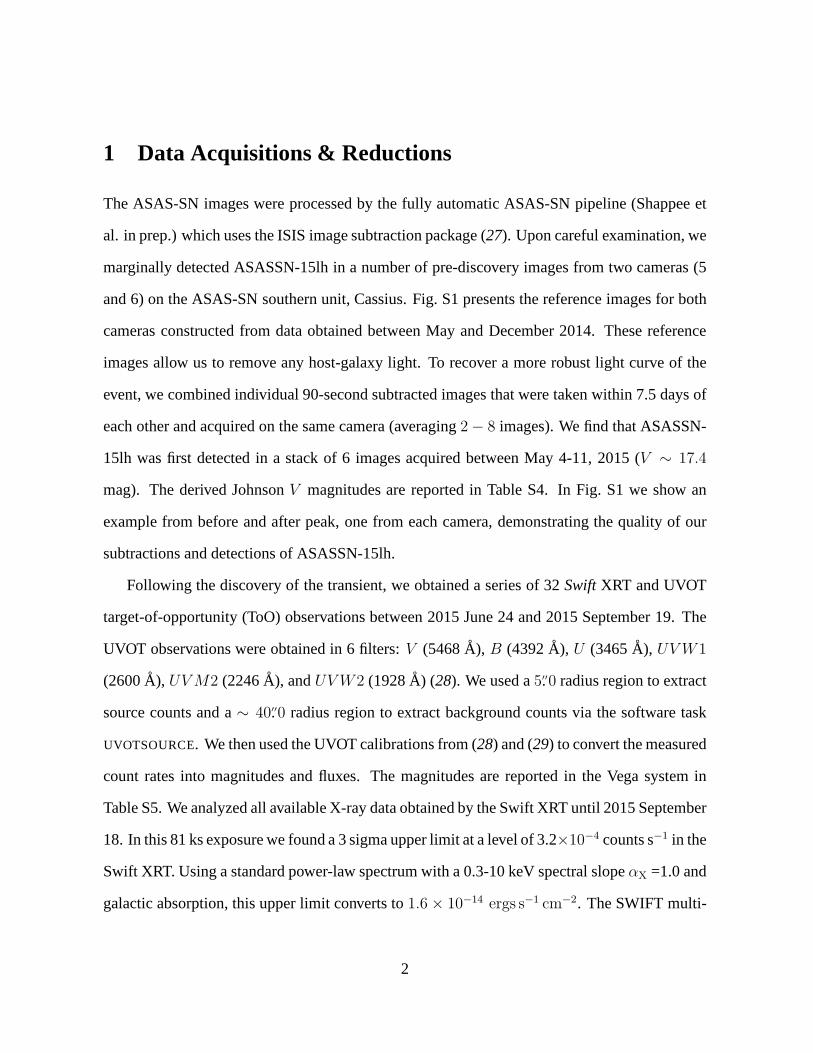
We searched public data archives and surveys in order to characterize the candidate host galaxy
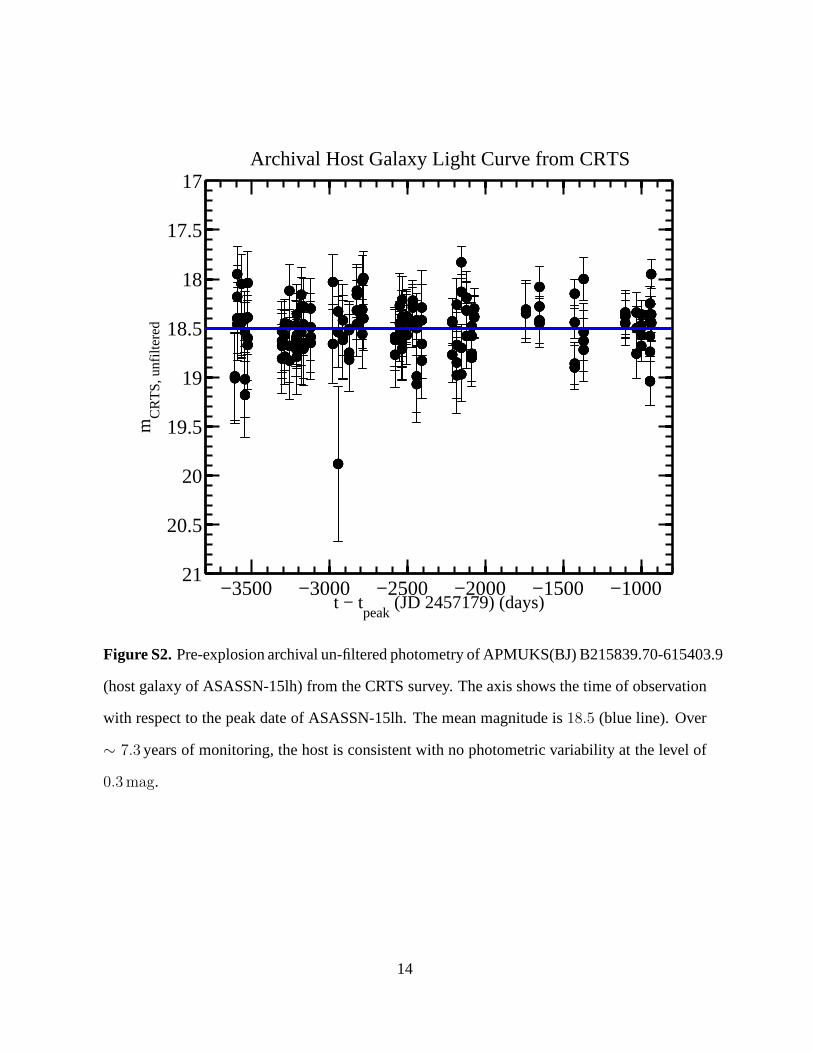
of ASASSN-15lh, APMUKS(BJ) B215839.70−615403.9 (10). The host is detected in CRTS
(35) images and the long termV -band light curve does not show any strong evidence for photo-
metric variability, with aV -band rms of 0.27 mag determined by the photometric uncertainties
(see Fig. S2). We found excellent near-infraredH andKs-band images of the host in the Euro-
pean Southern Observatories (ESO) archive from the VISTA Hemisphere Survey (VHS; (36)).
After calibrating the images using 2MASS stars in the field, we used Sextractor (37) to measure
total aperture magnitudes of the host ofJ = 16.04 ± 0.03 mag andKs = 14.82 ± 0.04 mag,
which correspond to absolute magnitudes ofMJ ≃ −24.3 andMK,s ≃ −25.5 for the assumed
distance modulus.
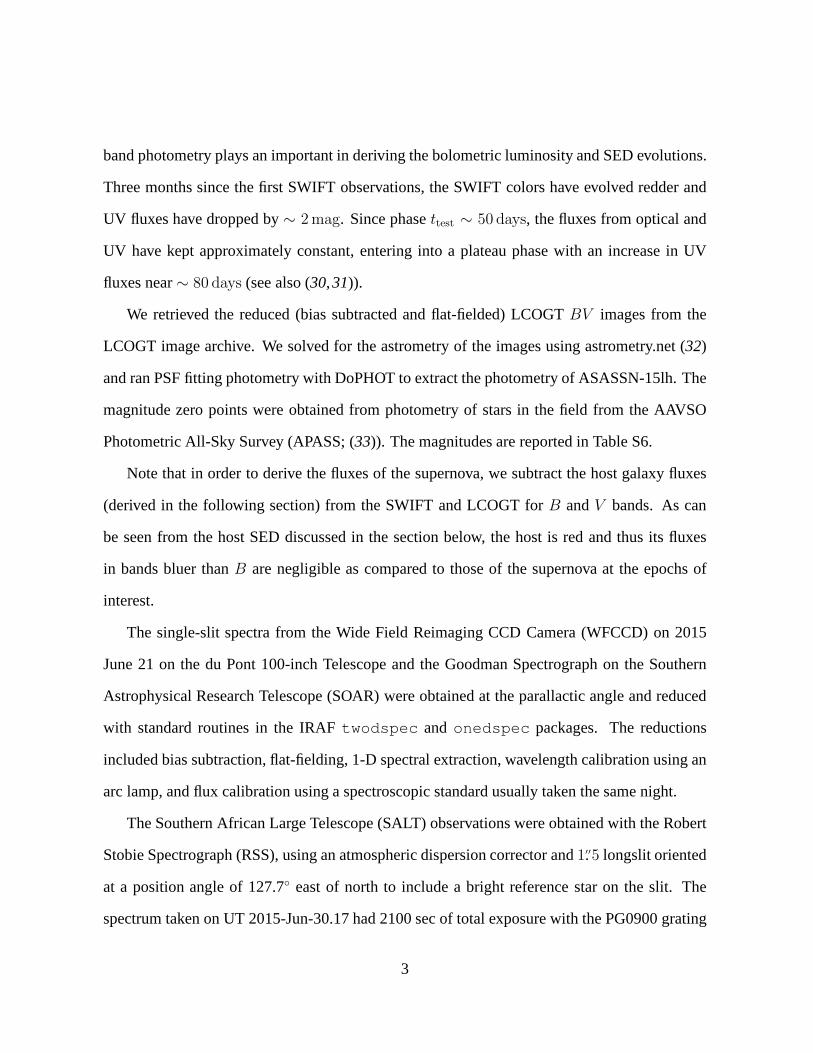
To analyze the SED of the host galaxy, we combined the near-IRfluxes that we derived from
the VHS images with thegriz magnitudes of the host reported from the Dark Energy Survey
(DES) data by (38). The SED of APMUKS(BJ) B215839.70-615403.9 is shown in Fig. S3.
4
We also show a fit using stellar population synthesis (SPS) models. The fit was obtained us-
ing the Fitting and Assessment of Synthetic Templates (FAST; (39)) code using Bruzual &
Charlot (2003) SPS models (40), assuming a Salpeter IMF and an exponentially declining star-
formation history (SFR(t) ∝ e−t/τ ), and correcting the fluxes for Galactic extinction only.
The best SPS model fit from FAST is excellent, with a reducedχ2 of 0.94, giving a total stel-
lar mass oflog(M⋆/M⊙) = 11.34 ± 0.1 (M⋆ ≃ 2 × 10¹¹ M⊙), log(τ/years) = 9.10+0.20−0.08,
and log(age/years) = 9.90+0.10−0.04. Given the good SPS fit of the SED, we used this model
to derive synthetic magnitudes in all the Swift/UVOT and LCOGT filters in which we ob-
tained photometry of ASASSN-15lh, in order to use these fluxes for host-galaxy subtraction.
The resulting synthetic magnitudes of the host are:V = 18.92, B = 20.47, U = 20.69,
UW1 = 21.13, UM2 = 21.18, andUW2 = 21.12 (Swift/UVOT filters in Vega system),
B = 20.37, V = 18.89 (Johnson-Kron/Cousins filters in Vega system).
We also analyzed the archival near-IR images of the host withGALFIT (41) in order to fit
the morphological structure of the host galaxy in the 2D images. We find excellent (reduced
χ2 of ∼1) Sersic profile fits (Σ(r) ∝ r−n) for theJ andKs bands, without the need of extra
components (e.g., a disk). The results of the fits are:n = 3.41 ± 0.47 andRe = 0.′′68 ± 0.′′03
in theJ band image,n = 4.82 ± 1.16 andRe = 0.′′59 ± 0.07 in Ks band image. From these
results, the structure of the host galaxy is consistent witha de Vaucouleurs spheroidal profile
(n = 4), with an effective radius of2.4± 0.3 kpc.
The high stellar mass, red colors, spheroidal morphology, and low recent star-formation
(obtained from upper limit on [O II] emission lines in the supernova spectra) of APMUKS(BJ)
B215839.70-615403.9 make it consistent with an old, massive galaxy. This is in line with the
results of (38), who found that the SED of the host was that of a red-sequencegalaxy at a
photometric redshift of0.25 ± 0.02, consistent with the spectroscopic redshift measured from
the Mg II doublet in the supernova spectra. The high stellar mass and low star-formation rate
5
make the candidate host of ASASSN-15lh distinct among SLSN-I host galaxies, which tend to
be low-metallicity, low-mass, and high star-formation rate density galaxies (e.g., (4–6, 42–44).
We note that we cannot rule out the presence of a small dwarf galaxy in projection along the
line of sight to this massive, compact galaxy with the current images that we have of the event.
Higher resolution data (e.g., with HST) obtained after the supernova fades will be important for
fully characterizing the host galaxy.
We perform relative astrometry between the LCOGT (June 16, 2015,0.′′47/pixel, FWHM
= 2.3 pixel) and archival DSS image (July 7, 1995,1.′′01/pixel, FWHM = 5.0 pixel). Using 10
common bright and isolated stars in the LCOGT field, we establish a 6-parameter coordinate
transformation between the images with IRAFgeomap package. The result of the transfor-
mation yields a separation in east (RA) direction of0.′′10 ± 0.′′13, and north (Decl.) direction
0.′′15± 0.′′10 between the transformed LCOGT supernova position and the DSS galaxy centroid
position. The supernova was atV ∼ 17 while the host galaxy hasV ∼ 18.9 so the astrometric
separation between the supernova and galaxy centroid is0.′′18± 0.′′16.
3 Blackbody Fits and Total Radiated Energy
We fit each epoch with photometric data using a simple blackbody model. For the epochs
with Swift data we used no priors on the blackbody temperature TBB. From these results we
designed a simple logarithmic prior for the epochs with onlyoptical data. The priors were set
to be20000 K on JD 2457191 and11000 K on JD 2457241, varying linear between these dates
and constant afterwards. We then considered two models for the earlier phases where either
the temperature continued to rise linearly towards earliertimes (Table S2) or was held constant
for the earlier epochs (Table S3). The temperature prior wasapplied tolog10 TBB with an
uncertainty of0.05 dex. Parameter uncertainties were determined using Monte Carlo Markov
Chain methods. The Tables S2 and S3 report the estimated median luminosities, temperatures,
6
and blackbody radii along with their estimated symmetric 90% confidence regions. The total
radiated energyE was determined by trapezoidal integration of the results for the individual
epochs. The uncertainties are dominated by the choice of thetemperature priors, where a shift
of ±2000 K in the absolute level changes the estimate by10%, and the shift from the constant
temperature prior to the rising temperature prior for earlytimes increases the estimate by10%.
The span of these systematic uncertainties leads to our estimate thatE = (1.1±0.2)×1052 erg.
In Fig. S4., we show ASASSN-15lh SEDs (filled circles with error bars) at various phases
and respective best-fit blackbody models (lines). The blackbody models are reasonable descrip-
tions of the SEDs with a well-detected UV peak in the SED that is inconsistent with a power-law
spectrum.
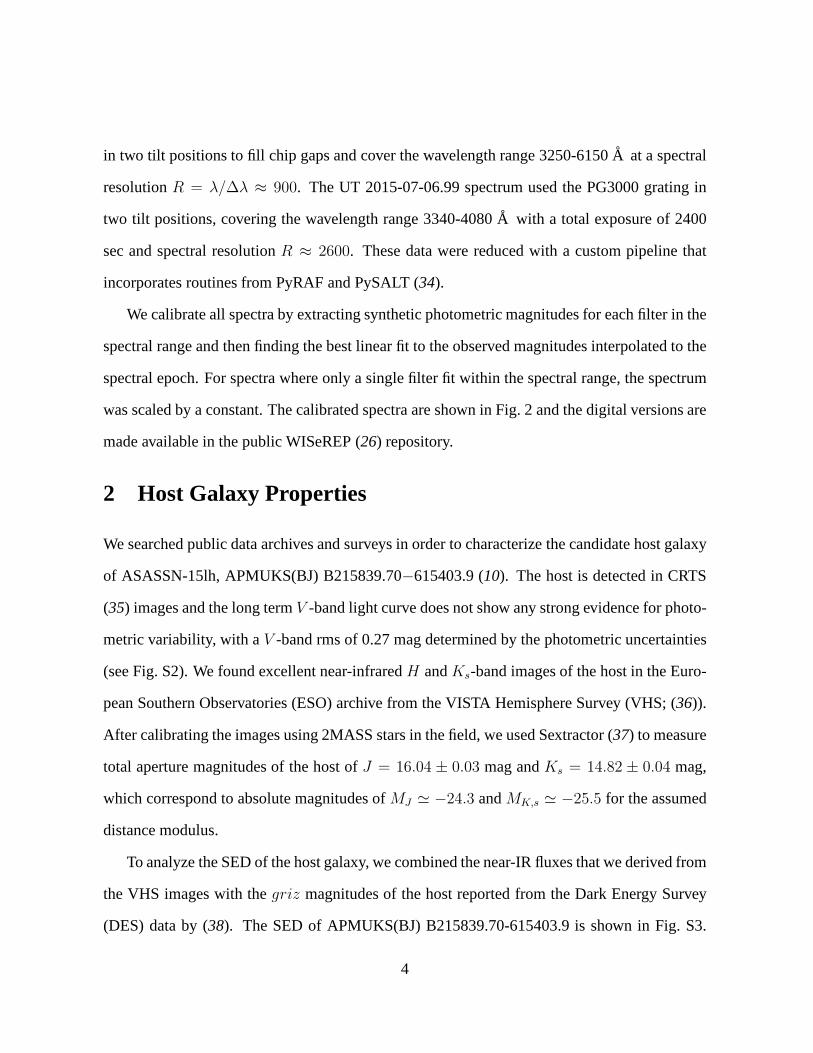
In Fig. S5, we compare the derived the bolometric light curves of ASASSN-15lh with those
of several supernovae of various types. The comparison supernovae include hydrogen-poor
SLSN iPTF13ajg (17), PTF12dam (44,45), Type Ia supernova SN 2003du (46), broad-line Type
Ic (Ic-GRB) supernova (“hypernova”) SN 1998bw (47), Type IIP supernova SN 1999em (48)
and Type II supernova SN 1987A (49). Note that the peak bolometric luminosity of ASASSN-
15lh is brighter than that of the Milky Way (50) by more than one order of magnitude.
4 Rate
While ASASSN-15lh is a single event, we can use it to estimatethe rate of such high luminosity
SLSNe for comparison to the rate at lower luminosity found by(2). We estimate it by randomly
drawing light curves for the centers of randomly selected0.01 < z < 0.1 SDSS galaxies ob-
served by the ASAS-SN survey for the period 1 June 2014 to 31 May 2015. The goal here is
to roughly sample the high latitude sky (e.g. Galactic extinction) and typical weather modu-
lated cadences. Using0.01 < z < 0.1 galaxy centers is mildly conservative in that the noise
contribution from the galaxies will be mildly overestimated. In general, however, since the vast
7
majority of these galaxies are undetected in ASAS-SN, the use of these galaxies differs little
from using random positions. The primary purpose of the procedure is to supply a random set
of observing cadences and their associated noise levels. Although we survey regions closer to
the Galactic plane, we assume the sky coverage excludes latitudes|b| < 10◦.
To estimate the rates, we randomly select a light curve, a redshift assuming a constant
comoving density in volumeVcom and the time at which the transient peaks. The scrambling of
the true SDSS redshifts is unimportant. The observed comoving rate and transient time scale
are corrected for time dilation. Relative to the time at which they peak, we assume the transients
can be modeled as
MV (t) = Mpeak + (t/tpeak(1 + z))2 − 1.86z (1)
wheretpeak is the rest frame time for the light curve to decay by one magnitude and the last
term is a simple K-correction matching our estimate for ASASSN-15lh at its observed redshift.
For ASASSN-15lh,tpeak ≃ 30 to 40 days. Comparing the model fluxes and observed noise at
the epochs of the randomly selected light curve, we define a detection as an event where the
signal-to-noise ratio isS/N > 7.5 for at least two epochs separated by less than one week.
This criterion reproduces the observed magnitude distribution of ASAS-SN Type Ia SNe well.
From these statistics we obtain the average number of days over which we would detect the
model transient for galaxies randomly distributed out to the distance limit,〈t〉, leading to a rate
estimate forN events ofr = N(〈t〉Vcom)−1. We tabulated the results forMpeak = −20, −21,
−22, −23 and−24 andtpeak = 10, 20, 30 and40 days.
For one detected event, the differential rates fortpeak = 40 days scale with absolute lu-
minosity asr = 60, 15, 3.8, 0.96 and0.23 Gpc−3 year−1 in order of increasing luminosity.
Because of ASAS-SN’s relatively high cadence, the choice oftpeak is unimportant given the
statistical uncertainties providedtpeak ≥ 20 days (usingtpeak = 30, 20 or 10 days instead of
40 days raises the rate estimates by approximately 3%, 26% and 83%, respectively). Thus,
8
if we consider ASASSN-15lh as one event over the magnitude range−23 < Mpeak < −24,
the mean rate isr ≃ 0.60 Gpc−3 year−1 with 0.21 < r < 2.8 at 90% confidence given
the Poisson uncertainties for one event. The lack of events in the magnitude ranges−21 <
Mpeak < −22 and−22 < Mpeak < −23 imply 90% confidence upper limits on the rates of
r < 22 and< 5.5 Gpc−3 year−1, respectively. This is broadly consistent with (2), who found
r ≃ 32 Gpc−3 year−1 (6 < r < 109) for SLSNe-I concentrated in the (unfiltered) magnitude
rangeMpeak ≃ −21.7± 0.4 mag, and the lack of any more luminous examples in (2) is consis-
tent with our inference of a steeply falling luminosity function. Alternately, for the rate found
by (2) we would have expected1.4 (0.3 to 4.9) events with−21 < Mpeak < −22, and our
failure to find one is compatible with Poisson expectations except at the upper end of their rate
estimates. More work is required to fully understand the SLSNe luminosity function and to
more completely quantify the ASAS-SN survey efficiency and completeness.
5 Alternative Scenarios
In this section, we examine alternative interpretations ofASASSN-15lh other than a superlumi-
nous supernova.
At this low redshift, any significant contribution from gravitational lensing is completely
implausible (see, e.g., the review by Kochanek 2006 (51) of lens properties and statistics).
Moreover, the putative lens (Mg II absorption) and source (broad absorption trough) redshifts
are identical.
That the transient’s position is consistent with the centerof the host galaxy raises the pos-
sibility that it is some form of transient created by a supermassive black hole. Of the various
possibilities, a plausible scenario is that the transient is a tidal disruption event (TDE) where
the debris from tidally destroying a star is then accreted. Normal Active Galactic Nucleus
(AGN) activity has been well-characterized as a stochasticprocess with well-defined properties
9
(e.g., (52)) that are inconsistent with the observed variability and the spectral slope of the vari-
able flux is not thermal (e.g., (53)). Only blazars and related “jetted” sources show this level of
variability, but they also have featureless, non-thermal,power law spectra (see, e.g., (54)). The
archival CRTS data (Fig. S2) show no variability at the levelof ∼ 0.3mag and is thus consistent
with no past AGN activities. We cannot rule out the possibility that the host galaxy has a weak
AGN with a level of photometric variability below the CRTS detection limits or the existence of
weak AGN emission lines that are below our current spectroscopic detection limits. This issue
will likely be clarified by further studying the host as ASASSN-15lh fades.
Nuclear outbursts do occur, with the best example being CSS100217 (55), a nuclear tran-
sient in an already active Seyfert galaxy. Its nature is debated (SLSN-II or TDE), but it has
prominent and changing hydrogen Balmer lines during the transient, which are not seen at all
in ASASSN-15lh spectra, suggesting that they have different origins.
A fundamental problem for interpreting ASASSN-15lh as a TDEis the lack of both hydro-
gen and helium emission lines. Almost all known TDEs show varying combinations of strong,
broad Hα/Hβ and HeII 4686A emission lines (e.g. (56)). In the initial phases, the apparent tem-
perature of ASASSN-15lh combined with its luminosity implies the generation of large numbers
of ionizing photons (Q ∼ 1055 s−1 above 13.6 eV). A large fraction of these photons photo-
ionize hydrogen and helium and must eventually produce recombination lines. The nature of
the TDE process makes it very difficult to avoid having moderate density gas associated with
the disruption that will do the reprocessing. The balance between hydrogen and helium can vary
both due to the composition of the star (e.g., the helium starhypothesis for PS1-10jh, (57)) and
variations in the effective temperature. For example, (58) make very strong arguments that the
only way to avoid having hydrogen emission lines from PS1-10jh is to have no hydrogen to be-
gin with. By extension, the only way to avoid having both hydrogen and helium emission lines
from a TDE is to have neither element, through the disruptionof a Wolf-Rayet star stripped of
10
both elements. We also note that the UV/optical spectral energy distributions of TDEs generally
are very slowly evolving and hot (staying∼ 20000 to 40000 K for many months after the peak,
see (56, 59, 60)). Their apparent photospheres do not show the steady cooling and expanding
ejecta from explosive events like supernovae or ASASSN-15lh (see Fig. 3).
The event called “Dougie” (61) was an off-nuclear transient with a featureless spectra. The
temperature evolution from∼ 13000 k to∼ 6300 K is typical of supernova and not observed in
other TDE candidates, both suggesting it was likely a supernova. PS1-11af (62) is regarded as
a TDE candidate and showed a blue featureless spectra. Its temperature stayed approximately
constant for three months after the peak, which is typical for a TDE but significantly differs
from ASASSN-15lh. For both “Dougie” and PS1-11af, there areno clear spectral features that
resemble those seen in ASASSN-15lh.
Finally, the very massive, compact, and old host of ASASSN-15lh would likely imply a
large central supermassive black hole mass (63). Since TDEs strongly favor relatively low-
mass supermassive black holes, this adds to the argument against the TDE interpretation of
ASASSN-15lh.
Further Acknowledgement
The authors thank PI Neil Gehrels and the Swift ToO team for promptly approving and ex-
ecuting our observations. This research has made use of the XRT Data Analysis Software
(XRTDAS) developed under the responsibility of the ASI Science Data Center (ASDC), Italy.
At Penn State the NASA Swift program is support through contract NAS5- 00136. We thank
LCOGT and its staff for their continued support of ASAS-SN. This work makes use of ob-
servations from the LCOGT network. This research uses data obtained through the Telescope
Access Program (TAP), which has been funded by the “the Strategic Priority Research Program-
The Emergence of Cosmological Structures” of the Chinese Academy of Sciences (Grant No.
11
XDB09000000) and the Special Fund for Astronomy from the Ministry of Finance. We thank
Eric Depagne, Marissa Kotze, Paul Kotze, and Brent Miszalski (SALT staff). This paper in-
cludes data gathered with the 2.5m du Pont Telescope and the 6.5m Magellan Clay Telescope
located at Las Campanas Observatory, Chile. Based in part ondata products from observations
made with ESO Telescopes at the Paranal Observatories underESO program ID 179.A-2010.
We also acknowledge CN2015A-85. The LANL LDRD program is funded by US Department
of Energy. This research was made possible through the use ofthe AAVSO Photometric All-Sky
Survey (APASS), funded by the Robert Martin Ayers Sciences Fund. This research has made
use of the NASA/IPAC Extragalactic Database (NED), which isoperated by the Jet Propulsion
Laboratory, California Institute of Technology, under contract with the National Aeronautics
and Space Administration.
12
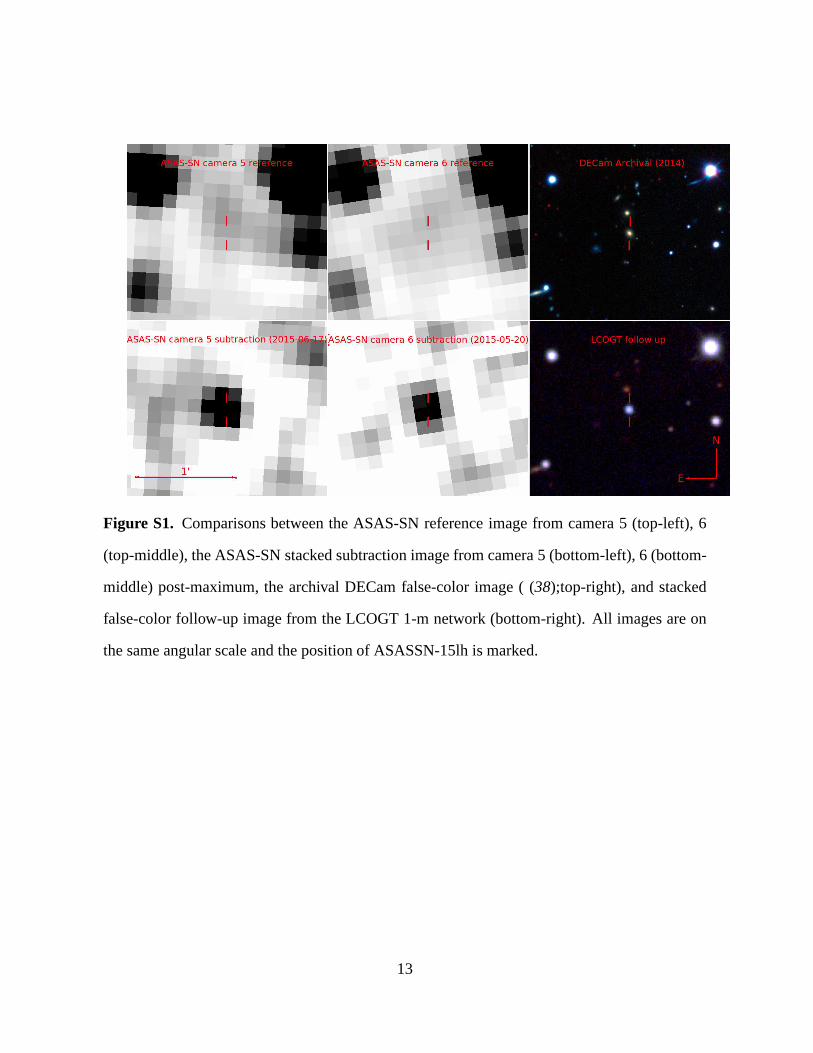
Figure S1. Comparisons between the ASAS-SN reference image from camera 5 (top-left), 6
(top-middle), the ASAS-SN stacked subtraction image from camera 5 (bottom-left), 6 (bottom-
middle) post-maximum, the archival DECam false-color image ( (38);top-right), and stacked
false-color follow-up image from the LCOGT 1-m network (bottom-right). All images are on
the same angular scale and the position of ASASSN-15lh is marked.
13
−3500 −3000 −2500 −2000 −1500 −1000
17
17.5
18
18.5
19
19.5
20
20.5
21t − t
peak (JD 2457179) (days)
mC
RT
S, u
nfilt
ered
Archival Host Galaxy Light Curve from CRTS
Figure S2.Pre-explosion archival un-filtered photometry of APMUKS(BJ) B215839.70-615403.9
(host galaxy of ASASSN-15lh) from the CRTS survey. The axis shows the time of observation
with respect to the peak date of ASASSN-15lh. The mean magnitude is18.5 (blue line). Over
∼ 7.3 years of monitoring, the host is consistent with no photometric variability at the level of
0.3mag.
14
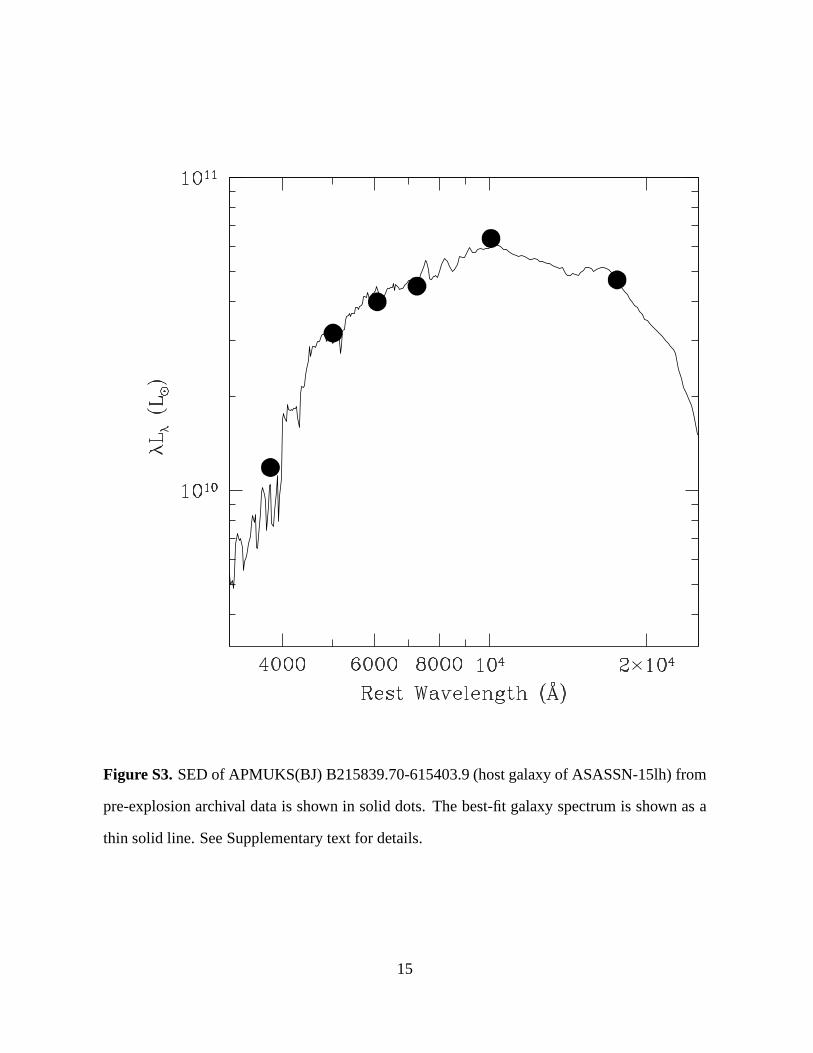
Figure S3.SED of APMUKS(BJ) B215839.70-615403.9 (host galaxy of ASASSN-15lh) from
pre-explosion archival data is shown in solid dots. The best-fit galaxy spectrum is shown as a
thin solid line. See Supplementary text for details.
15
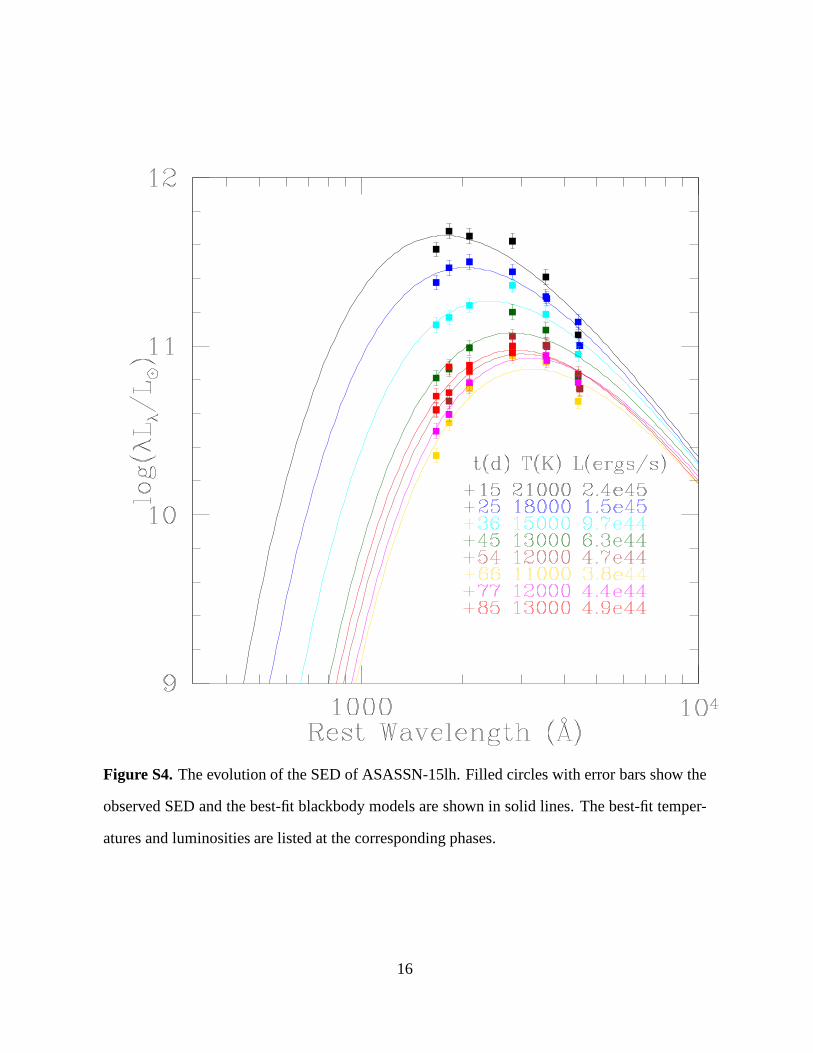
Figure S4.The evolution of the SED of ASASSN-15lh. Filled circles witherror bars show the
observed SED and the best-fit blackbody models are shown in solid lines. The best-fit temper-
atures and luminosities are listed at the corresponding phases.
16
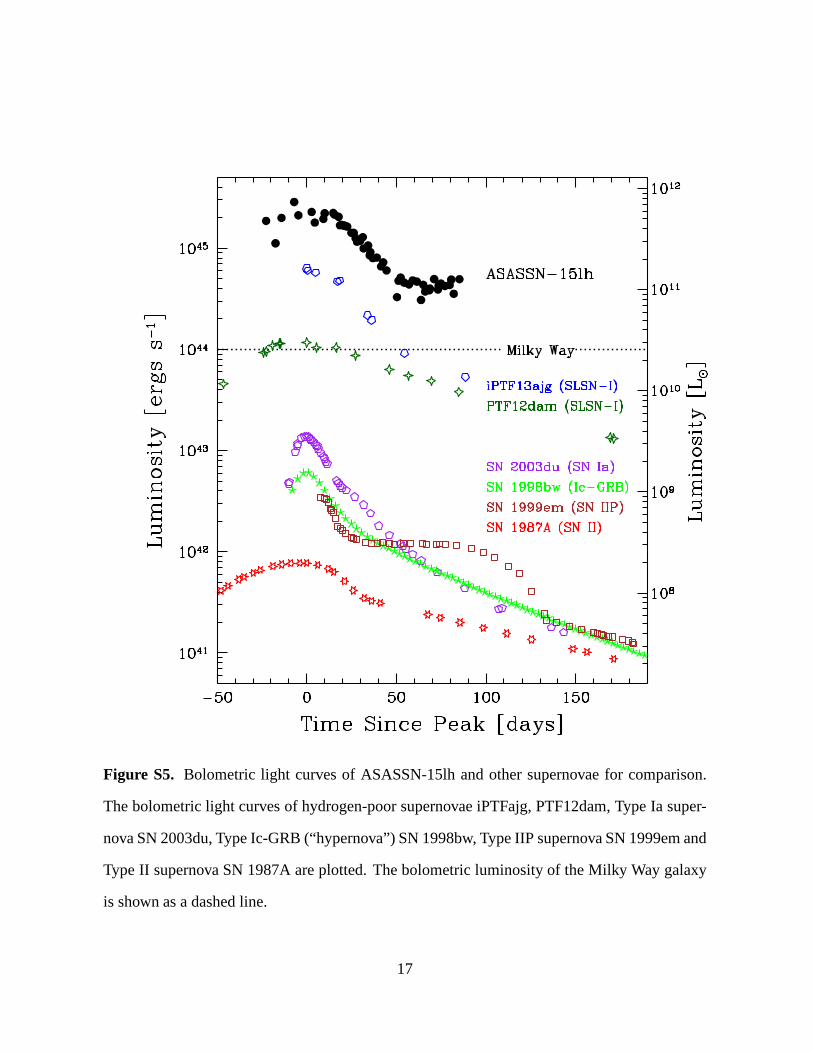
Figure S5. Bolometric light curves of ASASSN-15lh and other supernovae for comparison.
The bolometric light curves of hydrogen-poor supernovae iPTFajg, PTF12dam, Type Ia super-
nova SN 2003du, Type Ic-GRB (“hypernova”) SN 1998bw, Type IIP supernova SN 1999em and
Type II supernova SN 1987A are plotted. The bolometric luminosity of the Milky Way galaxy
is shown as a dashed line.
17
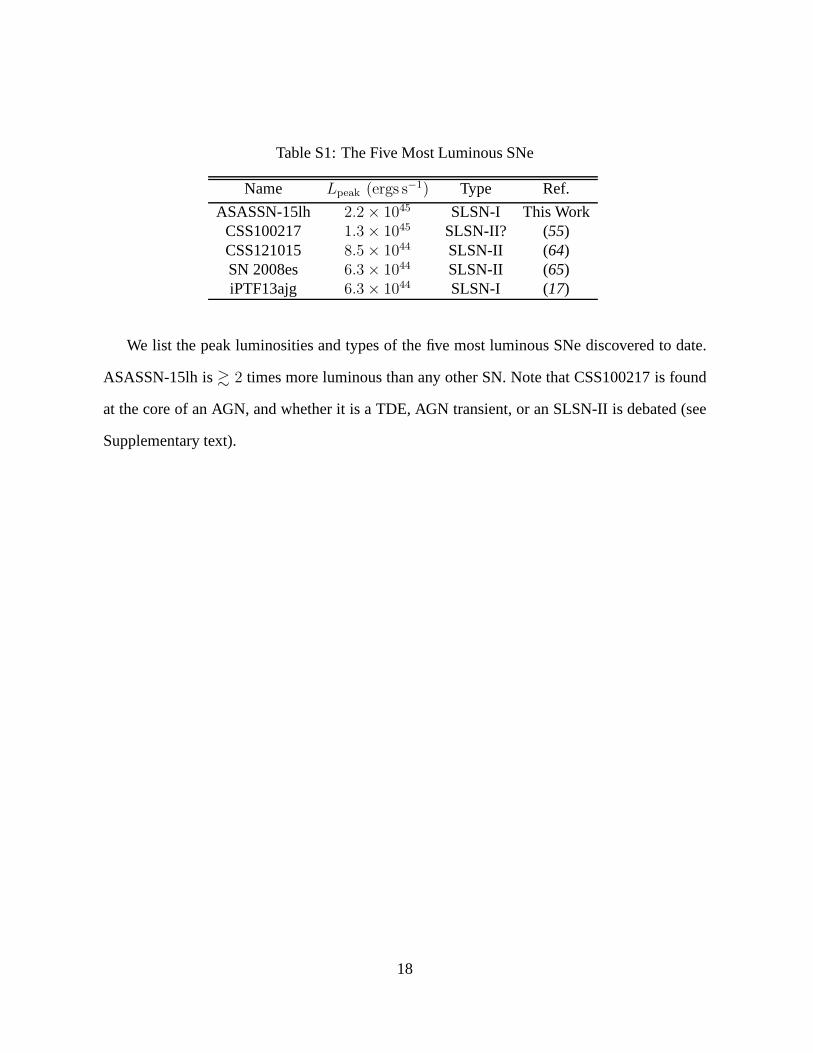
Table S1: The Five Most Luminous SNe
Name Lpeak (ergs s−1) Type Ref.
ASASSN-15lh 2.2× 1045 SLSN-I This WorkCSS100217 1.3× 1045 SLSN-II? (55)CSS121015 8.5× 1044 SLSN-II (64)SN 2008es 6.3× 1044 SLSN-II (65)iPTF13ajg 6.3× 1044 SLSN-I (17)
We list the peak luminosities and types of the five most luminous SNe discovered to date.
ASASSN-15lh is& 2 times more luminous than any other SN. Note that CSS100217 isfound
at the core of an AGN, and whether it is a TDE, AGN transient, oran SLSN-II is debated (see
Supplementary text).
18

Table S2: Blackbody TemperatureTBB, RadiusRBB and bolometric luminosity L derived fromSED fitting with a linear temperature prior at early time.
MJD Nobs logL(L⊙) logL− logL+ log T (K) log T− log T+ logR(cm) logR− logR+
57150.5 1 11.69 11.49 11.89 4.44 4.36 4.52 15.34 15.26 15.4257157.0 1 11.46 11.28 11.67 4.41 4.33 4.50 15.28 15.20 15.3657161.1 1 11.72 11.53 11.91 4.40 4.32 4.49 15.42 15.34 15.5057169.8 1 11.87 11.69 12.07 4.38 4.30 4.46 15.55 15.46 15.6357172.7 1 11.74 11.56 11.94 4.37 4.28 4.45 15.51 15.42 15.5957181.8 1 11.78 11.60 11.97 4.33 4.25 4.42 15.59 15.51 15.6857184.0 1 11.67 11.50 11.86 4.32 4.24 4.41 15.56 15.47 15.6557189.9 2 11.71 11.55 11.88 4.30 4.22 4.38 15.62 15.53 15.7157190.8 4 11.76 11.61 11.92 4.35 4.28 4.42 15.55 15.48 15.6357196.7 4 11.76 11.63 11.91 4.31 4.24 4.38 15.63 15.55 15.7257197.5 6 11.75 11.71 11.79 4.29 4.26 4.33 15.66 15.60 15.7157200.3 7 11.73 11.69 11.78 4.32 4.29 4.35 15.60 15.55 15.6557201.3 3 11.64 11.51 11.80 4.31 4.24 4.38 15.57 15.49 15.6557202.2 6 11.65 11.62 11.68 4.23 4.20 4.26 15.73 15.67 15.7957203.6 2 11.64 11.51 11.79 4.28 4.20 4.35 15.64 15.55 15.7357204.7 2 11.64 11.51 11.78 4.27 4.20 4.35 15.64 15.55 15.7457206.2 8 11.63 11.60 11.66 4.26 4.23 4.29 15.67 15.62 15.7257209.1 8 11.57 11.54 11.60 4.23 4.21 4.26 15.69 15.64 15.7457210.7 1 11.57 11.45 11.71 4.22 4.13 4.30 15.72 15.61 15.8557212.0 6 11.52 11.49 11.55 4.20 4.17 4.22 15.73 15.68 15.7957213.0 2 11.48 11.37 11.61 4.22 4.15 4.30 15.66 15.57 15.7657215.2 6 11.49 11.46 11.52 4.20 4.17 4.23 15.71 15.65 15.7757217.0 2 11.53 11.46 11.60 4.13 4.09 4.17 15.88 15.78 15.9857217.5 3 11.41 11.37 11.46 4.20 4.17 4.24 15.67 15.61 15.7257220.6 4 11.44 11.39 11.50 4.13 4.10 4.16 15.83 15.74 15.9257221.7 2 11.35 11.24 11.47 4.19 4.12 4.27 15.65 15.56 15.7657222.2 6 11.38 11.35 11.41 4.17 4.14 4.19 15.72 15.67 15.7857223.9 7 11.32 11.29 11.35 4.17 4.14 4.19 15.70 15.65 15.7457226.6 6 11.32 11.29 11.36 4.11 4.09 4.14 15.80 15.75 15.8657229.6 7 11.24 11.21 11.27 4.12 4.10 4.15 15.74 15.69 15.7957231.0 1 11.28 11.19 11.37 4.11 4.03 4.19 15.79 15.66 15.9457233.3 6 11.20 11.16 11.23 4.10 4.08 4.13 15.76 15.71 15.8157240.5 1 10.93 10.84 11.04 4.04 3.96 4.13 15.74 15.62 15.8857241.5 7 11.09 11.06 11.12 4.09 4.07 4.11 15.73 15.69 15.7857243.0 2 11.13 11.05 11.22 4.10 4.03 4.17 15.74 15.63 15.8557245.4 10 11.08 11.05 11.10 4.07 4.06 4.09 15.76 15.72 15.8057248.7 7 11.06 11.03 11.09 4.07 4.05 4.09 15.76 15.72 15.8157251.2 8 11.10 11.07 11.13 4.06 4.04 4.08 15.80 15.76 15.8457254.1 7 11.09 11.05 11.12 4.06 4.05 4.08 15.79 15.74 15.8357257.0 1 10.90 10.81 11.01 4.04 3.96 4.12 15.74 15.62 15.8857258.5 2 11.05 10.98 11.15 4.11 4.04 4.18 15.68 15.58 15.8057259.8 6 10.99 10.95 11.03 4.05 4.03 4.07 15.77 15.72 15.82
19
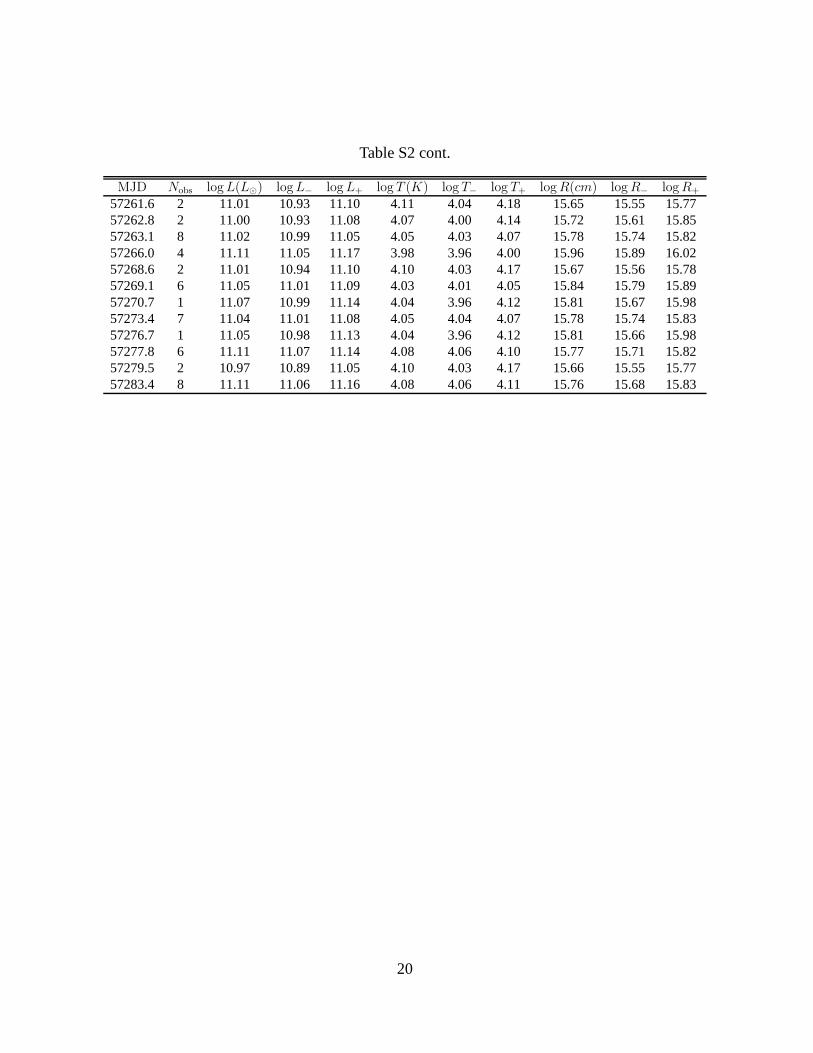
Table S2 cont.
MJD Nobs logL(L⊙) logL− logL+ log T (K) log T− log T+ logR(cm) logR− logR+
57261.6 2 11.01 10.93 11.10 4.11 4.04 4.18 15.65 15.55 15.7757262.8 2 11.00 10.93 11.08 4.07 4.00 4.14 15.72 15.61 15.8557263.1 8 11.02 10.99 11.05 4.05 4.03 4.07 15.78 15.74 15.8257266.0 4 11.11 11.05 11.17 3.98 3.96 4.00 15.96 15.89 16.0257268.6 2 11.01 10.94 11.10 4.10 4.03 4.17 15.67 15.56 15.7857269.1 6 11.05 11.01 11.09 4.03 4.01 4.05 15.84 15.79 15.8957270.7 1 11.07 10.99 11.14 4.04 3.96 4.12 15.81 15.67 15.9857273.4 7 11.04 11.01 11.08 4.05 4.04 4.07 15.78 15.74 15.8357276.7 1 11.05 10.98 11.13 4.04 3.96 4.12 15.81 15.66 15.9857277.8 6 11.11 11.07 11.14 4.08 4.06 4.10 15.77 15.71 15.8257279.5 2 10.97 10.89 11.05 4.10 4.03 4.17 15.66 15.55 15.7757283.4 8 11.11 11.06 11.16 4.08 4.06 4.11 15.76 15.68 15.83
20
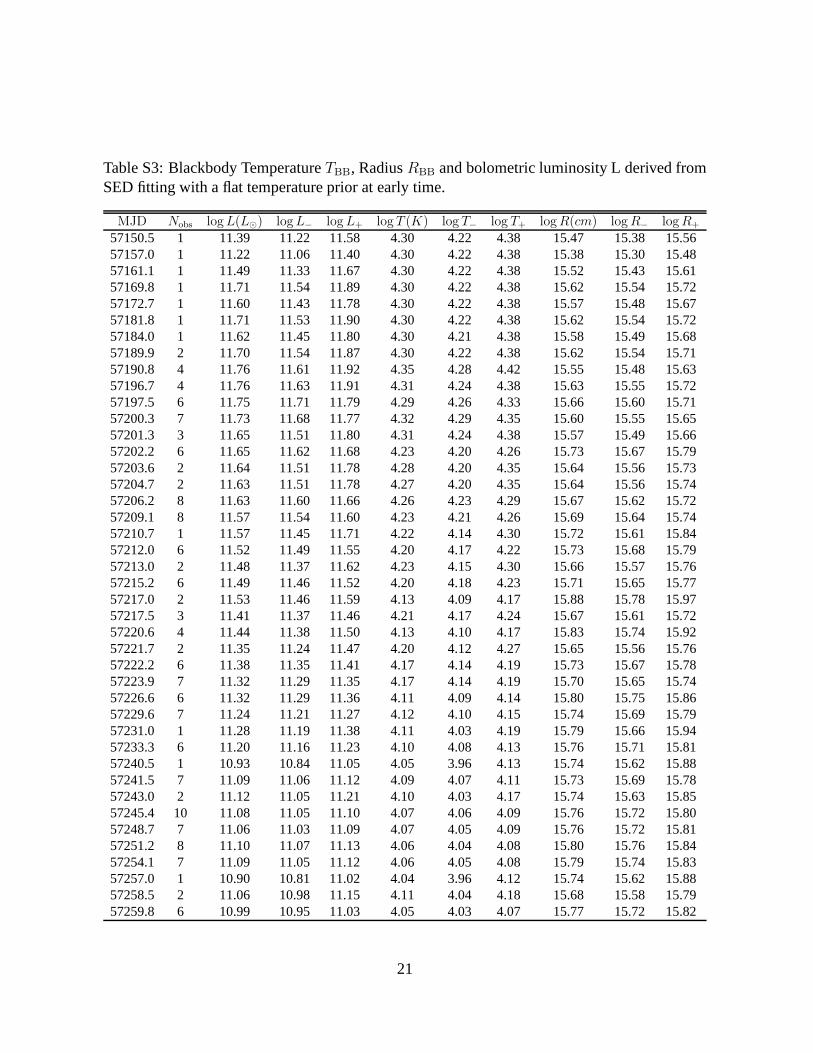
Table S3: Blackbody TemperatureTBB, RadiusRBB and bolometric luminosity L derived fromSED fitting with a flat temperature prior at early time.
MJD Nobs logL(L⊙) logL− logL+ log T (K) log T− log T+ logR(cm) logR− logR+
57150.5 1 11.39 11.22 11.58 4.30 4.22 4.38 15.47 15.38 15.5657157.0 1 11.22 11.06 11.40 4.30 4.22 4.38 15.38 15.30 15.4857161.1 1 11.49 11.33 11.67 4.30 4.22 4.38 15.52 15.43 15.6157169.8 1 11.71 11.54 11.89 4.30 4.22 4.38 15.62 15.54 15.7257172.7 1 11.60 11.43 11.78 4.30 4.22 4.38 15.57 15.48 15.6757181.8 1 11.71 11.53 11.90 4.30 4.22 4.38 15.62 15.54 15.7257184.0 1 11.62 11.45 11.80 4.30 4.21 4.38 15.58 15.49 15.6857189.9 2 11.70 11.54 11.87 4.30 4.22 4.38 15.62 15.54 15.7157190.8 4 11.76 11.61 11.92 4.35 4.28 4.42 15.55 15.48 15.6357196.7 4 11.76 11.63 11.91 4.31 4.24 4.38 15.63 15.55 15.7257197.5 6 11.75 11.71 11.79 4.29 4.26 4.33 15.66 15.60 15.7157200.3 7 11.73 11.68 11.77 4.32 4.29 4.35 15.60 15.55 15.6557201.3 3 11.65 11.51 11.80 4.31 4.24 4.38 15.57 15.49 15.6657202.2 6 11.65 11.62 11.68 4.23 4.20 4.26 15.73 15.67 15.7957203.6 2 11.64 11.51 11.78 4.28 4.20 4.35 15.64 15.56 15.7357204.7 2 11.63 11.51 11.78 4.27 4.20 4.35 15.64 15.56 15.7457206.2 8 11.63 11.60 11.66 4.26 4.23 4.29 15.67 15.62 15.7257209.1 8 11.57 11.54 11.60 4.23 4.21 4.26 15.69 15.64 15.7457210.7 1 11.57 11.45 11.71 4.22 4.14 4.30 15.72 15.61 15.8457212.0 6 11.52 11.49 11.55 4.20 4.17 4.22 15.73 15.68 15.7957213.0 2 11.48 11.37 11.62 4.23 4.15 4.30 15.66 15.57 15.7657215.2 6 11.49 11.46 11.52 4.20 4.18 4.23 15.71 15.65 15.7757217.0 2 11.53 11.46 11.59 4.13 4.09 4.17 15.88 15.78 15.9757217.5 3 11.41 11.37 11.46 4.21 4.17 4.24 15.67 15.61 15.7257220.6 4 11.44 11.38 11.50 4.13 4.10 4.17 15.83 15.74 15.9257221.7 2 11.35 11.24 11.47 4.20 4.12 4.27 15.65 15.56 15.7657222.2 6 11.38 11.35 11.41 4.17 4.14 4.19 15.73 15.67 15.7857223.9 7 11.32 11.29 11.35 4.17 4.14 4.19 15.70 15.65 15.7457226.6 6 11.32 11.29 11.36 4.11 4.09 4.14 15.80 15.75 15.8657229.6 7 11.24 11.21 11.27 4.12 4.10 4.15 15.74 15.69 15.7957231.0 1 11.28 11.19 11.38 4.11 4.03 4.19 15.79 15.66 15.9457233.3 6 11.20 11.16 11.23 4.10 4.08 4.13 15.76 15.71 15.8157240.5 1 10.93 10.84 11.05 4.05 3.96 4.13 15.74 15.62 15.8857241.5 7 11.09 11.06 11.12 4.09 4.07 4.11 15.73 15.69 15.7857243.0 2 11.12 11.05 11.21 4.10 4.03 4.17 15.74 15.63 15.8557245.4 10 11.08 11.05 11.10 4.07 4.06 4.09 15.76 15.72 15.8057248.7 7 11.06 11.03 11.09 4.07 4.05 4.09 15.76 15.72 15.8157251.2 8 11.10 11.07 11.13 4.06 4.04 4.08 15.80 15.76 15.8457254.1 7 11.09 11.05 11.12 4.06 4.05 4.08 15.79 15.74 15.8357257.0 1 10.90 10.81 11.02 4.04 3.96 4.12 15.74 15.62 15.8857258.5 2 11.06 10.98 11.15 4.11 4.04 4.18 15.68 15.58 15.7957259.8 6 10.99 10.95 11.03 4.05 4.03 4.07 15.77 15.72 15.82
21
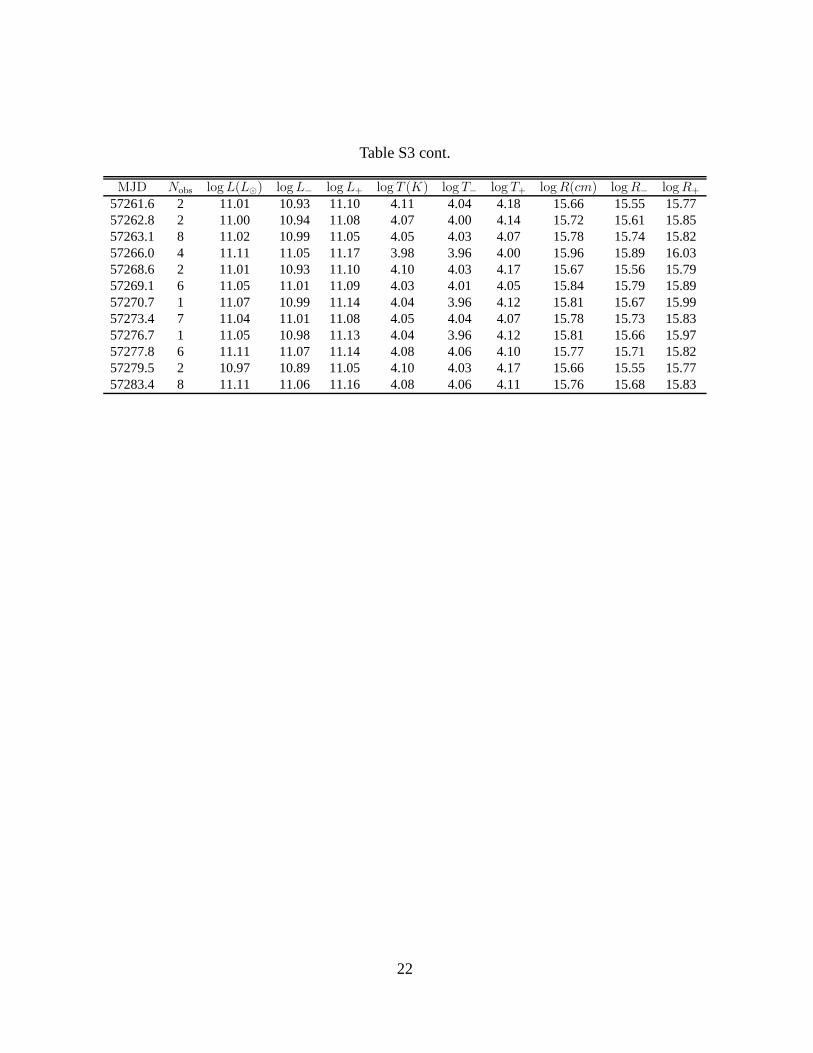
Table S3 cont.
MJD Nobs logL(L⊙) logL− logL+ log T (K) log T− log T+ logR(cm) logR− logR+
57261.6 2 11.01 10.93 11.10 4.11 4.04 4.18 15.66 15.55 15.7757262.8 2 11.00 10.94 11.08 4.07 4.00 4.14 15.72 15.61 15.8557263.1 8 11.02 10.99 11.05 4.05 4.03 4.07 15.78 15.74 15.8257266.0 4 11.11 11.05 11.17 3.98 3.96 4.00 15.96 15.89 16.0357268.6 2 11.01 10.93 11.10 4.10 4.03 4.17 15.67 15.56 15.7957269.1 6 11.05 11.01 11.09 4.03 4.01 4.05 15.84 15.79 15.8957270.7 1 11.07 10.99 11.14 4.04 3.96 4.12 15.81 15.67 15.9957273.4 7 11.04 11.01 11.08 4.05 4.04 4.07 15.78 15.73 15.8357276.7 1 11.05 10.98 11.13 4.04 3.96 4.12 15.81 15.66 15.9757277.8 6 11.11 11.07 11.14 4.08 4.06 4.10 15.77 15.71 15.8257279.5 2 10.97 10.89 11.05 4.10 4.03 4.17 15.66 15.55 15.7757283.4 8 11.11 11.06 11.16 4.08 4.06 4.11 15.76 15.68 15.83
22
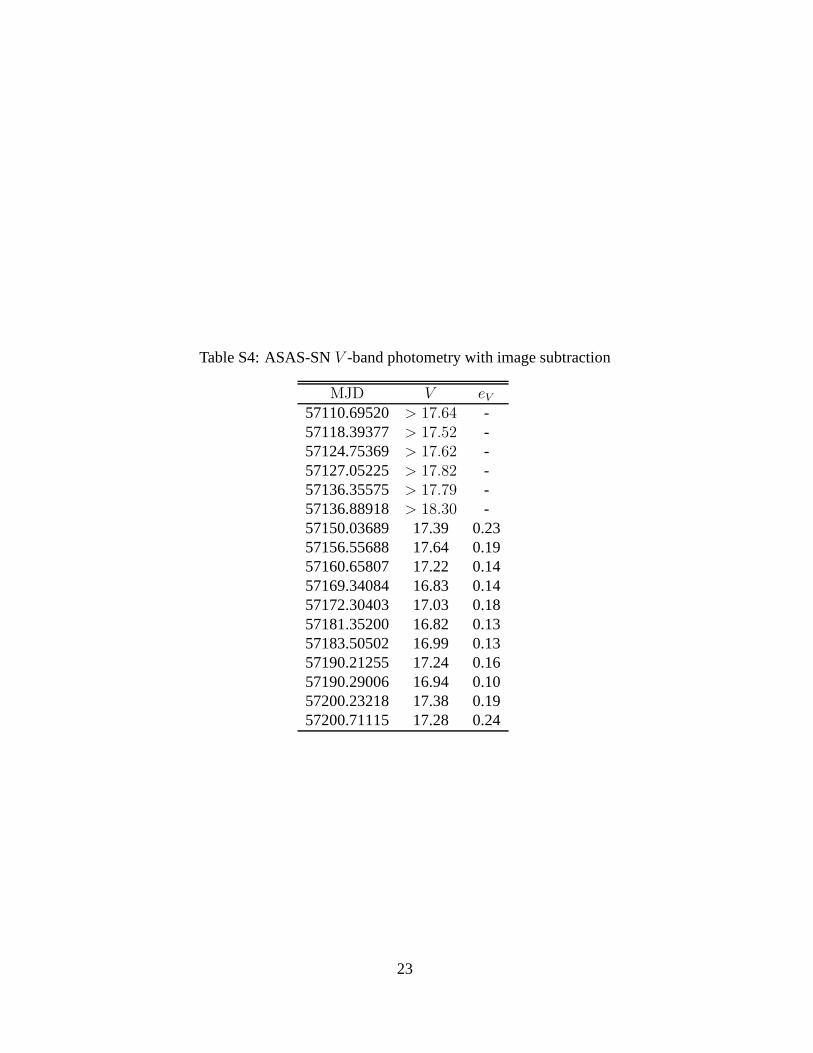
Table S4: ASAS-SNV -band photometry with image subtraction
MJD V eV57110.69520 > 17.64 -57118.39377 > 17.52 -57124.75369 > 17.62 -57127.05225 > 17.82 -57136.35575 > 17.79 -57136.88918 > 18.30 -57150.03689 17.39 0.2357156.55688 17.64 0.1957160.65807 17.22 0.1457169.34084 16.83 0.1457172.30403 17.03 0.1857181.35200 16.82 0.1357183.50502 16.99 0.1357190.21255 17.24 0.1657190.29006 16.94 0.1057200.23218 17.38 0.1957200.71115 17.28 0.24
23
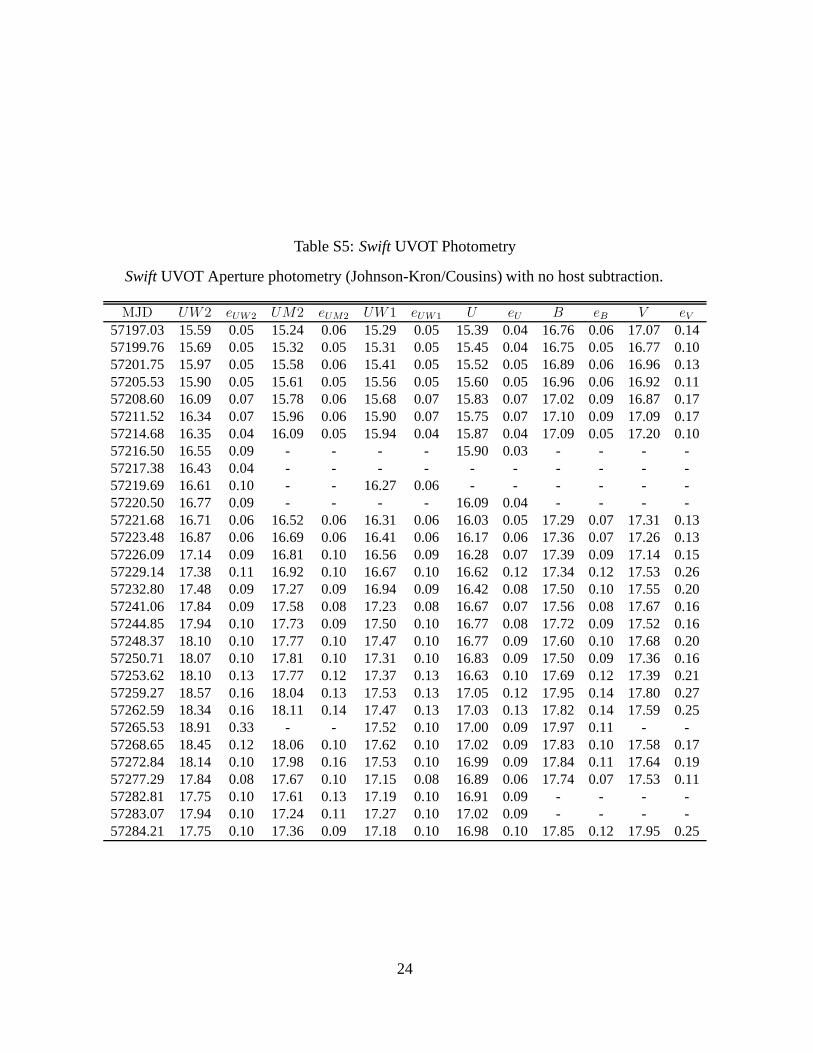
Table S5:SwiftUVOT Photometry
SwiftUVOT Aperture photometry (Johnson-Kron/Cousins) with no host subtraction.
MJD UW2 eUW2 UM2 eUM2 UW1 eUW1 U eU B eB V eV57197.03 15.59 0.05 15.24 0.06 15.29 0.05 15.39 0.04 16.76 0.06 17.07 0.1457199.76 15.69 0.05 15.32 0.05 15.31 0.05 15.45 0.04 16.75 0.05 16.77 0.1057201.75 15.97 0.05 15.58 0.06 15.41 0.05 15.52 0.05 16.89 0.06 16.96 0.1357205.53 15.90 0.05 15.61 0.05 15.56 0.05 15.60 0.05 16.96 0.06 16.92 0.1157208.60 16.09 0.07 15.78 0.06 15.68 0.07 15.83 0.07 17.02 0.09 16.87 0.1757211.52 16.34 0.07 15.96 0.06 15.90 0.07 15.75 0.07 17.10 0.09 17.09 0.1757214.68 16.35 0.04 16.09 0.05 15.94 0.04 15.87 0.04 17.09 0.05 17.20 0.1057216.50 16.55 0.09 - - - - 15.90 0.03 - - - -57217.38 16.43 0.04 - - - - - - - - - -57219.69 16.61 0.10 - - 16.27 0.06 - - - - - -57220.50 16.77 0.09 - - - - 16.09 0.04 - - - -57221.68 16.71 0.06 16.52 0.06 16.31 0.06 16.03 0.05 17.29 0.07 17.31 0.1357223.48 16.87 0.06 16.69 0.06 16.41 0.06 16.17 0.06 17.36 0.07 17.26 0.1357226.09 17.14 0.09 16.81 0.10 16.56 0.09 16.28 0.07 17.39 0.09 17.14 0.1557229.14 17.38 0.11 16.92 0.10 16.67 0.10 16.62 0.12 17.34 0.12 17.53 0.2657232.80 17.48 0.09 17.27 0.09 16.94 0.09 16.42 0.08 17.50 0.10 17.55 0.2057241.06 17.84 0.09 17.58 0.08 17.23 0.08 16.67 0.07 17.56 0.08 17.67 0.1657244.85 17.94 0.10 17.73 0.09 17.50 0.10 16.77 0.08 17.72 0.09 17.52 0.1657248.37 18.10 0.10 17.77 0.10 17.47 0.10 16.77 0.09 17.60 0.10 17.68 0.2057250.71 18.07 0.10 17.81 0.10 17.31 0.10 16.83 0.09 17.50 0.09 17.36 0.1657253.62 18.10 0.13 17.77 0.12 17.37 0.13 16.63 0.10 17.69 0.12 17.39 0.2157259.27 18.57 0.16 18.04 0.13 17.53 0.13 17.05 0.12 17.95 0.14 17.80 0.2757262.59 18.34 0.16 18.11 0.14 17.47 0.13 17.03 0.13 17.82 0.14 17.59 0.2557265.53 18.91 0.33 - - 17.52 0.10 17.00 0.09 17.97 0.11 - -57268.65 18.45 0.12 18.06 0.10 17.62 0.10 17.02 0.09 17.83 0.10 17.58 0.1757272.84 18.14 0.10 17.98 0.16 17.53 0.10 16.99 0.09 17.84 0.11 17.64 0.1957277.29 17.84 0.08 17.67 0.10 17.15 0.08 16.89 0.06 17.74 0.07 17.53 0.1157282.81 17.75 0.10 17.61 0.13 17.19 0.10 16.91 0.09 - - - -57283.07 17.94 0.10 17.24 0.11 17.27 0.10 17.02 0.09 - - - -57284.21 17.75 0.10 17.36 0.09 17.18 0.10 16.98 0.10 17.85 0.12 17.95 0.25
24
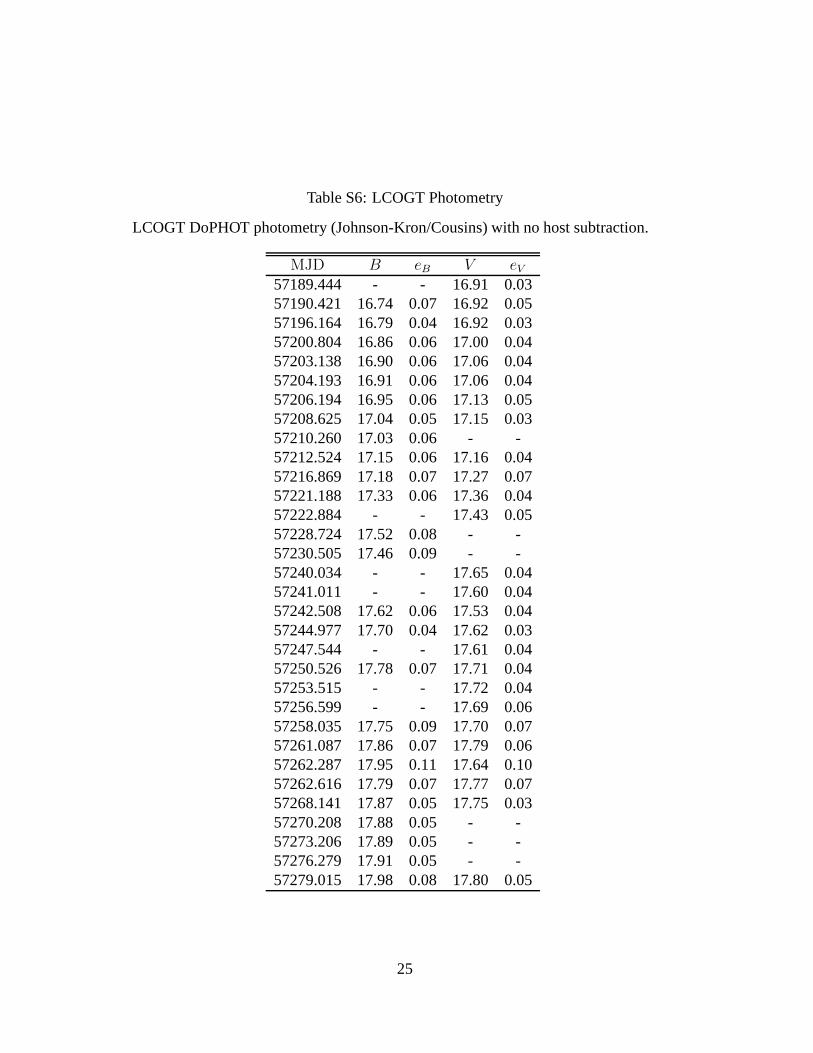
Table S6: LCOGT Photometry
LCOGT DoPHOT photometry (Johnson-Kron/Cousins) with no host subtraction.
MJD B eB V eV57189.444 - - 16.91 0.0357190.421 16.74 0.07 16.92 0.0557196.164 16.79 0.04 16.92 0.0357200.804 16.86 0.06 17.00 0.0457203.138 16.90 0.06 17.06 0.0457204.193 16.91 0.06 17.06 0.0457206.194 16.95 0.06 17.13 0.0557208.625 17.04 0.05 17.15 0.0357210.260 17.03 0.06 - -57212.524 17.15 0.06 17.16 0.0457216.869 17.18 0.07 17.27 0.0757221.188 17.33 0.06 17.36 0.0457222.884 - - 17.43 0.0557228.724 17.52 0.08 - -57230.505 17.46 0.09 - -57240.034 - - 17.65 0.0457241.011 - - 17.60 0.0457242.508 17.62 0.06 17.53 0.0457244.977 17.70 0.04 17.62 0.0357247.544 - - 17.61 0.0457250.526 17.78 0.07 17.71 0.0457253.515 - - 17.72 0.0457256.599 - - 17.69 0.0657258.035 17.75 0.09 17.70 0.0757261.087 17.86 0.07 17.79 0.0657262.287 17.95 0.11 17.64 0.1057262.616 17.79 0.07 17.77 0.0757268.141 17.87 0.05 17.75 0.0357270.208 17.88 0.05 - -57273.206 17.89 0.05 - -57276.279 17.91 0.05 - -57279.015 17.98 0.08 17.80 0.05
25