Embed Size (px)
Citation preview

ASB/BNPP Pantropic Analysis
Kate SebastianIFPRI

• Stratification of the pan-tropics
• A framework and a collection of databases for broadly identifying critical or priority areas and extrapolating research findings
• Improve the spatial characterization of the focus area in terms of …
• Biodiversity-rich habitats• Physical hydrology• Human population• Forest transition areas
Phase I Results
Phase II Activities

Climate based (AEZ) Stratification
Warm humid and subhumid tropics
ASB site locations#S
Warm subhumid tropicsWarm humid tropics
Source: IFPRI (2001) based on FAO/IIASA GAEZ Database (1999).
What defines
the limits of the
pantropic focus area?

Terrestrial Biomes by Realm
Source: WWF Global 200 Ecoregions (WWF 2001).Notes: The Biomes displayed are the biomes that are present in the warm humid and subhumid tropics.
ASB site locations#S
Terrestrial BiomesTropical and Subtropical Moist Broadleaf ForestsTropical and Subtropical Dry and Monsoon Broadleaf Forests
Focus areaDividing line between humid and subhumid tropics
Tropical and Subtropical Coniferous ForestsTropical and Subtropical Grasslands, Savannas & ShrublandsFlooded Grasslands & Savannas
Neotropical
AfrotropicalIndomalay
Australasia
Biodiversity based Strati-fication
WWF
Terrestrial
Ecoregions
Realms (8)
Biomes (14)
Ecoregions (220)

Forest Biomes by Realm
Source: WWF Global 200 Ecoregions (WWF 2001).Notes: The Biomes displayed are only forest biomes that are present in the warm humid and subhumid tropics.
Terrestrial Forest BiomesTropical and Subtropical Moist Broadleaf ForestsTropical and Subtropical Dry and Monsoon Broadleaf Forests
Focus areaDividing line between humid and subhumid tropics
ASB site locations#S
Neotropical
AfrotropicalIndomalay
Australasia
Why are these
different?

What did/can we learn from these stratifications and other global datasets?

What share of the tropics is in the climate derived focus area?
Area Area share Population Pop share(000 sq km) (percent) (000 people) (percent)
Humid 14,343 29.7% 548,168 28.4% Warm 13,203 92.1% 444,448 81.1% Moderately cool / cool / cold 1,139 7.9% 103,720 18.9%
Subhumid 12,053 24.9% 747,046 38.7% Warm 10,838 89.9% 641,263 85.8% Moderately cool / cool / cold 1,214 10.1% 105,783 14.2%
Arid / Semi-arid 21,942 45.4% 632,875 32.8%
Total tropics 48,338 100.0% 1,928,089 100.0%
Focus Area 24,042 49.7% 1,085,711 56.3%
Tropics

How many people live in the biodiversity derived focus area?
Tropical and Subtropical
Moist Broadleaf
Forest
Tropical and Subtropical Dry
Broadleaf Forest
Tropical and Subtropical
Moist Broadleaf
Forest
Tropical and Subtropical Dry
Broadleaf Forest
Central America & the Caribbean Warm humid tropics 15,921 3,111 1.9 0.4 Warm subhumid tropics 11,412 11,263 1.3 1.3
Total 27,333 14,374 3.2 1.7
South America Warm humid tropics 37,827 2,707 4.4 0.3 Warm subhumid tropics 26,498 3,631 3.1 0.4
Total 64,325 6,338 7.5 0.7
Sub-Saharan Africa Warm humid tropics 59,869 213 7.0 0.0 Warm subhumid tropics 26,290 782 3.1 0.1
Total 86,159 995 10.1 0.1
Insular Southeast Asia Warm humid tropics 170,796 5,139 19.9 0.6 Warm subhumid tropics 23,873 15,490 2.8 1.8
Total 194,669 20,629 22.7 2.4
Mainland Asia Warm humid tropics 53,381 26,176 6.2 3.1 Warm subhumid tropics 103,511 258,793 12.1 30.2
Total 156,892 284,970 18.3 33.3
(000 people) (share of focus area - percent)
Population for the pantropic focus area
WarmTropics:
1.1 billion
529.3 million

Phase II : Improve the spatial characterization of the focus area and define critical areas in
terms of …
•Biodiversity-rich habitats•Physical hydrology•Human population•Forest transition areas

Global 200 EcoregionsWithin moist broadleaf forest biome
by biogeographical realm
Dividing line between humid and subhumid tropicsFocus area
Source: WWF Global 200 Ecoregions (WWF 2001).
ASB site locations#S
Each polygon represents a Global 200 ecoregion of which any portion falls within the tropics focus area.
Critical Areas
based on potential threats to biodiversit
y

How much of the focus area is considered of biodiversity
importance?
Total AEZFocus Area
Global 200* Total Area
Global 200* Area within focus region
Share of focus area in Global 200*
Share of Global 200* in focus area
(sq km) (sq km) (sq km)
Central America & Caribbean 867,212 315,483 89,294 10.3% 28.3%South America 10,511,001 6,686,896 5,313,585 50.6% 79.5%Sub-Saharan Africa 7,915,363 2,797,917 2,371,069 30.0% 84.7%Mainland Asia 2,261,473 3,120,785 1,352,313 59.8% 43.3%Insular SE Asia 2,319,902 1,677,802 1,616,155 69.7% 96.3%Other 77,751 37,199 23,700 30.5% 63.7%
Total 23,952,702 14,636,082 10,766,116 44.9% 73.6%
* includes only those Global 200 ecoregions that coincide with the focus region

Where are the ASB sites located in relation to the Global 200 Ecoregions &
Clusters of ASB sites Global 200 Ecoregion BDI*Current Status Threat
Future Status
Priority Status Global Status
Mindinao_Phillipines Philippines moist forests Highest Critical - Critical HighestCritical or Endangered
Yurimaguas_Peru Napo moist forests Highest - - - HighestCritical or Endangered
Peru 08 S: 74-75 E Southwestern Amazonian moist forests Highest - -Relatively Intact Medium
Relatively Sta- ble or Intact
Indonesia 01 S: 101-102 E Sumatran Islands lowland and montane forests Highest Endangered - Critical HighestCritical or Endangered
Indonesia 04 S: 104-105 E Sumatran Islands lowland and montane forests Highest Endangered - Critical HighestCritical or Endangered
Brazil 10 S: 61-62 W Southwestern Amazonian moist forests High - -Relatively Stable Medium Vulnerable
Brazil 09 S: 66 W Southwestern Amazonian moist forests Highest - -Relatively Stable Medium Vulnerable
Brazil 10 S: 67 W Freshwater - Amazon River and Highest - - - Highest Vulnerable
Cameroon 03 N: 11 E Congolian Coastal Forests HighestRelatively Stable Medium Vulnerable Highest Vulnerable
Cameroon 02 S: 11 E Congolian Coastal Forests HighestRelatively Stable Medium Vulnerable Highest Vulnerable
Cameroon 04 S: 11 E Congolian Coastal Forests HighestRelatively Stable Medium Vulnerable Highest Vulnerable
Mae_Chaem_Thailand Kayah-Karen/Tenasserim moist forests HighestRelatively Intact -
Relatively Intact Medium
Relatively Sta- ble or Intact
*BDI - Biological Distiveness Index
Note: All of the ASB sites are located in the Tropical and Subtropical Moist Broadleaf Forests Biome
Biological Distinctiveness Index
What do the Global 200 characteristics tell us about biodiversity?

Dividing line between humid and subhumid tropicsFocus area
ASB site locations#S
Land Cover ClassCroplandCropland with forestCropland with grasslandCropland/Forest mosaicCropland/Other mosaicForestGrasslandOtherNon-vegetatedInland Water
Source: IFPRI reclassification of SLCR classes from Global Land CoverClassification Database (GLCCD – USGS/EDC 2000).Source: Sebastian 2001.
Does land cover help
us understand patterns
of conversion
?

What is the land cover for the pantropics by region by rainfall?
Land Cover for the Warm Sub-humid Tropics
0 20 40 60 80 100
Mesoamerica &Caribbean
South America
Sub-SaharanAfrica
Mainland Asia
Insular SE Asia
share (percent)
Cropland
Pasture
Cropland / PasturemosaicAg / Forest mosaic
Ag / Other Mosaic
Forest
Grassland
Other
Cropland
Pasture
Cropland / PasturemosaicAg / Forest mosaic
Ag / Other Mosaic
Forest
Grassland
Other
Cropland
Pasture
Cropland / PasturemosaicAg / Forest mosaic
Ag / Other Mosaic
Forest
Grassland
Other
Cropland
Pasture
Cropland / PasturemosaicAg / Forest mosaic
Ag / Other Mosaic
Forest
Grassland
Other
Land Cover for the Warm Humid Tropics
0 20 40 60 80 100
Mesoamerica &Caribbean
South America
Sub-SaharanAfrica
Mainland Asia
Insular SE Asia
share (percent)
Cropland
Pasture
Cropland / Pasture mosaic
Ag / Forest mosaic
Ag / Other Mosaic
Forest
Grassland
Other

What is the land cover for the ‘target’ biome?TROPICAL AND SUBTROPICAL MOIST BROADLEAF FOREST BIOME
AREA
Land Cover Type Total
Central America & Caribbean
South America
Sub-Saharan Africa
Mainland Asia
Insular Southeast
Asia
Cropland 857,681 61,765 23,868 154,281 261,513 356,254Pasture 6,640 6,640 0 0 0 0Cropland / Pasture mosaic 79,908 3,680 28,710 45,634 1,632 252Agriculture / Forest mosaic 1,179,195 55,123 423,126 356,964 76,876 267,106Agriculture / Other mosaic 1,038,332 49,035 436,546 250,618 141,737 160,396Forest 9,882,330 338,734 5,801,476 1,758,748 716,445 1,266,927Grassland, Savanna, Shrubland 1,306,263 46,139 429,251 648,972 22,840 159,061Other 53,226 2,850 20,149 28,922 1,275 30
14,403,575 563,966 7,163,126 3,244,139 1,222,318 2,210,026
SHARECropland 6.0 11.0 0.3 4.8 21.4 16.1Pasture 0.0 1.2 0.0 0.0 0.0 0.0Cropland / Pasture mosaic 0.6 0.7 0.4 1.4 0.1 0.0Agriculture / Forest mosaic 8.2 9.8 5.9 11.0 6.3 12.1Agriculture / Other mosaic 7.2 8.7 6.1 7.7 11.6 7.3Forest 68.6 60.1 81.0 54.2 58.6 57.3Grassland, Savanna, Shrubland 9.1 8.2 6.0 20.0 1.9 7.2Other 0.4 0.5 0.3 0.9 0.1 0.0
100.0 100.0 100.0 100.0 100.0 100.0
Region
(square kilometers)

Can we understand the extent of forest conversion?

Land CoverAgricultureForest
Other
Forest / Ag mosaicForest margin areasAg / other margin areas
Source: IFPRI reclassification of SLCR classes from Global Land Cover Classification Database (GLCCD – USGS/EDC 2000).
Can we define
transition areas using coarse
resolution satellite data?

Hydro1k Basins Warm humid and subhumid tropics
Source: Hydro1k (USGS EDC 2001).
Focus areaDividing line between humid and subhumid tropics
Each polygon represents a watershed (based onLevel 1 of the Hydro1k Database) of which any
portion falls within the tropics focus area.
ASB site locations#S
Hydro-logical
function:
Basin extent

Terrain TypeWarm humid and subhumid tropics
Dividing line between humid and subhumid tropics
ASB site locations#S
Focus area
Source: A. Nelson, World Bank (2001).
plainsmid-alt plainshigh alt plainslowlands & platformslow/mid plateaushills / rugged lowlands
low mid mountainshigh plateaushigh mountains
Terrain typeLower
Upper
Roughness indicator

Basins by Terrain typeWarm humid and subhumid tropics
Source: Hydro1k – USGS EDC 2001; Terrain type: A. Nelson – World Bank (2001).Note: The shading differentiates between the upper and lower catchments of the basins.
Dividing line between humid and subhumid tropicsFocus area
ASB site locations#S
Upper and lower
catchments

Share of Basin Area by Terrain Type
0
20
40
60
80
100
Lower
Upper
Mouth of the Amazon Andes – down to west coast

Critical Hydrological Function
• Potential negative impacts on the flood regimes around major urban areas, based on..
Watersheds (nested within Basins)
Urban population by watershed
Number of cities in each watershed

Each polygon represents a watershed (based onLevel 2 of the Hydro1k Database) of which any portion falls within the tropics focus area.
Dividing line between humid and subhumid tropicsFocus area
$T Cities with >= 500,000 peopleASB site locations#S
South America
0
100
200
300
400
500
600
700
800
0 1,000 2,000 3,000 4,000 5,000 6,000 7,000 8,000 9,000
Urban Population (000s)
Are
a (0
00 s
q k
m)
Latin American WatershedsWarm humid and subhumid tropics

Administrative density surface – no detail in urban
areas
Combined urban & administrative density surface
Improved dataset for understanding extent and density of human settlements
Comments• Useful to select characterization
variables that are hierarchical (e.g., basins/ watersheds, biomes/ecoregions, LCCS)
• Need to assess better what (if any) hydrological functions can be represented at this scale
• Need to integrate pan-tropic analysis with sub-regional studies (Mesoamerica, Mekong) to address some of these questions and comments
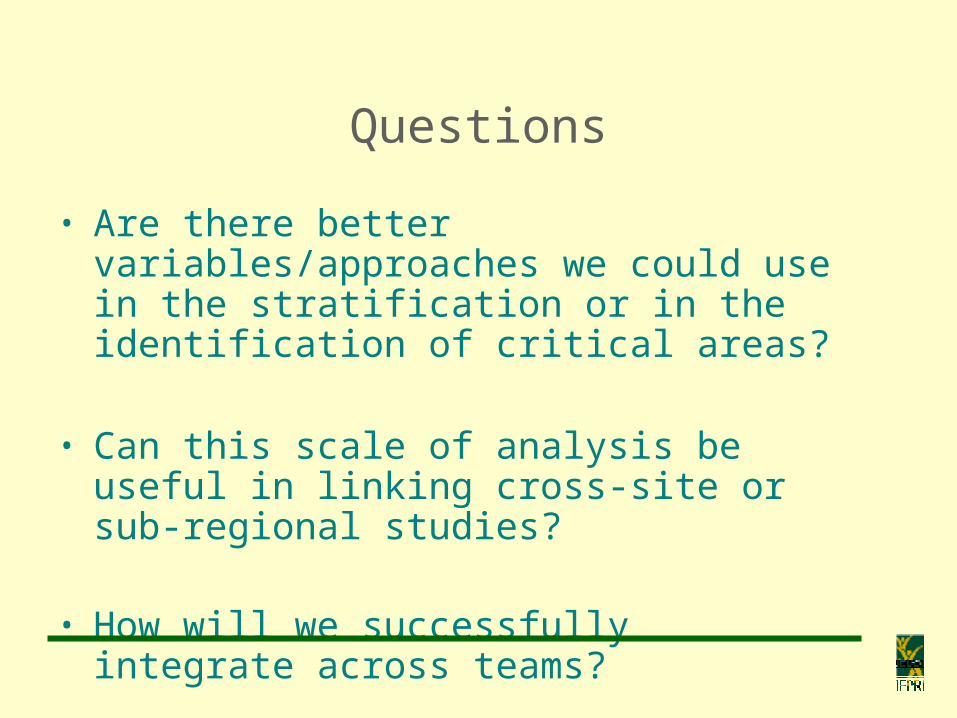
Questions
• Are there better variables/approaches we could use in the stratification or in the identification of critical areas?
• Can this scale of analysis be useful in linking cross-site or sub-regional studies?
• How will we successfully integrate across teams?