Embed Size (px)
Citation preview

Asbestos Safety and Eradication Agency | ii
Asbestos waste in Australia Final report, 22 September 2015
Disclaimer
This report has been prepared for Asbestos Safety and Eradication Agency in accordance with the
terms and conditions of appointment dated 8 January 2015, and is based on the assumptions and
exclusions set out in our scope of work. Information in this document is current as of April 2015. This
report has been compiled based on secondary information and data provided by other parties; as
such it relies on the accuracy of the provided material. Although the data has been reviewed, the
information provided was assumed to be correct unless otherwise stated.
While all professional care has been undertaken in preparing this report, Blue Environment Pty Ltd
cannot accept any responsibility for any use of or reliance on the contents of this report by any third
party.
© Commonwealth of Australia and Blue Environment Pty Ltd
Authors
Dr Joe Pickin; Paul Randell
Reviewer
Christine Wardle
Asbestos Safety and Eradication Agency | iii
CONTENTS Summary .......................................................................................................................................................... 1
1. Introduction .......................................................................................................................................... 4
1.1. Asbestos and waste ........................................................................................................................... 4 1.2. Project context .................................................................................................................................. 4
2. Analysis of asbestos waste data ............................................................................................................ 5
2.1. Data sources ...................................................................................................................................... 5 2.2. Data quality limitations ..................................................................................................................... 6 2.3. Tonnages and trends ......................................................................................................................... 8 2.4. Numbers of transactions and average load size (Qld & Vic) ........................................................... 10 2.5. Drivers of the increasing trend (Qld) ............................................................................................... 11 2.6. Place generated (Qld & Vic) ............................................................................................................. 12 2.7. Waste form and treatment (Qld & Vic) ........................................................................................... 15 2.8. Delivery times (Qld) ......................................................................................................................... 15 2.9. Assessment of entities managing asbestos in Qld ........................................................................... 16
3. Asbestos waste management .............................................................................................................. 18
3.1 Introduction ..................................................................................................................................... 18 3.2 Asbestos waste tracking systems .................................................................................................... 18 3.3 Licensing and management requirements for accepting asbestos at landfills ................................ 22 3.4 Licensing and management requirements for transfer stations ..................................................... 29 3.5 Conclusions and recommendations ................................................................................................ 34
4. Asbestos waste infrastructure in Australia .......................................................................................... 36
4.1 Introduction ..................................................................................................................................... 36 4.2 Jurisdictional reviews ...................................................................................................................... 36 4.3 Conclusions and recommendations ................................................................................................ 45
5. Ongoing waste data options ................................................................................................................ 46
References ..................................................................................................................................................... 48
Asbestos Safety and Eradication Agency | iv
Tables
Table 1: Annual tonnage data on asbestos waste obtained and used for this project ................................... 6
Table 2: Average annual generation rates of asbestos waste per person in various Qld local government areas, 2010-2013 ........................................................................................................ 14
Table 3: Summary of jurisdiction’s intra-state asbestos waste transport tracking systems ......................... 20
Table 4: Licensing and management requirements for accepting asbestos at landfills ................................ 23
Table 5: Licensing and management requirements for accepting asbestos at transfer stations (t/s) .......... 30
Table 6: Potential primary sources of asbestos tonnage data by jurisdiction .............................................. 46
Figures
Figure 1: Asbestos quantities disposed by jurisdiction and year ...................................................................... 9
Figure 2: Asbestos quantities disposed per person by jurisdiction and year ................................................. 10
Figure 3: The numbers of asbestos waste transactions in Qld and Vic, 2002 to 2014 ................................... 10
Figure 4: The average size of asbestos waste loads in Qld and Vic, 2002 to 2014 ......................................... 11
Figure 5: Tonnes of asbestos waste tracked by scale of generator activity, Qld 2008 to 2013 (generators
producing more than 1,000t in that year are in the left-most group, and etc.) .............................. 12
Figure 6: The value of construction work carried out by quarter, Qld and Vic, 2007 to 2014 ....................... 13
Figure 7: Asbestos waste generation rates in Brisbane and the rest of Qld, 2005 to 2013 ........................... 14
Figure 8: The proportions of population and dwelling unit approvals in Brisbane and the rest of Qld,
2003 to 2013 .................................................................................................................................... 15
Figure 9: The percentage of asbestos transactions delivered to landfill within a specified time period,
Qld, 2000 to 2013 ............................................................................................................................ 16
Figure 10: The proportions of asbestos waste generators, transporters and receivers who managed
specified quantities of asbestos waste, Qld, 2000 to 2013, and the proportions of the total
waste tonnage they managed ......................................................................................................... 17
Figure 11: A comparison of asbestos waste quantities and levy rates for asbestos and for industrial
waste, Victoria, 1996 to 2014 .......................................................................................................... 29
Figure 12: Asbestos disposal facilities at transfer stations in Victoria (left) and Tasmania (right) ................... 33
Figure 13: Key differences in jurisdictional controls over asbestos waste ....................................................... 35
Figure 14: Landfills accepting asbestos in New South Wales and ACT ............................................................. 37
Figure 15: Landfills accepting asbestos in Northern Territory .......................................................................... 38
Figure 16: Landfills accepting asbestos in Queensland .................................................................................... 40
Figure 17: Landfills accepting asbestos in South Australia ............................................................................... 41
Figure 18: Landfills accepting asbestos in Tasmania ........................................................................................ 42
Figure 19: Landfills accepting asbestos in Victoria ........................................................................................... 43
Figure 20: Landfills accepting asbestos in Western Australia........................................................................... 44
Asbestos Safety and Eradication Agency | v
Abbreviations & glossary
ACM Asbestos-containing material
ANZSIC codes Australian and New Zealand Standard Industrial Classification codes
Agency Asbestos Safety and Eradication Agency
Basel Convention The Basel Convention on the Control of Transboundary Movements of Hazardous Wastes and their Disposal
DER WA Department of Environment Regulation
DoE Commonwealth Department of the Environment
Domestic self-haul Transport by householders of asbestos waste generated from a household
EHP Qld Department of Environment and Heritage Protection
EPA Environment(al) Protection Authority
POEO Act NSW Protection of the Environment Operations Act
t/s Transfer station for waste
Acknowledgements
We acknowledge and thank the following organisations and the relevant staff for their cooperation
and support in providing data and advice to support this project:
ACTNoWaste
ACT Territory and Municipal Services
Barwon and South West Waste and Resource Recovery Group (Vic)
Department of Environment and Heritage Protection (Qld)
Department of Environment Regulation (WA)
Department of the Environment (Australia)
Environment Protection Authorities (NSW, NT, SA, Tas and Vic)
GeoScience Australia
Gippsland Waste and Resource Recovery Group (Vic)
Waste Authority (WA)
Asbestos Safety and Eradication Agency | 1
Summary The Asbestos Safety and Eradication Agency (the agency) was established in July 2013 to provide a
national focus on asbestos issues. It commissioned the authors to help improve its understanding of
asbestos waste.
Analysis of asbestos waste data
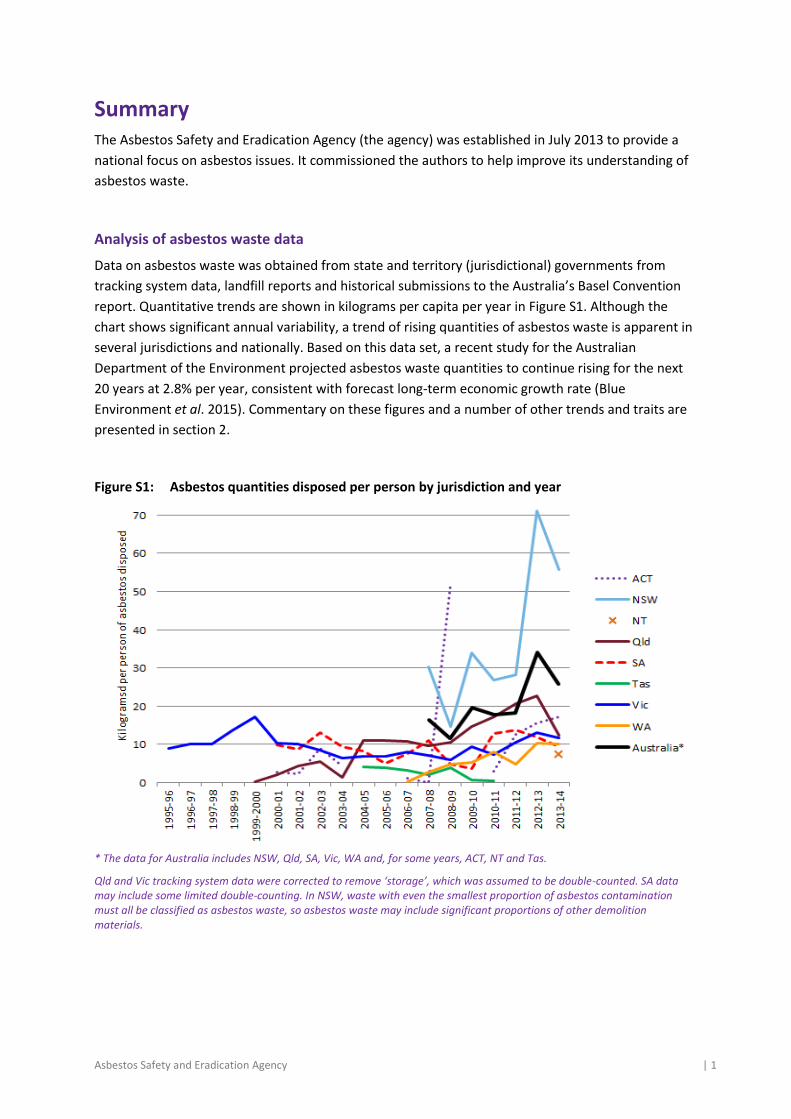
Data on asbestos waste was obtained from state and territory (jurisdictional) governments from
tracking system data, landfill reports and historical submissions to the Australia’s Basel Convention
report. Quantitative trends are shown in kilograms per capita per year in Figure S1. Although the
chart shows significant annual variability, a trend of rising quantities of asbestos waste is apparent in
several jurisdictions and nationally. Based on this data set, a recent study for the Australian
Department of the Environment projected asbestos waste quantities to continue rising for the next
20 years at 2.8% per year, consistent with forecast long-term economic growth rate (Blue
Environment et al. 2015). Commentary on these figures and a number of other trends and traits are
presented in section 2.
Figure S1: Asbestos quantities disposed per person by jurisdiction and year
* The data for Australia includes NSW, Qld, SA, Vic, WA and, for some years, ACT, NT and Tas.
Qld and Vic tracking system data were corrected to remove ‘storage’, which was assumed to be double-counted. SA data may include some limited double-counting. In NSW, waste with even the smallest proportion of asbestos contamination must all be classified as asbestos waste, so asbestos waste may include significant proportions of other demolition materials.
Asbestos Safety and Eradication Agency | 2
Asbestos waste management
Several jurisdictions track asbestos waste through waste generator, transporter and receiver to
ensure it is disposed of in a facility that will appropriately manage the risks posed by asbestos waste
to human health. There are major differences between them.
In all jurisdictions an EPA licence is required to landfill asbestos waste and a similar set of
management requirements are outlined. Gate fees for the disposal of asbestos vary significantly
within and between jurisdictions. Landfill levies applied to asbestos waste across Australia differ
widely.
Transfer stations provide an important linkage to landfill disposal for asbestos waste particularly in
areas lacking a local landfill licensed to receive asbestos. In all jurisdictions, apart from NSW, it
appears to be left up to transfer station operators (generally local governments) to decide whether
to seek an EPA licence to accept asbestos waste. Without guidance from jurisdictional governments,
transfer station managers – including local governments – may decline to accept asbestos. Its
acceptance requires higher levels of training, more rigorous occupational health and safety
procedures and, most likely, costlier insurance.
Asbestos waste infrastructure in Australia
The ACT was the only jurisdiction able to confirm that asbestos waste infrastructure should be
adequate for the foreseeable future across the jurisdiction. Several regions of Australia would benefit
from a detailed assessment to establish the most appropriate type and location of additional
infrastructure for asbestos waste.
Ongoing waste data options
The key ongoing data need is for tonnage data to help the agency to understand trends on
jurisdictional and national bases. Jurisdictions already report the tonnages of asbestos (and other
hazardous wastes) that they generate annually via their annual submissions to the Basel Convention.
The agency could seek the necessary permissions to access that data through the Commonwealth
Department of the Environment.
Asbestos Safety and Eradication Agency | 3
Recommendations
It is recommended that:
1. The agency work with the Commonwealth Department of the Environment (DoE) and relevant
jurisdictional agencies to develop a nationally preferred position in relation to tracking
asbestos waste, encompassing threshold quantities and sources to which tracking should
apply.
2. The agency work with the DoE and relevant jurisdictional agencies to develop a nationally
preferred position in relation to landfill pricing that encourages socially optimal disposal
practices for asbestos. Options include:
- a preferred position on the application of landfill levies to asbestos waste, including
relativities to the levy on other waste types and exemptions
- use of landfill licenses to require operators of suitable landfills to accept asbestos based on
some agreed pricing system, for example a standard national gate fee.
3. The agency work with the DoE and relevant jurisdictional agencies to develop a nationally
preferred position in relation to receipt of asbestos waste in areas that do not have ready
access to licensed landfill disposal. This could include amended requirements and guidance to
transfer station operators and/or provision of specialist and potentially temporary mobile
equipment.
4. The agency work with GeoScience Australia to update its waste facility database to include all
sites known by NSW EPA and Qld DEH to take asbestos.
5. The agency work with DoE and relevant jurisdictional agencies to assess the asbestos handling
and disposal requirements for remote areas and develop strategies to support the appropriate
and safe handling, transport and disposal of asbestos waste. This should encompass asbestos
awareness and education as well as infrastructure. There appears to be a particular need in:
- areas of the NT not serviced by the four main NT landfills
- remote inland areas of SA
- the east coast of Tasmania
- the western and less populous parts of eastern Victoria
- the east and far north of WA (assuming that the GeoScience database is complete for WA).
6. The agency liaise with DoE to obtain ongoing access to annual data on asbestos tonnages
reported via Basel Convention submissions.
7. The agency work with DoE and relevant jurisdictional agencies to develop preferred methods
for collating asbestos waste data for reporting via Basel Convention submissions.
Asbestos Safety and Eradication Agency | 4
1. Introduction
1.1. Asbestos and waste
Asbestos is the name given to a group of naturally occurring mineral fibres which were used
extensively in many products due to the versatility, strength, fire resistance and insulating properties
of the fibres.
The versatility of asbestos made it attractive to many industries and is thought to have more than
3,000 applications worldwide. Australia was one of the highest users per capita in the world up until
the mid-1980s. Approximately one third of all homes built in Australia contain asbestos products.
Inhalation of asbestos fibres is associated with a number of diseases including pleural disease,
asbestosis, lung cancer and mesothelioma. Even limited or short-term exposure to asbestos fibres
can be dangerous, but exposure does not make development of an asbestos-related disease
inevitable. There is still much unknown about why some people are susceptible to asbestos-related
diseases, while others who have been regularly exposed to asbestos may avoid them.
As a waste material, asbestos has some unusual characteristics: it is a hazardous waste generated
from across all of society rather than from a particular industry; its preferred fate is burial in landfill;
and it is among the highest risk materials for waste industry employees to manage. As a result,
asbestos poses a unique waste management challenge.
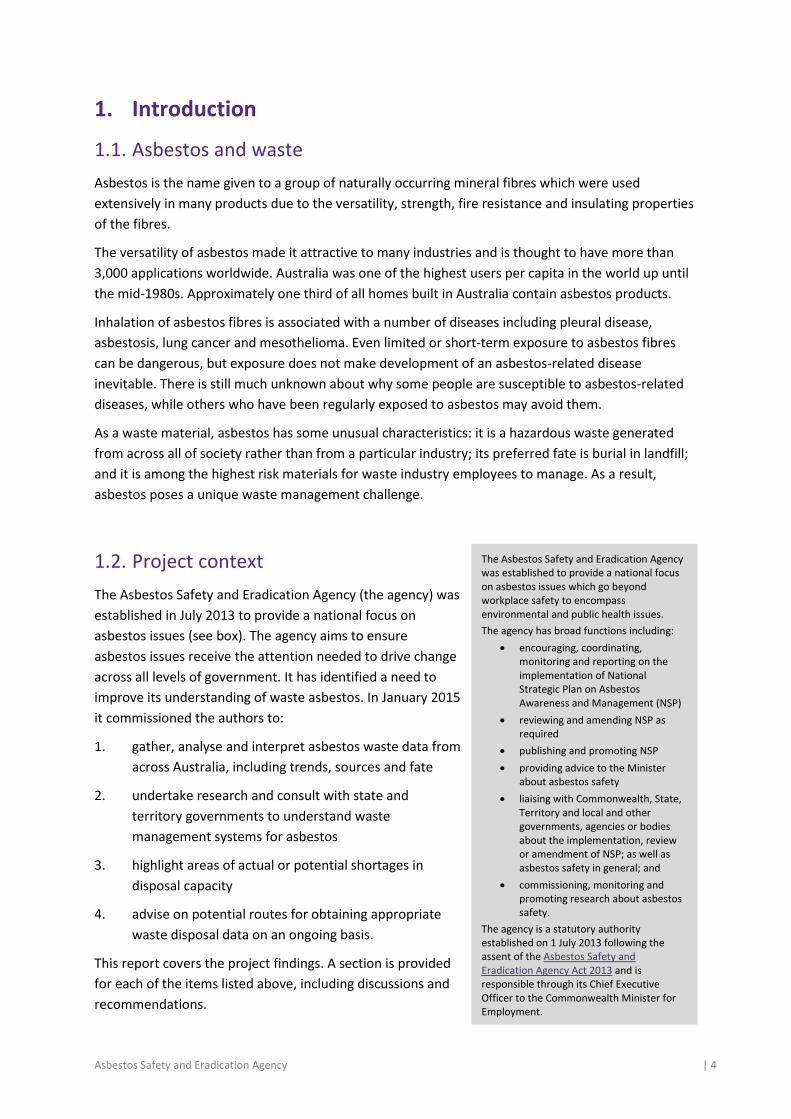
1.2. Project context
The Asbestos Safety and Eradication Agency (the agency) was
established in July 2013 to provide a national focus on
asbestos issues (see box). The agency aims to ensure
asbestos issues receive the attention needed to drive change
across all levels of government. It has identified a need to
improve its understanding of waste asbestos. In January 2015
it commissioned the authors to:
1. gather, analyse and interpret asbestos waste data from
across Australia, including trends, sources and fate
2. undertake research and consult with state and
territory governments to understand waste
management systems for asbestos
3. highlight areas of actual or potential shortages in
disposal capacity
4. advise on potential routes for obtaining appropriate
waste disposal data on an ongoing basis.
This report covers the project findings. A section is provided
for each of the items listed above, including discussions and
recommendations.
The Asbestos Safety and Eradication Agency was established to provide a national focus on asbestos issues which go beyond workplace safety to encompass environmental and public health issues.
The agency has broad functions including:
encouraging, coordinating, monitoring and reporting on the implementation of National Strategic Plan on Asbestos Awareness and Management (NSP)
reviewing and amending NSP as required
publishing and promoting NSP
providing advice to the Minister about asbestos safety
liaising with Commonwealth, State, Territory and local and other governments, agencies or bodies about the implementation, review or amendment of NSP; as well as asbestos safety in general; and
commissioning, monitoring and promoting research about asbestos safety.
The agency is a statutory authority established on 1 July 2013 following the assent of the Asbestos Safety and Eradication Agency Act 2013 and is responsible through its Chief Executive Officer to the Commonwealth Minister for Employment.
Asbestos Safety and Eradication Agency | 5
2. Analysis of asbestos waste data This chapter contains an analysis of the available data on waste asbestos. After describing the data
sources and limitations, it considers national tonnages and trends. Focusing on Qld and Vic only, it
then discusses transaction numbers, load sizes, place generated, waste form, treatment, delivery
times, and entities managing asbestos.
While the data is patchy and contains many uncertainties, it indicates that asbestos waste quantities
are increasing nationally.
2.1. Data sources
Data on asbestos waste was obtained from the state and territory governments (referred to
hereafter as the ‘jurisdictions’). Several jurisdictions kindly provided data to the project team
following written requests from the agency1. Other data was obtained through annual jurisdictional
submissions to the Australian Government for inclusion in its annual report under The Basel
Convention on the Control of Transboundary Movements of Hazardous Wastes and their Disposal2.
Jurisdictional governments may collect data on asbestos waste in two ways. Firstly, some states
operate tracking systems for intra-state (within the same state) movements of wastes that require
particularly careful management. States variously refer to these wastes as listed, controlled,
prescribed, trackable or regulated, and they are also often called hazardous waste. Intra-state
tracking systems were established in response to historical problems with dumping of wastes that
require expensive processing. They require the waste generator, waste transporter and waste
receiver to each certify the type and quantity of a particular waste load, and to send a copy of this
transport certificate to the state government. Intra-state tracking systems operate in the five largest
states, but asbestos waste has been tracked in only Qld, SA and Vic3. State tracking systems are
reviewed in section 3.2.
Secondly, some jurisdictions – particularly those that impose a levy on landfilled waste – require
landfill operators to report the tonnages, types and sources of the waste they receive. Landfill is the
sole legal fate for asbestos, which is generally reported as a ‘type’ in its own right. Collated landfill
levy reports can therefore provide a good record of asbestos quantities generated in the state.
Qld and Vic provided the project team with access to detailed data covering around 100,000
transport certificates, enabling a range of analyses. Other jurisdictions provided annual tonnage data
only. The sources and types of the annual tonnage data obtained from each jurisdiction and used in
the analysis are summarised in Table 1.
1 Commercially sensitive data was provided under binding confidentiality constraints.
2 This is an international agreement to which Australia is a signatory. It puts an obligation on exporting countries to ensure
that hazardous wastes are managed in an environmentally sound manner in the country of import. 3 NSW will shortly start tracking asbestos waste – see section 2.3.2.
Asbestos Safety and Eradication Agency | 6
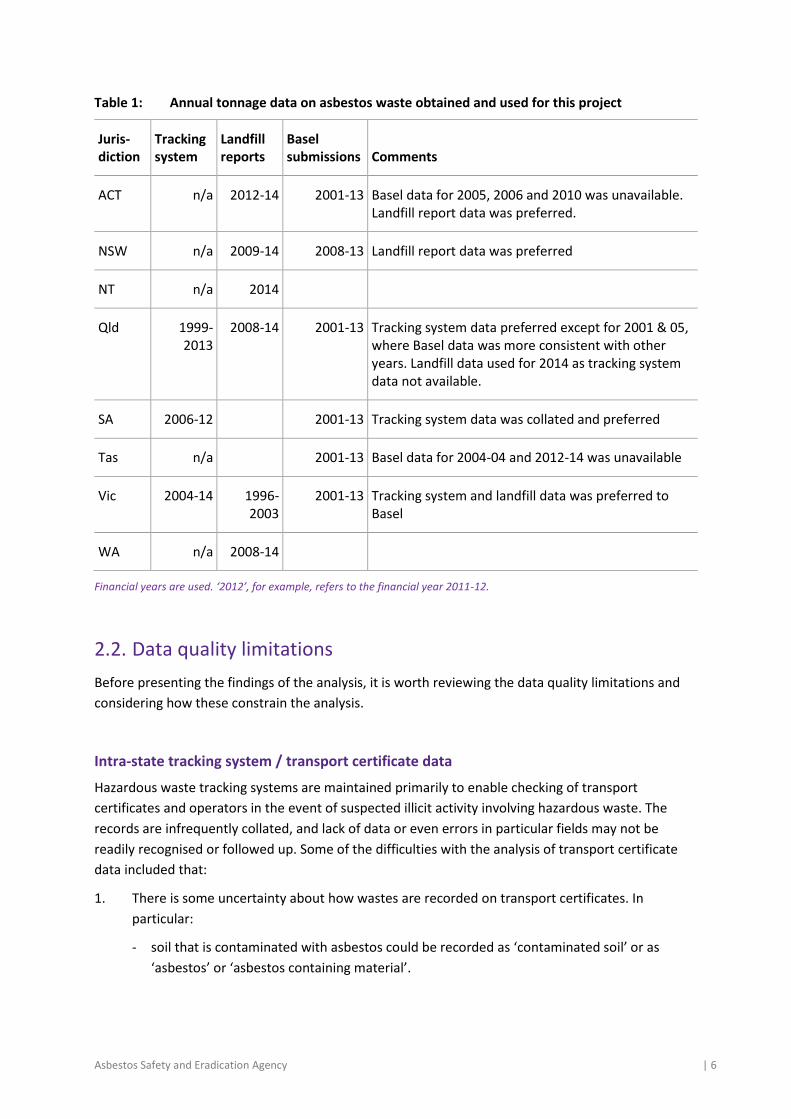
Table 1: Annual tonnage data on asbestos waste obtained and used for this project
Juris-diction
Tracking system
Landfill reports
Basel submissions Comments
ACT n/a 2012-14 2001-13 Basel data for 2005, 2006 and 2010 was unavailable. Landfill report data was preferred.
NSW n/a 2009-14 2008-13 Landfill report data was preferred
NT n/a 2014
Qld 1999-2013
2008-14 2001-13 Tracking system data preferred except for 2001 & 05, where Basel data was more consistent with other years. Landfill data used for 2014 as tracking system data not available.
SA 2006-12 2001-13 Tracking system data was collated and preferred
Tas n/a 2001-13 Basel data for 2004-04 and 2012-14 was unavailable
Vic 2004-14 1996-2003
2001-13 Tracking system and landfill data was preferred to Basel
WA n/a 2008-14
Financial years are used. ‘2012’, for example, refers to the financial year 2011-12.
2.2. Data quality limitations
Before presenting the findings of the analysis, it is worth reviewing the data quality limitations and
considering how these constrain the analysis.
Intra-state tracking system / transport certificate data
Hazardous waste tracking systems are maintained primarily to enable checking of transport
certificates and operators in the event of suspected illicit activity involving hazardous waste. The
records are infrequently collated, and lack of data or even errors in particular fields may not be
readily recognised or followed up. Some of the difficulties with the analysis of transport certificate
data included that:
1. There is some uncertainty about how wastes are recorded on transport certificates. In
particular:
- soil that is contaminated with asbestos could be recorded as ‘contaminated soil’ or as
‘asbestos’ or ‘asbestos containing material’.

Asbestos Safety and Eradication Agency | 7
- demolition waste that is contaminated with asbestos could be recorded as either part
asbestos or (for example, in NSW) all asbestos (or all asbestos containing material).
Guidance to waste generators on which of these to select under particular circumstances may
not be consistent between or within jurisdictions. For example, the Qld tracking system covers
asbestos but not contaminated soil, so mixed soil and asbestos would be recorded as asbestos
in its tracking system. In other jurisdictions advice may vary, potentially leading to
incompatible data across jurisdictions or years.
2. Some transport certificates record asbestos as sent to ‘storage’. This material is likely to be
subsequently taken to landfill under another transport certificate, leading to double counting.
(This is likely to be a relatively small issue.)
3. Some asbestos waste is not included. Jurisdictions vary in the extent to which they require
tracking of small asbestos loads and domestic self-haul. Similarly there may be variation in the
degree of asbestos contamination before a waste must be classified as asbestos. Asbestos
waste that is illegally dumped will not be included in tracking system unless it is identified and
collected and disposed to a licensed facility.
4. Australian and New Zealand Standard Industrial Classification (ANZSIC) codes are not always
well recorded, limiting our ability to analyse sources. One of the problems is that ANZSIC codes
vary from 2-4 digits depending on the level of disaggregation of industry type, but tracking
system software seems to require a consistent number of digits. Jurisdictions therefore design
their own ‘ANZSIC-like’ coding systems.
5. Analysis of the transport and fate of asbestos was limited by the fact names are often recorded
or spelled differently, e.g. XYZ; X.Y.Z.; XYZ Pty Ltd; XYZ Demolitions. Reporting such information
is also limited by commercial confidentiality requirements.
6. Units of measurement are variable. Data may be recorded by weight or volume, requiring
assumptions about density4.
7. A small proportion of records contain clear errors, e.g. recording asbestos as liquid, or its
treatment as ‘surface impoundment’ or ‘recycling’.
A review of jurisdictional tracking systems covering some of these issues is given in section 3.2.
Landfill data
Landfill data, for example from NSW, is self-reported and may not be audited at the material level.
Data discrepancies
Another data quality problem was discrepancies between overall tonnage data from different
sources for the same jurisdiction and year. These were of two types:
Differences between data from landfill records and from transport certificates. Where data
from these two sources was available for a jurisdiction and year, they were mostly within a few
4 Victoria’s system builds in an assumed density of 1t/m3. We followed that example for the Queensland data.

Asbestos Safety and Eradication Agency | 8
percentage points of each other. In one case, however, the difference was almost 60%.
Possible explanations include:
- Item 1 above: a landfill would be likely to record a load based on its management
requirements at the landfill, not based on the transport certificate
- small loads and domestic self-haul of asbestos may not subject to tracking requirements so
would be included in one data set but not the other
- waste from natural disasters may not always have been consistently recorded in the past5.
Differences between data submitted for Basel reporting purposes and data obtained for this
research from either transport certificates or landfill records. The sources of each jurisdiction’s
historical Basel submission data are not known. Some (e.g. Tas) appear to be incomplete. In
some cases the values reported were very different from those collated by the project team
from transport certificates, or reported by jurisdictions from landfill records or transport
certificate data. In each of NSW, Qld and SA the differences were as high as 100% in at least
one year. We are unable to determine the cause of these differences.
Where there were differences between the available data for a jurisdiction in a year, we selected
data based on considerations of: consistency of source; consistency of scale with adjacent years; and
age of the data (recent data sets are likely to be more accurate than older data sets). The sources of
the tonnage data used are shown in Table 1.
Notwithstanding the data quality limitations, the data analysis revealed some interesting and useful
traits as discussed below.
2.3. Tonnages and trends
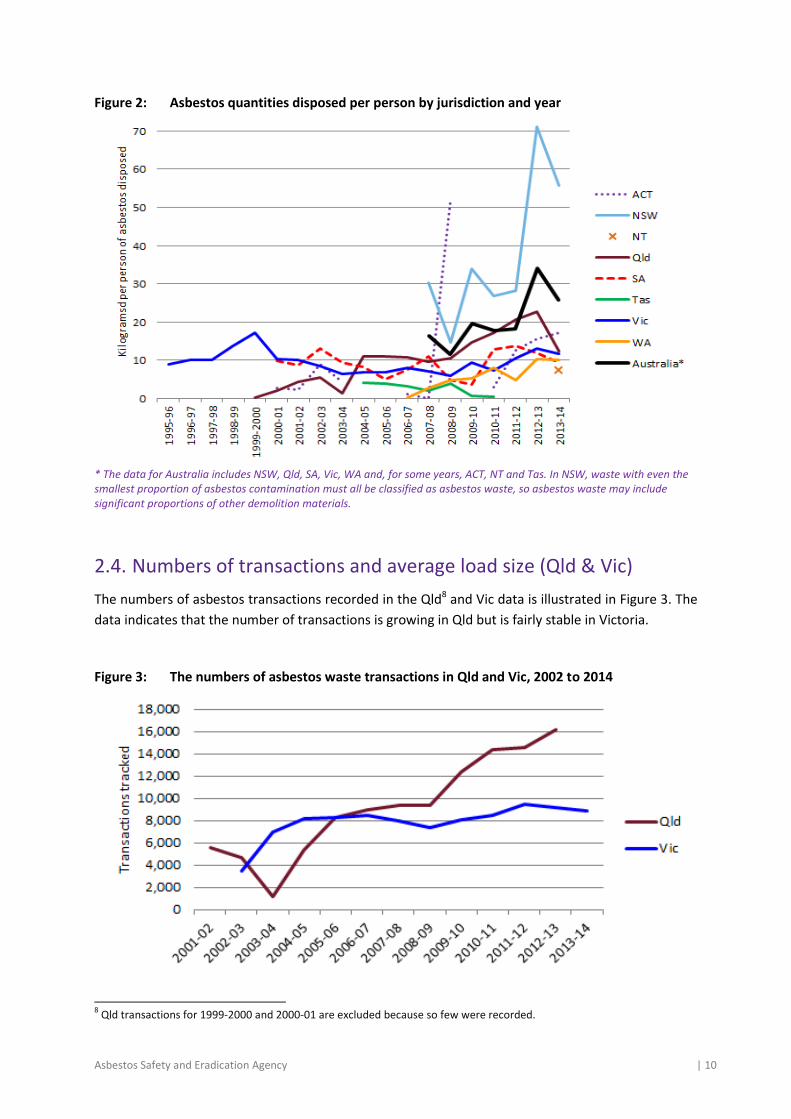
Quantitative trends in the disposal of asbestos6 are shown in tonnes per year in Figure 1 and in
kilograms per capita per year in Figure 2. The following observations can be made based on these
graphs:
1. Asbestos quantities vary significantly between years and jurisdictions. Spikes are often
associated with particular large projects such as the Bradmill factory site redevelopment in
Melbourne.
2. On average, over the seven financial years from 2008 to 2014, Australians generated around
20kg of asbestos waste per capita7.
3. NSW dominates asbestos waste generation on absolute and per capita measures. In all but one
of the years for which NSW data is available, it records more asbestos waste than all the other
jurisdictions combined. In NSW, waste with even the smallest proportion of asbestos
contamination must all be classified as asbestos waste, so asbestos waste may include
significant proportions of other demolition materials.
5 As an example, there is no evidence in the tracking system data of spikes associated with the Brisbane flood or Black
Saturday bushfires. Large volumes of asbestos-contaminated waste from these disasters were apparently not recorded in this data set. 6 Including asbestos containing material
7 Excludes some small and self-haul loads that not tracked in Qld, SA and Vic, and are therefore absent from this data.
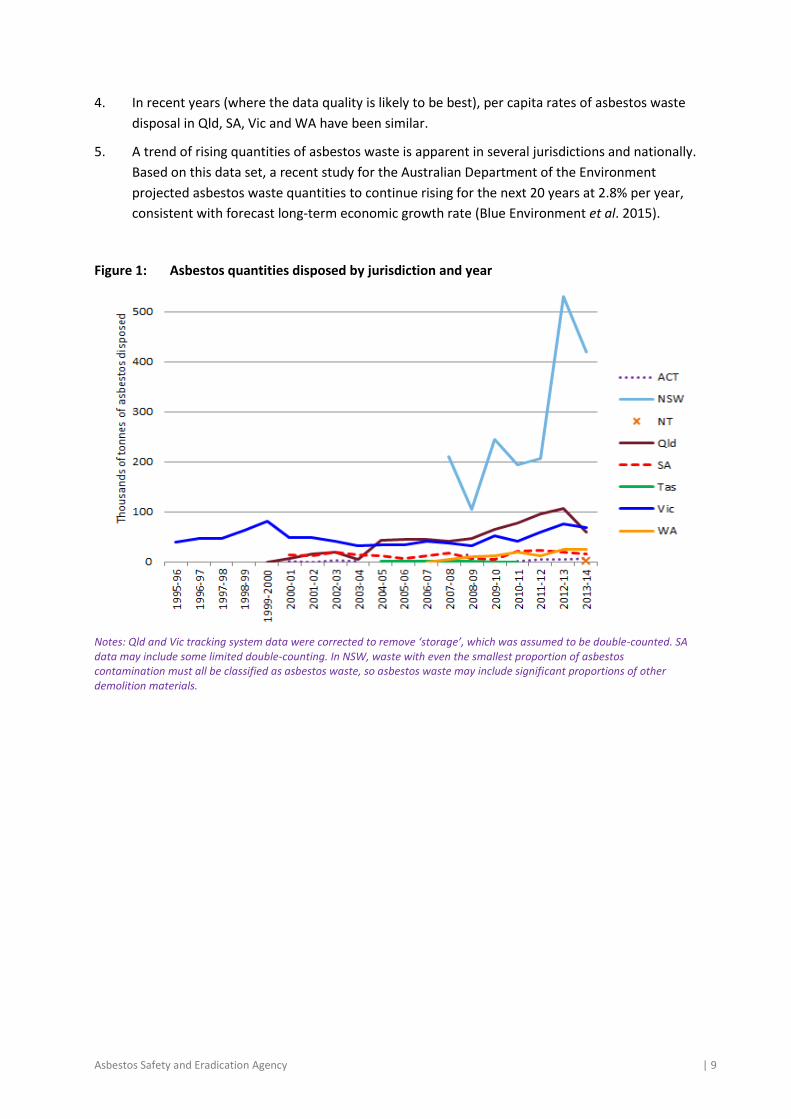
Asbestos Safety and Eradication Agency | 9
4. In recent years (where the data quality is likely to be best), per capita rates of asbestos waste
disposal in Qld, SA, Vic and WA have been similar.
5. A trend of rising quantities of asbestos waste is apparent in several jurisdictions and nationally.
Based on this data set, a recent study for the Australian Department of the Environment
projected asbestos waste quantities to continue rising for the next 20 years at 2.8% per year,
consistent with forecast long-term economic growth rate (Blue Environment et al. 2015).
Figure 1: Asbestos quantities disposed by jurisdiction and year
Notes: Qld and Vic tracking system data were corrected to remove ‘storage’, which was assumed to be double-counted. SA data may include some limited double-counting. In NSW, waste with even the smallest proportion of asbestos contamination must all be classified as asbestos waste, so asbestos waste may include significant proportions of other demolition materials.
Asbestos Safety and Eradication Agency | 10
Figure 2: Asbestos quantities disposed per person by jurisdiction and year
* The data for Australia includes NSW, Qld, SA, Vic, WA and, for some years, ACT, NT and Tas. In NSW, waste with even the smallest proportion of asbestos contamination must all be classified as asbestos waste, so asbestos waste may include significant proportions of other demolition materials.
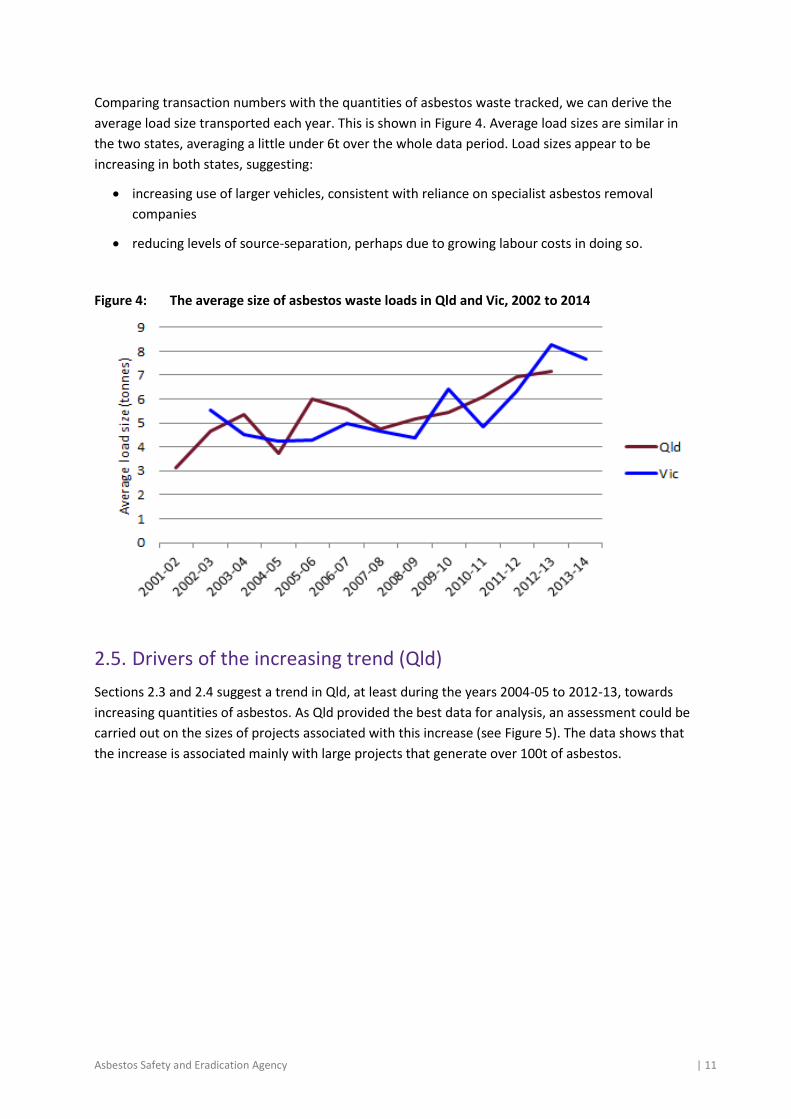
2.4. Numbers of transactions and average load size (Qld & Vic)
The numbers of asbestos transactions recorded in the Qld8 and Vic data is illustrated in Figure 3. The
data indicates that the number of transactions is growing in Qld but is fairly stable in Victoria.
Figure 3: The numbers of asbestos waste transactions in Qld and Vic, 2002 to 2014
8 Qld transactions for 1999-2000 and 2000-01 are excluded because so few were recorded.
Asbestos Safety and Eradication Agency | 11
Comparing transaction numbers with the quantities of asbestos waste tracked, we can derive the
average load size transported each year. This is shown in Figure 4. Average load sizes are similar in
the two states, averaging a little under 6t over the whole data period. Load sizes appear to be
increasing in both states, suggesting:
increasing use of larger vehicles, consistent with reliance on specialist asbestos removal
companies
reducing levels of source-separation, perhaps due to growing labour costs in doing so.
Figure 4: The average size of asbestos waste loads in Qld and Vic, 2002 to 2014
2.5. Drivers of the increasing trend (Qld)
Sections 2.3 and 2.4 suggest a trend in Qld, at least during the years 2004-05 to 2012-13, towards
increasing quantities of asbestos. As Qld provided the best data for analysis, an assessment could be
carried out on the sizes of projects associated with this increase (see Figure 5). The data shows that
the increase is associated mainly with large projects that generate over 100t of asbestos.

Asbestos Safety and Eradication Agency | 12
Figure 5: Tonnes of asbestos waste tracked by scale of generator activity, Qld 2008 to 2013 (generators producing more than 1,000t in that year are in the left-most group, and etc.)
Figure 6 compares the value of construction work carried out in Qld and Vic. Although the quantities
of asbestos waste were rising during this period (see Figure 1), the chart shows that levels of
construction activity were declining. In contrast, Victorian quantities of asbestos waste were more
stable despite increasing levels of construction activity. This supports the notion that the variability in
asbestos waste generation is driven by small numbers of large individual projects.
Figure 6: The value of construction work carried out by quarter, Qld and Vic, 2007 to 2014
Source: ABS 2015a
2.6. Place generated (Qld & Vic)
Asbestos waste disposed is generally derived from within the state. When transaction records for
which the generator state was blank are ignored (13% in Qld and 9% in Vic), in each case more than

Asbestos Safety and Eradication Agency | 13
99% of asbestos over the whole data period was derived from the home state. The remainder is
mainly from neighbouring jurisdictions. In Vic, this figure was 0.3%. In Qld, more than 0.9% came
from NSW, but this figure is increasing and reached 2.4% in 2012-13.
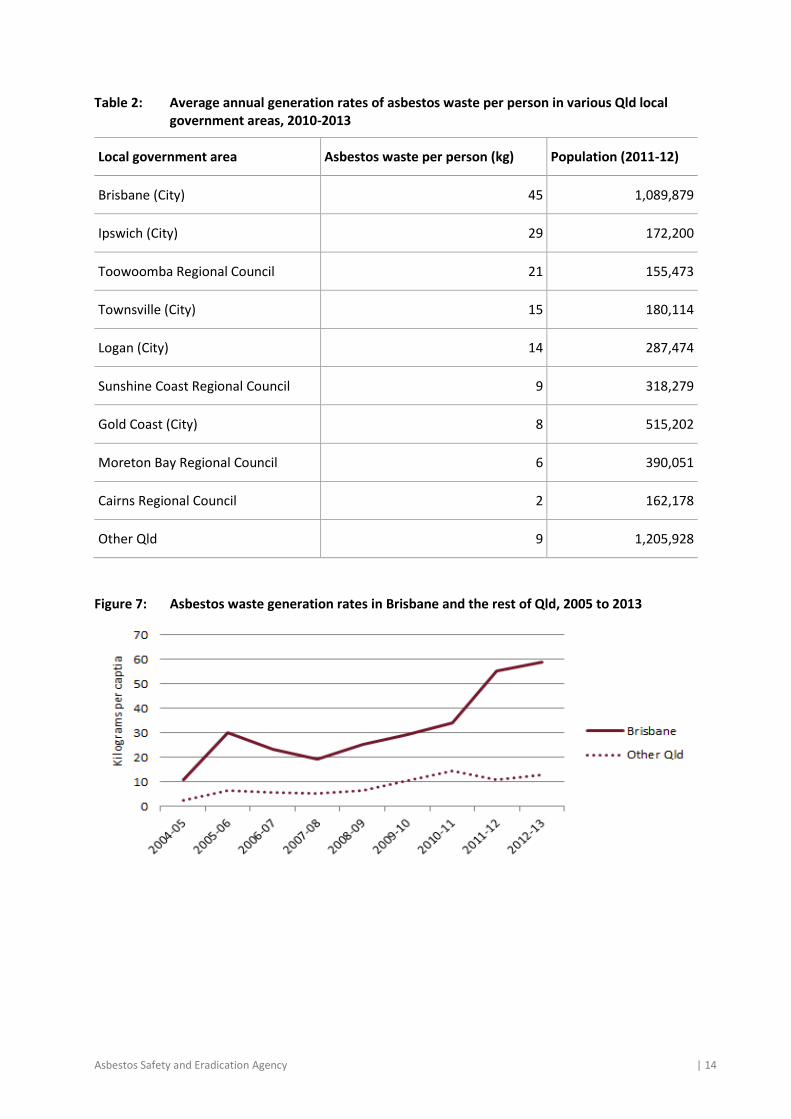
In Qld, the transaction data includes a field for the local government area of the waste generator,
allowing comparison of generation rates per capita in different areas. Table 2 compares asbestos
waste generation in several of Queensland’s largest cities and some less populous areas, listing per
capita generation rates in order. It shows that rates are much higher in Brisbane than elsewhere, and
also suggests that larger cities generally produce more waste per capita than smaller settlements.
The analysis in Table 2 is a four-year average – reform of local government areas in 2008-09 prevents
comparison in earlier years. A longer analytical timeframe can be constructed to compare generation
rates in Brisbane with the rest of Qld, as shown in Figure 7. The graph shows greater asbestos
generation rates in Brisbane across all years, the difference increasing near the end of the time-
series.
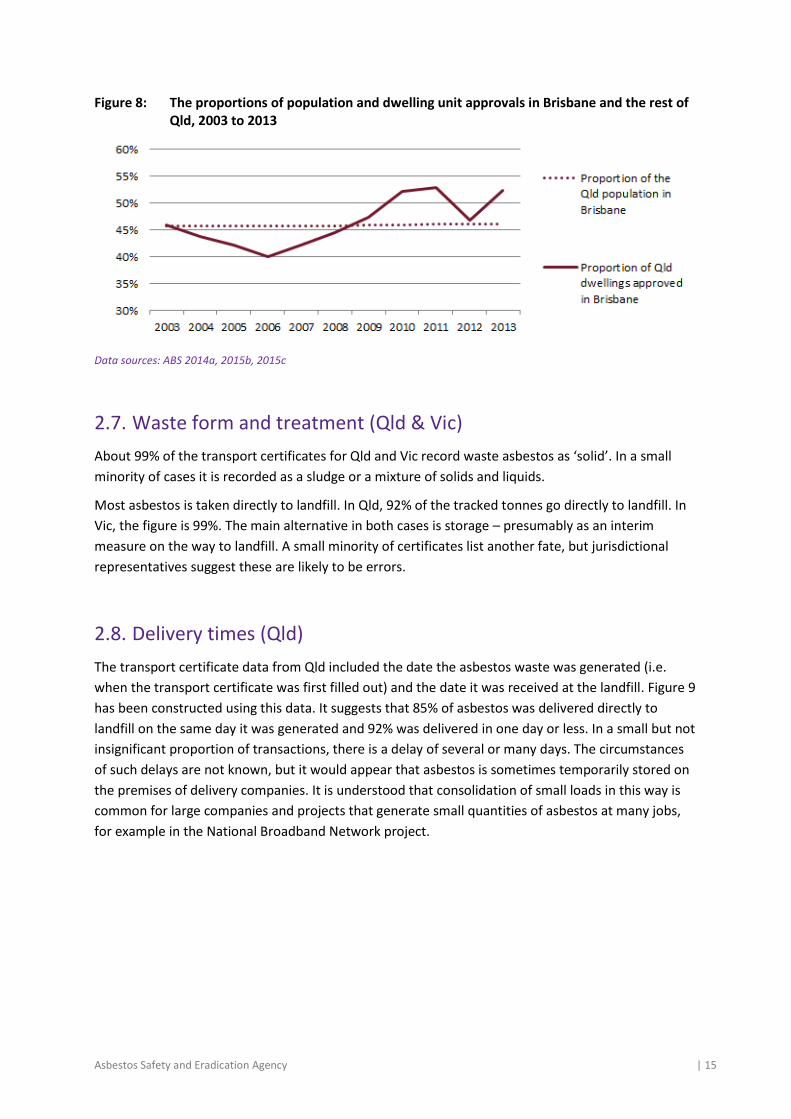
The cause of this disparity is not, apparently, greater levels of building activity per capita.
Comparative data on dwelling constructions indicates similar levels per capita in the Brisbane and
elsewhere (see Figure 8). Rather, potential causes are differences between large cities and other
areas in:
the proportions of asbestos managed in larger loads that are subject to tracking
compliance with tracking requirements
degrees of ‘dilution’ of asbestos in waste loads
asbestos stocks per capita.
Asbestos Safety and Eradication Agency | 14
Table 2: Average annual generation rates of asbestos waste per person in various Qld local government areas, 2010-2013
Local government area Asbestos waste per person (kg) Population (2011-12)
Brisbane (City) 45 1,089,879
Ipswich (City) 29 172,200
Toowoomba Regional Council 21 155,473
Townsville (City) 15 180,114
Logan (City) 14 287,474
Sunshine Coast Regional Council 9 318,279
Gold Coast (City) 8 515,202
Moreton Bay Regional Council 6 390,051
Cairns Regional Council 2 162,178
Other Qld 9 1,205,928
Figure 7: Asbestos waste generation rates in Brisbane and the rest of Qld, 2005 to 2013
Asbestos Safety and Eradication Agency | 15
Figure 8: The proportions of population and dwelling unit approvals in Brisbane and the rest of Qld, 2003 to 2013
Data sources: ABS 2014a, 2015b, 2015c
2.7. Waste form and treatment (Qld & Vic)
About 99% of the transport certificates for Qld and Vic record waste asbestos as ‘solid’. In a small
minority of cases it is recorded as a sludge or a mixture of solids and liquids.
Most asbestos is taken directly to landfill. In Qld, 92% of the tracked tonnes go directly to landfill. In
Vic, the figure is 99%. The main alternative in both cases is storage – presumably as an interim
measure on the way to landfill. A small minority of certificates list another fate, but jurisdictional
representatives suggest these are likely to be errors.
2.8. Delivery times (Qld)
The transport certificate data from Qld included the date the asbestos waste was generated (i.e.
when the transport certificate was first filled out) and the date it was received at the landfill. Figure 9
has been constructed using this data. It suggests that 85% of asbestos was delivered directly to
landfill on the same day it was generated and 92% was delivered in one day or less. In a small but not
insignificant proportion of transactions, there is a delay of several or many days. The circumstances
of such delays are not known, but it would appear that asbestos is sometimes temporarily stored on
the premises of delivery companies. It is understood that consolidation of small loads in this way is
common for large companies and projects that generate small quantities of asbestos at many jobs,
for example in the National Broadband Network project.

Asbestos Safety and Eradication Agency | 16
Figure 9: The percentage of asbestos transactions delivered to landfill within a specified time period, Qld, 2000 to 2013
Excludes transactions where the ‘treatment type’ was recorded as storage, and 13% of transactions where one or both dates were not included in the transport certificate data.
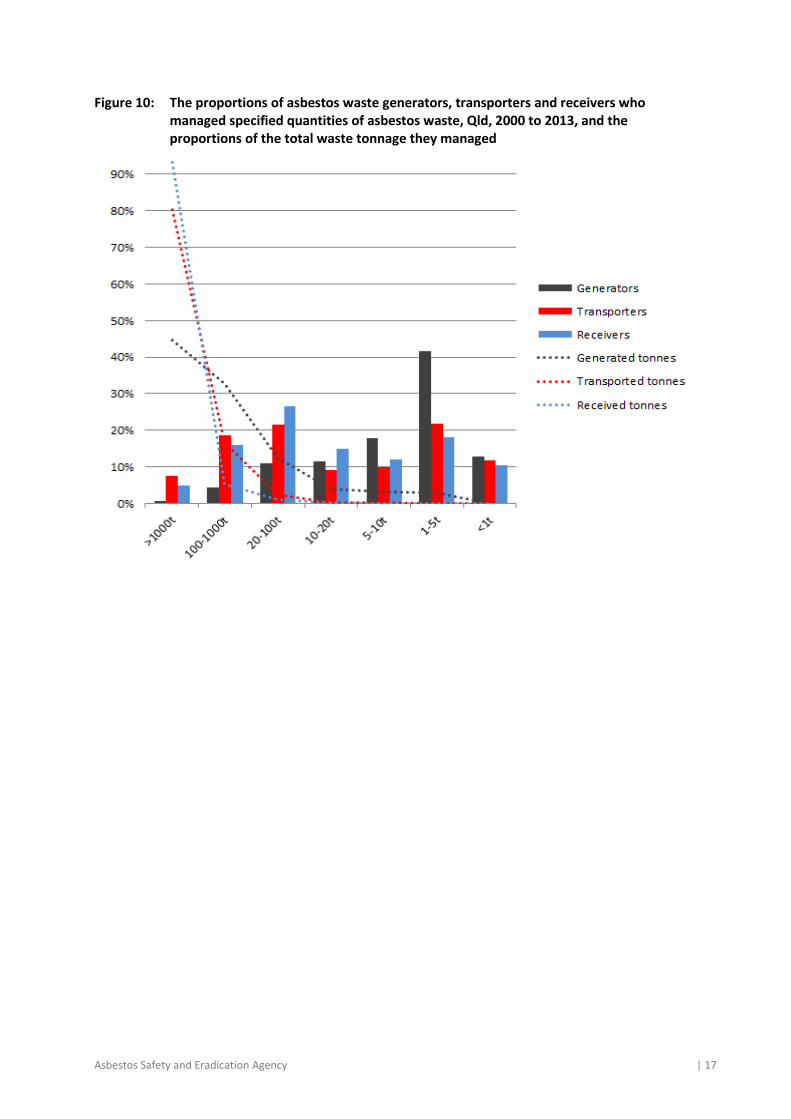
2.9. Assessment of entities managing asbestos in Qld
The Qld data set included the names of the asbestos waste generators, transporters and receivers9.
This enabled an analysis of the proportions of these entities who managed specified quantities of
asbestos over the 13 year timeframe (see Figure 10).
In considering the figure, note that users of transport certificates may not consistently record or spell
company and facility names. Many generators, transporters and receivers are recorded more than
once with different names, skewing the proportions towards the lower end of the ranges presented
in the figure. An attempt was made to rationalise the larger receiving facilities by identifying and
combining alternative names of the top 10 receivers. The process reduced the number of receivers
from 652 to 633, but we note that this still greatly exceeds the number of known landfills in Qld (see
section 4.2). No attempt was made to similarly rationalise the 16,417 asbestos waste generators or
the 1,563 asbestos waste transporters.
The proportions of entities that generated, transported or received more than 1,000t of asbestos
over the 13 years are shown to be small, but these entities generated 45% of the asbestos,
transported 80% and received 93%. At the other end of the scale, more than 10% of generators,
transporters and receivers managed less than 1t of asbestos. The most common scale of generation
was 1-5t (42%), and the most common scale of receiver was a surprisingly small 20-100t (27%). The
most common scale of transporter was also surprisingly small, both 1-5t and 20-100t ranges
representing a little more than 20% of the total.
The chart shows that small numbers of generation projects, transport companies and landfills
dominate the tonnages, but that much larger numbers of very small projects, transporters and
receivers are active.
9 These were received subject to a confidentiality deed preventing any reporting or sharing of this data.
Asbestos Safety and Eradication Agency | 17
Figure 10: The proportions of asbestos waste generators, transporters and receivers who managed specified quantities of asbestos waste, Qld, 2000 to 2013, and the proportions of the total waste tonnage they managed
Asbestos Safety and Eradication Agency | 18
3. Asbestos waste management
3.1 Introduction
This section provides analysis of several aspects of asbestos waste governance and management
systems in Australia, including each jurisdiction’s:
asbestos waste tracking systems (for waste generation, transport, transfer, and disposal)
licensing and management requirements for landfills and transfer stations that accept
asbestos
landfill levy systems and rates, and landfill prices for asbestos disposal more broadly
publication of facilities available to receive asbestos waste.
The information reported in this section was gathered through consultation with government and
industry stakeholders and literature review (as cited throughout). Meetings were held with EPA (or
equivalent) staff from each jurisdiction to discuss asbestos waste management and relevant issues
affecting the jurisdiction. To enable concise reporting and cross-jurisdictional comparison, the main
body of the analysis is presented in a series of tables.
Landfill management requirements are shown to be similar across Australia, but major differences
exist in the rules for tracking asbestos movements and in landfill levy amounts. A common problem
in regional areas is replacement of small landfills with transfer stations that do not accept asbestos,
reducing disposal options for regional residents and businesses. Fees for landfill disposal are shown
to vary widely.
3.2 Asbestos waste tracking systems
All jurisdictions track interstate movement of asbestos waste as required under the National
Environment Protection (Movement of Controlled Waste between States and Territories) Measure.
However, interstate disposal of asbestos is not common, as discussed in section 2.5.
Several jurisdictions track asbestos waste through waste generator, transporter and receiver to
ensure it is disposed of in a facility that will appropriately manage the risks posed by asbestos waste
to human health.
In all cases, the tracking code for asbestos is N220. In some jurisdictions it is possible that asbestos
waste mixed with soil may be classified as ‘contaminated soil’ (N120 or N121) rather than asbestos.
The table below provides analysis of each jurisdictions asbestos waste tracking system, including
(where relevant):
an overview of the tracking system
the weight threshold for requiring the tracking of asbestos waste
whether the tracking system is online or if it is a paper-based system (relevant because paper-
based systems generally produce lower quality data)

Asbestos Safety and Eradication Agency | 19
whether the waste generating source is identified (i.e. is the waste from a domestic source or
from an industry source and if from industry from which industry sector by ANZSIC code)
whether the ‘fate’ of the asbestos waste is recorded (this refers to the tracking system’s ability
to record if the asbestos is either disposed or if it remains in transfer).
Asbestos Safety and Eradication Agency | 20
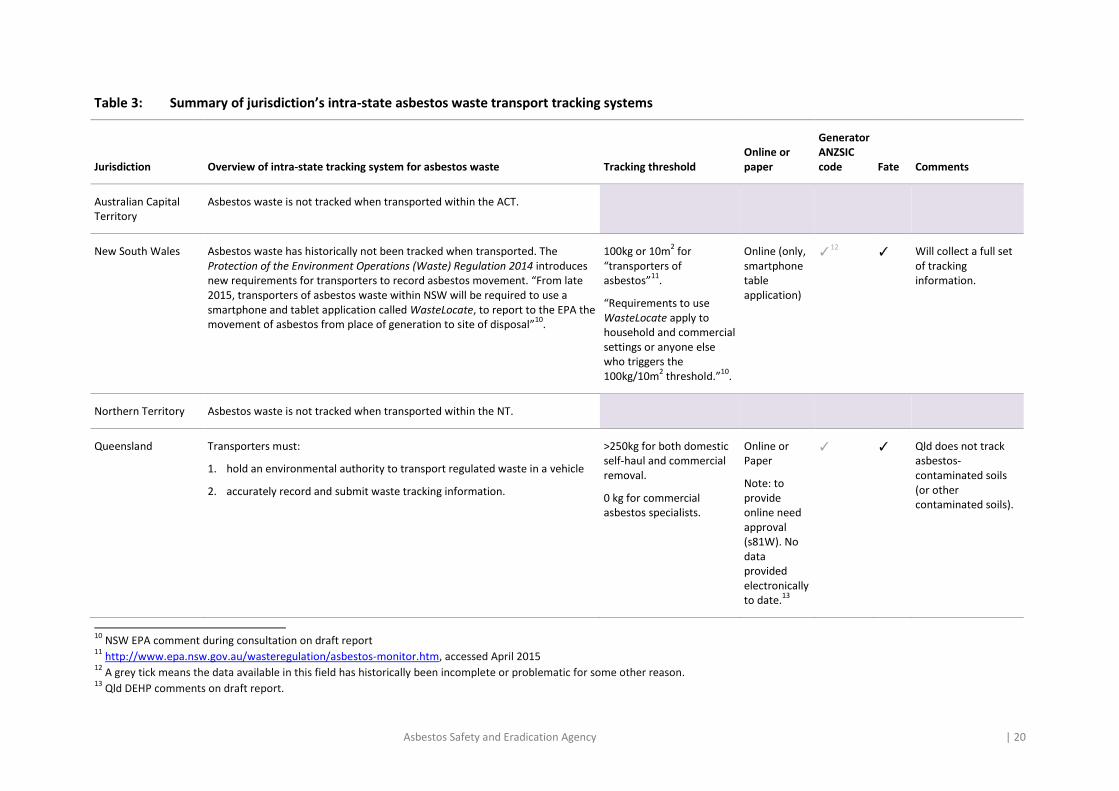
Table 3: Summary of jurisdiction’s intra-state asbestos waste transport tracking systems
Jurisdiction Overview of intra-state tracking system for asbestos waste Tracking threshold Online or paper
Generator ANZSIC code Fate Comments
Australian Capital Territory
Asbestos waste is not tracked when transported within the ACT.
New South Wales Asbestos waste has historically not been tracked when transported. The Protection of the Environment Operations (Waste) Regulation 2014 introduces new requirements for transporters to record asbestos movement. “From late 2015, transporters of asbestos waste within NSW will be required to use a smartphone and tablet application called WasteLocate, to report to the EPA the movement of asbestos from place of generation to site of disposal”
10.
100kg or 10m2 for
“transporters of asbestos”
11.
“Requirements to use WasteLocate apply to household and commercial settings or anyone else who triggers the 100kg/10m
2 threshold.”
10.
Online (only, smartphone table application)
✓12
✓ Will collect a full set of tracking information.
Northern Territory Asbestos waste is not tracked when transported within the NT.
Queensland Transporters must:
1. hold an environmental authority to transport regulated waste in a vehicle
2. accurately record and submit waste tracking information.
>250kg for both domestic self-haul and commercial removal.
0 kg for commercial asbestos specialists.
Online or Paper
Note: to provide online need approval (s81W). No data provided electronically to date.
13
✓ ✓ Qld does not track asbestos-contaminated soils (or other contaminated soils).
10
NSW EPA comment during consultation on draft report 11
http://www.epa.nsw.gov.au/wasteregulation/asbestos-monitor.htm, accessed April 2015 12
A grey tick means the data available in this field has historically been incomplete or problematic for some other reason. 13
Qld DEHP comments on draft report.
Asbestos Safety and Eradication Agency | 21
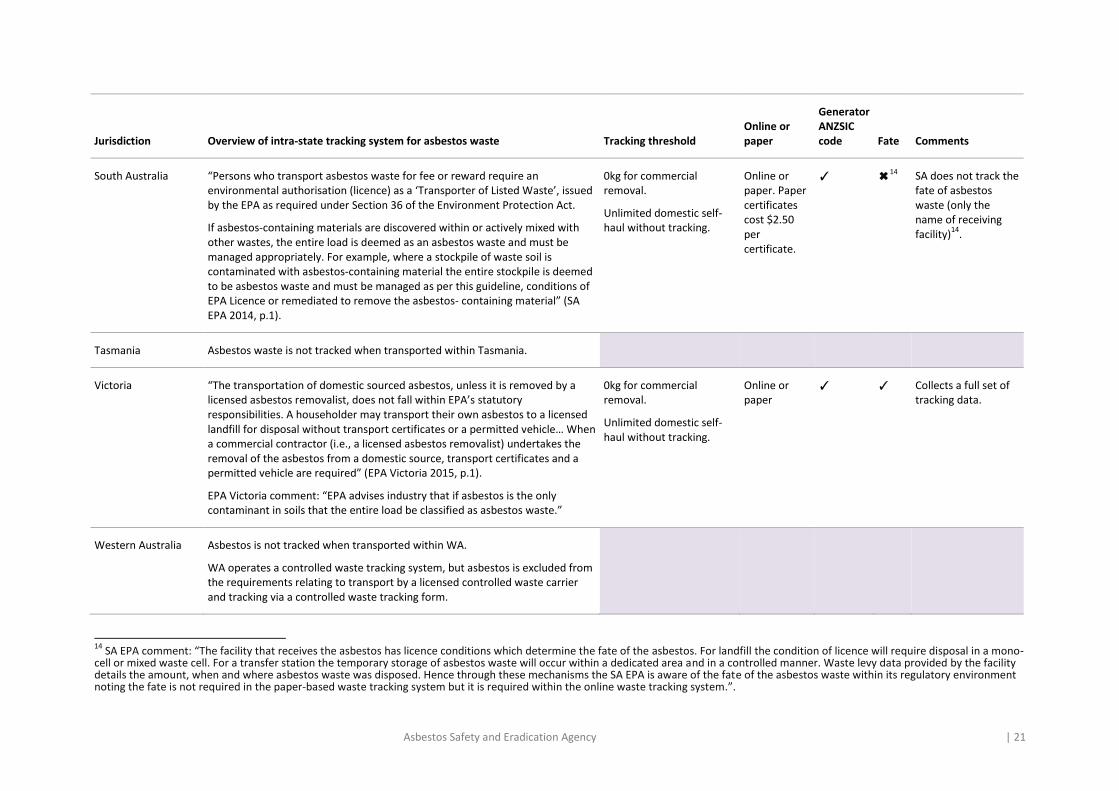
Jurisdiction Overview of intra-state tracking system for asbestos waste Tracking threshold Online or paper
Generator ANZSIC code Fate Comments
South Australia “Persons who transport asbestos waste for fee or reward require an environmental authorisation (licence) as a ‘Transporter of Listed Waste’, issued by the EPA as required under Section 36 of the Environment Protection Act.
If asbestos-containing materials are discovered within or actively mixed with other wastes, the entire load is deemed as an asbestos waste and must be managed appropriately. For example, where a stockpile of waste soil is contaminated with asbestos-containing material the entire stockpile is deemed to be asbestos waste and must be managed as per this guideline, conditions of EPA Licence or remediated to remove the asbestos- containing material” (SA EPA 2014, p.1).
0kg for commercial removal.
Unlimited domestic self-haul without tracking.
Online or paper. Paper certificates cost $2.50 per certificate.
✓ ✖14
SA does not track the fate of asbestos waste (only the name of receiving facility)
14.
Tasmania Asbestos waste is not tracked when transported within Tasmania.
Victoria “The transportation of domestic sourced asbestos, unless it is removed by a licensed asbestos removalist, does not fall within EPA’s statutory responsibilities. A householder may transport their own asbestos to a licensed landfill for disposal without transport certificates or a permitted vehicle… When a commercial contractor (i.e., a licensed asbestos removalist) undertakes the removal of the asbestos from a domestic source, transport certificates and a permitted vehicle are required” (EPA Victoria 2015, p.1).
EPA Victoria comment: “EPA advises industry that if asbestos is the only contaminant in soils that the entire load be classified as asbestos waste.”
0kg for commercial removal.
Unlimited domestic self-haul without tracking.
Online or paper
✓ ✓ Collects a full set of tracking data.
Western Australia Asbestos is not tracked when transported within WA.
WA operates a controlled waste tracking system, but asbestos is excluded from the requirements relating to transport by a licensed controlled waste carrier and tracking via a controlled waste tracking form.
14
SA EPA comment: “The facility that receives the asbestos has licence conditions which determine the fate of the asbestos. For landfill the condition of licence will require disposal in a mono-cell or mixed waste cell. For a transfer station the temporary storage of asbestos waste will occur within a dedicated area and in a controlled manner. Waste levy data provided by the facility details the amount, when and where asbestos waste was disposed. Hence through these mechanisms the SA EPA is aware of the fate of the asbestos waste within its regulatory environment noting the fate is not required in the paper-based waste tracking system but it is required within the online waste tracking system.”.
Asbestos Safety and Eradication Agency | 22
Summary and discussion
There are major differences in tracking system requirements for asbestos across Australia.
The ACT, NT, Tas, and WA do not track asbestos transport for either commercial asbestos companies
or domestic self-haul asbestos transport. NSW has historically not tracked asbestos but, from July
2015, quantities exceeding 100kg or 10m2 will require tracking. Qld requires tracking of all (including
domestic self-haul) asbestos waste transport for any weight above 250kg. In effect, this caps the
amount of asbestos waste that can be transported by householders. Qld also allows commercial
transport of asbestos waste of less than 250kg without tracking, as long this is incidental to providing
services such as domestic plumbing. SA and Vic both require the tracking of asbestos waste by
commercial asbestos waste companies for any amount of asbestos, but do not require tracking of
domestic self-haul regardless of the tonnage. SA does not record the fate of the waste asbestos –
only the name of the receiving facility.
These differences are surprising, given that all jurisdictions are dealing with essentially the same
problem.
3.3 Licensing and management requirements for accepting asbestos
at landfills
This section assesses the licensing and management requirements for operating a landfill to receive
asbestos waste. In all jurisdictions, asbestos can be received only at landfills operating under an EPA
licence15. A public list of waste facilities that accept asbestos is available in the ACT, NSW, Qld, SA, Vic
and WA (covering Perth only). No such list is available for the NT or Tas.
The table below describes, for each jurisdiction:
management requirements
the landfill levy rates in 2014/15 for asbestos waste
an indication of the gate fee range for disposing asbestos waste.
15
In some jurisdictions, Victoria for example, very small rural landfills are exempt from EPA licensing.
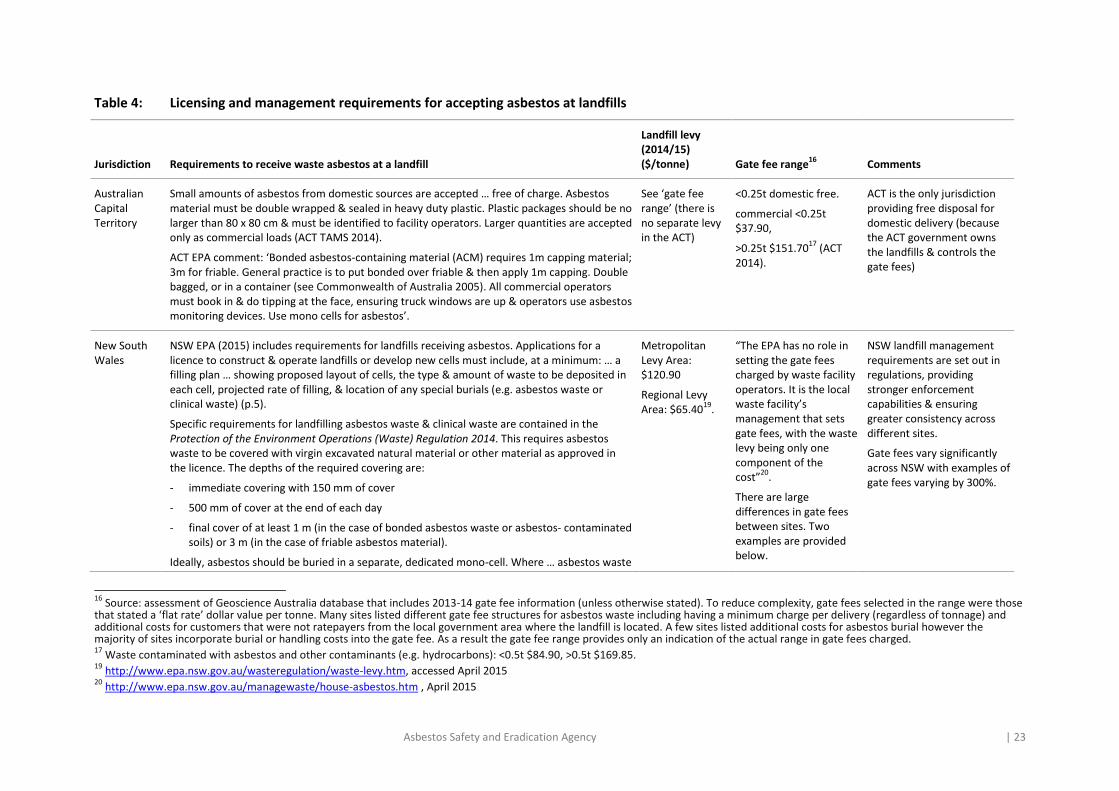
Asbestos Safety and Eradication Agency | 23
Table 4: Licensing and management requirements for accepting asbestos at landfills
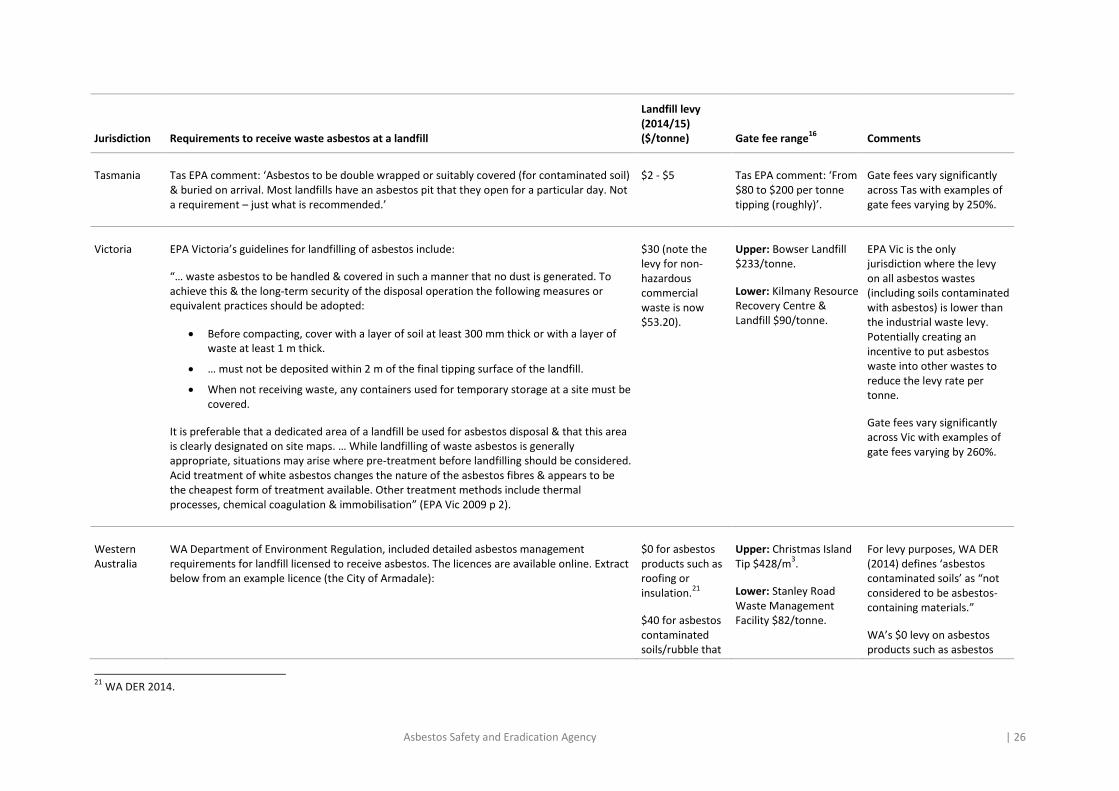
Jurisdiction Requirements to receive waste asbestos at a landfill
Landfill levy (2014/15) ($/tonne) Gate fee range
16 Comments
Australian Capital Territory
Small amounts of asbestos from domestic sources are accepted … free of charge. Asbestos material must be double wrapped & sealed in heavy duty plastic. Plastic packages should be no larger than 80 x 80 cm & must be identified to facility operators. Larger quantities are accepted only as commercial loads (ACT TAMS 2014).
ACT EPA comment: ‘Bonded asbestos-containing material (ACM) requires 1m capping material; 3m for friable. General practice is to put bonded over friable & then apply 1m capping. Double bagged, or in a container (see Commonwealth of Australia 2005). All commercial operators must book in & do tipping at the face, ensuring truck windows are up & operators use asbestos monitoring devices. Use mono cells for asbestos’.
See ‘gate fee range’ (there is no separate levy in the ACT)
<0.25t domestic free.
commercial <0.25t $37.90,
>0.25t $151.7017
(ACT 2014).
ACT is the only jurisdiction providing free disposal for domestic delivery (because the ACT government owns the landfills & controls the gate fees)
New South Wales
NSW EPA (2015) includes requirements for landfills receiving asbestos. Applications for a licence to construct & operate landfills or develop new cells must include, at a minimum: … a filling plan … showing proposed layout of cells, the type & amount of waste to be deposited in each cell, projected rate of filling, & location of any special burials (e.g. asbestos waste or clinical waste) (p.5).
Specific requirements for landfilling asbestos waste & clinical waste are contained in the Protection of the Environment Operations (Waste) Regulation 2014. This requires asbestos waste to be covered with virgin excavated natural material or other material as approved in the licence. The depths of the required covering are:
- immediate covering with 150 mm of cover
- 500 mm of cover at the end of each day
- final cover of at least 1 m (in the case of bonded asbestos waste or asbestos- contaminated soils) or 3 m (in the case of friable asbestos material).
Ideally, asbestos should be buried in a separate, dedicated mono-cell. Where … asbestos waste
Metropolitan Levy Area: $120.90
Regional Levy Area: $65.40
19.
“The EPA has no role in setting the gate fees charged by waste facility operators. It is the local waste facility’s management that sets gate fees, with the waste levy being only one component of the cost”
20.
There are large differences in gate fees between sites. Two examples are provided below.
NSW landfill management requirements are set out in regulations, providing stronger enforcement capabilities & ensuring greater consistency across different sites.
Gate fees vary significantly across NSW with examples of gate fees varying by 300%.
16
Source: assessment of Geoscience Australia database that includes 2013-14 gate fee information (unless otherwise stated). To reduce complexity, gate fees selected in the range were those that stated a ‘flat rate’ dollar value per tonne. Many sites listed different gate fee structures for asbestos waste including having a minimum charge per delivery (regardless of tonnage) and additional costs for customers that were not ratepayers from the local government area where the landfill is located. A few sites listed additional costs for asbestos burial however the majority of sites incorporate burial or handling costs into the gate fee. As a result the gate fee range provides only an indication of the actual range in gate fees charged. 17
Waste contaminated with asbestos and other contaminants (e.g. hydrocarbons): <0.5t $84.90, >0.5t $169.85. 19
http://www.epa.nsw.gov.au/wasteregulation/waste-levy.htm, accessed April 2015 20
http://www.epa.nsw.gov.au/managewaste/house-asbestos.htm , April 2015
Asbestos Safety and Eradication Agency | 24
Jurisdiction Requirements to receive waste asbestos at a landfill
Landfill levy (2014/15) ($/tonne) Gate fee range
16 Comments
is deposited in a cell with other wastes, the deposition area should be as small as possible & located away from areas used by customers bringing in other waste … (p.53).
The following extracts are from NSW landfill licences for the asbestos management.
Urban landfill, 4627 Westconnex delivery authority (note this site is now closed)
O5.18 All asbestos waste must be disposed of at the Premises in accordance with the document titled 'Filling Plan'…
O5.19 All asbestos waste must be covered immediately to a depth of at least 0.15 metre & at the end of each day's operation, to a depth of at least 0.5 metre as per the requirements of clause 42 of the POEO (Waste Regulation) 2005.
Regional landfill, 5898 Broken Hill City Council
Waste allowed: Waste including asbestos waste in bonded matrix & asbestos fibre & dust waste resulting from the removal of thermal or acoustic insulating materials or from processes involving asbestos material, & dust from ventilation collection systems. Disposal in accordance with Cl. 42 of the POEO (Waste Reg.) 2005.
L2.6 The quantity of asbestos waste defined in condition L2.1 of this licence … must not exceed 70 tonnes per reporting period
18.
Higher cost site (regulated levy area) example
Kimbriki Resource Recovery Centre, $430/tonne (approx. $310 net of levy).
Lower cost example (non-regulated levy area) example
Boonoo Boonoo Landfill, Tenterfield, $130/tonne (no levy to be deducted).
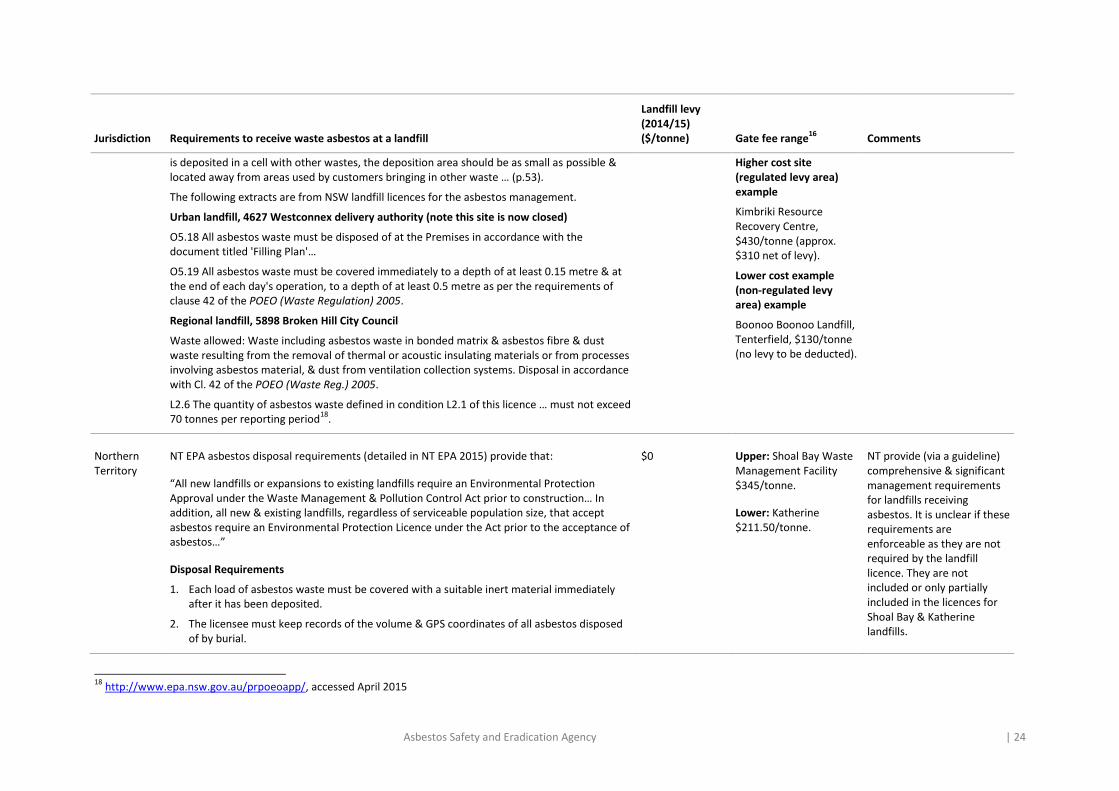
Northern Territory
NT EPA asbestos disposal requirements (detailed in NT EPA 2015) provide that:
“All new landfills or expansions to existing landfills require an Environmental Protection Approval under the Waste Management & Pollution Control Act prior to construction… In addition, all new & existing landfills, regardless of serviceable population size, that accept asbestos require an Environmental Protection Licence under the Act prior to the acceptance of asbestos…”
Disposal Requirements
1. Each load of asbestos waste must be covered with a suitable inert material immediately after it has been deposited.
2. The licensee must keep records of the volume & GPS coordinates of all asbestos disposed of by burial.
$0 Upper: Shoal Bay Waste Management Facility $345/tonne.
Lower: Katherine $211.50/tonne.
NT provide (via a guideline) comprehensive & significant management requirements for landfills receiving asbestos. It is unclear if these requirements are enforceable as they are not required by the landfill licence. They are not included or only partially included in the licences for Shoal Bay & Katherine landfills.
18
http://www.epa.nsw.gov.au/prpoeoapp/, accessed April 2015
Asbestos Safety and Eradication Agency | 25
Jurisdiction Requirements to receive waste asbestos at a landfill
Landfill levy (2014/15) ($/tonne) Gate fee range
16 Comments
3. Asbestos waste shall be deposited in a position which is:
a. in the case of asbestos fibre & dust wastes, at least 3m
b. in the case of stabilised asbestos wastes in a bonded matrix, at least 1m beneath the planned final land surface in such a manner that they do not come into direct contact with compaction or earthmoving equipment.
4. Asbestos waste … must be covered finally by:
a. in the case of asbestos fibre & dust wastes, orange marker mesh identifying that asbestos is buried below & not less than 3m of compacted material.
b. in the case of stabilised asbestos wastes in a bonded matrix, orange marker mesh … & not less than 1m of compacted material.
All asbestos landfills to place the following information of the land title:
- cadastral boundaries of asbestos landfill;
- quantities of asbestos buried at the site;
- caution against the disturbance of the area.
All landfills require a closure & post closure plan detailing the revegetation program & ongoing management & maintenance requirements for the site” (p.3).
Gate fees vary across NT with examples of gate fees varying by 160%.
Queensland Qld EHP comment: ‘Recent changes have shifted to self-regulation & leave it up to landfill operator how to accept & record the location of asbestos at landfills. Qld WorkCover is working with waste industry to make sure people are not exposed.’
Review of the Qld landfilling guidelines found no specific guidance for asbestos landfilling. Qld landfill licences (known as environmental authorities) are not freely available but can be purchased from EHP, at https://www.ehp.qld.gov.au/services/index.php?item_id=33258.
EHP comments suggest that the licences do not prescribe asbestos management methods.
$0 Upper: Middlemount Resource Recovery Centre $345.50/tonne.
Lower: Warwick Central Waste Management Facility $84/tonne.
Qld is the only jurisdiction with ‘self-regulation’ model for asbestos landfill management requirements.
Gate fees vary significantly across Qld - some examples vary by 400%.
South Australia
SA EPA comment: ‘Authorisation via licence must specify that asbestos is allowed. Landfills will either have mono cell or have specific controls to dispose as part of the mixed waste cell (that is usually in a defined area to ensure no problems later when sinking bores for landfill gas recovery, etc.)’.
$47 SA EPA comment: ‘Site tipping fees range from $250 to $600 per tonne’.
Gate fees vary significantly across SA with examples of gate fees varying by 240%.
Asbestos Safety and Eradication Agency | 26
Jurisdiction Requirements to receive waste asbestos at a landfill
Landfill levy (2014/15) ($/tonne) Gate fee range
16 Comments
Tasmania Tas EPA comment: ‘Asbestos to be double wrapped or suitably covered (for contaminated soil) & buried on arrival. Most landfills have an asbestos pit that they open for a particular day. Not a requirement – just what is recommended.’
$2 - $5 Tas EPA comment: ‘From $80 to $200 per tonne tipping (roughly)’.
Gate fees vary significantly across Tas with examples of gate fees varying by 250%.
Victoria EPA Victoria’s guidelines for landfilling of asbestos include:
“… waste asbestos to be handled & covered in such a manner that no dust is generated. To achieve this & the long-term security of the disposal operation the following measures or equivalent practices should be adopted:
Before compacting, cover with a layer of soil at least 300 mm thick or with a layer of waste at least 1 m thick.
… must not be deposited within 2 m of the final tipping surface of the landfill.
When not receiving waste, any containers used for temporary storage at a site must be covered.
It is preferable that a dedicated area of a landfill be used for asbestos disposal & that this area is clearly designated on site maps. … While landfilling of waste asbestos is generally appropriate, situations may arise where pre-treatment before landfilling should be considered. Acid treatment of white asbestos changes the nature of the asbestos fibres & appears to be the cheapest form of treatment available. Other treatment methods include thermal processes, chemical coagulation & immobilisation” (EPA Vic 2009 p 2).
$30 (note the levy for non-hazardous commercial waste is now $53.20).
Upper: Bowser Landfill $233/tonne.
Lower: Kilmany Resource Recovery Centre & Landfill $90/tonne.
EPA Vic is the only jurisdiction where the levy on all asbestos wastes (including soils contaminated with asbestos) is lower than the industrial waste levy. Potentially creating an incentive to put asbestos waste into other wastes to reduce the levy rate per tonne.
Gate fees vary significantly across Vic with examples of gate fees varying by 260%.
Western Australia
WA Department of Environment Regulation, included detailed asbestos management requirements for landfill licensed to receive asbestos. The licences are available online. Extract below from an example licence (the City of Armadale):
$0 for asbestos products such as roofing or insulation.
21
$40 for asbestos contaminated soils/rubble that
Upper: Christmas Island Tip $428/m
3.
Lower: Stanley Road Waste Management Facility $82/tonne.
For levy purposes, WA DER (2014) defines ‘asbestos contaminated soils’ as “not considered to be asbestos-containing materials.”
WA’s $0 levy on asbestos products such as asbestos
21
WA DER 2014.
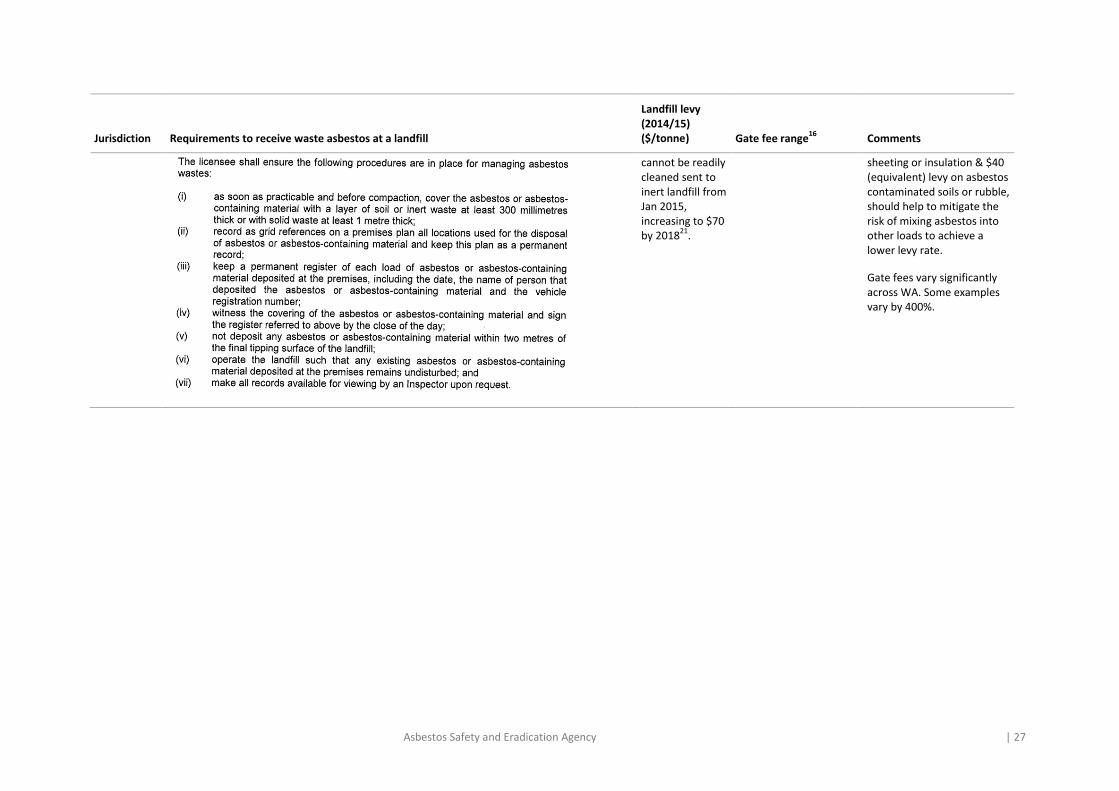
Asbestos Safety and Eradication Agency | 27
Jurisdiction Requirements to receive waste asbestos at a landfill
Landfill levy (2014/15) ($/tonne) Gate fee range
16 Comments
cannot be readily cleaned sent to inert landfill from Jan 2015, increasing to $70 by 2018
21.
sheeting or insulation & $40 (equivalent) levy on asbestos contaminated soils or rubble, should help to mitigate the risk of mixing asbestos into other loads to achieve a lower levy rate.
Gate fees vary significantly across WA. Some examples vary by 400%.
Asbestos Safety and Eradication Agency | 28
Summary and discussion
Readily available lists of facilities that will take asbestos waste are available for all jurisdictions apart
from NT, Tas and regional WA.
In all jurisdictions an EPA licence is required to landfill asbestos waste and a similar set of
management requirements are outlined. There is some variation in the requirements for mono-
landfilling and the records that are required regarding the asbestos waste location. Perhaps more
significant is the variation in how the landfilling management requirements are specified. For
example, NSW includes the requirements in regulations which are then simple to reference in a
licence and can be used in enforcement action. The NT EPA has an impressive set of management
requirements for asbestos at landfills (see NT EPA 2015), however, ‘guidance notes’ are difficult to
enforce unless included within the landfill licence.
Gate fees for the disposal of asbestos vary significantly within and between jurisdictions. Gate fees
can vary by as much as 400% in Qld and WA and 160% in the NT (with other jurisdictions in-
between). The reasons for the variation are many. Those identified by this project include:
gate fees per tonne being set by the facility operator who may not want to take asbestos and
therefore sets a high price to deter customers
differing landfill levy rates across a jurisdiction and between jurisdictions
gate fees being set higher for customers that are not rate payers in the local government area
where the landfill is located
variable landfilling costs due to economies of scale.
Landfill levies applied to asbestos waste across Australia differ widely. Some jurisdictions exclude
asbestos products such as asbestos-containing roofing or sheeting; others make no exceptions. The
ACT provides for free disposal for limited quantities. WA’s levy exemption on asbestos-containing
products such as sheeting or insulation and $40 (equivalent) levy on asbestos-contaminated soils or
rubble should help to mitigate the risk of mixing asbestos into other loads to achieve a lower levy
rate.
In Victoria in 2014-15, the levy on all asbestos wastes, including soils and rubble contaminated with
asbestos, ($30/tonne) is lower than the industrial waste levy ($53.20/tonne). This has the potential
to create an incentive to put asbestos waste into inert demolition wastes to reduce the levy rate per
tonne. A comparison of Victorian levy rates and asbestos disposal tonnages is presented in Figure 11
to check if this is occurring. The results are ambiguous. Ongoing monitoring would be advisable.
Should future levy data suggest significant quantities of asbestos waste are being mixed with other
industrial rubble to reduce landfill disposal costs, Victoria could adopt WA’s approach as discussed
above.

Asbestos Safety and Eradication Agency | 29
Figure 11: A comparison of asbestos waste quantities and levy rates for asbestos and for industrial waste, Victoria, 1996 to 2014
3.4 Licensing and management requirements for transfer stations
Transfer stations can provide an important linkage to landfill disposal for asbestos waste particularly
in areas lacking a local landfill licensed to receive asbestos. This section analyses the licensing and
management requirements for operating a transfer station to receive asbestos waste before it is
transported off-site to a landfill. We exclude transfer stations that are co-located on an operating
landfill site – typically these are licensed as part of the landfill operation.
The table below provides, for each jurisdiction, an overview of the role of transfer stations in
managing asbestos waste and a description of any EPA licensing and management requirements.

Asbestos Safety and Eradication Agency | 30
Table 5: Licensing and management requirements for accepting asbestos at transfer stations (t/s)
Jurisdiction Overview & jurisdictions general comments EPA licence/ approval req? Requirements to receive waste asbestos (where applicable) Comments
Australian Capital Territory
ACT EPA comment: ‘We don’t encourage double handling of asbestos via transfer stations (t/s) & prefer asbestos goes straight to landfill for disposal. Domestic quantities (<250kg) … can be received for free to prevent illegal dumping, or disposal in household bins.’
Yes ACT EPA comment: ‘T/s take only double bagged asbestos & require placing in bins (no throwing). If packing is torn they have bags on site for minor tears (only). Unpackaged asbestos is not allowed to enter the t/s. If only small can place in a bag on site, but if larger, then refuse to take until properly wrapped’.
ACT has free receipt of asbestos waste from domestic transport of <250kg.
New South Wales
NSW EPA comment: ‘Most t/s not licensed to take waste asbestos. Refer to Clause 80 of POEO Act 2014 that requires asbestos waste to go to a landfill (not t/s). EPA allows only a few t/s to aggregate asbestos (e.g. Shoalhaven Council)’.
Yes “Bonded asbestos material must be securely packaged at all times… Friable asbestos material must be kept in a sealed container”
22. NSW EPA comment: ‘Any t/s permitted must
have management plan for asbestos. Must refuse to receive asbestos that is not appropriately contained’.
NSW legislation appears to prohibit t/s from accepting asbestos, but EPA allows a few t/s to do so.
Northern Territory
NT EPA comment: ‘No transfer station currently receives asbestos. The NT EPA’s preference is that asbestos go directly to landfill’. “The NT EPA’s preferred position … is that asbestos should be disposed of promptly to a landfill licensed to receive it. Given the remoteness of communities & transport distances in NT other options such as temporary storage & on-site containment cells may also be considered. These systems must be regarded as secondary” (NT EPA 2015).
Yes “All new temporary storage facilities or expansions to existing storage facilities associated with the collection, storage, treatment & disposal of asbestos on a commercial or fee for service basis require an Environmental Protection Approval under the Waste Management & Pollution Control Act prior to construction… In addition …, all temporary storage facilities designed to accept asbestos require an Environmental Protection Licence” (NT EPA 2015).
NT EPA asbestos disposal guidelines state the preference is for asbestos to go directly to landfill but do not prevent transfer stations from applying to handle asbestos.
Queensland EHP comment: ‘No t/s in Brisbane accepts asbestos’. Qld government maintains ‘asbestos disposal information’ listing of options by local government area
23. Varying levels
of information are provided (from comprehensive to council contact details only). No t/s is listed, suggesting receipt is uncommon.
Yes No specific EHP requirements were identified. T/s receipt of asbestos is apparently decided and controlled at local government level.
T/s in Brisbane do not take asbestos, but some others do. To understand asbestos receipt in regional t/s Consultation with councils would be needed.
22
http://www.epa.nsw.gov.au/managewaste/house-asbestos.htm, accessed April 2015 23
http://www.deir.qld.gov.au/asbestos/law/transport-disposal.htm#requirements, accessed April 2015
Asbestos Safety and Eradication Agency | 31
Jurisdiction Overview & jurisdictions general comments EPA licence/ approval req? Requirements to receive waste asbestos (where applicable) Comments
South Australia SA EPA comment: ‘the EPA promotes the development of regional waste management plans to ensure the waste management requirements for areas are considered and addressed. Some t/s accept asbestos and some don’t. The site operator chooses to gain approval to receive asbestos waste’.
Yes ‘Double wrap asbestos in >200 micron thick plastic using duct tape to form sealed packages of a manageable size, or place in plastic-lined bins supplied by a licensed waste transporter. Plastic liners should be taped down over the contents of the bin’ (EPA SA 2014, p.3). SA EPA comment: ‘Typically t/s will refuse asbestos not properly contained or may wrap on site for a fee. Customers delivering asbestos are usually commercial operators & the t/s operators get to know those who are not compliant’.
The EPA promotes the development of regional waste management plans to ensure the waste management including asbestos management and disposal requirements for areas are considered and addressed
Tasmania Tas EPA comment: ‘Around 15% of t/s take asbestos. Up to operator as to whether it is accepted. EPA prefers that they take it to prevent illegal dumping by making it easy to dispose. Most councils publish whether they accept waste asbestos. EPA does not currently have a publically available list of asbestos waste disposal sites but are hoping to have the list available into the future’.
Unknown Tas EPA comment: ‘Must be double wrapped prior to acceptance. Issue exists when unwrapped asbestos arrives – has already exposed public on the journey. Three options: 1. Refusal. 2. Charge to wrap the asbestos. 3. Provide equipment to customer to do wrapping. All options have issues.’
Tas EPA supports t/s taking asbestos (see Figure 12).
Victoria EPA Vic comment: ‘Most t/s don't receive asbestos because receipt requires works approval & licensing.’ The only t/s taking asbestos in Victoria are co-located on landfill premises (which require EPA works approval & licensing).
A Victorian working group (AVRWMG et al. 2011) published a guideline on Managing domestic non-friable asbestos at resource recovery centres. This is the only detailed guide for t/s to receive asbestos waste from households identified in this review. The guideline is no longer public. EPA Vic commented that: ‘Before release of the document is revisited there needs to be agreement that this is a preferred option to manage asbestos disposal. To ensure the guidelines were adopted correctly transfer stations would need to be equipped with proper facilities and handling procedures/training. This increases costs. There may also be limited uptake as the risks around asbestos are often too big a barrier, especially at a local council level.’
Yes EPA Victoria (2009) provides detailed guidance on the requirements for asbestos waste delivery, including: “Double-wrap the entire article with polythene sheets, approximately 200 μm (0.2 mm) thick, & seal with adhesive tape” (p.2).
Commercial asbestos waste is a prescribed industrial waste (PIW) in Victoria. PIW receipt requires works approval & licence. EPA commented that approval is also required for a t/s to receive domestic delivered asbestos.
It is unclear if EPA Vic & other agencies support t/s receiving asbestos (commercial or domestic). This will be important to resolve as Victoria consolidate the number of regional landfills.
Asbestos Safety and Eradication Agency | 32
Jurisdiction Overview & jurisdictions general comments EPA licence/ approval req? Requirements to receive waste asbestos (where applicable) Comments
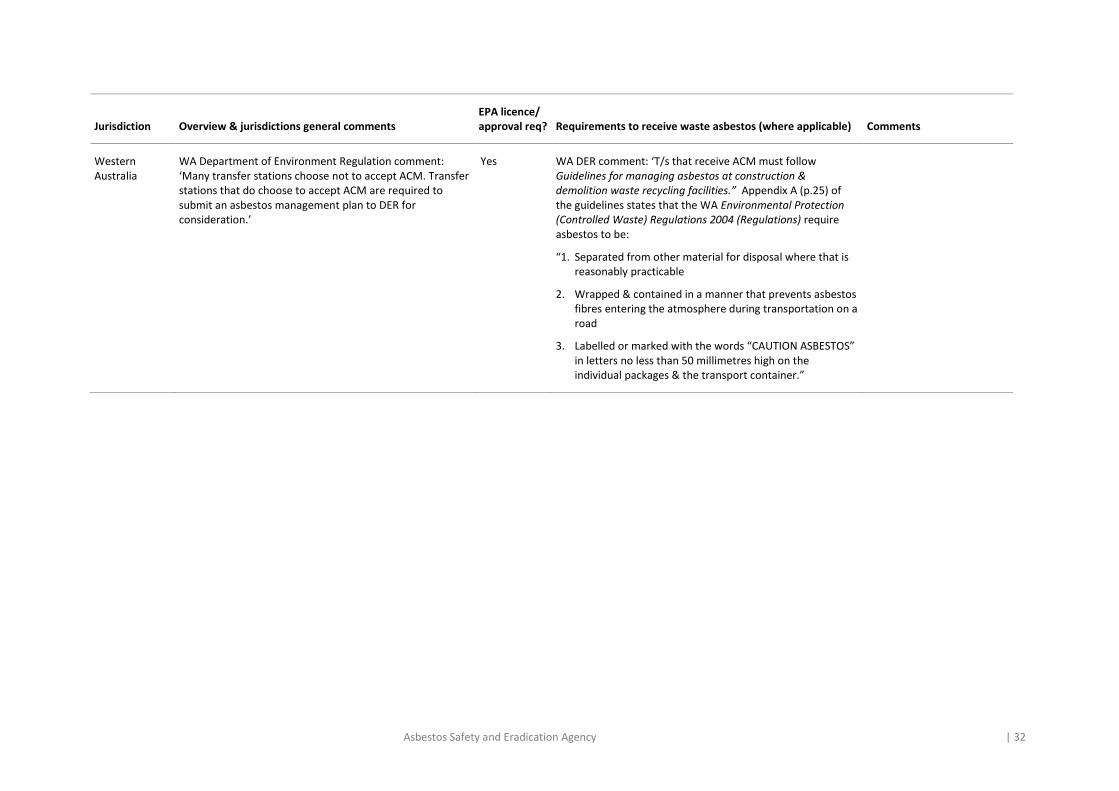
Western Australia
WA Department of Environment Regulation comment: ‘Many transfer stations choose not to accept ACM. Transfer stations that do choose to accept ACM are required to submit an asbestos management plan to DER for consideration.’
Yes WA DER comment: ‘T/s that receive ACM must follow Guidelines for managing asbestos at construction & demolition waste recycling facilities.” Appendix A (p.25) of the guidelines states that the WA Environmental Protection (Controlled Waste) Regulations 2004 (Regulations) require asbestos to be:
“1. Separated from other material for disposal where that is reasonably practicable
2. Wrapped & contained in a manner that prevents asbestos fibres entering the atmosphere during transportation on a road
3. Labelled or marked with the words “CAUTION ASBESTOS” in letters no less than 50 millimetres high on the individual packages & the transport container.”
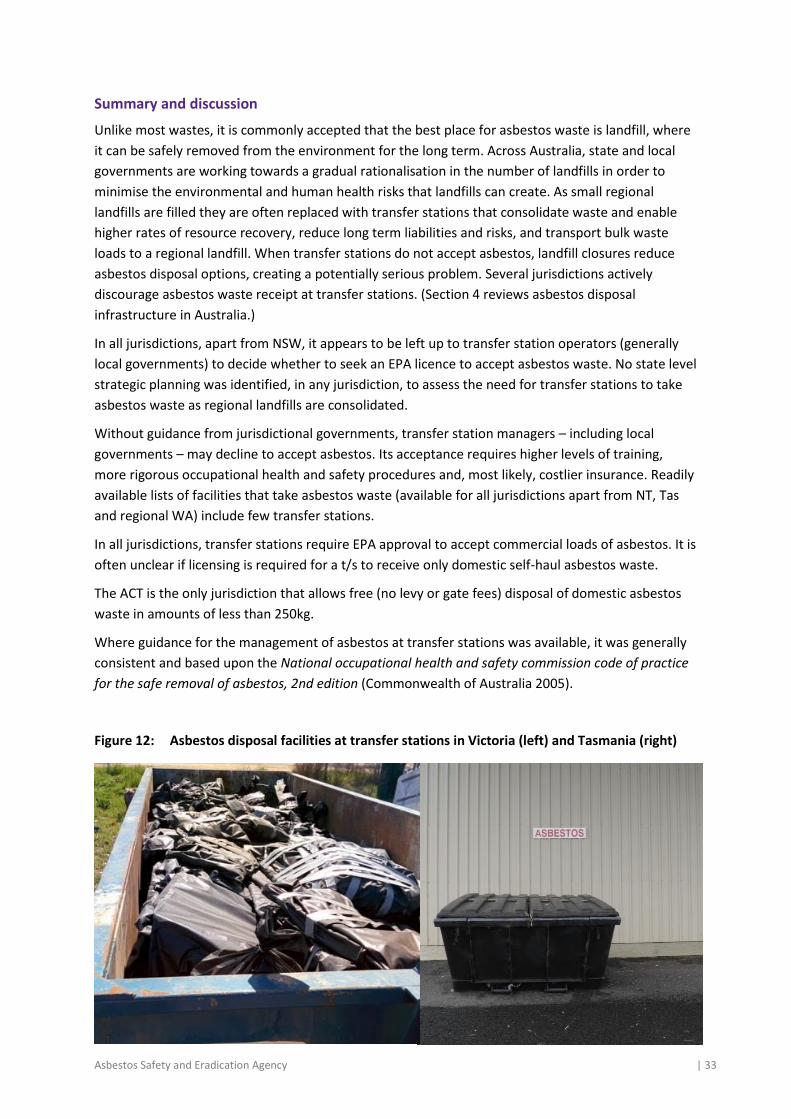
Asbestos Safety and Eradication Agency | 33
Summary and discussion
Unlike most wastes, it is commonly accepted that the best place for asbestos waste is landfill, where
it can be safely removed from the environment for the long term. Across Australia, state and local
governments are working towards a gradual rationalisation in the number of landfills in order to
minimise the environmental and human health risks that landfills can create. As small regional
landfills are filled they are often replaced with transfer stations that consolidate waste and enable
higher rates of resource recovery, reduce long term liabilities and risks, and transport bulk waste
loads to a regional landfill. When transfer stations do not accept asbestos, landfill closures reduce
asbestos disposal options, creating a potentially serious problem. Several jurisdictions actively
discourage asbestos waste receipt at transfer stations. (Section 4 reviews asbestos disposal
infrastructure in Australia.)
In all jurisdictions, apart from NSW, it appears to be left up to transfer station operators (generally
local governments) to decide whether to seek an EPA licence to accept asbestos waste. No state level
strategic planning was identified, in any jurisdiction, to assess the need for transfer stations to take
asbestos waste as regional landfills are consolidated.
Without guidance from jurisdictional governments, transfer station managers – including local
governments – may decline to accept asbestos. Its acceptance requires higher levels of training,
more rigorous occupational health and safety procedures and, most likely, costlier insurance. Readily
available lists of facilities that take asbestos waste (available for all jurisdictions apart from NT, Tas
and regional WA) include few transfer stations.
In all jurisdictions, transfer stations require EPA approval to accept commercial loads of asbestos. It is
often unclear if licensing is required for a t/s to receive only domestic self-haul asbestos waste.
The ACT is the only jurisdiction that allows free (no levy or gate fees) disposal of domestic asbestos
waste in amounts of less than 250kg.
Where guidance for the management of asbestos at transfer stations was available, it was generally
consistent and based upon the National occupational health and safety commission code of practice
for the safe removal of asbestos, 2nd edition (Commonwealth of Australia 2005).
Figure 12: Asbestos disposal facilities at transfer stations in Victoria (left) and Tasmania (right)
Asbestos Safety and Eradication Agency | 34
3.5 Conclusions and recommendations
The approaches to intra-state tracking of asbestos waste in Australia are inconsistent. Four
jurisdictions do not track asbestos waste; two apply a weight threshold for tracking asbestos; and
two require tracking for any amount of asbestos waste. The development of a consistent agreed
approach to asbestos waste tracking that could be adopted across Australia, over time, should be
considered.
Asbestos waste will need to be disposed to landfill for at least several decades. Establishing a
consistent set of national governance and management requirements for asbestos landfilling is
therefore a worthy long-term pursuit. Currently there is a reasonable level of consistency across
Australia in requirements for landfilling of asbestos at the tip face, but significant inconsistency in
how levies are applied. The lessons from these different approaches could be shared between
jurisdictions to help develop a coherent national ‘best practice’ approach.
However, while levies influence prices, they do not control them. Gate fees are ultimately set by
landfill operators based on private preferences. High prices may give rise to socially sub-optimal
outcomes, including hiding of asbestos in general waste, illegal dumping or diversion to more distant
sites. Table 4 presented evidence of large variations in asbestos disposal fees. The project team were
advised that high prices for asbestos disposal at some private landfills servicing Melbourne were
causing its diversion to smaller semi-rural landfills run by local governments. It is sensible that society
limits the supply of landfill space, but, it could be argued, those who are approved to operate a
licensed facility in a socially restricted market should be obliged to service local needs. There may be
a case for EPA licence requirements that obligate operators of suitable landfills to accept asbestos
based on some agreed pricing system, for example a standard national gate fee.
It is commonly accepted that the best place for asbestos waste is landfill. ‘Double handling’ of
asbestos waste can potentially increase exposure risks, so the receipt of asbestos waste at transfer
stations is often discouraged. This creates a tension between Australia’s long-term waste
management direction of replacing landfills with transfer stations, and the need for readily available
asbestos disposal options. As jurisdictions across Australia rationalise the number of landfills, the
risks of further limiting asbestos disposal options need to be carefully considered and included in
infrastructure planning. One option for dealing with this difficulty is to resolve the problems in
accepting asbestos at transfer stations, and amend best practice guidelines accordingly. Another is to
provide specialist, and potentially mobile, facilities for acceptance of asbestos waste. The project
team understands that equipment of this nature has been trialled in some areas, including Gippsland
in Victoria.
Key differences in jurisdictional methods for controlling asbestos waste are summarised in Figure 13.

Asbestos Safety and Eradication Agency | 35
Figure 13: Key differences in jurisdictional controls over asbestos waste
Tracking system?
Levy in operation?
Levy on most asbestos
Jurisdiction attitude to asbestos at transfer stations
ACT ✘ ✔ 1 NA Discouraged
NSW ✔ ✔ $121 Prohibited with exceptions
NT ✘ ✘ $0 Neutral
Qld ✔ ✘ $0 Neutral
SA ✔ ✔ $47 Neutral
Tas ✘ ✔ $2 Encouraged
Vic ✔ ✔ $30 Discouraged
WA ✘ ✔ ? 2 Neutral
Recommendations
It is recommended that the agency work with the Commonwealth Department of the Environment
(DoE) and relevant state and territory agencies to develop nationally preferred positions in relation
to:
1. Tracking asbestos waste, encompassing threshold quantities and sources to which tracking
should apply.
2. Landfill pricing that encourages socially optimal disposal practices for asbestos. Options
include:
- a preferred position on the application of landfill levies to asbestos waste, including
relativities to the levy on other waste types and exemptions
- use of landfill licenses to require operators of suitable landfills to accept asbestos based on
some agreed pricing system, for example a standard national gate fee.
3. Receipt of asbestos waste in areas that do not have ready access to landfill disposal. This could
include amended requirements and guidance to transfer station operators and/or provision of
specialist and potentially temporary mobile equipment.
Consultation with state and territory agencies during the development of this report indicates that all
are willing to be involved in developing nationally preferred positions in these areas of asbestos
waste management.
Notes:
1 ACT has no levy but the government owns and controls the price at the only operating landfill, which is equivalent to having a levy.
2 WA applies a $40
levy to waste
contaminated
with asbestos
but exempts
separate
asbestos
products, such as
roofing materials
that contain
asbestos.
Asbestos Safety and Eradication Agency | 36
4. Asbestos waste infrastructure in Australia
4.1 Introduction
This section aims to report and assess the availability of asbestos waste infrastructure in Australia by
jurisdiction. The information and data sources that informed the analysis were as follows:
1. Geoscience Australia National Waste Management Database (GeoScience database). An
extract from this resource, covering landfills licensed to accept asbestos, was kindly provided
to the project team. It enabled the mapping of the current asbestos waste infrastructure by
jurisdiction (presented below).
2. Consultation with EPA (or equivalent) staff in each jurisdiction regarding asbestos waste
infrastructure availability, and expected lifespan of landfills.
3. Where available, review of the jurisdictional online information for sites licensed to receive
asbestos waste.
4. Other reports for specific jurisdictions as cited.
Geographically-referenced data is shown to be unfortunately incomplete. However, it is apparent
that many regional and rural areas lack disposal options or are serviced by landfills operating to low
standards of performance.
4.2 Jurisdictional reviews Australian Capital Territory
The ACT is serviced by two landfills that receive asbestos waste, namely the Mugga Lane Resource
Management Centre and the West Belconnen Resource Management Centre (which is closed to
general waste).
The well documented ‘Mr Fluffy homes’ clean-up program is currently underway, and delivering
demolished Mr Fluffy homes to the West Belconnen site. ACT TAMS staff advised the project team
that the expected life at West Belconnen is about five to seven years, and Mugga Lane is expected to
have about 30 years of capacity as they are constructing a new asbestos cell. A new disposal site for
contaminated and non-contaminated soil, including asbestos impacted soil, is currently going
through planning and approval stage. With the construction of new asbestos disposal cells, ACT
TAMS believes that the ACT has capacity for asbestos waste disposal for approximately 30 years.
Given the relatively small size of the ACT it can be assumed that there are also no areas without
disposal infrastructure within a reasonable travel distance.
New South Wales
Figure 1 shows the waste asbestos disposal infrastructure in NSW, based on the GeoScience
database. Unfortunately, not all of the sites listed on the NSW EPA website24 are included in the
24
http://www.epa.nsw.gov.au/managewaste/house-asbestos.htm, accessed April 2015
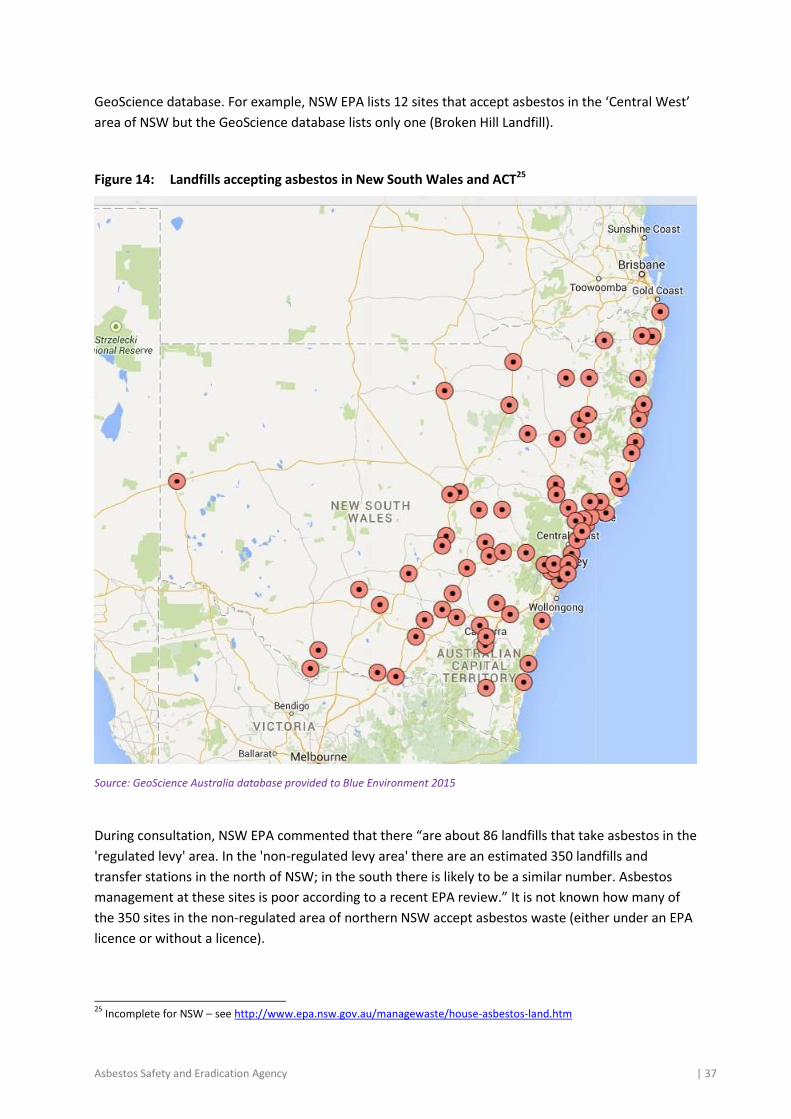
Asbestos Safety and Eradication Agency | 37
GeoScience database. For example, NSW EPA lists 12 sites that accept asbestos in the ‘Central West’
area of NSW but the GeoScience database lists only one (Broken Hill Landfill).
Figure 14: Landfills accepting asbestos in New South Wales and ACT25
Source: GeoScience Australia database provided to Blue Environment 2015
During consultation, NSW EPA commented that there “are about 86 landfills that take asbestos in the
'regulated levy' area. In the 'non-regulated levy area' there are an estimated 350 landfills and
transfer stations in the north of NSW; in the south there is likely to be a similar number. Asbestos
management at these sites is poor according to a recent EPA review.” It is not known how many of
the 350 sites in the non-regulated area of northern NSW accept asbestos waste (either under an EPA
licence or without a licence).
25
Incomplete for NSW – see http://www.epa.nsw.gov.au/managewaste/house-asbestos-land.htm
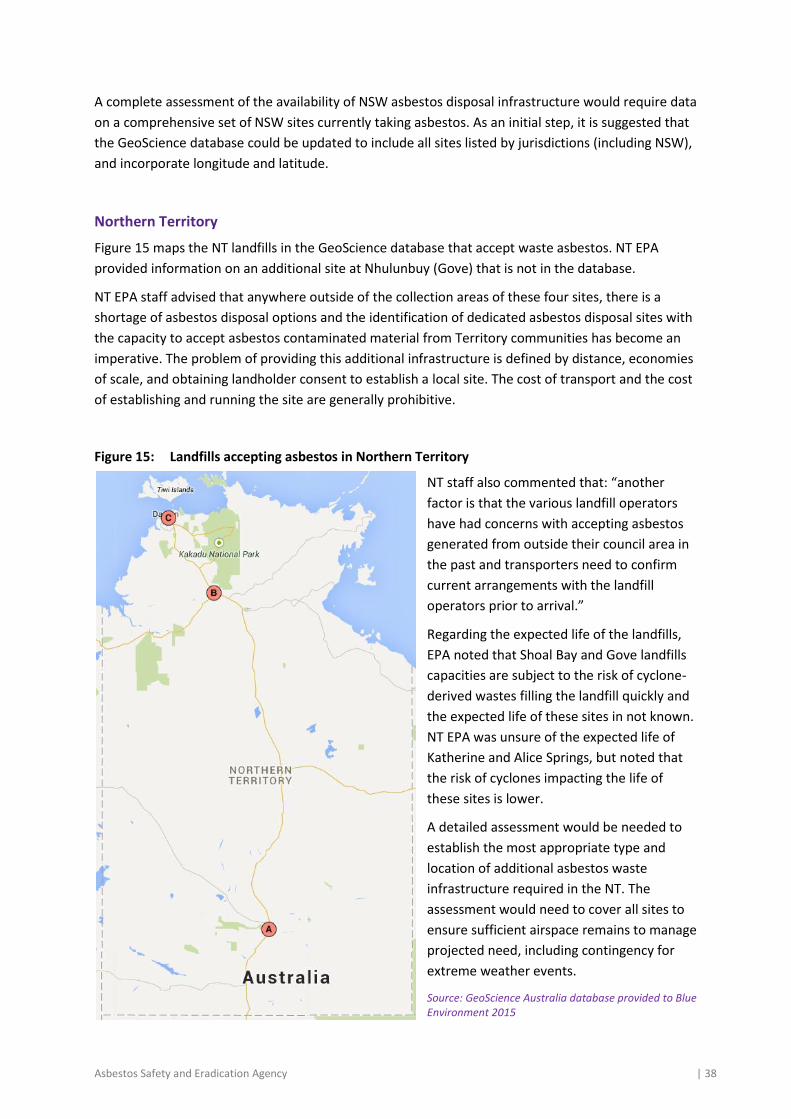
Asbestos Safety and Eradication Agency | 38
A complete assessment of the availability of NSW asbestos disposal infrastructure would require data
on a comprehensive set of NSW sites currently taking asbestos. As an initial step, it is suggested that
the GeoScience database could be updated to include all sites listed by jurisdictions (including NSW),
and incorporate longitude and latitude.
Northern Territory
Figure 15 maps the NT landfills in the GeoScience database that accept waste asbestos. NT EPA
provided information on an additional site at Nhulunbuy (Gove) that is not in the database.
NT EPA staff advised that anywhere outside of the collection areas of these four sites, there is a
shortage of asbestos disposal options and the identification of dedicated asbestos disposal sites with
the capacity to accept asbestos contaminated material from Territory communities has become an
imperative. The problem of providing this additional infrastructure is defined by distance, economies
of scale, and obtaining landholder consent to establish a local site. The cost of transport and the cost
of establishing and running the site are generally prohibitive.
Figure 15: Landfills accepting asbestos in Northern Territory
NT staff also commented that: “another
factor is that the various landfill operators
have had concerns with accepting asbestos
generated from outside their council area in
the past and transporters need to confirm
current arrangements with the landfill
operators prior to arrival.”
Regarding the expected life of the landfills,
EPA noted that Shoal Bay and Gove landfills
capacities are subject to the risk of cyclone-
derived wastes filling the landfill quickly and
the expected life of these sites in not known.
NT EPA was unsure of the expected life of
Katherine and Alice Springs, but noted that
the risk of cyclones impacting the life of
these sites is lower.
A detailed assessment would be needed to
establish the most appropriate type and
location of additional asbestos waste
infrastructure required in the NT. The
assessment would need to cover all sites to
ensure sufficient airspace remains to manage
projected need, including contingency for
extreme weather events.
Source: GeoScience Australia database provided to Blue Environment 2015

Asbestos Safety and Eradication Agency | 39
Queensland
Figure 16 shows the waste asbestos disposal infrastructure in Qld, based on the GeoScience
database. Unfortunately, not all of the sites that are listed on the Qld Government’s own list26 are
included. For example, the Qld list includes Burke Shire Council as accepting asbestos at “Asbestos
Waste - at cost plus 21% plus GST (minimum $110.00).” This site is not listed in the GeoScience
database. Also, Qld lists Boulia Shire Council in their infrastructure list (not included in the
GeoScience database). The Qld list links to the Boulia council website, which states the following
regarding the landfill operation: “The refuse tip is located on the Bedourie Road, and is accessible by
all persons. There is no charge to dump rubbish at this tip” 27.
Qld EHP staff advised that all landfills can accept some 'regulated waste' (up to 10%) or be classified
as a 100% regulated waste landfill. Recent changes now leave it up to landfill operators how to
accept and record the location of asbestos. WorkCover Qld is working with the waste industry to
make sure that people are not exposed, but this work is only in an early phase. They noted that most
indigenous communities have some kind of landfill. Qld has 467 local government landfills, many of
which are unmanned.
The inclusion of unmanned landfills in the Qld Government list of asbestos landfills and the
comments above indicate that asbestos waste can be disposed to any landfill in Qld. If this is correct,
then the GeoScience database of 64 sites is missing the majority of the 467 sites that Qld EHP has
identified.
A complete assessment of the availability of Qld asbestos disposal infrastructure would require a
comprehensive set of sites. It is suggested that the GeoScience database could be updated to include
all sites listed by jurisdictions (including Qld), and incorporate longitude and latitude.
26
http://www.deir.qld.gov.au/asbestos/law/transport-disposal/disposal-info.htm, accessed April 2015 27
http://www.boulia.qld.gov.au, accessed 23 April 2015
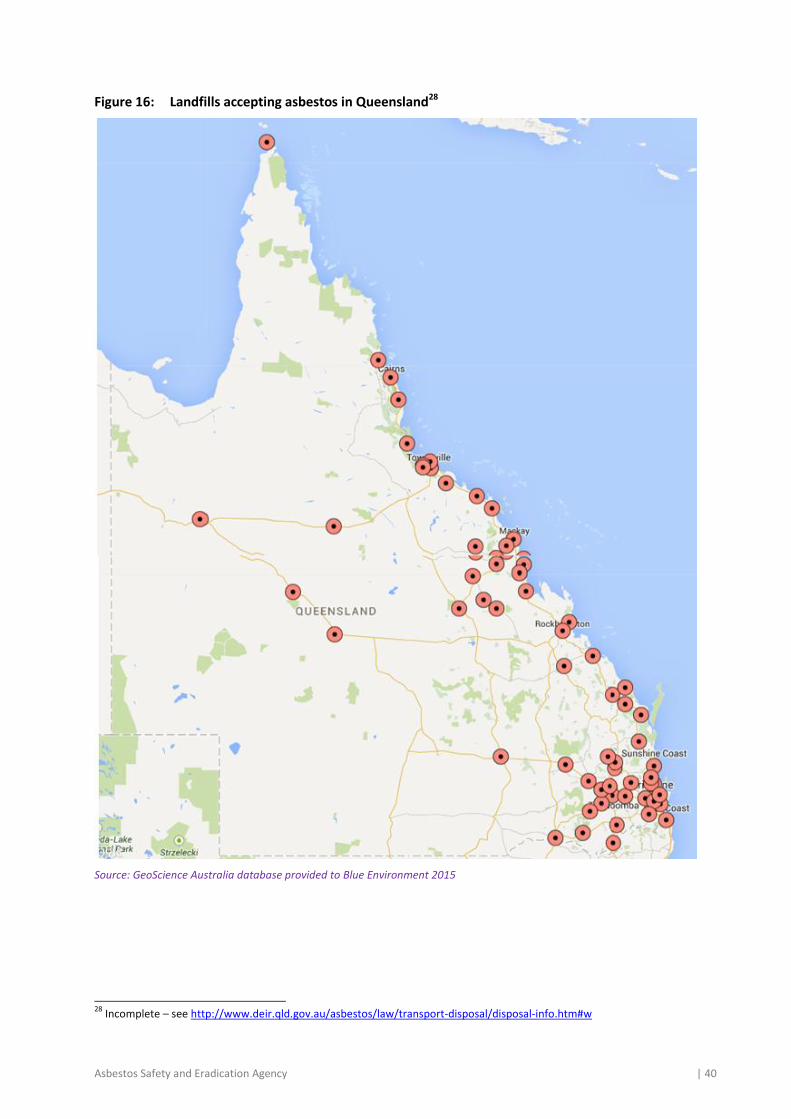
Asbestos Safety and Eradication Agency | 40
Figure 16: Landfills accepting asbestos in Queensland28
Source: GeoScience Australia database provided to Blue Environment 2015
28
Incomplete – see http://www.deir.qld.gov.au/asbestos/law/transport-disposal/disposal-info.htm#w
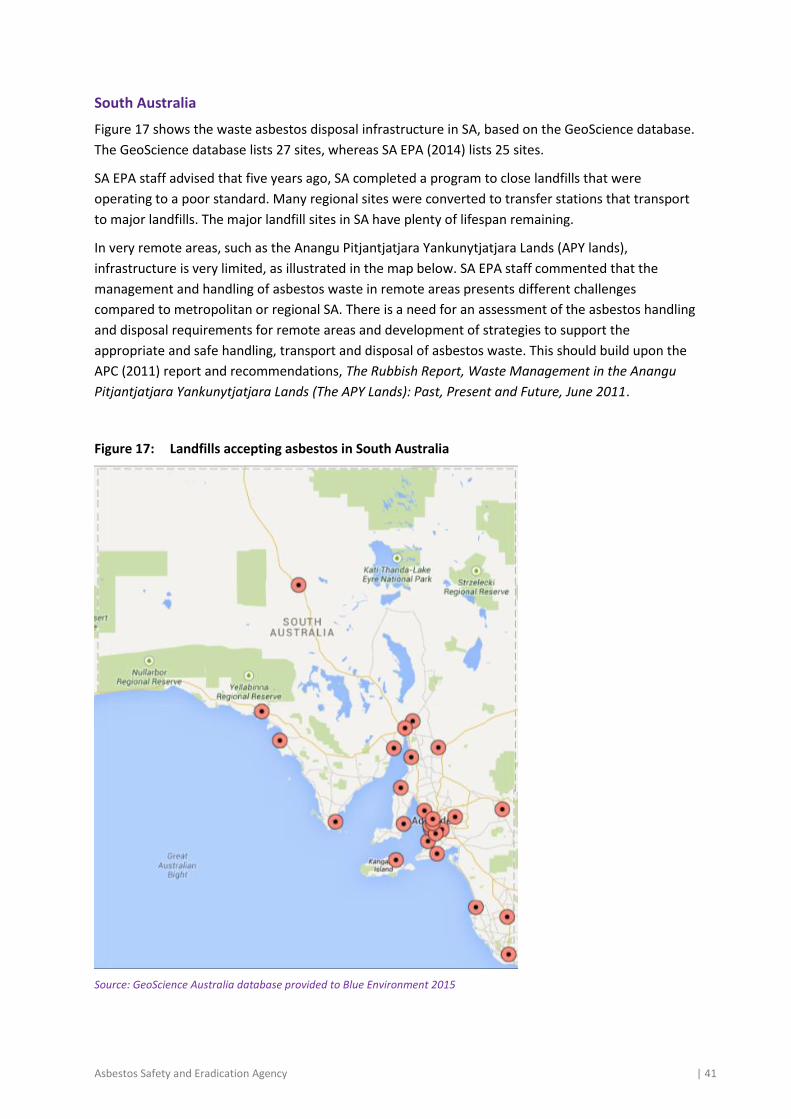
Asbestos Safety and Eradication Agency | 41
South Australia
Figure 17 shows the waste asbestos disposal infrastructure in SA, based on the GeoScience database.
The GeoScience database lists 27 sites, whereas SA EPA (2014) lists 25 sites.
SA EPA staff advised that five years ago, SA completed a program to close landfills that were
operating to a poor standard. Many regional sites were converted to transfer stations that transport
to major landfills. The major landfill sites in SA have plenty of lifespan remaining.
In very remote areas, such as the Anangu Pitjantjatjara Yankunytjatjara Lands (APY lands),
infrastructure is very limited, as illustrated in the map below. SA EPA staff commented that the
management and handling of asbestos waste in remote areas presents different challenges
compared to metropolitan or regional SA. There is a need for an assessment of the asbestos handling
and disposal requirements for remote areas and development of strategies to support the
appropriate and safe handling, transport and disposal of asbestos waste. This should build upon the
APC (2011) report and recommendations, The Rubbish Report, Waste Management in the Anangu
Pitjantjatjara Yankunytjatjara Lands (The APY Lands): Past, Present and Future, June 2011.
Figure 17: Landfills accepting asbestos in South Australia
Source: GeoScience Australia database provided to Blue Environment 2015
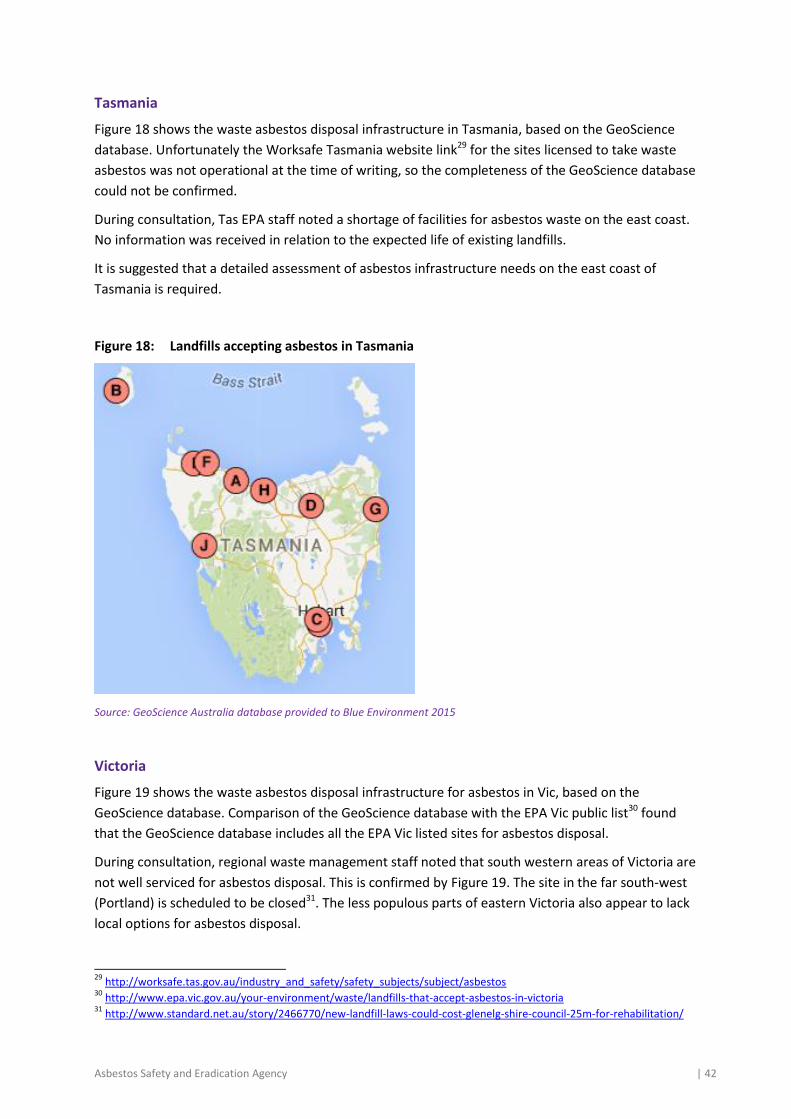
Asbestos Safety and Eradication Agency | 42
Tasmania
Figure 18 shows the waste asbestos disposal infrastructure in Tasmania, based on the GeoScience
database. Unfortunately the Worksafe Tasmania website link29 for the sites licensed to take waste
asbestos was not operational at the time of writing, so the completeness of the GeoScience database
could not be confirmed.
During consultation, Tas EPA staff noted a shortage of facilities for asbestos waste on the east coast.
No information was received in relation to the expected life of existing landfills.
It is suggested that a detailed assessment of asbestos infrastructure needs on the east coast of
Tasmania is required.
Figure 18: Landfills accepting asbestos in Tasmania
Source: GeoScience Australia database provided to Blue Environment 2015
Victoria
Figure 19 shows the waste asbestos disposal infrastructure for asbestos in Vic, based on the
GeoScience database. Comparison of the GeoScience database with the EPA Vic public list30 found
that the GeoScience database includes all the EPA Vic listed sites for asbestos disposal.
During consultation, regional waste management staff noted that south western areas of Victoria are
not well serviced for asbestos disposal. This is confirmed by Figure 19. The site in the far south-west
(Portland) is scheduled to be closed31. The less populous parts of eastern Victoria also appear to lack
local options for asbestos disposal.
29
http://worksafe.tas.gov.au/industry_and_safety/safety_subjects/subject/asbestos 30
http://www.epa.vic.gov.au/your-environment/waste/landfills-that-accept-asbestos-in-victoria 31
http://www.standard.net.au/story/2466770/new-landfill-laws-could-cost-glenelg-shire-council-25m-for-rehabilitation/
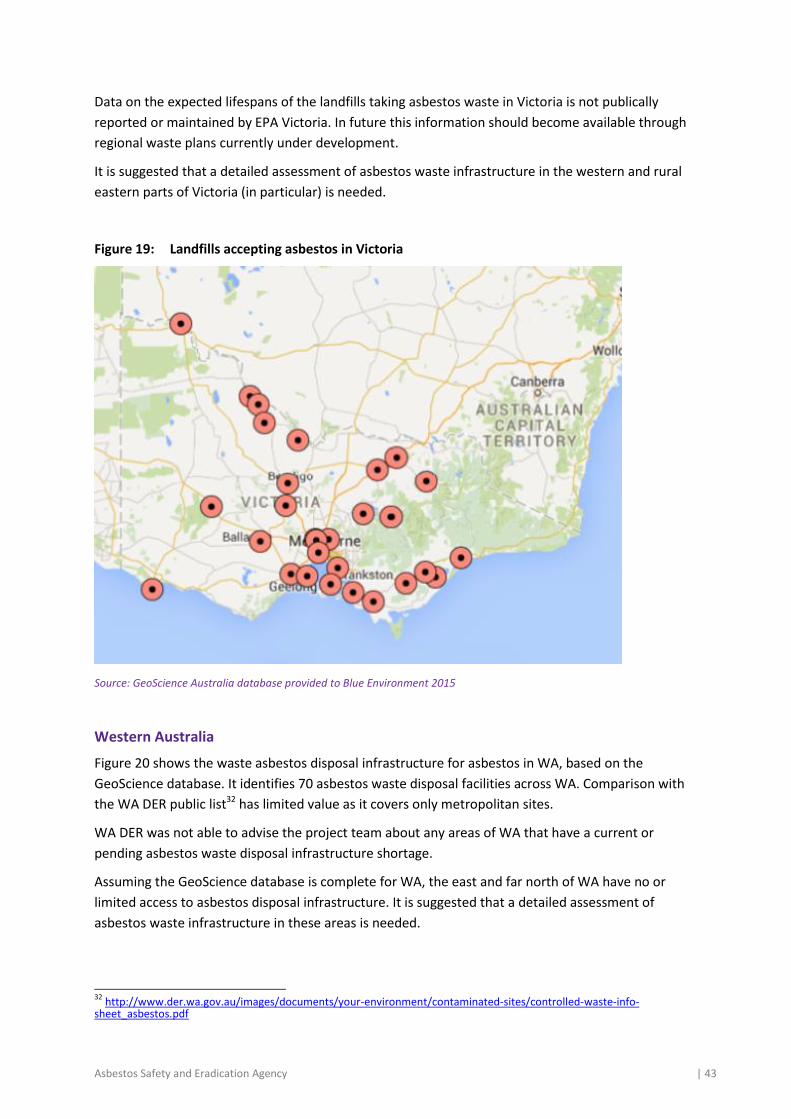
Asbestos Safety and Eradication Agency | 43
Data on the expected lifespans of the landfills taking asbestos waste in Victoria is not publically
reported or maintained by EPA Victoria. In future this information should become available through
regional waste plans currently under development.
It is suggested that a detailed assessment of asbestos waste infrastructure in the western and rural
eastern parts of Victoria (in particular) is needed.
Figure 19: Landfills accepting asbestos in Victoria
Source: GeoScience Australia database provided to Blue Environment 2015
Western Australia
Figure 20 shows the waste asbestos disposal infrastructure for asbestos in WA, based on the
GeoScience database. It identifies 70 asbestos waste disposal facilities across WA. Comparison with
the WA DER public list32 has limited value as it covers only metropolitan sites.
WA DER was not able to advise the project team about any areas of WA that have a current or
pending asbestos waste disposal infrastructure shortage.
Assuming the GeoScience database is complete for WA, the east and far north of WA have no or
limited access to asbestos disposal infrastructure. It is suggested that a detailed assessment of
asbestos waste infrastructure in these areas is needed.
32
http://www.der.wa.gov.au/images/documents/your-environment/contaminated-sites/controlled-waste-info-sheet_asbestos.pdf

Asbestos Safety and Eradication Agency | 44
Figure 20: Landfills accepting asbestos in Western Australia
Source: GeoScience Australia database provided to Blue Environment 2015

Asbestos Safety and Eradication Agency | 45
4.3 Conclusions and recommendations
The ACT was the only jurisdiction able to confirm that asbestos waste infrastructure should be
adequate for the foreseeable future across the jurisdiction.
Several regions of Australia would benefit from a detailed assessment to establish the most
appropriate type and location of additional infrastructure for asbestos waste.
For NSW and Qld, our assessment of infrastructure for asbestos waste disposal is incomplete due to
gaps in the available ‘mappable’ data (i.e. with attached coordinates).
Recommendations
It is recommended that:
4. The agency work with GeoScience Australia to update its waste facility database to include all sites known by NSW EPA and Qld EHP to take asbestos.
5. The agency work with DoE and relevant jurisdictional agencies to assess the asbestos handling and disposal requirements for remote areas and develop strategies to support the appropriate and safe handling, transport and disposal of asbestos waste. This should encompass asbestos awareness and education as well as infrastructure. There appears to be a particular need in:
- areas of the NT not serviced by the four main NT landfills
- remote inland areas of SA
- the east coast of Tasmania
- the western and less populous parts of eastern Victoria
- the east and far north of WA (assuming that the GeoScience database is complete for WA).
Asbestos Safety and Eradication Agency | 46
5. Ongoing waste data options Waste management is a central element of the asbestos problem, and it is therefore important that
the agency has ongoing and regular access to asbestos waste data. Section 2 shows that that a
number of types of data are potentially available in relation to asbestos waste, especially from
jurisdictional tracking systems. For many of these data types, however, there is no need for ongoing
access – periodic analyses (such as has been undertaken for this work) is appropriate for
characteristics such as sources and fates. We believe that the key ongoing need is for tonnage data
to help the agency to understand trends on jurisdictional and national bases.
Table 6 lists the primary sources of annual data on tonnages of asbestos disposal that are potentially
available, by jurisdiction.
Table 6: Potential primary sources of asbestos tonnage data by jurisdiction
Jurisdiction ACT NSW NT Qld SA Tas Vic WA
Tracking system data ✔ ✔ ✔ ✔
Landfill report data ✔ ✔ ✔ ✔ ✔ ✔ ✔
Collecting data can be administratively intensive, but happily there should be no need for the agency
to coordinate separately with each jurisdiction. Jurisdictions already report the tonnages of asbestos
(and other hazardous wastes) that they generate annually via their annual submissions to the Basel
Convention. The agency could seek the necessary permissions to access that data through the
Commonwealth Department of the Environment (DoE).
Section 2.2 identified some significant discrepancies and incompatibilities between the two primary
sources of asbestos waste tonnage data (tracking systems and landfill reports), as well as data quality
problems in historical Basel Convention figures. Some of these problems are due to basic differences
in the data characteristics while others appear to be due to error. Improvements to data quality
should be achievable through the Basel process. The agency could work with the Commonwealth and
jurisdictions to develop preferred methods for collating asbestos waste data, especially where
jurisdictions have access to primary data from both tracking systems and landfill reports. To the
extent practicable, preferred methods would be:
accurate, excluding non-asbestos materials mixed with asbestos (e.g. soil or demolition rubble)
and without double-counting
complete, including domestic self-haul and small commercial loads
apply consistent assumptions, for example for density
transparently constructed.
Asbestos Safety and Eradication Agency | 47
Recommendations
It is recommended that the agency:
6. Liaise with DoE to obtain ongoing access to annual data on asbestos tonnages reported via Basel Convention submissions.
7. Work with the DoE and relevant state and territory government agencies to develop preferred methods for collating asbestos waste data for reporting via Basel Convention submissions.
Asbestos Safety and Eradication Agency | 48
References ABS (Australian Bureau of Statistics 2014a) Building Approvals, Australia, Publication 8731.0,
available from: http://www.abs.gov.au/ausstats/[email protected]/mf/8731.0
ABS (Australian Bureau of Statistics 2015a) Building Activity, Australia, Dec 2014 Publication 8752.0,
available from: http://www.abs.gov.au/ausstats/[email protected]/mf/8731.0
ABS (Australian Bureau of Statistics 2015b) Regional Population Growth Australia, Publication 3218.0,
available from: http://www.abs.gov.au/ausstats/[email protected]/mf/3218.0/
ABS (Australian Bureau of Statistics 2015c) Australian Demographic Statistics, Publication 3101.0,
available from:
http://www.abs.gov.au/AUSSTATS/[email protected]/DetailsPage/3101.0Sep%202014?OpenDocument
ACT (2014) Waste Minimisations (Landfill Fees) Determination 2014 (No1), available from:
http://www.legislation.act.gov.au/di/2014-173/default.asp
ACT TAMS (ACT Territory and Municipal Services 2014) 2014 Guide to Waste and Disposal Charges,
available from: http://www.tams.act.gov.au/recycling-and-waste/recycling-and-waste-
services/recycling-and-waste-facilities#ResourceManagementCentres
Allen Consulting Group (2013) Analysis of Asbestos Removal Approaches for ACM in Workplaces,
prepared for the Office of Asbestos Safety, April.
APC (A Prince Consulting 2011) The Rubbish Report, Waste Management in the Anangu Pitjantjatjara
Yankunytjatjara Lands (The APY Lands): Past, Present and Future, June 2011, available at:
http://www.papertracker.com.au/pdfs/rubbish_report.pdf
AVRWMG (Association of Victorian Regional Waste Management Groups), Sustainability Victoria,
Department of Health, Worksafe Victoria and the Environment Protection Authority (2011)
Managing domestic non-friable asbestos at resource recovery centres, for facilities receiving non-
friable asbestos from domestic sources & subsequent transfer to a licensed landfill for disposal, not
publicly available.
Blue Environment, Ascend Waste and Environment, and Randell Environmental Consulting (2015)
Hazardous Waste Infrastructure Needs and Capacity Assessment, prepared for the Department of the
Environment, not publicly available at the time of writing
Code of Practice for the Safe Removal of Asbestos 2nd Edition [NOHSC:2002(2005)]
Commonwealth of Australia (2005) National Occupational Health and safety commission
EHP (Department of Environment and Heritage Protection 2013) Guideline—Landfill Siting, Design,
Operation and Rehabilitation, available at: http://www.ehp.qld.gov.au/era/prescribed/gl-bi-landfill-
siting-design-operation-rehabilition-em2319.pdf
EHP (Department of Environment and Heritage Protection) Waste Tracking Guideline: Completing
Waste Transport Certificates, available at: https://www.ehp.qld.gov.au/waste/pdf/completing-
wtc.pdf
EPA South Australia (2010) Waste Transport Certificate, available at:
http://www.epa.sa.gov.au/xstd_files/Waste/Guideline/guide_wastetransport.pdf
Asbestos Safety and Eradication Agency | 49
EPA South Australia (2014) Wastes Containing Asbestos – Removal, Transport and Disposal, available
at: http://www.epa.sa.gov.au/xstd_files/Waste/Guideline/guide_asbestos.pdf
EPA Victoria (2009) Asbestos Transport and Disposal, available at: http://www.epa.vic.gov.au/our-
work/publications/publication/2009/july/iwrg611-1
NSW EPA (2015) Draft Environmental Guidelines Solid Waste Landfills, Second Edition, 2015, available
at: http://www.epa.nsw.gov.au/resources/waste/150111env-guide-solid-waste-landfills.pdf
NT EPA (2015) Asbestos Disposal in the Northern Territory: Information on the Requirements for the
Disposal of Asbestos in the Northern Territory, available at:
http://www.ntepa.nt.gov.au/__data/assets/pdf_file/0006/136473/asbestos_disposal_in_the_northe
rn_territory.pdf
WA DER (Department of Environment and Regulation 2012) Guidelines for Managing Asbestos at
Construction and Demolition Waste Recycling Facilities, available at:
http://www.wasteauthority.wa.gov.au/media/files/documents/Guidelines_Asbestos_in_C+D_recycli
ng.pdf
WA DER (Department of Environment and Regulation 2014) Exemptions from the Landfill Levy for
Asbestos Containing Material available from: http://www.der.wa.gov.au/images/documents/your-
environment/waste/landfill-levy/fs-exemptions-from-the-landfill-levy-for-asbestos-containing-
material.pdf
WA DER (Department of Environment and Regulation 2015) Disposal of Material Containing
Asbestos, available at: http://www.der.wa.gov.au/images/documents/your-
environment/contaminated-sites/controlled-waste-info-sheet_asbestos.pdf