Embed Size (px)
Citation preview

1
Ascertaining the Credibility of Assessment Instruments through the Application of Item
Response Theory:
Perspective on the 2014 UTME Physics test
Sub Theme: Improving Test Development Procedures to Improve Validity
‘Dibu Ojerinde, ‘Kunmi Popoola, Francis Ojo and Chidinma Ifewulu
Email: [email protected], [email protected], [email protected],
Joint Admissions and Matriculation Board (JAMB) Abuja, Nigeria.
ABSTRACT
Item Response Theory (IRT) is a paradigm for the design, analysis, scoring of test items, and
similar instruments for measuring abilities, attitudes, or other variables. It is based on a set of
fairly strong assumptions which if not met, could compromise the validity and reliability of the
test. The purpose of this study is to show how the application of IRT in test development processes
has assisted the Joint Admissions and Matriculation Board (JAMB) in generating and quality
items for assessment, selection and placement suitably qualified candidates for admissions into
tertiary institutions in Nigeria. The application of the theory has greatly helped in maintaining the
validity and credibility of the Unified Tertiary Matriculation Examination (UTME). The study
employed an expo facto and descriptive research design method using random sample of
candidates’ responses from the 2015 UTME Physics test. Analysis was carried out using 1-
parameter IRT model of ACER conquest 3.0. Findings revealed that the statistics and graphs
generated assisted the Board in making the right choice in selecting good items for test
administration. The paper thus recommends the application of IRT in test item calibrations and
other test development processes especially in high stakes assessments organizations.
Key words: Parameter, Validity, IRT, UTME
Introduction
Measuring students learning out comes in testing is one of the fundamental issues in education
this is so because the result obtained from these tests are used by the educators to assess students
on how much they have learned and how the information is used to provide feedback for
improvement and remediation. The most important objective of measurement is to design test

2
instruments with minimum errors so as to obtain valid and reliable assessment. In recent times the
test development procedures in the Joint Admissions and Matriculation Board (JAMB) has been
changing rapidly, massive developments has been made to address important issues which
enhanced the Boards test development processes. In testing there are two popular frame works
that have been used widely the Classical Test Theory ( CTT) and the Item Response Theory (IRT)
as opined by (Hambliton and Jones ,1993), these frameworks has aid the measurement experts in
test construction of valid items for decades.CTT focused on items as a whole while IRT as the
name implies mainly focused on the item and persons level information its measurement approach
relates to the probability of particular response on an item to overall examinee ability therefore,
in IRT ability parameter estimated are not test dependent and item statistics estimated are not group
dependent it is said to have three basic assumption which are Unidimensionality ,local
independent, and ICC, The assumptions of Unidimensionality which assumes that item of test
measures only one ability and can only be assumed or consider when there is just one dominant
ability (Hambletonetal 1991).The assumptions of Local item independence assume that examinees
responses to the items in a test are statistically independent if the examinees ability level is taken
into account. An ICC assumption is a mathematical function that relates the probability of success
on an item to the ability measures by the item set, IRT puts forward three different models as 123
parameter models. the parameter of item difficulty (b) shows an individual‘s level of ability. The
discriminating parameter (a) and the guessing parameter(c)
The choice of Item Response Theory by the Board is based on the important assumptions of the
theory therefore urged the test developers to comply with its theoretical assumptions. A number
of measures and innovations aimed at ascertaining the credibility of the UTME have been
introduced since 2007. Some of these include: applying best practices in item construction,
application of taxonomy of educational objectives as well as the training of staff on applications
of IRT. The landmark in the recent innovative ideas is the employment of trial-testing as a
validation procedure in the test development processes of JAMB from 2010. This was a complete
deviation from the old practice where the discrimination and the difficulty index of the item are
determined by face validity. The Boards Trial-testing involves giving a test, under specified
conditions to groups of candidates similar to those who are to use the final test. This procedure as
it is applied currently in JAMB provides empirical data which are the needed evidence from which
inferences can be drawn about current status in the learning sequence and prediction of
performance. In making empirical judgment on the item performance, modern tools are currently
available as estimation software for analysis. This provides data for making comparisons on the
item and group performance prior to the actual use. This paper is aimed at demonstrating how the
application of IRT in test development processes has assisted the Joint Admissions and
Matriculation Board (JAMB) in generating and selection of credible items for assessment. The
UTME is a selection tests made for the purpose of selecting suitably qualified candidates into all
tertiary institutions in Nigeria. It offers a uniform test-taking experience to all candidates that
applied for the test. The items are set up in such a way that the test conditions and scoring have a
specific procedure that is interpreted in a consistent manner. In JAMB the items are created by test

3
development specialists who ensure that the tests have a specific goal, specific intent and solid
written foundation.
Steps taken to ascertain the credibility of the UTME test instrument in CTT and IRT eras
in JAMB
Test development process in ( CTT) era Test development process in (IRT) era
Preparation of table of specification in conjunction
with the subject syllabus and content weighting
Preparation of table of specification using the taxono
my of educational objectives in conformity with
subject syllabus and content weighting
Item writing by subject experts Item writing by subject experts
Test editing Test editing
Management reading Management reading
Selection of test items by face validity
Camera ready of test items Trial testing of the test instruments
Printing of the test items from the factory Scanning of examinees responses
Collection of scanned data
Cleaning of the data and calibration of the trial tested
items
Selection of test items and building of the parallel test
forms
Test delivery through paper and pencil Test delivery through Computer Based Test (CBT)
Source JAMB 2014
Review of related Literature
In a related study by Ojerinde, Onoja and Ifewulu (2013), candidates’ performances in the Pre and
Post IRT Eras in JAMB on the Use of English language for the 2012 and 2013 UTME was
compared. The purpose was to examine the empirical relationship between CTT and IRT eras in
JAMB to ascertain impact of both theories on performances of repeaters and on JAMB assessment
practices in the 2012 and 2013 UTME Use of English (UOE) Language paper. The application of

4
IRT which is a modern test theory was seen as the most significant and popular development in
psychometrics to overcome the shortcomings of the traditional test theory (CTT), which
maximizes objectivity in measurement according to Hambleton and Jones (1993). IRT was
preferred because it derives its meaning from the focus of the theory on items whereas the CTT
analysis is on the test (not the items). Findings in the report revealed that prior to the introduction
of IRT in JAMB; the process of test development was in line with the traditional method of
ascertaining reliability of test items by considering the item difficulty and the discrimination index
of the test items. This approach as useful as it appears only focused on the test as a whole without
any consideration given to the individual items and the test takers. It was therefore inferred that
the introduction of Computer Based Test (CBT) by the Board made the application of IRT in the
Board’s test development expedient. The application of IRT enabled the assembling of equivalent
test forms in JAMB thereby ensuring test security. Results of the study finally revealed a
significant improvement on the performances of candidates who repeated the examination in the
IRT era (2013) over those of the CTT era (2012) in the UTMEUOE
In a related study by Geoffrey and Favia (2012) where two approaches to psychometrics the CTT
and the IRT were compared using WINSTEPS item response theory model software. The paper
observed that IRT provides figures with useful features such as, the ICCs model curves, the
empirical curve, and the limit of 95 percent confidence interval furthermore it opined that all ICCs
from a test can be generated in a single figure and this statistics can help the test developer in
selecting quality items.
Statement of problem
An effort towards improving the quality of UTME has encouraged JAMB to introduce various
measures aimed at addressing measurement problems that it encounters periodically. However,
the choice for application of the IRT model has been shown to be a huge task. This is so because
for quality to be assured, the right model must be applied to ensure the reporting of true ability
scores with minimum measurement errors. The paradigm shift from the traditional way of item
development to a new one based on modern test theory principles has brought about a number of
interpretations in some quarters. The validity of a measure or its contributions to quality assurance
of a test needs to be evaluated in light of the purpose of measurement and the way in which the
measures are used and interpreted (Linn, 1989). Items for standardized tests such as the UTME
are not selected solely on the basis of item statistics; rather the item parameters are also used along
with other test information functions in deciding the quality of items to select and include in the
instrument. It is within this context that the use of item response theory (IRT) in test production
processes of JAMB has contributed to quality assurance of the UTME.
Purpose of the study
5
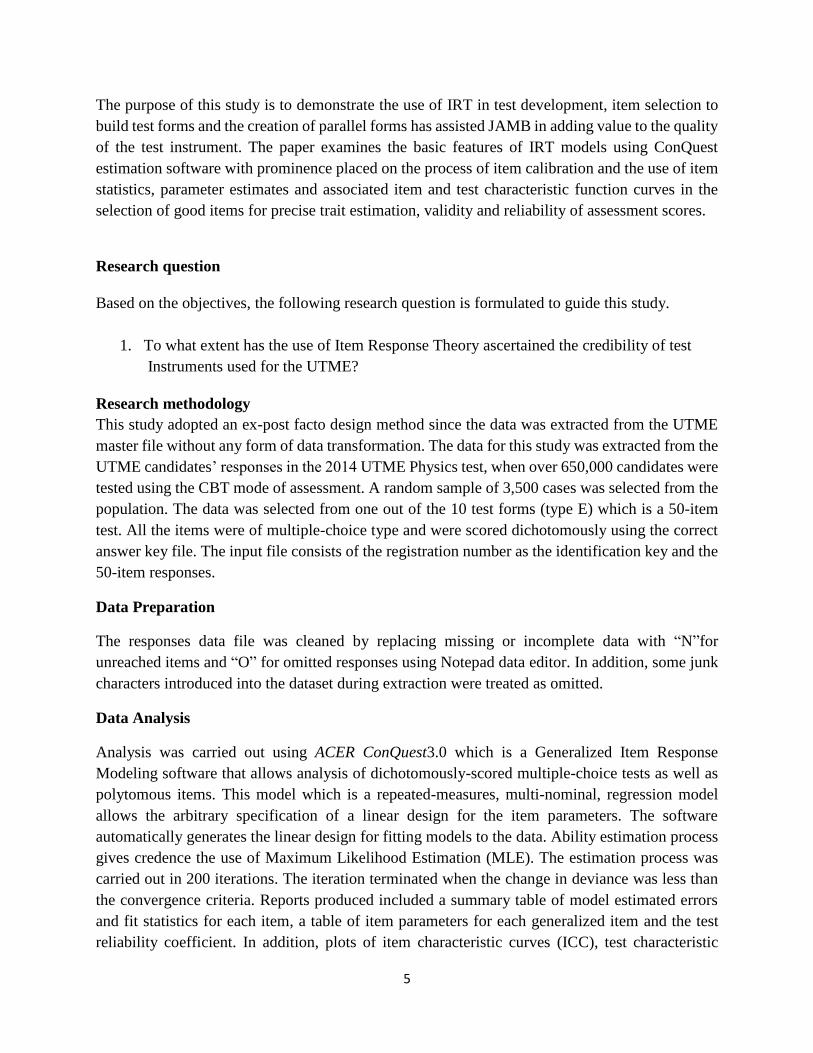
The purpose of this study is to demonstrate the use of IRT in test development, item selection to
build test forms and the creation of parallel forms has assisted JAMB in adding value to the quality
of the test instrument. The paper examines the basic features of IRT models using ConQuest
estimation software with prominence placed on the process of item calibration and the use of item
statistics, parameter estimates and associated item and test characteristic function curves in the
selection of good items for precise trait estimation, validity and reliability of assessment scores.
Research question
Based on the objectives, the following research question is formulated to guide this study.
1. To what extent has the use of Item Response Theory ascertained the credibility of test
Instruments used for the UTME?
Research methodology
This study adopted an ex-post facto design method since the data was extracted from the UTME
master file without any form of data transformation. The data for this study was extracted from the
UTME candidates’ responses in the 2014 UTME Physics test, when over 650,000 candidates were
tested using the CBT mode of assessment. A random sample of 3,500 cases was selected from the
population. The data was selected from one out of the 10 test forms (type E) which is a 50-item
test. All the items were of multiple-choice type and were scored dichotomously using the correct
answer key file. The input file consists of the registration number as the identification key and the
50-item responses.
Data Preparation
The responses data file was cleaned by replacing missing or incomplete data with “N”for
unreached items and “O” for omitted responses using Notepad data editor. In addition, some junk
characters introduced into the dataset during extraction were treated as omitted.
Data Analysis
Analysis was carried out using ACER ConQuest3.0 which is a Generalized Item Response
Modeling software that allows analysis of dichotomously-scored multiple-choice tests as well as
polytomous items. This model which is a repeated-measures, multi-nominal, regression model
allows the arbitrary specification of a linear design for the item parameters. The software
automatically generates the linear design for fitting models to the data. Ability estimation process
gives credence the use of Maximum Likelihood Estimation (MLE). The estimation process was
carried out in 200 iterations. The iteration terminated when the change in deviance was less than
the convergence criteria. Reports produced included a summary table of model estimated errors
and fit statistics for each item, a table of item parameters for each generalized item and the test
reliability coefficient. In addition, plots of item characteristic curves (ICC), test characteristic
6
curve (TCC), item information functions (IIF), overlay plots of ICCs, etc., were produced which
provided more information about the behavior of the items.
Results
In proffering answers to the research question posed, three major areas where IRT has recorded a
number of achievements will be discussed. The areas include calibration, selection of functional
items and use of parameter estimates in creating parallel test forms.
Calibration Results
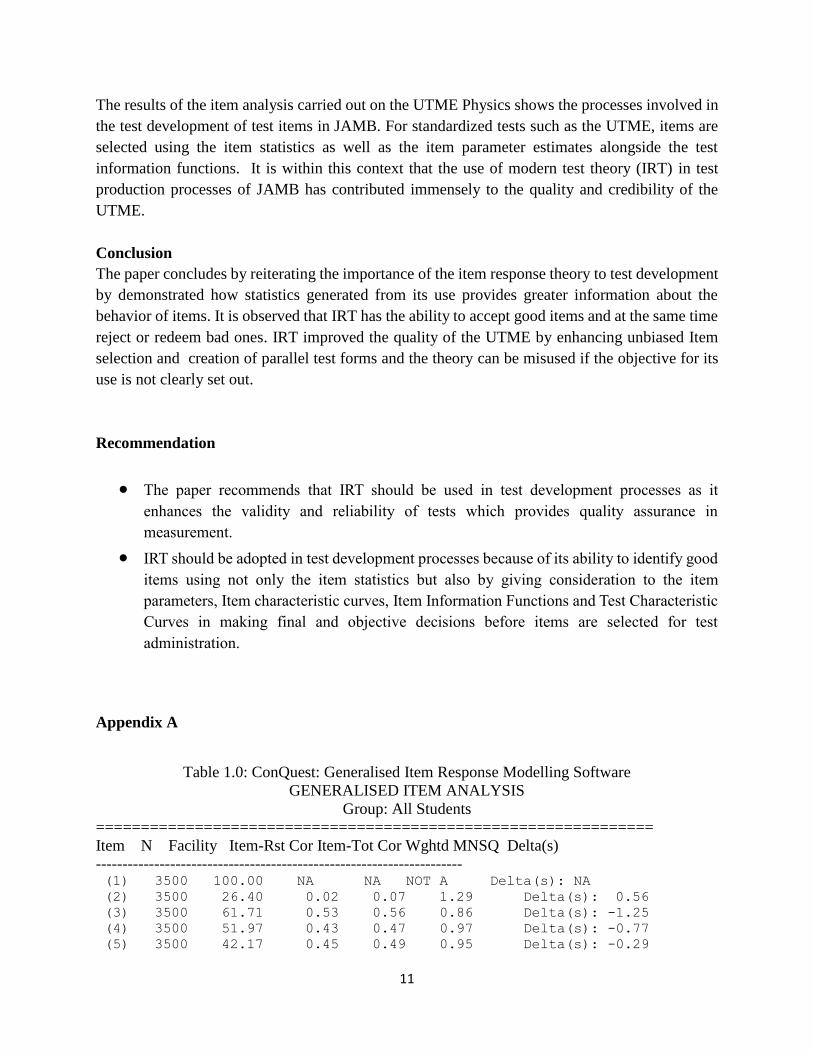
Table 1.0 in Appendix A shows the calibration report of the items. From the results, it can be
deduced that items 25, 47 and 36 had low item facility values of 16.43, 14.54 and 15.37
respectively which is below the bench mark of 30%. In the same way, two of these items also had
negative Point-Biserial correlations (Item-Rest Correlations) of -0.05, and -0.05 respectively for
items 19 and 25. Similarly, a few others such as items2, 36 and 47 had low item facility values of
and 0.02, 0.18 and 0.0418.40 as well as positive but low Point-biserial correlations of 0.02, 0.18,
0.04 respectively. Such items should be reconstructed and retrial-tested.
Table 2.0 as depicted in Appendix B shows the summary statistics of all calibrated items. The
classical statistics generated showed a mean score of 19.26 and a standard deviation of 9.73 from
the 50-item test. The standard error of mean was 3.01 and a reliability coefficient of 0.90. This is
an indication that the UTME Physics test had good internal consistency. Also, Table 3.0 in
Appendix C shows a cross section of the item parameter estimates error of measurement as well
as the weighted fit indices after calibrations which are used in determining the quality of the items.
Fig. 1, 2 show examples of items considered as “Good Items” and which have been demonstrated
using their item characteristic curves. On the other hand, figures 3 and 4 is used in exhibiting “Bad
Items” .From the look of the curves depicted by figures 3 and 4, a test developer can easily detect
deviant items since the curves do not have the normal “S” shape like the other two good items
illustrated using Fig. 1 and 2. To further confirm these deviant items, a look at the overlay item
information curve of the 2014 UTME Physics in Fig. 5 also substantiates this further. Apart from
items 2, 19, 23, 25, 36 and 47, all other items were good and acceptable. The overall reliability
coefficient from the calibration is .90. This shows that most of the items were valid.

7
Fig 1: ICC of Item 5 Fig 2: ICC of Item 30
Fig. 3: ICC of Item 19 Fig. 4: ICC of Item 47

8
Fig. 5: Overlay of Item Information Functions of the 2014 Test in Physics
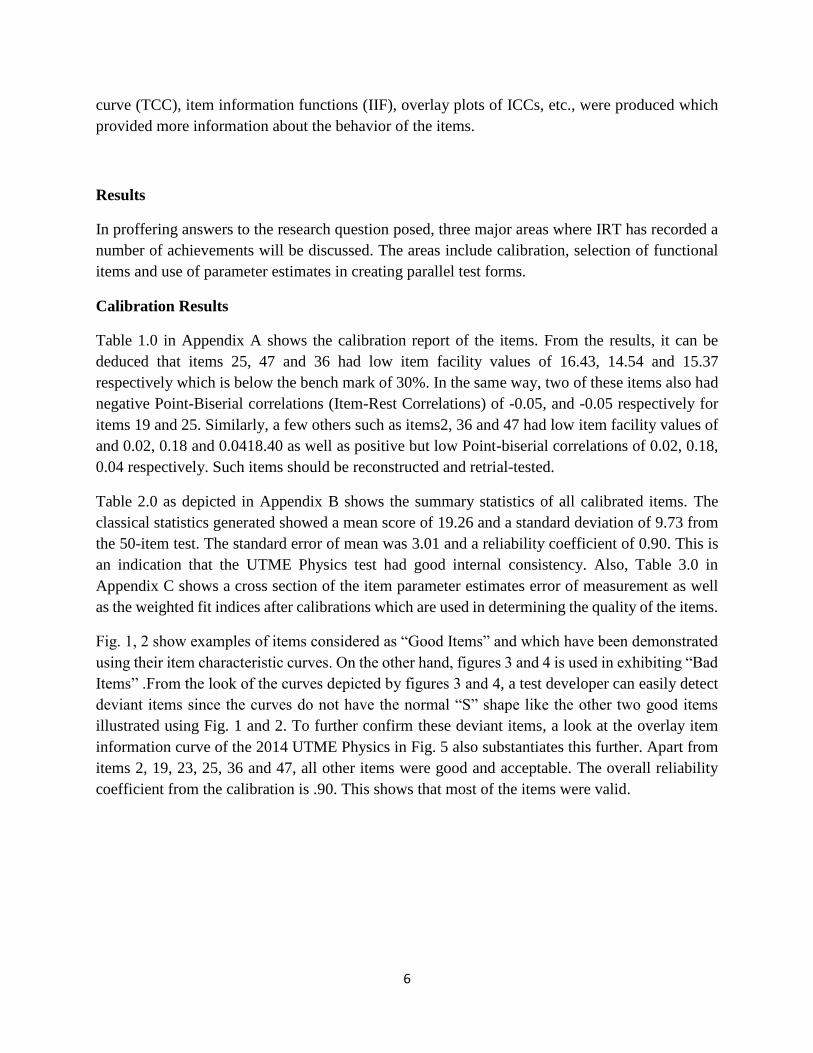
Item Selection to Build Test Forms
Since the UTME is a standardized achievement test used purposefully for the selection of
candidates for admissions into tertiary institutions in Nigeria, items for the test are not solely
selected on the basis of item statistics, but also taking into consideration the item parameters along
with other item and test information such as the Item Information Function (IIF) and the Test
Information Function (TIF). Lord (1977) opined that IRT is applied in the selection of items for
achievement test by the following steps:
(a) Selection of a target information curve for the test
(b) Selection of items with information curves that will fill the hard-to-fill areas under the
target information curves
This approach is also adopted by JAMB in item selection.
9
Fig. 6: Item Information Function of Item 45
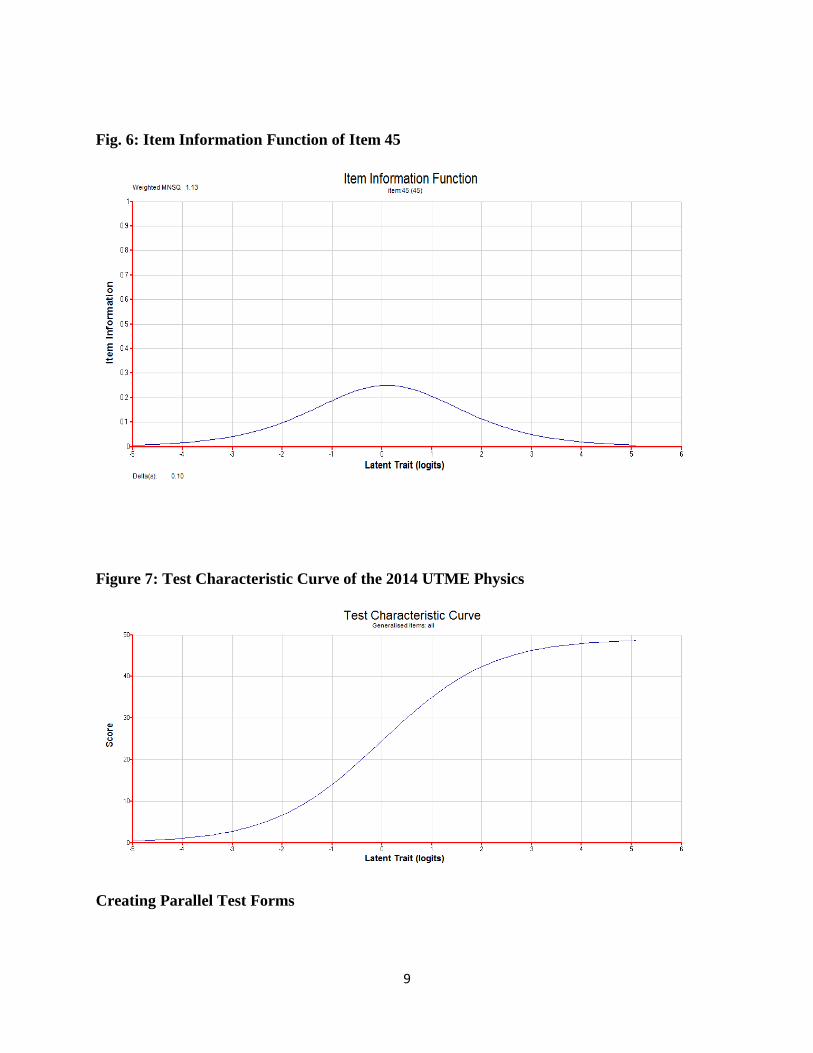
Figure 7: Test Characteristic Curve of the 2014 UTME Physics
Creating Parallel Test Forms

10
JAMB conducts CBT examinations to over 1.5 million candidates annually. In order to forestall
item exposure, the examination is conducted on different dates and time within 10 days. This
necessitated the creation of parallel test forms on 23 different subjects. In educational
measurement, the construction of parallel test forms is often a combinatorial optimization problem
that involves the time-consuming selection of items to construct tests having approximately the
same test information functions (TIFs) and constraints (Sun, Chen, Tsai & Cheng, 2008). The
Psychometrics’ Department of JAMB in 2014 developed an algorithm that can be optimized and
capable of creating as many test forms as the number of candidates. It is similar to the Genetic
Algorithm Method which commonly involves the construction of parallel test forms in which the
test information function (TIF) varies as little as possible between forms (Sun et al, 2008). The test
information function is shown in Fig 8 and can also be computed by calculating the sum of the
item information functions Ii(Ɵ) for the items included on the test (Frank, and Seock 2004) such
that:
I(Ɵ)= ∑ 𝐼𝑖(𝜃)𝑚𝑖=1 , ……………………………(1)
Where, m is the number of items in the test and Ɵ is the ability level. For constructing parallel
tests, one test is dedicated the target test (see Table 1) and another test is designed to approximate
the test information function of the target test.
Fig. 8: Test Information Curve of UTME Physics
Discussion of Results
11
The results of the item analysis carried out on the UTME Physics shows the processes involved in
the test development of test items in JAMB. For standardized tests such as the UTME, items are
selected using the item statistics as well as the item parameter estimates alongside the test
information functions. It is within this context that the use of modern test theory (IRT) in test
production processes of JAMB has contributed immensely to the quality and credibility of the
UTME.
Conclusion
The paper concludes by reiterating the importance of the item response theory to test development
by demonstrated how statistics generated from its use provides greater information about the
behavior of items. It is observed that IRT has the ability to accept good items and at the same time
reject or redeem bad ones. IRT improved the quality of the UTME by enhancing unbiased Item
selection and creation of parallel test forms and the theory can be misused if the objective for its
use is not clearly set out.
Recommendation
The paper recommends that IRT should be used in test development processes as it
enhances the validity and reliability of tests which provides quality assurance in
measurement.
IRT should be adopted in test development processes because of its ability to identify good
items using not only the item statistics but also by giving consideration to the item
parameters, Item characteristic curves, Item Information Functions and Test Characteristic
Curves in making final and objective decisions before items are selected for test
administration.
Appendix A
Table 1.0: ConQuest: Generalised Item Response Modelling Software
GENERALISED ITEM ANALYSIS
Group: All Students
==============================================================
Item N Facility Item-Rst Cor Item-Tot Cor Wghtd MNSQ Delta(s)
--------------------------------------------------------------------- (1) 3500 100.00 NA NA NOT A Delta(s): NA
(2) 3500 26.40 0.02 0.07 1.29 Delta(s): 0.56
(3) 3500 61.71 0.53 0.56 0.86 Delta(s): -1.25
(4) 3500 51.97 0.43 0.47 0.97 Delta(s): -0.77
(5) 3500 42.17 0.45 0.49 0.95 Delta(s): -0.29

12
(6) 3500 42.37 0.55 0.59 0.86 Delta(s): -0.30
(7) 3500 31.03 0.43 0.46 0.97 Delta(s): 0.30
(8) 3500 43.26 0.54 0.57 0.87 Delta(s): -0.34
(9) 3500 47.37 0.47 0.51 0.93 Delta(s): -0.54
(10) 3500 55.57 0.56 0.59 0.85 Delta(s): -0.94
(11) 3500 49.83 0.50 0.53 0.91 Delta(s): -0.66
(12) 3500 52.60 0.49 0.53 0.90 Delta(s): -0.80
(13) 3500 44.63 0.16 0.21 1.22 Delta(s): -0.41
(14) 3500 55.06 0.58 0.61 0.83 Delta(s): -0.91
(15) 3500 36.86 0.56 0.60 0.84 Delta(s): -0.02
(16) 3500 53.11 0.49 0.53 0.90 Delta(s): -0.82
(17) 3500 30.66 0.47 0.51 0.91 Delta(s): 0.32
(18) 3500 65.17 0.43 0.47 0.92 Delta(s): -1.42
(19) 3500 20.49 -0.05 -0.01 1.35 Delta(s): 0.96
(20) 3500 32.29 0.34 0.38 1.05 Delta(s): 0.23
(21) 3500 30.57 0.32 0.36 1.06 Delta(s): 0.32
(22) 3500 34.29 0.34 0.38 1.04 Delta(s): 0.12
(23) 3500 18.66 0.13 0.17 1.19 Delta(s): 1.09
(24) 3500 33.66 0.26 0.31 1.11 Delta(s): 0.15
(25) 3500 16.43 -0.05 -0.01 1.29 Delta(s): 1.27
(26) 3500 40.46 0.51 0.55 0.90 Delta(s): -0.20
(27) 3500 39.57 0.62 0.65 0.80 Delta(s): -0.16
(28) 3500 29.94 0.39 0.43 0.98 Delta(s): 0.35
(29) 3500 27.69 0.48 0.52 0.90 Delta(s): 0.49
(30) 3500 41.51 0.57 0.61 0.85 Delta(s): -0.26
(31) 3500 28.00 0.28 0.33 1.07 Delta(s): 0.47
(32) 3500 24.17 0.36 0.39 0.99 Delta(s): 0.70
(33) 3500 26.63 0.37 0.41 0.99 Delta(s): 0.55
(34) 3500 51.86 0.38 0.42 1.00 Delta(s): -0.76
(35) 3500 27.23 0.35 0.39 1.01 Delta(s): 0.51
(36) 3500 15.37 0.18 0.22 1.10 Delta(s): 1.35
(37) 3500 36.11 0.49 0.53 0.91 Delta(s): 0.02
(38) 3500 29.14 0.31 0.36 1.03 Delta(s): 0.40
(39) 3500 50.11 0.57 0.60 0.84 Delta(s): -0.68
(40) 3500 38.34 0.40 0.44 1.00 Delta(s): -0.10
(41) 3500 30.49 0.41 0.45 0.97 Delta(s): 0.32
(42) 3500 41.31 0.52 0.56 0.89 Delta(s): -0.25
(43) 3500 35.51 0.38 0.42 1.00 Delta(s): 0.05
(44) 3500 40.91 0.51 0.55 0.89 Delta(s): -0.23
(45) 3500 33.83 0.24 0.29 1.12 Delta(s): 0.14
(46) 3500 37.43 0.50 0.54 0.90 Delta(s): -0.05
(47) 3500 14.54 0.04 0.08 1.21 Delta(s): 1.43
(48) 3500 39.31 0.44 0.48 0.96 Delta(s): -0.15
(49) 3500 24.69 0.10 0.15 1.22 Delta(s): 0.67
(50) 3500 45.57 0.08 0.13 1.30 Delta(s): -0.46
----------------------------------------------------------------------
Appendix B
Table 2.0: Summary Statistics for all calibrated Items

13
The following traditional statistics are only meaningful for complete designs and when the amount
of missing data is minimal. In this analysis 0.00% of the data are missing.
The following results are scaled to assume that a single responsewas provided for each item.
N 3500
Mean 19.26
Standard Deviation 9.73
Variance 94.68
Skewness 0.55
Kurtosis -0.55
Standard error of mean 0.16
Standard error of measurement 3.01
Coefficient Alpha 0.90
=================================================================
Appendix C
Table C: ConQuest: Generalised Item Response Modelling Software
SUMMARY OF THE ESTIMATION
VARIABLES WEIGHTED FIT WEIGHTED FIT
--------------- ----------------------- -----------------------
item ESTIMATE ERROR^ MNSQ CI T MNSQ CI T
------------------------------------------------------------------------
2 0.565 0.041 1.61 ( 0.95, 1.05) 21.7 1.31 ( 0.96, 1.04) 13.4
3 -1.246 0.038 0.79 ( 0.95, 1.05) -9.7 0.86 ( 0.97, 1.03)-10.3
4 -0.766 0.037 0.95 ( 0.95, 1.05) -2.1 0.96 ( 0.97, 1.03) -2.7
5 -0.288 0.037 0.93 ( 0.95, 1.05) -3.0 0.95 ( 0.97, 1.03) -3.3
6 -0.298 0.037 0.83 ( 0.95, 1.05) -7.7 0.85 ( 0.97, 1.03)-10.6
7 0.296 0.040 0.94 ( 0.95, 1.05) -2.4 0.97 ( 0.96, 1.04) -1.9
8 -0.341 0.037 0.85 ( 0.95, 1.05) -6.7 0.87 ( 0.97, 1.03) -9.2
9 -0.542 0.037 0.92 ( 0.95, 1.05) -3.4 0.93 ( 0.97, 1.03) -5.1
10 -0.940 0.037 0.79 ( 0.95, 1.05) -9.6 0.84 ( 0.97, 1.03)-12.8
11 -0.661 0.037 0.87 ( 0.95, 1.05) -5.7 0.91 ( 0.97, 1.03) -7.3
12 -0.795 0.037 0.89 ( 0.95, 1.05) -4.7 0.90 ( 0.97, 1.03) -8.1
13 -0.408 0.037 1.32 ( 0.95, 1.05) 12.0 1.22 ( 0.97, 1.03) 14.6
14 -0.914 0.037 0.77 ( 0.95, 1.05)-10.5 0.83 ( 0.97, 1.03)-13.9
15 -0.017 0.038 0.80 ( 0.95, 1.05) -9.1 0.85 ( 0.97, 1.03)-10.0
16 -0.820 0.037 0.88 ( 0.95, 1.05) -5.0 0.90 ( 0.97, 1.03) -7.9
17 0.318 0.040 0.90 ( 0.95, 1.05) -4.2 0.92 ( 0.96, 1.04) -4.6
18 -1.421 0.038 0.93 ( 0.95, 1.05) -3.2 0.92 ( 0.97, 1.03) -5.3
19 0.959 0.045 1.67 ( 0.95, 1.05) 23.5 1.36 ( 0.95, 1.05) 12.9
20 0.227 0.039 1.03 ( 0.95, 1.05) 1.4 1.05 ( 0.96, 1.04) 2.7
21 0.322 0.040 1.09 ( 0.95, 1.05) 3.7 1.06 ( 0.96, 1.04) 3.4
22 0.118 0.039 1.07 ( 0.95, 1.05) 2.7 1.05 ( 0.97, 1.03) 2.8
23 1.092 0.046 1.35 ( 0.95, 1.05) 13.2 1.20 ( 0.95, 1.05) 6.8
24 0.151 0.039 1.14 ( 0.95, 1.05) 5.6 1.12 ( 0.97, 1.03) 6.7
25 1.269 0.048 2.07 ( 0.95, 1.05) 34.5 1.30 ( 0.94, 1.06) 9.2
26 -0.203 0.038 0.87 ( 0.95, 1.05) -5.5 0.89 ( 0.97, 1.03) -7.4

14
27 -0.159 0.038 0.75 ( 0.95, 1.05)-11.4 0.79 ( 0.97, 1.03)-14.6
28 0.355 0.040 1.01 ( 0.95, 1.05) 0.4 0.99 ( 0.96, 1.04) -0.6
29 0.486 0.041 0.92 ( 0.95, 1.05) -3.3 0.90 ( 0.96, 1.04) -5.2
30 0.258 0.037 0.81 ( 0.95, 1.05) -8.4 0.84 ( 0.97, 1.03)-11.6
31 0.466 0.041 1.15 ( 0.95, 1.05) 5.9 1.08 ( 0.96, 1.04) 3.9
32 0.702 0.042 1.04 ( 0.95, 1.05) 1.5 1.00 ( 0.96, 1.04) -0.1
33 0.548 0.041 1.05 ( 0.95, 1.05) 2.3 0.99 ( 0.96, 1.04) -0.4
34 -0.764 0.037 0.99 ( 0.95, 1.05) -0.2 1.00 ( 0.97, 1.03) 0.1
35 0.511 0.041 1.03 ( 0.95, 1.05) 1.3 1.02 ( 0.96, 1.04) 0.9
36 1.353 0.049 1.26 ( 0.95, 1.05) 10.1 1.11 ( 0.94, 1.06) 3.5
37 0.016 0.038 0.89 ( 0.95, 1.05) -4.7 0.91 ( 0.97, 1.03) -5.6
38 0.398 0.040 1.29 ( 0.95, 1.05) 11.3 1.04 ( 0.96, 1.04) 2.0
39 -0.680 0.037 0.78 ( 0.95, 1.05) -9.7 0.83 ( 0.97, 1.03)-13.1
40 -0.100 0.038 0.97 ( 0.95, 1.05) -1.3 1.00 ( 0.97, 1.03) -0.3
41 0.321 0.040 0.94 ( 0.95, 1.05) -2.5 0.98 ( 0.96, 1.04) -1.2
42 -0.250 0.037 0.85 ( 0.95, 1.05) -6.6 0.89 ( 0.97, 1.03) -8.1
43 0.047 0.038 1.03 ( 0.95, 1.05) 1.1 1.01 ( 0.97, 1.03) 0.7
44 -0.229 0.037 0.86 ( 0.95, 1.05) -6.0 0.89 ( 0.97, 1.03) -7.3
45 0.137 0.039 1.29 ( 0.95, 1.05) 11.1 1.13 ( 0.97, 1.03) 7.3
46 -0.052 0.038 0.88 ( 0.95, 1.05) -5.2 0.90 ( 0.97, 1.03) -6.6
47 1.430 0.050 1.90 ( 0.95, 1.05) 30.1 1.22 ( 0.94, 1.06) 6.3
48 -0.147 0.038 0.93 ( 0.95, 1.05) -2.9 0.96 ( 0.97, 1.03) -2.6
49 0.670 0.042 1.70 ( 0.95, 1.05) 24.3 1.22 ( 0.96, 1.04) 9.2
50 -0.457* 0.037 1.52 ( 0.95, 1.05) 18.7 1.31 ( 0.97, 1.03) 20.0
------------------------------------------------------------------------
An asterisk next to a parameter estimate indicates that it is constrained
Separation Reliability = 0.996
Chi-square test of parameter equality = 12009.15, df = 48, Sig Level =
0.000
^ Empirical standard errors have been used
========================================================================
References
Frank, B.B and Seock H.K (2004).Item Response Theory: Parameter Estimation Techniques
Second Edition Revised and expanded. A Publication of MarcelDekker, inc,270 Madison
avenue, NewYORK,NY,10016,USA. http/www.dekker.com.
Hambleton, R. K., Swaminatan H and Rojers H.J (1991).Fundamentals of Item Response Theory.
Newbury Park, CA: Sage Publication 1991.
Hambleton, R. K. and Jones, R.W.(1993).Comparison of Classical Test Theory and Item Response
Theory and their Applications to Test Development. An NCME Instructional Module 16,
Fall 1993. Retrieved on Saturday, 9th March, 2013 from
http://www.ncme.org/pubs/items/24.pdf
Jones, N (2014).Multilingual Frameworks: The Construction and Use of Multilingual
Proficiency Frameworks, Studies in Language Testing volume 40, Cambridge:
UCLES/Cambridge University Press.

15
Linn, R. L. (1985). Review of Comprehensive Tests of Basic Skills, Forms U and V. In J.V
Mitchell (Ed.). The ninth Mental Measurement Year Book. Lincoln, Nebraska: Buros
Mental Measurement Institute, pp. 382-386.
Lord, F.M. (1977). Practical Applications of Item Response Theory to Practical Testing Problems.
Hillsdale, NJ: Eribbbaum.
Ojerinde, D, Onoja, G. O and Ifewulu, B. C. (2014) A Comparative Analysis of Candidate’s
Performances in the Pre and Post IRT Eras in JAMB on the Use of English language for
the 2012 and 2013 UTME. A paper presented at the 39th IAEA Annual Conference in Tel
Aviv in Israel.
Thorpe, G. L and Favia, A.J (2012). Data Analysis Using Item Response Theory Methodology.
An Introduction to Selected Programs and Publications (2012) Psychology Faculty
scholarship faculty paper20 http://digitalcommons.libray.umaine.edu/psy_facpub/20.
Sun, K., Chen, Y., Tsai, C. and Cheng, C. (2008). Creating IRT-Based Parallel Test Forms Using
the Genetic Algorithm Method. Applied Measurement in Education, 21: 141–161,
2008.Institute of Computer Science and Information Education National University of
Taiwan.
Wright, B. D. (1969). Sample Free Test Calibration and Person Measurement. Proceedings of the
1967 ETS Invitational Conference on Testing Problems. Princeton, NJ: Educational
Testing Service.
Wu, M., Adams, R. J., Wilson, M. R., and Haldane, S. A. (2007). ACER ConQuest version 2.0.
Generalized Item Response Modeling Software. ISBN 9780864314543. Printed in
Australia by Solutions Digital Printing