Embed Size (px)
Citation preview
(7) Hu, A. S. L., Wolfe, R. G., Reithel, F. J., Arch. Biochern. Biophys . 81, 500 (1959).
(8) Linko, P., J. AGR. FOOD CHEM. 9, 310 (1961).
(9) iiational Dairy Products Corp., Glenview, Ill., private communica- tion, December 12, 1960.
(10) Pomeranz, Y., Miller, B. S., Miller, D., Johnson, J. A,, Cereal Chern. In press.
(11) Rickenberg, H. V., University of Indiana, Bloomington, private com- munication, November 28, 1960.
(12) Rohm & Haas Co., Philadelphia, Pa., private communication, January 16, 1961.
(13) Rotman, B., J . Bacteriol. 76, 1 (1958).
(14) Sandstedt, R . M., Blish, M. J., Cereal Chem. 11, 368 (1934).
(15) Sumner, J. B., Somers, G. F., “Chemistry and Methods of En- zymes,” 3rd ed., p. 111, Academic Press, New York, 1953.
(16) Tauber, H., Kleiner, I. S., J . Bid. Chern. 99, 249 (1932).
(17) Umbreit, Mi. W., Burris, R . H., Stauffer, J. F., “Manometric Tech- niques,” Burgess Publishing Co., Min- neapolis, Minn., 1957.
(18) Wallenfels, K., Malhotra, 0. P., in “Advances in Carbohydrate Chem- istry,” Vol. 16, p. 259, Academic Press, New York, 1961.
400
A
c $300
E E Y
W K 2 v) v) W U a
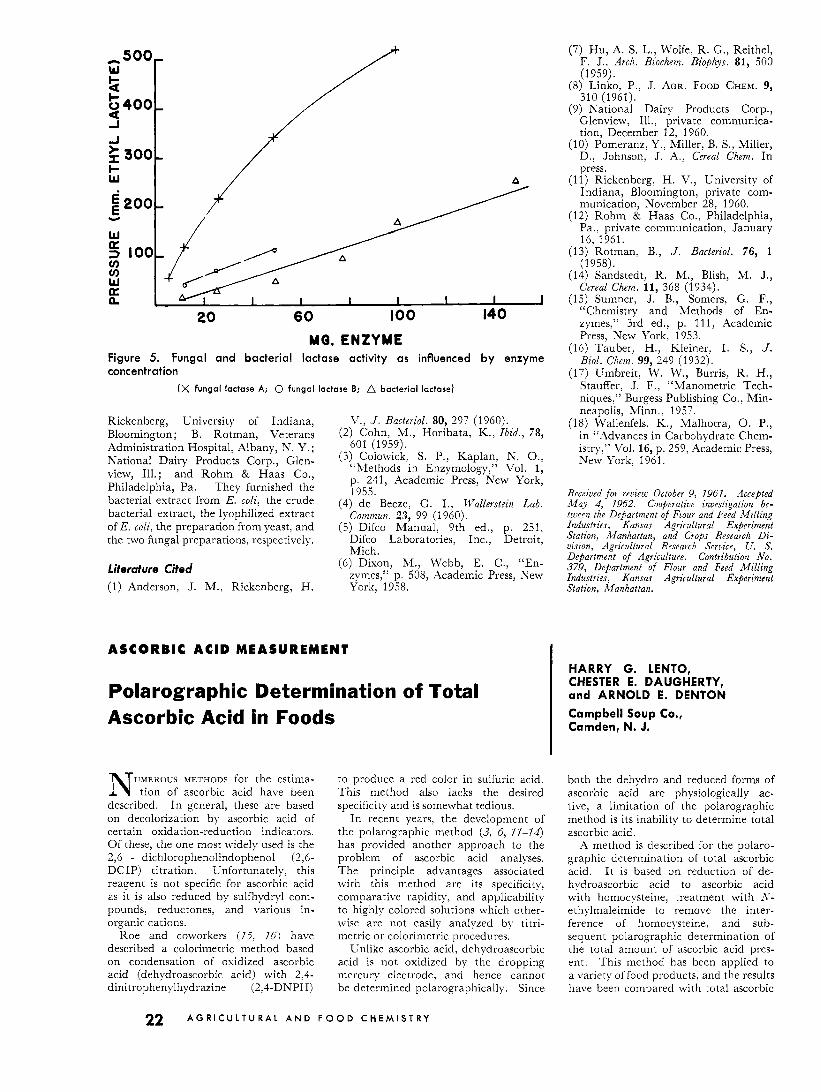
MQ. ENZYME Figure 5. Fungal and bacterial lactase activity as influenced by enzyme concentration
(X fungal lactase A; 0 fungal lactase B; A bacterial lactase)
Rickenberg, University of Indiana, Bloomington; B. Rotman, Veterans Administration Hospital, Albany, T. Y. ; National Dairy Products Corp., Glen- view, Ill.; and Rohm & Haas Co., Philadelphia, Pa. They furnished the bacterial extract from E. coli, the crude bacterial extract, the lyophilized extract of E. coli, the preparation from yeast, and the two fungal preparations, respectively.
Literature Cited (1) Anderson, J. M., Rickenberg, H.
V., J . Bacteriol . 80, 297 (1960). (2) Cohn, M., Horibata, K. , Ib id . , 78,
601 (1959). (3) Colowick, S. P., Kaplan, N. O.,
“Methods in Enzymology,” Vol. 1, p. 241, Academic Press, New York, 1955.
(4) de Becze, G. I., Wallers te in L a b . Cornmun. 23, 99 (1960).
( 5 ) Difco Manual, 9th ed., p. 251: Difco Laboratories, Inc., Detroit, Mich.
(6) Dixon, M., Webb, E. C., “En- zymes,” p. 508, Academic Press, New York, 1958.
ASCORBIC ACID MEASUREMENT
Polarographic Determination of Total Ascorbic Acid in Foods
UMEROUS METHODS for the estima- N tion of ascorbic acid have been described. In general, these are based on decolorization by ascorbic acid of certain oxidation-reduction indicators. Of these, the one most widely used is the 2,6 - dichlorophenolindophenol (2,6- DCIP) titration. Unfortunately, this reagent is not specific for ascorbic acid as it is also reduced by sulfhydryl com- pounds, reductones, and various in- organic cations.
Roe and coworkers (75, 76) have described a colorimetric method based on condensation of oxidized ascorbic acid (dehydroascorbic acid) with 2.4- dinitrophenylhydrazine (2,4-DNPH)
to produce a red color in sulfuric acid. This method also lacks the desired specificity and is somewhat tedious.
In recent years, the development of the polarographic method (3, 6, 71-74) has provided another approach to the problem of ascorbic acid analyses. The principle advantages associated with this method are its specificity, comparative rapidity, and applicability to highly colored solutions which other- wise are not easily analyzed by titri- metric or colorimetric procedures.
Unlike ascorbic acid, dehydroascorbic acid is not oxidized by the dropping mercury electrode. and hence cannot be determined polarographically. Since
Received for rmiere: October 9, 7967. Accepted M a y 4; 7962. Cooperative investigation be- tween the Department of Flour and Feed Mi l l ing Industries, Kansas Agricultural Experiment Station, Manhattan, and Crops Research Di- vision, Agricultural Reseaich Service, U. S. Department of Agriculture. Contribution No. 379, Department of Flour and 4eed M i l l i n g Industries, Kansas Agricultural Experiment Station, Manhattan.
HARRY G. LENTO, CHESTER E. DAUGHERTY, and ARNOLD E. DENTON
Campbell Soup Co., Camden, N. J.
both the dehydro and reduced forms of ascorbic acid are physiologically ac- tive, a limitation of the polarographic method is its inability to determine total ascorbic acid. -4 method is described for the polaro-
graphic determination of total ascorbic acid. It is based on reduction of de- hydroascorbic acid to ascorbic acid with homocysteine. treatment with A’- ethylmaleimide to remove the inter- ference of homocysteine, and sub- sequent polarographic determination of the total amount of ascorbic acid pres- ent. This method has been applied to a variety of food products. and the results have been compared with total ascorbic
22 A G R I C U L T U R A L A N D F O O D C H E M I S T R Y
~ ~ ~~~ ~~~ ~
A method is presented for the polarographic determination of both ascorbic acid and dehydroascorbic acid. Ascorbic acid is determined from the anodic wave produced between 0 and +0.2 volt in a phosphate buffer pH 6.8. Dehydroascorbic acid is determined by difference from the increase in wave height following reduction to ascorbic acid. Homocysteine, which is employed in the reduction step, interferes in the estimation of ascorbic acid. However, addition of N-ethylmaleimide following homocysteine reduc- tion suppresses the anodic wave of the homocysteine and permits the subsequent deter- mination of the ascorbic acid.
acid values obtained by the 2,6-DCIP and 2,4-DNPH methods. These find- ings indicate that the polarographic procedure offers a simple and rapid method for total ascorbic acid analysis.
Materials and Methods
Reagents. All chemicals were ana- lytical reagent grade, except when specifically indicated.
ascorbic acid (V.S.P. reference standard) in 100 ml. of 2 7 , aqueous solution of HPOs. The standard is prepared daily.
A 2 ’ - E ~ H ~ ~ ~ A L E ~ ~ r ~ ~ : - ( N u t r i t i o n a l Bio- chemical Corp.) I%! aqueous solution. After preparation this reagent is stable for 1 week.
PHOSPHATE B U F F I Z R - ~ ~ grams of K2HPO4 dissolved in 500 ml. of distilled water and adjusted to pH 6.8 by drop- wise addition of 85% H3P04.
Apparatus. A continuous recording Leeds and Sorthrup Electro-Chemo- graph (Type E) was used to obtain the current-voltage curvIx The capillary had m and t value:; of 4.82 mg. per second and 1.87 seconds. The elec- trolytic cell was a Lingane H-type with a saturated calomel reference electrode. A derivative attachment constructed according to the specifications described by Delahay ( , d ) was used in conjunction with the Electro-Chemograph for re- cording derivative polarograms.
Sample Preparation. FOR SOLID AND LIQUID PRODUCTS. Fifty grams of the sample to be analyzed are placed in a Waring Blendor and 50 ml. of 2% HPO, added. Xitrogen gas is bubbled through the mixture for 5 minutes to displace the air from the container and the sample material. The blendor should be covered while the: mixture is being homogenized to prevent oxidative losses of the ascorbic acid. Prior to analysis, the blend is clarified by vacuum filtra- tion through Whatman S o . 5 filter paper.
FOR CANNED PRODUCTS (containing solid material packed in a liquid-for example. canned vegetables, fruits). To a weighed amount of the sample is added enough solid HP03 to give ap- proximately a 2%, solution on blending. The mixture is then deaerated and blended as previously (described.
Analytical Method!$. POLAROGRAPHIC METHOD FOR TOTAL. ASCORBIC ACID.
ASCORBIC ACID STANDARD-50.0 mg.
An aliquot (1 to 4 ml.) of the clarified extract is added to a test tube calibrated to 10 ml. The volume is adjusted to 5 ml. with phosphate buffer p H 6.8, and 1 ml. of freshly prepared 0.5% aqueous solution of homocysteine (free base form, Nutritional Biochemical Corp.) is added. After mixing, the solution is left standing at room temperature for 15 minutes to ensure complete reduc- tion of the dehydroascorbic acid. Then, 1 ml. of a lY0 solution of AV-ethyl- maleimide is added and the solution diluted to 10 ml. with additional buffer. A measured aliquot of this solution is carefully transferred to the Lingane H-type cell of the polarograph and nitrogen bubbled through the solu- tion for 5 minutes to displace any dis- solved air. The polarogram is recorded anodically between -0.2 v. and 4-0.2 v.
REDUCED ASCORBIC ACID. The pro- cedure for the determination of reduced ascorbic acid is the same as previously described with the exception that the 15-minute reduction period is omitted and the ,V-ethylmaleirnide added im- mediately after the homocysteine.
For routine analyses of the same prod- uct, the concentration of total or reduced ascorbic acid can be determined from a calibration curve. However, to avoid the necessity of preparing curves daily for each of the products analyzed in this study. the Method of Standard Addition (70) was used to determine the ascorbic acid content of the test solu- tion.
METHOD OF STANDARD ADDITION (9). Following the recording of the polaro- gram, 2 ml. of a standard solution of ascorbic acid (0.5 mg. per ml.) are added to the polarographic cell, and the solution is de-aerated with nitrogen for 2 minutes. The current-voltage curve for the solution is again recorded between -0.2 v. and f0.2 v. Based on the initial wave height obtained on the test solution and the increase in wave height following addition of the standard, the concentration of total ascorbic acid per milliliter of test solu- tion is calculated from the followinq equation:
--n CH mh - H(m +<)
x =
X = concentration of ascorbic acid per ml. of test solution
n = ml. of standard solution of ascor- bic acid added
C = concentration of ascorbic acid per ml. of standard solution
m = ml. of test solution in polaro- graphic cell
h = wave height (microamperes) of test solution
H = wave height of test solution plus standard ascorbic acid
2.6 - DICHLOROPHENOLI~DOPHE~OL METHOD. The procedure employed in these studies for the determination of total ascorbic acid was that described in .‘Methods of Vitamin Assay” ( 7 ) . Essentially, this consists of treating the test solution with hydrogen sulfide for 15 minutes, removing excess reagent with nitrogen, and titrating an aliquot of the sample with a standard solution of 2,6-DCIP. .4scorbic acid (reduced form) was determined by direct titra- tion of the HPOj-extract with 2,6-DCIP.
2,4 - DINITROPHENYLHYDRAZISE METHOD. The procedure employed in these analyses was an adaptation of the method of Roe et al . (75. 76) and is described in detail in ..Methods of \-itamin Assay” (2). Basically. de- hydroascorbic acid is determined by conversion to diketogulonic acid, follo\ced by coupling with 2,4-DNPH under carefully controlled conditions of time and temperature (37’ C. for 3 hours) and colorimetric estimation of the resulting osazone. Total ascorbic acid is de- termined by bromine oxidation of as- corbic acid and subsequent reaction of the dehydroascorbic acid with 2.4- DATPH. The difference between the amount of dehydroascorbic acid deter- mined before and after bromine oxida- tion is equal to the amount of ascorbic acid (reduced form) present.
Results and Discussion Hydrogen sulfide reduction of de-
hydroascorbic acid to ascorbic acid is frequently used in the determination of total ascorbic acid by 2.6-DCIP titra- tion. The flammability, toxicity, and difficulty in ensuring complete removal of excess reagent are disadvantages as- sociated with its use. Aside from this, the reagent does not specifically reduce dehydroascorbic acid so that other sub- stances formed in the reduction may be determined in the titration.
To circumvent the difficulties in-
VOL. 1 1 , NO. 1, J A N . - F E B . 1 9 6 3 23
I B I
A P P L I E D V O L T A G E , ( V O L T S 1
I I l i
B
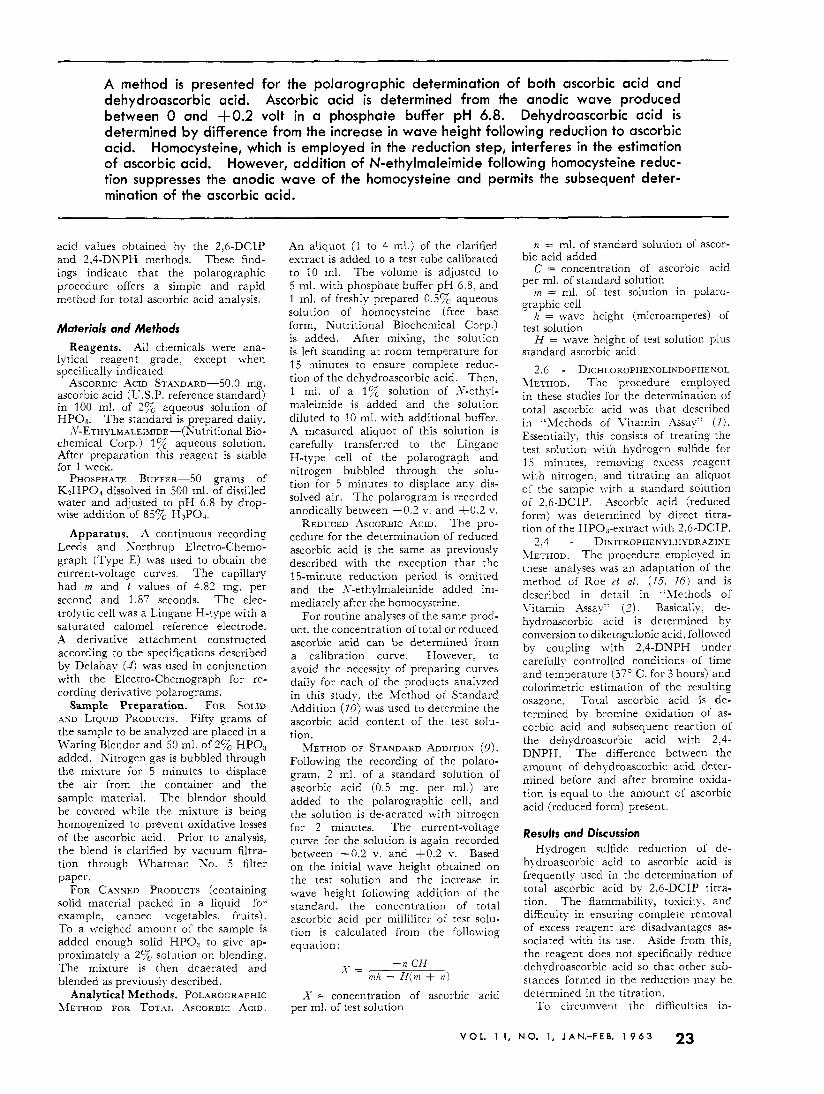
Figure 1. Polarographic wave of homocysteine ( A ) and its suppression by N-ethylmaleimide (6)
10 I I
a 0 2:Jl _ _ _ - ---- I J-- , I
7*0r-7 6 .O
C A N N E D C O R N ,
5.0 11
3.0 -
2.0 -
1.0 . -0.1 0.0 +0.1
A P P L I E D V O L T A G E , ( V O L T S )
z 3.0- K w a 1 a 0 K 0 z 2 . 0 -
1.0 0.0 + O . I -0.1
A P P L I E D V O L T A G E , ( V O L T S 1
Figure 2. N-ethylmaleimide (6)
Polarographic wave of ascorbic acid alone ( A ) and in the presence of
-0.1 0 +O.l
-0.1 0 to.1 -0.1 0 +O.I A P P L I E D V O L T A G E
( V O L T S )
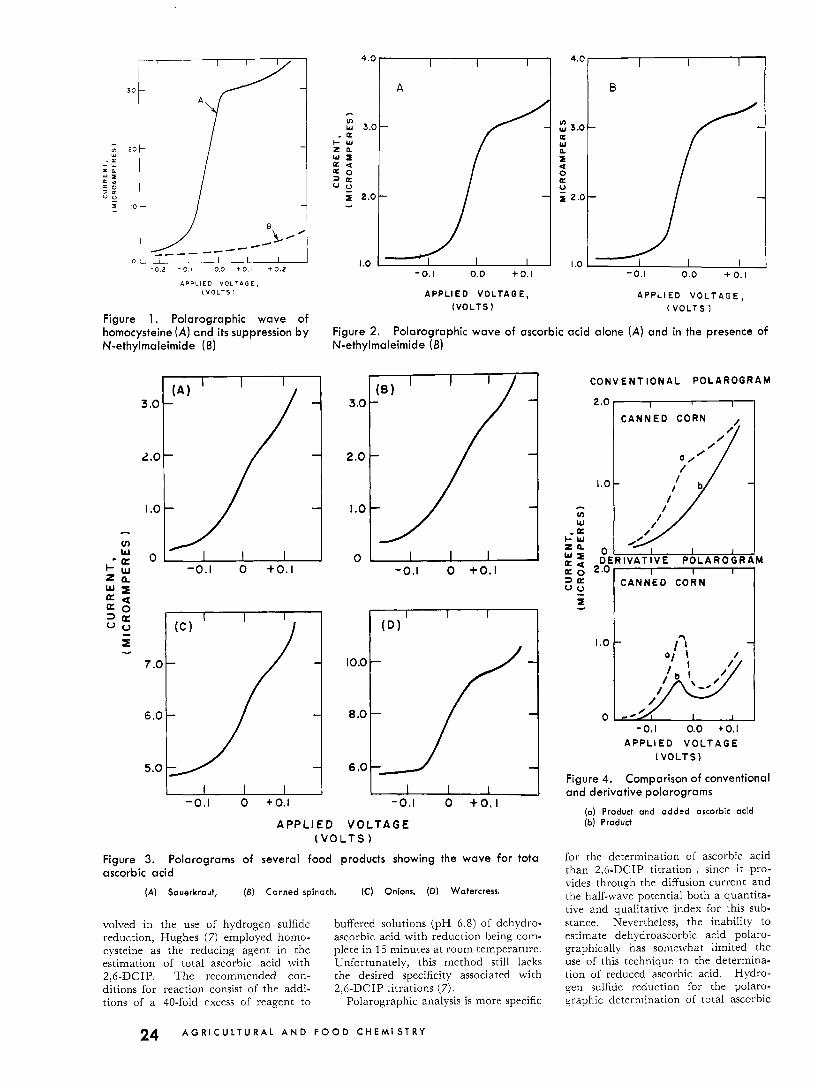
Figure 3. Polarograms of several food products showing the wave for tota ascorbic acid
(A) Sauerkraut, (6) Canned spinach. (C) Onions. (D) Watercress.
volved in the use of hydrogen sulfide buffered solutions (pH 6.8) of dehydro- reduction, Hughes (7) employed homo- ascorbic acid with reduction being com- cysteine as the reducing agent in the plete in 15 minutes at room temperature. estimation of total ascorbic acid with Unfortunately, this method still lacks 2,G-DCIP. The recommended con- the desired specificity associated with ditions for reaction consist of the addi- tions of a 40-fold excess of reagent to Polarographic analysis is more specific
2,6-DCIP titrations (7).
1.0 - - v) w
I - w z a .a
0 D E R I V A T I V E P O L A R O G R A M
a 0 2.0 3 a C A N N E D C O R N
-0.1 0.0 t0.1 A P P L I E D V O L T A G E
( V O L T S )
Figure 4. Comparison of conventional and derivative polarograms
(a) Product and added ascorbic acid ( b ) Product
for the determination of ascorbic acid than 2.6-DCIP titration , since it pro- vides through the diffusion current and the half-wave potential both a quantita- tive and qualitative index for this sub- stance. Nevertheless, the inability to estimate dehydroascorbic acid polaro- graphically has somewhat limited the use of this technique to the determina- tion of reduced ascorbic acid. Hydro- gen sulfide reduction for the polaro- graphic determination of total ascorbic
24 A G R I C U L T U R A L A N D F O O D C H E M I S T R Y
Table 1. Total Ascorbic Acid Recoveries by Homocysteine Reduction and Polarographic Analysis
Amounf Added Dehydro- Tofal Ascorbic Acid
Ascorbic ascorbic Present, Found,'" Recovery, acid, mg. acid, mg. mg. mg. %
Q Values given are the average of five determinations f std. dev.
Table II. Total Ascorbic Acid Analyses of Various Foods Comparison of Polarographic Method with 2,G-DCIP and 2,4-DNPH
Fresh Producfs
Brussel sprouts Cabbage Celery Lemon juice Onion Orange juice Parsley Spinach Tomato Watercress
Conned Products
Asparagus Grapefruit juice Lemon juice Lima beans Mixed vegetable juice Orange juice Peas Sauerkraut Tomato juice Tomato puree
2,6-DCIP
Reduced Total A A A A
h g . %I h s . %I 105 3 130 4 48 1 52 1 37 5 43 5 41 2 42 0 11 8 1 1 . 8 5 1 . 2 51 .2 70 .1 88 .0
2 ,4 -DNPH
Reduced Tofal A A AA
( m g . %I (mg. %I
Polarographic
Reduced Tofol AA AA
(mg. %I (ms. %I 9 9 . 4 127 .5 99 .4 125 .0 45 .6 50 .0 4 4 . 5 48 .7 30 .6 45 .3 32 .5 3 8 . 8
4 2 . 4 4 2 . 5 4 1 . 0 43 .8 7 . 9 7 . 9
5 1 . 5 50 .2 71 .0 8 8 . 5
41 1 49 4 41 3 48 4 21 2 23 2 18 5 22 4 35 0 60 0 45 6 60 8
32 8 32 8 29 2 30 8 41 7 42 6
8 8 8 8 25 3 25 3 49 4 53 0 11 0 12 5 18 0 18 8 16 4 16 4 47 3 53 8
15 4 17 4 28 1 28 5 40 4 41 2
6 4 8 7 19 5 24 0 47 1 53 0 10 0 12 0 17 7 18 1 14 2 16 0 40 2 46 3
8 . 4 8 . 4 48 .8 4 8 . 8 68 .0 84 .9 4 0 . 5 4 8 . 0 1 8 . 0 1 9 . 0 5 0 . 3 6 1 . 4
1 4 . 2 14 6 23 .1 24 2 39 6 40 0
6 8 8 0 20 2 20 4 46 3 52 2 10 4 11 2 14 6 17 6 14 6 14 6 44 5 50 5
acid has been studied by Krauze and Bosyk ( 9 ) . These investigators. how- ever, have shown that the formation of polysulfides following treatment with hydrogen sulfide hlas an adverse in- fluence on the polarographic wave produced by the ascorbic acid.
In view of the advantages afforded by the use of homocysteine over hydrogen sulfide, it was thought that the com- bination of polarographic analysis and the use of homocysteine would result in a rapid and specific method for determining total asscorbic acid.
,4t pH 6.8, a condition optimum for the reduction of dehydroascorbic acid by homocysteine. the half-wave poten- tial for ascorbic acid (El12-0.06 v. us. S.C.E.) is independent of con- centration and suitable for quantitative analysis. It is not possible, however, to determine polarographically dehydro- ascorbic acid as ascorbic acid directly following homocysteine reduction. This results from the interference of homo- cysteine which. as :shown in Figure 1> also produces an anodic wave (E1'2-0.06 v. us. S.C.E.) at voltages similar to that of ascorbic acid.
When S-ethylmaleimide is added to solutions of homocysteine, the anodic wave resulting from oxidation of the
sulfhydryl group of the homocysteine at the dropping mercuq- electrode is not obtained because the S-ethylmalei- mide complexes with sulfhydryl com- pounds (5). With homocysteine, the reaction is represented as follows:
HOOC-CHNH2-CHa-CHLSH + Homocysteine
CH-CO \N-c..H~ -+ HOOC- CH-CO/ II
.V-Ethylmaleimide
CHKH:-CH,S-CHCO \T-C2Hs
CH,CO/- Addition Product
The suppression of the anodic wave of homocysteine following the addition of .l'-ethylmaleimide is demonstrated in Figure 1. Figure 2 shows that the reagent is without effect on the anodic wave of ascorbic acid.
Selective removal by .Y-ethylmaleimide of the interference of homocysteine permits the polarographic determination of total ascorbic acid following homo- cysteine reduction (Table I). Typical polarograms obtained from some of the food products investigated in the study are illustrated in Figure 3.
Table I1 shows total and reduced
VOL. 1 1 ,
ascorbic acid values obtained on a variety of food products analyzed by the present method. In all cases, the concentration of ascorbic acid in the extracts of the samples was determined by the Method of Standard Addition. This technique was used because it avoided the influence that each of these products had on the wave height and half-wave potential of ascorbic acid as well as compensating for any varia- tion in temperature or capillary char- acteristics. Further, comparison of the half-wave potential of ascorbic acid before and after the addition of the standard solution to the unknown also eliminated the possible estimation of substances with half-wave potentials similar to ascorbic acid.
Also shown in Table I1 are total and reduced ascorbic acid values determined on these food products by the 2,6- DCIP and 2,4-DNPH methods. These data show conclusively that the polaro- graphic method agrees substantially with these other methods and, there- fore, is applicable for the determination of total ascorbic acid. In some products where more significant differences were obtained, for example, asparagus. celery, and onion: the lower polarographic value is probably the more reliable due to the greater specificity of the meihod.
By the technique described, 1 mg. of ascorbic acid per 100 grams of solution was easily detectable in model buffered solutions. I t was not possible to discern through a well-defined wave this con- centration of ascorbic acid in a food product. For example, food extracts shown to contain 3 mg. total ascorbic acid per 100 grams (mg.yc) of product by 2>4-DNPH analyses gave no evidence polarographically of this substance being present. Only when these extracts were adjusted by the addition of ascorbic acid to contain more than 3 mg. per 100 grams of product did the character- istic ascorbic acid wave become ap- parent. This would seem to limit the method to concentrations higher than this amount. However, more recent investigations in the authors' labora- tories have shown that the sensitivity of the method can be increased below the 3-mg.Y0 level through the applica- tion of derivative polarography. In the derivative technique, the polarogram
is recorded as a plot of - us. E in which
i and E represent diffusion current and applied potential, respectively. The half-wave potential is thus represented as a maximum with the peak height proportional to concentration ( 8 ) .
Derivative polarography will sep- arate substances with oxidation or reduction potentials within 0.05 volt of the final current rise so that waves not appearing in conventional polarograms are more readily detected. This is illustrated in Figure 4 by a typical
Ai AE
NO. 1, J A N . - F E B . 1 9 6 3 25
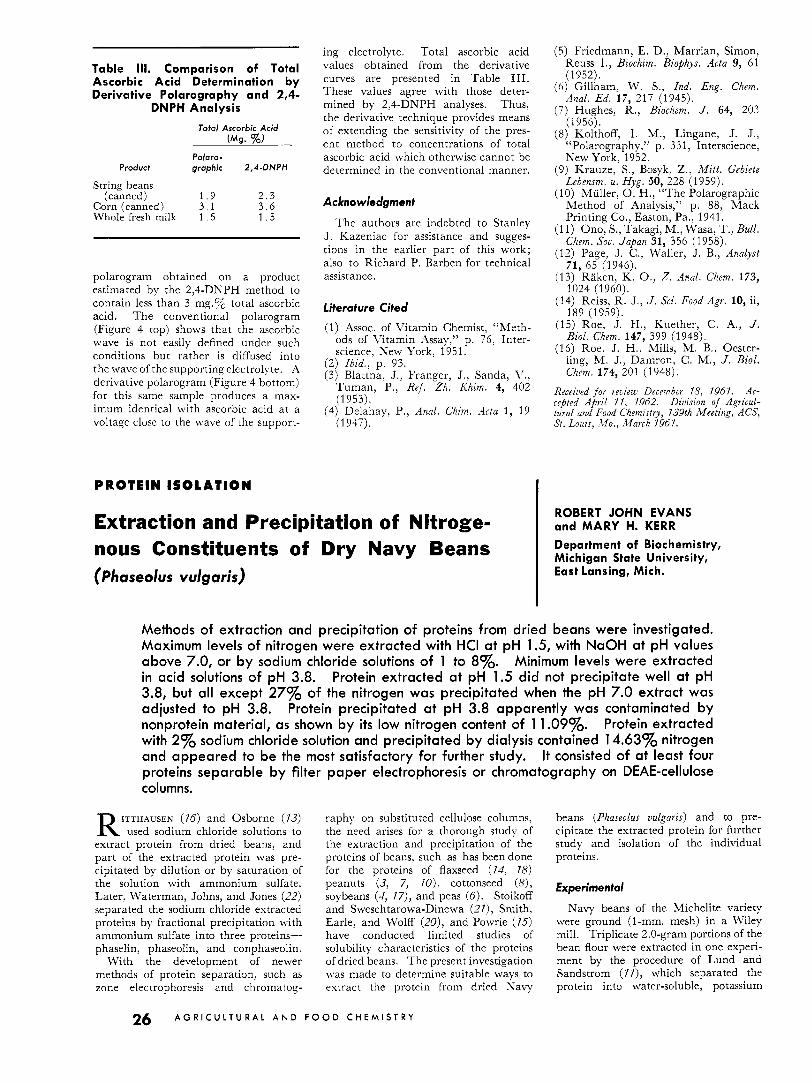
Table 111. Comparison of Total Ascorbic Acid Determination by Derivative Polarography and 2,4-
DNPH Analysis
Tofaf Ascorbic Acid (Ms. %)
Pofaro- Product graphic 2,4-DNPH
String beans (canned) 1 . 9 2 . 3
Corn (canned) 3 . 1 3 . 6 Whole fresh milk 1 . 5 1 . 5
Extraction and Precipitation of Nitroge-
polarogram obtained on a product estimated by the 2,4-DNPH method to contain less than 3 mg.% total ascorbic acid. The conventional polarogram (Figure 4 top) shows that the ascorbic wave is not easily defined under such conditions but rather is diffused into the wave of the supporting electrolyte. A derivative polarogram (Figure 4 bottom) for this same sample produces a max- imum identical with ascorbic acid at a voltage close to the wave of the support-
ROBERT JOHN EVANS and MARY H. KERR
ing electrolyte. Total ascorbic acid values obtained from the derivative curves are presented in Table 111. These values agree with those deter- mined by 2,4-DNPH analyses. Thus, the derivative technique provides means of extending the sensitivity of the pres- ent method to concentrations of total ascorbic acid which otherwise cannot be determined in the conventional manner.
(PhaseoIus vulgaris)
Acknowledgment
The authors are indebted to Stanley J. Kazeniac for assistance and sugges- tions in the earlier part of this work; also to Richard P. Barben for technical assistance.
Department of Biochemistry, Michigan State University, East Lansing, Mich.
Literature Cited
(1) Assoc. of Vitamin Chemist, “Meth- ods of Vitamin Assay,” p. 76, Inter- science, Sew York. 1951.
(2) Zbid., p. 93. (3) Blattna, J., Franger, J., Sanda, V.?
Tuman. P.. Ref. Zh. Khim. 4, 402 , , ” (1953).
(1947). (4) Delahay, P., Anal. Chim. Acta 1, 19
(5) Friedmann, E. D., Marrian, Simon, Reuss I., Biochim. Biophys. Acta 9, 61 (1952).
(6) Gillham, W. S., Znd. Eng. Chem. Anal. Ed. 17, 2,17 (1945).
(7) Hughes, R., Biochem. J . 64, 203 (1956).
(8) Kolthoff, I. M., Lingane, J. J., “Polarography,” p. 331, Interscience, New York, 1952.
(9) Krauze, S., Bosyk, Z., Mitt. Gebiete Lebensm. u. Hyg. 50, 228 (1959).
(10) Muller, 0. H., “The Polarographic Method of A4nalysis,” p. 88, Mack Printing Co., Easton, Pa., 1941.
(1 1) Ono, S., Takagi, M., Wasa, T., Bull. Chem. Sac. Japan 31, 356 (1958).
(12) Page, J. C., Waller, J. B., Analyst 71, 65 (1946).
(13) Raken, K. O.? 2. Aual. Chem. 173, 1024 (1960).
(14) Reiss, R . J., J . Sci. Food ‘4gr. 10, ii, 189 (1959).
(15) Roe, J. H., Kuether, C. .4., J . B i d . Chem. 147, 399 (1948).
(16) Roe, J. H., Mills, M. B., Oester- ling, M. J., Damron, C. M., J . Biol. Chem. 174, 201 (1948).
Received for review Decembcr 78, 7967. Ac- cepted April 7 7 , 1962. Division of Agricul- tural and Food Chpmistry, 739th Meeting, ACS, St. Louis, ‘Mo., March 7967.
PROTEIN ISOLATION
Methods of extraction and precipitation of proteins from dried beans were investigated. Maximum levels of nitrogen were extracted with HCI at pH 1.5, with NaOH at pH values above 7.0, or by sodium chloride solutions of 1 to 8%. Minimum levels were extracted in acid solutions of pH 3.8. Protein extracted at pH 1.5 did not precipitate well at pH 3.8, but all except 27% of the nitrogen was precipitated when the pH 7.0 extract was adjusted to pH 3.8. Protein precipitated at pH 3.8 apparently was contaminated by nonprotein material, as shown by its low nitrogen content of 11.097& Protein extracted with 2% sodium chloride solution and precipitated by dialysis contained 14.6370 nitrogen and appeared to be the most satisfactory for further study. It consisted of at least four proteins separable by filter paper electrophoresis or chromatography on DEAE-cellulose columns.
ITTHAUSEN (76) and Osborne (73) R used sodium chloride solutions to extract protein from dried beans, and part of the extracted protein was pre- cipitated by dilution or by saturation of the solution with ammonium sulfate. Later, Waterman, Johns, and Jones (22) separated the sodium chloride extracted proteins by fractional precipitation with ammonium sulfate into three proteins- phaselin, phaseolin, and conphaseolin.
With the development of newer methods of protein separation, such as zone electrophoresis and chromatog-
raphy on substituted cellulose columns, the need arises for a thorough study of the extraction and precipitation of the proteins of beans, such as has been done for the proteins of flaxseed (74, 78) peanuts (3, 7, 70), cottonseed (8), soybeans (4> 77), and peas (6). Stoikoff and Sweschtarowa-Dinewa (27), Smith, Earle, and Wolff (20), and Powrie (75) have conducted limited studies of solubility characteristics of the proteins of dried beans. The present investigation was made to determine suitable ways to extract the protein from dried Navy
beans (Phaseolus vulgaris) and to pre- cipitate the extracted protein for further study and isolation of the individual proteins.
Experirnenfal
Navy beans of the Michelite variety were ground (1-mm. mesh) in a Wiley mill. Triplicate 2.0-gram portions of the bean flour were extracted in one experi- ment by the procedure of Lund and Sandstrom (77), which separated the protein into water-soluble, potassium
26 A G R I C U L T U R A L A N D F O O D C H E M I S T R Y

![Polarographic Behavior and Determination of Vitamin B in ... · Polarographic Behavior and Determination... 25 Icha[12] has described the polarographic active behavior of orotic acid](https://img.pdfslide.net/doc/110x75/606749c4ab2cc56e4a6481f6/polarographic-behavior-and-determination-of-vitamin-b-in-polarographic-behavior.jpg)