Embed Size (px)
Citation preview
Aseptic Technique: The Emperor's New Clothes?
Mia Small Nurse Consultant Nutrition and Intestinal Failure St Mark’s Hospital, UK [email protected]
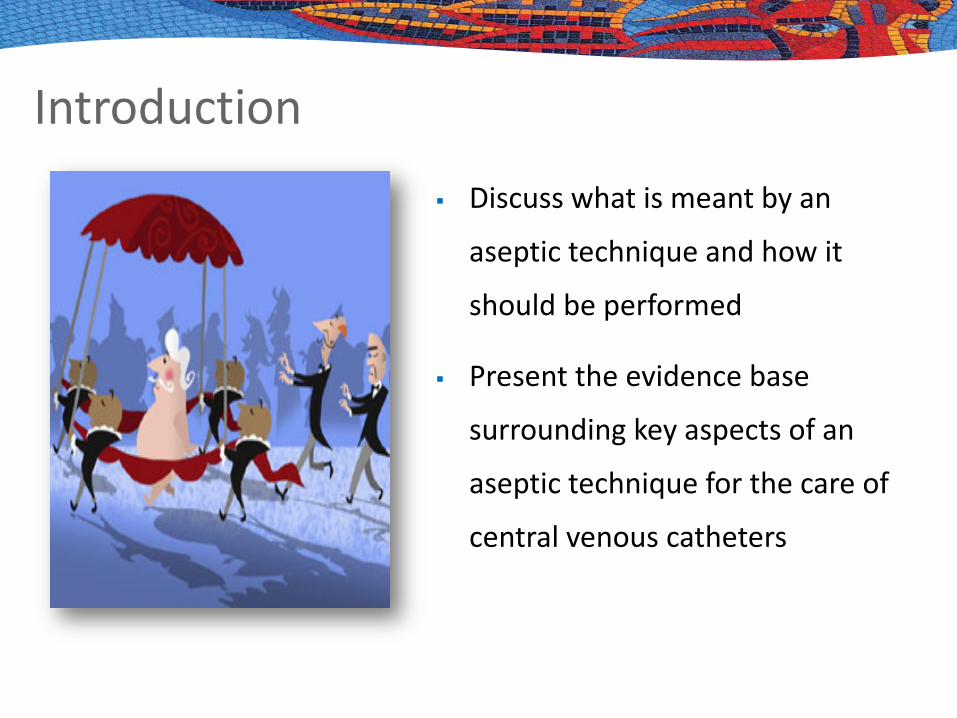
Introduction
Discuss what is meant by an
aseptic technique and how it
should be performed
Present the evidence base
surrounding key aspects of an
aseptic technique for the care of
central venous catheters

What is an aseptic technique?
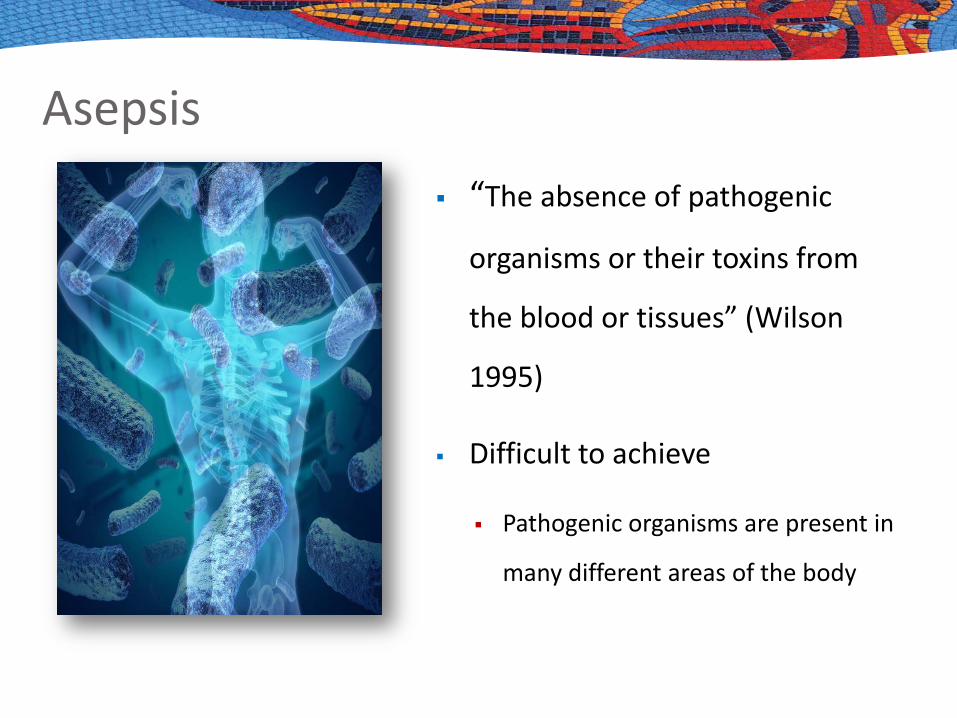
Asepsis “The absence of pathogenic
organisms or their toxins from
the blood or tissues” (Wilson
1995)
Difficult to achieve
Pathogenic organisms are present in
many different areas of the body
“Necessary infection control measures to prevent
pathogenic micro-organisms on hands, surfaces or
equipment from being introduced into susceptible
sites during clinical practice”
Dougherty et al (2010)
Aseptic technique
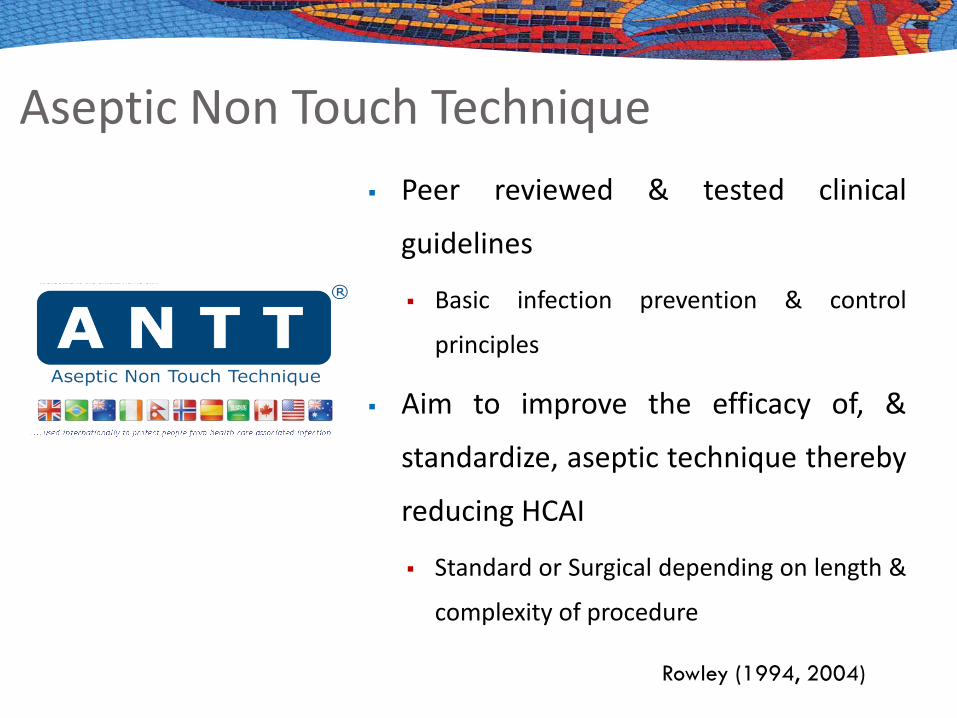
Aseptic Non Touch Technique Peer reviewed & tested clinical
guidelines
Basic infection prevention & control
principles
Aim to improve the efficacy of, &
standardize, aseptic technique thereby
reducing HCAI
Standard or Surgical depending on length &
complexity of procedure
Rowley (1994, 2004)
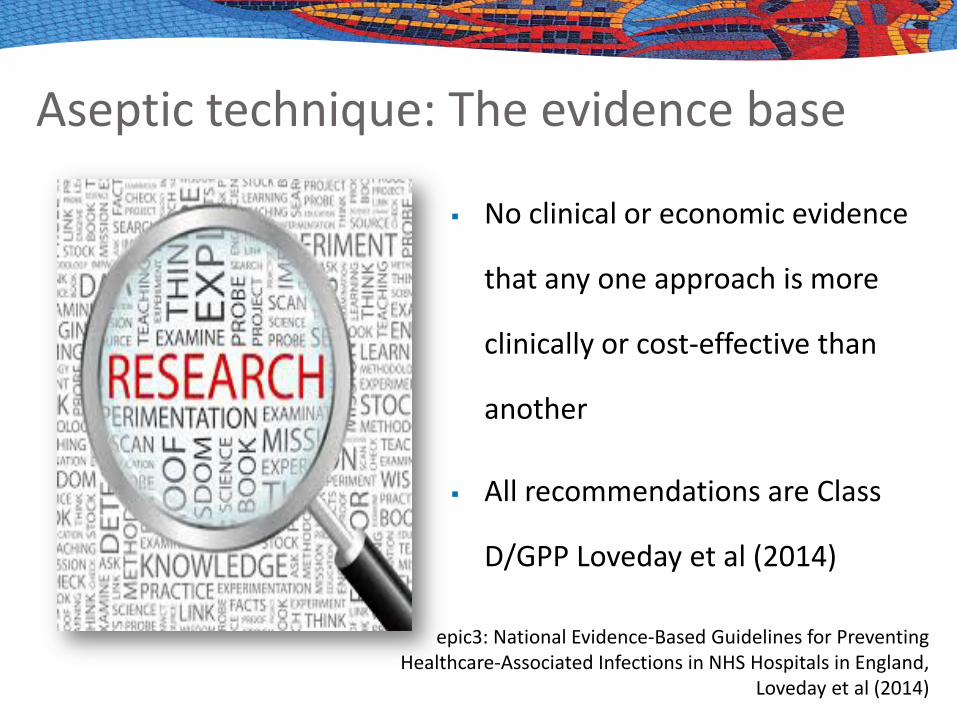
Aseptic technique: The evidence base
No clinical or economic evidence
that any one approach is more
clinically or cost-effective than
another
All recommendations are Class
D/GPP Loveday et al (2014)
epic3: National Evidence-Based Guidelines for Preventing Healthcare-Associated Infections in NHS Hospitals in England,
Loveday et al (2014)

What technique would you recommend for parenteral nutrition?
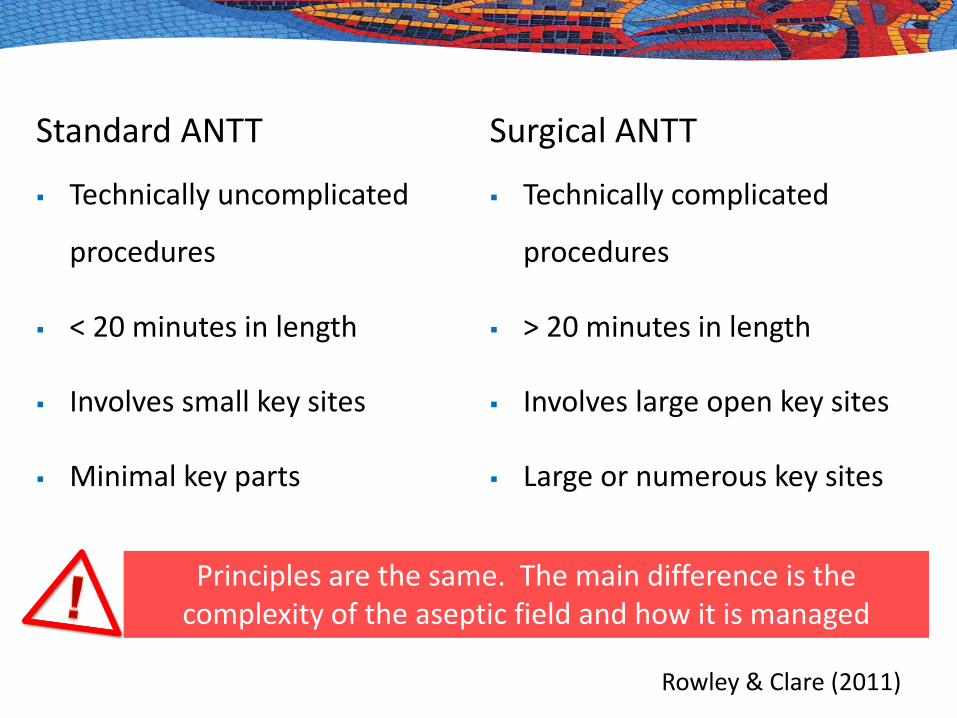
Standard ANTT
Technically uncomplicated
procedures
< 20 minutes in length
Involves small key sites
Minimal key parts
Surgical ANTT
Technically complicated
procedures
> 20 minutes in length
Involves large open key sites
Large or numerous key sites
Principles are the same. The main difference is the complexity of the aseptic field and how it is managed
Rowley & Clare (2011)
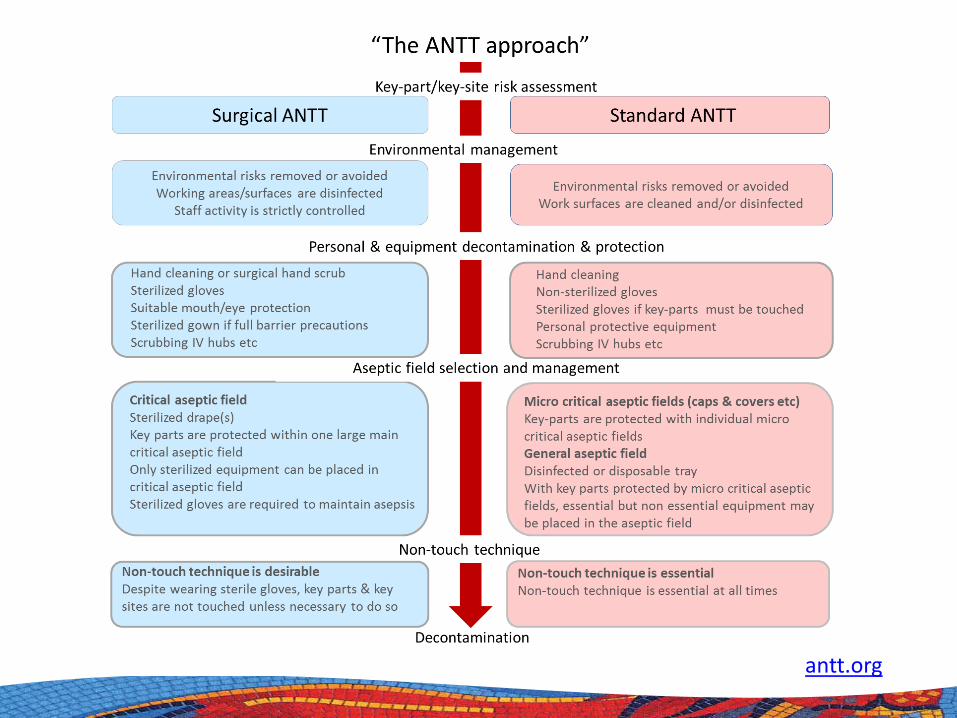
antt.org
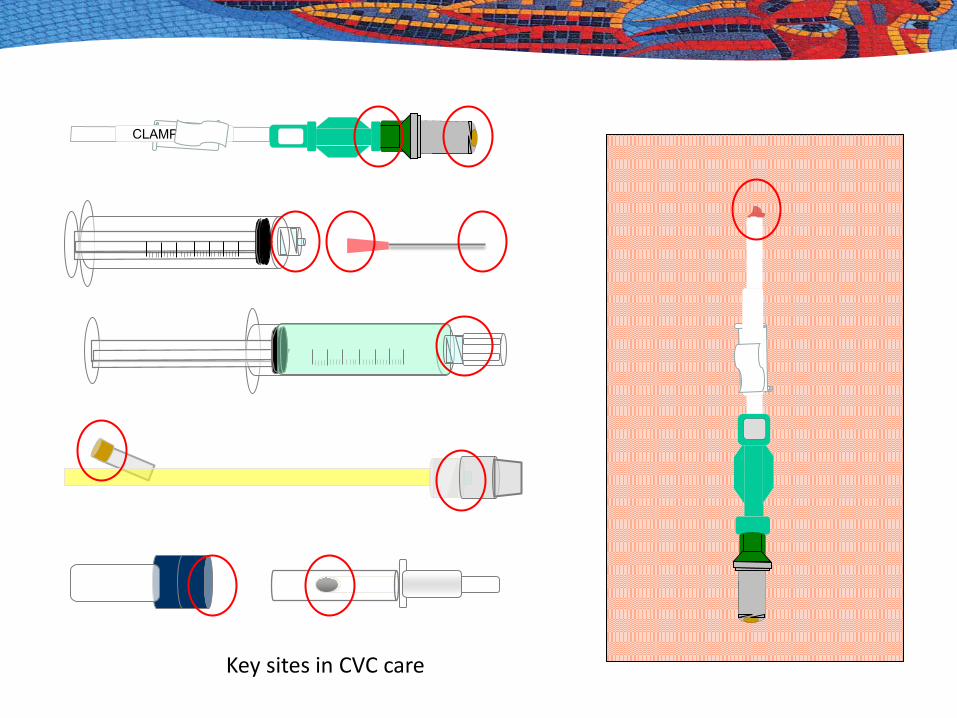
Key sites in CVC care

Should the technique be standardised?
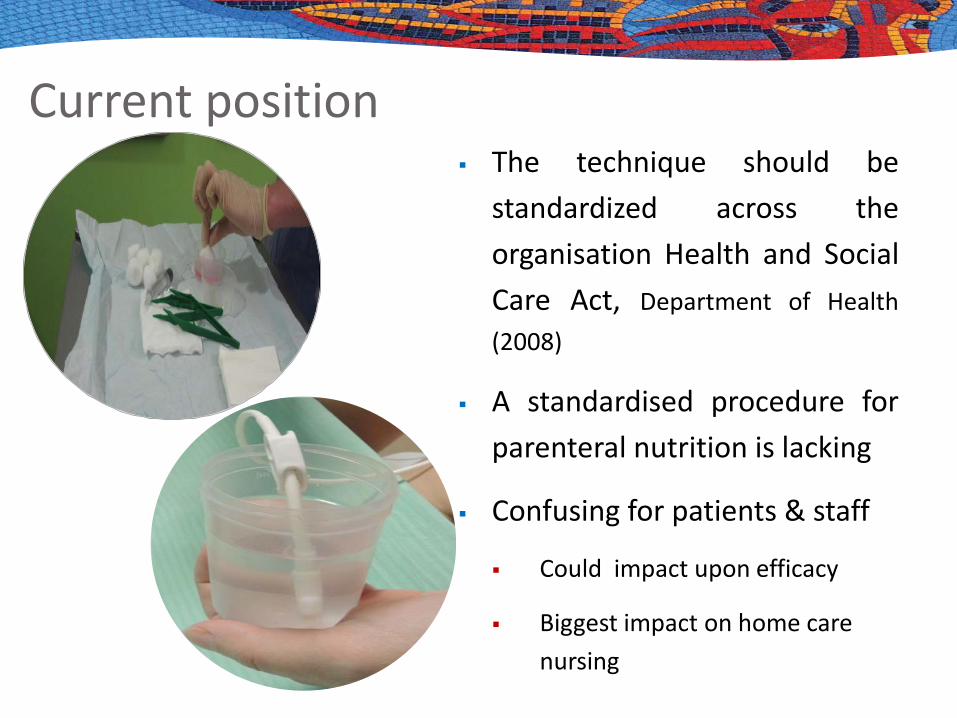
Current position The technique should be
standardized across the organisation Health and Social Care Act, Department of Health (2008)
A standardised procedure for parenteral nutrition is lacking
Confusing for patients & staff
Could impact upon efficacy
Biggest impact on home care nursing
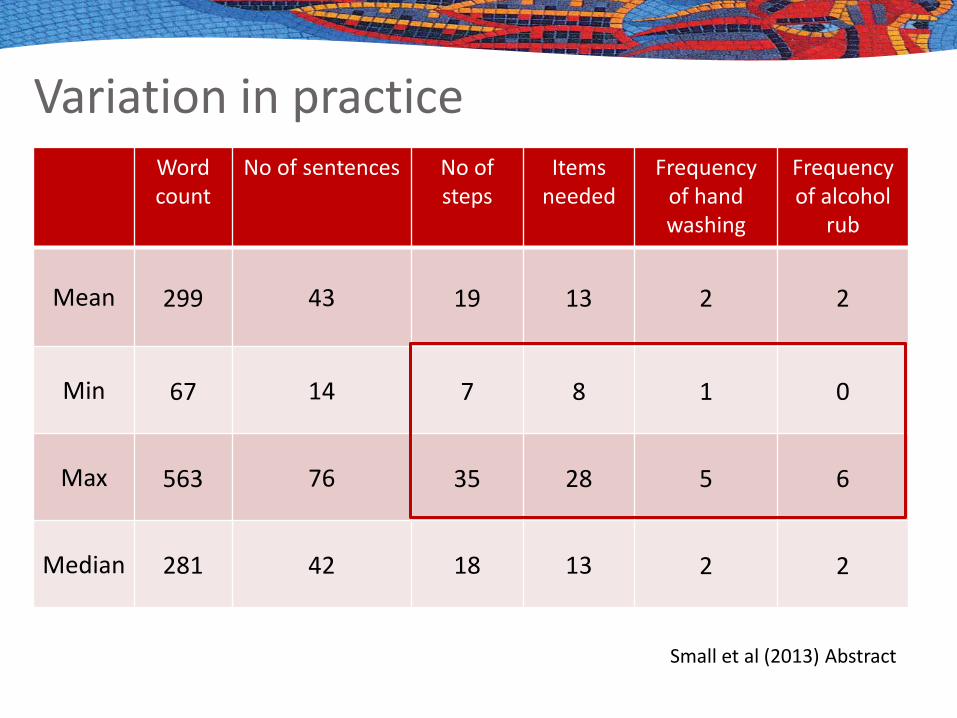
Variation in practice Word count
No of sentences No of steps
Items needed
Frequency of hand washing
Frequency of alcohol
rub
Mean 299 43 19 13 2 2
Min 67 14 7 8 1 0
Max 563 76 35 28 5 6
Median 281 42 18 13 2 2
Small et al (2013) Abstract

Which elements of central venous catheter care are evidence-based?
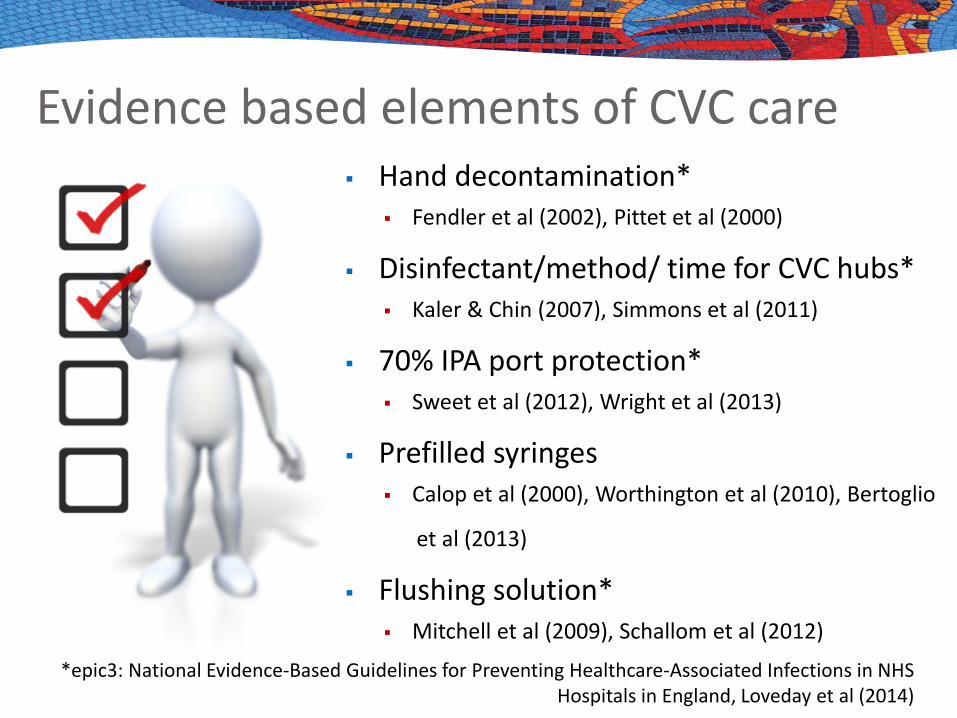
Hand decontamination* Fendler et al (2002), Pittet et al (2000)
Disinfectant/method/ time for CVC hubs* Kaler & Chin (2007), Simmons et al (2011)
70% IPA port protection* Sweet et al (2012), Wright et al (2013)
Prefilled syringes Calop et al (2000), Worthington et al (2010), Bertoglio
et al (2013)
Flushing solution* Mitchell et al (2009), Schallom et al (2012)
Evidence based elements of CVC care
*epic3: National Evidence-Based Guidelines for Preventing Healthcare-Associated Infections in NHS Hospitals in England, Loveday et al (2014)
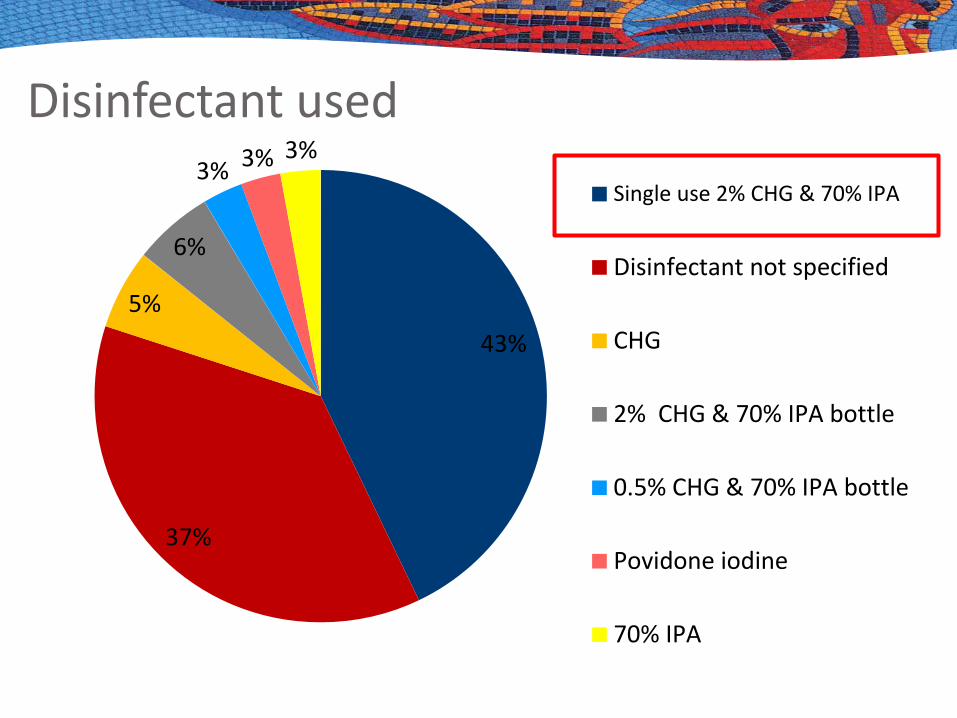
Disinfectant used
43%
37%
5%
6%
3% 3% Single use 2% CHG & 70% IPA
Disinfectant not specified
CHG
2% CHG & 70% IPA bottle
0.5% CHG & 70% IPA bottle
Povidone iodine
70% IPA
3%
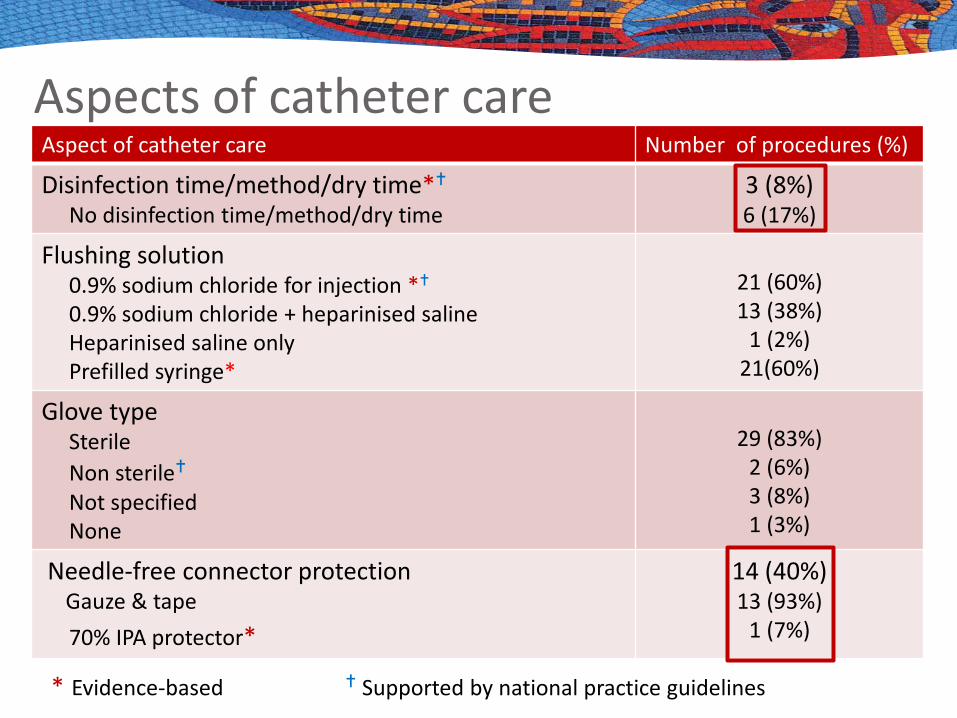
Aspects of catheter care Aspect of catheter care Number of procedures (%)
Disinfection time/method/dry time* No disinfection time/method/dry time
3 (8%) 6 (17%)
Flushing solution 0.9% sodium chloride for injection * 0.9% sodium chloride + heparinised saline Heparinised saline only Prefilled syringe*
21 (60%) 13 (38%)
1 (2%) 21(60%)
Glove type Sterile Non sterile Not specified None
29 (83%)
2 (6%) 3 (8%) 1 (3%)
Needle-free connector protection Gauze & tape 70% IPA protector*
14 (40%) 13 (93%)
1 (7%)
* Evidence-based Supported by national practice guidelines
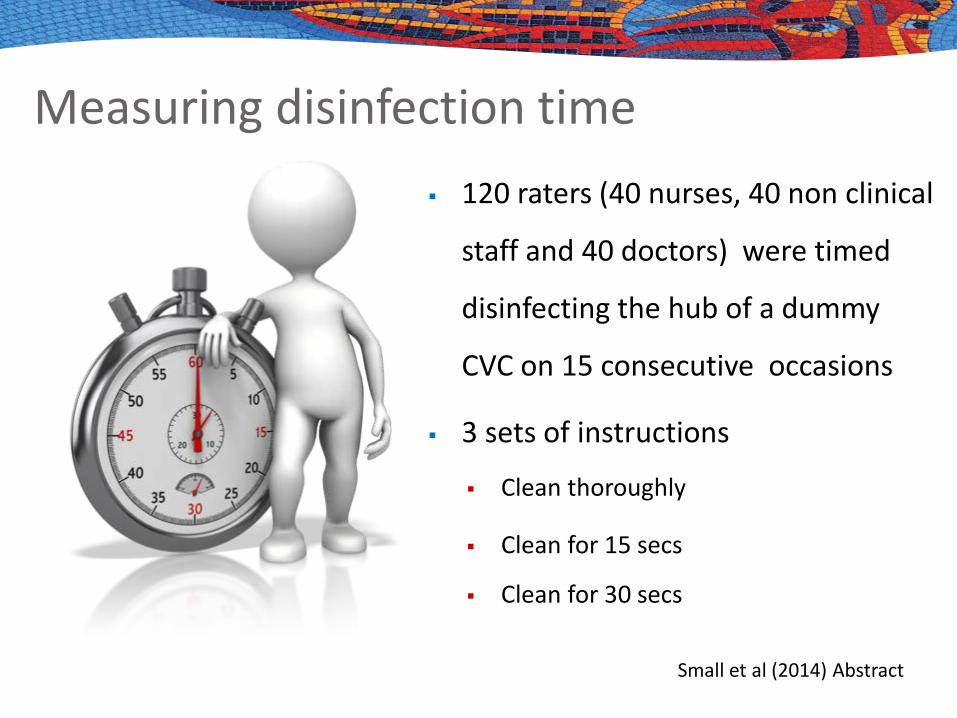
Measuring disinfection time 120 raters (40 nurses, 40 non clinical
staff and 40 doctors) were timed
disinfecting the hub of a dummy
CVC on 15 consecutive occasions
3 sets of instructions
Clean thoroughly
Clean for 15 secs
Clean for 30 secs
Small et al (2014) Abstract
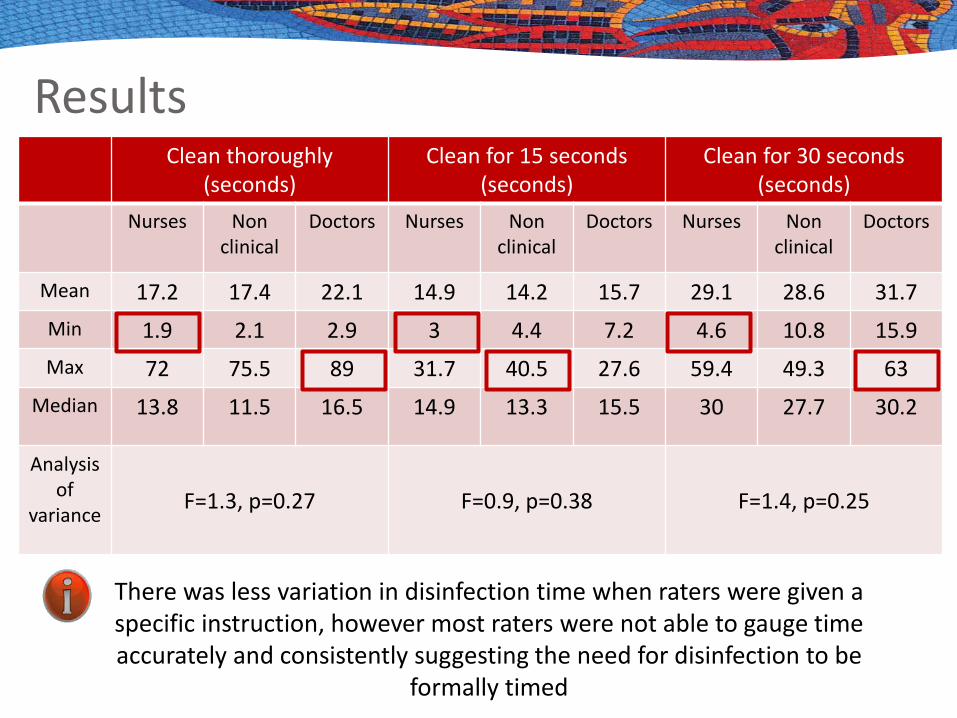
Results Clean thoroughly
(seconds) Clean for 15 seconds
(seconds) Clean for 30 seconds
(seconds) Nurses Non
clinical Doctors Nurses Non
clinical Doctors Nurses Non
clinical Doctors
Mean 17.2 17.4 22.1 14.9 14.2 15.7 29.1 28.6 31.7 Min 1.9 2.1 2.9 3 4.4 7.2 4.6 10.8 15.9 Max 72 75.5 89 31.7 40.5 27.6 59.4 49.3 63
Median 13.8 11.5 16.5 14.9 13.3 15.5 30 27.7 30.2
Analysis of
variance F=1.3, p=0.27 F=0.9, p=0.38 F=1.4, p=0.25
There was less variation in disinfection time when raters were given a specific instruction, however most raters were not able to gauge time accurately and consistently suggesting the need for disinfection to be
formally timed
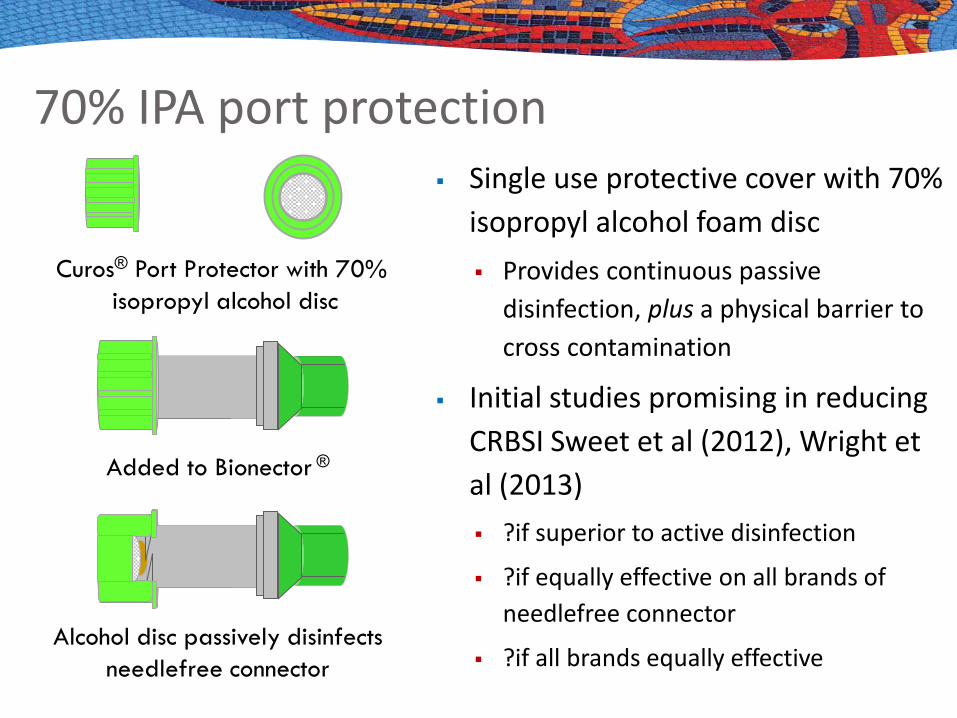
70% IPA port protection Single use protective cover with 70%
isopropyl alcohol foam disc Provides continuous passive
disinfection, plus a physical barrier to cross contamination
Initial studies promising in reducing CRBSI Sweet et al (2012), Wright et al (2013) ?if superior to active disinfection
?if equally effective on all brands of needlefree connector
?if all brands equally effective
Added to Bionector ®
Curos® Port Protector with 70% isopropyl alcohol disc
Alcohol disc passively disinfects needlefree connector
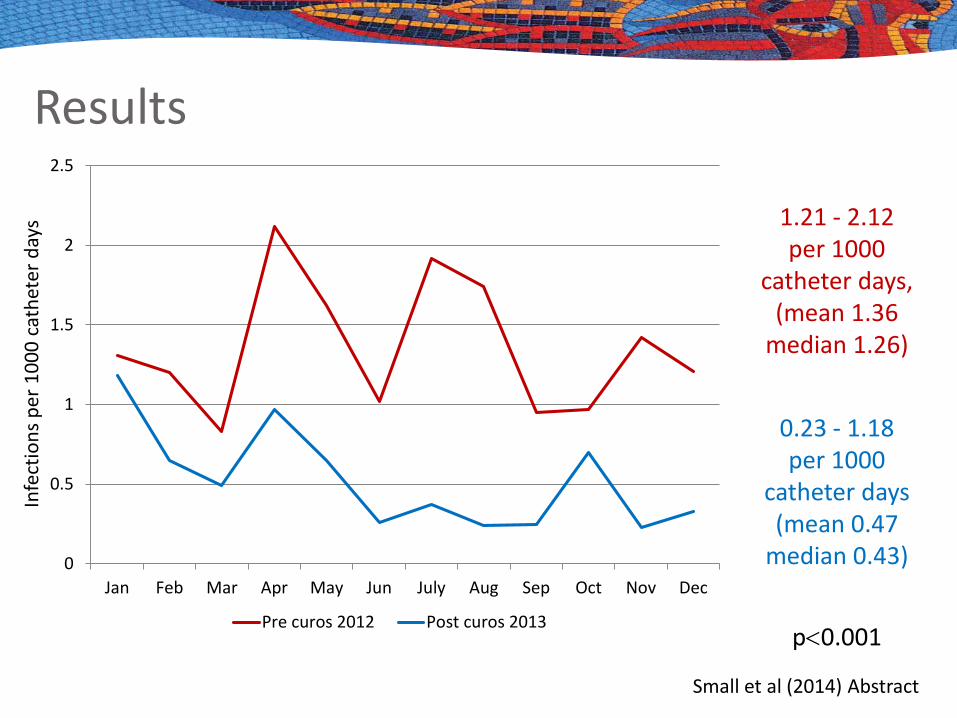
Results
0
0.5
1
1.5
2
2.5
Jan Feb Mar Apr May Jun July Aug Sep Oct Nov Dec
Pre curos 2012 Post curos 2013
Infe
ctio
ns p
er 1
000
cath
eter
day
s
0.23 - 1.18 per 1000
catheter days (mean 0.47
median 0.43)
p<0.001
1.21 - 2.12 per 1000
catheter days, (mean 1.36
median 1.26)
Small et al (2014) Abstract

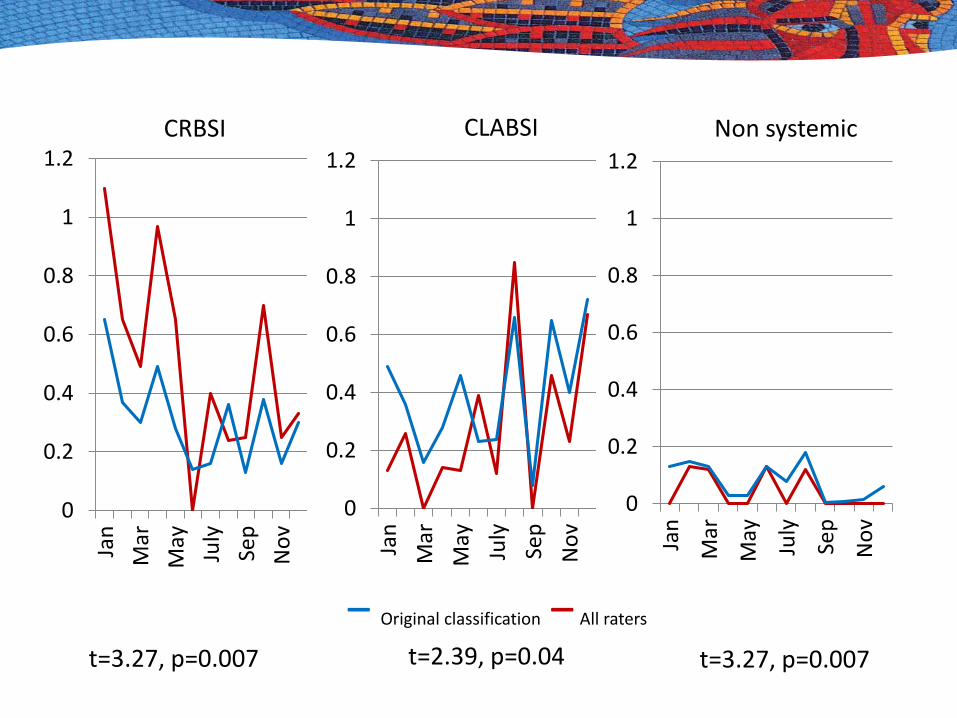
How can the efficacy of an aseptic technique be assessed?
Catheter related infection Monitoring catheter related infection is
an important outcome measure
Differences in classifying infection
Specifically catheter related bloodstream infection (CRBSI) & central line associated bloodstream infection (CLABSI)
Availability of culturing methods, & whether catheter tips are available for analysis make direct comparison of infection rates difficult
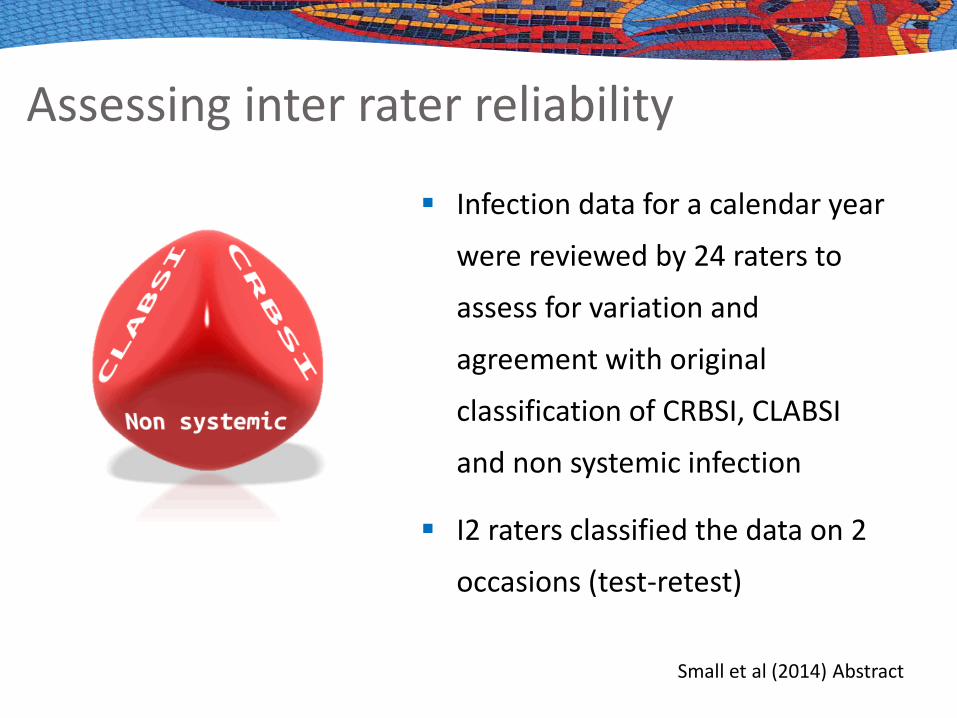
Assessing inter rater reliability
Infection data for a calendar year
were reviewed by 24 raters to
assess for variation and
agreement with original
classification of CRBSI, CLABSI
and non systemic infection
I2 raters classified the data on 2
occasions (test-retest)
Small et al (2014) Abstract
0
0.2
0.4
0.6
0.8
1
1.2
Jan
Mar
May July
Sep
Nov
0
0.2
0.4
0.6
0.8
1
1.2
Jan
Mar
May July
Sep
Nov
0
0.2
0.4
0.6
0.8
1
1.2
Jan
Mar
May July
Sep
Nov
− Original classification − All raters
t=3.27, p=0.007 t=2.39, p=0.04 t=3.27, p=0.007
CRBSI CLABSI Non systemic
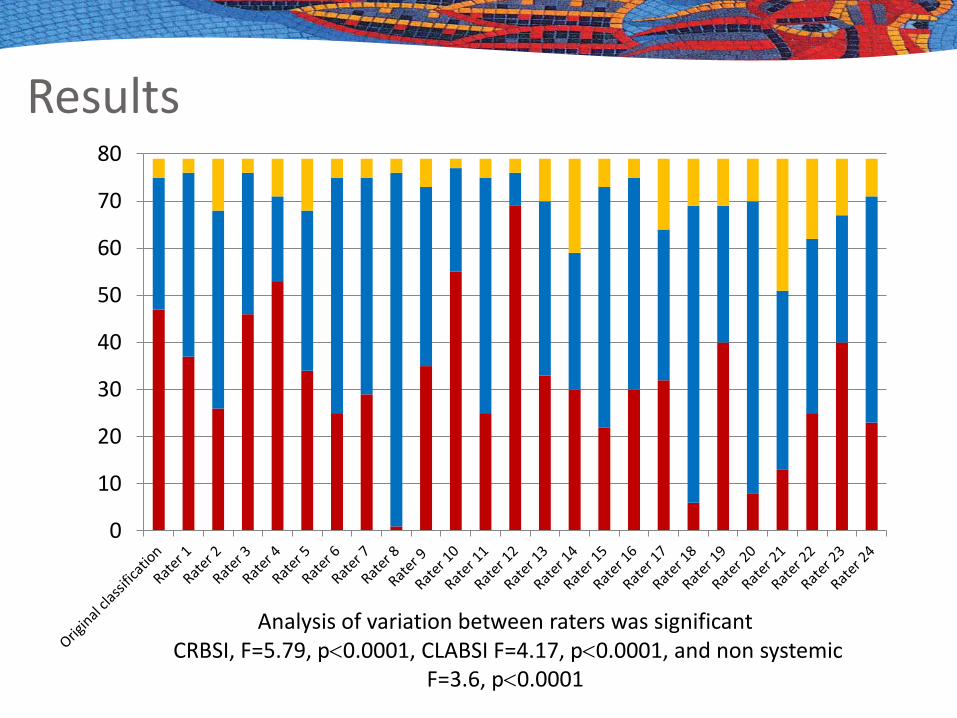
Results
0
10
20
30
40
50
60
70
80
Analysis of variation between raters was significant CRBSI, F=5.79, p<0.0001, CLABSI F=4.17, p<0.0001, and non systemic
F=3.6, p<0.0001
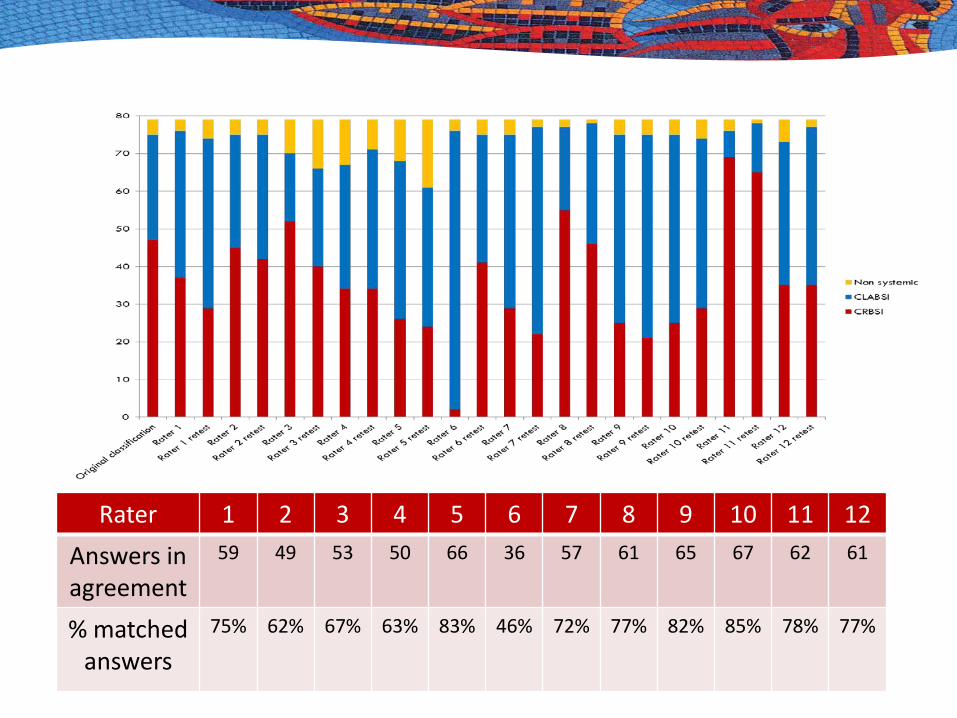
Rater 1 2 3 4 5 6 7 8 9 10 11 12 Answers in agreement
59 49 53 50 66 36 57 61 65 67 62 61
% matched answers
75% 62% 67% 63% 83% 46% 72% 77% 82% 85% 78% 77%
The ideal procedure…
Focus on the principles of asepsis
rather than a step by step list of
instructions
Hospitals should incorporate
evidence based recommendations
into their procedures