Embed Size (px)
Citation preview

Asetek A/S
CVR‐number 3488 0522
UNAUDITED
Annual Report 2014
(January 1st ‐ December 31st 2014)

General Information (UNAUDITED)
2 Asetek A/S – Annual Report 2014
Asetek A/S
Assensvej 2
DK‐9220 Aalborg East
Denmark
Phone: +45 9645 0047
Fax: +45 9645 0048
Web site: www.asetek.com
email: [email protected]
CVR‐number: 3488 0522
ISIN‐Number DK0060477263
Board of Directors
Samuel Szteinbaum, Chairman Chris J. Christopher Jim McDonnell
Bengt Olof Thuresson Knut Øversjøen Peter Gross
Nomination Committee
Ib Sønderby
Samuel Szteinbaum
Thomas Vogt
Audit Committee
Knut Øversjøen
Chris J. Christopher
Compensation Committee
Samuel Szteinbaum
Bengt Olof Thuresson
Executive Management
André Sloth Eriksen, CEO Peter Dam Madsen, CFO
Auditor
PwC, state authorized public accountants
Skelagervej 1A, DK‐9000 Aalborg
Phone: +45 9635 4000

Shareholder Information (UNAUDITED)
3 Asetek A/S – Annual Report 2014
1 January 2014
Asetek shares opened the year 2014 at NOK 41.50.
31 December 2014
At the last day of the year the Asetek shares closed at NOK
19.00, which was a decline of 54% during the year. The Oslo
Stock Exchange (OSE) Benchmark Index advanced 6% in 2014.
The OSE Information Technology Index advanced 25% in
2014.
Asetek’s shares have been listed on Oslo Boers since
March 20 2013. 4,000,000 new shares were issued and
sold during the initial public offering. As of December 31,
2014, a total of 14,881,311 shares are issued, each with a
nominal value of DKK 0.1.
The share is classified in the “Information Technology”
sector by the stock exchange, and the ticker mark is
ASETEK.
The total market capitalization value at the end of 2014
was NOK 283m (approximately USD 46m) which is 51%
lower than the market value at the beginning of 2014.
716,603 shares were held by the Company as per
December 31, 2014 as treasury shares, primarily to
support an employee stock option program.
Each share provides one vote. The shares are marketable
securities and no restrictions have been set for the
shares’ negotiability. The share register is maintained by
DNB Bank ASA ‐ Verdipapirservice, Postboks 1600
Sentrum, 0021 Oslo, Norway.
Ownership At the end of 2014, Asetek A/S had 300 shareholders,
some of whom are nominee accounts covering several
individual investors.
Members of Asetek A/S’s Board of Directors and
Executive Board owned or represented a total of 3.20%
of the share capital at the end of 2014.
According to Asetek’s registrations, the following
shareholders have possessions of 5% or above of the
share capital as per December 31, 2014:
Number of Shares %
Sunstone Technology
Ventures, Fund I, Denmark
1,666,341 11.2%
D.E. Shaw Composite Side
Pocket Series 12, L.L.C., USA
1,143,469 7.7%
D.E. Shaw Composite Side
Pocket Series 13, L.L.C., USA
1,124,410 7.6%
Danske Bank A/S, Denmark 891,970 6.0%
Verdipapirfondet DNB,
Norway
850,000 5.7%
Investor Relations Asetek aims to provide a high and consistent level of
information to its shareholders and other interested
parties.
It is Asetek’s intention to conduct an active dialogue with
shareholders, analysts, the press and the public as a
whole. Communication with interested parties takes
place via the ongoing publication of notifications,
investor presentations and individual meetings.
The website www.asetek.com is the primary source of
information for interested parties. It is updated
continuously with information about Asetek’s activities
and strategy. Shareholders, analysts, investors,
stockbrokers as well as other interested parties who have
questions regarding Asetek are requested to inquire via
the email address [email protected], which
is monitored by the CFO.
Dividends. Asetek is investing its capital in the
development and marketing of its cooling products and
values the flexibility to be able to pursue strategic
opportunities if they should arise. Asetek will therefore
retain within the Company any surplus cash that it
generates.
Reporting Calendar for 2015:
Q1 2015 Report: April 29, 2015
Annual General Meeting: April 30, 2015
Q2 2015 Report: August 12, 2015
Q3 2015 Report: October 28, 2015

Shareholder Information�(UNAUDITED)
4 Asetek A/S – Annual Report 2014
Stock Exchange Notices Issued in 2014
Issue Date Headline
December 18, 2014
Asetek Announces Significant Victory in Intellectual Property Lawsuit
November 17, 2014
The University of Tromsø Expands Use of Asetek’s Liquid Cooling
October 31, 2014 OSLO BØRS – RE. TRADES
October 22, 2014 Q3 2014 Progress in both segments
October 15, 2014 Asetek – Invitation to presentation of results for the third quarter 2014
September 10, 2014
Mandatory Notification of Trade
September 4, 2014 Asetek Wins Frost & Sullivan Award for Their Revolutionary Data Center Cooling Solution
August 14, 2014 Issuance of Warrants
August 14, 2014 Asetek Announces Largest Ever Design Win
August 13, 2014 Q2 2014 Strengthened data center market position
August 6, 2014 Invitation to presentation of results for the second quarter and first half year 2014
July 3, 2014 Outcome of extraordinary general meeting
June 26, 2014 Asetek Receives its Largest Order of RackCDU for US Federal Data Center
June 11, 2014 Notice of Extraordinary General Meeting July 3, 2014
June 4, 2014 Asetek Sees Continued Growth With Latest Workstation Design Win
April 24, 2014 Allowed U.S. Patent Claims on its RackCDU D2CT Data Center Liquid Cooling
April 24, 2014 Outcome of annual general meeting
April 24, 2014 Issuance of Warrants
April 24, 2014 Q1 2013 Improved margins and continued data center order inflow
April 16, 2014 Q1 2014 – Invitation to Presentation of First Quarter Results 2014, Postponement of CMD
April 9, 2014 AMD Selects Asetek to Liquid Cool The World’s Fastest Graphics Card
April 2, 2014 Termination of market making agreement
April 2, 2014 Notice of Annual General Meeting April 24, 2014
March 26, 2014 Receives Order of RackCDU Liquid Cooling System
March 21, 2014 Mandatory Notification of Trade
March 19, 2014 Mandatory Notification of Trade
March 15, 2014 Mandatory Notification of Trade
March 12, 2014 Capital Markets Day 2014
March 12, 2014 Change in Financial Calendar
March 5, 2014 Mandatory Notification of Trade
February 26, 2014 Annual Report 2013
February 26, 2014 Q4 2013 Strong revenue increase and solid operational development
February 20, 2014 Q4 2013 – Invitation to presentation of fourth quarter results 2013
January 16, 2014 Receives Order of RackCDU Liquid Cooling System
January 4, 2014 Change in the composition of the Nomination Committee

Management Report (UNAUDITED)
5 Asetek A/S – Annual Report 2014
The Year 2014 Outlined
Asetek continued its success as the leading supplier of liquid cooling solutions for high‐end computing,
shipping 425,000 liquid cooling units in 2014. Since inception, the Company has shipped over two million
sealed loop liquid coolers to customers worldwide.
Revenues in 2014 totaled $20.8 million, level with 2013 ($20.7 million).
o Data center revenues grew to $1.5 million in 2014, a 90% increase over 2013 ($0.8 million).
o Desktop revenues in 2014 declined slightly to $19.3 million from $19.9 million in 2013. The
decline was principally due to the decrease in shipments of desktop graphics cooling and
workstation products in 2014.
Gross margin increased to 41.8% in 2014 from 38.8% in 2013. The increase reflects multiple factors,
primarily a change in business model with certain customers resulted in reduction of their sales prices and
increases in their gross margins.
Total Operating losses of $9.8 million ($7.8 million in 2013) increased principally due to costs incurred for
the defense of Asetek intellectual property.
o Operating profit (adjusted EBITDA) from the desktop segment was $3.3 million for the year, a
decrease from $4.3 million profit in 2013. The decline was principally due to the increase in
development costs associated with the Generation 5 liquid cooling platform in 2014.
o Operating loss (adjusted EBITDA) from the data center segment was $5.5 million for the year,
compared with an operating loss of $6.4 million in 2013. The data center spending reflects
continued investment in development and marketing, business development resources and
equipment/tools.
A jury in the U.S. District Court unanimously ruled in favor of Asetek on all claims in its patent
infringement lawsuit against CMI USA, Inc. (“CMI”, formerly known as Cooler Master USA Inc.). The jury
awarded Asetek damages of $0.4 million, representing a 14.5% royalty on CMI’s infringing sales since
2012.
The U.S. Patent and Trademark Office (USPTO) issued a notice of allowance on Asetek’s patent claims on
its liquid cooling system designed for graphic processing units (GPU’s).
Successful results achieved in Asetek’s first installations of RackCDU:
o University of Tromsø in Norway reduced power consumption and recycled up to 80% of the
waste heat from its data center.
o Mississippi State University reduced capital infrastructure and operating costs of its Cray CS200‐
LC cluster by eliminating the need to purchase a new chiller system.
o The U.S. Department of Defense Redstone Arsenal data center has experienced cooling load
reduction of greater than 60% and a reduction in server energy of more than two times the
expected savings.
Achievements in developing the market for liquid cooling:
o Asetek made progress on multiple business development projects during 2014 – the Company is
engaged in discussions with large OEM’s to expand the RackCDU customer base, and with a major
chip manufacturer to potentially develop a direct‐to‐chip cooling solution for a next generation
platform.
o The USPTO issued a notice of allowance on the Company’s patent claims on the RackCDU direct‐
to‐chip cooling technology.
o Asetek engaged with Johnson Controls as its first Certified Integrator‐Installer Partner (CIIP)

Management Report (UNAUDITED)
6 Asetek A/S – Annual Report 2014
Asetek’s business
Asetek is the world leading provider of energy efficient
liquid cooling systems for data centers, servers,
workstations, gaming and high performance PCs. Its
products are used for reducing power and greenhouse
emissions, lowering acoustic noise, and achieving
maximum performance by leading OEMs and channel
partners around the globe.
Asetek’s products are based upon its patented all‐in‐one
liquid cooling technology with more than 2.0 million
liquid cooling units deployed in the field. Founded in
2000, Asetek is headquartered in Denmark with offices in
USA, China and Taiwan.
Financial position and operating results for 2014
Profit and loss
Total revenues for 2014 were $20.8 million, on par with
2013 ($20.7 million). An increase in data center revenues
in 2014 more than offset a decrease in revenues from
desktop graphics and workstation cooling units. Sealed
loop cooling unit volumes for 2014 were 425,000, down
marginally from 2013 (426,000). ASP’s for the year 2014
were $45.50, a decline of 3% from 2013 ($46.75).
Gross margin increased to 41.8% in 2014 from 38.8% in
2013. The increase reflects multiple factors. A change in
business model with certain customers resulted in
reduction of their sales prices and increases in their gross
margins. Asetek’s proactive management of the mix of
product offerings and cost savings achieved with certain
component suppliers also increased margins. These
increases were partly offset by declines in shipments of
high margin products for PC graphics cooling and
workstations in 2014.
In 2014, operating expenses were $18.5 million, a 17%
increase over 2013 ($15.8 million), reflecting principally
$3.8 million of legal costs associated with defense of
existing intellectual property (IP) and securing new IP
($1.7 million incurred in 2013). The substantial increase
in legal costs occurred in part due to the completion of a
trial versus CMI USA, Inc. (formerly Cooler Master, USA
Inc.), which resulted in a favorable outcome for Asetek. A
lawsuit against another competitor, CoolIT Systems, Inc.,
was settled in February 2015. Operating expenses also
reflect share based compensation expense associated
with employee option grants totaling $0.9 million ($0.6
million in 2013) and foreign exchange loss of $0.3 million
($0.1 million in 2013).
Finance income and costs in 2014 were not significant.
Finance income in 2013 included $1.6 million of gains
associated with the valuation of outstanding debt
instruments converted to equity at the time of the IPO.
Based on the initial trading price of the common shares,
the Company recognized $0.8 million income on the
convertible option on preferred shares and $0.8 million
income on the convertible loan upon revaluation.
Finance costs in 2013 include foreign exchange loss of
$0.5 million, plus $0.3 million of interest charges on debt
paid or converted to shares during 2013.
In 2014, income tax benefit associated with credits for
research and development in Denmark totaled $1.1
million ($0.4 million in 2013).
As a result of the above, net loss for 2014 increased to
$8.8 million from a net loss of $6.3 million in 2013.
Balance sheet
Asetek’s total assets at the end of 2014 were $12.8
million, compared with $21.0 million at the end of 2013.
The decrease is principally the result of cash payments for
operating expenditures, including litigation costs. Cash
and cash equivalents on hand at December 31, 2014 was
$4.2 million.
Significant changes in specific assets for 2014 were as
follows: Cash and cash equivalents decreased $7.5 million
due to funding of operations and legal costs. Trade
receivables decreased $1.3 million from 2013 principally
due to a 29% decrease in sales in the last month of 2014
compared with the last month of 2013. Intangible assets
increased $0.5 million due to an increase in capitalizable
product development costs. Other receivables increased
$0.5 million as a result of tax credits earned but not yet
collected.
Total liabilities decreased by $0.8 million in 2014. Trade
payables decreased $0.8 million principally due to lower
inventory purchases in the fourth quarter of 2014
compared with the same period of 2013. Short‐term
debt decreased $0.1 million due to net payments on a
line of credit. Accrued compensation and benefits
decreased $0.1 million due to lower bonuses payable in
2014. These decreases were partly offset by an increase
in accrued liabilities of $0.5 million reflecting an increase
in accrued legal costs and $0.2 million of liabilities
reclassified from long‐term to short‐term during 2014.

Management Report (UNAUDITED)
7 Asetek A/S – Annual Report 2014
Statement of cash flows
Net cash used by operating activities was $5.8 million for
2014, compared with $4.6 million used in 2013. The
change was mainly attributed to the increased operating
loss.
Cash used by investing activities was $2.0 million, related
principally to additions in capitalized development costs
and property and equipment.
Cash provided by financing activities was $0.1 million in
2014, compared with $17.9 million provided in 2013.
Funds received in 2014 were principally related to leasing
of equipment. The activity in 2013 reflected $21.4 million
of net proceeds raised in the company’s IPO in the first
quarter of 2013, and payments of $4.0 million of
outstanding debt, interest and line of credit, net of draws.
Net change in cash and cash equivalents was negative
$7.5 million in 2014, compared with an increase of $10.4
million in 2013. Not including IPO related transactions,
the net change in cash in 2013 was negative $6.9 million.
Liquidity and financing
Asetek has incurred losses and negative cash flows from
operations since its inception. During this time, Asetek
has financed operations principally through the issuance
of convertible preferred shares and through its initial
public offering (IPO) of common shares on the Oslo Stock
Exchange in March 2013. As of December 31, 2014, the
Company has working capital of $4.4 million and non‐
current liabilities of $0.3 million.
In February 2015, the Company secured NOK 100 million
(approximately $12.4 million) in gross proceeds through
a private placement of 10 million new common shares, at
an offering price of NOK 10.00 per share. The transaction
closed in March 2015, with the Company receiving net
proceeds of approximately $11.6 million after expenses.
In April 2015 at the time of this report, a public offering
of up to 2 million new shares at NOK 10.00 per share was
in process. Expected proceeds to the Company from this
offering is estimated to be $2.4 million.
While there is no assurance that the Company will
generate sufficient revenues or operating profits in the
future, Asetek’s management estimate that, including
the funds raised in the first quarter of 2015, the
Company’s capital resources are sufficient to fund
operating activities through the first half of 2016, based
on financial forecasts. Management will consider
meeting Asetek’s future funding requirements through a
combination of debt and equity offerings, depending on
the cost of capital and the status financial markets at that
time.

Management Report (UNAUDITED)
8 Asetek A/S – Annual Report 2014
Historical financial review
Expectations for 2015
Data center:
In February 2015, Asetek announced a major design win
with the execution of an agreement with Fujitsu
Technology Solutions GmbH to use Asetek's RackCDU
liquid cooling technology. RackCDU will enable Fujitsu’s
High Performance Computing (HPC) customers to
implement high efficiency hot water cooling solutions.
Asetek anticipates shipments to Fujitsu to commence in
the second quarter of 2015, and product launches
involving various server models throughout the year.
Over time, Asetek anticipates significant revenue growth
to be derived from RackCDU sales on Fujitsu platforms.
In February 2015, the Company announced that the
California Energy Commission has selected Asetek to
install RackCDU D2C liquid cooling in two large scale,
supercomputing data centers in California. The project,
valued at $3.5 million and expected to span two years
beginning mid‐2015, will include installation of RackCDU
in approximately 90 racks of servers.
The desire for extremely high densities and overclocking
in the high frequency stock trading market has resulted
in confidential projects with two significant OEMs. Asetek
anticipates executing a sales agreement with one or both
of these OEMs in 2015.
Efforts progress with a major chip manufacturer to
develop a RackCDU D2C cooling solution for a next‐
generation platform. Asetek has entered into 3‐way
NDAs with three major OEMs and the chip manufacturer
to support their related development efforts. In addition,
a major end‐user has been engaged as a potential site for
the first major installation using this platform.
As a result of the fully executed integrator‐installer
partnership agreement between Asetek and Johnson
Controls, Johnson Controls continues to leverage the
differentiation provided by RackCDU into two Federal
data center projects. Both represent major Federal data
center energy efficiency upgrades, where it is expected
that the installation of RackCDU will allow server
consolidation, while cutting cooling energy and IT load
energy by significant margins over the current
installation.
Phase 1b and Phase 2 installation of the Army’s ESTCP
system will begin in parallel starting in the first quarter,
with data collection initiated by the end of the quarter.
Selection of servers and a final timeline for Phase 3
Fiscal Year 2014 2013 2012 2011 2010
Financial highlights: ($000's)
Revenue 20,847 20,729 18,681 15,574 15,749
Gross profit 8,710 8,049 6,788 5,703 4,823
Gross margin % 41.8% 38.8% 36.3% 36.6% 30.6%
EBITDA (8,037) (5,729) (2,820) (1,918) (3,170)
Operating loss (9,808) (7,759) (4,872) (3,707) (4,215)
Finance income (expenses) (87) 1,035 (3,693) 1,838 (2,274)
Net income (loss) (8,757) (6,281) (8,558) (1,877) (6,499)
Purchases of property and equipment 172 952 88 386 183
Sealed loop units shipped (000's) 425 426 414 333 354
Year‐end values ($000's):
Total assets 12,814 20,983 8,162 8,503 8,751
Total equity 7,422 14,808 (40,642) (32,294) (30,613)
Total liabilities 5,392 6,175 48,804 40,797 39,364
Employees at end of year 66 69 60 51 58
Key ratios:
Average selling price per desktop unit ($) 45.5 46.8 45.1 46.8 44.5
Revenue per employee ($000's) 316 300 311 305 272
Days sales outstanding 52 74 65 48 55
Inventory turns per year 11.2 11.9 12.6 8.1 6.2

Management Report (UNAUDITED)
9 Asetek A/S – Annual Report 2014
installation will be completed by the Army early in the
second quarter.
Asetek anticipates additional HPC demand in the first half
of 2015, as repeat orders with existing national
laboratory test sites, as well as from newly acquired
customers.
Desktop:
The Desktop segment is expected to continue to be a
profitable part of Asetek’s offering. Asetek expects
desktop revenue for the first quarter 2015 to increase
over the fourth quarter 2014, partly due to the delay of a
large order that was expected in the fourth quarter 2014.
In the first quarter of 2015, two new Asetek products are
expected to be released by DIY customers, both of which
are targeted to fulfill new demand and generate
incremental revenue and market share for Asetek. As a
result, compared with both the first quarter and fourth
quarter of 2014, the Company anticipates strong revenue
growth in the DIY market.
Revenue in the Gaming/Performance Desktop PC market
is expected to soften slightly in the first quarter. Revenue
in the Workstation market will be negatively impacted in
the near term quarters as a result of HP’s decision to
remove liquid cooling as an option on its most recently
released line of high performance workstations.
However, the Company expects to regain workstation
revenue in future quarters with liquid cooler shipments
for Dell workstations.
The Company expects continued desktop revenue
growth into the second quarter 2015. Based on purchase
orders and internal forecasts, the Company expects
revenues in the second quarter will be upwards of 40%
higher than the average revenue levels achieved in recent
quarters. The anticipated increase is primarily due to
shifts in the competitive landscape and recent product
launches, particularly the Generation 5 liquid cooling
platform. Generation 5 products, launched in late fourth
quarter 2014, offer improved cooling performance,
pump flowrate and overall durability.
While blended gross margins were 42% in the fourth
quarter, Asetek expects gross margin to retreat in the
first quarter 2015 due to a significant increase in
shipment of DIY cooling products, which typically
generate lower margins, combined with a decline in
shipment of workstation cooling units, which typically
generate higher margins. Longer term, management
expects blended gross margins to approximate 40%.
segment is expected to continue to be a profitable part
of Asetek’s offering. In early 2015, new Asetek products
are released by DIY customers, targeted to fulfill new
demand and generate incremental revenue and market
share for Asetek. As a result, compared with both the first
quarter and fourth quarter of 2014, the Company
anticipates strong revenue growth in the DIY market.
Revenue in the Gaming/Performance Desktop PC market
is expected to soften slightly in the first quarter. Revenue
in the Workstation market will be negatively impacted in
the near term quarters as a result of HP’s decision to
remove liquid cooling as an option on its most recently
released line of high performance workstations.
However, the Company expects to regain workstation
revenue in future quarters with liquid cooler shipments
for Dell workstations.
The Company expects continued desktop revenue
growth into the second quarter 2015. The anticipated
increase is primarily due to shifts in the competitive
landscape and recent product launches, particularly the
Generation 5 liquid cooling platform. Generation 5
products, launched in late fourth quarter 2014, offer
improved cooling performance, pump flowrate and
overall durability.
While blended gross margins were 42% in the fourth
quarter, Asetek expects gross margin to retreat in the
first quarter 2015 due to a significant increase in
shipment of DIY cooling products, which typically
generate lower margins, combined with a decline in
shipment of workstation cooling units, which typically
generate higher margins. Longer term, management
expects blended gross margins to approximate 40
Events after the reporting period.
Other than the following, there have been no events
since 31 December 2014 which could significantly affect
the evaluation of the Group’s financial position and
revenues:
In February 2015, the Company secured NOK 100 million
(approximately $12.4 million) in gross proceeds through
a private placement of 10 million new common shares, at
an offering price of NOK 10.00 per share. The transaction
closed in March 2015, with the Company receiving net
proceeds of approximately $11.6 million after expenses.
In April 2015 at the time of this report, a public offering
of up to 2 million new shares at NOK 10.00 per share was
in process. Proceeds to the Company from this offering
is currently unknown.

Management Report (UNAUDITED)
10 Asetek A/S – Annual Report 2014
Risk exposure and management
Asetek’s potential to realize the company’s strategic and
operational objectives are subject to a number of
commercial and financial risks. Asetek is continuously
working on identifying risks that can negatively impact
the company’s future growth, activities, financial position
and results. To the largest extent possible, Asetek tries to
accommodate and limit the risks which the company can
affect through its own actions.
Below, some of the risk factors management considers as
being of special importance to the Group are described in
no specific order. Asetek conducts its business with
significant focus on continuous risk monitoring and
management. The overall goal of risk management is to
ensure that the company is run with a level of risk, which
is in a sensible ratio to the activity level, the nature of the
business, and the company’s expected earnings and
equity.
Insurance. It is the company’s policy to cover all relevant
risk areas with commercially available insurance
products. This currently includes insurance for product
liability, operating material and inventory as well as
compulsory coverage, which varies from country to
country. Management assessments indicate that the
necessary and relevant precautions have been taken to
thoroughly cover insurance issues. Asetek’s insurance
policies and overall coverage approach are reviewed at
least annually.
Credit risk. The credit risk is the risk of a counterpart
neglecting to fulfill its contractual obligations and in so
doing imposing a loss on Asetek. The Group’s credit risk
originates mainly from receivables from the sale of
products as well as deposits in financial institutions.
Receivables from the sale of products are split between
many customers and geographic areas. A systematic
credit evaluation of all customers is conducted, and the
rating forms the basis for the payment terms offered to
the individual customer. The credit risk is monitored
centrally.
Foreign exchange rates. Substantially all of Asetek’s
revenue is billed in USD. However, many customers resell
Asetek products to end users in countries where USD is
not the transactional currency. As a result, there is a risk
that fluctuations in currency will affect the cost of
product to the end user and negatively impact market
demand for Asetek products. The USD has appreciated
against the DKK, Euro and Japanese Yen by more than
10% since January 2014, with the most significant
changes occurring in the last 6 months of 2014, and
continuing into 2015. Asetek estimates that about one
third of its sold products ultimately are delivered in
Europe or Japan, which are the two geographical areas
estimated to have the largest potential impact due the
USD appreciation.
Asetek’s raw materials are predominantly purchased
from vendors whose underlying currency is CNY. The USD
has been stable versus the CNY during 2014, and Asetek
can therefore not expect to pass on a significant portion
of its currency risk to its vendors. While Asetek recognizes
that a USD appreciation will add negative sales price
pressure, Asetek has only seen a very limited reaction
from its markets. Asetek believes that other factors in the
end users’ buying decision play a larger role than a
possible 10% price increase on the liquid cooling
component. In addition, Asetek believes that competing
products will be prone to the same exchange rate
scenarios as Asetek.
Approximately 30‐40% of Asetek’s overhead expenses
are denominated in DKK. If the DKK continues at a
devaluation of 10% relative to the USD, management
expects that the related impact to the Group’s overhead
expenses compared to prior years would be at the level
of 3‐4%.
Asetek strives to match expenses against income and
liabilities against assets. Furthermore, as many expenses
and liabilities as feasible are denominated in USD.
Despite this, increased fluctuations in USD vs. DKK and
CNY will have an influence on the financial position. The
Group has not entered into any forward exchange
instruments.
Product innovation and market development. The
company’s future success, including the opportunities to
ensure growth, depends on the ability to continue
developing new solutions and products adapted to the
latest technology and the clients’ needs as well as
improving existing solutions and market position. Asetek
has in recent years increased its focus and investments
on building the market for datacenter liquid cooling
products.
Projects and contracts. It is of significant importance to
Asetek’s overall success that development projects are
executed at high quality and at predetermined
timeframes and cost prices. Risks are attached to the
sale, analysis and design, development and initial
manufacturing phases. Asetek has carefully defined the
individual phases and the activities contained therein,
with a view to active risk management and efficient
implementation. Through project reviews and ongoing

Management Report (UNAUDITED)
11 Asetek A/S – Annual Report 2014
analyses before, during, and after initiation, Asetek works
to ensure that agreements are adhered to and that
revenue and margins are as planned.
Employee relations. Asetek is a knowledge‐intensive
company and in order to continuously offer optimal
solutions, develop innovative products, and ensure
satisfactory financial results, it is necessary to attract and
develop the right employees. Asetek has the goal of being
an attractive workplace and achieves this through various
programs including an option incentive program, and
attractive working conditions. The company seeks to
support a company culture founded on individual
responsibility and performance as well as team
accomplishment.
Statutory report on corporate social responsibility
Code of conduct. Asetek’s Code of Business Conduct
Ethics is the general ethical guideline for business
conduct to ensure that Asetek on a global level is
dedicated to promote ethical business practices and
protect Asetek against corruption and other unethical
business behavior. The business conduct guidelines can
be found at http://asetek.com/investor‐
relations/corporate‐governance/ethical‐guidelines.aspx
Transparency and credibility. Asetek is committed to
show complete openness towards shareholders,
customers, employees, suppliers and other stakeholders.
It is essential that their understanding of the business and
products is accurate, updated and truthful.
Anti‐corruption. Asetek will not tolerate corruption,
money laundering, bribery or other illegal or unethical
business activity. The Company’s performance and
competitiveness are strengthened solely through lawful
conduct. The group’s anti‐corruption position has been
clearly communicated to all employees. Furthermore,
Asetek has implemented an Ethics Website operated by
a third party company. Via the website, all stakeholders
can keep themselves informed about Asetek’s policies as
well as report any concern to the company’s leadership.
Internal environment and knowledge resources. Asetek
recognizes that its employees are its key assets and it is
committed to maintaining a stimulating working
environment that offers opportunity for both personal
and professional development. The Company maintains
a team‐oriented culture where all employees have the
opportunity to contribute significantly to the success of
the Company. This is also necessary to continue to attract
and retain highly qualified employees within the
computer industry. Asetek welcomes applications for
employment from all sectors of the community and
strives to promote equal opportunity of employment to
all. The Group maintains a positive working environment
and sick leave and turnaround is not significant. No
working accidents or injuries occurred in 2014.
Equal Opportunities. The Board of Directors decided in
October 2013 that it is Asetek’s goal to have at least 15%
female representation at board and management level
by 2016. Women are actively encouraged to apply for
open positions in the Company. During 2015, Asetek
expects to be able to bring its female representation in
the senior management level to 8% which is in line with
expectations and work against meeting the target.
External environment. Asetek Group operations’ effect
on the environment is minimal and is typical for a supplier
of computer components. The manufacturing operations
are outsourced to a commercial manufacturer in China,
which is continuously monitored on various factors
relating to the environment and other social
responsibilities. The principal source of strain on the
environment from the business is related to shipment of
inventory, which is conducted in accordance with normal
routine commerce.
Adherence to Human Rights Principles. Asetek supports
the fundamental principles of EICC (Electronic Industry
Citizenship Coalition) on human rights, employees’ rights,
child labor, health and safety, environment and
anticorruption. Asetek requires that its suppliers respect
and conform to the same principles. Asetek periodically
reviews via its supplier review and evaluation process
that its suppliers conform to the principles. The principles
can be found at http://www.eicc.info/eicc_code.shtml
Social responsibility program. While the Company has
not at this point developed a formal program of CSR
policies, Asetek complies with the laws and regulations in
each of the countries in which it operates.

Management Report (UNAUDITED)
12 Asetek A/S – Annual Report 2014
Corporate governance
The work of the board of directors
Asetek’s management model and organization are
adapted continuously to ensure the Company is
equipped to manage all obligations to shareholders,
customers, employees, authorities and other
stakeholders to the utmost. In this process, Asetek uses
the corporate governance recommendations from
NASDAQ OMX Copenhagen as an important source of
inspiration. The recommendations can be found at
www.corporategovernance.dk.
The Board of Directors is fundamentally in full agreement
with NASDAQ OMX Copenhagen’s recommendations
about good company governance. Asetek endeavors to
follow the relevant recommendations for the company,
which support the business and ensure value for the
company’s stakeholders. The statutory report on
Corporate Governance, cf. section 107b of the Danish
Financial Statements Act, is available on the Company’s
website: http://asetek.com/media/91620/Form‐for‐
reporting‐on‐the‐recommendations‐on‐corporate‐
governance‐2014.pdf
Dialogue between the company and its shareholders.
The communication between Asetek and shareholders
primarily takes place at the company’s annual general
meeting and via company announcements. Asetek
shareholders are encouraged to subscribe to the e‐mail
service to receive company announcements, interim
management statements, interim reports and annual
reports as well as other news via e‐mail.
The general meeting. The general meeting has the final
authority over the company. The Board of Directors
emphasize that the shareholders are given detailed
information and an adequate basis for the decisions to be
made by the general meeting.
The general meeting elects the Board of Directors, which
currently consists of six members. The board members
are elected for one year at a time with the option for re‐
election.
Amendment of Articles of Association. Unless otherwise
required by the Danish Companies Act, resolutions to
amend the Articles of Association must be approved by
at least 2/3 of the votes cast as well as at least 2/3 of the
voting share capital represented at the General Meeting.
Board responsibilities. The Board of Directors’ main tasks
include participating in developing and adopting the
Company's strategy, performing the relevant control
functions and serving as an advisory body for the
executive management. The Board reviews and adopts
the Company's plans and budgets. Items of major
strategic or financial importance for the Company are
items processed by the Board. The Board is responsible
for hiring the CEO and defining his or her work
instructions as well as setting of his or her compensation.
The Board periodically reviews the Company’s policies
and procedures to ensure that the Group is managed in
accordance with good corporate governance principles,
upholding high ethics.
Financial reporting. The Board of Directors receives
regular financial reports on the Company's business and
financial status.
Notification of meetings and discussion of items. The
Board schedules regular meetings each year. Ordinarily,
the Board meets 4‐6 times a year. The meetings are
typically conducted in either the facility in Aalborg,
Denmark or in San Jose, California. Additional meetings
may be convened on an ad hoc basis.
All Board members receive regular information about the
Company's operational and financial progress in advance
of the scheduled Board meetings.
The Board members also regularly receive operations
reports and participate in strategy reviews. The
Company's business plan, strategy and risks are regularly
reviewed and evaluated by the Board. The Board
Members are free to consult the Company's senior
executives as needed. Ordinarily, the Chairman of the
Board proposes the agenda for each Board meeting.
Besides the Board Members, Board meetings are
attended by the Executive Board. Other participants are
summoned as needed. The Board approves decisions of
particular importance to the Company including the
strategies and strategic plans, the approval of significant
investments, and the approval of business acquisitions
and disposals.
Conflicts of interest. In a situation involving a member of
the Board personally, this member will exclude him or
herself from the discussions and voting on the issue.

Management Report (UNAUDITED)
13 Asetek A/S – Annual Report 2014
Use of Committees. Currently, the Company has a
Nomination Committee, an Audit Committee and a
Compensation Committee.
The Nomination Committee is elected directly by
the General Meeting. The Committee consists of
three members and must be independent from the
Board of Directors and the management, however,
it is recommended that the chairman of the Board
of Directors is a member. The tasks include
proposing candidates for the Board of Directors,
propose remuneration for the Board of Directors as
well as perform the annual assessment of the Board
of Directors. Members: Ib Sønderby (chairman),
Thomas Vogt and Samuel Szteinbaum.
The Audit Committee is elected among the
members of the Board of Directors and has
responsibilities related to financial reporting, the
independent auditor, internal reporting and risk
management. The Committee consists of two
shareholder‐elected Board members. The other
Board members are entitled to attend if they so
desire. Members: Knut Øversjøen (Chairman) and
Chris Christopher.
The Compensation Committee has responsibilities
related to developing proposals for the applicable
remuneration policy and execution of the
Management Board. Members: Samuel Szteinbaum
(Chairman) and Bengt Olof Thuresson.
The Board's self‐evaluation. The Board's composition,
competencies, working methods and interaction are
discussed on an ongoing basis and evaluated formally on
an annual basis. In this connection, the Board also
evaluates its efforts in terms of corporate governance.
The composition of the Board is considered appropriate
in terms of professional experience and relevant special
competences to perform the tasks of the Board of
Directors. The Board of Directors continuously assesses
whether the competences and expertise of members
need to be updated. At least half of the members elected
by the general meeting are independent persons, and
none of the Board members participates in the day‐to‐
day operation of the Company.
A comprehensive list of other management positions
held by the Board members can be found in note 24.
Risk management. Refer to the Risk Exposure and
Management section of the Management Report as well
as Note 3 of the consolidated financial statements.
The board’s authorization to issue shares
At the general meeting held on August 13, 2013 the
Board was authorized to issue shares with a nominal
value of up to DKK 80,000 for the period until August 14,
2018 in connection with employee warrant programs.
At the Board of Directors meeting on April 23, 2014
warrants permitting subscription of up to 118,210 shares
of a nominal value of DKK 0.10 and at an exercise price of
NOK 40.10 per share were issued. The exercise price was
established as the share price (“closing price”) for the
Company’s share as of the prior day. The warrants were
issued to employees and Board members.
At the Board of Directors meeting on August 12, 2014
warrants permitting subscription of up to 32,970 shares
of a nominal value of DKK 0.10 and at an exercise price of
NOK 33.90 per share were issued. The exercise price was
established as the share price (“closing price”) for the
Company’s share as of the prior day. The warrants were
issued to employees and Board members.
In addition to the above, the Board is authorized to buy
and sell Company shares to treasury.
Remuneration of the board of directors
Board members representing their Company’s ownership
interests are not compensated for their services.
Independent board members received share option
grants in lieu of cash remuneration in 2014. Please see
note 24 for further details.
Remuneration of the executive staff
The Remuneration Committee recommends to the
Board, and the Board sets, the terms of employment of
the members of the Management Board. Each year, the
Remuneration Committee undertakes a review of salary
and other remuneration to the CEO as well as for other
members of the Management Board.
A summary of the agreements between the Company
and its management board members pertaining to
termination can be found in note 6.
The option program and the allocation of options to the
employees and Board members are decided upon by the
Board of Directors.

Statement by Management (UNAUDITED)
14 Asetek A/S – Annual Report 2014
The Executive Board and the Board of Directors have
today considered and adopted the Annual Report of
Asetek A/S for the financial year January 1 to December
31, 2014. The annual report is prepared in accordance
with International Financial Reporting Standards as
adopted by the EU and additional Danish disclosure
requirements for listed companies.
In our opinion, the Consolidated Financial Statements
and Financial Statements give a true and fair view of the
financial position at December 31, 2014 of the Group and
the Parent company and of the results of the Group and
Parent company operations and cash flows for 2014.
In our opinion, Management’s Report includes a true and
fair account of the development in the operations and
financial circumstances of the Group and the Parent
company as well as a description of the most significant
risks and elements of uncertainty facing the Group and
the Parent company.
We recommend that the Annual Report be adopted at
the Annual General Meeting.
Aalborg, Denmark
__ April 2015
Executive Board:
________________________________________ ________________________________________
André Sloth Eriksen Peter Dam Madsen
Chief Executive Officer Chief Financial Officer
Board of Directors:
________________________________________ ________________________________________
Samuel Szteinbaum, Chairman Chris J. Christopher
________________________________________ ________________________________________
Jim McDonnell Bengt Olof Thuresson
________________________________________ ________________________________________
Peter Gross Knut Øversjøen

Auditor’s Report
15 Asetek A/S – Annual Report 2014
Independent Auditor's Report

Auditor’s Report
16 Asetek A/S – Annual Report 2014

Profit & Loss (UNAUDITED)
17 Asetek A/S – Annual Report 2014
Asetek A/S
Consolidated Statement of Comprehensive Income For the years ended December 31, 2014 and 2013
The Notes on the following pages are an integral part of these consolidated financial statements.
USD 000's Note 2014 2013
Revenue 4 20,847 20,729
Cost of sales 8 (12,137) (12,680)
Gross profit 8,710 8,049
Research and development (3,556) (4,492)
Selling, general and administrative (14,664) (11,236)
Foreign exchange (loss)/gain (298) (80)
Total operating expenses 8 (18,518) (15,808)
Operating loss (9,808) (7,759)
Finance income 9 2 1,865
Finance costs 9 (89) (830)
Total financial income (expenses) (87) 1,035
Loss before tax (9,895) (6,724)
Income tax benefit 10, 11 1,138 443
Loss for the year (8,757) (6,281)
Other comprehensive income items that may be reclassified
to profit or loss in subsequent periods:
Foreign currency translation adjustments 335 52
Total comprehensive loss (8,422) (6,229)
Loss per share: (in USD)
Basic (0.62) (0.46)
Diluted (0.62) (0.46)
All operations are continuing.

Balance Sheet (UNAUDITED)
18 Asetek A/S – Annual Report 2014
Asetek A/S
Consolidated Balance Sheet As of December 31, 2014 and 2013
The Notes on the following pages are an integral part of these consolidated financial statements.
USD 000's Note 2014 2013
ASSETS
Non‐current assets
Intangible assets 14 2,334 1,823
Property and equipment 15 730 1,096
Other assets 292 330
Total non‐current assets 3,356 3,249
Current assets
Inventory 17 1,102 1,074
Trade receivables and other 16 4,186 4,997
Cash and cash equivalents 4,170 11,663
Total current assets 9,458 17,734
Total assets 12,814 20,983
EQUITY AND LIABILITIES
Equity
Share capital 18 264 264
Share premium 18 64,451 64,357
Accumulated deficit (57,307) (49,490)
Translation reserves 14 (323)
Total equity 7,422 14,808
Non‐current liabilities
Long‐term debt 18, 19 309 243
Other long‐term liabilities ‐ 232
Total non‐current liabilities 309 475
Current liabilities
Short‐term debt 19 300 420
Accrued liabilities 1,255 802
Accrued compensation and employee benefits 882 995
Trade payables 2,646 3,483
Total current liabilities 5,083 5,700
Total liabilities 5,392 6,175
Total equity and liabilities 12,814 20,983

Cash Flows (UNAUDITED)
19 Asetek A/S – Annual Report 2014
Asetek A/S
Consolidated Cash Flow Statement For the years ended December 31, 2014 and 2013
The Notes on the following pages are an integral part of these consolidated financial statements
USD 000's Note 2014 2013
Cash flows from operating activities
Loss for the year (8,757) (6,281)
Depreciation and amortization 14, 15 1,771 2,030
Finance costs (income) 9 87 (1,035)
Income tax expense (income) 10, 11 (1,138) (443)
Impairment of intangible assets 36 62
Cash receipt (payment) for income tax 204 222
Share based payments expense 7 940 593
Changes in trade receivables, inventories, other assets 1,264 (1,109)
Changes in trade payables and accrued liabilities (230) 1,406
Net cash used in operating activities (5,823) (4,555)
Cash flows from investing activities
Additions to intangible assets 14 (1,873) (2,128)
Additions to other assets ‐ (314)
Purchase of property and equipment 15 (172) (631)
Net cash used in investing activities (2,045) (3,073)
Cash flows from financing activities
Cash received for finance of previously purchased equipment 279 ‐
Long‐term deposit received from sub‐lessee ‐ 234
Cash payments on long‐term debt 18, 19 ‐ (3,621)
Funds drawn (paid) against line of credit (141) 57
Cash payments for interest on long‐term debt ‐ (461)
Proceeds from issuance of share capital 18 96 25,099
Cash paid for fees related to IPO 18 ‐ (3,405)
Principal and interest payments on finance leases (145) (42)
Net cash provided by financing activities 89 17,861
Effect of exchange rate changes on cash and cash equivalents 286 182
Net changes in cash and cash equivalents (7,493) 10,415
Cash and cash equivalents at beginning of period 11,663 1,248
Cash and cash equivalents at end of period 4,170 11,663
Supplemental disclosure ‐ non‐cash transactions
Property and equipment acquired on finance leases 15 ‐ 321

Equity (UNAUDITED)
20 Asetek A/S – Annual Report 2014
Asetek A/S
Consolidated Statement of Changes in Equity For the years ended December 31, 2014 and 2013
The Notes on the following pages are an integral part of these consolidated financial statements.
(USD 000's) Share capita l
Share
premium
Trans lation
reserves
Other
reserves
Accumulated
defici t Total
Equity at January 1, 2013 2 3,519 (361) ‐ (43,802) (40,642)
Total comprehensive income for 2013
Loss for the year ‐ ‐ ‐ ‐ (6,281) (6,281)
‐ ‐ 52 ‐ ‐ 52
Total comprehensive loss for 2013 ‐ ‐ 52 ‐ (6,281) (6,229)
Transactions with owners in 2013
Shares issued 75 24,955 ‐ ‐ ‐ 25,030
Less: issuance costs ‐ (3,423) ‐ ‐ ‐ (3,423)
Equity exchange to Asetek A/S 25 (25) ‐ ‐ ‐ ‐
Issuance of treasury shares 14 ‐ ‐ (14)
Conversion of debt 9 3,110 ‐ ‐ ‐ 3,119
Conversion of preferred shares 139 36,221 ‐ ‐ ‐ 36,360
Share based payment expense ‐ ‐ ‐ ‐ 593 593
Transactions with owners in 2013 262 60,838 ‐ (14) 593 61,679
Equity at December 31, 2013 264 64,357 (309) (14) (49,490) 14,808
Total comprehensive income for 2014
Loss for the year ‐ ‐ ‐ ‐ (8,757) (8,757)
‐ ‐ 335 ‐ ‐ 335
Total comprehensive loss for 2014 ‐ ‐ 335 ‐ (8,757) (8,422)
Transactions with owners in 2014
Shares issued ‐ 94 ‐ 2 ‐ 96
Share based payment expense ‐ ‐ ‐ ‐ 940 940
Transactions with owners in 2014 ‐ 94 ‐ 2 940 1,036
Equity at December 31, 2014 264 64,451 26 (12) (57,307) 7,422
Foreign currency translation adjustments
Foreign currency translation adjustments

Notes (UNAUDITED)
21 Asetek A/S – Annual Report 2014
1. General information
Asetek A/S (‘the Company’), and its subsidiaries
(together, ‘Asetek Group’, ‘the Group’ or ‘Asetek’)
designs, develops and markets thermal management
solutions used in computers and datacenter servers. The
Group’s core products utilize liquid cooling technology to
provide improved performance, acoustics and energy
efficiency. The Company is based in Aalborg, Denmark
with offices in USA, China and Taiwan. The Company’s
shares trade on the Oslo Stock Exchange under the
symbol ‘ASETEK’.
In the first quarter of 2013, Asetek Group reorganized as
follows: Asetek Holdings, Inc. was the parent company of
the Asetek Group from August 2008 until February 2013.
Asetek A/S was incorporated in December 2012 and
acquired by Asetek Holdings, Inc. in January 2013. Asetek
A/S became 100% owner of the Asetek Group through
the purchase of all outstanding shares of Asetek Holdings,
Inc. from the shareholders, in exchange for new shares in
Asetek A/S in February 2013.
This reorganization of Asetek Group did not have a
material effect on the Group’s operating results or
consolidated equity. The Group’s results for 2013 and
2014 are therefore presented on a comparative basis in
this report.
2. Summary of significant accounting policies
The principal accounting policies applied in the
preparation of these consolidated financial statements
are set out below. These policies have been consistently
applied to all the years presented, unless otherwise
stated.
2.1. Basis of preparation
The consolidated financial statements have been
prepared on a historical cost convention, in accordance
with International Financial Reporting Standards (IFRS) as
adopted by the European Union (EU) and the
supplementary Danish information requirements for
class D publicly listed companies.
2.2. Consolidation
The consolidated financial statements comprise the
Company and its consolidated subsidiaries. Subsidiaries
are all entities (including structured entities) over which
the Group has control. The Group controls an entity when
the Group is exposed to, or has rights to, variable returns
from its involvement with the entity and has the ability to
affect those returns through its power over the entity.
Subsidiaries are fully consolidated from the date on
which control is transferred to the Group. They are
deconsolidated from the date that control ceases.
Intercompany transactions, balances, income and
expenses on transactions between Group companies are
eliminated. Profits and losses resulting from the
intercompany transactions that are recognized in assets
are also eliminated. Accounting policies of subsidiaries
are consistent with the policies adopted by the Group.
The Group uses the acquisition method of accounting to
account for business combinations. The consideration
transferred for the acquisition of a subsidiary is the fair
values of the assets transferred, the liabilities incurred
and the equity interests issued by the Group. The
consideration transferred includes the fair value of any
asset or liability resulting from a contingent consideration
arrangement. Acquisition‐related costs are expensed as
incurred. Identifiable assets acquired and liabilities and
contingent liabilities assumed in a business combination
are measured initially at their fair values at the
acquisition date. The Group recognizes any non‐
controlling interest in the acquiree on an acquisition‐by‐
acquisition basis either at fair value or at the non‐
controlling interest’s proportionate share of the
acquiree’s net assets. The excess of the consideration
transferred, the amount of any non‐controlling interest
in the acquiree and the acquisition‐date fair value of any
previous equity interest in the acquiree over the fair
value of the identifiable net assets acquired is recorded
as goodwill. If the total of consideration transferred, non‐
controlling interest recognized and previously held
interest measured is less than the fair value of the net
assets of the subsidiary acquired in the case of a bargain
purchase, the difference is recognized directly in the
income statement.
2.3. Foreign currency
Items included in the financial statements of each of the
Group’s entities are measured using the currency of the
primary economic environment in which the entity

Notes (UNAUDITED)
22 Asetek A/S – Annual Report 2014
operates (‘the functional currency’). The functional
currency of the Company’s operations in the United
States of America, Denmark and China are the U.S. dollar,
Danish kroner, and Chinese Yuan Renminbi, respectively.
The consolidated financial statements are presented in
U.S. dollars, which is the Group’s presentation currency.
Foreign currency transactions are translated into the
functional currency using the exchange rates prevailing at
the dates of the transactions. Foreign exchange gains and
losses resulting from the settlement of such transactions
and from the translation at year‐end exchange rates of
monetary assets and liabilities denominated in foreign
currencies are recognized as operating expense in the
income statement in foreign exchange (loss)/gain.
Group companies that have a functional currency
different from the presentation currency are translated
into the presentation currency as follows:
Assets and liabilities for each balance sheet
presented are translated at the closing rate at the
date of that balance sheet;
Income and expenses for each income statement
are translated at average exchange rates;
All resulting exchange differences are recognized in
other comprehensive income
2.4. Property and equipment
Property and equipment are stated at historical cost less
accumulated depreciation. Subsequent costs are
included in the asset’s carrying amount or recognized as
a separate asset, as appropriate, only when it is probable
that future economic benefits associated with the item
will flow to the Group and the cost of the item can be
measured reliably. The carrying amount of any replaced
part is derecognized. All other repairs and maintenance
are charged to the income statement during the financial
period in which they are incurred.
Depreciation is provided over the estimated useful lives
of the depreciable assets, generally three to five years,
using the straight‐line method. The assets’ useful lives are
reviewed, and adjusted if appropriate, at the end of each
reporting period. Gains and losses on disposals are
determined by comparing the proceeds with the carrying
amount and are recognized as operating expenses in the
consolidated income statement. Property and equipment
is grouped as follows:
Group Estimated Useful Life
Leasehold improvements Lesser of 5 years or lease term Plant and machinery 5 years Tools, equipment, fixtures 3 to 5 years
2.5. Research and development
Research costs are expensed as incurred. Costs directly
attributable to the design and testing of new or improved
products to be held for sale by the Group are recognized
as intangible assets within development projects when all
of the following criteria are met:
It is technically feasible to complete the product so
that it will be available for sale;
management intends to complete the product and
use or sell it;
there is an ability to use or sell the product;
it can be demonstrated how the product will
generate probable future economic benefits;
adequate technical, financial and other resources to
complete the development and to use or sell the
product are available; and
the expenditure attributable to the product during
its development can be reliably measured.
Directly attributable costs that are capitalized as part of
the product include the employee costs associated with
development and an appropriate portion of relevant
overheads. Other development expenditures that do not
meet these criteria are recognized as expense when
incurred. Development costs previously recognized as
expense are not recognized as an asset in a subsequent
period. Development costs recognized as assets are
amortized on a straight‐line basis over their estimated
useful lives, which generally range between three and
forty‐eight months. Amortization expense related to
capitalized development costs is included in research and
development expense.
2.6. Impairment of non‐financial assets
Assets that are subject to amortization are reviewed for
impairment whenever events or changes in
circumstances indicate that the carrying amount may not
be recoverable. An impairment loss is recognized for the
amount by which the asset’s carrying amount exceeds its
recoverable amount. The recoverable amount is the
higher of 1) an asset’s fair value less costs to sell or 2) its
value in use. For the purposes of assessing impairment,
assets are grouped at the lowest levels for which there
are separately identifiable cash flows (cash‐generating
units). Non‐financial assets other than goodwill that
previously suffered an impairment are reviewed for
possible reversal of the impairment at each reporting
date.

Notes (UNAUDITED)
23 Asetek A/S – Annual Report 2014
2.7. Financial assets
Recognition and Measurement. The Group determines
the classification of its financial assets at initial
recognition. Financial assets within the scope of IAS 39
are classified as follows:
‘Financial assets at fair value through profit or loss’
are financial assets held for trading, and are
classified as current if they are expected to be
settled within twelve months.
‘Loans and receivables’ are non‐derivative financial
assets with fixed or determinable payments that are
not quoted in an active market. They are classified
as current assets except when they have maturities
of twelve months or more from the balance sheet
date.
‘Available‐for‐sale financial assets’ are all others
that are designated in this category or not classified
in the other categories.
For all years presented, the Group’s financial assets
include only ‘loans and receivables’.
Impairment of financial assets. For financial assets
carried at amortized cost, the Group assesses at the end
of each reporting period whether there is objective
evidence that a financial asset or group of financial assets
is impaired. A financial asset or a group of financial assets
is impaired and impairment losses are incurred only if
there is objective evidence of impairment as a result of
one or more events that occurred after the initial
recognition of the asset (a ‘loss event’) and that loss
event (or events) has an impact on the estimated future
cash flows of the financial asset or group of financial
assets that can be reliably estimated. Evidence of
impairment may include indications that the debtors or a
group of debtors is experiencing significant financial
difficulty, default or delinquency in interest or principal
payments, the probability that they will enter bankruptcy
or other financial reorganization, and where observable
data indicate that there is a measurable decrease in the
estimated future cash flows, such as changes in arrears or
economic conditions that correlate with defaults.
For loans and receivables category, the amount of the
loss is measured as the difference between the asset’s
carrying amount and the present value of estimated
future cash flows (excluding future credit losses that have
not been incurred) discounted at the financial asset’s
original effective interest rate. The carrying amount of
the asset is reduced and the amount of the loss is
recognized in the consolidated income statement. If a
loan or held‐to‐maturity investment has a variable
interest rate, the discount rate for measuring any
impairment loss is the current effective interest rate
determined under the contract. As a practical expedient,
the Group may measure impairment on the basis of an
instrument’s fair value using an observable market price.
If, in a subsequent period, the amount of the impairment
loss decreases and the decrease can be related
objectively to an event occurring after the impairment
was recognized (such as an improvement in the debtor’s
credit rating), the reversal of the previously recognized
impairment loss is recognized in the consolidated income
statement. As of December 31, 2014, the Company has
not incurred any impairment losses on financial assets.
2.8. Financial liabilities
Recognition and measurement. Financial liabilities
within the scope of IAS 39 are classified as financial
liabilities at fair value through profit or loss, loans and
borrowings, or other liabilities. The Group determines
the classification of its financial liabilities at initial
recognition. Financial liabilities are recognized initially at
fair value less, in the case of other liabilities, directly
attributable transaction costs. The measurement of
financial liabilities depends on their classification as
follows:
‘Financial liabilities at fair value through profit or
loss’ are liabilities entered into that do not meet the
hedge accounting criteria as defined by IAS 39. Gains
or losses on liabilities held for trading are recognized
in profit and loss.
‘Other liabilities’ – After initial recognition, interest
bearing debt is subsequently measured at amortized
cost using the effective interest rate method. Gains
and losses are recognized in the income statement
when the liabilities are derecognized as well as
through the amortization process. The calculation
takes into account any premium or discount on
acquisition and includes transaction costs and fees
that are an integral part of the effective interest
rate.
‘Trade payables’ are obligations to pay for goods or
services that have been acquired in the ordinary
course of business from suppliers. Trade payables
are recognized initially at fair value and
subsequently measured at amortized cost using the
effective interest method. Trade payables are
classified as current liabilities if payment is due
within one year or less.
Redeemable convertible preferred shares and
convertible debt are accounted for as specified in
Note 2.14
Offsetting of financial instruments. Financial assets and
financial liabilities are offset and the net amount
reported in the consolidated balance sheet if, and only if,

Notes (UNAUDITED)
24 Asetek A/S – Annual Report 2014
there is a currently enforceable legal right to offset the
recognized amounts and there is an intention to settle on
a net basis, or to realize the assets and settle the liabilities
simultaneously.
2.9. Inventories
Inventories are stated at the lower of actual cost or net
realizable value. Cost is determined using the first‐in,
first‐out (FIFO) method. Net realizable value is the
estimated selling price in the ordinary course of business
less estimated costs necessary to make the sale.
Adjustments to reduce the cost of inventory to its net
realizable value, if required, are made for estimated
excess, obsolescence, or impaired balances.
2.10. Trade receivables
Trade receivables are amounts due from customers for
product sold in the ordinary course of business. Trade
receivables are recognized initially at fair value and
subsequently measured at amortized cost using the
effective interest method, less any provision for
impairment. If collection is expected in one year or less,
trade receivables are classified as current assets.
2.11. Cash and cash equivalents
Cash and cash equivalents includes cash on hand,
deposits with banks, overdrafts and other short‐term
highly liquid investments with original maturities of three
months or less.
2.12. Share capital
Ordinary shares are classified as equity. Incremental
costs directly attributable to the issue of new ordinary
shares or options are shown in equity as a deduction, net
of tax, from the proceeds.
2.13. Share‐based payments
The Company issues options (or warrants) that allow
management and key personnel to acquire shares in the
Company. Through equity‐settled, share‐based
compensation plans the Company receives services from
employees as consideration for equity instruments
options to purchase shares in the Company at a fixed
exercise price. The fair value of the employee services
received in exchange for the grant of the options is
recognized as an expense. The total amount to be
expensed is determined by reference to the fair value of
the options granted, excluding the impact of any non‐
market service and performance vesting conditions. The
grant date fair value of options granted is recognized as
an employee expense with a corresponding increase in
equity, over the period that the employees become
unconditionally entitled to the options (vesting period).
The fair value of the options granted is measured using
the Black‐Scholes model, taking into account the terms
and conditions as set forth in the share option program.
Measurement inputs include share price on
measurement date, exercise price of the instrument,
expected volatility (based on historical volatility of
comparable companies with publicly available share
prices), weighted average expected life of the
instruments (based on historical experience and general
option holder behavior), expected dividends, and the
risk‐free interest rate (based on the U.S. Treasury yield
curve). Service and non‐market performance conditions
attached to the transactions are not taken into account
in determining fair value. At each reporting date, the
Company revises its estimates of the number of options
that are expected to vest based on the non‐market
vesting conditions. The impact of the revision to original
estimates, if any, is recognized in the Statement of
Comprehensive Income, with a corresponding
adjustment to equity.
2.14. Redeemable convertible preferred shares and
convertible debt
In 2012 the Company had redeemable convertible
preferred shares and convertible debt outstanding that
was converted to share capital in the Company’s initial
public offering of common shares (‘IPO’) in March 2013.
See Note 18.
Redeemable convertible preferred shares. The
redeemable preferred shares were recognized initially
upon issuance at the difference between the net
proceeds of the instrument as a whole and the fair value
of the equity conversion option. Because the holders’
ability to redeem these shares upon change in control
generates an unavoidable obligation to deliver cash, the
host instrument and equity conversion option were each
classified as a current liability on the balance sheet prior
to their conversion. Due to the financial protection
provided to its holders with regard to subsequent
offerings, the equity conversion component was
accounted for as a derivative liability and carried at fair
value prior to its conversion at the IPO. Changes in the
fair value of the equity conversion component were
recorded as finance income or cost.
Convertible debt. The Company’s convertible debt
included terms allowing the holders to convert their
portion of the loan to common shares at a discount below
the share price in the event of an initial public offering,
therefore making it a financial instrument with
embedded derivative features. As a result, the Company
designated this financial instrument in its entirety to be

Notes (UNAUDITED)
25 Asetek A/S – Annual Report 2014
valued at fair value through profit or loss as allowed
under IAS 39. Changes in the fair value of the convertible
debt were recorded as finance income or cost.
2.15. Current and deferred income tax
The tax expense for the period comprises current and
deferred tax. Tax is recognized in the income statement,
except to the extent that it relates to items recognized in
other comprehensive income or directly in equity. In this
case, the tax is also recognized in other comprehensive
income or directly in equity, respectively.
The current income tax expense is calculated on the basis
of the tax laws enacted or substantively enacted at the
balance sheet date in the countries where the company
and its subsidiaries operate and generate taxable income.
Management periodically evaluates positions taken in tax
returns with respect to situations in which applicable tax
regulation is subject to interpretation. Management
establishes provisions where appropriate on the basis of
amounts expected to be paid to the tax authorities.
Deferred income tax is recognized, using the liability
method, on temporary differences arising between the
tax bases of assets and liabilities and their carrying
amounts in the consolidated financial statements.
However, deferred tax liabilities are not recognized if
they arise from the initial recognition of goodwill;
deferred income tax is not accounted for if it arises from
initial recognition of an asset or liability in a transaction
other than a business combination that at the time of the
transaction affects neither accounting nor taxable profit
or loss. Deferred income tax is determined using tax rates
(and laws) that have been enacted or substantively
enacted by the balance sheet date and are expected to
apply when the related deferred income tax asset is
realized or the deferred income tax liability is settled.
Deferred income tax assets are recognized only to the
extent that it is probable that future taxable profit will be
available against which the temporary differences can be
utilized.
Deferred income tax assets and liabilities are offset when
there is a legally enforceable right to offset current tax
assets against current tax liabilities and when the
deferred income tax assets and liabilities relate to income
taxes levied by the same taxation authority on either the
same taxable entity or different taxable entities where
there is an intention to settle the balances on a net basis.
2.16. Revenue recognition
Revenue represents sale of the Group’s products to
customers which are principally resellers and original
equipment manufacturers. Revenue is measured at the
fair value of the consideration received or receivable, and
represents amounts receivable for goods supplied, stated
net of discounts, sales tax, returns and after eliminating
sales within the Group.
The Group recognizes revenue when shipment or
delivery has occurred, the amount of revenue can be
reliably measured, and it is probable that future
economic benefits will flow to the entity. Customer
purchase orders and/or contracts are used as evidence of
an arrangement. Delivery occurs when products are
shipped to the specified location and the risks of
obsolescence and loss have been transferred to the
customer. For certain customers with vendor‐managed
inventory, delivery does not occur until product is
acquired by the customer from the vendor‐managed
inventory location. The Company assesses collectability
based primarily on the creditworthiness of the customer
as determined by credit checks and customer payment
history. Customers do not generally have a right of
return.
The Company enters into contracts with the United
States government to deliver products and services
under time and materials and costs‐plus arrangements.
Revenue under such contracts is recorded as costs are
incurred and includes estimated earned fees in
proportion that costs incurred‐to‐date bear to total
estimated costs. The Company also periodically receives
funding awards from government agencies to assist with
the development and testing of specific technologies.
Such awards are recognized over the period that the
costs are incurred and are recorded as an offset to
research and development expense.
2.17. Leases
Leases in which a significant portion of the risks and
rewards of ownership are retained by the lessor are
classified as operating leases. Payments made under
operating leases are charged to the income statement on
a straight line basis over the period of the lease.
The Group leases certain property and equipment. Leases
of property and equipment where the Group has
substantially all the risks and rewards of ownership are
classified as finance leases and the asset is accounted for
as if it has been purchased outright. The amount initially
recognized as an asset is the lower of the fair value of the
leased property and the present value of the minimum
lease payments over the term of the lease.
Finance lease payments are allocated between the
liability and finance charges. The corresponding rental
obligations, net of finance charges, are included in other
long‐term payables. Amounts due within one year are
Notes (UNAUDITED)
26 Asetek A/S – Annual Report 2014
classified as current liabilities. The interest element of the
finance cost is charged to the statement of
comprehensive income over the lease period to produce
a constant periodic rate of interest on the remaining
balance of the liability for each period. The equipment
acquired under finance leases is depreciated over the
shorter of the useful life of the asset and the lease term.
2.18. Provisions
A provision is recognized when the Company has a
present legal or constructive obligation as a result of past
events, it is probable that an outflow of resources will be
required to settle the obligation, and the amount has
been reliably estimated. If the impact of time value is
significant, the provision is calculated by discounting
anticipated future cash flow using a discount rate before
tax that reflects the market’s pricing of the present value
of money and, if relevant, risks specifically associated
with the obligation. Provisions are reviewed at each
balance sheet date and adjusted to reflect the current
best estimate.
2.19. Contingent liabilities
Contingent liabilities are not recognized in the financial
statements. Significant contingent liabilities are
disclosed, with the exception of contingent liabilities
where the probability of the liability occurring is remote.
2.20. Segment reporting
Business segmentation. Beginning in January 2013, the
Group is reporting on two distinct segments: Desktop and
Datacenter. The two segments are identified by their
specific sets of products and specific sets of customers.
The splitting of operating expenses between segments is
based on the company’s best judgment, and done by
using the company’s employee/project time tracking
system and project codes from the accounting system.
Operating expenses that are not divisible by nature (rent,
telecommunication expenses, etc.) have been split
according to actual time spent on the two businesses,
and the company’s best estimate for attribution. Costs
incurred for intellectual property defense, foreign
exchange and headquarters administration have been
classified separately as headquarters costs and excluded
from segment operating expenses as indicated. The CEO
is the Group’s chief operating decision‐maker. The CEO
assesses the performance of each segment principally on
measures of revenue, gross margins, and adjusted
EBITDA.
Geographical segmentation. Each of the Group’s offices
in its three principal geographies fulfills a particular
function that serves the Asetek Group as a whole. The
majority of costs incurred in each of the geographies are
generally incurred for the benefit of the entire Group and
not to generate revenue in the respective geography. As
a result, the financial results of the Group are not divided
between multiple geographical segments for key
operating decision‐making. Revenue and assets by
geography is measured and reported in Note 4,
Geographical information.
2.21. Cash flow statement
The cash flow statement is prepared using the indirect
method.
2.22. Critical accounting estimates and assumptions
The preparation of financial statements in conformity
with IFRS requires management to make estimates and
assumptions that affect the amounts reported in the
financial statements and accompanying notes. Actual
results could differ from those estimates. Areas where
significant judgment has been applied are:
Capitalization of development costs: the Group’s
business includes a significant element of research
and development activity. Under IAS 38, there is a
requirement to capitalize and amortize
development spend to match costs to expected
benefits from projects deemed to be commercially
viable. The application of this policy involves the
ongoing consideration by management of the
forecasted economic benefit from such projects
compared to the level of capitalized costs, together
with the selection of amortization periods
appropriate to the life of the associated revenues
from the product. If customer demand for products
or the useful lives of products vary from
management estimates, impairment charges on
intangibles could increase.
Valuation of deferred tax assets: deferred income
tax assets are recognized to the extent that the
realization of the tax benefit to offset future tax
liabilities is considered to be probable. Due to
historical losses and uncertainty regarding future
taxable profits, the group has not recognized
deferred income tax assets since inception. In
future periods, management will continue to assess
the probability of realization of the assets’ value and
record or adjust the valuation in accordance with IAS
12.
Provision for excess/obsolete inventory:
management’s forecast of revenue by product is a
factor in determination of inventory reserves. If
future customer demand or ordering patterns vary
Notes (UNAUDITED)
27 Asetek A/S – Annual Report 2014
from management estimates, inventory may be
overstated.
Share based compensation: expenditures related to
share based compensation are sensitive to
assumptions used in calculation of fair value. If the
volatility, expected life or risk‐free interest rates
differ materially from management’s assumptions,
the share based compensation expense could
fluctuate.
2.23. Defined contribution plan
In 2008, the Company established a defined contribution
savings plan (the “Plan”) in the U.S. that meets the
requirements under Section 401(k) of the U.S. Internal
Revenue Code. This Plan covers substantially all U.S.
employees who meet the minimum age and service
requirements and allows participants to defer a portion
of their annual compensation on a pre‐tax basis.
Company contributions to the Plan may be made at the
discretion of the board of directors. Through December
31, 2014, there have been no contributions made to the
Plan by the Company.
2.24. Changes in accounting policy and disclosures
Applied new standards and amendments included in
Annual Report for 2014. A number of new standards and
amendments to standards and interpretations are
effective for annual periods beginning after January 1,
2014, and have been applied in preparing these
consolidated financial statements. None of these have a
significant effect on the consolidated financial
statements of the Group.
New standards and amendments not applied in the
Annual Report for 2014. A number of new standards and
amendments to standards and interpretations are
effective for annual periods beginning after January 1,
2014, and have not been applied in preparing these
consolidated financial statements. None of these is
expected to have a significant effect on the consolidated
financial statements of the Group:

Notes (UNAUDITED)
28 Asetek A/S – Annual Report 2014
EU Endorsed as of December 31, 2014
Standard Content Effective date
Amendment to IAS 19: Defined
benefit Plans: Employee
contributions
The amendment sets out more detailed guidance in respect of measurement of
defined benefit plans with employee contributions.
July 1 2014
Annual Improvements 2010‐2012
cycle
Introduces minor amendments to IFRS 2 Share‐based Payment, IFRS 3, Business
combinations, IFRS 8, Operating segments, IFRS 13 Fair Value Measurement, IAS
16, Property, plant and equipment, IAS 24, Related party disclosures, IAS 38,
Intangible assets.
July 1 2014
Annual improvements 2011‐2013
cycle
Introduces minor amendments to IFRS 1 First‐time Adoption of International
Financial Reporting Standards, IFRS 3, Business combination, IFRS 13 Fair Value
Measurement, IAS 40 Investment Property.
July 1 2014
Not endorsed by EU as of December 31, 2014
Standard Content Effective date
Financial assets are classified into three measurement categories: those
measured at fair value through profit or loss, fair value through other
comprehensive income and those measured at amortised cost. The determination
is made at initial recognition. The classification depends on the entity’s business
model for managing its financial instruments and the contractual cash flow
characteristics of the instrument.
Changes in fair value of non‐derivative financial l iabil ities which are designated
at fair value are recognized in other comprehensive income.
The standard introduces a new hedge accounting model that is designed to be
more closely aligned with risk management activities.
Among other amendments, it introduces the possibil ity to hedge portions of non‐
financial items, the possibil ity to defer recognition of option premiums in cash
flows hedges and an option to designate commodity contracts at fair value
through profit or loss if this eliminates or significantly reduces an accounting
mismatch. Finally, the standard introduces new impairment provisions based on
an expected loss model.
IFRS 9, Financial instruments January 1
2018

Notes (UNAUDITED)
29 Asetek A/S – Annual Report 2014
3. Risk management and debt
The group’s activities expose it to a variety of risks:
liquidity risk, market risk (including foreign exchange risk
and interest rate risk) and credit risk. The primary
responsibility for Asetek’s risk management and internal
controls in relation to the financial reporting process
rests with executive management. Asetek’s internal
control procedures are integrated in the accounting and
reporting systems and include procedures with respect to
review, authorization, approval and reconciliation.
Management is in charge of ongoing efficient risk
management, including the identification of material
risks, the development of systems for risk management,
and that significant risks are routinely reported to the
board of directors.
Liquidity risk. The Group has incurred losses from
operations and negative cash flows from operations since
inception. In 2013, the Group secured liquidity through
its initial public offering of common shares. Previously
the Group has issued convertible preferred shares,
convertible debt and notes payable to shareholders, and
continues to secure bank lines of credit and trade
receivables financing. The Group’s corporate finance
team monitors risk of a shortage of funds through regular
updates and analysis of cash flow projections and
maturities of financial assets and liabilities. The finance
teams also review liquidity, balance sheet ratios (such as
days’ sales outstanding, inventory turns) and other
metrics on a regular basis to ensure compliance both on
a short‐ and long‐term basis.
The following are contractual maturities of financial
liabilities, including estimated interest payments on an
undiscounted basis.
Debt Maturities
Market risk factors. The Group’s current principal
financial liabilities consist of short‐term debt on revolving
lines of credit. The Group’s financial assets mainly
comprise trade receivables, cash and deposits. The
Group’s operations are exposed to market risks,
principally foreign exchange risk and interest rate risk.
(a) Foreign exchange risk. With few exceptions,
the Group’s inventory purchase and sale transactions are
denominated in U.S. dollars. The Group operates
internationally and is exposed to foreign exchange risk
arising from currency exposures, principally with respect
to the Danish kroner. Foreign exchange risk arises from
operating results and net assets associated with
Denmark‐based operations where the Danish krone is the
functional currency. The Company’s Denmark entity has
a revolving line of credit available totaling 2.0 million
Danish kroner ($0.3 million). The Group does not enter
into derivatives or other hedging transactions to manage
foreign exchange risk. Management mitigates this
exposure through timely settlement of intercompany
operating liabilities.
The ending exchange rate at December 31, 2014 was 6.12
Danish kroner to one U.S. dollar (5.41 to the U.S. dollar at
December 31, 2013). The effect of a 10% strengthening
As of December 31, 2014
(USD 000's) On Demand
Less than 3
months
3 to 12
months 1 to 5 years Total
Line of credit (223) ‐ ‐ ‐ (223)
Finance leases ‐ (23) (54) (309) (386)
Lease deposit ‐ ‐ (204) ‐ (204)
Trade payables and accrued liabilities (223) (3,994) (362) ‐ (4,579)
(446) (4,017) (620) (309) (5,392)
As of December 31, 2013
(USD 000's) On Demand
Less than 3
months
3 to 12
months 1 to 5 years Total
Line of credit (364) ‐ ‐ ‐ (364)
Finance leases ‐ (14) (42) (243) (299)
Lease deposit ‐ ‐ ‐ (232) (232)
Trade payables and accrued liabilities ‐ (4,880) (399) ‐ (5,280)
(364) (4,894) (441) (475) (6,175)

Notes (UNAUDITED)
30 Asetek A/S – Annual Report 2014
(weakening) of the Danish kroner against the U.S. dollar
for the reporting period would have resulted in an
increase (decrease) in post‐tax loss for fiscal year 2014 of
$23,000 and comparable increase in 2013 of $287,000.
(b) Interest rate risk. As of December 31, 2014,
Asetek had the following debt outstanding that is subject
to interest rate risk:
Line of credit with Sydbank – 2.0 million Danish
kroner revolving line of credit available to Asetek
A/S. Total line in USD is approximately $0.3 million,
$0.2 million of which was outstanding at December
31, 2014. The line carries interest at the Danish
CIBOR 3 rate plus 4.5 percentage points, which in
total was 4.8% at December 31, 2014. Based on the
line’s revolving, short‐term nature, interest rate risk
is not significant.
Capital and debt management. Because the Company is
in the relatively early stages of developing its market, its
primary focus has been to support its product
development initiatives, maintain liquidity through use of
financing alternatives, and maximize shareholder value.
The Group manages its capital and debt structure with
consideration of economic conditions. In March 2013, the
Company completed an initial public offering on the Oslo
Stock Exchange, raising net $21.4 million, to support its
market strategies and liquidity needs. In the first quarter
2015, the Company raised $11.6 million of net proceeds
through a private placement of equity (reference Note
25). With regard to future capital needs, the Company
will continue to consider both equity and debt financing
strategies.
Credit risk factors. Credit risk refers to the risk that a
counterparty will default on its contractual obligations
resulting in financial loss to the Group. The Group is
exposed to credit risk primarily through trade receivables
and cash deposits. Management mitigates credit risk
through standard review of customer credit‐worthiness
and maintaining its liquid assets principally with
reputable banks, principally Wells Fargo Bank in the U.S.
and Sydbank in Denmark. The carrying amount of the
financial assets represents the maximum credit exposure.
Trade receivables that are deemed uncollectible are
charged to expense with an offsetting allowance
recorded against the trade receivable. In 2014, two
customers accounted for 32% and 18% of revenues,
respectively. In 2013, three customers accounted for
26%, 22% and 10% of revenues, respectively. At
December 31, 2014, three customers represented 36%,
15% and 14% of outstanding trade receivables,
respectively. At December 31, 2013, one customer
represented 24% of outstanding trade receivables. The
reserve for uncollectible trade accounts was $48,000 at
December 31, 2014 (2013: $441,000). The aged trade
receivables and bad debt reserve balances for all years
presented are provided in Note 16.
The maximum exposure to credit risk at the reporting
dates was:
4. Geographical information
The Group operates internationally in several
geographical areas mainly in Asia, Europe and the
Americas.
The following table presents the Group’s revenue and
assets in each of the principal geographical areas:
Revenue in Denmark (country of domicile) was $0.1
million in 2014 ($0.1 million in 2013). Non‐current assets
(USD 000's) 2014 2013
Cash and cash equivalents 4,170 11,663
Trade receivables and other 4,186 4,997
Other assets 292 330
Maximum credit exposure 8,648 16,990
Current Non‐current
Revenue assets assets
Asia 15,344 2,641 12
Americas 3,697 1,302 609
Europe 1,806 5,515 2,734
Total 20,847 9,458 3,356
Current Non‐current
Revenue assets assets
Asia 15,801 3,967 19
Americas 2,464 1,450 537
Europe 2,464 12,317 2,693
Total 20,729 17,734 3,249
(USD 000's)
2014
(USD 000's)
2013

Notes (UNAUDITED)
31 Asetek A/S – Annual Report 2014
in Denmark were $2.7 million in 2014 ($2.7 million in
2013).
For the purpose of the above presentation, the
information pertaining to revenue and current assets is
calculated based on the location of the customers,
whereas information pertaining to non‐current assets is
based on the physical location of the assets. The
information pertaining to current assets is calculated as a
summation of assets such as trade receivables and
finished goods inventories reasonably attributable to the
specific geographical area.
5. Segment information
From Company inception through December 2012, all
Asetek operations were considered to be one segment:
Desktop. Beginning in January 2013, the Group added a
second segment: Data center. The Desktop and Data
center segments are identified by their specific sets of
products and specific sets of customers. The CEO is the
Group’s chief operating decision‐maker. The CEO
assesses the performance of each segment principally on
measures of revenue, gross margins, and adjusted
EBITDA. The following tables represent the results by
operating segment in 2014 and 2013.

Notes (UNAUDITED)
32 Asetek A/S – Annual Report 2014
6. Salary costs and remunerations
Condensed income statement ‐ years ended December 31,
(USD 000's) Desktop
Data
center
Not
allocable
to
divisions Total Desktop
Data
center
Not
allocable
to
divisions Total
Revenue 19,318 1,529 ‐ 20,847 19,925 804 ‐ 20,729
Cost of goods sold, less depreciation 11,124 956 ‐ 12,080 11,781 639 112 12,532
Gross profit 8,194 573 ‐ 8,767 8,144 165 (112) 8,197
Operating costs 4,915 6,102 4,847 15,864 3,845 6,560 2,928 13,333
Adjusted EBITDA 3,279 (5,529) (4,847) (7,097) 4,299 (6,395) (3,040) (5,136)
Depreciation in cost of goods 57 ‐ ‐ 57 148 ‐ ‐ 148
Depreciation in operating expense 622 1,092 ‐ 1,714 1,411 471 ‐ 1,882
Share based compensation 320 426 194 940 206 292 95 593
Financial income (expenses) ‐ ‐ (87) (87) ‐ ‐ 1,035 1,035
Income (loss) before tax 2,280 (7,047) (5,128) (9,895) 2,534 (7,158) (2,100) (6,724)
Condensed balance sheet ‐ as of December 31,
(USD 000's) Desktop
Data
center
Not
allocable
to
divisions Total Desktop
Data
center
Not
allocable
to
divisions Total
Total investment 2,770 1,515 3,138 7,422 3,050 2,022 9,736 14,808
Total assets 4,985 2,273 5,556 12,814 5,585 2,974 12,424 20,983
Total l iabil ities 2,215 758 2,419 5,392 2,536 952 2,687 6,175
Changes in intangible assets ‐ years ended December 31,
(USD 000's) Desktop
Data
center
Not
allocable
to
divisions Total Desktop
Data
center
Not
allocable
to
divisions Total
Opening balance, intangible assets 602 1,221 ‐ 1,823 1,360 88 ‐ 1,448
Gross additions 834 1,038 ‐ 1,872 580 1,548 ‐ 2,128
Amortization and other (500) (861) ‐ (1,361) (1,338) (415) ‐ (1,753)
Ending balance, intangible assets 936 1,398 ‐ 2,334 602 1,221 ‐ 1,823
2014 2013
2014 2013
2014 2013
(USD 000's) 2014 2013
Salaries 6,877 6,515
Retirement fund contributions 68 93
Social cost 127 247
Share based payment 940 593
Other expenses 250 18
8,262 7,465
Capitalized as development cost (1,318) (1,518)
6,944 5,947
Average number of employees 68 65
Total personnel expenses before
capitalization
Total personnel expenses in statement
of income
The staff costs are specified as follows:
(USD 000's) 2014 2013
Research and development 2,521 2,788
Selling, general and administrative 5,741 4,677
8,262 7,465
Total personnel expenses before
capitalization

Notes (UNAUDITED)
33 Asetek A/S – Annual Report 2014
The figures listed include incentive based compensation
for management and staff. Incentive based
compensation is based on a combination of quarterly
cash based rewards and periodic grants of options (or
warrants) to buy the Company’s common shares. The
bonus plan for the CEO is approved by the Board of
Directors at the beginning of the year and the bonus
payments for the CEO and the upper management are
reviewed by the Board of Directors on an annual basis. All
bonus plans are structured to include an absolute dollar
cap.
The Company’s CEO has an agreement of six months’
severance pay in case of termination or termination in
connection with change of control. The Company’s CFO
has an agreement of six months’ severance pay in case of
termination and paid relocation to Denmark. Except for
the Company’s CEO and CFO, no member of the
administrative, management or supervisory bodies has
contracts with the Company or any of its subsidiaries
providing for benefits upon termination of employment.
As of December 31, 2014, The Company’s CEO, André
Eriksen, held 391,862 common shares of the Company
and 14,688 options exercisable at $0.96 per share, 96,167
warrants exercisable at NOK36.50 per share and 24,750
warrants exercisable at NOK40.10 per share. The
Company’s CFO, Peter Dam Madsen, held 64,441
common shares of the Company and 14,221 options
exercisable at $0.96 or $0.94 per share, 37,800 warrants
exercisable at NOK36.50 per share, and 10,313 warrants
exercisable at NOK40.10 per share.
7. Share based payment
Asetek’s Equity Incentive Plan (‘the Plan’) is a share
option program where the employees and other parties
that deliver services to the Group have been granted
share options (or warrants). The options, if vested and
executed, will be settled in common shares of the
Company.
The options are granted at the time of employment and,
at the discretion of the Board of Directors, under other
circumstances. The options are granted with exercise
prices equaling the fair market value of the underlying
security. Prior to initial public offering (IPO) of the
Company’s shares on the Oslo Stock Exchange, the fair
market value of the shares was estimated based on
valuations prepared periodically by external valuation
experts. Subsequent to the IPO, the exercise prices of
option grants are determined based on the closing
market price of the shares on the day of the grant. Share
based compensation expense was $940,000 and
$593,000 for the years ended December 31, 2014 and
2013, respectively.
The Plan was adopted by the Board of Directors in 2008
and has the following purpose:
To attract and retain the best available personnel for
positions of substantial responsibility;
to provide additional incentive to employees,
directors and consultants, and
to promote the success of the Company’s business.
As of December 31, 2014 there is a total of 1,848,187
common shares authorized under the Plan.
In August, 2014, 32,970 warrants were granted with
exercise prices of NOK33.90 ($5.50) per share. In April
2014, 118,210 warrants were granted with exercise
prices of NOK40.10 ($6.70) per share. In October 2013,
670,728 warrants were granted with exercise prices of
NOK 36.50 ($6.11) per share. In January 2013, 20,000
options were granted with exercise prices of $0.96 per
share. Movements in the number of share options
outstanding and their related weighted average exercise
price are as follows:
Compensation to the Board of Directors and Officers in 2014
(USD 000's) Remuneration Options Total
Board of Directors ‐ 160 160
Officers 824 194 1,018
824 354 1,178
Compensation to the Board of Directors and Officers in 2013
(USD 000's) Remuneration Options Total
Board of Directors ‐ 145 145
Officers 1,019 99 1,118
1,019 244 1,264
Number of
Date of authorization options
March 2013 1,048,187
August 2013 800,000
Total number of options authorized 1,848,187

Notes (UNAUDITED)
34 Asetek A/S – Annual Report 2014
Of the options and warrants outstanding at December 31, 2014, 268,416 have an exercise price of $0.94 per share, 217,657
options have an exercise price of $0.96 per share, 26,626 warrants have an exercise price of $5.50 per share, 620,143
warrants have an exercise price of $6.11 per share, 118,210 warrants have an exercise price of $6.70 per share and zero
warrants have an exercise price of $7.12 per share. The weighted average remaining contractual term is 4.75 years. The
Company calculated the fair value of each option award on the date of grant using the Black‐Scholes option pricing model.
The warrants granted in 2014 have an estimated total value of $346,000. The options and warrants granted in 2013 have
an estimated total value of $1,311,000. The following weighted average assumptions were used for the period indicated.
Prior to the Company’s IPO in March 2013, the fair value of common shares underlying the share options and equity awards
has historically been determined by management with input from independent third‐party valuation firms. All options are
intended to be exercisable at a price per share not less than the per share fair market value of the common shares underlying
those options on the date of grant.
Weighted Weighted
Average Average
Exercise Exercise
Option activity ‐ exercise prices of $0.94 and $0.96 2014 Price 2013 Price
Outstanding on January 1 597,461 0.95 946,783 0.95
Options/warrants granted ‐ ‐ 20,000 0.96
Options/warrant adjustment to granted ‐ ‐ (33,500) 0.96
Options/warrants exercised (99,758) 0.94 (333,172) 0.94
Options/warrants forfeited (11,630) 0.96 (2,650) 0.94
Outstanding on December 31 486,073 0.95 597,461 0.95
Exercisable on December 31 445,258 0.95 476,960 0.95
Weighted Weighted
Average Average
Exercise Exercise
Option activity ‐ exercise prices of $5.50 to $7.12 2014 Price 2013 Price
Outstanding on January 1 691,874 6.14 ‐ ‐
Adjustment for beginning outstanding ‐ ‐ 39,146 7.12
Options/warrants granted 151,180 6.44 670,728 6.11
Options/warrants exercised (1,917) 6.11 ‐ ‐
Options/warrants forfeited (76,158) 6.34 (18,000) 7.12
Outstanding on December 31 764,979 6.18 691,874 6.14
Exercisable on December 31 290,323 6.18 83,213 6.37
Valuation assumptions 2014 2013
Risk‐free interest rate 1.0% ‐ 1.6% 0.9% ‐ 1.3%
Dividend yield 0.0% 0.0%
Expected life of options (years) 3.5 ‐ 4.6 3.5 ‐ 4.6
Expected volatility 33% ‐ 55% 45% ‐ 57%

Notes (UNAUDITED)
35 Asetek A/S – Annual Report 2014
8. Expenses by nature
9. Finance costs and income
The income (loss) on fair value of convertible preferred
shares and the loss on convertible loan in 2013 were non‐
cash transactions resulting from recording the
instruments at fair value at period end. Income on the
conversion of preferred shares and convertible loan
outstanding was recognized as a result of the Company’s
IPO in March 2013.
10. Income taxes
Tax on profit/loss for the year is specified as follows:
The tax benefit for 2014 represents principally credits
realized in Denmark associated with investment in
research and development. The tax benefit on the
group’s loss before tax differs from the theoretical
amount that would arise using the weighted average tax
rate applicable to profits of the consolidated entities as
follows:
(USD 000's) 2014 2013
Inventories recognized as cost of sales (Note 17) 12,080 12,532
Personnel expenses (Note 6) 8,262 7,465
Depreciation and amortization 1,771 2,030
Legal, patent, consultants and auditor 6,270 4,158
Facilities and infrastructure 1,204 1,218
Other expenses 2,941 3,213
Total operating expenses before capitalization 32,528 30,616
Less: capitalized costs for development projects (Note 14) (1,873) (2,128)
Total expenses 30,655 28,488
Depreciation and amortization expense by classification on the income statement is as follows:
(USD 000's) 2014 2013
Depreciation and amortization included in:
Cost of sales 57 148
Research and development 907 1,689
Selling, general and administrative 807 193
Total 1,771 2,030
(USD 000's) 2014 2013
Income (loss) on fair value of convertible preferred shares ‐ 848
Income (loss) on fair value of convertible loan ‐ 821
Non‐cash items included in finance costs and income ‐ 1,670
Interest cost on line of credit, note payable (12) (369)
Income (loss) on foreign currency translation of cash deposits, net ‐ (267)
Interest cost on finance lease (22) (3)
Other bank fees and income, net (53) 4
Total finance (costs) / income (87) 1,035
(USD 000's) 2014 2013
Current income tax benefit 1,138 443
Deferred income tax ‐ ‐
Tax benefit 1,138 443
(USD 000's) 2014 2013
Loss before tax (9,895) (6,724)
2,722 2,154
Tax effects of:
(169) (107)
(1,415) (1,604)
Tax benefit 1,138 443
Tax benefit calculated at
domestic rates applicable to
profits/losses in respective
countries
Expenses not deductible for
tax purposes
Tax losses for which no asset
was recognized

Notes (UNAUDITED)
36 Asetek A/S – Annual Report 2014
11. Deferred income tax
Deferred income tax assets are recognized to the extent
that the realization of the related tax benefit is probable.
Due to uncertainty in realizability, the group did not
recognize deferred income tax assets of $15,201
thousand (2013: $14,762 thousand), in respect of losses
amounting to $68,080 thousand (2013: $67,124
thousand) that can be carried forward against future
taxable income. Losses of the U.S. parent company and
the U.S. subsidiary will begin to expire in 2017 and losses
of the Denmark subsidiary do not expire.
The group did not recognize deferred tax liabilities
resulting to temporary differences of $428 thousand
(2013: $322 thousand) in respect of costs deducted in
taxation but not in bookkeeping amounting to $2,201
thousand (2013: $1,717 thousand).
In accordance with IAS 12, because of the history of
recent losses, the Company recognizes deferred tax
assets arising from unused tax losses or tax credits only
to the extent that the entity has sufficient taxable
temporary differences or there is convincing other
evidence that sufficient taxable profit will be available
against which the unused tax losses or unused tax credits
can be utilized by the Company. As of December 31, 2014
and 2013, no deferred tax assets have been recorded by
the Company.
12. Earnings (losses) per share
The Company completed a public offering of its common
shares in March 2013 and its shares have since been
trading publicly on the Oslo Stock Exchange. IAS 33
requires disclosure of basic and diluted earnings per
share for entities whose shares are publicly traded.
Basic earnings per share is calculated by dividing the
profit or loss attributable to equity holders of the
Company by the weighted average number of common
shares outstanding during the period. Diluted earnings
per share is calculated by adjusting the number of
common shares outstanding used in the Basic calculation
for the effect of dilutive equity instruments, which
include options, warrants and debt or preferred shares
that are convertible to common shares, to the extent
their inclusion in the calculation would be dilutive.
Potential dilutive instruments are not included in the
calculation of diluted loss per share for the periods
presented because the effect of including them would be
anti‐dilutive and reduce the loss per share.
In accordance with IAS 33, weighted average shares
outstanding for 2013 has been adjusted to reflect the IPO
and conversion of shares that occurred in 2013, as if the
IPO and conversion of shares had occurred on January 1,
2013.
13. Financial instruments category and fair value estimation
The Company uses the following valuation methods for
fair value estimation of its financial instruments:
Quoted prices (unadjusted) in active markets (Level
1).
Inputs other than quoted prices included within
level 1 that are observable for the asset or liability,
either directly (as prices) or indirectly (derived from
prices) (Level 2).
Inputs for the asset or liability that are not based on
observable market data (unobservable inputs)
(Level 3).
All of the Company’s financial assets as of December 31,
2014 are classified as ‘loans and receivables’ having fixed
or determinable payments that are not quoted in an
2014 2013
Loss attributable to equity holders
of the Company (USD 000's) (8,757)$ (6,281)$
Weighted average number of
common shares outstanding
(000's) 14,123 13,795
Basic loss per share (0.62)$ (0.46)$
Diluted loss per share (0.62)$ (0.46)$

Notes (UNAUDITED)
37 Asetek A/S – Annual Report 2014
active market (Level 3). As of December 31, 2014, all of
the Company’s financial liabilities are carried at
amortized cost.
The Company believes that book value approximates fair
value for all financial instruments as of December 31,
2014. The values of the Group’s assets and liabilities are
as follows:
14. Intangible assets
The Group routinely incurs costs directly attributable to
the design and testing of new or improved products to be
held for sale. These costs are capitalized as intangible
assets and amortized over the estimated useful lives of
the products, typically three to forty eight months. The
following table presents a summary of these
development projects.
Impairment tests are performed on completed assets
whenever there are indications of a need for write‐offs
and for assets still in development regardless of whether
there have been indications for write downs. If the value
of expected future free cash flow of the specific
development project is lower than the carrying value, the
asset is written down to the lower value. The booked
value includes capitalized salary expenses and other net
assets for the cash flow producing project. Expected
future free cash flow is based on budgets and
anticipations prepared by management. The main
parameters are the development in revenue, EBIT and
working capital.
As of December 31, 2014
(USD 000's)
Loans and
receivables
Assets as per balance sheet:
Trade receivables and other 4,186
Cash and cash equivalents 4,170
8,356
As of December 31, 2014
(USD 000's)
Liabilities at fair
value through
profit and loss
Other financial
liabilities at
amortized cost Total
Liabilities as per balance sheet:
Long‐term debt ‐ 309 309
Short‐term debt ‐ 300 300
Trade payables and accrued liabilities ‐ 4,783 4,783
‐ 5,392 5,392
(USD 000's) 2014 2013Cost:
Balance at January 1 5,611 4,171
Additions 1,873 2,128
Deletions ‐ completion of useful life (2,443) (384)
Impairment loss (175) (304)
Balance at December 31 4,866 5,611
Accumulated amortizationand impairment losses:
Balance at January 1 (3,788) (2,723)
Amortization for the year (1,326) (1,692)
Amortization associated with deletions 2,443 384
Amortization associated with impairment losses 139 243
Balance at December 31 (2,532) (3,788)
Carrying amount 2,334 1,823

Notes (UNAUDITED)
38 Asetek A/S – Annual Report 2014
15. Property and equipment
The following table presents a summary of property and equipment activity.
At December 31, 2014, property and equipment includes
leased equipment at a gross value of approximately
$505,000 which had accumulated amortization of
$197,000. (2013: gross value of $352,000 and
accumulated amortization of $31,000).
(USD 000's)
Leasehold
improvements Machinery
Other fixtures,
fittings, tools,
equipment Total
Cost:
Balance at January 1, 2013 133 1,205 359 1,697
Additions 170 659 125 954
Disposals (35) (28) (34) (97)
Exchange rate difference 7 56 16 79
Balance at December 31, 2013 275 1,892 466 2,633
Balance at January 1, 2014 275 1,892 466 2,633
Additions 25 98 49 172
Disposals (1) (67) (37) (105)
Exchange rate difference (22) (162) (43) (227)
Balance at December 31, 2014 277 1,761 435 2,473
Acccumulated depreciations
Balance at January 1, 2013 (59) (905) (293) (1,257)
Disposals 35 28 34 97
Depreciations for the year (34) (255) (50) (339)
Exchange rate differences (1) (26) (11) (38)
Balance at December 31, 2013 (59) (1,158) (320) (1,537)
Balance at January 1, 2014 (59) (1,158) (320) (1,537)
Disposals ‐ 67 36 103
Depreciations for the year (58) (319) (65) (442)
Exchange rate differences 4 99 30 133
Balance at December 31, 2014 (113) (1,311) (319) (1,743)
Carrying amount at December 31, 2013 216 734 146 1,096
Carrying amount at December 31, 2014 164 450 116 730

Notes (UNAUDITED)
39 Asetek A/S – Annual Report 2014
16. Trade receivables and other
Trade receivables are non‐interest bearing and are
generally on payment terms of Net 30 days.
The trade receivables of Asetek Danmark A/S carry a
general lien of 4 million Danish krone ($0.7 million),
representing collateral on Sydbank’s engagement with
the Company. The carrying amount of trade receivables
is approximately equal to fair value due to the short term
to maturity. Regarding credit risks, refer to Note 3.
A summary of the activity in the provision for
uncollectible accounts is as follows:
Other receivables. Other receivables at December 31,
2014 include $1.0 million of income tax benefit
receivable. Refer to Note 10.
Included in other receivables at December 31, 2013 was
an award from the Danish government of 1.82 million
Danish krone ($336,000). This receivable represented a
subsidy awarded to fund the development and testing of
a prototype solution for sealed server cooling, and was
collected in full by the Company in April 2014. Amounts
received under this grant were recorded as a reduction
to research and development expense. There are no
receivables outstanding related to this project at
December 31, 2014.
17. Inventories
(USD 000's) 2014 2013
Gross trade receivables 3,040 4,721
(48) (441)
Net trade receivables 2,992 4,280
Other receivables and assets 1,194 717
4,186 4,997
Total trade receivables
and other
Provision for
uncollectible accounts
The aging of trade receivables as of the reporting date is as follows:
(USD 000's) Total
0 to 30
days
31 to 60
days
61 to 90
days
Over 90
days
December 31, 2014 3,040 1,971 863 152 54
December 31, 2013 4,721 3,304 1,174 193 50
(USD 000's) 2014 2013
Balance at January 1 (441) (162)
Additions (48) (441)
Reversals 441 162
Balance at December 31 (48) (441)
(USD 000's) 2014 2013
Raw materials 551 572
Work in process ‐ ‐
Finished goods 629 597
Total gross inventories 1,180 1,169
Less: provision for inventory reserves (78) (95)
Total net inventories 1,102 1,074
(USD 000's) 2014 2013
Inventories recognized as cost of sales during the period (12,080) (12,532)
Write‐down of inventories to net realizable value (80) (95)

Notes (UNAUDITED)
40 Asetek A/S – Annual Report 2014
A summary of the activity in the provision for inventory reserves is as follows:
18. Share capital, reorganization, initial public offering and debt conversion
In February 2013, Asetek Group reorganized when Asetek
A/S became 100% owner of the Asetek Group through
the purchase of all outstanding shares of Asetek Holdings,
Inc. from the shareholders, in exchange for new shares in
Asetek A/S. The reorganization resulted in a $25
thousand increase in par value of common shares and
corresponding decrease in share premium at the
exchange date.
In March 2013, the Company completed an initial public
offering (IPO) of 4.0 million new common shares offered
by Asetek A/S on the Oslo Stock Exchange at an offering
price per share of 36.00 Norwegian kroner
(approximately $6.20 USD per share). The Company
raised funds totaling $21.4 million, after deduction of
$3.4 million of offering costs.
Conversion of preferred shares. In March 2013, at the
time of the IPO, all of the Company’s preferred shares
outstanding, carried as current liabilities of $37.1 million
at December 31, 2012, converted to common shares.
The Company recognized $0.8 million income on the
revaluation of the preferred shares at the time of
conversion. After conversion of these shares, the
Company now has one class of shares outstanding.
Conversion of loan. In October 2012, the Company
entered into an unsecured convertible loan agreement
with seven investors to raise $3.0 million to be used for
working capital in preparation for an IPO. Interest
accrued from the loan date at a stated annual rate of 10%
and was due to be paid quarterly beginning in September
2014. At the time of the IPO in March 2013, $2.4 million
of the principal value of the loan was converted to
common shares at a discount of 20% below the IPO share
price. In the first half of 2013, the remaining $0.6 million
of principal was repaid by the Company, plus interest and
a 5% repayment fee. As a result of these transactions,
the Company recognized $0.8 million non‐cash income
on conversion of the loan in 2013.
At the time of the reorganization, the Company reserved
1,150 thousand shares (8% of total shares, nominal value
DKK 115 thousand) for future exercises of options. In
2014, a total of 102 thousand options (0.7% of total
shares, nominal value DKK 10 thousand) were exercised
resulting in $0.1 million funds received by the Company.
In 2013, a total of 333 thousand options (2% of total
shares, nominal value DKK 33 thousand) were exercised
resulting in $0.3 million funds received by the Company.
As of December 31, 2014, there are 14,165 thousand
common shares outstanding with a nominal value of 0.10
DKK per share and 718 thousand shares (4.9% of total
shares, nominal value DKK 73 thousand) held in treasury.
Included in equity is a reserve for treasury shares of
approximately $12,000 at December 31, 2014.
The following table summarizes common share activity in the years presented:
Refer to ‘Shareholder information’ in this report for information on the composition of Asetek shareholders.
(USD 000's) 2014 2013
Balance at January 1 (95) (98)
Additions (80) (95)
Write‐offs 97 98
Balance at December 31 (78) (95)
(000's) 2014 2013
Common shares outstanding ‐ January 1 14,064 1,578
Exchange of outstanding Asetek Holdings, Inc. shares ‐ (1,578)
Issuance of Asetek A/S shares ‐ 2,728
Treasury shares ‐ (1,150)
Conversion of preferred shares ‐ 7,660
Conversion of debt ‐ 493
Offering of new shares in IPO ‐ 4,000
Options exercised 101 333
Common shares outstanding ‐ December 31 14,165 14,064
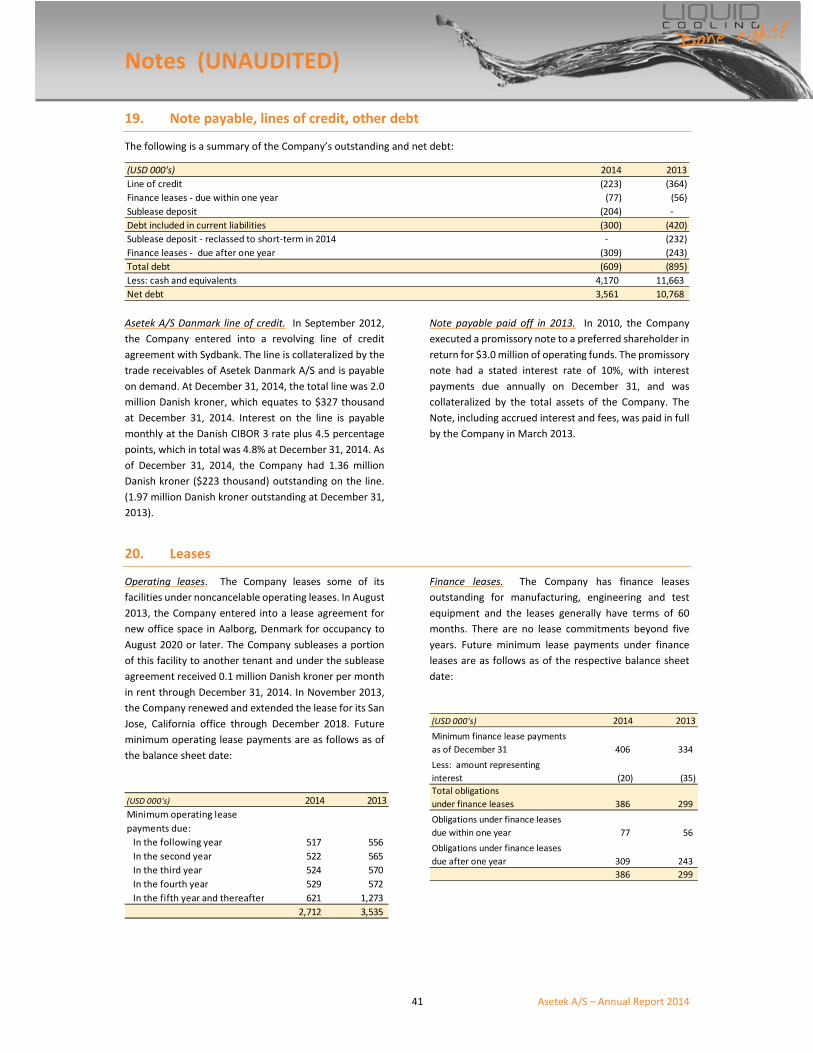
Notes (UNAUDITED)
41 Asetek A/S – Annual Report 2014
19. Note payable, lines of credit, other debt
The following is a summary of the Company’s outstanding and net debt:
Asetek A/S Danmark line of credit. In September 2012,
the Company entered into a revolving line of credit
agreement with Sydbank. The line is collateralized by the
trade receivables of Asetek Danmark A/S and is payable
on demand. At December 31, 2014, the total line was 2.0
million Danish kroner, which equates to $327 thousand
at December 31, 2014. Interest on the line is payable
monthly at the Danish CIBOR 3 rate plus 4.5 percentage
points, which in total was 4.8% at December 31, 2014. As
of December 31, 2014, the Company had 1.36 million
Danish kroner ($223 thousand) outstanding on the line.
(1.97 million Danish kroner outstanding at December 31,
2013).
Note payable paid off in 2013. In 2010, the Company
executed a promissory note to a preferred shareholder in
return for $3.0 million of operating funds. The promissory
note had a stated interest rate of 10%, with interest
payments due annually on December 31, and was
collateralized by the total assets of the Company. The
Note, including accrued interest and fees, was paid in full
by the Company in March 2013.
20. Leases
Operating leases. The Company leases some of its
facilities under noncancelable operating leases. In August
2013, the Company entered into a lease agreement for
new office space in Aalborg, Denmark for occupancy to
August 2020 or later. The Company subleases a portion
of this facility to another tenant and under the sublease
agreement received 0.1 million Danish kroner per month
in rent through December 31, 2014. In November 2013,
the Company renewed and extended the lease for its San
Jose, California office through December 2018. Future
minimum operating lease payments are as follows as of
the balance sheet date:
Finance leases. The Company has finance leases
outstanding for manufacturing, engineering and test
equipment and the leases generally have terms of 60
months. There are no lease commitments beyond five
years. Future minimum lease payments under finance
leases are as follows as of the respective balance sheet
date:
(USD 000's) 2014 2013
Line of credit (223) (364)
Finance leases ‐ due within one year (77) (56)
Sublease deposit (204) ‐
Debt included in current liabilities (300) (420)
Sublease deposit ‐ reclassed to short‐term in 2014 ‐ (232)
Finance leases ‐ due after one year (309) (243)
Total debt (609) (895)
Less: cash and equivalents 4,170 11,663
Net debt 3,561 10,768
(USD 000's) 2014 2013
In the following year 517 556
In the second year 522 565
In the third year 524 570
In the fourth year 529 572
In the fifth year and thereafter 621 1,273
2,712 3,535
Minimum operating lease
payments due:
(USD 000's) 2014 2013
406 334
(20) (35)
386 299
77 56
309 243
386 299
Total obligations
under finance leases
Minimum finance lease payments
as of December 31
Less: amount representing
interest
Obligations under finance leases
due after one year
Obligations under finance leases
due within one year

Notes (UNAUDITED)
42 Asetek A/S – Annual Report 2014
21. Transactions with related parties
The Company’s chairman is a member of the board of
directors of a reseller of Company products. During the
years ended December 31, 2014 and 2013, the Company
had sales of inventory to the reseller of $6.7 million and
$5.5 million, respectively. As of December 31, 2014 and
2013, the Company had outstanding trade receivables
from the reseller of $1.1 million and $1.0 million,
respectively.
The Company’s CEO serves as Chairman of the Board for
a vendor that supplies information technology services to
the Company. In 2014, the Company purchased services
totaling approximately $0.2 million ($0.3 million in 2013)
from this vendor. At December 31, 2014 and 2013, the
Company had outstanding payables to this vendor of
$4,000 and $17,000, respectively.
22. Subsidiaries
The following subsidiaries are included in the consolidated accounts:
23. Audit fees
The Group’s principal auditors perform audits for all of
Asetek’s entities except for the Xiamen, China subsidiary,
which is audited by a local firm. The Group’s principal
auditors received a total fee of $197,000 and $354,000 in
2014 and 2013, respectively.
The fee is distributed between these services:
Company Domicile Stake Voting Share Activity
Asetek Holdings, Inc. USA 100% 100% Inactive
Asetek USA, Inc. USA 100% 100% Trading
Asetek Danmark A/S Denmark 100% 100% Trading
Xiamen Asetek Computer Industry Co., Ltd. China 100% 100% Trading
Asetek International ApS Denmark 100% 100% Trading
Asetek International ApS ‐ Branch Office Taiwan 100% 100% Trading
(USD 000's) 2014 2013
Statutory audit 103 150
Other assurance services 63 31
Tax services 30 91
Other services 1 82
Total 197 354

Notes (UNAUDITED)
43 Asetek A/S – Annual Report 2014
24. Board of Directors
The members of the Board of Directors have reported, that they had the below listed other director positions as of the
date of this filing. For the year 2014, the board members have been compensated as listed below.
Name Current directorships and position Share compensation from Asetek in 2014 and current
holdings
Samuel Szteinbaum Corsair Components, Inc. ‐ Board memberThe Wonder Years Inc. – Chairman and CEO
11,000 warrants to buy shares at a price of NOK40.10. The warrants are vesting over 12 months and are exercisable for 7 years. Also holds 76,600 shares, and 12,822 warrants at NOK36.50 from grants in prior years.
Chris Christopher Rocky Mountain Innosphere – Board member
CloudRegen – Board member
11,000 warrants to buy shares at a price of NOK40.10. The warrants are vesting over 12 months and are exercisable for 7 years. Also holds 18,640 shares and 17,760 options at $0.96/share, and 12,822 warrants at NOK36.50 from prior year grants.
Jim McDonnell
Peter Gross
Intermec Technologies, Inc., SVPTBC
Glumac, Inc. TBC – Board member
I3 Solutions, Inc. – Board member
6,408 warrants to buy shares at a price of NOK33.90. The
warrants are vesting over 12 months and are exercisable for 7
years. Also holds 6,400 shares.
6,408 warrants to buy shares at a price of NOK33.90. The
warrants are vesting over 12 months and are exercisable for 7
years.
Bengt Olof Thuresson Piql AS, Board member
Nevion Europe AS – Chairman
Protan AS – Chairman
ICTEC AS – Chairman
Kirkenes Bolig 1 AS, Board member
Pearl Consulting AS – Chairman
Pexip AS – Chairman
Likida Invest AS – Chairman
11,000 warrants to buy shares at a price of NOK40.10. The warrants are vesting over 12 months and are exercisable for 7 years. Also holds 12,822 warrants at NOK36.50 from prior years. Also holds 291 shares.
Knut Øversjøen Nordic Energy AS – Chairman
Kov Invest Holding, Chairman and Owner
Spond AS – Board member
Scandec Systems, Chairman
Falcon Industrial Partners, AS – Chairman
Guardian Corporate AS – Board member
Scandec Systems, Chairman
11,000 warrants to buy shares at a price of NOK40.10. The warrants are vesting over 12 months and are exercisable for 7 years. Also holds 14,759 shares and 12,822 warrants at NOK36.50 from prior years.
25. Post balance sheet events
The Company has evaluated the period after December 31, 2014 up through the date of the Statement by Management
and determined that there were the following transactions that required recognition or disclosure in the Company’s
financial statements:

Notes (UNAUDITED)
44 Asetek A/S – Annual Report 2014
In February 2015, the patent case with CoolIT Systems Inc. (“CoolIT”) was settled, with Asetek agreeing to dismiss the case.
Any damage amount payable from CoolIT to Asetek will be made public upon the determination of such amount by the
judge.
In February 2015, the Company secured NOK 100 million (approximately $12.4 million) in gross proceeds through a private
placement of 10 million new common shares, at an offering price of NOK 10.00 per share. The transaction closed in March
2015, with the Company receiving net proceeds of approximately $11.6 million after expenses. In April 2015 at the time of
this report, a public offering of up to 2 million new shares at NOK 10.00 per share was in process. Expected proceeds to
the Company from this offering is estimated to be $2.4 million. The net proceeds from these financings will be used for
data center product launches, business development, and strengthening the balance sheet.
26. Contingent liabilities
Letter of credit. As of December 31, 2014, the Company had an outstanding letter of credit for $0.5 million issued to its
principal manufacturer.
The Danish group enterprises are jointly and severally liable for tax on group income subject to joint taxation, as well as for
Danish withholding taxes by way of dividend tax, royalty tax, tax on unearned income and any subsequent adjustments to
these.
Other significant commitments of the Company are referenced within the respective Notes to these consolidated financial
statements.

Parent Company Report (UNAUDITED)
45 Asetek A/S – Annual Report 2014
Annual Report 2014, Parent Company For year ended December 31, 2014
Asetek A/S
CVR‐number 3488 0522

Parent Company Report (UNAUDITED)
46 Asetek A/S – Annual Report 2014
Comprehensive Income Statement, Parent Company
USD 000's Note
Year ended
December 31,
2014
Period from
December 6,
2012 (inception)
to December
31, 2013
Revenue ‐ ‐
Cost of sales ‐ ‐
Gross profit ‐ ‐
Research and development 3, 4, 5 (176) (114)
Selling, general and administrative 3, 4, 5 (1,636) (1,297)
Foreign exchange (loss)/gain (36) ‐
Total operating expenses (1,848) (1,411)
Operating loss (1,848) (1,411)
Finance income 6 854 513
Finance costs 6 (164) (339)
Total financial income (expenses) 690 174
Loss before tax (1,158) (1,237)
Income tax 7 197 ‐
Loss for the year (961) (1,237)
Other comprehensive income items that may be reclassified
to profit or loss in subsequent periods:
Foreign currency translation adjustments ‐ ‐
Total comprehensive loss (961) (1,237)
All operations are continuing.

Parent Company Report (UNAUDITED)
47 Asetek A/S – Annual Report 2014
Balance Sheet, Parent Company As of December 31,
USD 000's Note 2014 2013
ASSETS
Non‐current assets
Investments in subsidiaries 8 1,500 1,500
Receivables from subsidiaries 9 16,071 8,853
Total non‐current assets 17,571 10,353
Current assets
Other assets 150 9
Cash and cash equivalents 3,500 10,788
Total current assets 3,650 10,797
Total assets 21,221 21,151
EQUITY AND LIABILITIES
Equity
Share capital 10 264 264
Share premium 10 21,539 21,445
Accumulated deficit (666) (644)
Translation and other reserves (12) (14)
Total equity 21,125 21,051
Current liabilities
Accrued liabilities 96 100
Total current liabilities 96 100
Total liabilities 96 100
Total equity and liabilities 21,221 21,151

Parent Company Report (UNAUDITED)
48 Asetek A/S – Annual Report 2014
Statement of Cash Flows, Parent Company
USD 000's Note
Year ended
December 31,
2014
Period from
December 6,
2012 (inception)
to December 31,
2013
Cash flows from operating activities
Loss for the year (961) (1,237)
Share based payments expense 4 940 593
Changes in other current assets (141) (9)
Changes in trade payables and accrued liabilities (4) 100
Net cash used in operating activities (166) (553)
Cash flows from investing activities
Investment in subsidiaries 8 ‐ (1,500)
Net loans to subsidiaries 9 (7,218) (8,853)
Net cash used in investing activities (7,218) (10,353)
Cash flows from financing activities
Proceeds from issuance of share capital 10 96 25,100
Cash paid for fees related to IPO 10 ‐ (3,406)
Net cash provided by financing activities 96 21,694
Net changes in cash and cash equivalents (7,288) 10,788
Cash and cash equivalents at beginning of period 10,788 ‐
Cash and cash equivalents at end of period 3,500 10,788

Parent Company Report (UNAUDITED)
49 Asetek A/S – Annual Report 2014
Statement of Changes in Equity, Parent Company
(USD 000's)
Share
capital
Share
premium
Translation
reserves
Other
reserves
Accumulated
deficit Total
Equity at December 6, 2012 ‐ ‐ ‐ ‐ ‐ ‐
Total comprehensive income for the period:
Loss for the period ‐ ‐ ‐ ‐ (1,237) (1,237)
Total comprehensive loss for the period ‐ ‐ ‐ ‐ (1,237) (1,237)
Transactions with owners in the period:
Issuance of shares at inception 88 ‐ ‐ ‐ ‐ 88
Share capital reduction (70) 70 ‐ ‐ ‐ ‐
Exchange of shares with Asetek Holdings, Inc. 157 (157) ‐ ‐ ‐ ‐
Issuance of treasury shares 14 ‐ ‐ (14) ‐ ‐
Shares issued in IPO 75 24,955 ‐ ‐ ‐ 25,030
Less: issuance costs ‐ (3,423) ‐ ‐ ‐ (3,423)
Share based payment expense ‐ ‐ ‐ ‐ 593 593
Transactions with owners in the period 264 21,445 ‐ (14) 593 22,288
Equity at December 31, 2013 264 21,445 ‐ (14) (644) 21,051
Total comprehensive income for 2014
Loss for the year ‐ ‐ ‐ ‐ (961) (961)
Total comprehensive loss for 2014 ‐ ‐ ‐ ‐ (961) (961)
Transactions with owners in 2014
Shares issued ‐ 94 ‐ 2 ‐ 96
Share based payment expense ‐ ‐ ‐ ‐ 940 940
Transactions with owners in 2014 ‐ 94 ‐ 2 940 1,036
Equity at December 31, 2014 264 21,539 ‐ (12) (666) 21,125

AsetekA/SNotestotheAnnualReport–ParentCompany(UNAUDITED)
50 Asetek A/S – Annual Report 2014
1. General information
Asetek A/S was incorporated on December 6, 2012 and
acquired by Asetek Holdings, Inc. in January 2013. Asetek
A/S became the parent and 100% owner of the Asetek
Group through the purchase of all outstanding shares of
Asetek Holdings, Inc. from the shareholders, in exchange
for new shares in Asetek A/S in February 2013.
2. Summary of significant accounting policies
The 2014 financial statements for Asetek A/S have been
prepared in accordance with International Financial
Reporting Standards (IFRS) as issued by IASB and adopted
by the EU.
The financial statements are presented in U.S. Dollars
(USD), which is the functional currency.
The accounting policies for the Parent Company are the
same as for the Asetek Group, as per Note 2 to the
consolidated financial statements, with the exception of
the items listed below.
2.1. Dividends on investments in subsidiaries, joint
ventures and associates.
Dividends on investments in subsidiaries, joint ventures
and associates are recognized as income in the income
statement of the Parent Company in the financial year in
which the dividend is declared.
2.2. Investments in subsidiaries, joint ventures and
associates.
Investments in subsidiaries, joint ventures and associates are measured at the lower of cost, which equals book value, or recoverable amount.
3. Total operating expenses
4. Personnel expenses
The figures listed above include a portion of the
executive management’s cash compensation based on
an estimate of the actual resources allocated to the
management of the parent company. Also, the figures
include incentive based compensation in the form of
share options and warrants granted to employees in the
Asetek Group.
Remuneration of the Group Board of Directors is
specified in Note 6 to the Consolidated Financial
Statements.
The company’s share based incentive pay program is
described in Note 7 of the Consolidated Financial
Statements.
(USD 000's)
Year ended
December 31,
2014
Period from
December 6,
2012 (inception)
to December 31,
2013
Personnel expenses (Note 4) 1,340 770
Legal, consultants and auditor 401 563
Other expenses 71 78
Total expenses 1,812 1,411
(USD 000's)
Year ended
December 31,
2014
Period from
December 6,
2012 (inception)
to December 31,
2013
Salaries 400 177
Share based payment 940 593
Total personnel expenses 1,340 770
(USD 000's)
Year ended
December 31,
2014
Period from
December 6,
2012 (inception)
to December 31,
2013
Research and development 176 114
Selling, general and administrative 1,164 656
Total personnel expenses 1,340 770

AsetekA/SNotestotheAnnualReport–ParentCompany(UNAUDITED)
51 Asetek A/S – Annual Report 2014
5. Audit fees
6. Financial income and cost
7. Income tax
Reference is made to Note 11 to the Consolidated Financial Statements.
8. Investment in subsidiaries
Asetek A/S acquired 100% of Asetek Holdings, Inc.
through the exchange of shares in February 2013. At the
time of acquisition, Asetek Holdings, Inc. had negative net
equity, resulting in the initial investment to be valued at
zero. Asetek Holdings, Inc. represents Asetek A/S’s only
direct investment in subsidiaries.
(USD 000's)
Year ended
December 31,
2014
Period from
December 6,
2012 (inception)
to December 31,
2013
Statutory audit 32 36
Other assurance services 39 141
Tax services 15 ‐
Other services ‐ ‐
Total 86 177
(USD 000's)
Year ended
December 31,
2014
Period from
December 6,
2012 (inception)
to December 31,
2013
Interest income on loans to subsidiaries 853 429
Interest from bank accounts 1 84
Total finance income 854 513
Interest cost on loans from subsidiaries 157 58
Net foreign exchange loss on deposits ‐ 264
Interest cost on notes payable ‐ 10
Other finance expense 7 7
Total finance cost 164 339
(USD 000's)
Investment in
Asetek
Holdings, Inc.
Balance at December 6, 2012 ‐
Additions 1,500
Balance at December 31, 2013 1,500
Additions ‐
Balance at December 31, 2014 1,500
Carrying amount at December 6, 2012 ‐
Carrying amount at December 31, 2013 1,500
Carrying amount at December 31, 2014 1,500

AsetekA/SNotestotheAnnualReport–ParentCompany(UNAUDITED)
52 Asetek A/S – Annual Report 2014
9. Receivables from subsidiaries
The fair value of receivables corresponds in all material
respects to the carrying amount.
10. Equity
Reference is made to Note 18 to the Consolidated Financial Statements.
11. Transactions with related parties
Reference is made to Note 21 to the Consolidated Financial Statements.
12. Events after the reporting period
Reference is made to Note 25 to the Consolidated Financial Statements.
13. Contingent liabilities
The Danish group enterprises are jointly and severally liable for tax on group income subject to joint taxation, as well as for
Danish withholding taxes by way of dividend tax, royalty tax, tax on unearned income and any subsequent adjustments to
these.
Asetek A/S has issued a declaration of support to Asetek Danmark A/S confirming its intention and commitment of financial
support in the form of loans or capital contributions to the extent necessary to finance its cash obligations through April 28,
2016.
Reference is made to Note 26 to the Consolidated Financial Statements.
As of December 31,
(USD 000's) 2014 2013
Asetek Danmark A/S 15,507 9,337
Asetek USA, Inc. (3,246) (2,600)
Asetek Holdings, Inc. 3,811 2,116
Net receivables from subsidiaries 16,071 8,853
% 2014 2013
Average effective interest rate 5% 5%