Embed Size (px)
Citation preview
This article was downloaded by: [University of Strathclyde]On: 10 October 2014, At: 07:03Publisher: Taylor & FrancisInforma Ltd Registered in England and Wales Registered Number: 1072954Registered office: Mortimer House, 37-41 Mortimer Street, London W1T 3JH, UK
Aerosol Science and TechnologyPublication details, including instructions for authors andsubscription information:http://www.tandfonline.com/loi/uast20
Ash Vaporization in CirculatingFluidized Bed Coal CombustionTerttaliisa Lind a , Esko I. Kauppinen a , Willy Maenhaut b ,Anup Shah c & Frank Huggins ca VTT CHBMICAL TECHNOLOGY, AEROSOL TECHNOLOGYGROUP , P.O. BOX 1401, VTT, FIN-02044, FINLANDb UNIVERSITY OF GENT, INSTITUTE FOR NUCLEARSCIENCES , PROEFTUINSTRAAT 86, B-9000, GENT, BELGIUMc UNIVERSITY OF KENTUCKY , LEXINGTON, KENTUCKY, USAPublished online: 13 Jun 2007.
To cite this article: Terttaliisa Lind , Esko I. Kauppinen , Willy Maenhaut , Anup Shah &Frank Huggins (1996) Ash Vaporization in Circulating Fluidized Bed Coal Combustion, AerosolScience and Technology, 24:3, 135-150, DOI: 10.1080/02786829608965359
To link to this article: http://dx.doi.org/10.1080/02786829608965359
PLEASE SCROLL DOWN FOR ARTICLE
Taylor & Francis makes every effort to ensure the accuracy of all the information(the “Content”) contained in the publications on our platform. However, Taylor& Francis, our agents, and our licensors make no representations or warrantieswhatsoever as to the accuracy, completeness, or suitability for any purposeof the Content. Any opinions and views expressed in this publication are theopinions and views of the authors, and are not the views of or endorsed by Taylor& Francis. The accuracy of the Content should not be relied upon and should beindependently verified with primary sources of information. Taylor and Francisshall not be liable for any losses, actions, claims, proceedings, demands, costs,expenses, damages, and other liabilities whatsoever or howsoever caused arisingdirectly or indirectly in connection with, in relation to or arising out of the use ofthe Content.
This article may be used for research, teaching, and private study purposes.Any substantial or systematic reproduction, redistribution, reselling, loan,sub-licensing, systematic supply, or distribution in any form to anyone is

expressly forbidden. Terms & Conditions of access and use can be found at http://www.tandfonline.com/page/terms-and-conditions
Dow
nloa
ded
by [
Uni
vers
ity o
f St
rath
clyd
e] a
t 07:
03 1
0 O
ctob
er 2
014
ELSEVIER
Ash Vaporization in Circulating Fluidized Bed Coal Combustion
Terttaliisa Lind and Esko I. Kauppinen
Willy Maenhaut UNIVERSITY OF GENT, INSTITUTE FOR NUCLEAR SCIENCES, PROEFTUINSTRAAT 86,
8-9000 GENT, BELGIUM
Anup Shah and Frank Huggins UNIVERSITY OF KENTUCKY, LEXINGTON, KENTUCKY, USA
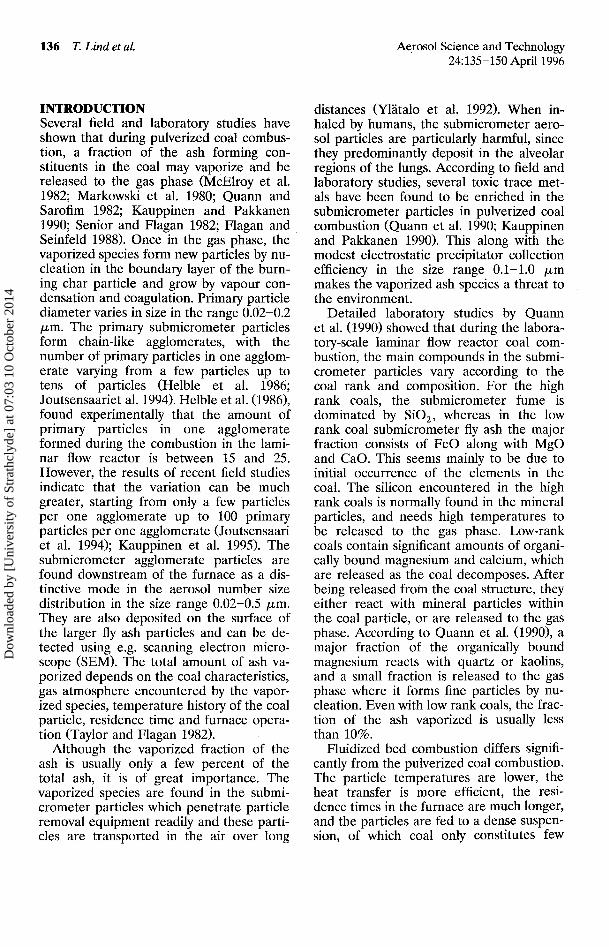
ABSTRACT. In this work, the vaporization of the ash forming constituents in circulating fluidized bed combustion (CFBC) in a full-scale 80 MW,, unit was studied. Ash vaporization in CFBC was studied by measuring the fly ash aerosols in a full-scale boiler upstream of the electrostatic precipitator (ESP) at the flue gas temperature of 125°C. The fuel was a Venezuelan bituminous coal, and a limestone sorbent was used during the measurements. The fly ash number size distributions showed two distinct modes in the submicrometer size range, at particle diameters 0.02 and 0.3 pm. The concentration of the ultrafine 0.02-pm mode showed a large variation with time and it decreased as the measurements advanced. The concentra- tion of the 0.02-pm mode was two orders of magnitude lower than in the submicrometer mode observed earlier in the bubbling FBC and up to three orders of magnitude lower than in the pulverized coal combustion. Scanning electron micrographs showed few ultrafine particles. The intermediate mode at 0.3 p m consisted of particles irregular in shape, and hence in this mode the particles had not been formed via a gas to particle route. We propose that the 0.3-pm mode had been formed from the partial melting of the very fine mineral particles in the coal. The mass size distribution in the size range 0.01-70 p m was unimodal with maximum at 20 pm. Less than 1% of the fly ash particles was found in the submicrometer size range. Ninety percent of Mg in coal was organically bound, and it was found to react with quartz and aluminosilicate minerals inside the coal particle. No Mg was found to be released to the gas phase and Mg mass fraction size distribution was size independent. A fraction of halogens C1, Br and I were found to be in the gas phase after the combustion. AEROSOL SCIENCE AND TECHNOLOGY 24:135-150 (1996)
* Corresponding author: Terttaliisa Lind.
Aerosol Science and Technology 24:135-150 (1996) O 1996 American Association for Aerosol Research Published by Elsevier Science Inc.
Dow
nloa
ded
by [
Uni
vers
ity o
f St
rath
clyd
e] a
t 07:
03 1
0 O
ctob
er 2
014
136 T. Lind et al. Aerosol Science and Technology 24:135-150 April 1996
INTRODUCTION Several field and laboratory studies have shown that during pulverized coal combus- tion, a fraction of the ash forming con- stituents in the coal may vaporize and be released to the gas phase (McElroy et al. 1982; Markowski et al. 1980; Quann and Sarofim 1982; Kauppinen and Pakkanen 1990; Senior and Flagan 1982; Flagan and Seinfeld 1988). Once in the gas phase, the vaporized species form new particles by nu- cleation in the boundary layer of the burn- ing char particle and grow by vapour con- densation and coagulation. Primary particle diameter varies in size in the range 0.02-0.2 pm. The primary submicrometer particles form chain-like agglomerates, with the number of primary particles in one agglom- erate varying from a few particles up to tens of particles (Helble et al. 1986; Joutsensaariet al. 1994). Helble et al. (1986), found experimentally that the amount of primary particles in one agglomerate formed during the combustion in the lami- nar flow reactor is between 15 and 25. However, the results of recent field studies indicate that the variation can be much greater, starting from only a few particles per one agglomerate up to 100 primary particles per one agglomerate (Joutsensaari et al. 1994); Kauppinen et al. 1995). The submicrometer agglomerate particles are found downstream of the furnace as a dis- tinctive mode in the aerosol number size distribution in the size range 0.02-0.5 pm. They are also deposited on the surface of the larger fly ash particles and can be de- tected using e.g. scanning electron micro- scope (SEM). The total amount of ash va- porized depends on the coal characteristics, gas atmosphere encountered by the vapor- ized species, temperature history of the coal particle, residence time and furnace opera- tion (Taylor and Flagan 1982).
Although the vaporized fraction of the ash is usually only a few percent of the total ash, it is of great importance. The vaporized species are found in the submi- crometer particles which penetrate particle removal equipment readily and these parti- cles are transported in the air over long
distances (Ylatalo et al. 1992). When in- haled by humans, the submicrometer aero- sol particles are particularly harmful, since they predominantly deposit in the alveolar regions of the lungs. According to field and laboratory studies, several toxic trace met- als have been found to be enriched in the submicrometer particles in pulverized coal combustion (Quann et al. 1990; Kauppinen and Pakkanen 1990). This along with the modest electrostatic precipitator collection efficiency in the size range 0.1-1.0 pm makes the vaporized ash species a threat to the environment.
Detailed laboratory studies by Quann et al. (1990) showed that during the labora- tory-scale laminar flow reactor coal com- bustion, the main compounds in the submi- crometer particles vary according to the coal rank and composition. For the high rank coals, the submicrometer fume is dominated by SiO,, whereas in the low rank coal submicrometer fly ash the major fraction consists of FeO along with MgO and CaO. This seems mainly to be due to initial occurrence of the elements in the coal. The silicon encountered in the high rank coals is normally found in the mineral particles, and needs high temperatures to be released to the gas phase. Low-rank coals contain significant amounts of organi- cally bound magnesium and calcium, which are released as the coal decomposes. After being released from the coal structure, they either react with mineral particles within the coal particle, or are released to the gas phase. According to Quann et al. (19901, a major fraction of the organically bound magnesium reacts with quartz or kaolins, and a small fraction is released to the gas phase where it forms fine particles by nu- cleation. Even with low rank coals, the frac- tion of the ash vaporized is usually less than 10%.
Fluidized bed combustion differs signifi- cantly from the pulverized coal combustion. The particle temperatures are lower, the heat transfer is more efficient, the resi- dence times in the furnace are much longer, and the particles are fed to a dense suspen- sion, of which coal only constitutes few
Dow
nloa
ded
by [
Uni
vers
ity o
f St
rath
clyd
e] a
t 07:
03 1
0 O
ctob
er 2
014
Aerosol Science and Technology 24:135-150 April 1996
Ash Vaporization in CFBC 137
percent (Sarofim et al. 1987; Tang and Tay- lor 1987; Hernberg et al. 1993). In addition, the temperatures and the gas concentra- tions vary widely in the bed, especially in the case of the bubbling bed. Because of the large coal feed size, usually several millimeters in diameter, long residence times and low temperatures in fluidized bed combustion, the different phases of com- bustion, i.e., drying, pyrolysis and char burning, cannot be separated. The pyrolysis starts while the inside of the particle is still drying (Wildegger-Gaissmaier and Aganval 1990). As well, the char burning starts be- fore the pyrolysis has been completed.
The vaporization of the ash forming con- stituents and subsequent submicron parti- cle formation in fluidized bed coal combus- tion has been earlier studied by Cheng et al. (1985). They measured fly ash parti- cles from an atmospheric bubbling fluidized bed upstream and downstream of a particu- late removal system. They collected particle samples for transmission electron micro- scope (TEM) analysis and found that the supermicron particles were irregular in shape, whereas the submicron particles were more spherical, with some aggregate clustels of spherical primary particles. The number concentration of the submicron
particles was close the values measured earlier in pulverized coal combustion. In this work, we studied the vaporization of the ash forming constituents in circulating fluidized bed combustion (CFBC) in a full- scale 80 MW,, unit. We measured the num- ber, mass and elemental size distributions of the combustion aerosols upstream of the electrostatic precipitator (ESP), studied the particle morphology with scanning electron microscopy (SEM), analyzed the coal and sorbent, and studied the fly ash and bottom ash composition with computer controlled scanning electron microscope (CCSEM). Based on the results, we discuss the vapor- ization of the ash and the fate of the organ- ically bound magnesium in CFBC.
EXPERIMENTAL Process Description
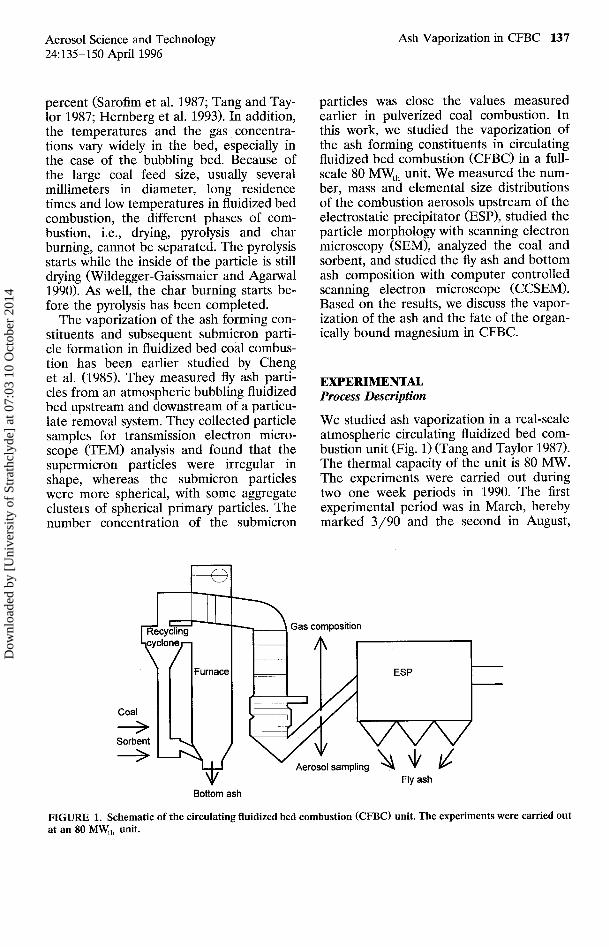
We studied ash vaporization in a real-scale atmospheric circulating fluidized bed com- bustion unit (Fig. 1) (Tang and Taylor 1987). The thermal capacity of the unit is 80 MW. The experiments were carried out during two one week periods in 1990. The first experimental period was in March, hereby marked 3/90 and the second in August,
Gas composition
Fly ash Bottom ash
FIGURE 1. Schematic of the circulating fluidized bed combustion (CFBC) unit. The experiments were carried out at an 80 MWth unit.
Dow
nloa
ded
by [
Uni
vers
ity o
f St
rath
clyd
e] a
t 07:
03 1
0 O
ctob
er 2
014
138 T. Lind et al. Aerosol Science and Technology 24:135-150 April 1996
hereby marked 8/90. The flue gas composi- tions during both experimental periods were measured continuously and are given along with process parameters during the mea- surements in Table l. The flue gas mois- ture content was measured with the total mass concentration sampling train and it varied between 17 and 67 g/kg flue gas. Samples were collected once an hour from the boiler bottom ash, the ESP-collected fly ash, and the feed materials, i.e. coal and limestone.
Feed Materials
The fuel during the experiments was Venezuelan low sulfur bituminous coal, but at the beginning of the second experimen- tal period English subbituminous coal was accidentally fed into the coal feed silo. The amount of the English coal in the fuel feed was about 50% at the beginning of the week, and was reduced during the week. The coal proximate, ultimate, and ash anal- yses are given in Table 2. C1 contents in the coal were 210 and 230 ppm during the experimental periods 3/90 and 8/90, re- spectively. A limestone sorbent was used in bed during both periods to capture the sulphur. During 8/90 period, the sorbent feed was higher due to the addition of the higher sulphur English coal in the fuel feed.
TABLE 1. Process Parameters and Flue Gas Compositions During the Experimental Periods 3/90 and 8/90
Process parameters 3/90 8/90
Fuel feed (kg/s) 2.55-2.65 2.57-2.61 Sorbent feed (kg/s) 0.06 0.08-0.14 Air feed (kg/s) 32.6-33.5 33.1 Coal conversion (%) 97.4-97.7 97.4-97.6 Bed temperature PC) 846-865 870-893 Particle concentration 13.7-15.8 14.3-18.7 (g/Nm3)
Flue gas composition
02(%) 3.9-4.5 3.6-4.8 NO, ( p p d 140-200 150-220 SO2 (ppm) 50-100 40-200 CO (ppm) 90-180 90-120 C 0 2 (%) 14.2-16.5 14.2-15.2
TABLE 2. Proximate, Ultimate, and Ash Analysis of Venezuelan Coal
Ptoximate 3/90 8/90
Moisture as received (%I 8.0 8.2 Volatile matter in d.s. [%] 37.5 37.1 Fixed carbon in d.s. [%] 58.3 58.5 Ash in d.s. [%] 4.2 4.5
Ultimate (in d.s.)
C (%) 80.8 80.8 H (%) 5.4 5.5 N (%I 1.46 1.45 0 (%I 7.7 7.4 S (%) 0.48 0.51 Heating value (MJ/kg) 32.6 32.8 -
Ash Analysis (%)
Na,O 0.7 0.6 K2O 1.0 1 .I CaO 8.6 7.0 MgO 5.7 4.7 SiO, 41 43 A',0? 23 22 Fez03 6.3 7.3 p? 0 5 0.18 0.01 T10, 1.0 1.2 so3 10.1 7.9
The sulfur capture is discussed in Lind et al. (1995).
The coal feed particle size as determined with a sieve was 1-3 mm. The average limestone feed size was 300 p m as deter- mined using classification by sieve and with a Malvern optical size analyzer. Coal and limestone sorbent elemental compositions were analyzed with instrumental neutron activation analysis (INAA) and inductively coupled plasma mass spectrometry (ICP- MS), coal also with particle-induced x-ray emission analysis (PIXE). Coal and lime- stone samples were analyzed for both ex- perimental periods. The coal minerals and limestone were analyzed at the University of Kentucky using computer-controlled scanning electron microscopy (CCSEM) (Huggins et al. 1980; Lind et al. 1994a). For the analysis, the coal and limestone were crushed to pass through a 200-mesh sieve (75 p m top size). After crushing, the coal was embedded in epoxy, which was polished and sputter-coated with carbon. The lime-
Dow
nloa
ded
by [
Uni
vers
ity o
f St
rath
clyd
e] a
t 07:
03 1
0 O
ctob
er 2
014
Aerosol Science and Technology 24:135-150 April 1996
Ash Vaporization in CFBC 139
stone was suspended in distilled acetone, deposited carefully on a Nuclepore filter and sputter-coated with carbon to avoid charging effects in SEM. The CCSEM analysis was carried out by sizing and classi- fying approximately 1200 mineral and lime- stone particles for a sample with SEM. The elemental analysis of each particle was car- ried out with energy-dispersive x-ray (EDX) analyzer based on a four seconds counting time. The EDX analyzer was not able to detect elements lighter than sodium. The major mineral categories in the coal were quartz, calcite and miscellaneous silicates, along with significantly lesser amounts of kaolinite, illite, pyrite and gypsum. Lime- stone consisted mainly of calcite along with minor amounts of silicates.
In addition, the coal was analyzed by a chemical fractionation method (Benson and Holm 1985), where coal is leached consecu- tively in water, ammonium acetate and HCl. The leachates and the remaining coal is then analyzed for desired elements, and hence we obtain information on the occur- rence of these elements in the parent coal. According to chemical fractionation analy- sis, 90% of magnesium was found as organ- ically bound in the Venezuelan coal used in this study (Lind et al. 1994a).
Aerosol Sampling
The mass and elemental size distributions were determined by collecting size-classi- fied aerosol samples with an 11-stage, mul- tijet compressible flow Berner-type low- pressure impactor (BLPI) (Kauppinen 1992; Hillamo and Kauppinen 1991; Kauppinen and Pakkanen 1990). The impactor Stokes cut-diameters from stages 11 to 1 are 10.39, 5.173,2.533, 1.248,0.596,0.299,0.169,0.071, 0.034, 0.021 and 0.010 calculated at 125°C with a particle density of 2.4 g/cm3. A cyclone wit Stokes cut-diameter of 5.4 pm was used as a precutter sampling device to prevent overloading of the upper BLPI stages. The cyclone-BLPI sampler was situ- ated in the flue gas channel upstream of the electrostatic precipitator (ESP), and the sample was collected with iso-mean sam-
pling velocity. Due to high particle concen- trations in the CFBC flue gas, double stages were used in the impactor for the stages 9, 8, and 7 to prevent overloading of these stages during the latter experimental pe- riod, i.e., 8/90. Thin aluminium (Al) and polycarbonate (poreless Nuclepore, NP) films greased with Apiezon L vacuum grease were used as impaction substrates. To eval- uate the chemical reactions and condensa- tion of the vapours with the substrates dur- ing BLPI sampling, in-situ blank samples were collected through two quartz fiber fil- ters. In total, 22 BLPI samplings were car- ried out, including 6 in-situ blank samples.
The total particle mass concentration was determined, in addition to the BLPI method, with filter sampling. The cyclone used in BLPI sampling was used as a pre- cutter, followed by a filter to collect parti- cles smaller than the cyclone cut-diameter. The total particle concentrations in the flue gas are presented in Table 1.
To determine the combustion aerosol number size distributions in the size range 0.01-0.8 pm, the aerosol was sampled in- stack through a pre-cyclone having a Stokes cut-diameter of 2.5 p m during the second experimental period. The aerosol was di- luted with a two-stage, ejector based dilu- tion system (Koch et al. 1988). In the first dilution stage, dry, clean dilution air was heated to the flue gas temperature of 125°C to reduce the partial pressure of condens- able species and hence to minimize new particle formation as well as particle growth by condensation of sulphuric acid, hydro- chloric acid and water. For the second dilu- tion, ambient temperature clean, dry air was used. The diluted aerosol was mea- sured with a differential mobility analyzer (DMA, TSI model 3071) by using a conden- sation nucleus counter (CNC, TSI model 3020) as a number concentration sensor. The schematic of the dilution-DMA sys- tem is presented by Joutsensaari et al., 1994. DMA sheath and excess air flow rates were equal, being 10 times the sample flow rate. Size distributions in the range 0.01-0.3 pm were measured without the pre-impac- tor using 10 L/min sheath air flow rate.
Dow
nloa
ded
by [
Uni
vers
ity o
f St
rath
clyd
e] a
t 07:
03 1
0 O
ctob
er 2
014
140 T. Lind et al. Aerosol Science and Technology 24:135-150 April 1996
Size distributions in the range 0.02-0.8 pm were measured with the single-stage, sin- gle-jet pre-impactor with 0.8-pm aerody- namic cut diameter and 3 L/min sheath air flow. Due to the low concentration of ultra- fine particles (Dp < 0.1 pm) towards the end of the experimental period 8/90, two measurements were made with 10 minutes measuring times for each channel to reduce the statistical error and the error due to the fluctuation in the flue gas particle con- centrations. One measurement was carried out using 10 L/min sheath air flow rate and another with 3 L/min sheath air flow rate. CNC readings were recorded with a strip chart recorder and averaged manually.
Analytical Techniques
The BLPI samples were weighed carefully on a microbalance before and after the sampling. The cyclone-collected samples were weighed to determine the total mass of the samples, and size-classified with Bahco-sieve. Bahco-sieve size fractions were <3.5, 5.3, 8.3, 13.8, 22.7, 37.1, 47.5, and 56.0 pm. The sieve size fractions were weighed and stored for elemental analyses. In addition, the size distribution of the cy- clone collected particles was measured with the Coulter Counter method. The size dis- tributions obtained with the two methods were found to be in reasonably good agree- ment, even though the size distributions given by Bahco-sieve were slightly broader than the size distributions given by Coulter Counter.
Up to about 50 elements were analyzed in the BLPI and size-classified cyclone pre-cutter samples by INAA and ICP-MS (Maenhaut et al. 1993a; Lind et al. 1994a). BLPI samples were also analyzed for 28 elements with PIXE (Maenhaut et al. 1993b). The analysis results and corre- sponding aerosol particle size distributions for sodium and potassium, as well as for the trace metals have been reported earlier in Lind et al. (1994a) and Lind et al. (1994b), respectively. ESP collected fly ash and boiler bottom ash were analyzed with CC- SEM. The ash samples were prepared for
the analysis similarly as the limestone sam- ple. The data reduction for the ash samples was based on a generic elemental classifi- cation scheme that classifies each particle into a chemical class depending on the three most abundant elements found in the EDX spectrum (Shah et al. 1992). Categories that consist of only one or two elements have no significant second or third element appear- ing in the EDX spectrum. The cut-off for significance is 10% and 5% of the total peak area for the second element and thrid element, respectively.
The morphology of the CFBC aerosol particles was studied with high resolution scanning electron microscopy (HRSEM) at the University of New Mexico. The samples for HRSEM were prepared from impactor samples collected on stages 7 and 2 bj attaching a piece of the impactor substrate on a copper plate and sputter-coating it with platinum. HRSEM was used in order to distinguish ultrafine particles or agglom- erates composed of ultrafine primary parti- cles attached to large particle surfaces.
Data Reduction
The CFBC aerosol mass and elemental size distributions were determined from the gravimetric and elemental analysis results by assuming the collection efficiency of each BLPI stage to be a step function at the cut-point particle size, i.e., no cross-sensi- tivity corrections were made. Stage cut- point diameters were adapted from Kaup- pinen and Pakkanen, (1990), i.e., they are based on a particle density of 2400 kg/m3 and a flue gas temperature of 125°C. Wall losses were assumed to be negligible.
For the data reduction of the aerosol number size distributions, the commercial (TSI) data reduction algorithm was used with the charge distribution proposed by Wiedensohler (1988). Particle losses within the DMA were calculated as proposed by Adachi et al. (1990) and between the DMA and CNC as proposed by Liu et al. (1985). The number concentrations measured with CNC were corrected to include the losses between DMA pre-impactor and CNC by
Dow
nloa
ded
by [
Uni
vers
ity o
f St
rath
clyd
e] a
t 07:
03 1
0 O
ctob
er 2
014
Aerosol Science and Technology 24:135-150 April 1996
Ash Vaporization in CFBC 141
estimating each mobility fraction to include only singly charged particles. Similarly, losses from the sampling nozzle to the preimpactor were estimated based on Liu et al. (1985) and accordingly corrected dur- ing data reduction.
RESULTS AND DISCUSSION Number Size Distributions
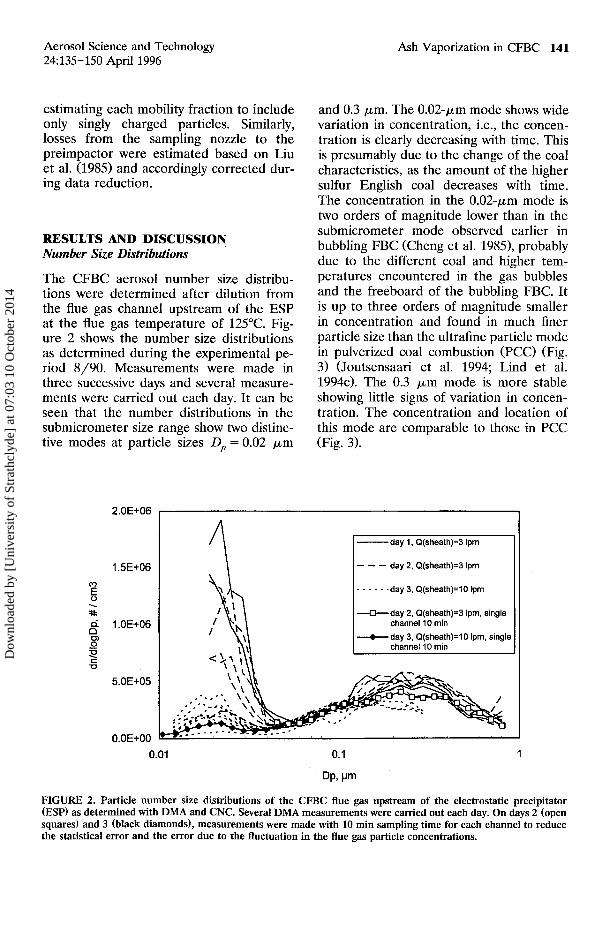
The CFBC aerosol number size distribu- tions were determined after dilution from the flue gas channel upstream of the ESP at the flue gas temperature of 125°C. Fig- ure 2 shows the number size distributions as determined during the experimental pe- riod 8/90. Measurements were made in three successive days and several measure- ments were carried out each day. It can be seen that the number distributions in the submicrometer size range show two distinc- tive modes at particle sizes D, = 0.02 pm
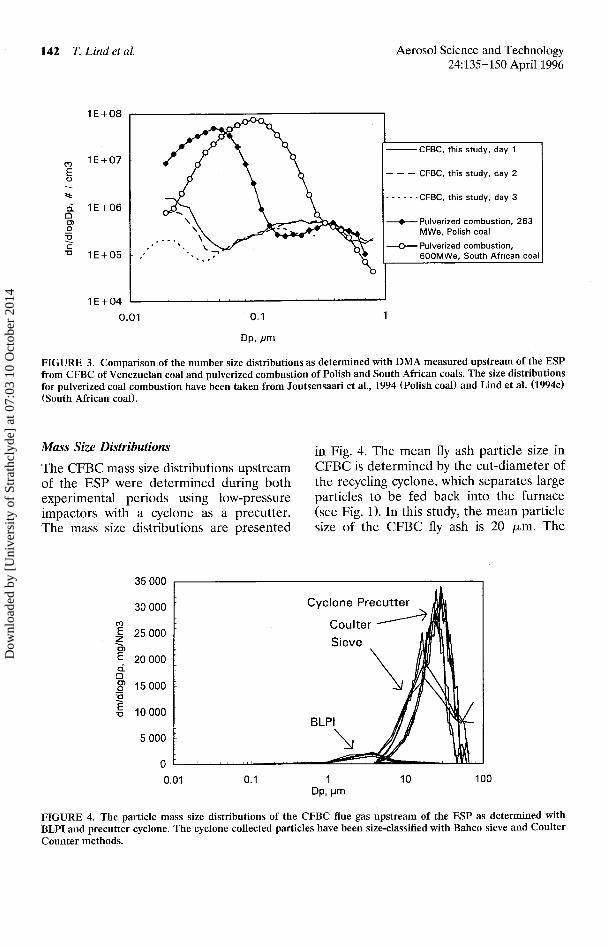
and 0.3 pm. The 0.02-pm mode shows wide variation in concentration, i.e., the concen- tration is clearly decreasing with time. This is presumably due to the change of the coal characteristics, as the amount of the higher sulfur English coal decreases with time. The concentration in the 0.02-pm mode is two orders of magnitude lower than in the submicrometer mode observed earlier in bubbling FBC (Cheng et al. 1985), probably due to the different coal and higher tem- peratures encountered in the gas bubbles and the freeboard of the bubbling FBC. It is up to three orders of magnitude smaller in concentration and found in much finer particle size than the ultrafine particle mode in pulverized coal combustion (PCC) (Fig. 3) (Joutsensaari et al. 1994; Lind et al. 1994~). The 0.3 p m mode is more stable showing little signs of variation in concen- tration. The concentration and location of this mode are comparable to those in PCC (Fig. 3).
-day 1. Q(sheath)=3 Ipm
--- day 2, Q(sheath)=3 Iprn I . - - - - . day 3, Q(sheath)=lO Ipm
U d a y 2, Q(sheath)=3 Ipm, single channel 10 min 1
--+-day 3, Q(sheath)=lO Ipm, single channel 10 min
FIGURE 2. Particle number size distributions of the CFBC flue gas upstream of the electrostatic precipitator (ESP) as determined with DMA and CNC. Several DMA measurements were camed out each day. On days 2 (open squares) and 3 (black diamonds), measurements were made with 10 min sampling time for each channel to reduce the statistical error and the error due to the fluctuation in the flue gas particle concentrations.
Dow
nloa
ded
by [
Uni
vers
ity o
f St
rath
clyd
e] a
t 07:
03 1
0 O
ctob
er 2
014
142 T. Lind et al. Aerosol Science and Technology 24:135-150 April 1996
-CFBC, this study, day 1
- - - CFBC, this study, day 2
. - . - - . CFBC, this study, day 3
+Pulverized combustion, 263 MWe, Polish coal
+Pulverized combustion, 6OOMWe. South African coa
FIGURE 3. Comparison of the number size distributions as determined with DMA measured upstream of the ESP from CFBC of Venezuelan coal and pulverized combustion of Polish and South African coals. The size distributions for pulverized coal combustion have been taken from Joutsensaari et al., 1994 (Polish coal) and Lind et al. (1994~) (South African coal).
Mass Size Distributions in Fig. 4. The mean fly ash particle size in The CFBC mass size distributions upstream CFBC is determined by the cut-diameter of of the ESP were determined during both the recycling cyclone, which separates large experimental periods using low-pressure particles to be fed back into the furnace impactors with a cyclone as a precutter. (see Fig. 1). In this study, the mean particle The mass size distributions are presented size of the CFBC fly ash is 20 pm. The
FIGURE 4. The particle mass size distributions of the CFBC flue gas upstream of the ESP as determined with BLPI and precutter cyclone. The cyclone collected particles have been size-classified with Bahco sieve and Coulter Counter methods.
Dow
nloa
ded
by [
Uni
vers
ity o
f St
rath
clyd
e] a
t 07:
03 1
0 O
ctob
er 2
014
Aerosol Science and Technology 24:135-150 April 1996
Ash Vaporization in CFBC
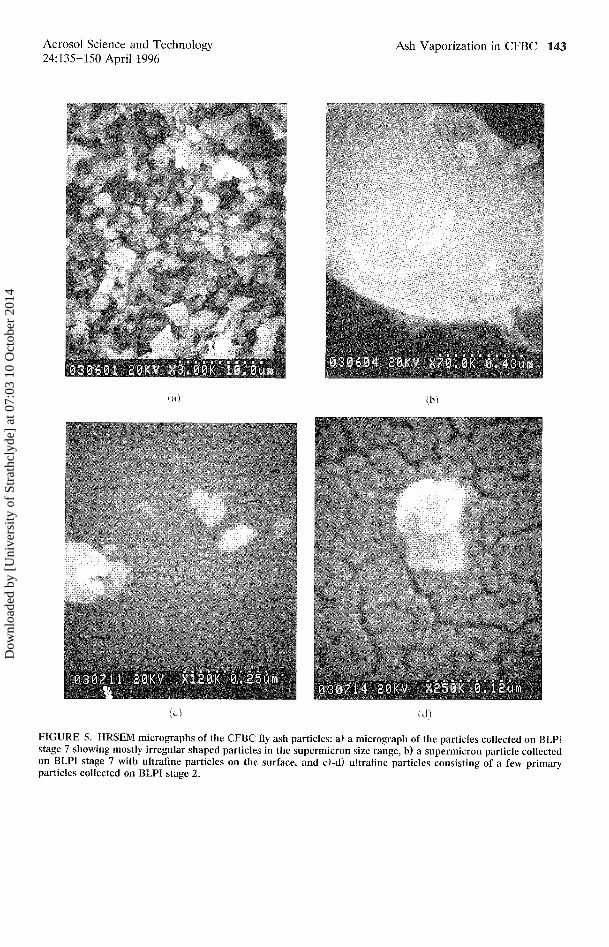
FIGURE 5. HRSEM micrographs of the CFBC fly ash particles: a) a micrograph of the particles collected on BLPI stage 7 showing mostly irregular shaped particles in the supermicron size range, b) a supermicron particle collected on BLPI stage 7 with ultrafine particles on the surface, and c)-d) ultrafine particles consisting of a few primary particles collected on BLPI stage 2.
Dow
nloa
ded
by [
Uni
vers
ity o
f St
rath
clyd
e] a
t 07:
03 1
0 O
ctob
er 2
014
144 T. Lind et al. Aerosol Science and Technology 24:135-150 April 1996
m
$, 150
a 0, roo 0 - u
5 50
0 01 0 1 1 10
DP, Irm
I -c- BLPl 3-3/90
I + BLP14-3/90
+ BLPl5-8/90
--c BLPl6-8/90 I + BLPl7-8\90
I - - x. . . BLPl 8-8/90, ln-s~tu
, - - x - BLPI 9-8/90. ~n-sltu
' - - + - . BLPI 10-3190, in-s~t~
Dow
nloa
ded
by [
Uni
vers
ity o
f St
rath
clyd
e] a
t 07:
03 1
0 O
ctob
er 2
014
Aerosol Science and Technology 24:135-150 April 1996
Ash Vaporization in CFBC 145
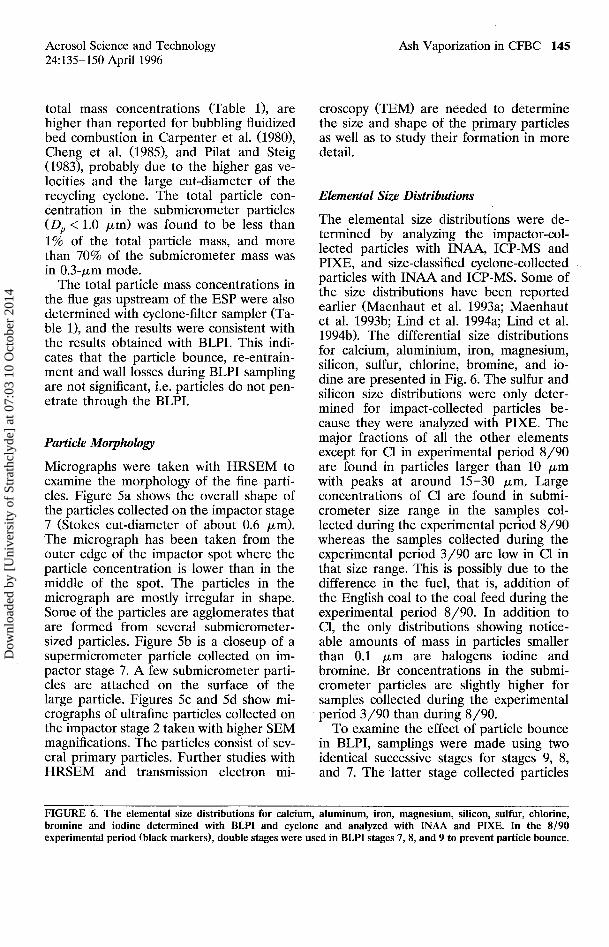
total mass concentrations (Table I), are higher than reported for bubbling fluidized bed combustion in Carpenter et al. (1980), Cheng et al. (1985), and Pilat and Steig (1983), probably due to the higher gas ve- locities and the large cut-diameter of the recycling cyclone. The total particle con- centration in the submicrometer particles (D, < 1.0 pm) was found to be less than 1% of the total particle mass, and more than 70% of the submicrometer mass was in 0.3-pm mode.
The total particle mass concentrations in the flue gas upstream of the ESP were also determined with cyclone-filter sampler (Ta- ble I), and the results were consistent with the results obtained with BLPI. This indi- cates that the particle bounce, re-entrain- ment and wall losses during BLPI sampling are not significant, i.e. particles do not pen- etrate through the BLPI.
Particle Morphology
Micrographs were taken with HRSEM to examine the morphology of the fine parti- cles. Figure 5a shows the overall shape of the particles collected on the impactor stage 7 (Stokes cut-diameter of about 0.6 pm). The micrograph has been taken from the outer edge of the impactor spot where the particle concentration is lower than in the middle of the spot. The particles in the micrograph are mostly irregular in shape. Some of the particles are agglomerates that are formed from several submicrometer- sized particles. Figure 5b is a closeup of a supermicrometer particle collected on im- pactor stage 7. A few submicrometer parti- cles are attached on the surface of the large particle. Figures 5c and 5d show mi- crographs of ultrafine particles collected on the impactor stage 2 taken with higher SEM magnifications. The particles consist of sev- eral primary particles. Further studies with HRSEM and transmission electron mi-
croscopy (TEM) are needed to determine the size and shape of the primary particles as well as to study their formation in more detail.
Elemental Size Distributions
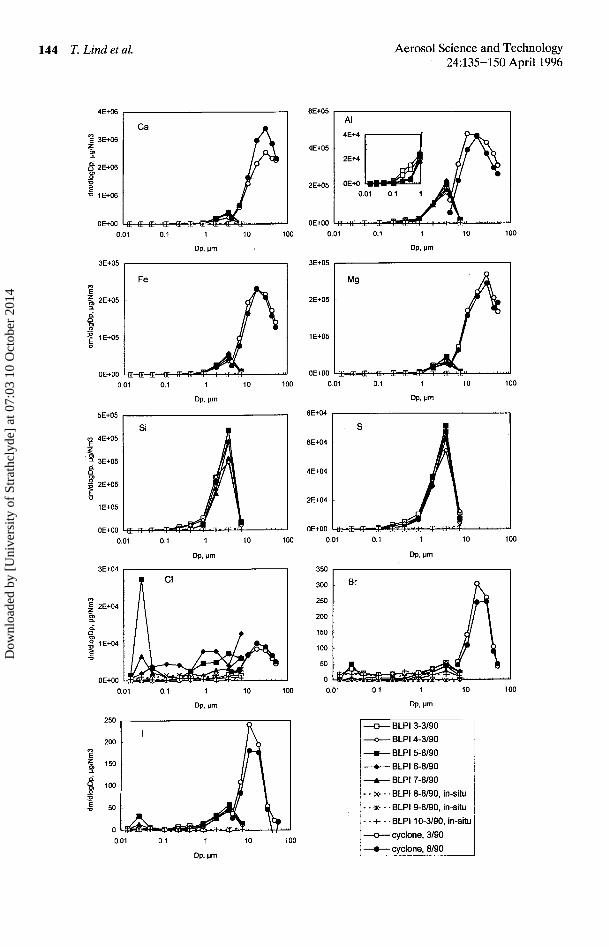
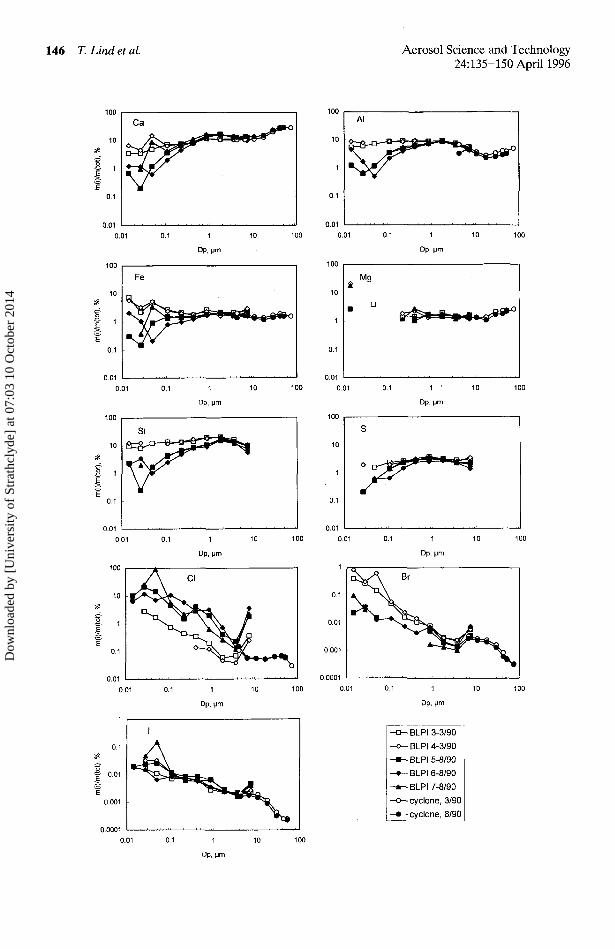
The elemental size distributions were de- termined by analyzing the impactor-col- lected particles with INAA, ICP-MS and PIXE, and size-classified cyclone-collected particles with INAA and ICP-MS. Some of the size distributions have been reported earlier (Maenhaut et al. 1993a; Maenhaut et al. 1993b; Lind et al. 1994a; Lind et al. 1994b). The differential size distributions for calcium, aluminium, iron, magnesium, silicon, sulfur, chlorine, bromine, and io- dine are presented in Fig. 6. The sulfur and silicon size distributions were only deter- mined for impact-collected particles be- cause they were analyzed with PIXE. The major fractions of all the other elements except for C1 in experimental period 8/90 are found in particles larger than 10 pm with peaks at around 15-30 pm. Large concentrations of C1 are found in submi- crometer size range in the samples col- lected during the experimental period 8/90 whereas the samples collected during the experimental period 3/90 are low in C1 in that size range. This is possibly due to the difference in the fuel, that is, addition of the English coal to the coal feed during the experimental period 8/90. In addition to Cl, the only distributions showing notice- able amounts of mass in particles smaller than 0.1 p m are halogens iodine and bromine. Br concentrations in the submi- crometer particles are slightly higher for samples collected during the experimental period 3/90 than during 8/90.
To examine the effect of particle bounce in BLPI, samplings were made using two identical successive stages for stages 9, 8, and 7. The latter stage collected particles
FIGURE 6. The elemental size distributions for calcium, aluminum, iron, magnesium, silicon, sulfur, chlorine, bromine and iodine determined with BLPI and cyclone and analyzed with INAA and PIXE. In the 8/90 experimental period (black markers), double stages were used in BLPI stages 7,8, and 9 to prevent particle bounce.
Dow
nloa
ded
by [
Uni
vers
ity o
f St
rath
clyd
e] a
t 07:
03 1
0 O
ctob
er 2
014
146 T. Lind et al. Aerosol Science and Technology 24:135-150 April 1996
--
+ BLPl 3-3/90
+ BLPl4-3/90
-C- BLPl 5-8/90
+ BLPl6-8/90
4 BLPl 7-8/90
4 cyclone, 3/90
--
Dow
nloa
ded
by [
Uni
vers
ity o
f St
rath
clyd
e] a
t 07:
03 1
0 O
ctob
er 2
014
Aerosol Science and Technology 24:135-150 April 1996
Ash Vaporization in CFBC 147
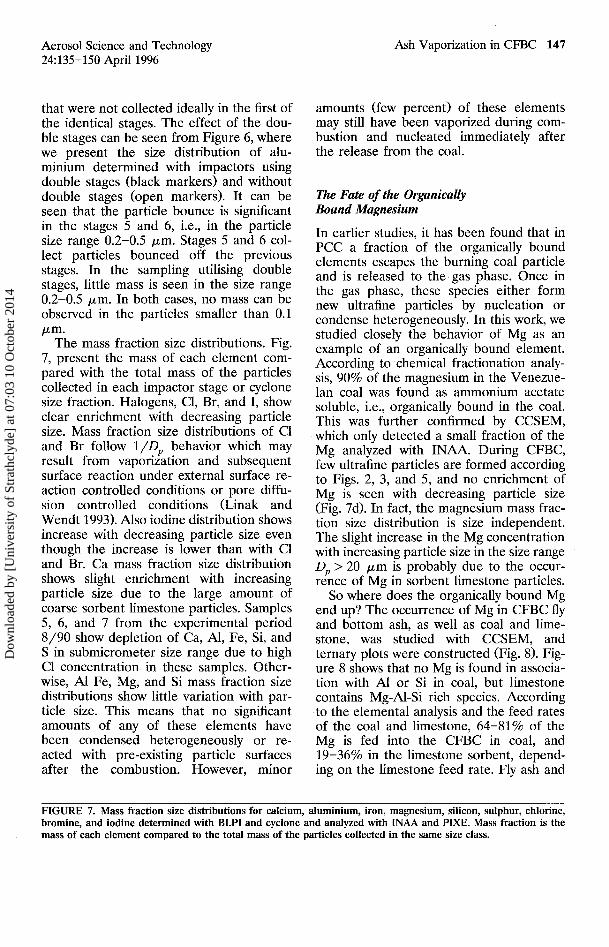
that were not collected ideally in the first of the identical stages. The effect of the dou- ble stages can be seen from Figure 6, where we present the size distribution of alu- minium determined with impactors using double stages (black markers) and without double stages (open markers). It can be seen that the particle bounce is significant in the stages 5 and 6, i.e., in the particle size range 0.2-0.5 pm. Stages 5 and 6 col- lect particles bounced off the previous stages. In the sampling utilising double stages, little mass is seen in the size range 0.2-0.5 pm. In both cases, no mass can be observed in the particles smaller than 0.1 pm.
The mass fraction size distributions. Fig. 7, present the mass of each element com- pared with the total mass of the particles collected in each impactor stage or cyclone size fraction. Halogens, C1, Br, and I, show clear enrichment with decreasing particle size. Mass fraction size distributions of Cl and Br follow l/Dp behavior which may result from vaporization and subsequent surface reaction under external surface re- action controlled conditions or pore diffu- sion controlled conditions (Linak and Wendt 1993). Also iodine distribution shows increase with decreasing particle size even though the increase is lower than with C1 and Br. Ca mass fraction size distribution shows slight enrichment with increasing particle size due to the large amount of coarse sorbent limestone particles. Samples 5, 6, and 7 from the experimental period 8/90 show depletion of Ca, Al, Fe, Si, and S in submicrometer size range due to high C1 concentration in these samples. Other- wise, Al Fe, Mg, and Si mass fraction size distributions show little variation with par- ticle size. This means that no significant amounts of any of these elements have been condensed heterogeneously or re- acted with pre-existing particle surfaces after the combustion. However, minor
amounts (few percent) of these elements may still have been vaporized during com- bustion and nucleated immediately after the release from the coal.
The Fate of the Organically Bound Magnesium
In earlier studies, it has been found that in PCC a fraction of the organically bound elements escapes the burning coal particle and is released to the gas phase. Once in the gas phase, these species either form new ultrafine particles by nucleation or condense heterogeneously. In this work, we studied closely the behavior of Mg as an example of an organically bound element. According to chemical fractionation analy- sis, 90% of the magnesium in the Venezue- lan coal was found as ammonium acetate soluble, i.e., organically bound in the coal. This was further confirmed by CCSEM, which only detected a small fraction of the Mg analyzed with INAA. During CFBC, few ultrafine particles are formed according to Figs. 2, 3, and 5, and no enrichment of Mg is seen with decreasing particle size (Fig. 7d). In fact, the magnesium mass frac- tion size distribution is size independent. The slight increase in the Mg concentration with increasing particle size in the size range D, > 20 p m is probably due to the occur- rence of Mg in sorbent limestone particles.
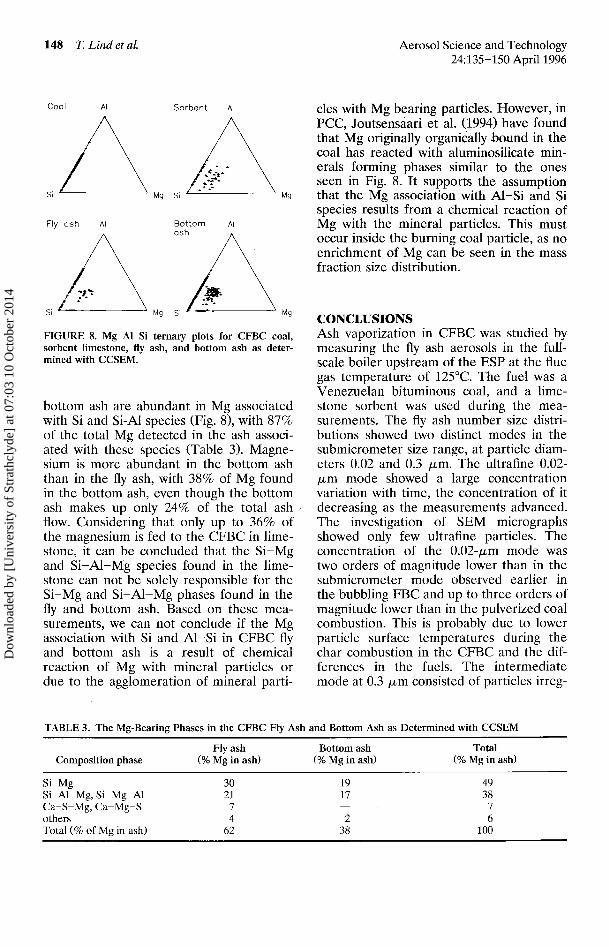
So where does the organically bound Mg end up? The occurrence of Mg in CFBC fly and bottom ash, as well as coal and lime- stone, was studied with CCSEM, and ternary plots were constructed (Fig. 8). Fig- ure 8 shows that no Mg is found in associa- tion with Al or Si in coal, but limestone contains Mg-Al-Si rich species. According to the elemental analysis and the feed rates of the coal and limestone, 64-81% of the Mg is fed into the CFBC in coal, and 19-36% in the limestone sorbent, depend- ing on the limestone feed rate. Fly ash and
FIGURE 7. Mass fraction size distributions for calcium, aluminium, iron, magnesium, silicon, sulphur, chlorine, bromine, and iodine determined with BLPI and cyclone and analyzed with INAA and PIXE. Mass fraction is the mass of each element compared to the total mass of the particles collected in the same size class.
Dow
nloa
ded
by [
Uni
vers
ity o
f St
rath
clyd
e] a
t 07:
03 1
0 O
ctob
er 2
014
148 T. Lind et al. Aerosol Science and Technology 24:135-150 April 1996
Coal Ai
F lyosh Al
Sorbent AI cles with Mg bearing particles. However, in PCC, Joutsensaari et al. (1994) have found that Mg originally organically bound in the coal has reacted with aluminosilicate min-
.<--, - erals forming phases similar to the ones
. - seen in Fig. 8. It supports the assumption ~g Si ~s that the Mg association with AI-Si and Si
species results from a chemical reaction of Bottom AI Mg with the mineral particles. This must
OSh A occur inside the burning coal particle, as no enrichment of Mg can be seen in the mass fraction size distribution.
Mg Si M9 CONCLUSIONS
FIGURE 8. Mg-Al-Si ternary plots for CFBC coal, sorbent limestone, fly ash, and bottom ash as deter- mined with CCSEM.
bottom ash are abundant in Mg associated with Si and Si-Al species (Fig. 8), with 87% of the total Mg detected in the ash associ- ated with these species (Table 3). Magne- sium is more abundant in the bottom ash than in the fly ash, with 38% of Mg found in the bottom ash, even though the bottom ash makes up only 24% of the total ash flow. Considering that only up to 36% of the magnesium is fed to the CFBC in lime- stone, it can be concluded that the Si-Mg and Si-Al-Mg species found in the lime- stone can not be solely responsible for the Si-Mg and Si-Al-Mg phases found in the fly and bottom ash. Based on these mea- surements, we can not conclude if the Mg association with Si and Al-Si in CFBC fly and bottom ash is a result of chemical reaction of Mg with mineral particles or due to the agglomeration of mineral parti-
Ash vaporization in CFBC was studied by measuring the fly ash aerosols in the full- scale boiler upstream of the ESP at the flue gas temperature of 125°C. The fuel was a Venezuelan bituminous coal, and a lime- stone sorbent was used during the mea- surements. The fly ash number size distri- butions showed two distinct modes in the submicrometer size range, at particle diam- eters 0.02 and 0.3 pm. The ultrafine 0.02- pm mode showed a large concentration variation with time, the concentration of it decreasing as the measurements advanced. The investigation of SEM micrographs showed only few ultrafine particles. The concentration of the 0.02-pm mode was two orders of magnitude lower than in the submicrometer mode observed earlier in the bubbling FBC and up to three orders of magnitude lower than in the pulverized coal combustion. This is probably due to lower particle surface temperatures during the char combustion in the CFBC and the dif- ferences in the fuels. The intermediate mode at 0.3 pm consisted of particles irreg-
TABLE 3. The Mg-Bearing Phases in the CFBC Fly Ash and Bottom Ash as Determined with CCSEM
Fly ash Bottom ash Total Composition phase (% Mg in ash) (% Mg in ash) (% Mg in ash)
Si-Mg 30 19 49 Si-A1-Mg, Si-Mg-A1 21 17 38 Ca-S-Mg, Ca-Mg-S 7 - 7 others 4 2 6 Total (% of Mg in ash) 62 38 100
Dow
nloa
ded
by [
Uni
vers
ity o
f St
rath
clyd
e] a
t 07:
03 1
0 O
ctob
er 2
014
Aerosol Science and Technology 24:135-150 April 1996
Ash Vaporization in CFBC 149
ular in shape, and consequently we suggest that the particles have not been formed via a gas to particle route. We propose that the 0.3-pm mode has been formed from the particle melting of the very fine mineral particles in the coal. The mass size distribu- tion in the size range 0.01-70 pm was found to be unimodai with maximum at 20 pm. Less than 1% of the fly ash particles were found in submicrometer size range. Ca, Al, Fe, Mg, and Si showed no signifi- cant vaporization in CFBC. Ninety percent of Mg in coal was organically bound, and it was found to react with quartz and alumi- nosilicate minerals inside the coal particle. A fraction of halogens C1, Br, and I were found to be in the gas phase after the combustion.
The authors want to thank the ministry of Trade and Industry of Finland and companies IVO, Ahlstrom, and Tampella for funding the study through the combustion research program LIEKKI. We want to thank euerybody who took part in the experimentalpart of this work. Willy Maenhaut is grateful to the Belgian "Nationaal Fonds uoor Wetenschappelijk Onderzoek" and the "lntetuni- uersitair Instituut uoor Kernwelenschappen" for research support. We thank Mr. Quint Powell, Mr. Ahhijit Gurau, and Prof: Toiuo i? Kodas from the Uniuersity of New Mexico for canying out HRSEM analyses, Mr. Juha Kurkela from VTT for CCSEM data analysis and Dr. Jorma K. Jokiniemi from VTT for many fruitful discus- sions.
Hernberg, R., Stenberg, J., and Zethraeus, B. (1993). Combust. Flame 95:191-205.
Hillamo, R. E., and Kauppinen, E. I. (1991). Aerosol Sci. Technol. 14:33-47.
Huggins, F. E., Kosmack, D. A., Huffman, G. P., and Lee, R. J. (1980). Coal Mineralogies by SEM automatic image analysis. Scanning Elec- tron Microscopy/l980/1 (0 . Johari, Ed.). SEM, AMF O'Hare, IL, pp. 531-540.
Joutsensaari, J., Kauppinen, E. I., Jokiniemi, J. K., and Helble, J. J. (1994). The Impact of Ash Deposition on Coal Fired Plants: Proceed- ings of the Engineering Foundation Conference (J. Williamson and F. Wigley, Eds.), Taylor & Francis, pp. 613-624.
Kauppinen, E. I. (1992). Aerosol Sci. Technol. 16:171-197.
Kauppinen, E. I. and Pakkanen, T. A. (1990). Enuiron. Sci. Technol. 24:1811-1818.
Kauppinen, E. I., Lind, T., Valmari, T., Ylatalo, S. I., Joutsensaari, J., Jokiniemi, J. K., Mohr, M., Riccius, O., Klippel, N., Mauritzson, C., Lillieblad, L., and Porle, K. (1995) EPRZ/DOE International Conference on Managing Haz- ardous and Pavt'culate Air Pollutants, August 1995, Toronto, Canada, Book 2.
Koch, W., Lodding, H., Molter, W., and Mun- zinger, F. (1988). Staub-Reinhaltung der Luft 48:341-344.
Linak, W. P., and Wendt, J. 0. L. (1993). Prog. Ener. Combust. Sci. 19:145-185.
References Lind, T., Kauppinen, E. I. Kurkela, J., Maen- M.' Okuyama' K.7 Kousaka' Y'' haut, W., Shah, A., and Huggins, F. E. (1995).
S. W., and Seinfeld, J. H. (1990). Aerosol Sci. Mineral, sorbent and sulphur interactions in Technol. 12:225-239. real-scale CFBC, Proceedings of the 13th In-
Benson, S. A., and Holm, P. L. (1985). Ind. Eng. ternational Fluidized Bed Combustion Con- Chem. Prod. Res. Deu. 24:145-149. ference, May 1995, Orlando, Florida, Vol. 2,
Carpenter, R. L., Newton, G. J., Rothenberg, pp. 1129-1136. S. J., and DeNee, P. B. (1980). Enuiron. Sci. Technol. 14:854-859. Lind, T. M., Kauppinen, E. I., Jokiniemi, J. K.,
Cheng, Y.-S., Carpenter, R. L., Barr, E. B., and Maenhaut, W., and Pakkanen, T. A. (1994a). Hobbs, C. H. (1985). Aerosol Sci. Technol. The Impact of Ash of Fired 4:175-189. Plants: Proceedings of the Engineering Founda-
Flagan, R. C., and Seinfeld, J. H. (1988). Funda- tion Conference (J. Williamson and F. Wigley,
mentals o f Air Pollution Engineering, Prentice Eds.), Taylor& Francis, pp. 77-88.
Hall, ~nglewood Cliffs, N J , ~ ~ . 356372 . Lind, T., Kauppinen, E. I., Jokiniemi, J. K., and Helble, J. J., Neville, M., and Sarofim, A. F. Maenhaut, W. (1994b). Twenty-Fifth Sympo-
(1986). Twenty-First Symposium (International) sium (International) on Combustion, The on Combustion, The Combustion Institute, Combustion Institute, Pittsburgh, 1994, pp. Pittsburgh, pp. 411-417. 201-209.
Dow
nloa
ded
by [
Uni
vers
ity o
f St
rath
clyd
e] a
t 07:
03 1
0 O
ctob
er 2
014
150 T. Lind et al. Aerosol Science and Technology 24:135-150 April 1996
Lind, T. Kauppinen, E. I. Yratalo, S., Joutsen- saari, J., Jokiniemi, J. K., Lillieblad, L., Klip- pel, N., and Mohr, M. (1994~). Abstract Book of Fourth International Aerosol Conference, August 29-September 2, 1994, Los Angeles, California, pp. 486-487.
Liu, B. Y. H., Pui, D. Y. H., Rubow, K. L., and Szymanski, W. W. (1985). Ann. Occup. Hyg. 29:251-269.
Maenhaut, W., Kauppinen, E. I., and Lind, T. M. (1993a). J. Radioanal. Nuclear Chem. 167:259-269.
Maenhaut, W., Royset, O., Vadset, M., Kaup- pinen, E. I., and Lind, T. L. (1993b). Nuclear Instrum. Methods Phys. Res. B75:266-272.
Markowski, G. R., Ensor, D. S., Hooper, R. G., and Carr, R. C. (1980). Enuiron. Sci. Technol. 14:1400-1402.
McElroy, M. W., Carr, R. C., Ensor, D. S., and Markowski, G. R. (1982). Science 215:13-19.
Pilat, M. J., and Steig, T. W. (1983). Atmos. Enuiron. 17:2429-2433.
Quann, R. J., and Sarofim, A. F. (1982). Nine- teenth Symposium (International) on Combus- tion, The Combustion Institute, Pittsburgh, pp. 1429-1440.
Quann, R. J., Neville, M., and Sarofim, A. F. (1990). Combustion Sci. Technol. 74:245-265.
Sarofim, A. F., Beer, J. M., Baron, R. E., and Hodges, J. L. (1987). AFBC Technical Source Book, (S.-E. Tung and G. C. Williams, Eds.), Final Report, DOE/MC/14536-2544.
Shah, N., Huffman, G. P., Huggins, F. E., and Shah, A. D. (1992). Inorganic Transformations and Ash Deposition during Combustion: Pro- ceedings of the Engineering Foundation Confer- ence (S. A. Benson, Ed.), pp. 179-190.
Senior, C. L., and Flagan, R. C. (1982). Aerosol Sci. Technol. 1:371-383.
Tang, J. T., and Taylor, E. S. (1987). AFBC Technical Source Book 6.-E. Tung and G. C. Williams, Eds.), Final Report, DOE/MC/ 14536-2544.
Taylor, D. D., and Flagan, R. C. (1982). Aerosol Sci. Technol. 1:103-117.
Wiedensohler, A. (1988). J . Aerosol Sci. 19: 387-389.
Wildegger-Gaissmaier, A. E., and Aganval, P. K. (1990). Trans IChemE 68:251-262.
Ylatalo, S. I., Kauppinen, E. I. Hautanen, J., Joutsensaari, J., Ahonen, P., Lind, T. M., Jokiniemi, J. K., and Kilpelainen, M. (1992). J. Aerosol Sci. 23:S795-S798.
Received December 20, 1994; revised Septem- ber 19, 1995.
Dow
nloa
ded
by [
Uni
vers
ity o
f St
rath
clyd
e] a
t 07:
03 1
0 O
ctob
er 2
014