Embed Size (px)
Citation preview
ASHEBORO CITY BOARD OF EDUCATION WINTER RETREAT
Saturday, January 24, 2015
Professional Development Center
8:15 a.m. Breakfast
Welcome, Statistical Profile, and Outcomes
Planning for the Future
8:15 – 8:40 Strengthening Our Public Schools – Dr. Terry Worrell and Dr. Drew Maerz 8:40 – 9:40 Strategic Planning and SACS Standards – Dr. Terry Worrell And Jennifer Smith 9:40 – 10:00 E-Rate 2.0: Changes and Effects for Technology Planning – Nathan Craver and Lee Clark 10:00– 10:15 Break 10:15 – 12:00 Career Readiness Hands-on Experience – Dr. Julie Pack and
Team
12:00 Lunch
12:30 – 2:30 Long-Range Facility Planning – Smith-Sinnett
2:30 – 2:45 Drivers Education in the Future
2:45 – 3:00 Investing in Rural Education
3:00 – 3:10 Break
3:10 – 4:00 Board Operation Planning
4:00 p.m. Adjourn
Asheboro City Schools … 110 years of excellence!
Asheboro City Schools 1126 S. Park Street
P.O. Box 1103 Asheboro, NC 27204-1103
336-625-5104 www.asheboro.k12.nc.us
Asheboro City Schools Statistical Profile
2014
Dr. Terry W. Worrell, Superintendent Mrs. Jennifer Smith, Assistant Superintendent C&I Dr. Brad Rice, Assistant Superintendent Support Services
We are committed to providing quality learning opportunities for all students in a safe and inviting environment so that our students
can become successful lifelong learners, prepared for 21st century
global citizenship.
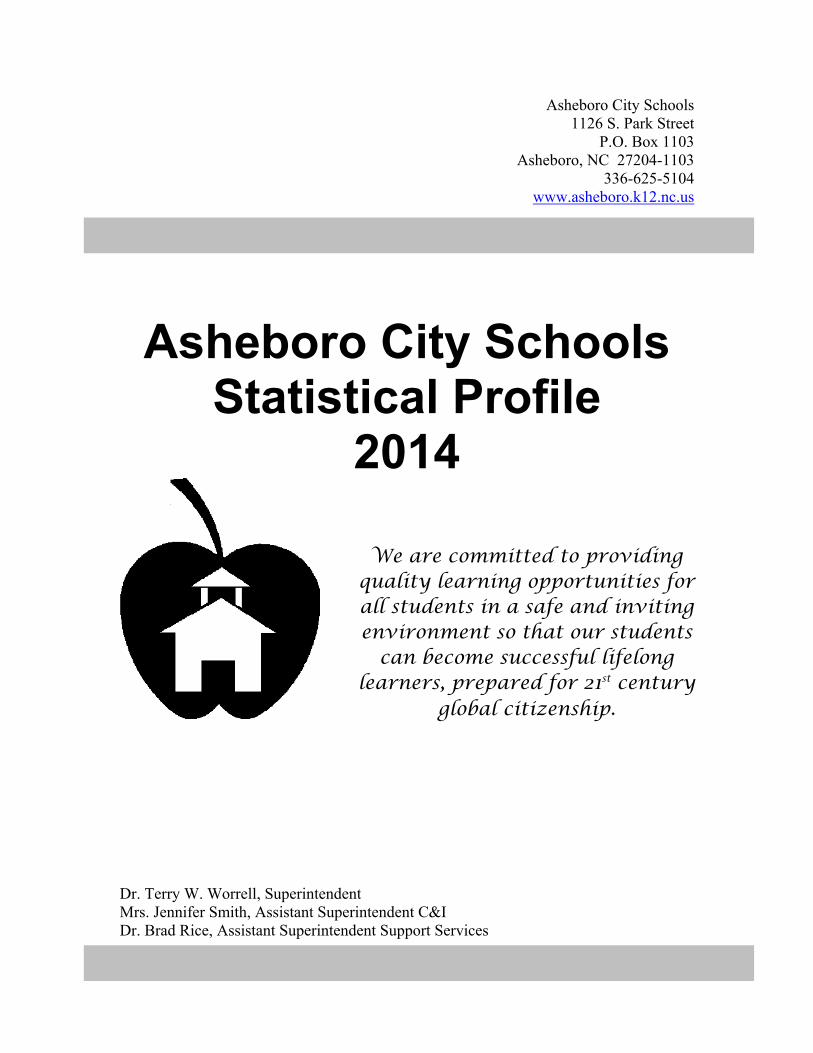
Asheboro City Schools Future Plan
Strategic Plan Goals and Objectives
2013‐2016
Goals and Objectives Annual Milestones of Progress 2013‐14 2014‐15 2015‐16 OVERALL STRATEGIC GOAL: 90% Graduation Rate!
OBJECTIVE 1: ENGAGE EACH STUDENT—All teachers will engage each student in meaningful, authentic and rigorous work through the use of innovative instructional practices and supportive technologies that will motivate students to be self‐directed and inquisitive learners. 1. Students develop 21st century skills:
Critical thinking and problem solving
Collaboration Communication Creativity
Focus: critical thinking and collaboration
Critical thinking rubric revised and distributed to all staff. Rubric being used to evaluate curriculum units for application of critical thinking and problem solving.
Thematic/concept‐based curriculum units were collaboratively developed for all four core subjects (English/Language Arts, Math, Science, and Social Studies) aligned with new standards. Intentional focus on the 4 C’s, and in particular, critical thinking.
50 teachers and staff members participated in high quality professional development on problem‐based learning conducted by the Buck Institute. Middle
Focus: communication and collaboration Implement PBL units using the district wide PBL protocol and appropriate performance rubrics at each school. Identify and nurture problem‐based partnerships with the community and beyond for planning and evaluating real world solutions.
Focus: creativity and collaboration
and high school science teachers piloted the PBL model in the spring.
2. Expand student opportunities for global awareness
Global awareness task force reviewed research, literature, and conducted several site visits to develop recommendations for embedding global studies into the curriculum.
Led by their 2013‐14 TLA participants, Teachey School embraced a new global studies approach with each grade level adopting a country or a state and communicating with their new friends via Skype, Google Maps, culture boxes, and letters.
Mandarin Chinese I and II were offered for the first time at AHS. Enrollment has significantly increased for 2014‐15. Chinese cultural experiences were provided at elementary schools by Ms. Chen Jie.
Plan for implementation of a full immersion and/or 50/50 immersion language program at one or more elementary schools in 2015‐2016. Provide students opportunities in the classroom and embedded within instruction to expand global awareness and understanding.
3. Improve climate of safety and security
Implement Positive Behavior Instructional Support program at each school.
Each school’s PBIS team meets monthly to develop Tier I, II, and III positive behavior systems of support. All schools achieved PBIS SET scores of 80% or greater this spring, with 4 schools earning 100% on both Expectations Taught and Total Score (Lindley Park, McCrary, Teachey, and SAMS).
Continue Positive Behavior Instructional Support program at each school. Continue project to address discipline disproportionality.
Implement strategies to reduce office referrals and OSS for black students.
The SAMS PBIS team, Dr. Brad Rice, and Pam Johnson are working with Caycee McCamish, Region 5 PBIS Coordinator, to review discipline data disaggregated by race and ethnicity. They are merging PBIS and Connected Schools philosophical foundations in ground‐breaking work. They are developing working definitions of subjective offense categories such as “disruption” and “disrespect.” They are also investigating alternatives to OSS that may prove more effective in creating school environments that are more productive and inclusive. Develop district‐wide program to prevent bullying.
A bullying task force researched best practices and developed student friendly definitions for use in school level lessons. Guidance counselors are creating lessons for use in our schools in 2014‐15. Dr. Rice will complete staff training in the fall to assure consistency in the implementation of the anti‐bullying message. Review and update crisis plans.
Current crisis plans were reviewed at each site in November and December by
Implement district‐wide program to prevent bullying. Implement updated lockdown and crisis plan procedures.
Dr. Rice, Mr. Mize, Asheboro Fire Department, Emergency Management Services, School principals, SRO’s, and Dr. Frost. Updates to North Carolina lockdown procedures for 2014‐15 were presented to all principals May 14, 2014.
4. Integrate technology for learning
Develop and implement next generation plan.
Updated 2014‐2016 Technology Plan developed, submitted, and approved by NC DPI.
A district technology integration framework (SAMR) has been selected to assist teachers in assessing their level of technology integration and providing appropriate professional development.
The Technology Advisory Council researched and recommended a new device for the AHS 1:1 program. Chromebooks were selected and have been ordered for 2014‐15.
Implement approved Technology plan. Provide professional development and support for teachers on the SAMR model for integrating technology and other identified needs based on staff surveys. Implement support for new Chromebook devices at AHS. Redistribute AHS laptops as needed throughout the district.
OBJECTIVE 2: ASSESS FOR LEARNING—ACS will develop and implement a comprehensive assessment system that accurately reflects student demonstration and mastery of ACS outcomes for student success. 1. Determine evidences of academic
proficiency in core curriculum Data sources were identified that are evidences of student academic progress throughout the school year.
District instructional leaders developed and implemented new benchmark assessments to monitor
Determine how to systematically capture and share student data at the classroom, school, and district levels as it is collected to inform instruction and intervention.
student progress throughout the year. The 3rd grade reading benchmark assessments were used as an alternative assessment for 3rd graders to demonstrate proficiency in reading comprehension as required by Read to Achieve legislation.
Evidences of academic proficiency in the core curriculum were selected for tracking district‐wide academic progress throughout the 2013‐2016 strategic plan cycle. They are listed at the end of this document.
2. Implement consistent use of performance rubrics
Improve design and use of performance rubrics to guide students in demonstrating learning.
Dr. Maerz provided training at all schools for developing common assessments and appropriate rubrics for assessing student mastery of skills in a timely manner.
Develop an online platform for sharing common assessments linked to curriculum standards and units.
OBJECTIVE 3: IMPROVE ACHIEVEMENT—Each school will improve achievement for all students while closing gaps of identified student groups. 1. Implement consistent plan for literacy
instruction and assessment across the curriculum
Focus: K‐12 literacy plan; instruction and assessment plan for the writing process.
Extensive work has been done to develop a comprehensive district‐wide literacy plan including reading and writing. The plan will provide a strong foundation for future professional development and consistency in our approach to literacy instruction across the district. An important part of the plan is the development of grade‐level rubrics for
Share district literacy plan with teachers and staff and provide professional development aligned with the plan. Pilot consistent phonics instructional approach in pre‐kindergarten and kindergarten classrooms at each school site.
assessing student writing. The plan is located at this Google site: https://sites.google.com/a/asheboro.k12.nc.us/acs‐literacy‐plan/
Our instructional team has partnered with UNCG faculty to develop a plan for 2014 summer professional development to improve writing instruction. Implement data‐driven early intervention system for struggling readers.
A consistent RtI process (including a roadmap and fidelity checklist) for struggling readers was developed and implemented in all elementary schools. Regular school monitoring visits were conducted to support fidelity to the plan. Implement strategies to prevent summer reading loss.
Research on effective strategies for preventing summer reading loss was summarized and disseminated. Plans for our third grade summer reading camp are incorporating those strategies. Additional support for readers over the summer will be provided by the READS project and by elementary schools opening their media centers to allow students to have access to reading material.
Implement writing strategies from 2014 UNCG summer partnership initiative. Continue Reading Foundations training for all K‐2 teachers to increase reading content knowledge and enhance instructional skills as funding is available.
2. Develop and implement strategies to improve student academic success
Implement transition plans for at‐risk students between elementary, middle, and high school.
School‐based transition teams identified at‐risk students entering 6th and 9th grades and met regularly to provide needed supports for students. Develop an academic plan for each 7th grade student aligned with vocational interests and individual goals that culminates in graduation.
Progress was made in selecting a set of individual student assessments and inventories to be tracked from grades 7 to 12. Challenges arose when determining the best method to house the information digitally. A new product, Career Cruising, was discovered that will provide the online structure that we desire.
Convene Asheboro City Schools Transition Team and implement district wide transition plan. Implement Career Cruising as the structure for planning, career and academic inventories, lessons, and online access for students, teachers, and parents.
3. Expand learning opportunities before and after school and summer, and enrichment and advancement opportunities for middle school students, while removing barriers for student participation
Existing middle school enrichment programs have been identified and documented.
An additional high school course will be offered in middle school in 2014‐15—Earth and Environmental Science.
Credit by Demonstrated Mastery process has been developed for Spanish I and World History.
Determine areas of need not addressed in current offerings and research what activities would interest various groups of students. Develop process for expanding Credit by Demonstrated Mastery to other allowable course offerings.
OBJECTIVE 4: CREATE OPPORTUNITIES—ACS will create opportunities for parents, community and business leaders to fulfill their essential roles as actively engaged partners in supporting student achievement and outcomes for student success. 1. Enhance opportunities for parents to
support their child’s academic achievement
Increase parent outreach through workshops or classes to support their child’s academic achievement.
Parent survey data was shared and used by schools as they planned parent events this year and will also guide planning for 2014‐15. Partner with UNCG and community stakeholders to assess and evaluate needs for a Parent Academy.
Local resources have been identified and shared with principals. A parent community resource page on our website is under development.
Develop online video curriculum resources for parents.
2. Enhance business, community, and higher education partnerships
Implement communication strategy to increase community awareness and involvement in our schools.
Launched new SharpSchool website in August; launched new online Parent Portal in January; published a new calendar format for the annual report to the community; piloted “I’m a Blue Comet” initiative in the fall. Formalize community partnerships and volunteer services and establish protocols for data collection.
Implement communication strategy to increase community awareness and involvement in our schools.
Collecting information from schools regarding current community partners and volunteers to use for future planning. Increase student internship and job shadowing opportunities, including paid student internships.
Increased number of student internships in CTE from 4 to 7.
OBJECTIVE 5: BUILD CAPACITY—ACS will develop essential leader, teacher, and staff competencies and optimize all resources to achieve the school district’s strategic goal and outcomes for student success. 1. Provide quality professional and
leadership development Provide district support for teacher‐led professional development.
Teachers led conference‐style professional development day sessions in January. The feedback from their peers was extremely positive. Continue Teacher Leadership Academy for cohort #4.
Cohort #4 successfully completed TLA in April and two members, Barry Barber and Laura Popp, presented their TLA projects and reflections to the Board of Education in May.
Continue teacher‐led professional development initiatives. Continue Teacher Leadership Academy for cohort #5.
2. Improve staff recruitment and retention processes
Improve selection protocols.
Updated resources provided to principals for improving skills in reviewing applications, preparing for interviews, and checking references.
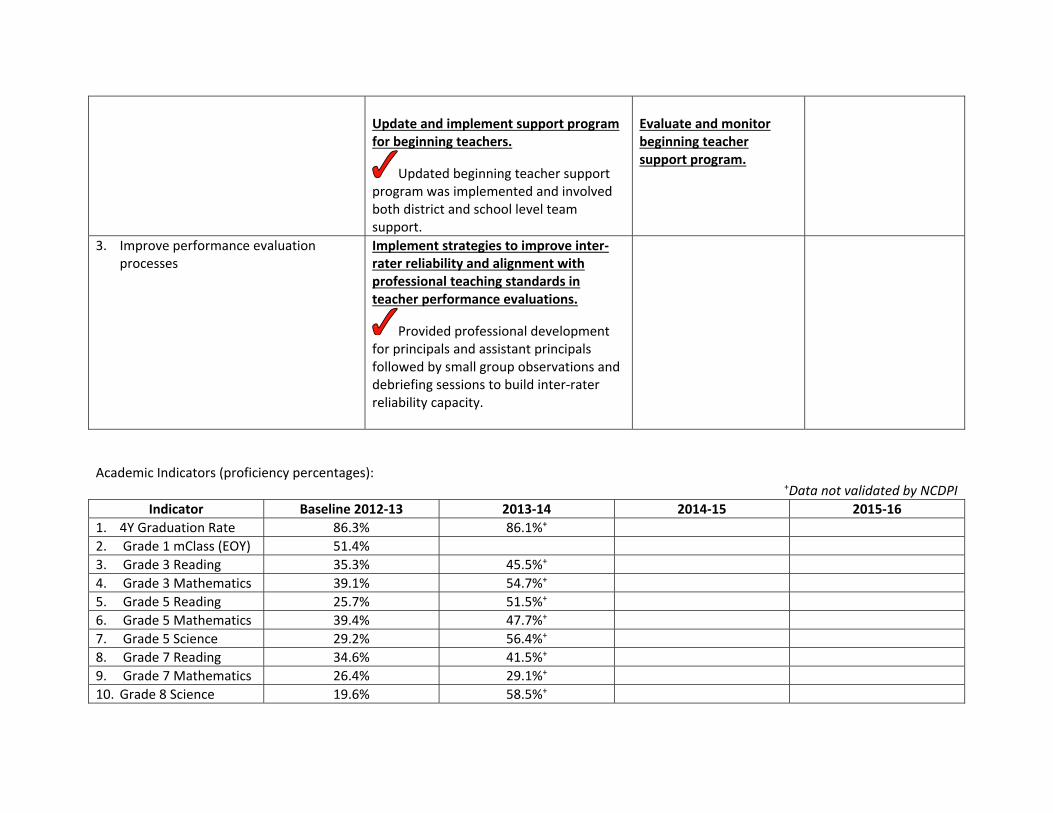
Update and implement support program for beginning teachers.
Updated beginning teacher support program was implemented and involved both district and school level team support.
Evaluate and monitor beginning teacher support program.
3. Improve performance evaluation processes
Implement strategies to improve inter‐rater reliability and alignment with professional teaching standards in teacher performance evaluations.
Provided professional development for principals and assistant principals followed by small group observations and debriefing sessions to build inter‐rater reliability capacity.
Academic Indicators (proficiency percentages): +Data not validated by NCDPI
Indicator Baseline 2012‐13 2013‐14 2014‐15 2015‐16 1. 4Y Graduation Rate 86.3% 86.1%+ 2. Grade 1 mClass (EOY) 51.4% 3. Grade 3 Reading 35.3% 45.5%+ 4. Grade 3 Mathematics 39.1% 54.7%+ 5. Grade 5 Reading 25.7% 51.5%+ 6. Grade 5 Mathematics 39.4% 47.7%+ 7. Grade 5 Science 29.2% 56.4%+ 8. Grade 7 Reading 34.6% 41.5%+ 9. Grade 7 Mathematics 26.4% 29.1%+ 10. Grade 8 Science 19.6% 58.5%+
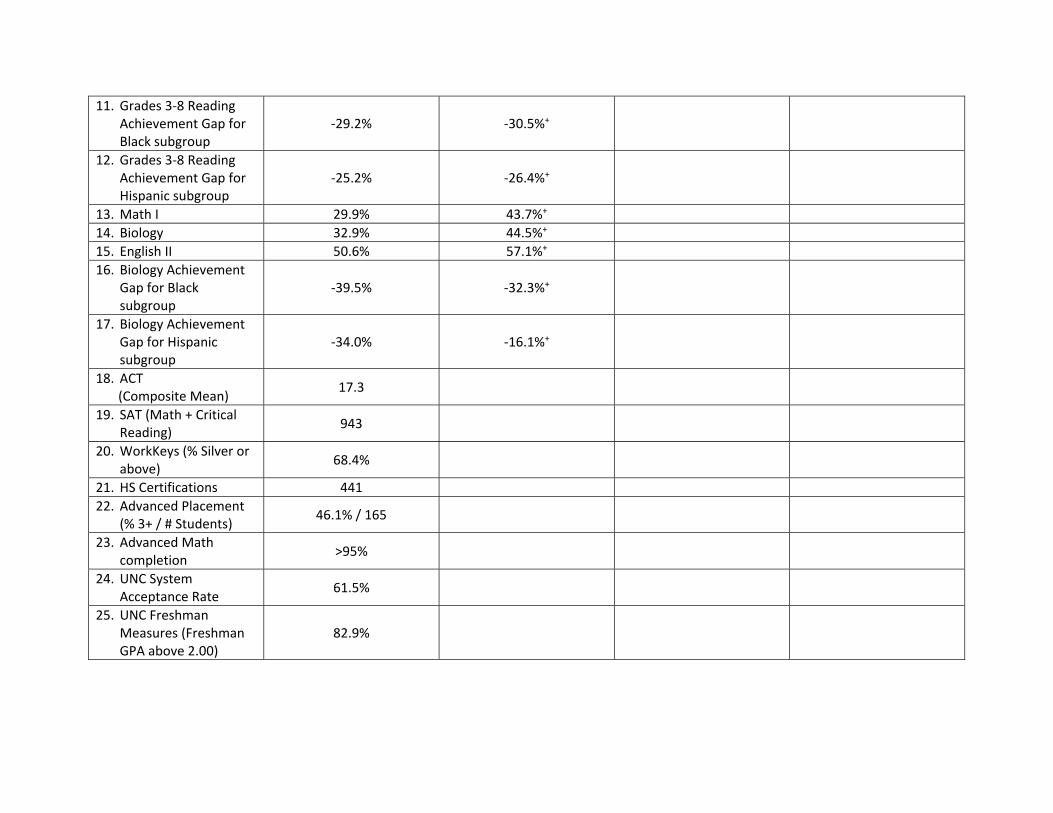
11. Grades 3‐8 Reading Achievement Gap for Black subgroup
‐29.2% ‐30.5%+
12. Grades 3‐8 Reading Achievement Gap for Hispanic subgroup
‐25.2% ‐26.4%+
13. Math I 29.9% 43.7%+ 14. Biology 32.9% 44.5%+ 15. English II 50.6% 57.1%+ 16. Biology Achievement
Gap for Black subgroup
‐39.5% ‐32.3%+
17. Biology Achievement Gap for Hispanic subgroup
‐34.0% ‐16.1%+
18. ACT (Composite Mean) 17.3
19. SAT (Math + Critical Reading) 943
20. WorkKeys (% Silver or above) 68.4%
21. HS Certifications 441 22. Advanced Placement
(% 3+ / # Students) 46.1% / 165
23. Advanced Math completion >95%
24. UNC System Acceptance Rate 61.5%
25. UNC Freshman Measures (Freshman GPA above 2.00)
82.9%
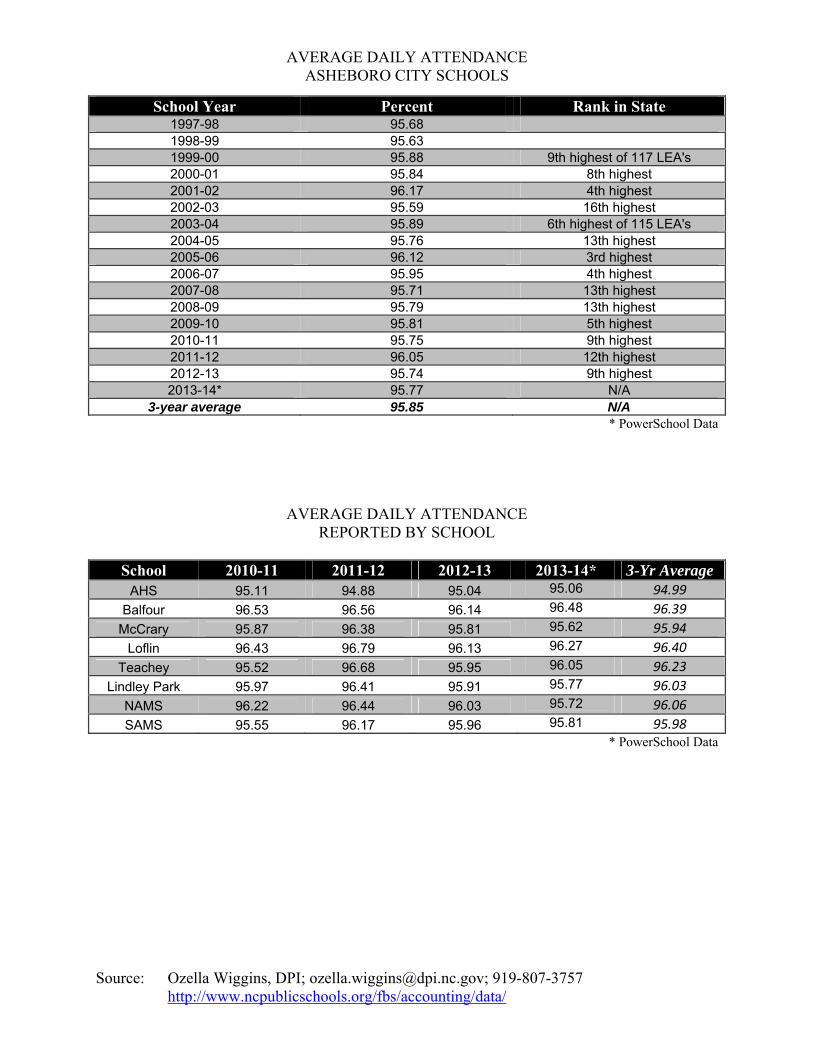
AVERAGE DAILY ATTENDANCE ASHEBORO CITY SCHOOLS
Source: Ozella Wiggins, DPI; [email protected]; 919-807-3757 http://www.ncpublicschools.org/fbs/accounting/data/
School Year Percent Rank in State 1997-98 95.68 1998-99 95.63 1999-00 95.88 9th highest of 117 LEA's 2000-01 95.84 8th highest 2001-02 96.17 4th highest 2002-03 95.59 16th highest 2003-04 95.89 6th highest of 115 LEA's 2004-05 95.76 13th highest 2005-06 96.12 3rd highest 2006-07 95.95 4th highest 2007-08 95.71 13th highest 2008-09 95.79 13th highest 2009-10 95.81 5th highest 2010-11 95.75 9th highest 2011-12 96.05 12th highest 2012-13 95.74 9th highest 2013-14* 95.77 N/A
3-year average 95.85 N/A * PowerSchool Data
AVERAGE DAILY ATTENDANCE REPORTED BY SCHOOL
School 2010-11 2011-12 2012-13 2013-14* 3-Yr Average
AHS 95.11 94.88 95.04 95.06 94.99 Balfour 96.53 96.56 96.14 96.48 96.39
McCrary 95.87 96.38 95.81 95.62 95.94 Loflin 96.43 96.79 96.13 96.27 96.40
Teachey 95.52 96.68 95.95 96.05 96.23 Lindley Park 95.97 96.41 95.91 95.77 96.03
NAMS 96.22 96.44 96.03 95.72 96.06 SAMS 95.55 96.17 95.96 95.81 95.98
* PowerSchool Data
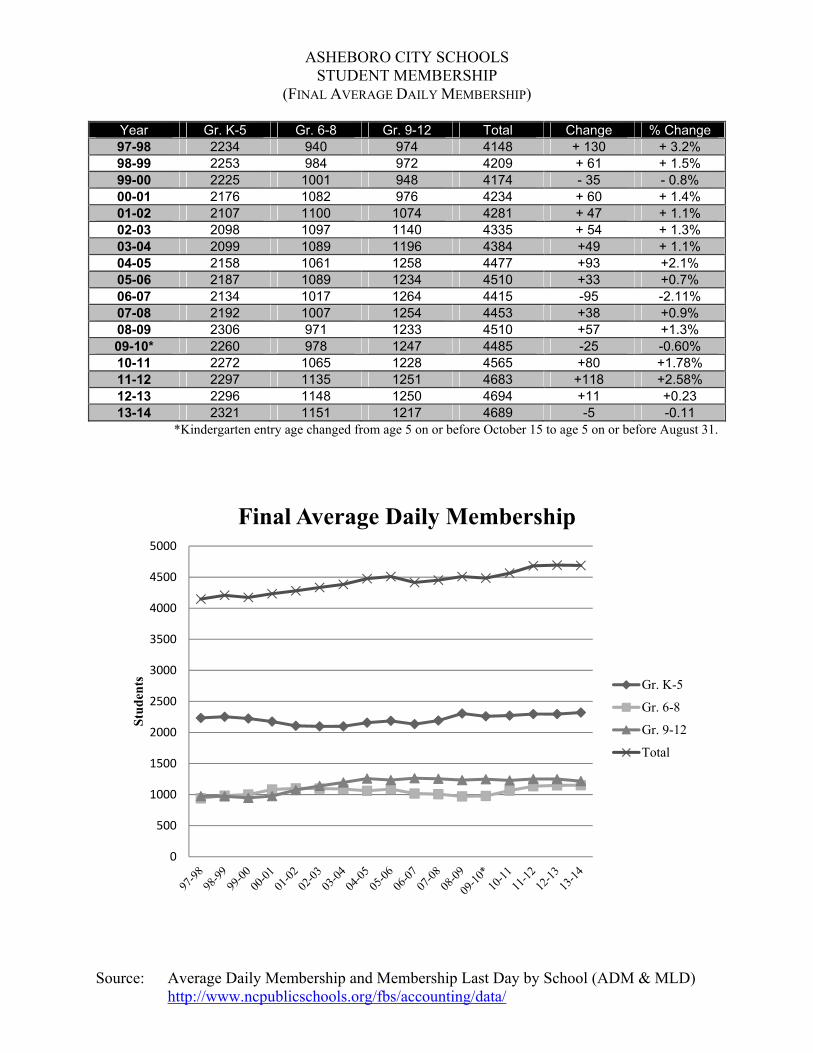
ASHEBORO CITY SCHOOLS STUDENT MEMBERSHIP (FINAL AVERAGE DAILY MEMBERSHIP)
Source: Average Daily Membership and Membership Last Day by School (ADM & MLD) http://www.ncpublicschools.org/fbs/accounting/data/
Year Gr. K-5 Gr. 6-8 Gr. 9-12 Total Change % Change 97-98 2234 940 974 4148 + 130 + 3.2% 98-99 2253 984 972 4209 + 61 + 1.5% 99-00 2225 1001 948 4174 - 35 - 0.8% 00-01 2176 1082 976 4234 + 60 + 1.4% 01-02 2107 1100 1074 4281 + 47 + 1.1% 02-03 2098 1097 1140 4335 + 54 + 1.3% 03-04 2099 1089 1196 4384 +49 + 1.1% 04-05 2158 1061 1258 4477 +93 +2.1% 05-06 2187 1089 1234 4510 +33 +0.7% 06-07 2134 1017 1264 4415 -95 -2.11% 07-08 2192 1007 1254 4453 +38 +0.9% 08-09 2306 971 1233 4510 +57 +1.3% 09-10* 2260 978 1247 4485 -25 -0.60% 10-11 2272 1065 1228 4565 +80 +1.78% 11-12 2297 1135 1251 4683 +118 +2.58% 12-13 2296 1148 1250 4694 +11 +0.23 13-14 2321 1151 1217 4689 -5 -0.11
*Kindergarten entry age changed from age 5 on or before October 15 to age 5 on or before August 31.
0
500
1000
1500
2000
2500
3000
3500
4000
4500
5000
Stu
den
ts
Final Average Daily Membership
Gr. K-5
Gr. 6-8
Gr. 9-12
Total
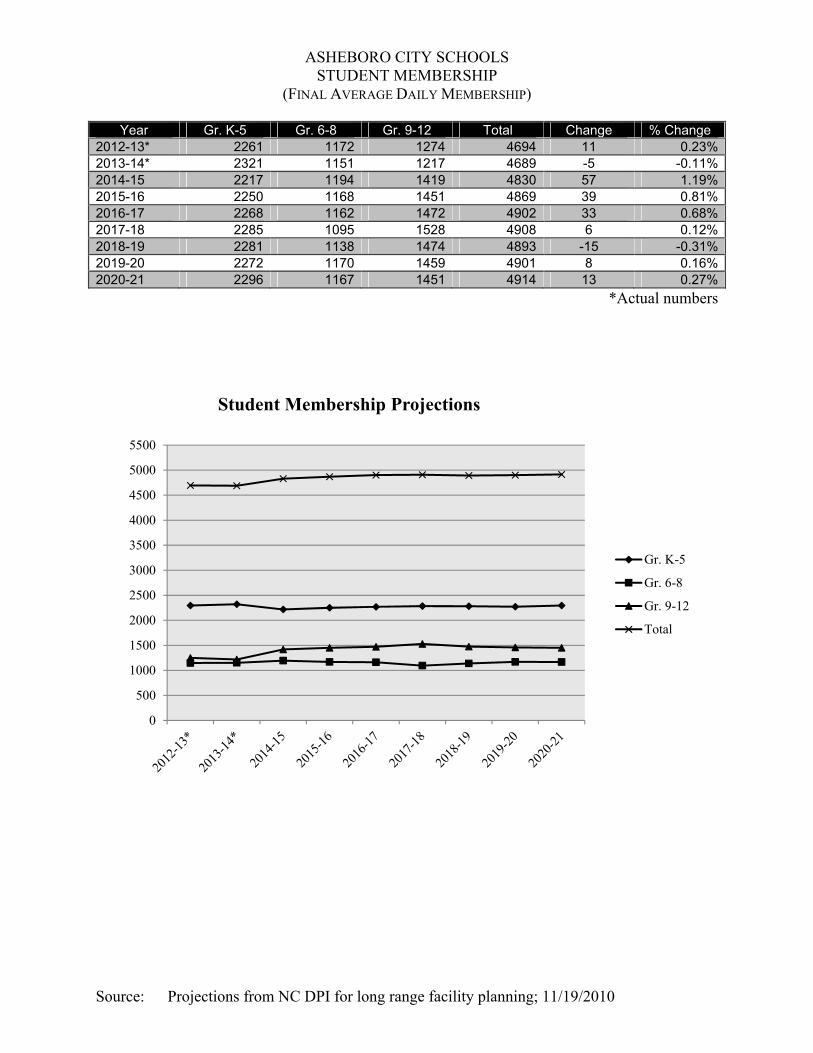
ASHEBORO CITY SCHOOLS STUDENT MEMBERSHIP (FINAL AVERAGE DAILY MEMBERSHIP)
Source: Projections from NC DPI for long range facility planning; 11/19/2010
Year Gr. K-5 Gr. 6-8 Gr. 9-12 Total Change % Change 2012-13* 2261 1172 1274 4694 11 0.23%2013-14* 2321 1151 1217 4689 -5 -0.11%2014-15 2217 1194 1419 4830 57 1.19%2015-16 2250 1168 1451 4869 39 0.81%2016-17 2268 1162 1472 4902 33 0.68%2017-18 2285 1095 1528 4908 6 0.12%2018-19 2281 1138 1474 4893 -15 -0.31%2019-20 2272 1170 1459 4901 8 0.16%2020-21 2296 1167 1451 4914 13 0.27%
*Actual numbers
0
500
1000
1500
2000
2500
3000
3500
4000
4500
5000
5500
Student Membership Projections
Gr. K-5
Gr. 6-8
Gr. 9-12
Total
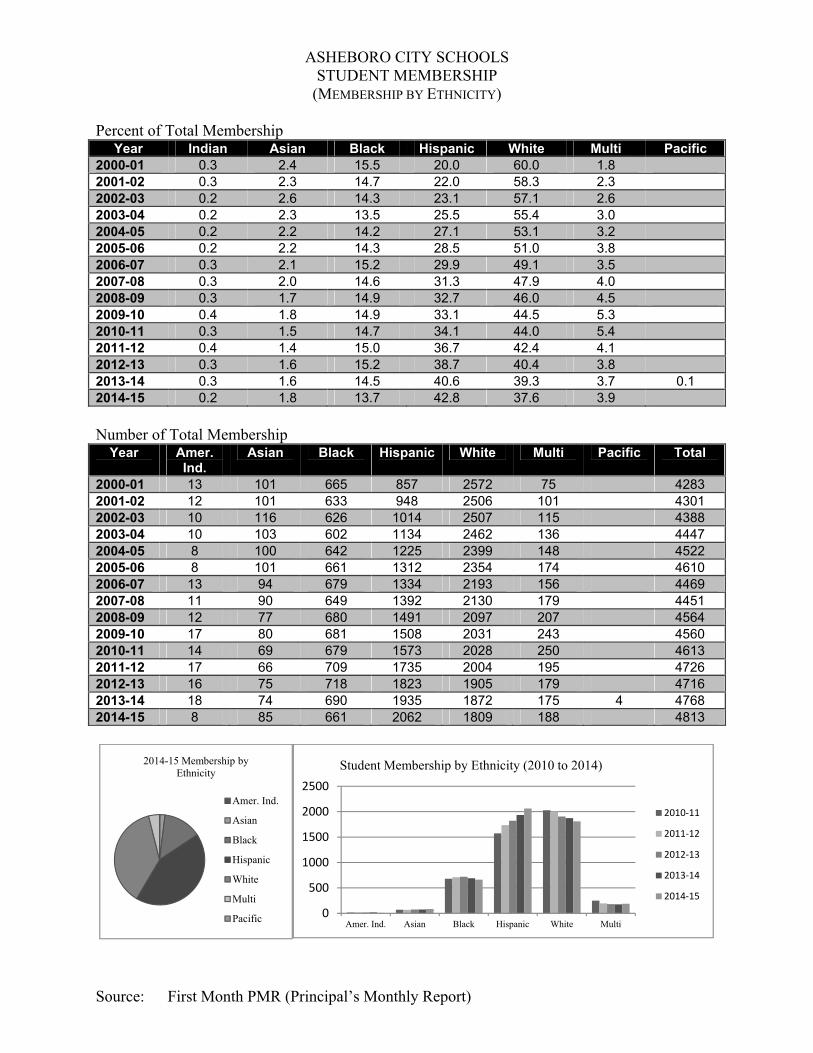
ASHEBORO CITY SCHOOLS STUDENT MEMBERSHIP (MEMBERSHIP BY ETHNICITY)
Source: First Month PMR (Principal’s Monthly Report)
Percent of Total Membership Year Indian Asian Black Hispanic White Multi Pacific
2000-01 0.3 2.4 15.5 20.0 60.0 1.8 2001-02 0.3 2.3 14.7 22.0 58.3 2.3 2002-03 0.2 2.6 14.3 23.1 57.1 2.6 2003-04 0.2 2.3 13.5 25.5 55.4 3.0 2004-05 0.2 2.2 14.2 27.1 53.1 3.2 2005-06 0.2 2.2 14.3 28.5 51.0 3.8 2006-07 0.3 2.1 15.2 29.9 49.1 3.5 2007-08 0.3 2.0 14.6 31.3 47.9 4.0 2008-09 0.3 1.7 14.9 32.7 46.0 4.5 2009-10 0.4 1.8 14.9 33.1 44.5 5.3 2010-11 0.3 1.5 14.7 34.1 44.0 5.4 2011-12 0.4 1.4 15.0 36.7 42.4 4.1 2012-13 0.3 1.6 15.2 38.7 40.4 3.8 2013-14 0.3 1.6 14.5 40.6 39.3 3.7 0.1 2014-15 0.2 1.8 13.7 42.8 37.6 3.9
Number of Total Membership
Year Amer. Ind.
Asian Black Hispanic White Multi Pacific Total
2000-01 13 101 665 857 2572 75 4283 2001-02 12 101 633 948 2506 101 4301 2002-03 10 116 626 1014 2507 115 4388 2003-04 10 103 602 1134 2462 136 4447 2004-05 8 100 642 1225 2399 148 4522 2005-06 8 101 661 1312 2354 174 4610 2006-07 13 94 679 1334 2193 156 4469 2007-08 11 90 649 1392 2130 179 4451 2008-09 12 77 680 1491 2097 207 4564 2009-10 17 80 681 1508 2031 243 4560 2010-11 14 69 679 1573 2028 250 4613 2011-12 17 66 709 1735 2004 195 4726 2012-13 16 75 718 1823 1905 179 4716 2013-14 18 74 690 1935 1872 175 4 4768 2014-15 8 85 661 2062 1809 188 4813
2014-15 Membership by Ethnicity
Amer. Ind.
Asian
Black
Hispanic
White
Multi
Pacific 0
500
1000
1500
2000
2500
Amer. Ind. Asian Black Hispanic White Multi
Student Membership by Ethnicity (2010 to 2014)
2010‐11
2011‐12
2012‐13
2013‐14
2014‐15
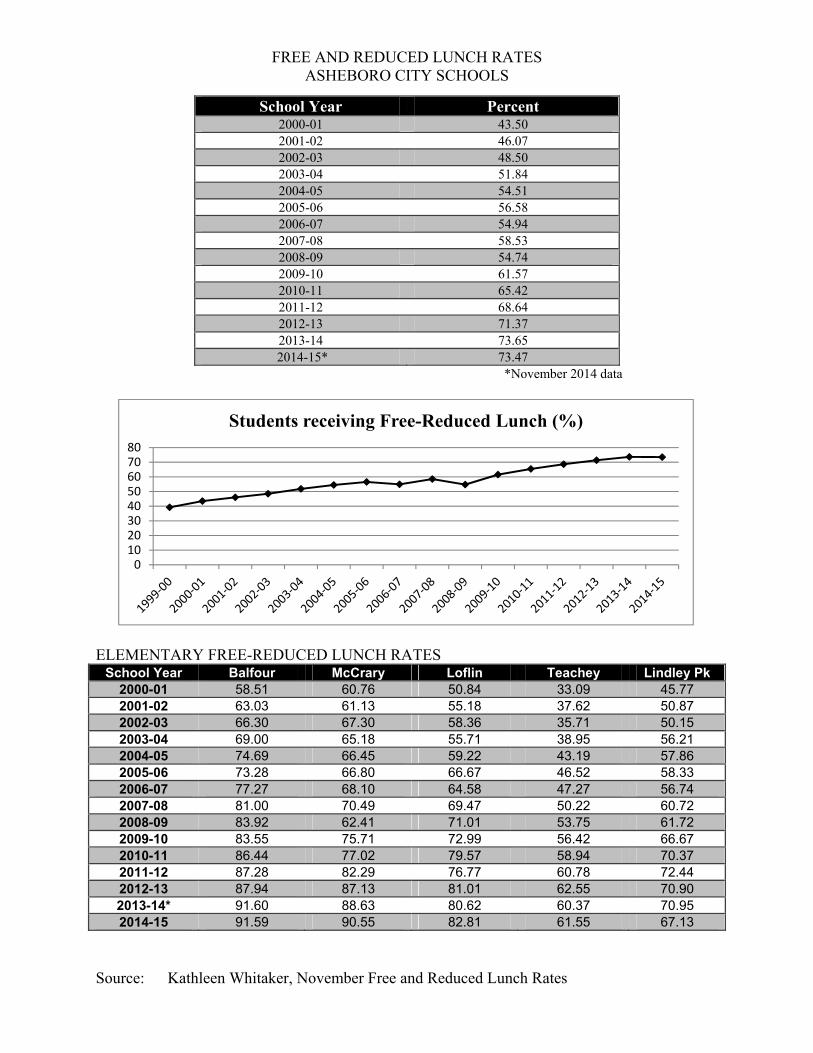
FREE AND REDUCED LUNCH RATES ASHEBORO CITY SCHOOLS
Source: Kathleen Whitaker, November Free and Reduced Lunch Rates
School Year Percent 2000-01 43.50 2001-02 46.07 2002-03 48.50 2003-04 51.84 2004-05 54.51 2005-06 56.58 2006-07 54.94 2007-08 58.53 2008-09 54.74 2009-10 61.57 2010-11 65.42 2011-12 68.64 2012-13 71.37 2013-14 73.65
2014-15* 73.47 *November 2014 data
ELEMENTARY FREE-REDUCED LUNCH RATES School Year Balfour McCrary Loflin Teachey Lindley Pk
2000-01 58.51 60.76 50.84 33.09 45.77 2001-02 63.03 61.13 55.18 37.62 50.87 2002-03 66.30 67.30 58.36 35.71 50.15 2003-04 69.00 65.18 55.71 38.95 56.21 2004-05 74.69 66.45 59.22 43.19 57.86 2005-06 73.28 66.80 66.67 46.52 58.33 2006-07 77.27 68.10 64.58 47.27 56.74 2007-08 81.00 70.49 69.47 50.22 60.72 2008-09 83.92 62.41 71.01 53.75 61.72 2009-10 83.55 75.71 72.99 56.42 66.67 2010-11 86.44 77.02 79.57 58.94 70.37 2011-12 87.28 82.29 76.77 60.78 72.44 2012-13 87.94 87.13 81.01 62.55 70.90 2013-14* 91.60 88.63 80.62 60.37 70.95 2014-15 91.59 90.55 82.81 61.55 67.13
01020304050607080
Students receiving Free-Reduced Lunch (%)
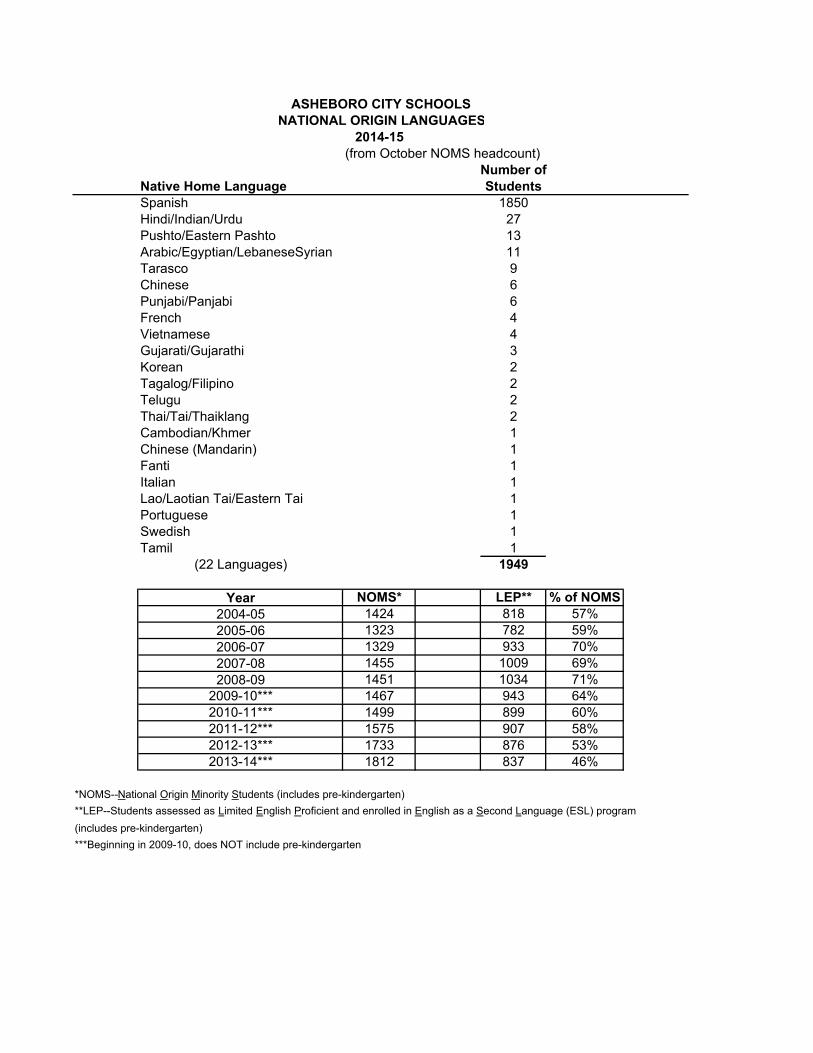
ASHEBORO CITY SCHOOLSNATIONAL ORIGIN LANGUAGES
2014-15(from October NOMS headcount)
Number ofNative Home Language StudentsSpanish 1850Hindi/Indian/Urdu 27Pushto/Eastern Pashto 13Arabic/Egyptian/LebaneseSyrian 11Tarasco 9Chinese 6Punjabi/Panjabi 6French 4Vietnamese 4Gujarati/Gujarathi 3Korean 2Tagalog/Filipino 2Telugu 2Thai/Tai/Thaiklang 2Cambodian/Khmer 1Chinese (Mandarin) 1Fanti 1Italian 1Lao/Laotian Tai/Eastern Tai 1Portuguese 1Swedish 1Tamil 1
(22 Languages) 1949
Year NOMS* LEP** % of NOMS2004-05 1424 818 57%2005-06 1323 782 59%2006-07 1329 933 70%2007-08 1455 1009 69%2008-09 1451 1034 71%
2009-10*** 1467 943 64%2010-11*** 1499 899 60%2011-12*** 1575 907 58%2012-13*** 1733 876 53%2013-14*** 1812 837 46%
*NOMS--National Origin Minority Students (includes pre-kindergarten)**LEP--Students assessed as Limited English Proficient and enrolled in English as a Second Language (ESL) program(includes pre-kindergarten)***Beginning in 2009-10, does NOT include pre-kindergarten
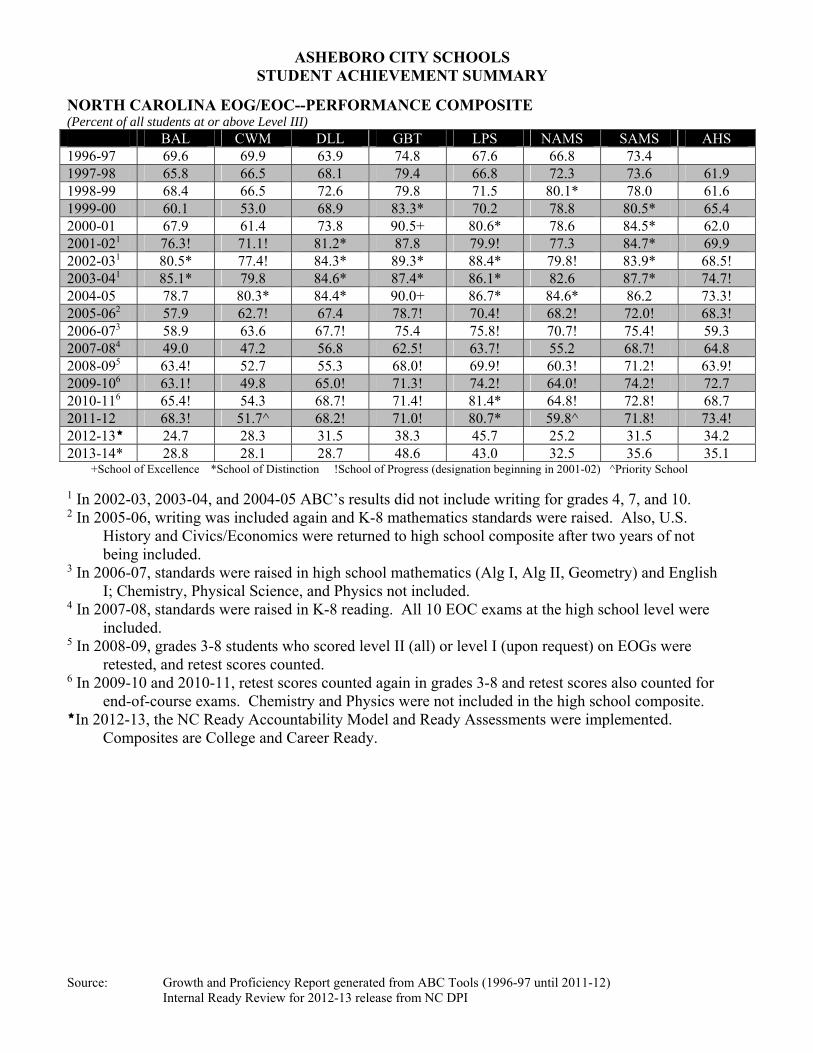
ASHEBORO CITY SCHOOLS STUDENT ACHIEVEMENT SUMMARY
Source: Growth and Proficiency Report generated from ABC Tools (1996-97 until 2011-12) Internal Ready Review for 2012-13 release from NC DPI
NORTH CAROLINA EOG/EOC--PERFORMANCE COMPOSITE (Percent of all students at or above Level III) BAL CWM DLL GBT LPS NAMS SAMS AHS 1996-97 69.6 69.9 63.9 74.8 67.6 66.8 73.4 1997-98 65.8 66.5 68.1 79.4 66.8 72.3 73.6 61.9 1998-99 68.4 66.5 72.6 79.8 71.5 80.1* 78.0 61.6 1999-00 60.1 53.0 68.9 83.3* 70.2 78.8 80.5* 65.4 2000-01 67.9 61.4 73.8 90.5+ 80.6* 78.6 84.5* 62.0 2001-021 76.3! 71.1! 81.2* 87.8 79.9! 77.3 84.7* 69.9 2002-031 80.5* 77.4! 84.3* 89.3* 88.4* 79.8! 83.9* 68.5! 2003-041 85.1* 79.8 84.6* 87.4* 86.1* 82.6 87.7* 74.7! 2004-05 78.7 80.3* 84.4* 90.0+ 86.7* 84.6* 86.2 73.3! 2005-062 57.9 62.7! 67.4 78.7! 70.4! 68.2! 72.0! 68.3! 2006-073 58.9 63.6 67.7! 75.4 75.8! 70.7! 75.4! 59.3 2007-084 49.0 47.2 56.8 62.5! 63.7! 55.2 68.7! 64.8 2008-095 63.4! 52.7 55.3 68.0! 69.9! 60.3! 71.2! 63.9! 2009-106 63.1! 49.8 65.0! 71.3! 74.2! 64.0! 74.2! 72.7 2010-116 65.4! 54.3 68.7! 71.4! 81.4* 64.8! 72.8! 68.7 2011-12 68.3! 51.7^ 68.2! 71.0! 80.7* 59.8^ 71.8! 73.4! 2012-13 24.7 28.3 31.5 38.3 45.7 25.2 31.5 34.2 2013-14* 28.8 28.1 28.7 48.6 43.0 32.5 35.6 35.1
+School of Excellence *School of Distinction !School of Progress (designation beginning in 2001-02) ^Priority School 1 In 2002-03, 2003-04, and 2004-05 ABC’s results did not include writing for grades 4, 7, and 10. 2 In 2005-06, writing was included again and K-8 mathematics standards were raised. Also, U.S.
History and Civics/Economics were returned to high school composite after two years of not being included.
3 In 2006-07, standards were raised in high school mathematics (Alg I, Alg II, Geometry) and English I; Chemistry, Physical Science, and Physics not included.
4 In 2007-08, standards were raised in K-8 reading. All 10 EOC exams at the high school level were included.
5 In 2008-09, grades 3-8 students who scored level II (all) or level I (upon request) on EOGs were retested, and retest scores counted.
6 In 2009-10 and 2010-11, retest scores counted again in grades 3-8 and retest scores also counted for end-of-course exams. Chemistry and Physics were not included in the high school composite.
In 2012-13, the NC Ready Accountability Model and Ready Assessments were implemented. Composites are College and Career Ready.
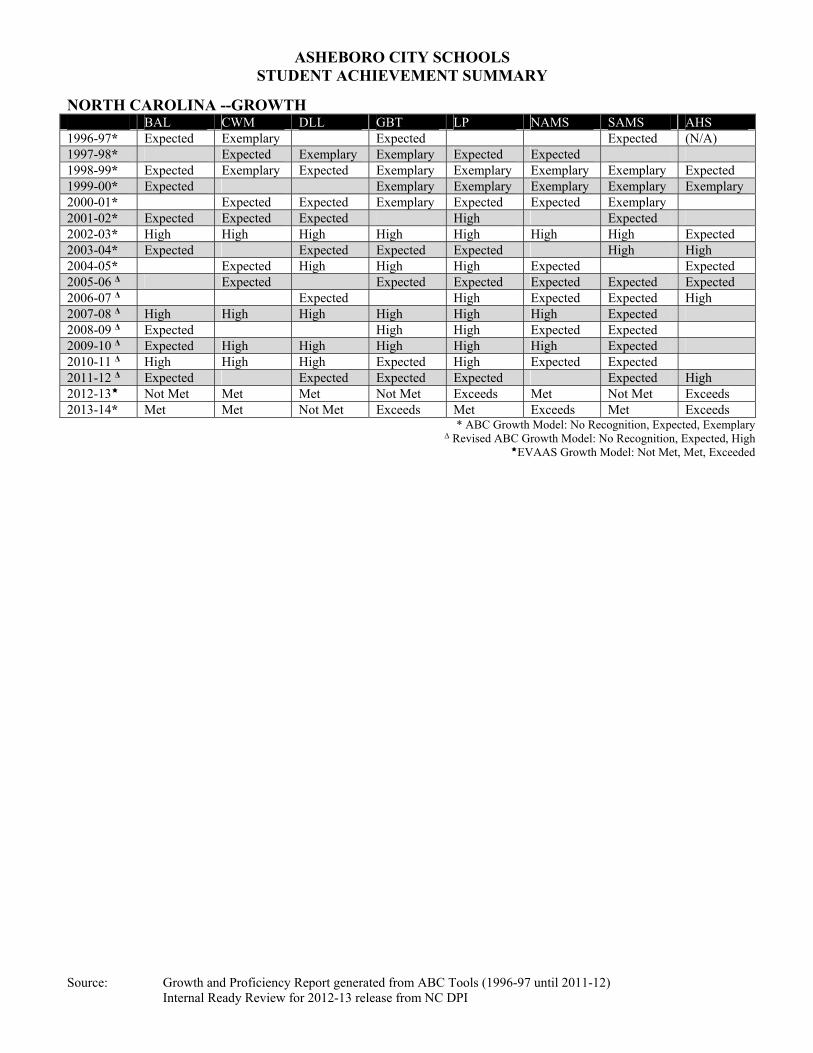
ASHEBORO CITY SCHOOLS STUDENT ACHIEVEMENT SUMMARY
Source: Growth and Proficiency Report generated from ABC Tools (1996-97 until 2011-12) Internal Ready Review for 2012-13 release from NC DPI
NORTH CAROLINA --GROWTH BAL CWM DLL GBT LP NAMS SAMS AHS 1996-97* Expected Exemplary Expected Expected (N/A) 1997-98* Expected Exemplary Exemplary Expected Expected 1998-99* Expected Exemplary Expected Exemplary Exemplary Exemplary Exemplary Expected 1999-00* Expected Exemplary Exemplary Exemplary Exemplary Exemplary 2000-01* Expected Expected Exemplary Expected Expected Exemplary 2001-02* Expected Expected Expected High Expected 2002-03* High High High High High High High Expected 2003-04* Expected Expected Expected Expected High High 2004-05* Expected High High High Expected Expected 2005-06 Δ Expected Expected Expected Expected Expected Expected 2006-07 Δ Expected High Expected Expected High 2007-08 Δ High High High High High High Expected 2008-09 Δ Expected High High Expected Expected 2009-10 Δ Expected High High High High High Expected 2010-11 Δ High High High Expected High Expected Expected 2011-12 Δ Expected Expected Expected Expected Expected High 2012-13 Not Met Met Met Not Met Exceeds Met Not Met Exceeds 2013-14* Met Met Not Met Exceeds Met Exceeds Met Exceeds
* ABC Growth Model: No Recognition, Expected, Exemplary Δ Revised ABC Growth Model: No Recognition, Expected, High
EVAAS Growth Model: Not Met, Met, Exceeded
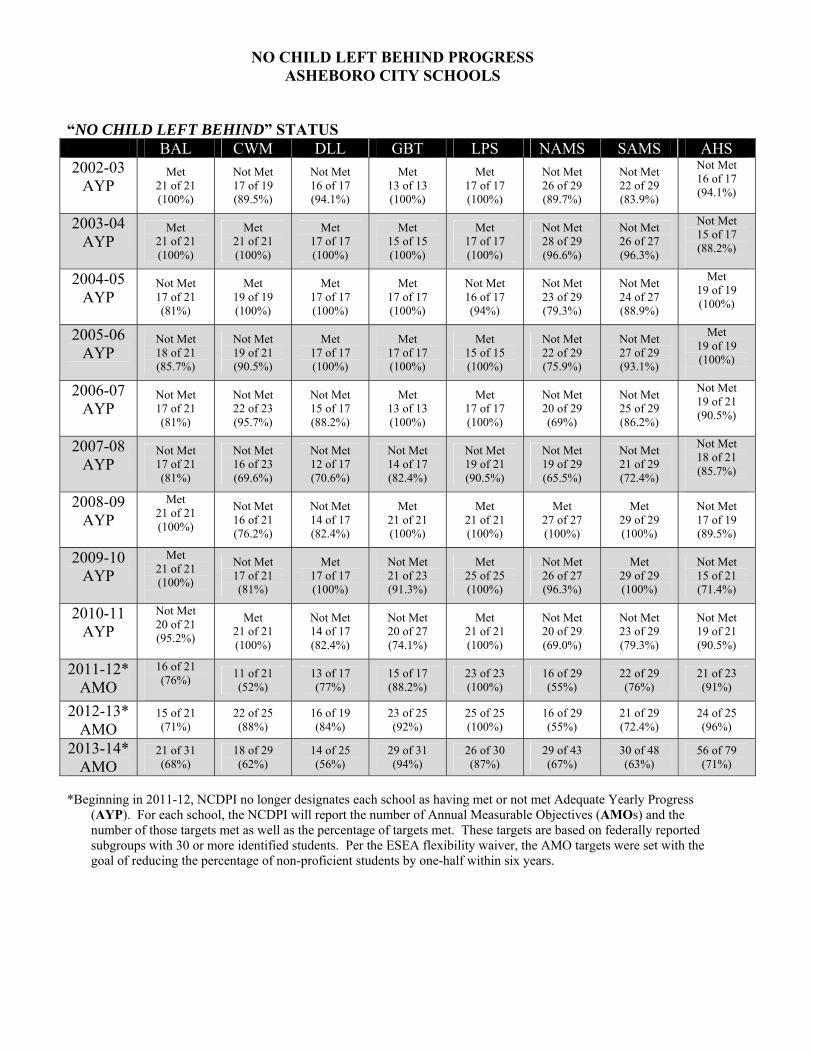
NO CHILD LEFT BEHIND PROGRESS ASHEBORO CITY SCHOOLS
“NO CHILD LEFT BEHIND” STATUS
BAL CWM DLL GBT LPS NAMS SAMS AHS 2002-03
AYP Met
21 of 21 (100%)
Not Met 17 of 19 (89.5%)
Not Met 16 of 17 (94.1%)
Met 13 of 13 (100%)
Met 17 of 17 (100%)
Not Met 26 of 29 (89.7%)
Not Met 22 of 29 (83.9%)
Not Met 16 of 17 (94.1%)
2003-04 AYP
Met 21 of 21 (100%)
Met 21 of 21 (100%)
Met 17 of 17 (100%)
Met 15 of 15 (100%)
Met 17 of 17 (100%)
Not Met 28 of 29 (96.6%)
Not Met 26 of 27 (96.3%)
Not Met 15 of 17 (88.2%)
2004-05 AYP
Not Met 17 of 21 (81%)
Met 19 of 19 (100%)
Met 17 of 17 (100%)
Met 17 of 17 (100%)
Not Met 16 of 17 (94%)
Not Met 23 of 29 (79.3%)
Not Met 24 of 27 (88.9%)
Met 19 of 19 (100%)
2005-06 AYP
Not Met 18 of 21 (85.7%)
Not Met 19 of 21 (90.5%)
Met 17 of 17 (100%)
Met 17 of 17 (100%)
Met 15 of 15 (100%)
Not Met 22 of 29 (75.9%)
Not Met 27 of 29 (93.1%)
Met 19 of 19 (100%)
2006-07 AYP
Not Met 17 of 21 (81%)
Not Met 22 of 23 (95.7%)
Not Met 15 of 17 (88.2%)
Met 13 of 13 (100%)
Met 17 of 17 (100%)
Not Met 20 of 29 (69%)
Not Met 25 of 29 (86.2%)
Not Met 19 of 21 (90.5%)
2007-08 AYP
Not Met 17 of 21 (81%)
Not Met 16 of 23 (69.6%)
Not Met 12 of 17 (70.6%)
Not Met 14 of 17 (82.4%)
Not Met 19 of 21 (90.5%)
Not Met 19 of 29 (65.5%)
Not Met 21 of 29 (72.4%)
Not Met 18 of 21 (85.7%)
2008-09 AYP
Met 21 of 21 (100%)
Not Met 16 of 21 (76.2%)
Not Met 14 of 17 (82.4%)
Met 21 of 21 (100%)
Met 21 of 21 (100%)
Met 27 of 27 (100%)
Met 29 of 29 (100%)
Not Met 17 of 19 (89.5%)
2009-10 AYP
Met 21 of 21 (100%)
Not Met 17 of 21 (81%)
Met 17 of 17 (100%)
Not Met 21 of 23 (91.3%)
Met 25 of 25 (100%)
Not Met 26 of 27 (96.3%)
Met 29 of 29 (100%)
Not Met 15 of 21 (71.4%)
2010-11 AYP
Not Met 20 of 21 (95.2%)
Met 21 of 21 (100%)
Not Met 14 of 17 (82.4%)
Not Met 20 of 27 (74.1%)
Met 21 of 21 (100%)
Not Met 20 of 29 (69.0%)
Not Met 23 of 29 (79.3%)
Not Met 19 of 21 (90.5%)
2011-12* AMO
16 of 21 (76%)
11 of 21 (52%)
13 of 17 (77%)
15 of 17 (88.2%)
23 of 23 (100%)
16 of 29 (55%)
22 of 29 (76%)
21 of 23 (91%)
2012-13* AMO
15 of 21 (71%)
22 of 25 (88%)
16 of 19 (84%)
23 of 25 (92%)
25 of 25 (100%)
16 of 29 (55%)
21 of 29 (72.4%)
24 of 25 (96%)
2013-14* AMO
21 of 31 (68%)
18 of 29 (62%)
14 of 25 (56%)
29 of 31 (94%)
26 of 30 (87%)
29 of 43 (67%)
30 of 48 (63%)
56 of 79 (71%)
*Beginning in 2011-12, NCDPI no longer designates each school as having met or not met Adequate Yearly Progress
(AYP). For each school, the NCDPI will report the number of Annual Measurable Objectives (AMOs) and the number of those targets met as well as the percentage of targets met. These targets are based on federally reported subgroups with 30 or more identified students. Per the ESEA flexibility waiver, the AMO targets were set with the goal of reducing the percentage of non-proficient students by one-half within six years.
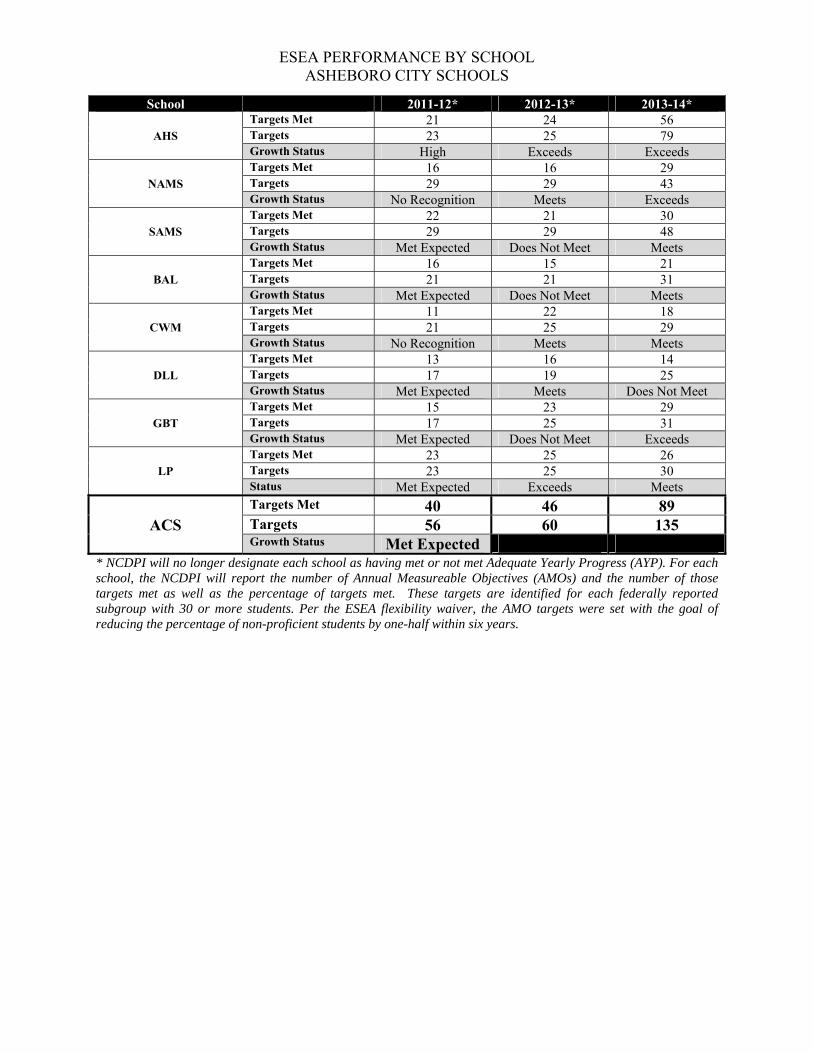
ESEA PERFORMANCE BY SCHOOL ASHEBORO CITY SCHOOLS
School 2011-12* 2012-13* 2013-14*
AHS
Targets Met 21 24 56 Targets 23 25 79 Growth Status High Exceeds Exceeds
NAMS
Targets Met 16 16 29 Targets 29 29 43 Growth Status No Recognition Meets Exceeds
SAMS
Targets Met 22 21 30 Targets 29 29 48 Growth Status Met Expected Does Not Meet Meets
BAL
Targets Met 16 15 21 Targets 21 21 31 Growth Status Met Expected Does Not Meet Meets
CWM
Targets Met 11 22 18 Targets 21 25 29 Growth Status No Recognition Meets Meets
DLL
Targets Met 13 16 14 Targets 17 19 25 Growth Status Met Expected Meets Does Not Meet
GBT
Targets Met 15 23 29 Targets 17 25 31 Growth Status Met Expected Does Not Meet Exceeds
LP
Targets Met 23 25 26 Targets 23 25 30 Status Met Expected Exceeds Meets
ACS Targets Met 40 46 89 Targets 56 60 135 Growth Status Met Expected
* NCDPI will no longer designate each school as having met or not met Adequate Yearly Progress (AYP). For each school, the NCDPI will report the number of Annual Measureable Objectives (AMOs) and the number of those targets met as well as the percentage of targets met. These targets are identified for each federally reported subgroup with 30 or more students. Per the ESEA flexibility waiver, the AMO targets were set with the goal of reducing the percentage of non-proficient students by one-half within six years.
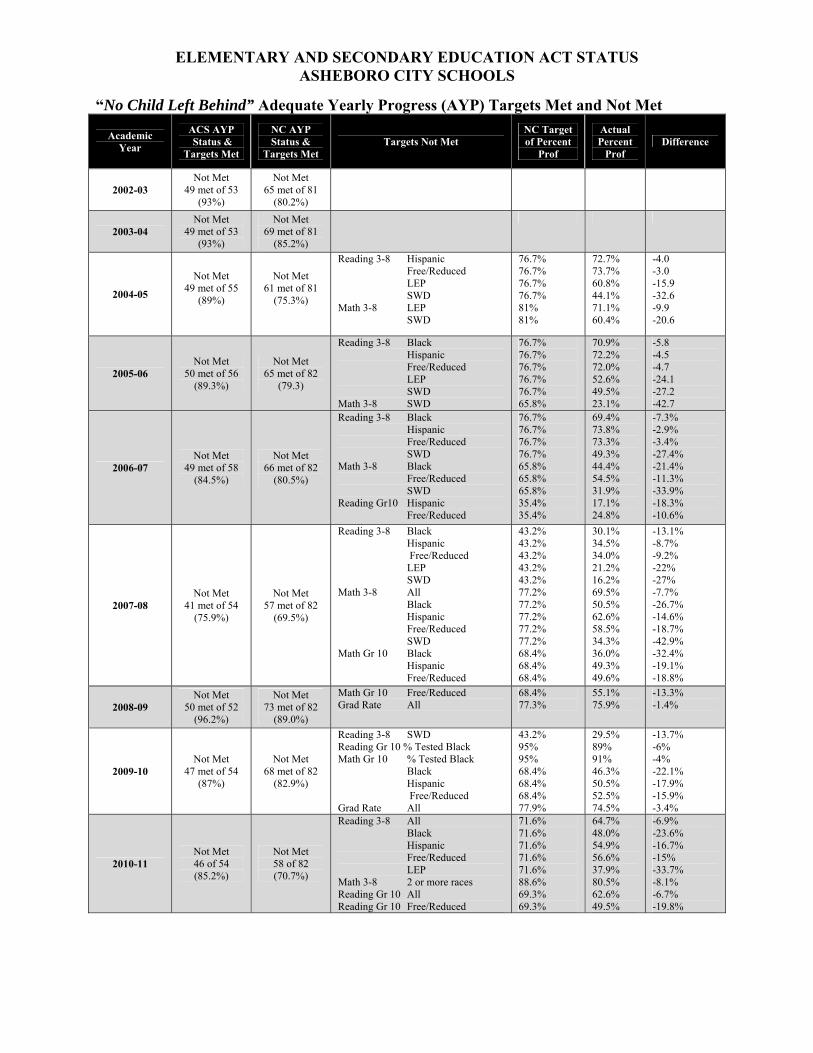
ELEMENTARY AND SECONDARY EDUCATION ACT STATUS ASHEBORO CITY SCHOOLS
“No Child Left Behind” Adequate Yearly Progress (AYP) Targets Met and Not Met
Academic Year
ACS AYP Status &
Targets Met
NC AYP Status &
Targets Met Targets Not Met
NC Target of Percent
Prof
Actual Percent
Prof Difference
2002-03 Not Met
49 met of 53 (93%)
Not Met 65 met of 81
(80.2%)
2003-04 Not Met
49 met of 53 (93%)
Not Met 69 met of 81
(85.2%)
2004-05
Not Met 49 met of 55
(89%)
Not Met 61 met of 81
(75.3%)
Reading 3-8 Hispanic Free/Reduced LEP SWD Math 3-8 LEP SWD
76.7% 76.7% 76.7% 76.7% 81% 81%
72.7% 73.7% 60.8% 44.1% 71.1% 60.4%
-4.0 -3.0 -15.9 -32.6 -9.9 -20.6
2005-06 Not Met
50 met of 56 (89.3%)
Not Met 65 met of 82
(79.3)
Reading 3-8 Black Hispanic Free/Reduced LEP SWD Math 3-8 SWD
76.7% 76.7% 76.7% 76.7% 76.7% 65.8%
70.9% 72.2% 72.0% 52.6% 49.5% 23.1%
-5.8 -4.5 -4.7 -24.1 -27.2 -42.7
2006-07 Not Met
49 met of 58 (84.5%)
Not Met 66 met of 82
(80.5%)
Reading 3-8 Black Hispanic Free/Reduced SWD Math 3-8 Black Free/Reduced SWD Reading Gr10 Hispanic Free/Reduced
76.7% 76.7% 76.7% 76.7% 65.8% 65.8% 65.8% 35.4% 35.4%
69.4% 73.8% 73.3% 49.3% 44.4% 54.5% 31.9% 17.1% 24.8%
-7.3% -2.9% -3.4% -27.4% -21.4% -11.3% -33.9% -18.3% -10.6%
2007-08 Not Met
41 met of 54 (75.9%)
Not Met 57 met of 82
(69.5%)
Reading 3-8 Black Hispanic Free/Reduced LEP SWD Math 3-8 All Black Hispanic Free/Reduced SWD Math Gr 10 Black Hispanic Free/Reduced
43.2% 43.2% 43.2% 43.2% 43.2% 77.2% 77.2% 77.2% 77.2% 77.2% 68.4% 68.4% 68.4%
30.1% 34.5% 34.0% 21.2% 16.2% 69.5% 50.5% 62.6% 58.5% 34.3% 36.0% 49.3% 49.6%
-13.1% -8.7% -9.2% -22% -27% -7.7% -26.7% -14.6% -18.7% -42.9% -32.4% -19.1% -18.8%
2008-09 Not Met
50 met of 52 (96.2%)
Not Met 73 met of 82
(89.0%)
Math Gr 10 Free/Reduced Grad Rate All
68.4% 77.3%
55.1% 75.9%
-13.3% -1.4%
2009-10 Not Met
47 met of 54 (87%)
Not Met 68 met of 82
(82.9%)
Reading 3-8 SWD Reading Gr 10 % Tested Black Math Gr 10 % Tested Black Black Hispanic Free/Reduced Grad Rate All
43.2% 95% 95% 68.4% 68.4% 68.4% 77.9%
29.5% 89% 91% 46.3% 50.5% 52.5% 74.5%
-13.7% -6% -4% -22.1% -17.9% -15.9% -3.4%
2010-11 Not Met 46 of 54 (85.2%)
Not Met 58 of 82 (70.7%)
Reading 3-8 All Black Hispanic Free/Reduced LEP Math 3-8 2 or more races Reading Gr 10 All Reading Gr 10 Free/Reduced
71.6% 71.6% 71.6% 71.6% 71.6% 88.6% 69.3% 69.3%
64.7% 48.0% 54.9% 56.6% 37.9% 80.5% 62.6% 49.5%
-6.9% -23.6% -16.7% -15% -33.7% -8.1% -6.7% -19.8%
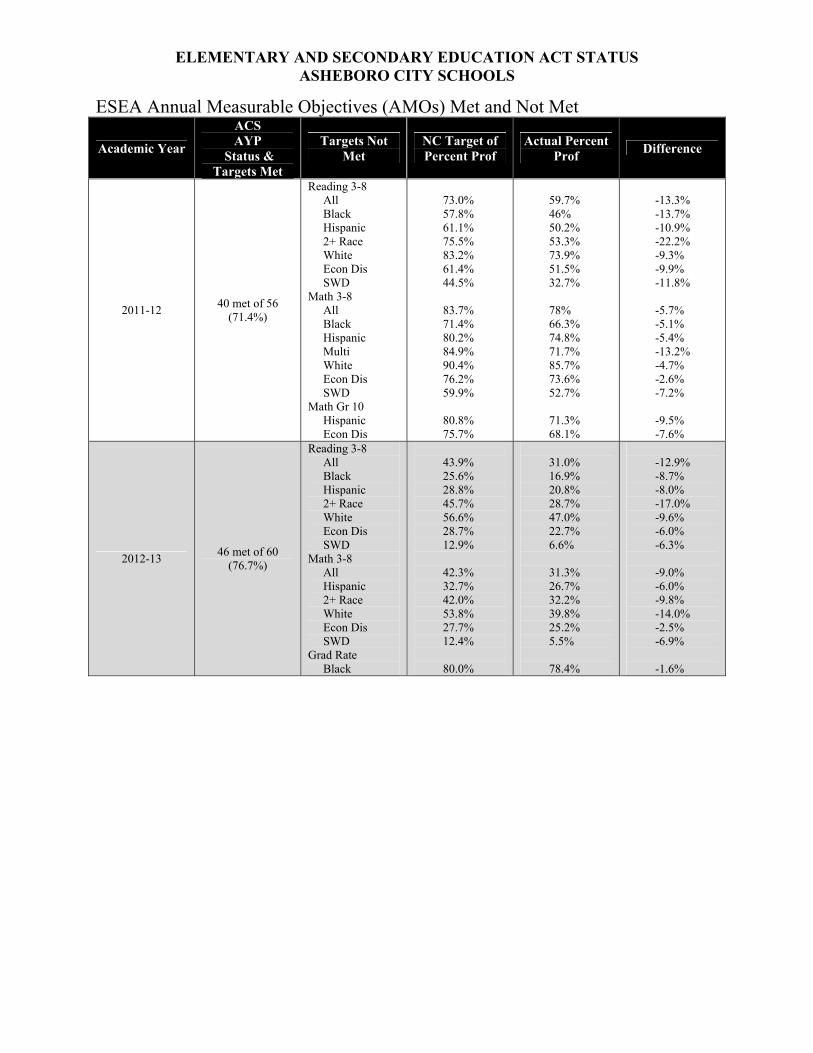
ELEMENTARY AND SECONDARY EDUCATION ACT STATUS ASHEBORO CITY SCHOOLS
ESEA Annual Measurable Objectives (AMOs) Met and Not Met
Academic Year
ACS AYP
Status & Targets Met
Targets Not Met
NC Target of Percent Prof
Actual Percent Prof
Difference
2011-12 40 met of 56
(71.4%)
Reading 3-8 All Black Hispanic 2+ Race White Econ Dis SWD Math 3-8 All Black Hispanic Multi White Econ Dis SWD Math Gr 10 Hispanic Econ Dis
73.0% 57.8% 61.1% 75.5% 83.2% 61.4% 44.5% 83.7% 71.4% 80.2% 84.9% 90.4% 76.2% 59.9% 80.8% 75.7%
59.7% 46% 50.2% 53.3% 73.9% 51.5% 32.7% 78% 66.3% 74.8% 71.7% 85.7% 73.6% 52.7% 71.3% 68.1%
-13.3% -13.7% -10.9% -22.2% -9.3% -9.9% -11.8% -5.7% -5.1% -5.4% -13.2% -4.7% -2.6% -7.2% -9.5% -7.6%
2012-13 46 met of 60
(76.7%)
Reading 3-8 All Black Hispanic 2+ Race White Econ Dis SWD Math 3-8 All Hispanic 2+ Race White Econ Dis SWD Grad Rate Black
43.9% 25.6% 28.8% 45.7% 56.6% 28.7% 12.9% 42.3% 32.7% 42.0% 53.8% 27.7% 12.4% 80.0%
31.0% 16.9% 20.8% 28.7% 47.0% 22.7% 6.6% 31.3% 26.7% 32.2% 39.8% 25.2% 5.5% 78.4%
-12.9% -8.7% -8.0% -17.0% -9.6% -6.0% -6.3% -9.0% -6.0% -9.8% -14.0% -2.5% -6.9% -1.6%
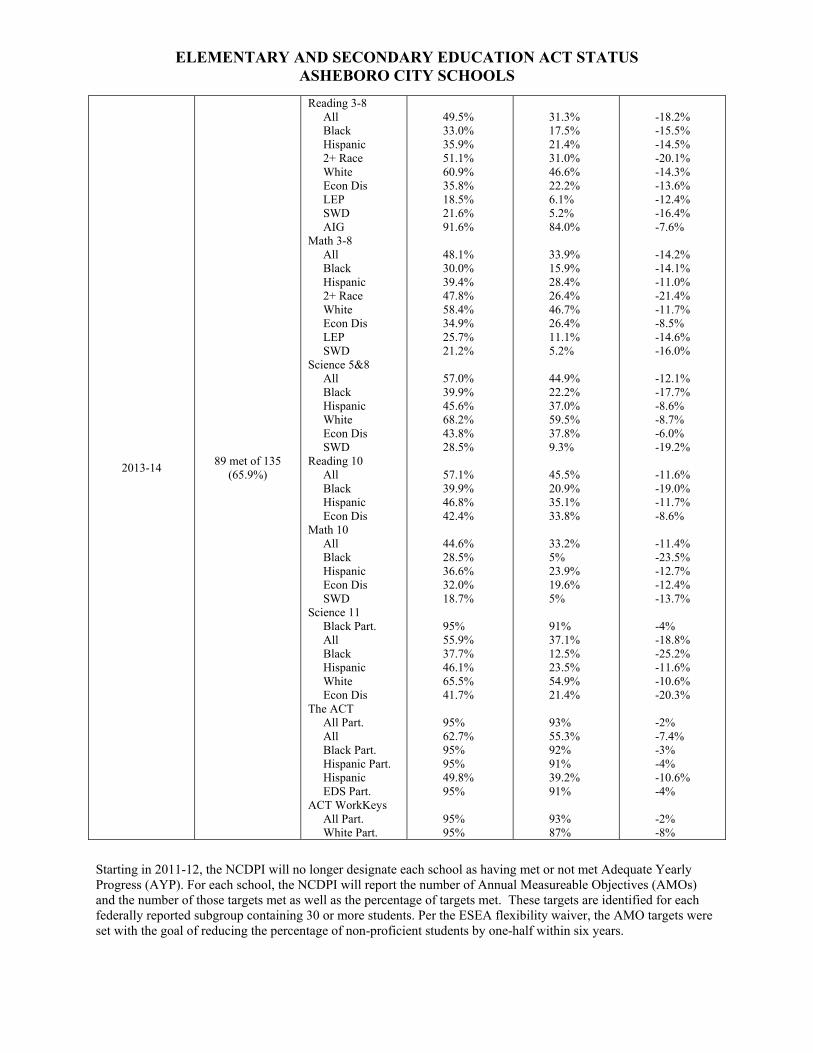
ELEMENTARY AND SECONDARY EDUCATION ACT STATUS ASHEBORO CITY SCHOOLS
2013-14 89 met of 135
(65.9%)
Reading 3-8 All Black Hispanic 2+ Race White Econ Dis LEP SWD AIG Math 3-8 All Black Hispanic 2+ Race White Econ Dis LEP SWD Science 5&8 All Black Hispanic White Econ Dis SWD Reading 10 All Black Hispanic Econ Dis Math 10 All Black Hispanic Econ Dis SWD Science 11 Black Part. All Black Hispanic White Econ Dis The ACT All Part. All Black Part. Hispanic Part. Hispanic EDS Part. ACT WorkKeys All Part. White Part.
49.5% 33.0% 35.9% 51.1% 60.9% 35.8% 18.5% 21.6% 91.6% 48.1% 30.0% 39.4% 47.8% 58.4% 34.9% 25.7% 21.2% 57.0% 39.9% 45.6% 68.2% 43.8% 28.5% 57.1% 39.9% 46.8% 42.4% 44.6% 28.5% 36.6% 32.0% 18.7% 95% 55.9% 37.7% 46.1% 65.5% 41.7% 95% 62.7% 95% 95% 49.8% 95% 95% 95%
31.3% 17.5% 21.4% 31.0% 46.6% 22.2% 6.1% 5.2% 84.0% 33.9% 15.9% 28.4% 26.4% 46.7% 26.4% 11.1% 5.2% 44.9% 22.2% 37.0% 59.5% 37.8% 9.3% 45.5% 20.9% 35.1% 33.8% 33.2% 5% 23.9% 19.6% 5% 91% 37.1% 12.5% 23.5% 54.9% 21.4% 93% 55.3% 92% 91% 39.2% 91% 93% 87%
-18.2% -15.5% -14.5% -20.1% -14.3% -13.6% -12.4% -16.4% -7.6% -14.2% -14.1% -11.0% -21.4% -11.7% -8.5% -14.6% -16.0% -12.1% -17.7% -8.6% -8.7% -6.0% -19.2% -11.6% -19.0% -11.7% -8.6% -11.4% -23.5% -12.7% -12.4% -13.7% -4% -18.8% -25.2% -11.6% -10.6% -20.3% -2% -7.4% -3% -4% -10.6% -4% -2% -8%
Starting in 2011-12, the NCDPI will no longer designate each school as having met or not met Adequate Yearly Progress (AYP). For each school, the NCDPI will report the number of Annual Measureable Objectives (AMOs) and the number of those targets met as well as the percentage of targets met. These targets are identified for each federally reported subgroup containing 30 or more students. Per the ESEA flexibility waiver, the AMO targets were set with the goal of reducing the percentage of non-proficient students by one-half within six years.
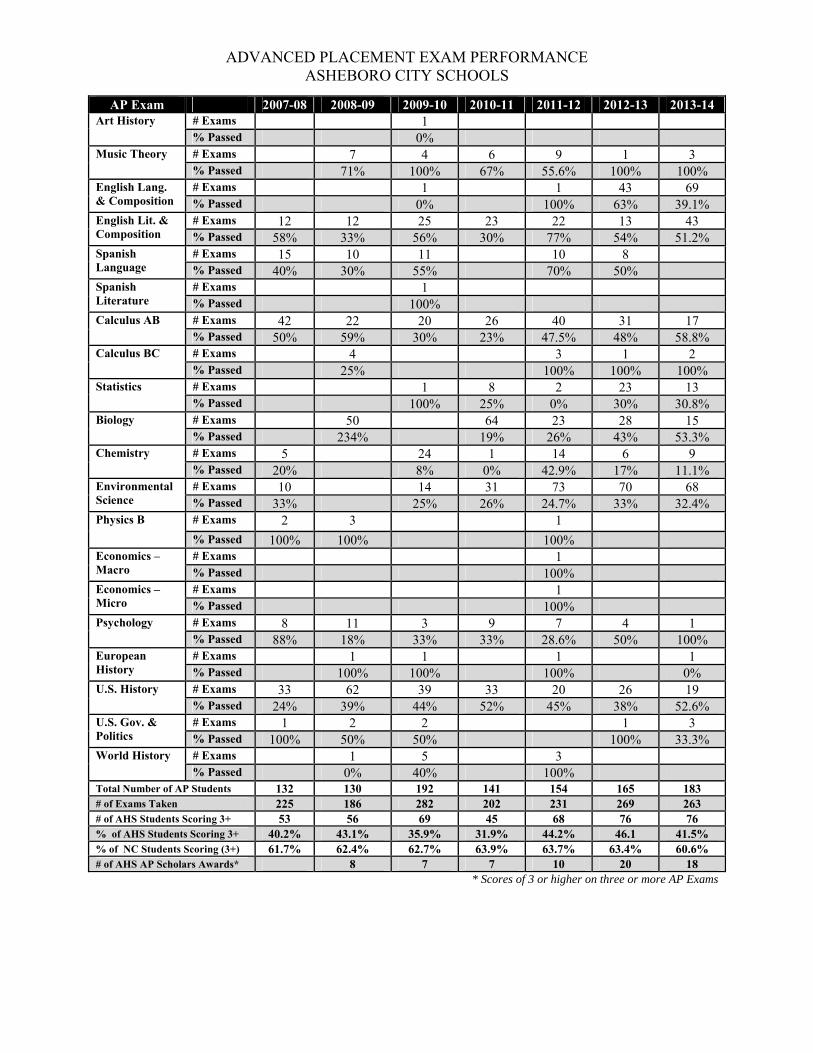
ADVANCED PLACEMENT EXAM PERFORMANCE ASHEBORO CITY SCHOOLS
AP Exam 2007-08 2008-09 2009-10 2010-11 2011-12 2012-13 2013-14 Art History # Exams 1
% Passed 0% Music Theory # Exams 7 4 6 9 1 3
% Passed 71% 100% 67% 55.6% 100% 100% English Lang. & Composition
# Exams 1 1 43 69 % Passed 0% 100% 63% 39.1%
English Lit. & Composition
# Exams 12 12 25 23 22 13 43 % Passed 58% 33% 56% 30% 77% 54% 51.2%
Spanish Language
# Exams 15 10 11 10 8 % Passed 40% 30% 55% 70% 50%
Spanish Literature
# Exams 1 % Passed 100%
Calculus AB # Exams 42 22 20 26 40 31 17 % Passed 50% 59% 30% 23% 47.5% 48% 58.8%
Calculus BC # Exams 4 3 1 2 % Passed 25% 100% 100% 100%
Statistics # Exams 1 8 2 23 13 % Passed 100% 25% 0% 30% 30.8%
Biology # Exams 50 64 23 28 15 % Passed 234% 19% 26% 43% 53.3%
Chemistry # Exams 5 24 1 14 6 9 % Passed 20% 8% 0% 42.9% 17% 11.1%
Environmental Science
# Exams 10 14 31 73 70 68 % Passed 33% 25% 26% 24.7% 33% 32.4%
Physics B # Exams 2 3 1
% Passed 100% 100% 100% Economics – Macro
# Exams 1 % Passed 100%
Economics – Micro
# Exams 1 % Passed 100%
Psychology # Exams 8 11 3 9 7 4 1 % Passed 88% 18% 33% 33% 28.6% 50% 100%
European History
# Exams 1 1 1 1 % Passed 100% 100% 100% 0%
U.S. History # Exams 33 62 39 33 20 26 19 % Passed 24% 39% 44% 52% 45% 38% 52.6%
U.S. Gov. & Politics
# Exams 1 2 2 1 3 % Passed 100% 50% 50% 100% 33.3%
World History # Exams 1 5 3 % Passed 0% 40% 100%
Total Number of AP Students 132 130 192 141 154 165 183 # of Exams Taken 225 186 282 202 231 269 263 # of AHS Students Scoring 3+ 53 56 69 45 68 76 76 % of AHS Students Scoring 3+ 40.2% 43.1% 35.9% 31.9% 44.2% 46.1 41.5% % of NC Students Scoring (3+) 61.7% 62.4% 62.7% 63.9% 63.7% 63.4% 60.6% # of AHS AP Scholars Awards* 8 7 7 10 20 18
* Scores of 3 or higher on three or more AP Exams
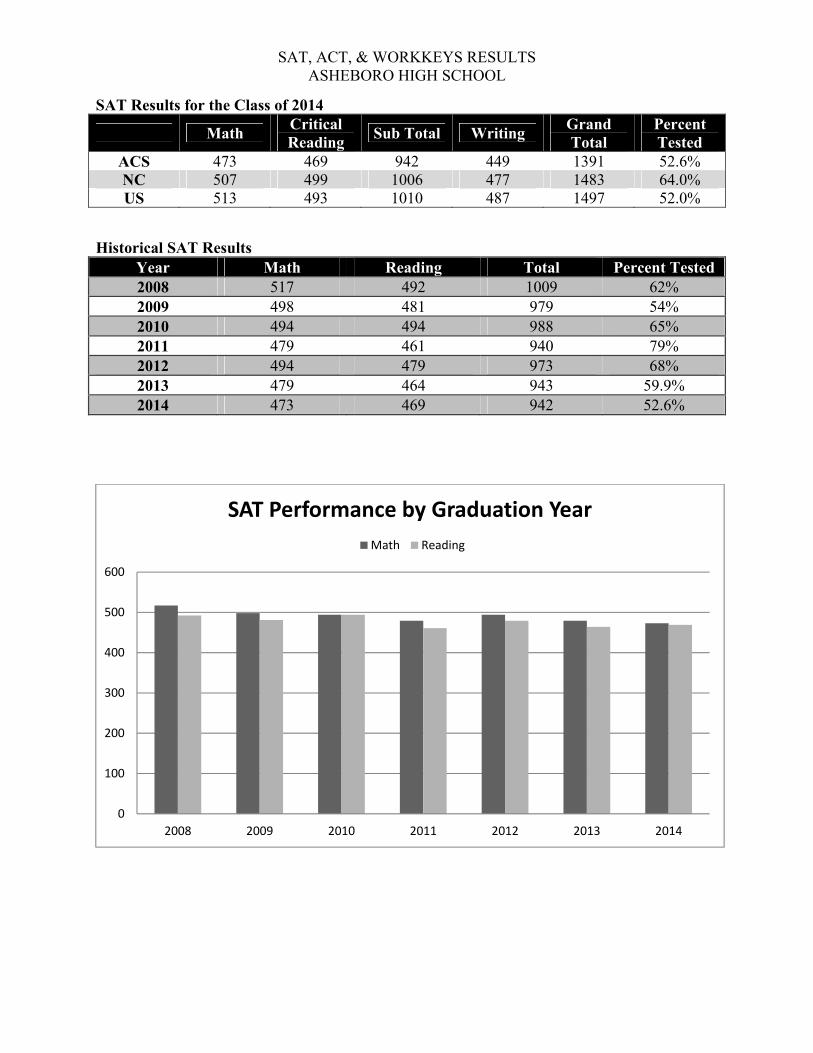
SAT, ACT, & WORKKEYS RESULTS ASHEBORO HIGH SCHOOL
SAT Results for the Class of 2014
Math Critical Reading
Sub Total Writing Grand Total
Percent Tested
ACS 473 469 942 449 1391 52.6% NC 507 499 1006 477 1483 64.0% US 513 493 1010 487 1497 52.0%
Historical SAT Results
Year Math Reading Total Percent Tested 2008 517 492 1009 62% 2009 498 481 979 54% 2010 494 494 988 65% 2011 479 461 940 79% 2012 494 479 973 68% 2013 479 464 943 59.9% 2014 473 469 942 52.6%
0
100
200
300
400
500
600
2008 2009 2010 2011 2012 2013 2014
SAT Performance by Graduation YearMath Reading
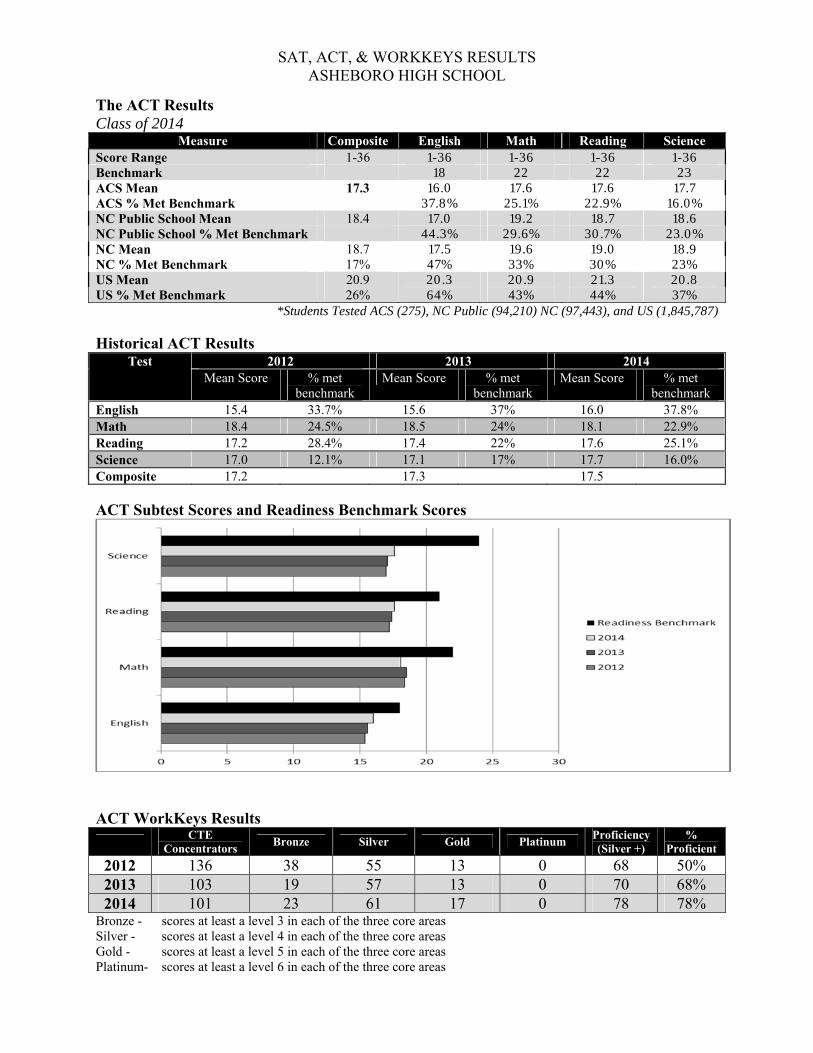
SAT, ACT, & WORKKEYS RESULTS ASHEBORO HIGH SCHOOL
The ACT Results Class of 2014
Measure Composite English Math Reading Science Score Range 1-36 1-36 1-36 1-36 1-36 Benchmark 18 22 22 23 ACS Mean 17.3 16.0 17.6 17.6 17.7 ACS % Met Benchmark 37.8% 25.1% 22.9% 16.0% NC Public School Mean 18.4 17.0 19.2 18.7 18.6 NC Public School % Met Benchmark 44.3% 29.6% 30.7% 23.0% NC Mean 18.7 17.5 19.6 19.0 18.9 NC % Met Benchmark 17% 47% 33% 30% 23% US Mean 20.9 20.3 20.9 21.3 20.8 US % Met Benchmark 26% 64% 43% 44% 37%
*Students Tested ACS (275), NC Public (94,210) NC (97,443), and US (1,845,787)
Historical ACT Results Test 2012 2013 2014
Mean Score % met benchmark
Mean Score % met benchmark
Mean Score % met benchmark
English 15.4 33.7% 15.6 37% 16.0 37.8% Math 18.4 24.5% 18.5 24% 18.1 22.9% Reading 17.2 28.4% 17.4 22% 17.6 25.1% Science 17.0 12.1% 17.1 17% 17.7 16.0% Composite 17.2 17.3 17.5
ACT Subtest Scores and Readiness Benchmark Scores
ACT WorkKeys Results
CTE
Concentrators Bronze Silver Gold Platinum
Proficiency (Silver +)
% Proficient
2012 136 38 55 13 0 68 50% 2013 103 19 57 13 0 70 68% 2014 101 23 61 17 0 78 78%
Bronze - scores at least a level 3 in each of the three core areas Silver - scores at least a level 4 in each of the three core areas Gold - scores at least a level 5 in each of the three core areas Platinum- scores at least a level 6 in each of the three core areas
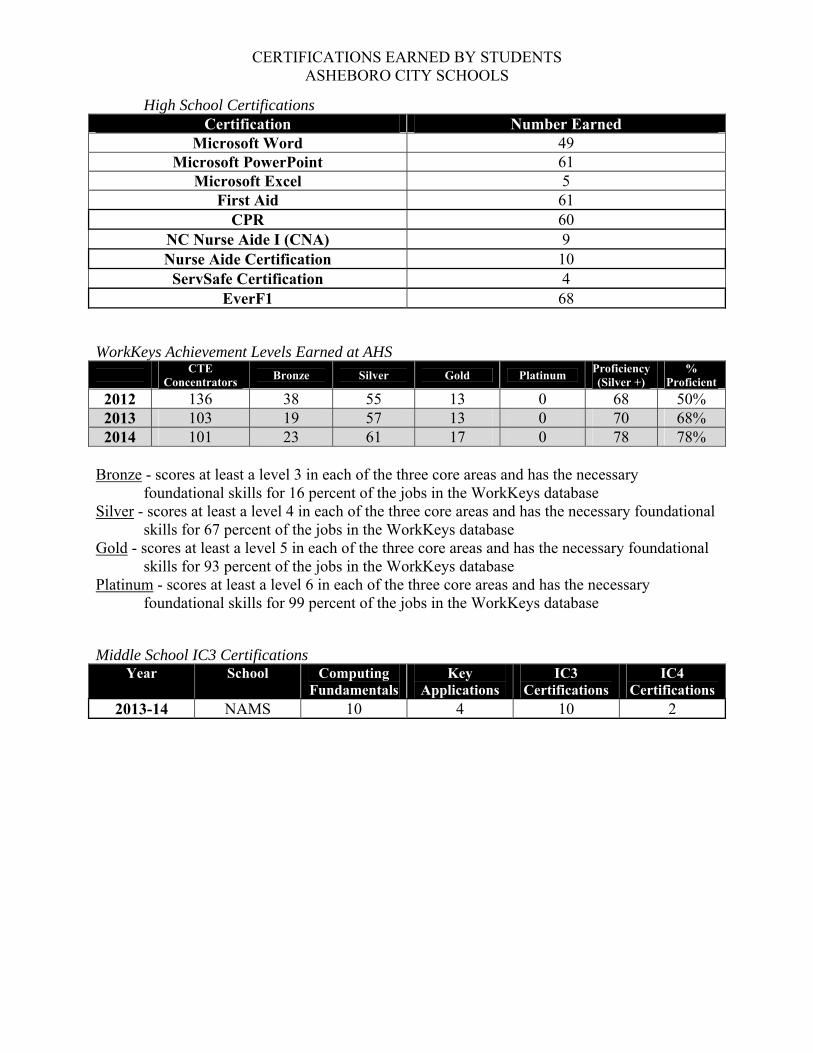
CERTIFICATIONS EARNED BY STUDENTS ASHEBORO CITY SCHOOLS
High School Certifications Certification Number Earned
Microsoft Word 49 Microsoft PowerPoint 61
Microsoft Excel 5 First Aid 61
CPR 60 NC Nurse Aide I (CNA) 9 Nurse Aide Certification 10
ServSafe Certification 4 EverF1 68
WorkKeys Achievement Levels Earned at AHS
CTE
Concentrators Bronze Silver Gold Platinum
Proficiency (Silver +)
% Proficient
2012 136 38 55 13 0 68 50% 2013 103 19 57 13 0 70 68% 2014 101 23 61 17 0 78 78%
Bronze - scores at least a level 3 in each of the three core areas and has the necessary
foundational skills for 16 percent of the jobs in the WorkKeys database Silver - scores at least a level 4 in each of the three core areas and has the necessary foundational
skills for 67 percent of the jobs in the WorkKeys database Gold - scores at least a level 5 in each of the three core areas and has the necessary foundational
skills for 93 percent of the jobs in the WorkKeys database Platinum - scores at least a level 6 in each of the three core areas and has the necessary
foundational skills for 99 percent of the jobs in the WorkKeys database Middle School IC3 Certifications
Year School Computing Fundamentals
Key Applications
IC3 Certifications
IC4 Certifications
2013-14 NAMS 10 4 10 2
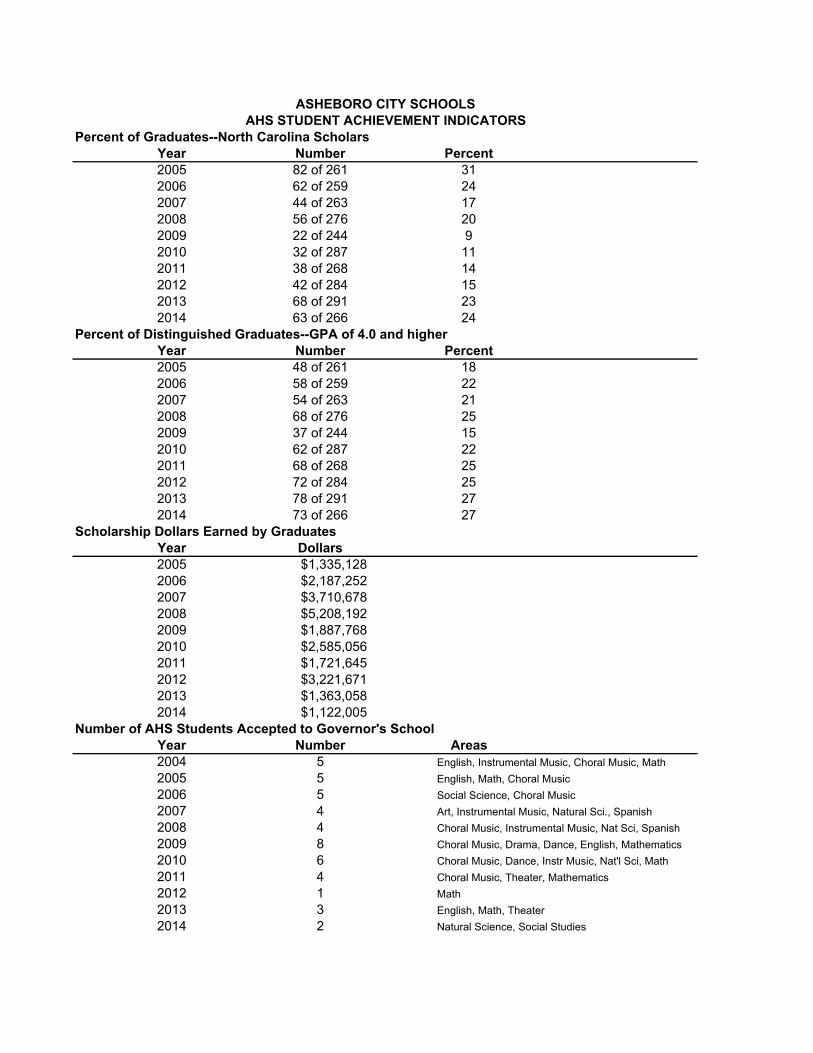
ASHEBORO CITY SCHOOLSAHS STUDENT ACHIEVEMENT INDICATORS
Percent of Graduates--North Carolina ScholarsYear Number Percent2005 82 of 261 312006 62 of 259 242007 44 of 263 172008 56 of 276 202009 22 of 244 92010 32 of 287 112011 38 of 268 142012 42 of 284 152013 68 of 291 232014 63 of 266 24
Percent of Distinguished Graduates--GPA of 4.0 and higherYear Number Percent2005 48 of 261 182006 58 of 259 222007 54 of 263 212008 68 of 276 252009 37 of 244 152010 62 of 287 222011 68 of 268 252012 72 of 284 252013 78 of 291 272014 73 of 266 27
Scholarship Dollars Earned by GraduatesYear Dollars2005 $1,335,1282006 $2,187,2522007 $3,710,6782008 $5,208,1922009 $1,887,7682010 $2,585,0562011 $1,721,6452012 $3,221,6712013 $1,363,0582014 $1,122,005
Number of AHS Students Accepted to Governor's SchoolYear Number Areas2004 5 English, Instrumental Music, Choral Music, Math2005 5 English, Math, Choral Music2006 5 Social Science, Choral Music2007 4 Art, Instrumental Music, Natural Sci., Spanish2008 4 Choral Music, Instrumental Music, Nat Sci, Spanish2009 8 Choral Music, Drama, Dance, English, Mathematics2010 6 Choral Music, Dance, Instr Music, Nat'l Sci, Math2011 4 Choral Music, Theater, Mathematics2012 1 Math2013 3 English, Math, Theater2014 2 Natural Science, Social Studies
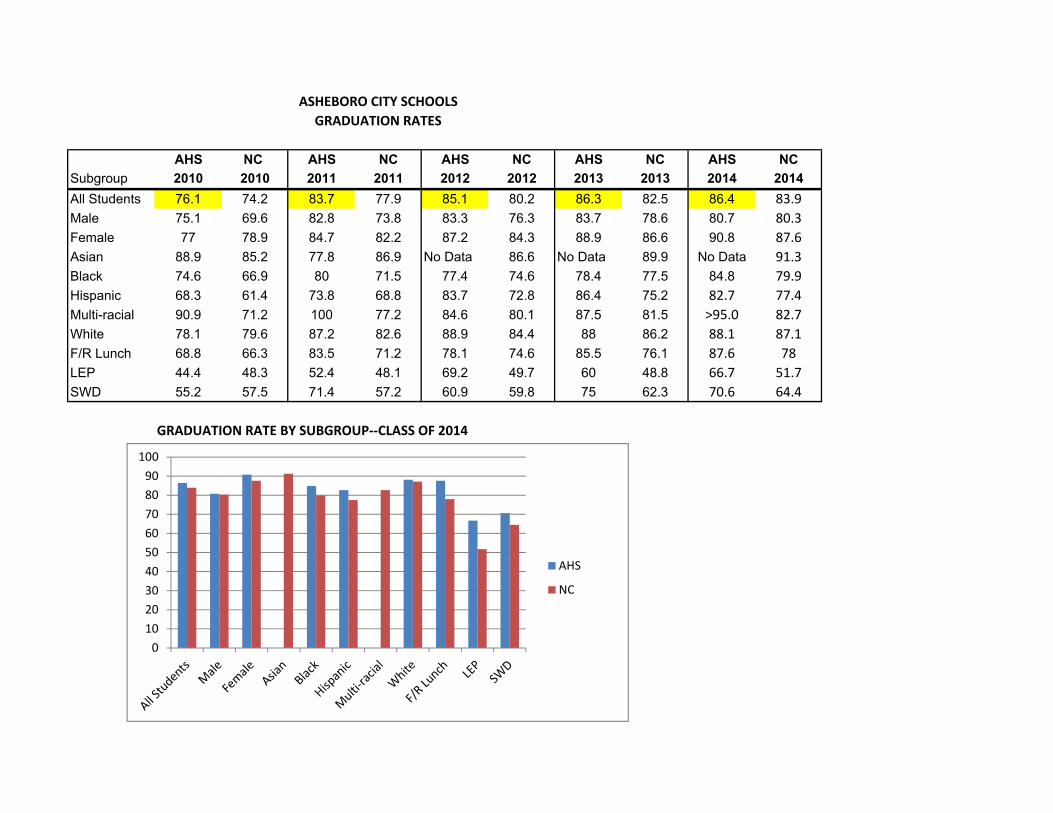
AHS NC AHS NC AHS NC AHS NC AHS NC
Subgroup 2010 2010 2011 2011 2012 2012 2013 2013 2014 2014
All Students 76.1 74.2 83.7 77.9 85.1 80.2 86.3 82.5 86.4 83.9Male 75.1 69.6 82.8 73.8 83.3 76.3 83.7 78.6 80.7 80.3Female 77 78.9 84.7 82.2 87.2 84.3 88.9 86.6 90.8 87.6Asian 88.9 85.2 77.8 86.9 No Data 86.6 No Data 89.9 No Data 91.3Black 74.6 66.9 80 71.5 77.4 74.6 78.4 77.5 84.8 79.9Hispanic 68.3 61.4 73.8 68.8 83.7 72.8 86.4 75.2 82.7 77.4Multi-racial 90.9 71.2 100 77.2 84.6 80.1 87.5 81.5 >95.0 82.7White 78.1 79.6 87.2 82.6 88.9 84.4 88 86.2 88.1 87.1F/R Lunch 68.8 66.3 83.5 71.2 78.1 74.6 85.5 76.1 87.6 78LEP 44.4 48.3 52.4 48.1 69.2 49.7 60 48.8 66.7 51.7SWD 55.2 57.5 71.4 57.2 60.9 59.8 75 62.3 70.6 64.4
GRADUATION RATE BY SUBGROUP‐‐CLASS OF 2014
ASHEBORO CITY SCHOOLSGRADUATION RATES
0102030405060708090100
AHS
NC
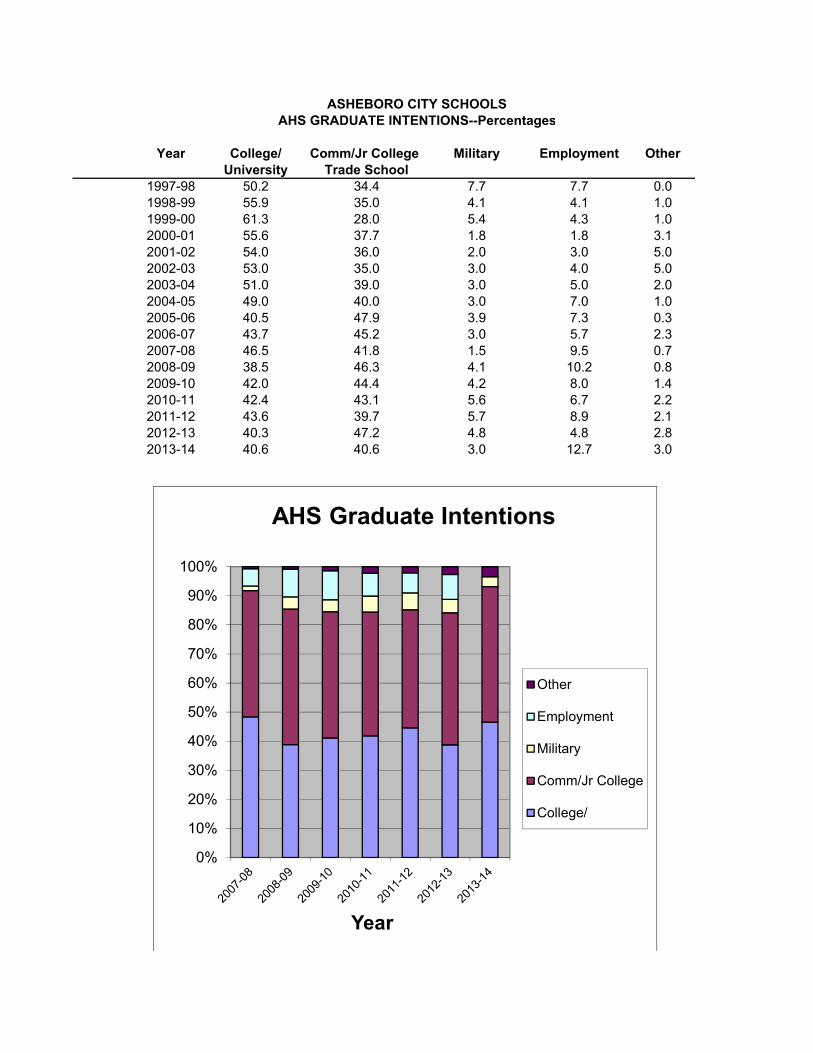
ASHEBORO CITY SCHOOLSAHS GRADUATE INTENTIONS--Percentages
Year College/ Comm/Jr College Military Employment OtherUniversity Trade School
1997-98 50.2 34.4 7.7 7.7 0.01998-99 55.9 35.0 4.1 4.1 1.01999-00 61.3 28.0 5.4 4.3 1.02000-01 55.6 37.7 1.8 1.8 3.12001-02 54.0 36.0 2.0 3.0 5.02002-03 53.0 35.0 3.0 4.0 5.02003-04 51.0 39.0 3.0 5.0 2.02004-05 49.0 40.0 3.0 7.0 1.02005-06 40.5 47.9 3.9 7.3 0.32006-07 43.7 45.2 3.0 5.7 2.32007-08 46.5 41.8 1.5 9.5 0.72008-09 38.5 46.3 4.1 10.2 0.82009-10 42.0 44.4 4.2 8.0 1.42010-11 42.4 43.1 5.6 6.7 2.22011-12 43.6 39.7 5.7 8.9 2.12012-13 40.3 47.2 4.8 4.8 2.82013-14 40.6 40.6 3.0 12.7 3.0
0%
10%
20%
30%
40%
50%
60%
70%
80%
90%
100%
Year
AHS Graduate Intentions
Other
Employment
Military
Comm/Jr College
College/
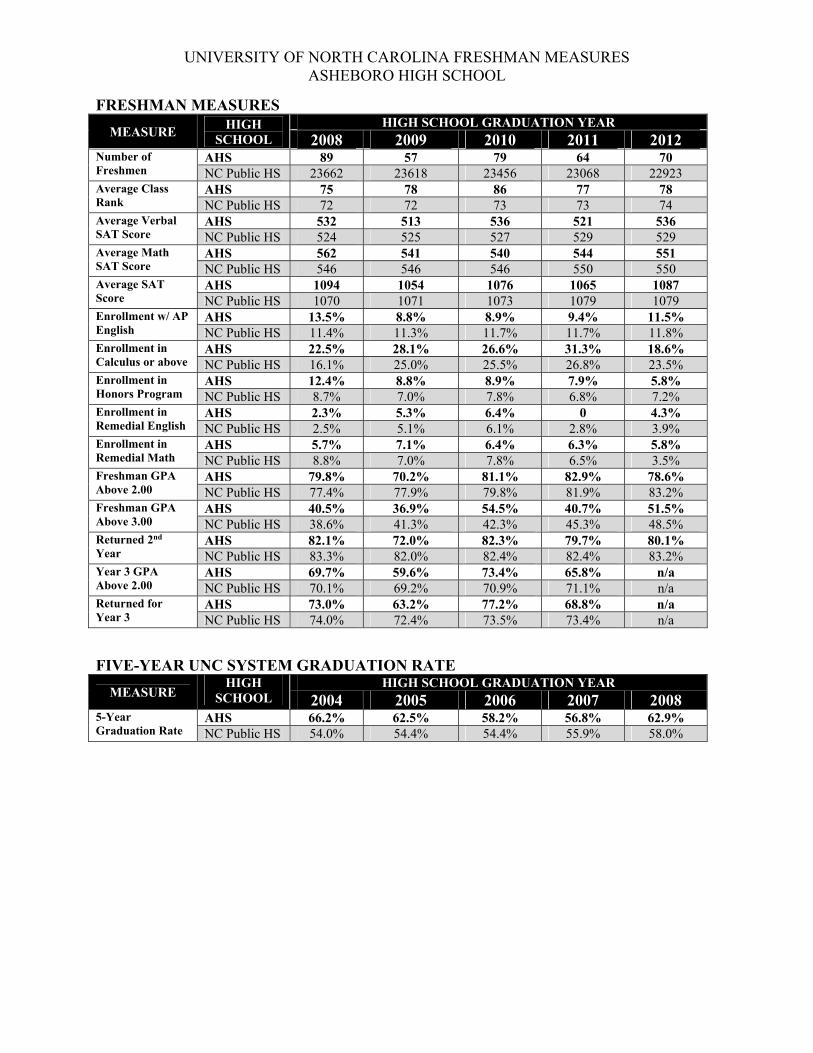
UNIVERSITY OF NORTH CAROLINA FRESHMAN MEASURES ASHEBORO HIGH SCHOOL
FRESHMAN MEASURES
MEASURE HIGH
SCHOOL HIGH SCHOOL GRADUATION YEAR
2008 2009 2010 2011 2012 Number of Freshmen
AHS 89 57 79 64 70 NC Public HS 23662 23618 23456 23068 22923
Average Class Rank
AHS 75 78 86 77 78 NC Public HS 72 72 73 73 74
Average Verbal SAT Score
AHS 532 513 536 521 536 NC Public HS 524 525 527 529 529
Average Math SAT Score
AHS 562 541 540 544 551 NC Public HS 546 546 546 550 550
Average SAT Score
AHS 1094 1054 1076 1065 1087 NC Public HS 1070 1071 1073 1079 1079
Enrollment w/ AP English
AHS 13.5% 8.8% 8.9% 9.4% 11.5% NC Public HS 11.4% 11.3% 11.7% 11.7% 11.8%
Enrollment in Calculus or above
AHS 22.5% 28.1% 26.6% 31.3% 18.6% NC Public HS 16.1% 25.0% 25.5% 26.8% 23.5%
Enrollment in Honors Program
AHS 12.4% 8.8% 8.9% 7.9% 5.8% NC Public HS 8.7% 7.0% 7.8% 6.8% 7.2%
Enrollment in Remedial English
AHS 2.3% 5.3% 6.4% 0 4.3% NC Public HS 2.5% 5.1% 6.1% 2.8% 3.9%
Enrollment in Remedial Math
AHS 5.7% 7.1% 6.4% 6.3% 5.8% NC Public HS 8.8% 7.0% 7.8% 6.5% 3.5%
Freshman GPA Above 2.00
AHS 79.8% 70.2% 81.1% 82.9% 78.6% NC Public HS 77.4% 77.9% 79.8% 81.9% 83.2%
Freshman GPA Above 3.00
AHS 40.5% 36.9% 54.5% 40.7% 51.5% NC Public HS 38.6% 41.3% 42.3% 45.3% 48.5%
Returned 2nd Year
AHS 82.1% 72.0% 82.3% 79.7% 80.1% NC Public HS 83.3% 82.0% 82.4% 82.4% 83.2%
Year 3 GPA Above 2.00
AHS 69.7% 59.6% 73.4% 65.8% n/a NC Public HS 70.1% 69.2% 70.9% 71.1% n/a
Returned for Year 3
AHS 73.0% 63.2% 77.2% 68.8% n/a NC Public HS 74.0% 72.4% 73.5% 73.4% n/a
FIVE-YEAR UNC SYSTEM GRADUATION RATE MEASURE
HIGH SCHOOL
HIGH SCHOOL GRADUATION YEAR 2004 2005 2006 2007 2008
5-Year Graduation Rate
AHS 66.2% 62.5% 58.2% 56.8% 62.9% NC Public HS 54.0% 54.4% 54.4% 55.9% 58.0%
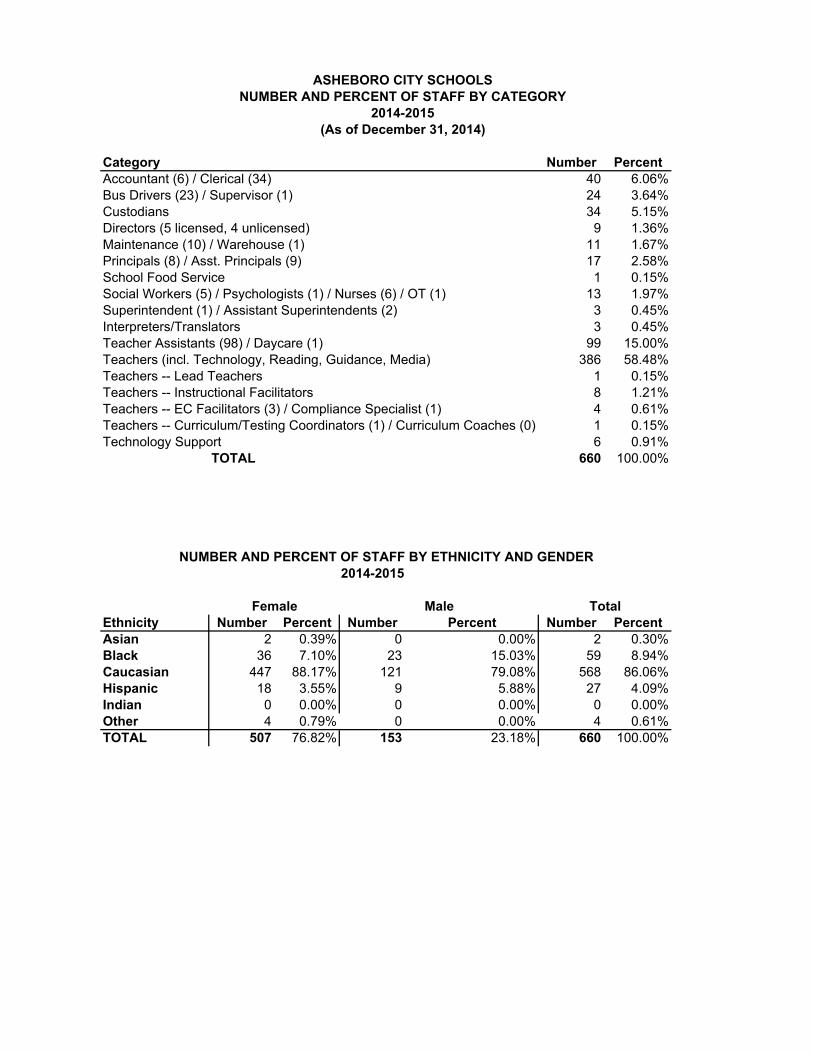
ASHEBORO CITY SCHOOLSNUMBER AND PERCENT OF STAFF BY CATEGORY
Category Number PercentAccountant (6) / Clerical (34) 40 6.06%Bus Drivers (23) / Supervisor (1) 24 3.64%Custodians 34 5.15%Directors (5 licensed, 4 unlicensed) 9 1.36%Maintenance (10) / Warehouse (1) 11 1.67%Principals (8) / Asst. Principals (9) 17 2.58%School Food Service 1 0.15%Social Workers (5) / Psychologists (1) / Nurses (6) / OT (1) 13 1.97%Superintendent (1) / Assistant Superintendents (2) 3 0.45%Interpreters/Translators 3 0.45%Teacher Assistants (98) / Daycare (1) 99 15.00%Teachers (incl. Technology, Reading, Guidance, Media) 386 58.48%Teachers -- Lead Teachers 1 0.15%Teachers -- Instructional Facilitators 8 1.21%Teachers -- EC Facilitators (3) / Compliance Specialist (1) 4 0.61%Teachers -- Curriculum/Testing Coordinators (1) / Curriculum Coaches (0) 1 0.15%Technology Support 6 0.91%
TOTAL 660 100.00%
2014-2015
Female Male TotalEthnicity Number Percent Number Percent Number PercentAsian 2 0.39% 0 0.00% 2 0.30%Black 36 7.10% 23 15.03% 59 8.94%Caucasian 447 88.17% 121 79.08% 568 86.06%Hispanic 18 3.55% 9 5.88% 27 4.09%Indian 0 0.00% 0 0.00% 0 0.00%Other 4 0.79% 0 0.00% 4 0.61%TOTAL 507 76.82% 153 23.18% 660 100.00%
2014-2015(As of December 31, 2014)
NUMBER AND PERCENT OF STAFF BY ETHNICITY AND GENDER
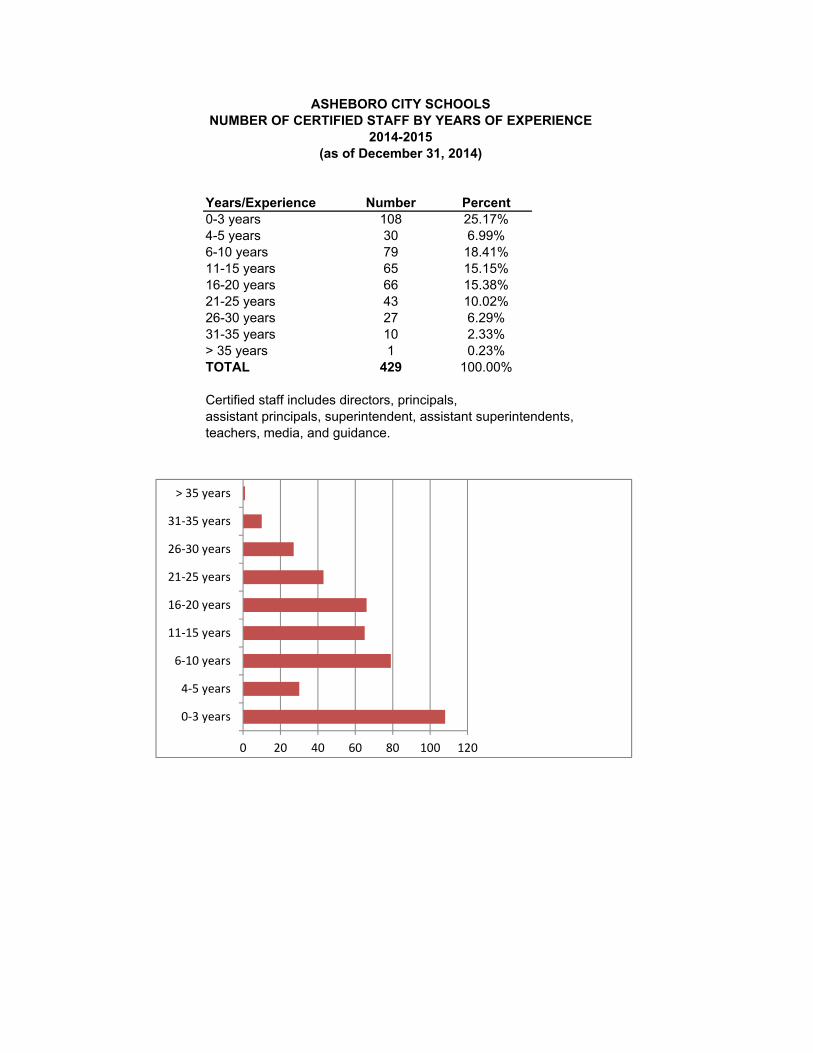
Years/Experience Number Percent0-3 years 108 25.17%4-5 years 30 6.99%6-10 years 79 18.41%11-15 years 65 15.15%16-20 years 66 15.38%21-25 years 43 10.02%26-30 years 27 6.29%31-35 years 10 2.33%> 35 years 1 0.23%TOTAL 429 100.00%
Certified staff includes directors, principals,assistant principals, superintendent, assistant superintendents,teachers, media, and guidance.
ASHEBORO CITY SCHOOLSNUMBER OF CERTIFIED STAFF BY YEARS OF EXPERIENCE
2014-2015(as of December 31, 2014)
0 20 40 60 80 100 120
0‐3 years
4‐5 years
6‐10 years
11‐15 years
16‐20 years
21‐25 years
26‐30 years
31‐35 years
> 35 years
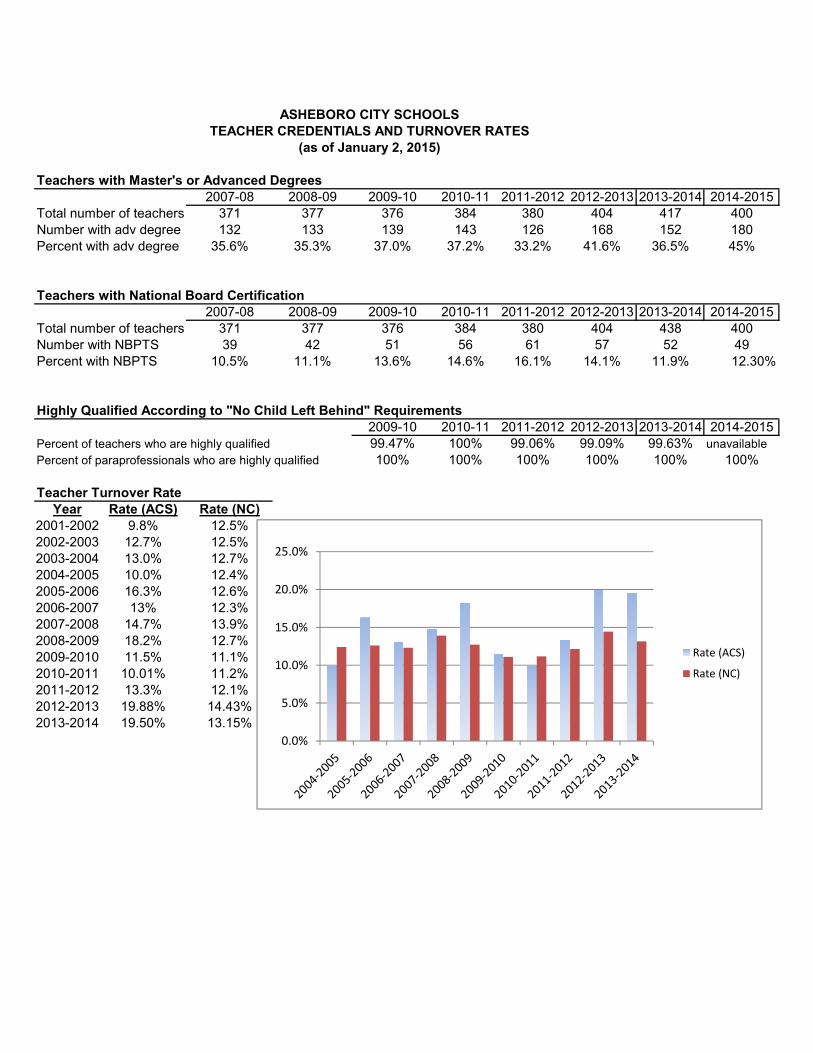
Teachers with Master's or Advanced Degrees2007-08 2008-09 2009-10 2010-11 2011-2012 2012-2013 2013-2014 2014-2015
Total number of teachers 371 377 376 384 380 404 417 400Number with adv degree 132 133 139 143 126 168 152 180Percent with adv degree 35.6% 35.3% 37.0% 37.2% 33.2% 41.6% 36.5% 45%
Teachers with National Board Certification2007-08 2008-09 2009-10 2010-11 2011-2012 2012-2013 2013-2014 2014-2015
Total number of teachers 371 377 376 384 380 404 438 400Number with NBPTS 39 42 51 56 61 57 52 49Percent with NBPTS 10.5% 11.1% 13.6% 14.6% 16.1% 14.1% 11.9% 12.30%
Highly Qualified According to "No Child Left Behind" Requirements2009-10 2010-11 2011-2012 2012-2013 2013-2014 2014-2015
Percent of teachers who are highly qualified 99.47% 100% 99.06% 99.09% 99.63% unavailablePercent of paraprofessionals who are highly qualified 100% 100% 100% 100% 100% 100%
Teacher Turnover RateYear Rate (ACS) Rate (NC)
2001-2002 9.8% 12.5%2002-2003 12.7% 12.5%2003-2004 13.0% 12.7%2004-2005 10.0% 12.4%2005-2006 16.3% 12.6%2006-2007 13% 12.3%2007-2008 14.7% 13.9%2008-2009 18.2% 12.7%2009-2010 11.5% 11.1%2010-2011 10.01% 11.2%2011-2012 13.3% 12.1%2012-2013 19.88% 14.43%2013-2014 19.50% 13.15%
ASHEBORO CITY SCHOOLSTEACHER CREDENTIALS AND TURNOVER RATES
(as of January 2, 2015)
0.0%
5.0%
10.0%
15.0%
20.0%
25.0%
Rate (ACS)
Rate (NC)
Asheboro City Schools Staff Benefits Paid Holidays Sick Leave Vacation/Annual Leave Personal Leave for Teachers 7% supplement for Master's Degree Teachers 6% supplement for Bachelor's Degree Teachers Cafeteria Plan for Pre-tax Expenses Longevity Pay (does not apply to teachers) Retirement System with Employer Participation Death Benefit Provision with $25,000 minimum/$50,000 maximum Health Insurance Dental Insurance Unemployment Insurance Disability Insurance Worker's Compensation Tuition Assistance Program Support for New Teachers 1. Ongoing school-based support and coaching from administrators and instructional support personnel 2. Ongoing school-based support from mentor teacher and lead mentor 3. Services from BT (Beginning Teachers) team: Orientation Workshop, S.E.E.D.S. - Setting Expectations for Educators and Defining Success! Ongoing professional development opportunities; topics include classroom management, classroom instruction, differentiated instruction, etc. Ongoing professional development for lead mentors Ten day training for lateral entry teachers Introduction to the NC Professional Teaching Standards and Teacher Evaluation System PRAXIS test preparation and assistance Regular classroom visits, observations, and feedback sessions Training and assistance for mentor teachers 4. Career development counseling for graduate school and National Board Certification preparation 5. Support from Chamber of Commerce - discount package from local businesses
ASHEBORO CITY SCHOOLS STAFF BENEFITS (January 2, 2015)
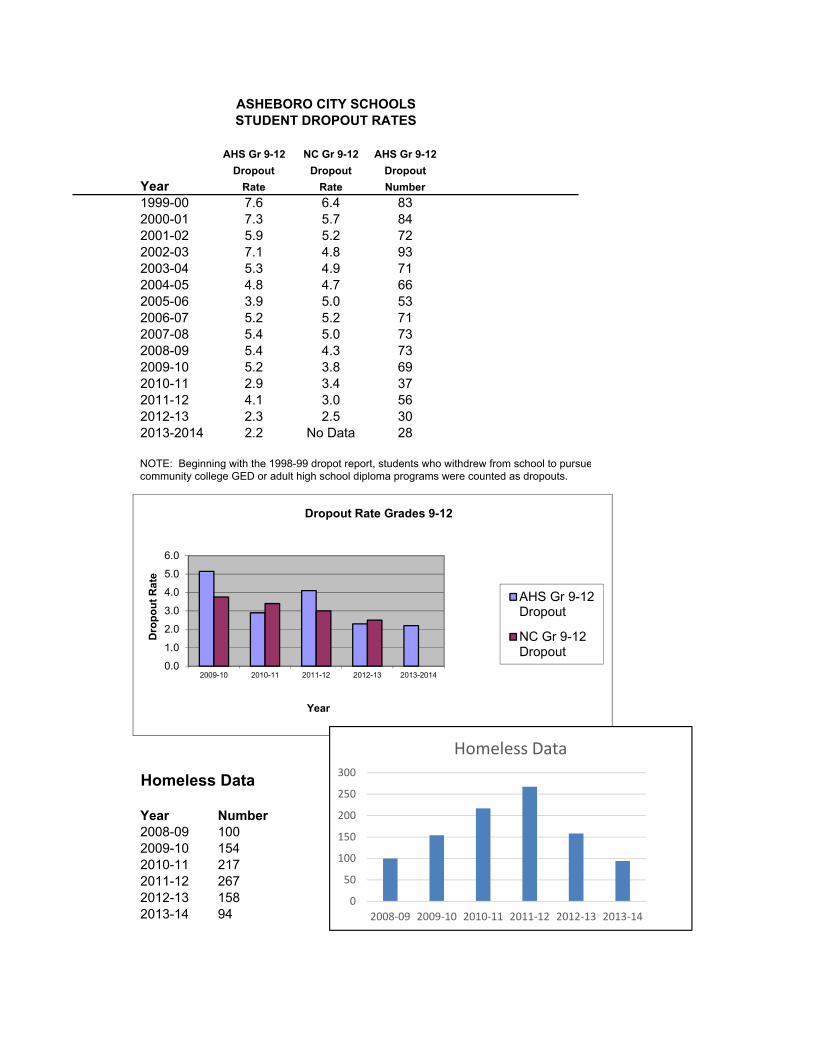
ASHEBORO CITY SCHOOLSSTUDENT DROPOUT RATES
AHS Gr 9-12 NC Gr 9-12 AHS Gr 9-12
Dropout Dropout Dropout
Year Rate Rate Number
1999-00 7.6 6.4 832000-01 7.3 5.7 842001-02 5.9 5.2 722002-03 7.1 4.8 932003-04 5.3 4.9 712004-05 4.8 4.7 662005-06 3.9 5.0 532006-07 5.2 5.2 712007-08 5.4 5.0 732008-09 5.4 4.3 732009-10 5.2 3.8 692010-11 2.9 3.4 372011-12 4.1 3.0 562012-13 2.3 2.5 302013-2014 2.2 No Data 28
NOTE: Beginning with the 1998-99 dropot report, students who withdrew from school to pursuecommunity college GED or adult high school diploma programs were counted as dropouts.
Homeless Data
Year Number2008-09 1002009-10 1542010-11 2172011-12 2672012-13 1582013-14 94
0.0
1.0
2.0
3.0
4.0
5.0
6.0
2009-10 2010-11 2011-12 2012-13 2013-2014
Dro
po
ut
Rat
e
Year
Dropout Rate Grades 9-12
AHS Gr 9-12Dropout
NC Gr 9-12Dropout
0
50
100
150
200
250
300
2008‐09 2009‐10 2010‐11 2011‐12 2012‐13 2013‐14
Homeless Data
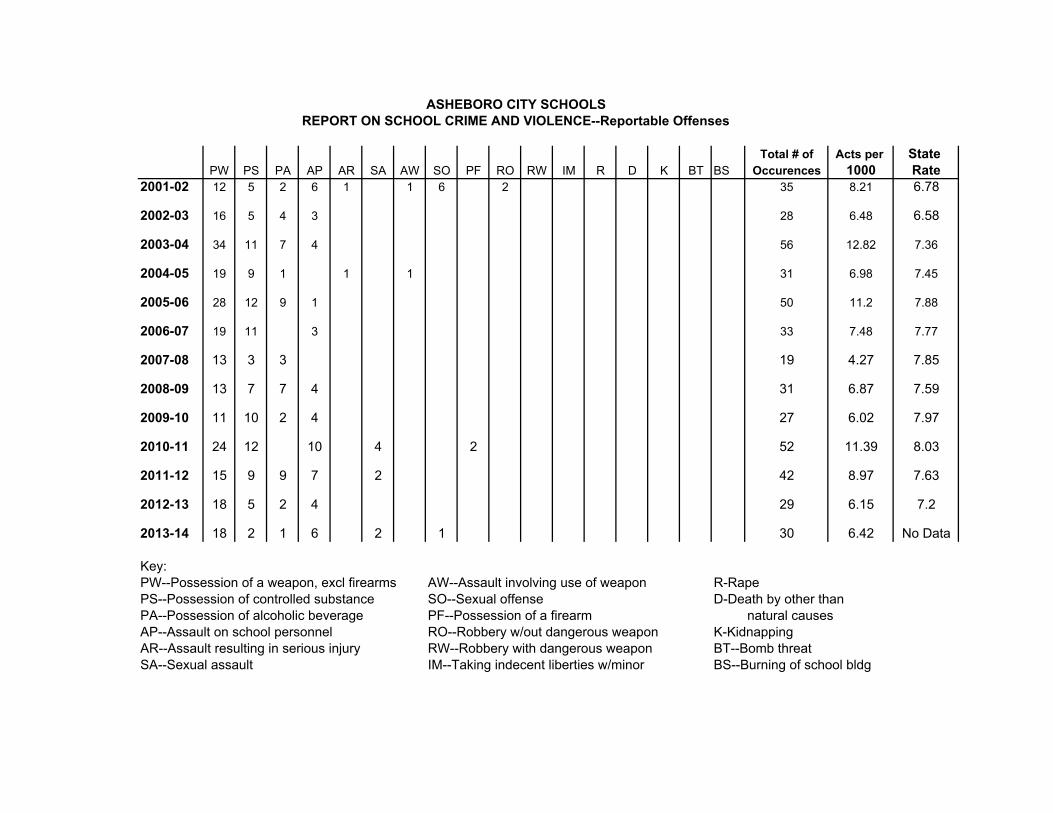
ASHEBORO CITY SCHOOLSREPORT ON SCHOOL CRIME AND VIOLENCE--Reportable Offenses
Total # of Acts per State PW PS PA AP AR SA AW SO PF RO RW IM R D K BT BS Occurences 1000 Rate
2001-02 12 5 2 6 1 1 6 2 35 8.21 6.78
2002-03 16 5 4 3 28 6.48 6.58
2003-04 34 11 7 4 56 12.82 7.36
2004-05 19 9 1 1 1 31 6.98 7.45
2005-06 28 12 9 1 50 11.2 7.88
2006-07 19 11 3 33 7.48 7.77
2007-08 13 3 3 19 4.27 7.85
2008-09 13 7 7 4 31 6.87 7.59
2009-10 11 10 2 4 27 6.02 7.97
2010-11 24 12 10 4 2 52 11.39 8.03
2011-12 15 9 9 7 2 42 8.97 7.63
2012-13 18 5 2 4 29 6.15 7.2
2013-14 18 2 1 6 2 1 30 6.42 No Data
Key:PW--Possession of a weapon, excl firearms AW--Assault involving use of weapon R-RapePS--Possession of controlled substance SO--Sexual offense D-Death by other than PA--Possession of alcoholic beverage PF--Possession of a firearm natural causesAP--Assault on school personnel RO--Robbery w/out dangerous weapon K-KidnappingAR--Assault resulting in serious injury RW--Robbery with dangerous weapon BT--Bomb threatSA--Sexual assault IM--Taking indecent liberties w/minor BS--Burning of school bldg
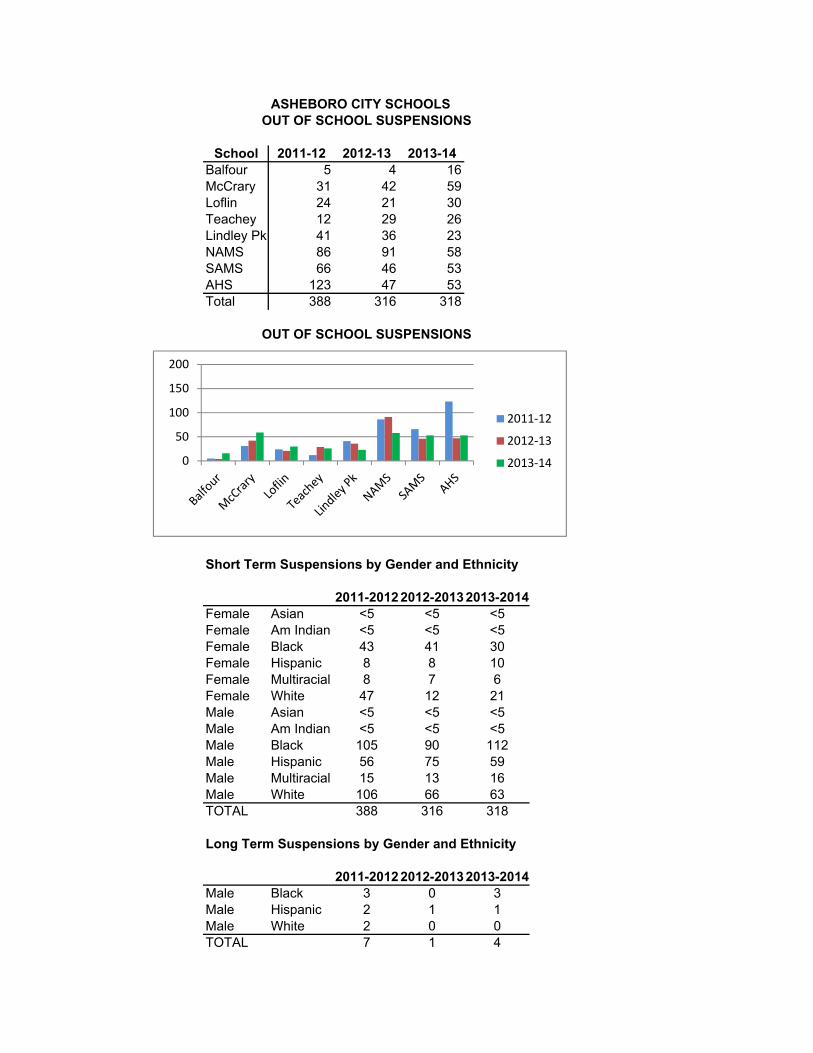
ASHEBORO CITY SCHOOLS
School 2011-12 2012-13 2013-14Balfour 5 4 16McCrary 31 42 59Loflin 24 21 30Teachey 12 29 26Lindley Pk 41 36 23NAMS 86 91 58SAMS 66 46 53AHS 123 47 53Total 388 316 318
OUT OF SCHOOL SUSPENSIONS
Short Term Suspensions by Gender and Ethnicity
2011-2012 2012-2013 2013-2014Female Asian <5 <5 <5Female Am Indian <5 <5 <5Female Black 43 41 30Female Hispanic 8 8 10Female Multiracial 8 7 6Female White 47 12 21Male Asian <5 <5 <5Male Am Indian <5 <5 <5Male Black 105 90 112Male Hispanic 56 75 59Male Multiracial 15 13 16Male White 106 66 63TOTAL 388 316 318
Long Term Suspensions by Gender and Ethnicity
2011-2012 2012-2013 2013-2014Male Black 3 0 3Male Hispanic 2 1 1Male White 2 0 0TOTAL 7 1 4
OUT OF SCHOOL SUSPENSIONS
0
50
100
150
200
2011‐12
2012‐13
2013‐14
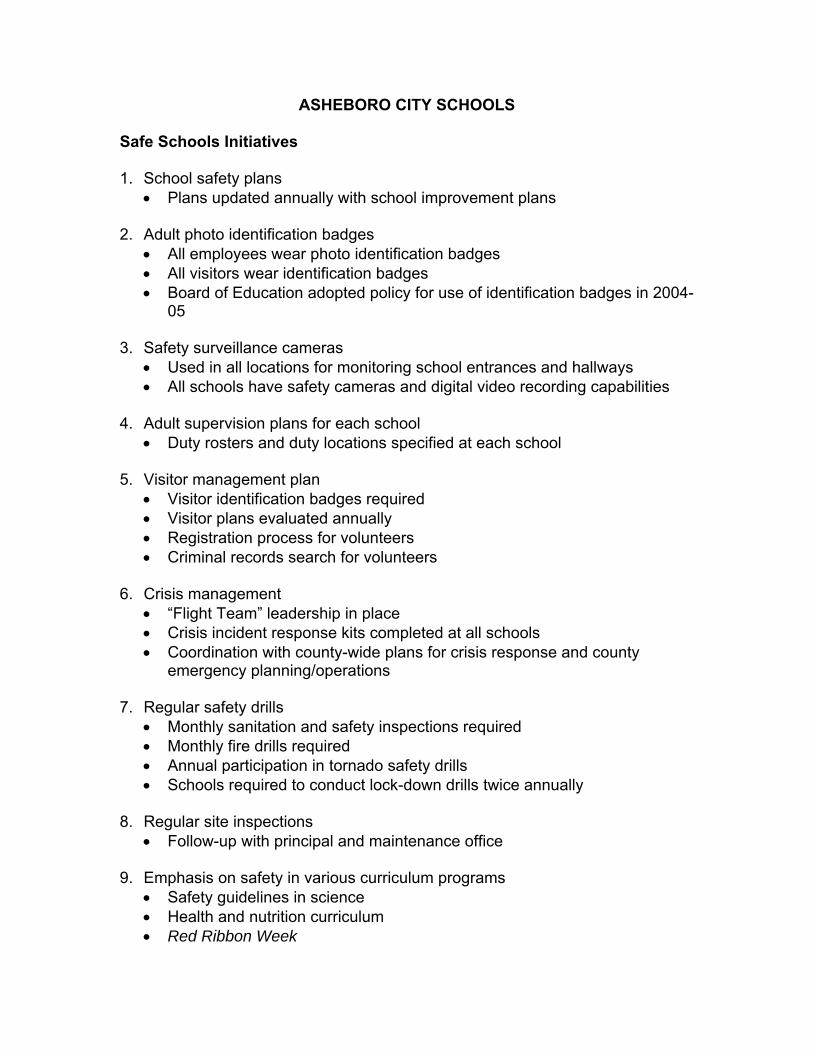
ASHEBORO CITY SCHOOLS
Safe Schools Initiatives 1. School safety plans
Plans updated annually with school improvement plans
2. Adult photo identification badges All employees wear photo identification badges All visitors wear identification badges Board of Education adopted policy for use of identification badges in 2004-
05
3. Safety surveillance cameras Used in all locations for monitoring school entrances and hallways All schools have safety cameras and digital video recording capabilities
4. Adult supervision plans for each school Duty rosters and duty locations specified at each school
5. Visitor management plan
Visitor identification badges required Visitor plans evaluated annually Registration process for volunteers Criminal records search for volunteers
6. Crisis management
“Flight Team” leadership in place Crisis incident response kits completed at all schools Coordination with county-wide plans for crisis response and county
emergency planning/operations
7. Regular safety drills Monthly sanitation and safety inspections required Monthly fire drills required Annual participation in tornado safety drills Schools required to conduct lock-down drills twice annually
8. Regular site inspections
Follow-up with principal and maintenance office 9. Emphasis on safety in various curriculum programs
Safety guidelines in science Health and nutrition curriculum Red Ribbon Week
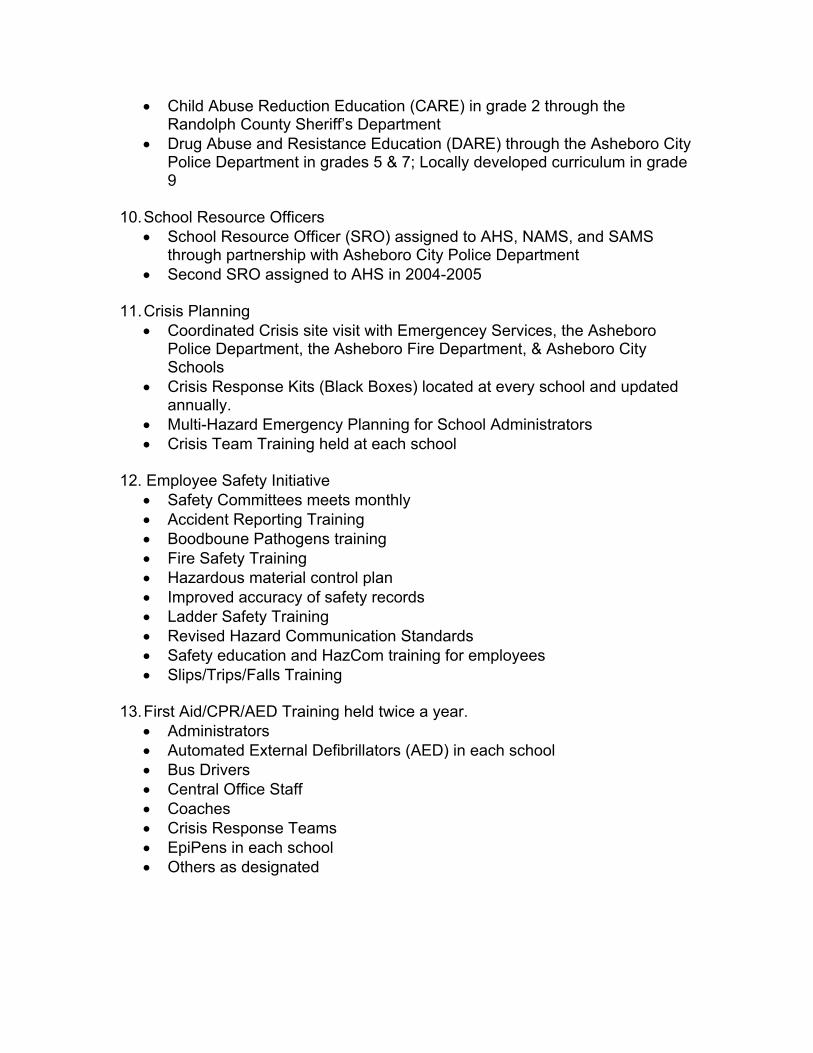
Child Abuse Reduction Education (CARE) in grade 2 through the Randolph County Sheriff’s Department
Drug Abuse and Resistance Education (DARE) through the Asheboro City Police Department in grades 5 & 7; Locally developed curriculum in grade 9
10. School Resource Officers
School Resource Officer (SRO) assigned to AHS, NAMS, and SAMS through partnership with Asheboro City Police Department
Second SRO assigned to AHS in 2004-2005
11. Crisis Planning Coordinated Crisis site visit with Emergencey Services, the Asheboro
Police Department, the Asheboro Fire Department, & Asheboro City Schools
Crisis Response Kits (Black Boxes) located at every school and updated annually.
Multi-Hazard Emergency Planning for School Administrators Crisis Team Training held at each school
12. Employee Safety Initiative
Safety Committees meets monthly Accident Reporting Training Boodboune Pathogens training Fire Safety Training Hazardous material control plan Improved accuracy of safety records Ladder Safety Training Revised Hazard Communication Standards Safety education and HazCom training for employees Slips/Trips/Falls Training
13. First Aid/CPR/AED Training held twice a year. Administrators Automated External Defibrillators (AED) in each school Bus Drivers Central Office Staff Coaches Crisis Response Teams EpiPens in each school Others as designated
ASHEBORO CITY SCHOOLS
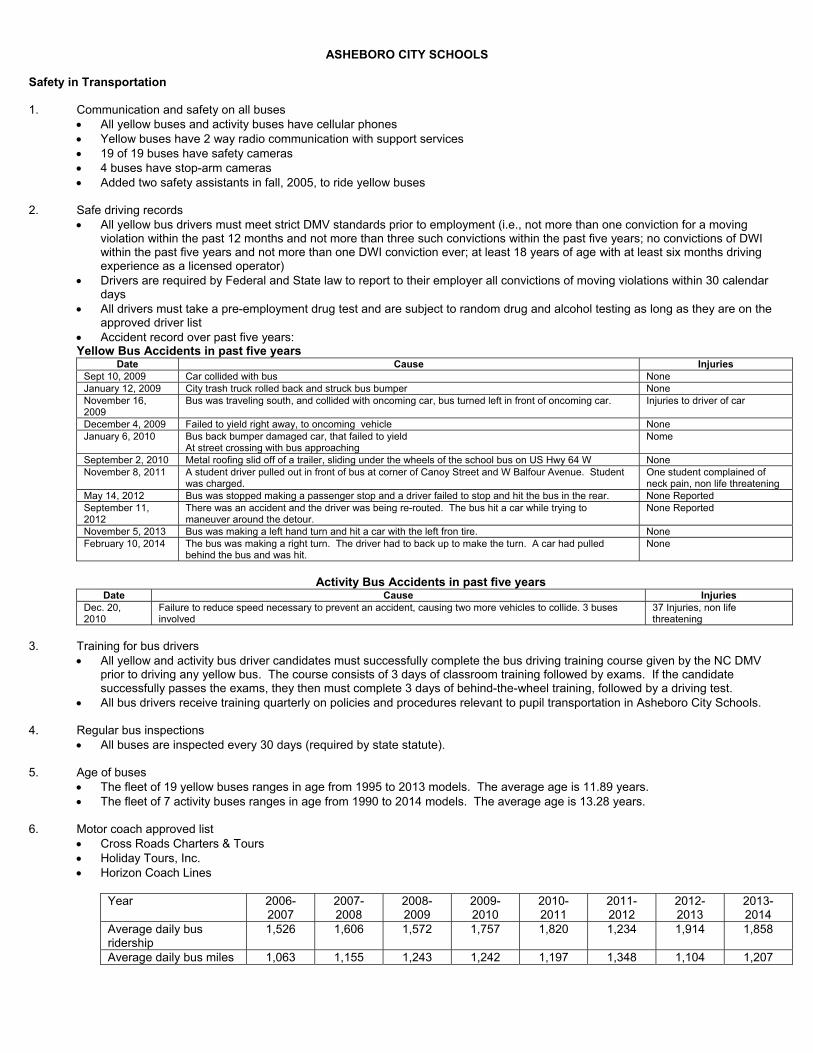
Safety in Transportation 1. Communication and safety on all buses
All yellow buses and activity buses have cellular phones Yellow buses have 2 way radio communication with support services 19 of 19 buses have safety cameras 4 buses have stop-arm cameras Added two safety assistants in fall, 2005, to ride yellow buses
2. Safe driving records All yellow bus drivers must meet strict DMV standards prior to employment (i.e., not more than one conviction for a moving
violation within the past 12 months and not more than three such convictions within the past five years; no convictions of DWI within the past five years and not more than one DWI conviction ever; at least 18 years of age with at least six months driving experience as a licensed operator)
Drivers are required by Federal and State law to report to their employer all convictions of moving violations within 30 calendar days
All drivers must take a pre-employment drug test and are subject to random drug and alcohol testing as long as they are on the approved driver list
Accident record over past five years: Yellow Bus Accidents in past five years
Date Cause InjuriesSept 10, 2009 Car collided with bus None January 12, 2009 City trash truck rolled back and struck bus bumper None November 16, 2009
Bus was traveling south, and collided with oncoming car, bus turned left in front of oncoming car. Injuries to driver of car
December 4, 2009 Failed to yield right away, to oncoming vehicle None January 6, 2010 Bus back bumper damaged car, that failed to yield
At street crossing with bus approaching Nome
September 2, 2010 Metal roofing slid off of a trailer, sliding under the wheels of the school bus on US Hwy 64 W None November 8, 2011 A student driver pulled out in front of bus at corner of Canoy Street and W Balfour Avenue. Student
was charged. One student complained of neck pain, non life threatening
May 14, 2012 Bus was stopped making a passenger stop and a driver failed to stop and hit the bus in the rear. None Reported September 11, 2012
There was an accident and the driver was being re-routed. The bus hit a car while trying to maneuver around the detour.
None Reported
November 5, 2013 Bus was making a left hand turn and hit a car with the left fron tire. None February 10, 2014 The bus was making a right turn. The driver had to back up to make the turn. A car had pulled
behind the bus and was hit. None
Activity Bus Accidents in past five years
Date Cause InjuriesDec. 20, 2010
Failure to reduce speed necessary to prevent an accident, causing two more vehicles to collide. 3 buses involved
37 Injuries, non life threatening
3. Training for bus drivers
All yellow and activity bus driver candidates must successfully complete the bus driving training course given by the NC DMV prior to driving any yellow bus. The course consists of 3 days of classroom training followed by exams. If the candidate successfully passes the exams, they then must complete 3 days of behind-the-wheel training, followed by a driving test.
All bus drivers receive training quarterly on policies and procedures relevant to pupil transportation in Asheboro City Schools. 4. Regular bus inspections
All buses are inspected every 30 days (required by state statute).
5. Age of buses The fleet of 19 yellow buses ranges in age from 1995 to 2013 models. The average age is 11.89 years. The fleet of 7 activity buses ranges in age from 1990 to 2014 models. The average age is 13.28 years.
6. Motor coach approved list Cross Roads Charters & Tours Holiday Tours, Inc. Horizon Coach Lines
Year 2006-2007
2007-2008
2008-2009
2009-2010
2010-2011
2011-2012
2012-2013
2013-2014
Average daily bus ridership
1,526 1,606 1,572 1,757 1,820 1,234 1,914 1,858
Average daily bus miles 1,063 1,155 1,243 1,242 1,197 1,348 1,104 1,207
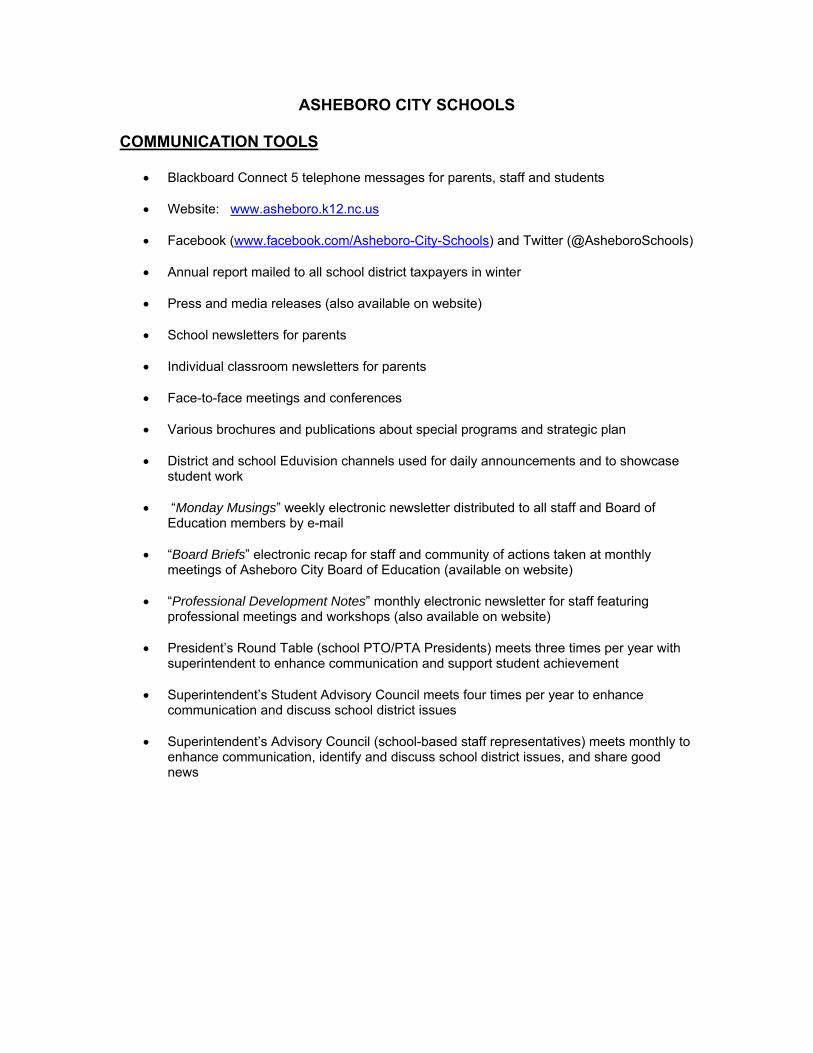
ASHEBORO CITY SCHOOLS COMMUNICATION TOOLS
Blackboard Connect 5 telephone messages for parents, staff and students Website: www.asheboro.k12.nc.us
Facebook (www.facebook.com/Asheboro-City-Schools) and Twitter (@AsheboroSchools)
Annual report mailed to all school district taxpayers in winter
Press and media releases (also available on website)
School newsletters for parents
Individual classroom newsletters for parents
Face-to-face meetings and conferences
Various brochures and publications about special programs and strategic plan
District and school Eduvision channels used for daily announcements and to showcase
student work
“Monday Musings” weekly electronic newsletter distributed to all staff and Board of Education members by e-mail
“Board Briefs” electronic recap for staff and community of actions taken at monthly
meetings of Asheboro City Board of Education (available on website)
“Professional Development Notes” monthly electronic newsletter for staff featuring professional meetings and workshops (also available on website)
President’s Round Table (school PTO/PTA Presidents) meets three times per year with
superintendent to enhance communication and support student achievement
Superintendent’s Student Advisory Council meets four times per year to enhance communication and discuss school district issues
Superintendent’s Advisory Council (school-based staff representatives) meets monthly to
enhance communication, identify and discuss school district issues, and share good news

ASHEBORO CITY SCHOOLS
PARTNERSHIPS WITH PARENTS
PTO, PTA Athletic and band boosters
Parent participation on school improvement teams
Parent participation on various committees, such as annual calendar
committee, strategic planning, etc.
Parent workshops
Parent-teacher conferences
Parents as volunteers
PAGE (Partners for the Advancement of Gifted Education)
ESL parent nights
Title I parent nights
AVID parent nights
College/Scholarship parent nights
Curriculum parent events
8th Grade parent nights for career planning
Open House nights
Parent involvement activities for at-risk families
Student and parent surveys
President’s Round Table (PTO/PTA Presidents) meet with superintendent three times per year to enhance communication and share ideas for supporting student achievement
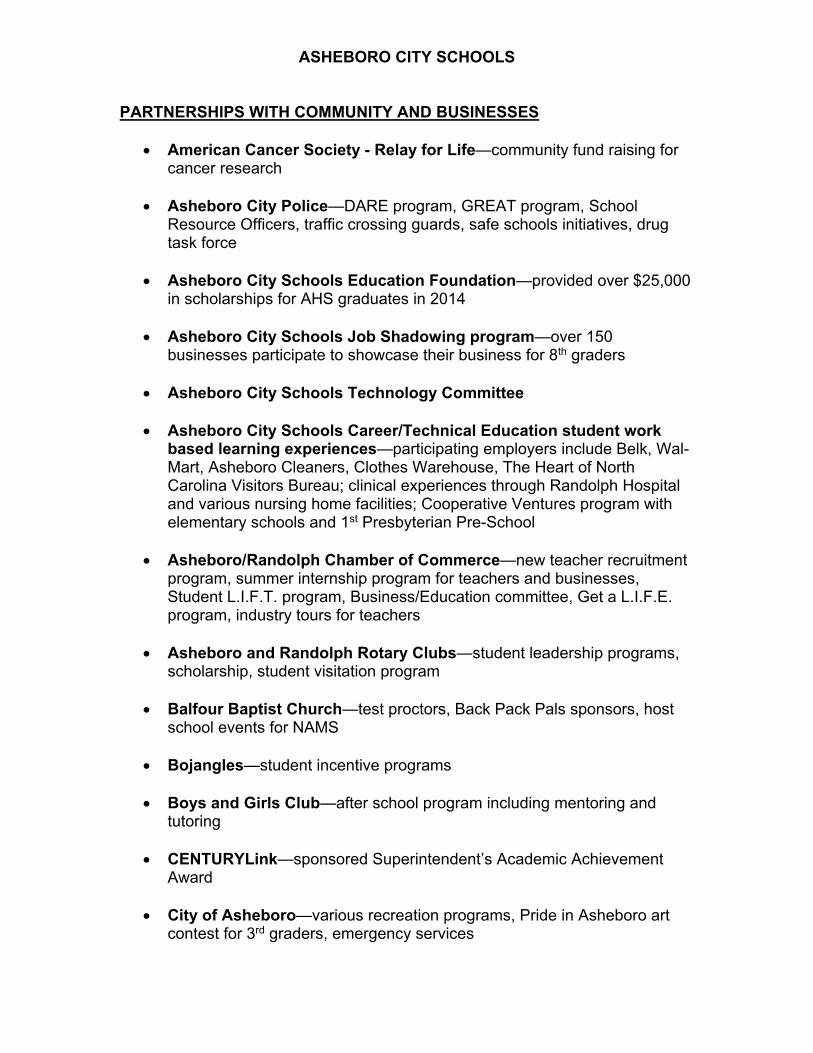
ASHEBORO CITY SCHOOLS PARTNERSHIPS WITH COMMUNITY AND BUSINESSES
American Cancer Society - Relay for Life—community fund raising for cancer research
Asheboro City Police—DARE program, GREAT program, School Resource Officers, traffic crossing guards, safe schools initiatives, drug task force
Asheboro City Schools Education Foundation—provided over $25,000
in scholarships for AHS graduates in 2014
Asheboro City Schools Job Shadowing program—over 150 businesses participate to showcase their business for 8th graders
Asheboro City Schools Technology Committee
Asheboro City Schools Career/Technical Education student work
based learning experiences—participating employers include Belk, Wal-Mart, Asheboro Cleaners, Clothes Warehouse, The Heart of North Carolina Visitors Bureau; clinical experiences through Randolph Hospital and various nursing home facilities; Cooperative Ventures program with elementary schools and 1st Presbyterian Pre-School
Asheboro/Randolph Chamber of Commerce—new teacher recruitment
program, summer internship program for teachers and businesses, Student L.I.F.T. program, Business/Education committee, Get a L.I.F.E. program, industry tours for teachers
Asheboro and Randolph Rotary Clubs—student leadership programs,
scholarship, student visitation program
Balfour Baptist Church—test proctors, Back Pack Pals sponsors, host school events for NAMS
Bojangles—student incentive programs
Boys and Girls Club—after school program including mentoring and
tutoring
CENTURYLink—sponsored Superintendent’s Academic Achievement Award
City of Asheboro—various recreation programs, Pride in Asheboro art
contest for 3rd graders, emergency services
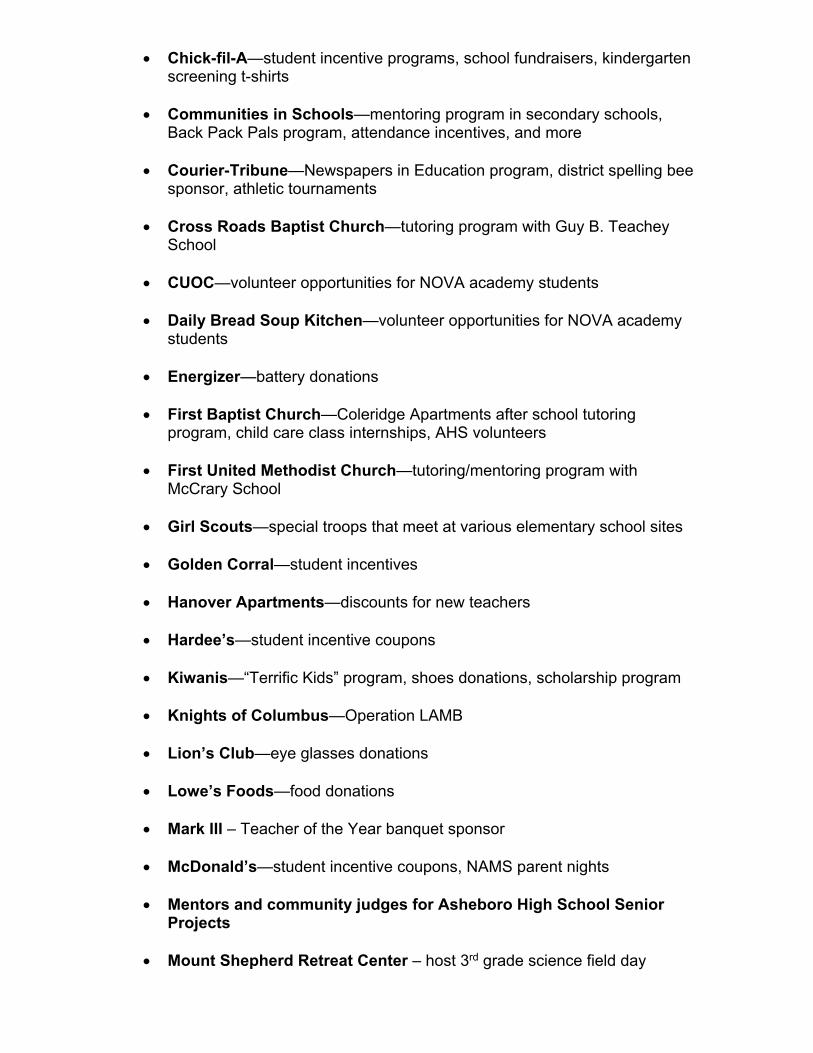
Chick-fil-A—student incentive programs, school fundraisers, kindergarten screening t-shirts
Communities in Schools—mentoring program in secondary schools,
Back Pack Pals program, attendance incentives, and more
Courier-Tribune—Newspapers in Education program, district spelling bee sponsor, athletic tournaments
Cross Roads Baptist Church—tutoring program with Guy B. Teachey
School
CUOC—volunteer opportunities for NOVA academy students
Daily Bread Soup Kitchen—volunteer opportunities for NOVA academy students
Energizer—battery donations
First Baptist Church—Coleridge Apartments after school tutoring
program, child care class internships, AHS volunteers
First United Methodist Church—tutoring/mentoring program with McCrary School
Girl Scouts—special troops that meet at various elementary school sites
Golden Corral—student incentives
Hanover Apartments—discounts for new teachers
Hardee’s—student incentive coupons
Kiwanis—“Terrific Kids” program, shoes donations, scholarship program
Knights of Columbus—Operation LAMB
Lion’s Club—eye glasses donations
Lowe’s Foods—food donations
Mark III – Teacher of the Year banquet sponsor
McDonald’s—student incentive coupons, NAMS parent nights
Mentors and community judges for Asheboro High School Senior
Projects
Mount Shepherd Retreat Center – host 3rd grade science field day
News & Record—Newspapers in Education
North Carolina Zoo—Uganda project, AHS Zoo School and other
curriculum projects
North Ridge Church – tutoring and mentoring program at Balfour School
PAGE of Asheboro (Partners for the Advancement of Gifted Education) – enrichment opportunities for students
Pilot’s Club—bicycle safety and helmet donations
Pizza Hut—student reading incentive program
Pugh Oil—athletic donations
Randolph Arts Guild—various arts programs, including Rag Bag Players
drama productions, Touring Theater Ensemble, Greensboro Symphony
Randolph Community College—Even Start program, Huskins program, college transfer courses, adult high school diploma program, etc.
Randolph County Economic Development Corporation—summer
internship program for teachers and businesses
Randolph County Children & Youth Interagency Council
Randolph County Cooperative Extension and 4-H—curriculum support for various projects such as hatching chicks
Randolph County Government—emergency services coordination and
management
Randolph County Health Department—immunization and health support for students, Health Advisory Task Force
Randolph County Juvenile Crime Prevention Council—Teen Court,
Teen Restitution program, Juvenile Day Reporting Center
Randolph County Partnership for Children—preschool and family literacy programs
Randolph County Schools—Health Advisory Task Force, bus garage,
professional development, crisis management planning
Randolph County Sheriff’s Department—CARE program, Sheriff’s Academy
Randolph County Social Services—referrals for child abuse, permanency planning for child placement
Randolph Hospital—company doctor, worker’s compensation, employee
screenings and inoculations, AHS Health Sciences Academy partner, educational programs for students and staff (e.g., Teddy Bear Fair), kindergarten screening t-shirts
REMC—Bright Ideas grants
Roll-a-bout—school fundraisers
Rushwood Church—mentor and reading buddy programs at Donna Lee
Loflin
Sandhills Mental Health Department—support programs for students and families
Senior Holiday Luncheon—a Christmas holiday luncheon for senior
citizens with a student program and door prizes donated by various businesses (Past donors include: America’s Roadhouse, Ann Crittenden Hallmark, Belk, Blasé Chiropractic, Burge Florist, Chick-fil-A, Chili’s, Cinemark Theatre, Clothes Warehouse, CommunityOne Bank, Di’lishi Frozen Yogurt Bar, Faith Book Nook, Fresh Cuts Butcher & Seafood Market, Henry James Bar-B-Q, Ink ‘n Stitches, NC Zoo, RE/MAX Central Realty, Something Different, State of the Art Custom Framing, The Flying Pig, The Table Farmhouse Bakery, Vintage Cottage and Walker Shoe’s Outlet)
St. Joseph’s Catholic Church—after school tutoring program for Donna
Lee Loflin ESL students
Timken—technology support and matching grant opportunities
Trees Asheboro – variety of earth/environmental curriculum projects
United Way—community fund raising for special service agencies
Village Printing—paper donations
Wal-Mart—“Tools for Schools” program, various donations
YMCA—after school programs NOTE: This list is continually being updated, and may not include all community and business partnerships, both formal and informal.
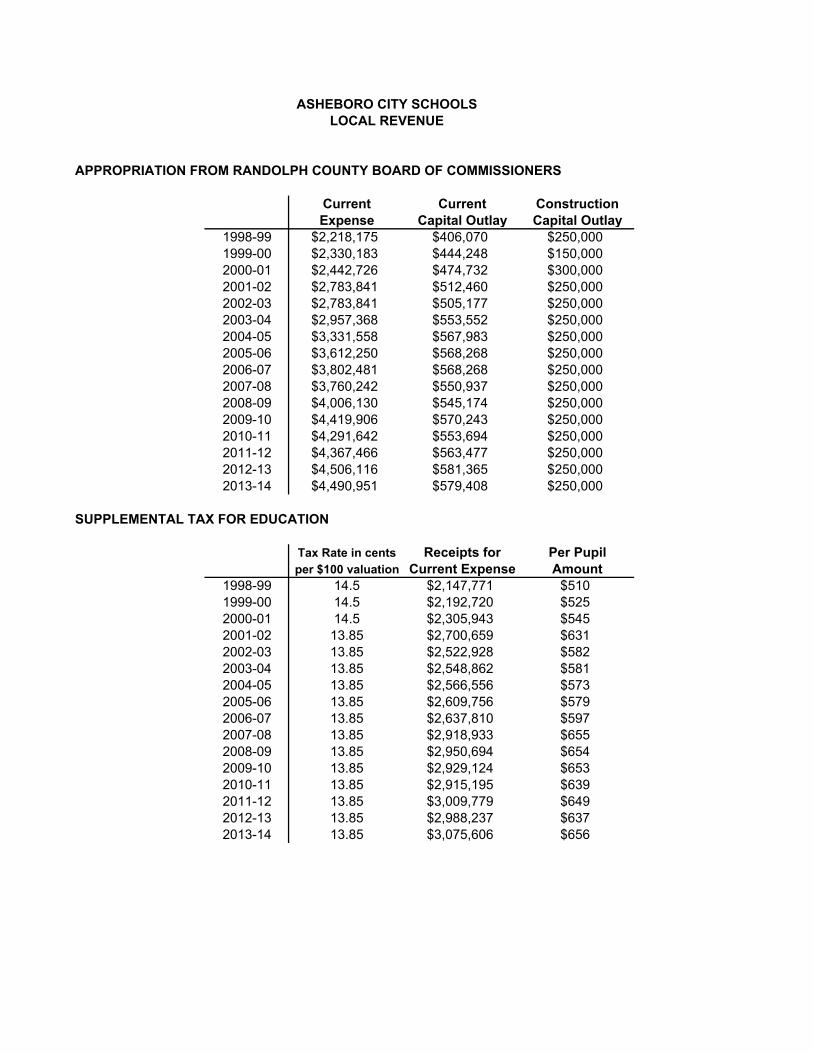
ASHEBORO CITY SCHOOLSLOCAL REVENUE
APPROPRIATION FROM RANDOLPH COUNTY BOARD OF COMMISSIONERS
Current Current ConstructionExpense Capital Outlay Capital Outlay
1998-99 $2,218,175 $406,070 $250,0001999-00 $2,330,183 $444,248 $150,0002000-01 $2,442,726 $474,732 $300,0002001-02 $2,783,841 $512,460 $250,0002002-03 $2,783,841 $505,177 $250,0002003-04 $2,957,368 $553,552 $250,0002004-05 $3,331,558 $567,983 $250,0002005-06 $3,612,250 $568,268 $250,0002006-07 $3,802,481 $568,268 $250,0002007-08 $3,760,242 $550,937 $250,0002008-09 $4,006,130 $545,174 $250,0002009-10 $4,419,906 $570,243 $250,0002010-11 $4,291,642 $553,694 $250,0002011-12 $4,367,466 $563,477 $250,0002012-13 $4,506,116 $581,365 $250,0002013-14 $4,490,951 $579,408 $250,000
SUPPLEMENTAL TAX FOR EDUCATION
Tax Rate in cents Receipts for Per Pupilper $100 valuation Current Expense Amount
1998-99 14.5 $2,147,771 $5101999-00 14.5 $2,192,720 $5252000-01 14.5 $2,305,943 $5452001-02 13.85 $2,700,659 $6312002-03 13.85 $2,522,928 $5822003-04 13.85 $2,548,862 $5812004-05 13.85 $2,566,556 $5732005-06 13.85 $2,609,756 $5792006-07 13.85 $2,637,810 $5972007-08 13.85 $2,918,933 $6552008-09 13.85 $2,950,694 $6542009-10 13.85 $2,929,124 $6532010-11 13.85 $2,915,195 $6392011-12 13.85 $3,009,779 $6492012-13 13.85 $2,988,237 $6372013-14 13.85 $3,075,606 $656
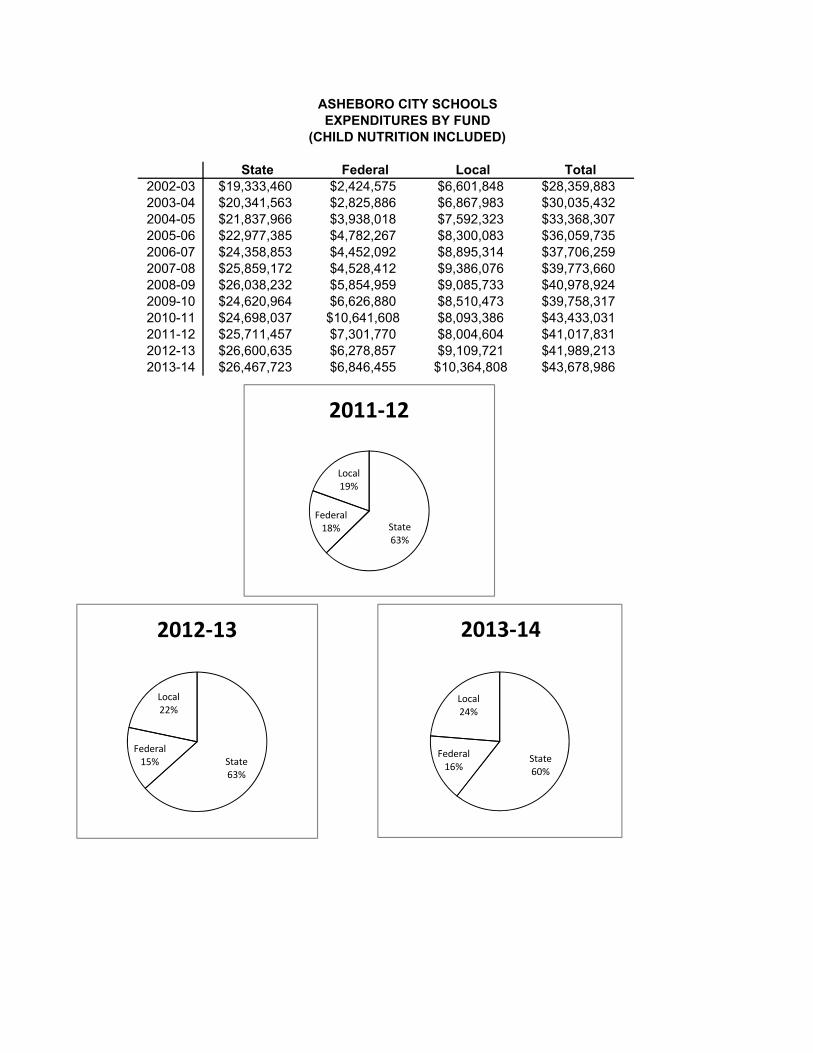
ASHEBORO CITY SCHOOLSEXPENDITURES BY FUND
(CHILD NUTRITION INCLUDED)
State Federal Local Total2002-03 $19,333,460 $2,424,575 $6,601,848 $28,359,8832003-04 $20,341,563 $2,825,886 $6,867,983 $30,035,4322004-05 $21,837,966 $3,938,018 $7,592,323 $33,368,3072005-06 $22,977,385 $4,782,267 $8,300,083 $36,059,7352006-07 $24,358,853 $4,452,092 $8,895,314 $37,706,2592007-08 $25,859,172 $4,528,412 $9,386,076 $39,773,6602008-09 $26,038,232 $5,854,959 $9,085,733 $40,978,9242009-10 $24,620,964 $6,626,880 $8,510,473 $39,758,3172010-11 $24,698,037 $10,641,608 $8,093,386 $43,433,0312011-12 $25,711,457 $7,301,770 $8,004,604 $41,017,8312012-13 $26,600,635 $6,278,857 $9,109,721 $41,989,2132013-14 $26,467,723 $6,846,455 $10,364,808 $43,678,986
State63%
Federal15%
Local22%
2012‐13
State60%
Federal16%
Local24%
2013‐14
State63%
Federal18%
Local19%
2011‐12

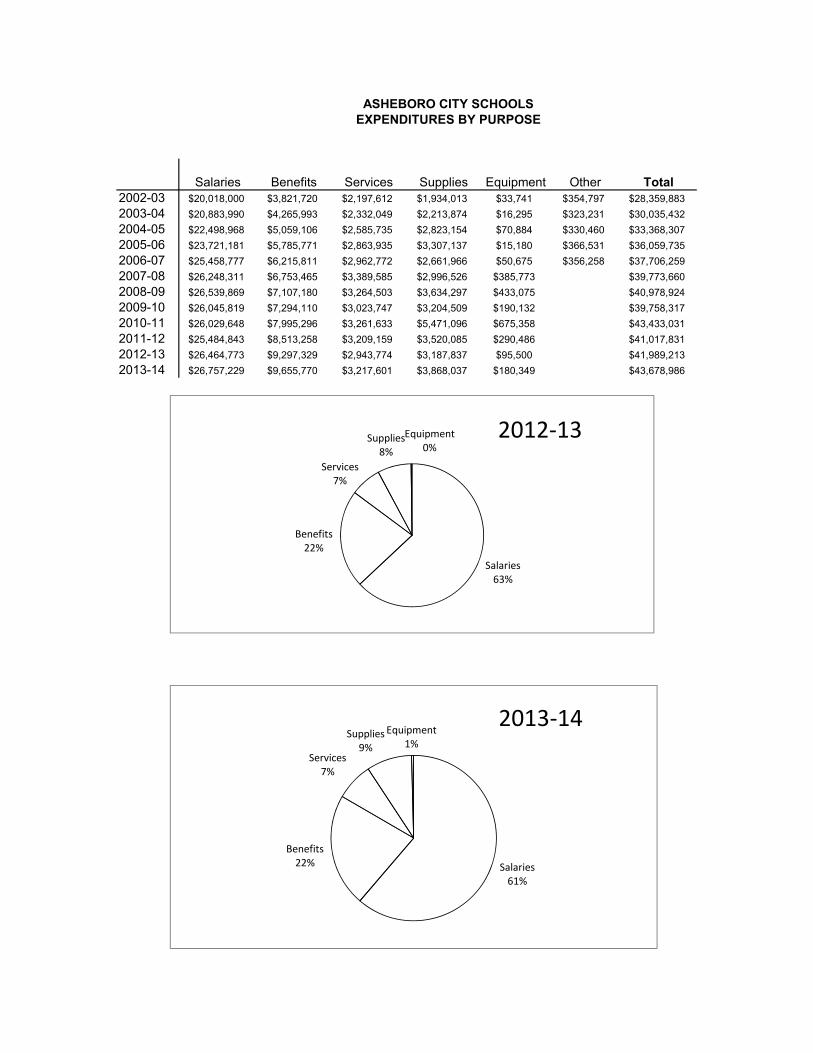
ASHEBORO CITY SCHOOLSEXPENDITURES BY PURPOSE
Salaries Benefits Services Supplies Equipment Other Total2002-03 $20,018,000 $3,821,720 $2,197,612 $1,934,013 $33,741 $354,797 $28,359,8832003-04 $20,883,990 $4,265,993 $2,332,049 $2,213,874 $16,295 $323,231 $30,035,4322004-05 $22,498,968 $5,059,106 $2,585,735 $2,823,154 $70,884 $330,460 $33,368,3072005-06 $23,721,181 $5,785,771 $2,863,935 $3,307,137 $15,180 $366,531 $36,059,7352006-07 $25,458,777 $6,215,811 $2,962,772 $2,661,966 $50,675 $356,258 $37,706,2592007-08 $26,248,311 $6,753,465 $3,389,585 $2,996,526 $385,773 $39,773,6602008-09 $26,539,869 $7,107,180 $3,264,503 $3,634,297 $433,075 $40,978,9242009-10 $26,045,819 $7,294,110 $3,023,747 $3,204,509 $190,132 $39,758,3172010-11 $26,029,648 $7,995,296 $3,261,633 $5,471,096 $675,358 $43,433,0312011-12 $25,484,843 $8,513,258 $3,209,159 $3,520,085 $290,486 $41,017,8312012-13 $26,464,773 $9,297,329 $2,943,774 $3,187,837 $95,500 $41,989,2132013-14 $26,757,229 $9,655,770 $3,217,601 $3,868,037 $180,349 $43,678,986
Salaries63%
Benefits22%
Services7%
Supplies8%
Equipment0%
2012‐13
Salaries61%
Benefits22%
Services7%
Supplies9%
Equipment1%
2013‐14
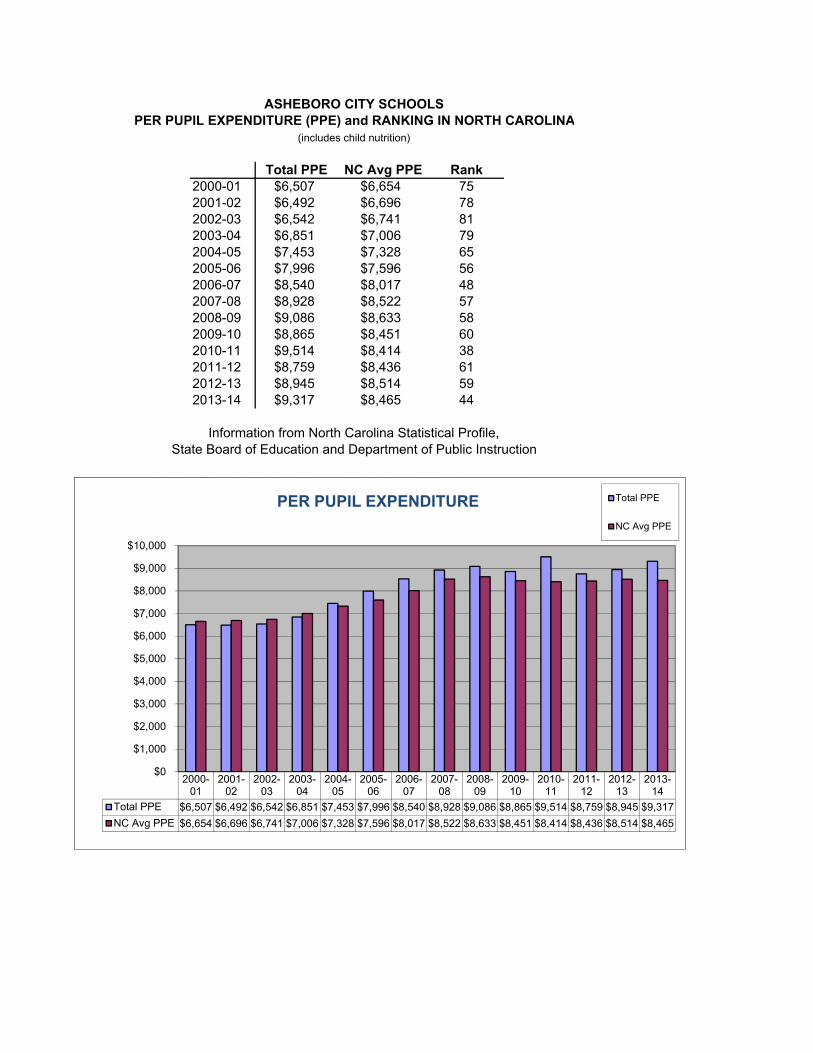
ASHEBORO CITY SCHOOLSPER PUPIL EXPENDITURE (PPE) and RANKING IN NORTH CAROLINA
(includes child nutrition)
Total PPE NC Avg PPE Rank2000-01 $6,507 $6,654 752001-02 $6,492 $6,696 782002-03 $6,542 $6,741 812003-04 $6,851 $7,006 792004-05 $7,453 $7,328 652005-06 $7,996 $7,596 562006-07 $8,540 $8,017 482007-08 $8,928 $8,522 572008-09 $9,086 $8,633 582009-10 $8,865 $8,451 602010-11 $9,514 $8,414 382011-12 $8,759 $8,436 612012-13 $8,945 $8,514 592013-14 $9,317 $8,465 44
Information from North Carolina Statistical Profile,State Board of Education and Department of Public Instruction
**Note: The chart below does not include capital outlay expenditures
2000-01
2001-02
2002-03
2003-04
2004-05
2005-06
2006-07
2007-08
2008-09
2009-10
2010-11
2011-12
2012-13
2013-14
Total PPE $6,507 $6,492 $6,542 $6,851 $7,453 $7,996 $8,540 $8,928 $9,086 $8,865 $9,514 $8,759 $8,945 $9,317NC Avg PPE $6,654 $6,696 $6,741 $7,006 $7,328 $7,596 $8,017 $8,522 $8,633 $8,451 $8,414 $8,436 $8,514 $8,465
$0
$1,000
$2,000
$3,000
$4,000
$5,000
$6,000
$7,000
$8,000
$9,000
$10,000
PER PUPIL EXPENDITURE Total PPE
NC Avg PPE
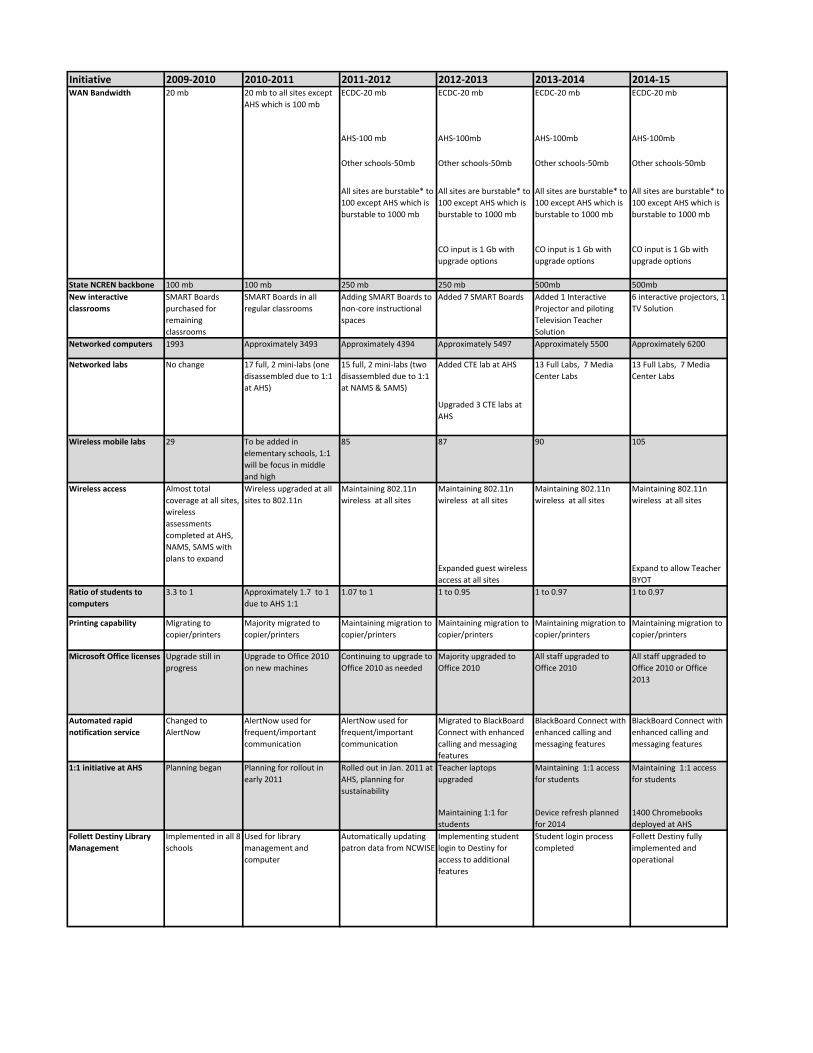
Initiative 2009‐2010 2010‐2011 2011‐2012 2012‐2013 2013‐2014 2014‐15WAN Bandwidth 20 mb 20 mb to all sites except
AHS which is 100 mbECDC‐20 mb ECDC‐20 mb ECDC‐20 mb ECDC‐20 mb
AHS‐100 mb AHS‐100mb AHS‐100mb AHS‐100mb
Other schools‐50mb Other schools‐50mb Other schools‐50mb Other schools‐50mb
All sites are burstable* to 100 except AHS which is burstable to 1000 mb
All sites are burstable* to 100 except AHS which is burstable to 1000 mb
All sites are burstable* to 100 except AHS which is burstable to 1000 mb
All sites are burstable* to 100 except AHS which is burstable to 1000 mb
CO input is 1 Gb with upgrade options
CO input is 1 Gb with upgrade options
CO input is 1 Gb with upgrade options
State NCREN backbone 100 mb 100 mb 250 mb 250 mb 500mb 500mbNew interactive classrooms
SMART Boards purchased for remaining classrooms
SMART Boards in all regular classrooms
Adding SMART Boards to non‐core instructional spaces
Added 7 SMART Boards Added 1 Interactive Projector and piloting Television Teacher Solution
6 interactive projectors, 1 TV Solution
Networked computers 1993 Approximately 3493 Approximately 4394 Approximately 5497 Approximately 5500 Approximately 6200
Networked labs No change 17 full, 2 mini‐labs (one disassembled due to 1:1 at AHS)
15 full, 2 mini‐labs (two disassembled due to 1:1 at NAMS & SAMS)
Added CTE lab at AHS 13 Full Labs, 7 Media Center Labs
13 Full Labs, 7 Media Center Labs
Upgraded 3 CTE labs at AHS
Wireless mobile labs 29 To be added in elementary schools, 1:1 will be focus in middle and high
85 87 90 105
Almost total coverage at all sites, wireless assessments completed at AHS, NAMS, SAMS with plans to expand
Wireless upgraded at all sites to 802.11n
Maintaining 802.11n wireless at all sites
Maintaining 802.11n wireless at all sites
Maintaining 802.11n wireless at all sites
Maintaining 802.11n wireless at all sites
Expanded guest wireless access at all sites
Expand to allow Teacher BYOT
Ratio of students to computers
3.3 to 1 Approximately 1.7 to 1 due to AHS 1:1
1.07 to 1 1 to 0.95 1 to 0.97 1 to 0.97
Printing capability Migrating to copier/printers
Majority migrated to copier/printers
Maintaining migration to copier/printers
Maintaining migration to copier/printers
Maintaining migration to copier/printers
Maintaining migration to copier/printers
Microsoft Office licenses Upgrade still in progress
Upgrade to Office 2010 on new machines
Continuing to upgrade to Office 2010 as needed
Majority upgraded to Office 2010
All staff upgraded to Office 2010
All staff upgraded to Office 2010 or Office 2013
Automated rapid notification service
Changed to AlertNow
AlertNow used for frequent/important communication
AlertNow used for frequent/important communication
Migrated to BlackBoard Connect with enhanced calling and messaging features
BlackBoard Connect with enhanced calling and messaging features
BlackBoard Connect with enhanced calling and messaging features
1:1 initiative at AHS Planning began Planning for rollout in early 2011
Rolled out in Jan. 2011 at AHS, planning for sustainability
Teacher laptops upgraded
Maintaining 1:1 access for students
Maintaining 1:1 access for students
Maintaining 1:1 for students
Device refresh planned for 2014
1400 Chromebooks deployed at AHS
Follett Destiny Library Management
Implemented in all 8 schools
Used for library management and computer
Automatically updating patron data from NCWISE
Implementing student login to Destiny for access to additional features
Student login process completed
Follett Destiny fully implemented and operational
Wireless access
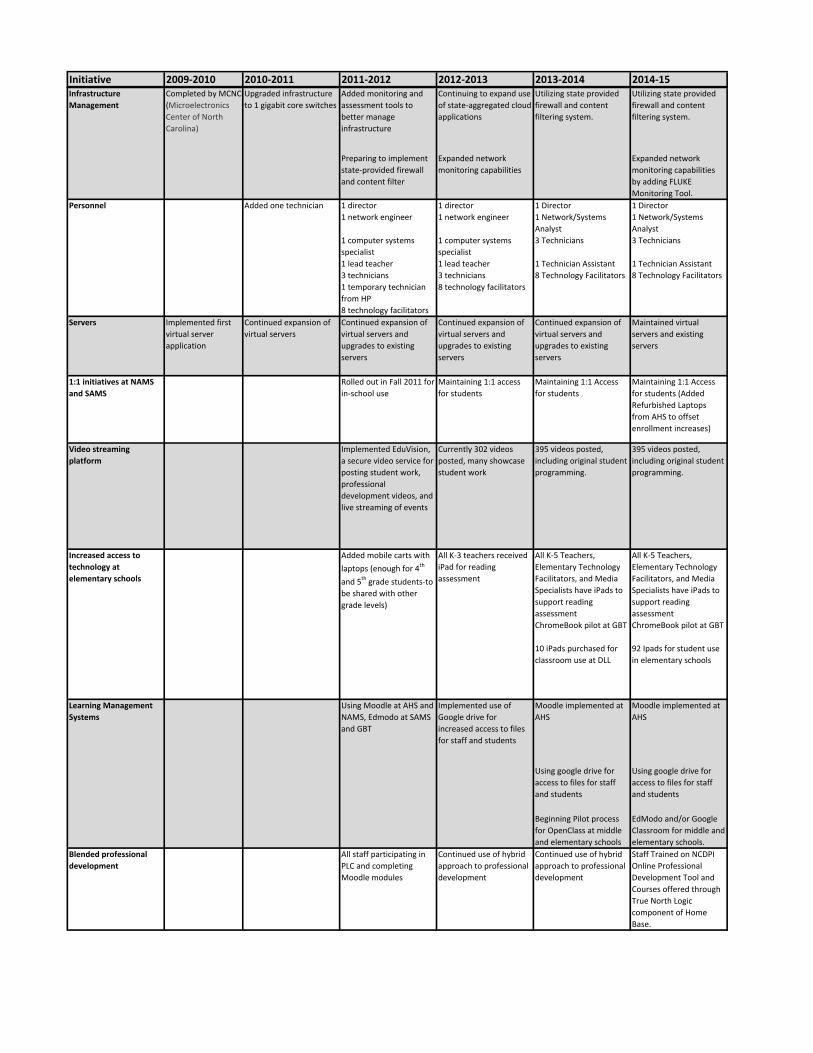
Initiative 2009‐2010 2010‐2011 2011‐2012 2012‐2013 2013‐2014 2014‐15Infrastructure Management
Completed by MCNC (Microelectronics Center of North Carolina)
Upgraded infrastructure to 1 gigabit core switches
Added monitoring and assessment tools to better manage infrastructure
Continuing to expand use of state‐aggregated cloud applications
Utilizing state provided firewall and content filtering system.
Utilizing state provided firewall and content filtering system.
Preparing to implement state‐provided firewall and content filter
Expanded network monitoring capabilities
Expanded network monitoring capabilities by adding FLUKE Monitoring Tool.
Personnel Added one technician 1 director 1 director 1 Director 1 Director1 network engineer 1 network engineer 1 Network/Systems
Analyst1 Network/Systems Analyst
1 computer systems specialist
1 computer systems specialist
3 Technicians 3 Technicians
1 lead teacher 1 lead teacher 1 Technician Assistant 1 Technician Assistant3 technicians 3 technicians 8 Technology Facilitators 8 Technology Facilitators1 temporary technician from HP
8 technology facilitators
8 technology facilitators Servers Implemented first
virtual server application
Continued expansion of virtual servers
Continued expansion of virtual servers and upgrades to existing servers
Continued expansion of virtual servers and upgrades to existing servers
Continued expansion of virtual servers and upgrades to existing servers
Maintained virtual servers and existing servers
1:1 initiatives at NAMS and SAMS
Rolled out in Fall 2011 for in‐school use
Maintaining 1:1 access for students
Maintaining 1:1 Access for students
Maintaining 1:1 Access for students (Added Refurbished Laptops from AHS to offset enrollment increases)
Video streaming platform
Implemented EduVision, a secure video service for posting student work, professional development videos, and live streaming of events
Currently 302 videos posted, many showcase student work
395 videos posted, including original student programming.
395 videos posted, including original student programming.
Increased access to technology at elementary schools
Added mobile carts with laptops (enough for 4th
and 5th grade students‐to be shared with other grade levels)
All K‐3 teachers received iPad for reading assessment
All K‐5 Teachers, Elementary Technology Facilitators, and Media Specialists have iPads to support reading assessment
All K‐5 Teachers, Elementary Technology Facilitators, and Media Specialists have iPads to support reading assessment
ChromeBook pilot at GBT ChromeBook pilot at GBT
10 iPads purchased for classroom use at DLL
92 Ipads for student use in elementary schools
Learning Management Systems
Using Moodle at AHS and NAMS, Edmodo at SAMS and GBT
Implemented use of Google drive for increased access to files for staff and students
Moodle implemented at AHS
Moodle implemented at AHS
Using google drive for access to files for staff and students
Using google drive for access to files for staff and students
Beginning Pilot process for OpenClass at middle and elementary schools
EdModo and/or Google Classroom for middle and elementary schools.
Blended professional development
All staff participating in PLC and completing Moodle modules
Continued use of hybrid approach to professional development
Continued use of hybrid approach to professional development
Staff Trained on NCDPI Online Professional Development Tool and Courses offered through True North Logic component of Home Base.
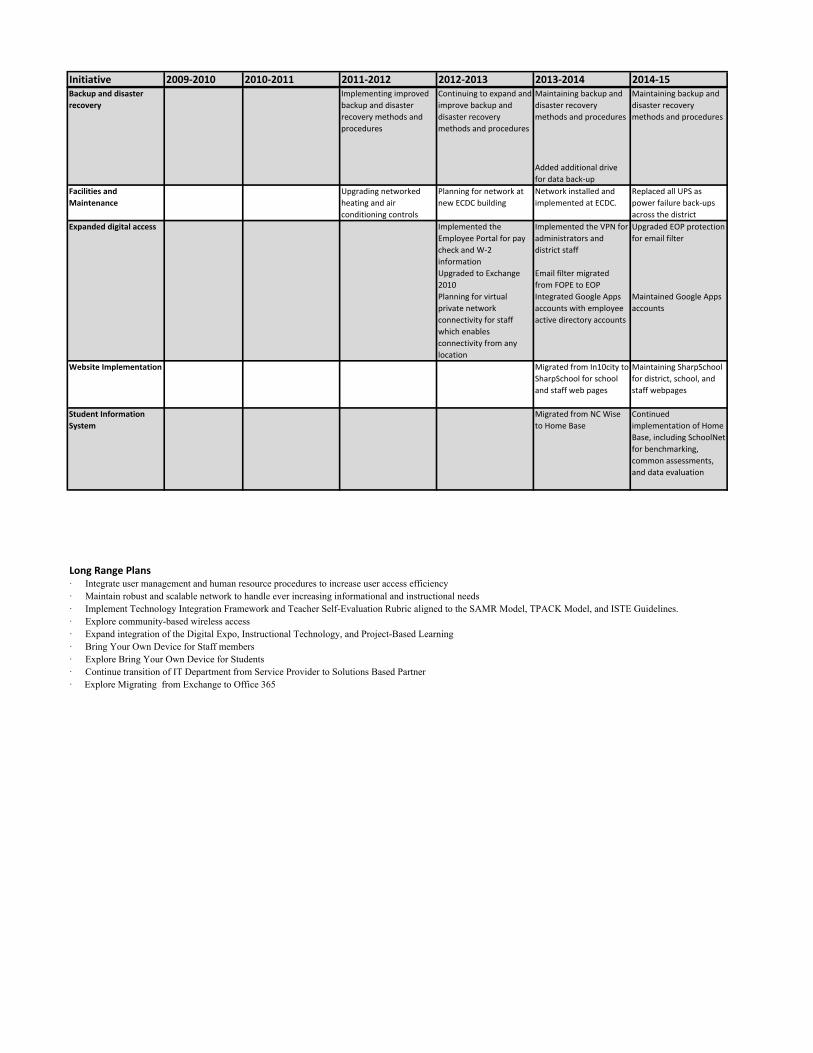
Initiative 2009‐2010 2010‐2011 2011‐2012 2012‐2013 2013‐2014 2014‐15Implementing improved backup and disaster recovery methods and procedures
Continuing to expand and improve backup and disaster recovery methods and procedures
Maintaining backup and disaster recovery methods and procedures
Maintaining backup and disaster recovery methods and procedures
Added additional drive for data back‐up
Facilities and Maintenance
Upgrading networked heating and air conditioning controls
Planning for network at new ECDC building
Network installed and implemented at ECDC.
Replaced all UPS as power failure back‐ups across the district
Expanded digital access Implemented the Employee Portal for pay check and W‐2 information
Implemented the VPN for administrators and district staff
Upgraded EOP protection for email filter
Upgraded to Exchange 2010
Email filter migrated from FOPE to EOP
Planning for virtual private network connectivity for staff which enables connectivity from any location
Integrated Google Apps accounts with employee active directory accounts
Maintained Google Apps accounts
Website Implementation Migrated from In10city to SharpSchool for school and staff web pages
Maintaining SharpSchool for district, school, and staff webpages
Student Information System
Migrated from NC Wise to Home Base
Continued implementation of Home Base, including SchoolNet for benchmarking, common assessments, and data evaluation
Long Range Plans· Integrate user management and human resource procedures to increase user access efficiency· Maintain robust and scalable network to handle ever increasing informational and instructional needs· Implement Technology Integration Framework and Teacher Self-Evaluation Rubric aligned to the SAMR Model, TPACK Model, and ISTE Guidelines.· Explore community-based wireless access· Expand integration of the Digital Expo, Instructional Technology, and Project-Based Learning· Bring Your Own Device for Staff members· Explore Bring Your Own Device for Students· Continue transition of IT Department from Service Provider to Solutions Based Partner· Explore Migrating from Exchange to Office 365
Backup and disaster recovery
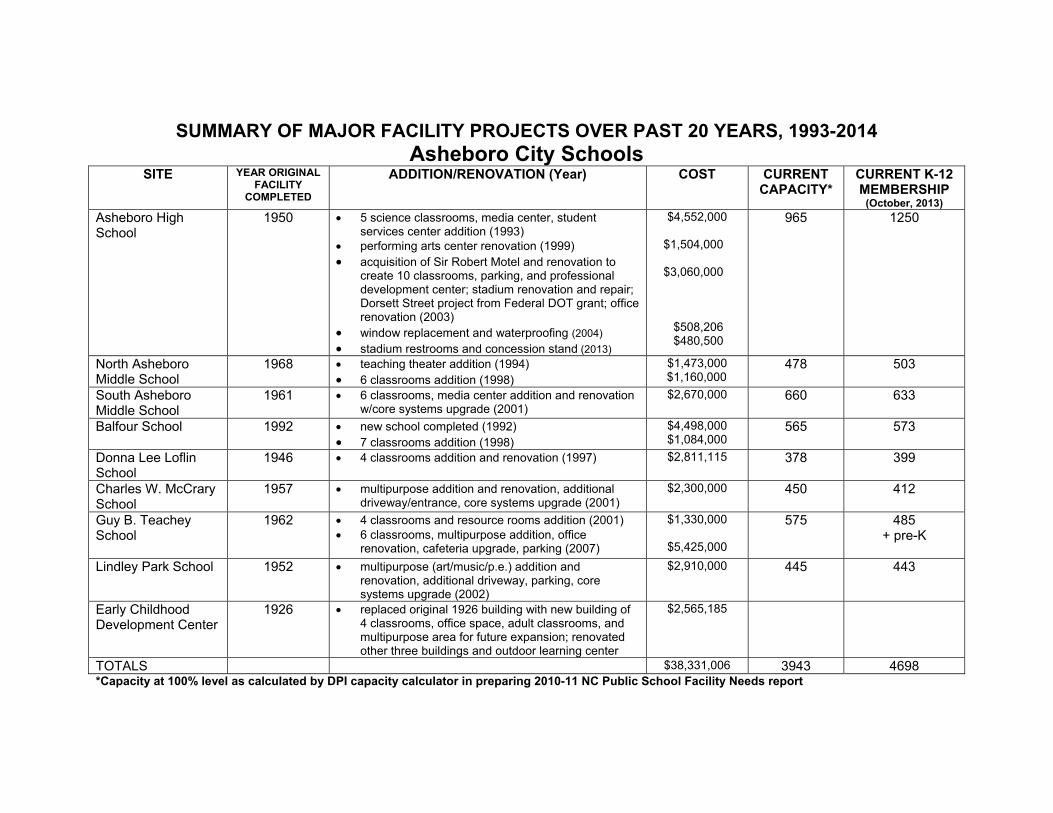
SUMMARY OF MAJOR FACILITY PROJECTS OVER PAST 20 YEARS, 1993-2014 Asheboro City Schools
SITE YEAR ORIGINAL FACILITY
COMPLETED
ADDITION/RENOVATION (Year) COST CURRENT CAPACITY*
CURRENT K-12 MEMBERSHIP
(October, 2013)
Asheboro High School
1950 5 science classrooms, media center, student services center addition (1993)
performing arts center renovation (1999) acquisition of Sir Robert Motel and renovation to
create 10 classrooms, parking, and professional development center; stadium renovation and repair; Dorsett Street project from Federal DOT grant; office renovation (2003)
window replacement and waterproofing (2004) stadium restrooms and concession stand (2013)
$4,552,000
$1,504,000 $3,060,000 $508,206 $480,500
965 1250
North Asheboro Middle School
1968 teaching theater addition (1994) 6 classrooms addition (1998)
$1,473,000 $1,160,000
478 503
South Asheboro Middle School
1961 6 classrooms, media center addition and renovation w/core systems upgrade (2001)
$2,670,000 660 633
Balfour School 1992 new school completed (1992) 7 classrooms addition (1998)
$4,498,000 $1,084,000
565 573
Donna Lee Loflin School
1946 4 classrooms addition and renovation (1997) $2,811,115 378 399
Charles W. McCrary School
1957 multipurpose addition and renovation, additional driveway/entrance, core systems upgrade (2001)
$2,300,000 450 412
Guy B. Teachey School
1962
4 classrooms and resource rooms addition (2001) 6 classrooms, multipurpose addition, office
renovation, cafeteria upgrade, parking (2007)
$1,330,000
$5,425,000
575 485 + pre-K
Lindley Park School 1952 multipurpose (art/music/p.e.) addition and renovation, additional driveway, parking, core systems upgrade (2002)
$2,910,000 445 443
Early Childhood Development Center
1926 replaced original 1926 building with new building of 4 classrooms, office space, adult classrooms, and multipurpose area for future expansion; renovated other three buildings and outdoor learning center
$2,565,185
TOTALS $38,331,006 3943 4698 *Capacity at 100% level as calculated by DPI capacity calculator in preparing 2010-11 NC Public School Facility Needs report
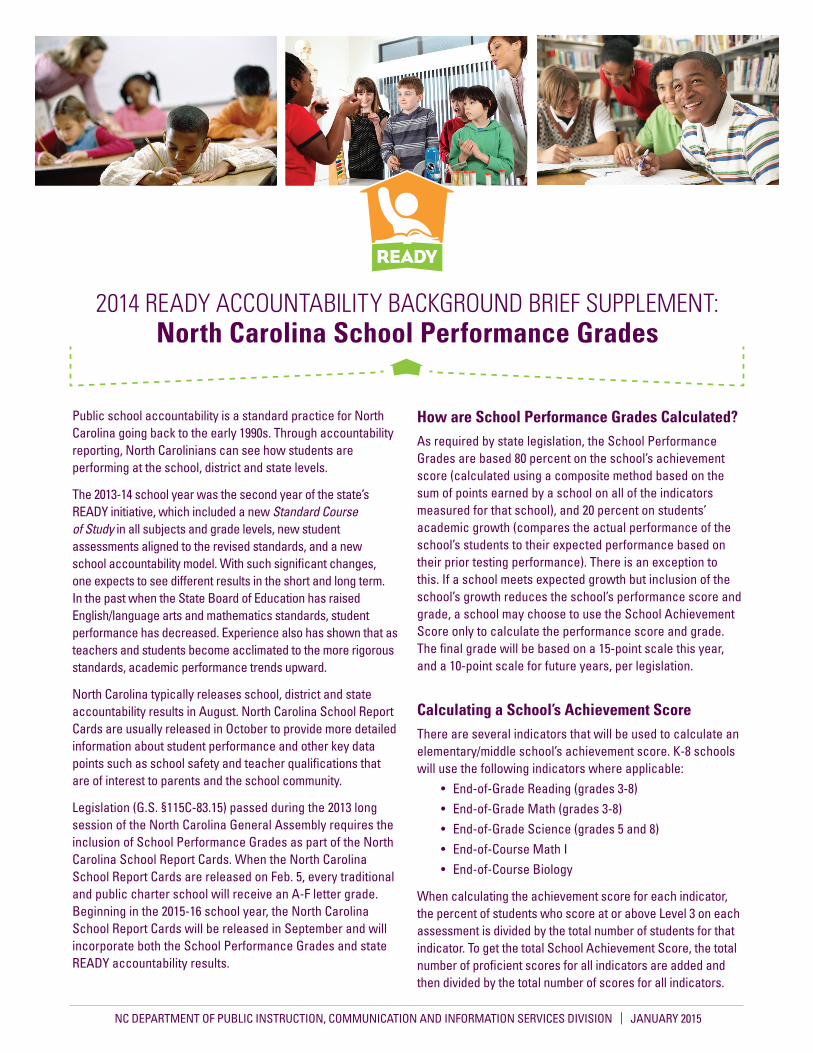
Public school accountability is a standard practice for North Carolina going back to the early 1990s. Through accountability reporting, North Carolinians can see how students are performing at the school, district and state levels.
The 2013-14 school year was the second year of the state’s READY initiative, which included a new Standard Course of Study in all subjects and grade levels, new student assessments aligned to the revised standards, and a new school accountability model. With such significant changes, one expects to see different results in the short and long term. In the past when the State Board of Education has raised English/language arts and mathematics standards, student performance has decreased. Experience also has shown that as teachers and students become acclimated to the more rigorous standards, academic performance trends upward.
North Carolina typically releases school, district and state accountability results in August. North Carolina School Report Cards are usually released in October to provide more detailed information about student performance and other key data points such as school safety and teacher qualifications that are of interest to parents and the school community.
Legislation (G.S. §115C-83.15) passed during the 2013 long session of the North Carolina General Assembly requires the inclusion of School Performance Grades as part of the North Carolina School Report Cards. When the North Carolina School Report Cards are released on Feb. 5, every traditional and public charter school will receive an A-F letter grade. Beginning in the 2015-16 school year, the North Carolina School Report Cards will be released in September and will incorporate both the School Performance Grades and state READY accountability results.
How are School Performance Grades Calculated?As required by state legislation, the School Performance Grades are based 80 percent on the school’s achievement score (calculated using a composite method based on the sum of points earned by a school on all of the indicators measured for that school), and 20 percent on students’ academic growth (compares the actual performance of the school’s students to their expected performance based on their prior testing performance). There is an exception to this. If a school meets expected growth but inclusion of the school’s growth reduces the school’s performance score and grade, a school may choose to use the School Achievement Score only to calculate the performance score and grade. The final grade will be based on a 15-point scale this year, and a 10-point scale for future years, per legislation.
Calculating a School’s Achievement ScoreThere are several indicators that will be used to calculate an elementary/middle school’s achievement score. K-8 schools will use the following indicators where applicable: • End-of-Grade Reading (grades 3-8) • End-of-Grade Math (grades 3-8) • End-of-Grade Science (grades 5 and 8) • End-of-Course Math I • End-of-Course Biology
When calculating the achievement score for each indicator, the percent of students who score at or above Level 3 on each assessment is divided by the total number of students for that indicator. To get the total School Achievement Score, the total number of proficient scores for all indicators are added and then divided by the total number of scores for all indicators.
2014 READY ACCOUNTABILITY BACKGROUND BRIEF SUPPLEMENT: North Carolina School Performance Grades
NC DEPARTMENT OF PUBLIC INSTRUCTION, COMMUNICATION AND INFORMATION SERVICES DIVISION | JANUARY 2015
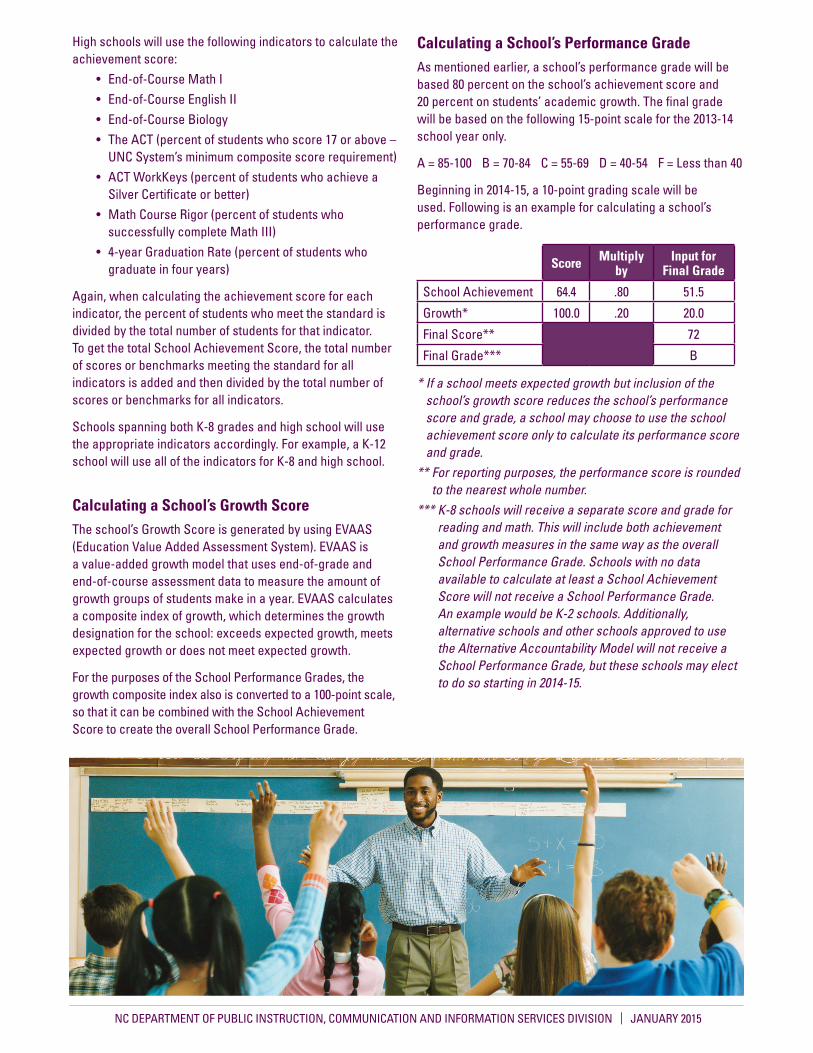
High schools will use the following indicators to calculate the achievement score: • End-of-Course Math I • End-of-Course English II • End-of-Course Biology • The ACT (percent of students who score 17 or above –
UNC System’s minimum composite score requirement) • ACT WorkKeys (percent of students who achieve a
Silver Certificate or better) • Math Course Rigor (percent of students who
successfully complete Math III) • 4-year Graduation Rate (percent of students who
graduate in four years)
Again, when calculating the achievement score for each indicator, the percent of students who meet the standard is divided by the total number of students for that indicator. To get the total School Achievement Score, the total number of scores or benchmarks meeting the standard for all indicators is added and then divided by the total number of scores or benchmarks for all indicators.
Schools spanning both K-8 grades and high school will use the appropriate indicators accordingly. For example, a K-12 school will use all of the indicators for K-8 and high school.
Calculating a School’s Growth ScoreThe school’s Growth Score is generated by using EVAAS (Education Value Added Assessment System). EVAAS is a value-added growth model that uses end-of-grade and end-of-course assessment data to measure the amount of growth groups of students make in a year. EVAAS calculates a composite index of growth, which determines the growth designation for the school: exceeds expected growth, meets expected growth or does not meet expected growth.
For the purposes of the School Performance Grades, the growth composite index also is converted to a 100-point scale, so that it can be combined with the School Achievement Score to create the overall School Performance Grade.
Calculating a School’s Performance GradeAs mentioned earlier, a school’s performance grade will be based 80 percent on the school’s achievement score and 20 percent on students’ academic growth. The final grade will be based on the following 15-point scale for the 2013-14 school year only.
A = 85-100 B = 70-84 C = 55-69 D = 40-54 F = Less than 40
Beginning in 2014-15, a 10-point grading scale will be used. Following is an example for calculating a school’s performance grade.
Score Multiply by
Input for Final Grade
School Achievement 64.4 .80 51.5
Growth* 100.0 .20 20.0
Final Score** 72
Final Grade*** B
* If a school meets expected growth but inclusion of the school’s growth score reduces the school’s performance score and grade, a school may choose to use the school achievement score only to calculate its performance score and grade.
** For reporting purposes, the performance score is rounded to the nearest whole number.
*** K-8 schools will receive a separate score and grade for reading and math. This will include both achievement and growth measures in the same way as the overall School Performance Grade. Schools with no data available to calculate at least a School Achievement Score will not receive a School Performance Grade. An example would be K-2 schools. Additionally, alternative schools and other schools approved to use the Alternative Accountability Model will not receive a School Performance Grade, but these schools may elect to do so starting in 2014-15.
NC DEPARTMENT OF PUBLIC INSTRUCTION, COMMUNICATION AND INFORMATION SERVICES DIVISION | JANUARY 2015
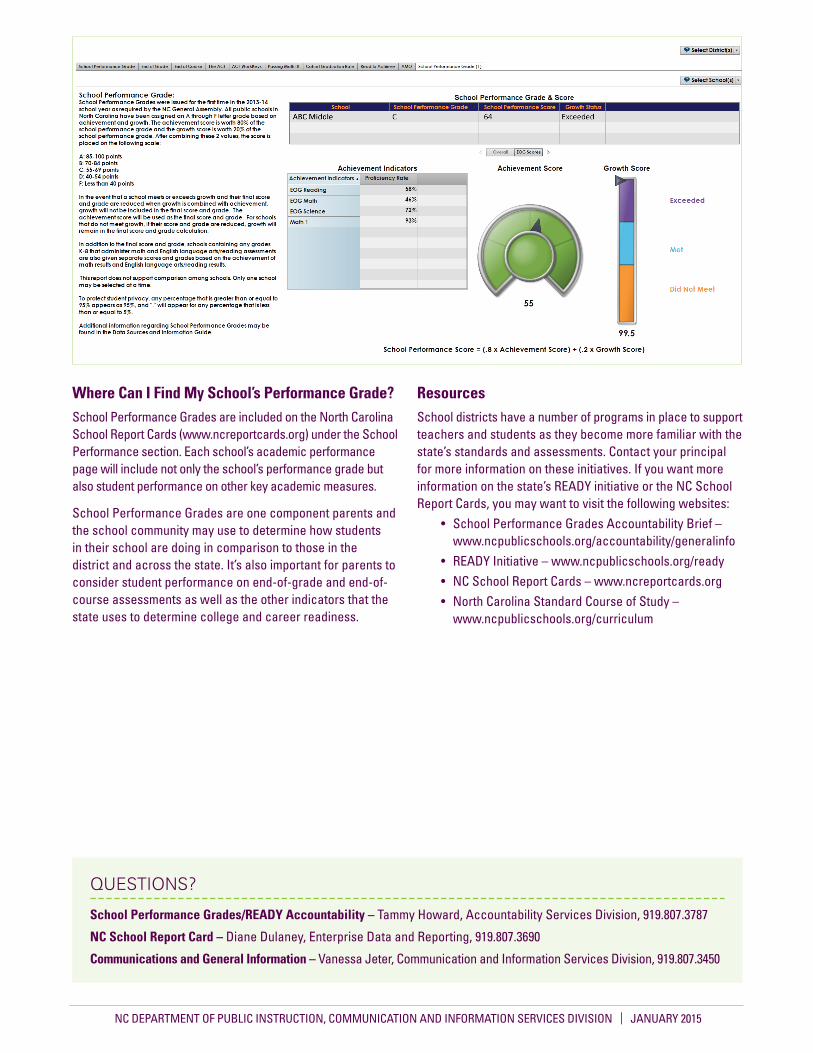
Where Can I Find My School’s Performance Grade?School Performance Grades are included on the North Carolina School Report Cards (www.ncreportcards.org) under the School Performance section. Each school’s academic performance page will include not only the school’s performance grade but also student performance on other key academic measures.
School Performance Grades are one component parents and the school community may use to determine how students in their school are doing in comparison to those in the district and across the state. It’s also important for parents to consider student performance on end-of-grade and end-of-course assessments as well as the other indicators that the state uses to determine college and career readiness.
ResourcesSchool districts have a number of programs in place to support teachers and students as they become more familiar with the state’s standards and assessments. Contact your principal for more information on these initiatives. If you want more information on the state’s READY initiative or the NC School Report Cards, you may want to visit the following websites: • School Performance Grades Accountability Brief –
www.ncpublicschools.org/accountability/generalinfo • READY Initiative – www.ncpublicschools.org/ready • NC School Report Cards – www.ncreportcards.org • North Carolina Standard Course of Study –
www.ncpublicschools.org/curriculum
QUESTIONS?
School Performance Grades/READY Accountability – Tammy Howard, Accountability Services Division, 919.807.3787
NC School Report Card – Diane Dulaney, Enterprise Data and Reporting, 919.807.3690
Communications and General Information – Vanessa Jeter, Communication and Information Services Division, 919.807.3450
NC DEPARTMENT OF PUBLIC INSTRUCTION, COMMUNICATION AND INFORMATION SERVICES DIVISION | JANUARY 2015
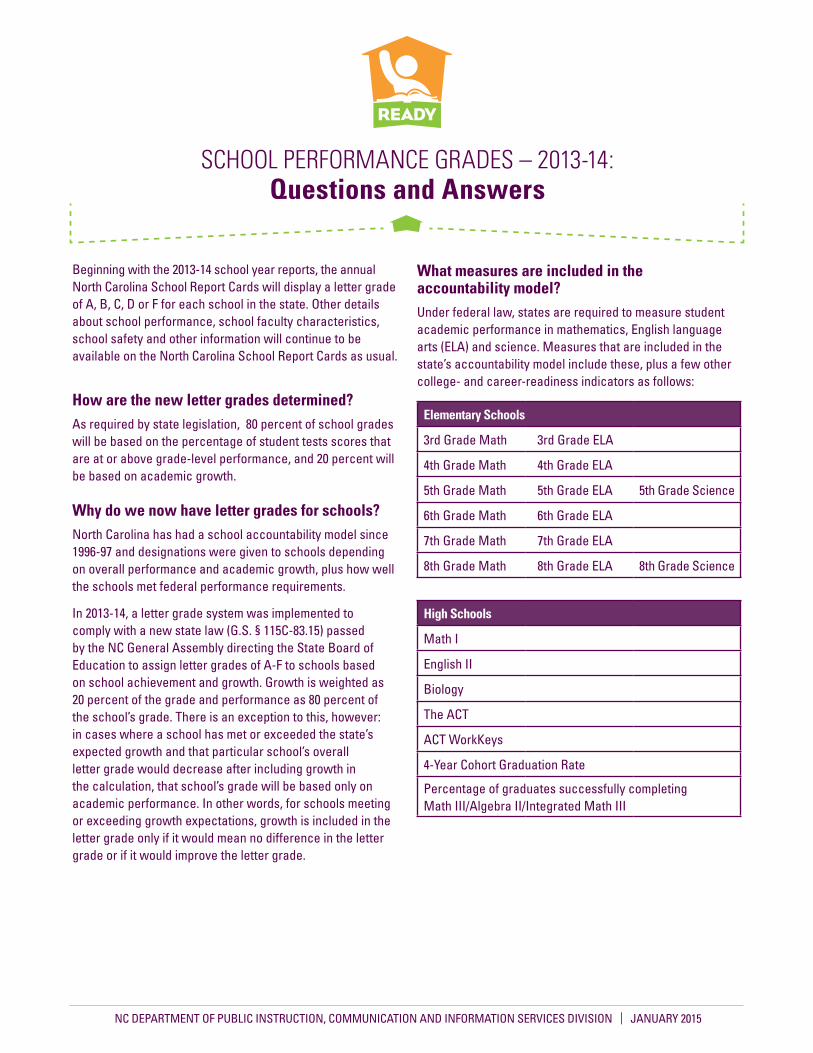
Beginning with the 2013-14 school year reports, the annual North Carolina School Report Cards will display a letter grade of A, B, C, D or F for each school in the state. Other details about school performance, school faculty characteristics, school safety and other information will continue to be available on the North Carolina School Report Cards as usual.
How are the new letter grades determined? As required by state legislation, 80 percent of school grades will be based on the percentage of student tests scores that are at or above grade-level performance, and 20 percent will be based on academic growth.
Why do we now have letter grades for schools?North Carolina has had a school accountability model since 1996-97 and designations were given to schools depending on overall performance and academic growth, plus how well the schools met federal performance requirements.
In 2013-14, a letter grade system was implemented to comply with a new state law (G.S. § 115C-83.15) passed by the NC General Assembly directing the State Board of Education to assign letter grades of A-F to schools based on school achievement and growth. Growth is weighted as 20 percent of the grade and performance as 80 percent of the school’s grade. There is an exception to this, however: in cases where a school has met or exceeded the state’s expected growth and that particular school’s overall letter grade would decrease after including growth in the calculation, that school’s grade will be based only on academic performance. In other words, for schools meeting or exceeding growth expectations, growth is included in the letter grade only if it would mean no difference in the letter grade or if it would improve the letter grade.
What measures are included in the accountability model? Under federal law, states are required to measure student academic performance in mathematics, English language arts (ELA) and science. Measures that are included in the state’s accountability model include these, plus a few other college- and career-readiness indicators as follows:
Elementary Schools
3rd Grade Math 3rd Grade ELA
4th Grade Math 4th Grade ELA
5th Grade Math 5th Grade ELA 5th Grade Science
6th Grade Math 6th Grade ELA
7th Grade Math 7th Grade ELA
8th Grade Math 8th Grade ELA 8th Grade Science
High Schools
Math I
English II
Biology
The ACT
ACT WorkKeys
4-Year Cohort Graduation Rate
Percentage of graduates successfully completing Math III/Algebra II/Integrated Math III
SCHOOL PERFORMANCE GRADES – 2013-14: Questions and Answers
NC DEPARTMENT OF PUBLIC INSTRUCTION, COMMUNICATION AND INFORMATION SERVICES DIVISION | JANUARY 2015

What is growth? What is performance? Performance is defined as the percentage of students/student test scores that are considered to be at grade level or on track to be college and career ready. In North Carolina, that would be the percentage of student scores at Achievement Levels 3 (grade level), 4 and 5 (college and career ready).
Growth is calculated using the SAS EVAAS system, which calculates how much academic growth a school made as compared to the typical rate of growth for the state overall. Growth is important because it demonstrates the rate of change in student learning, regardless of where students were at the beginning of the year. For example, some schools may have a large number of students who begin school less prepared for success than the students in other schools. These students may learn at a rapid rate over the course of the school year and still not catch up to other students who began the year with more preparation. The use of growth as part of the letter grade is in recognition of this circumstance.
What happens to schools with low letter grades? Legislation did not identify any sanctions or consequences for schools with low letter grades. North Carolina has however, provided additional support and interventions to the lowest-performing schools since 1997. This effort has been improved and strengthened over the years, and a successful school transformation model is now in place to improve teaching and learning in low-performing schools. Resources allow intervention only in the lowest-performing schools. Schools that receive a D or F School Performance Grade are required to notify parents in writing.
Can a good school receive a C grade or even lower?Yes. A school with many students who entered school unprepared or behind their peers academically may have an overall proficiency rate that is low – even if teachers in that school have helped students make academic growth, even academic growth that is more rapid than the state’s growth rate. Because growth is weighted as just 20 percent of the school’s grade, schools that serve many students who are not yet performing at grade level may receive lower grades overall.
Is there recognition or benefit for schools that earn an A or B?The only recognition or benefit for A or B schools is the public recognition of a high grade. The School Performance Grades legislation did not provide incentives for high performance grades.
Do charter schools receive letter grades? Do private schools that qualify for tuition tax credit vouchers receive letter grades? Charter schools in North Carolina are public schools, so they receive School Performance Grades. Private schools will not receive grades as they do not operate under the same reporting requirements.
If my child’s school receives a D or F, can I move my child to another school? At this point, there is no provision in the legislation to provide public school choice.
What should I do if my child’s school receives a low grade? It is important to look carefully at details about your school to fully understand the school’s situation. If your child’s school had high academic growth, that is a strong sign that student learning needs are being addressed – even if the school’s grade is low overall. Your school principal also can provide key information about special efforts to help your child and other students in the school. Key factors to consider include your child’s grades, your child’s scores on state tests and any other tests that your school district may choose to use, and your child’s teachers’ appraisal of how your child is learning. Test scores are just one indicator of how well students are learning. Other factors should be taken into consideration in judging the quality of a school. That is why the North Carolina School Report Cards include the School Performance Grades along with many other types of information highlighting teacher quality, school technology and school safety.
My school did not receive a grade. Why is that? Schools that do not have data available to calculate at least a School Achievement Score will not received a grade. For example, K-2 schools would not have data to generate a grade. Also, alternative schools and other schools approved to use the Alternative Accountability Model will not receive a School Performance Grade, but they may elect to do so starting in 2014-15 (reported in fall of 2015).
NC DEPARTMENT OF PUBLIC INSTRUCTION, COMMUNICATION AND INFORMATION SERVICES DIVISION | JANUARY 2015
Ash
ebor
o C
ity
Sch
ools
…the subject is excellence
Understanding School Performance Grades
Asheboro City Schools School Board Winter Retreat
January 24, 2015
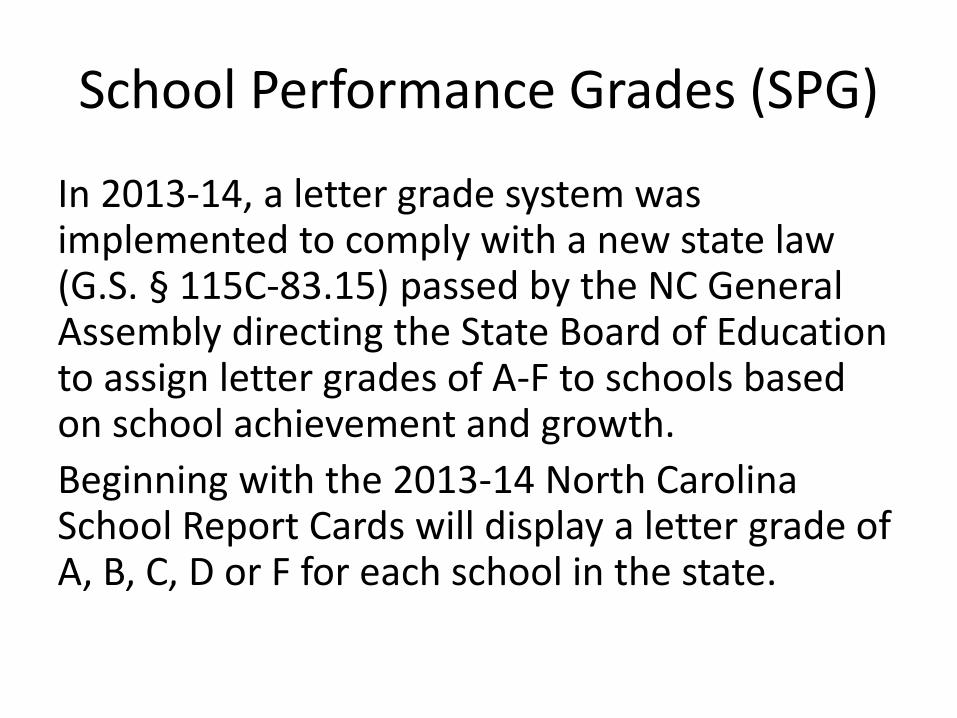
School Performance Grades (SPG)
In 2013-14, a letter grade system was implemented to comply with a new state law (G.S. § 115C-83.15) passed by the NC General Assembly directing the State Board of Education to assign letter grades of A-F to schools based on school achievement and growth. Beginning with the 2013-14 North Carolina School Report Cards will display a letter grade of A, B, C, D or F for each school in the state.
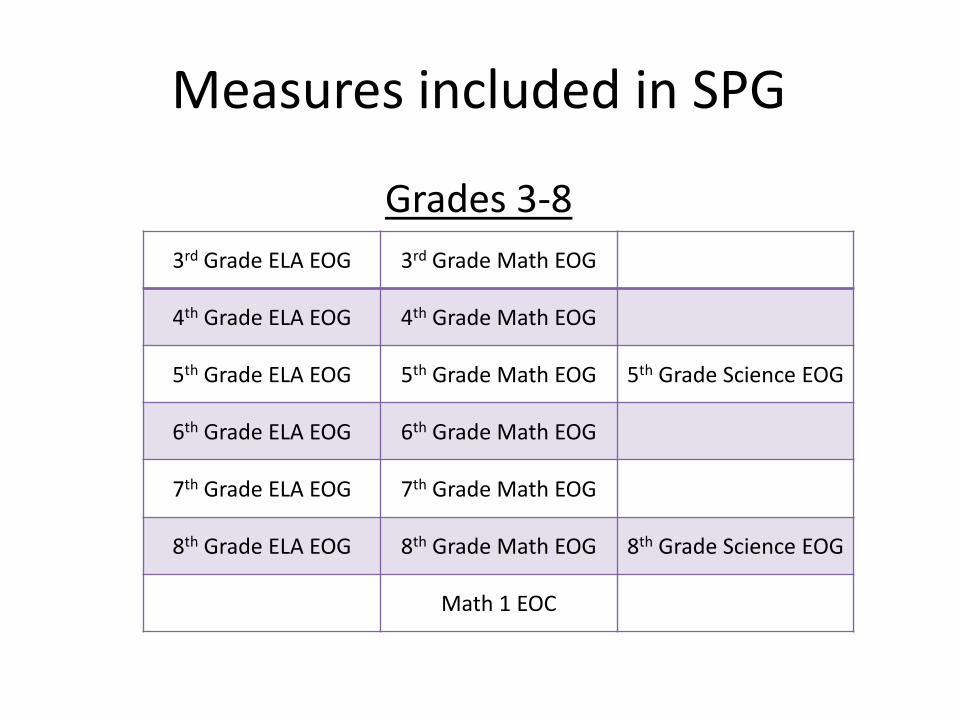
Measures included in SPG
Grades 3-8 3rd Grade ELA EOG 3rd Grade Math EOG
4th Grade ELA EOG 4th Grade Math EOG
5th Grade ELA EOG 5th Grade Math EOG 5th Grade Science EOG
6th Grade ELA EOG 6th Grade Math EOG
7th Grade ELA EOG 7th Grade Math EOG
8th Grade ELA EOG 8th Grade Math EOG 8th Grade Science EOG
Math 1 EOC
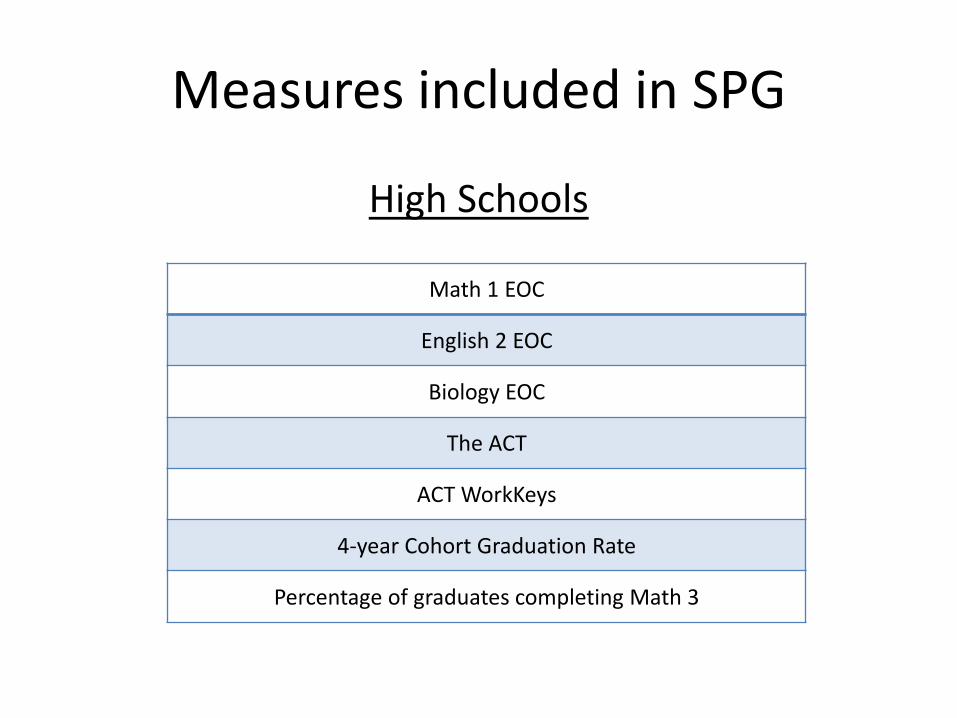
Measures included in SPG
High Schools
Math 1 EOC
English 2 EOC
Biology EOC
The ACT
ACT WorkKeys
4-year Cohort Graduation Rate
Percentage of graduates completing Math 3
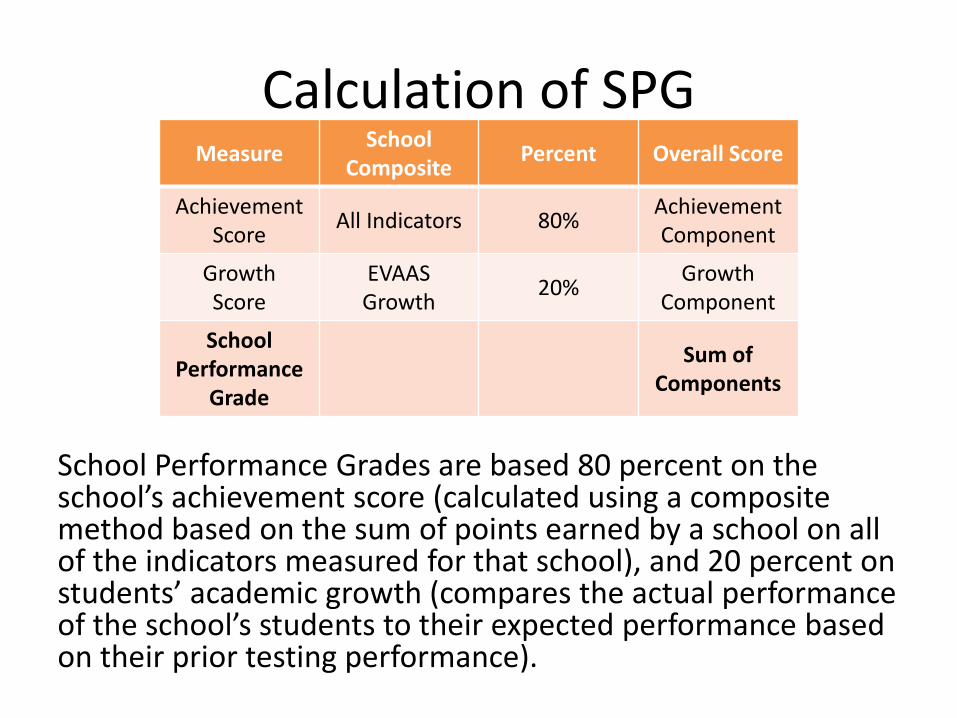
Calculation of SPG
School Performance Grades are based 80 percent on the school’s achievement score (calculated using a composite method based on the sum of points earned by a school on all of the indicators measured for that school), and 20 percent on students’ academic growth (compares the actual performance of the school’s students to their expected performance based on their prior testing performance).
Measure School Composite Percent Overall Score
Achievement Score All Indicators 80% Achievement
Component
Growth Score
EVAAS Growth 20% Growth
Component
School Performance
Grade
Sum of Components
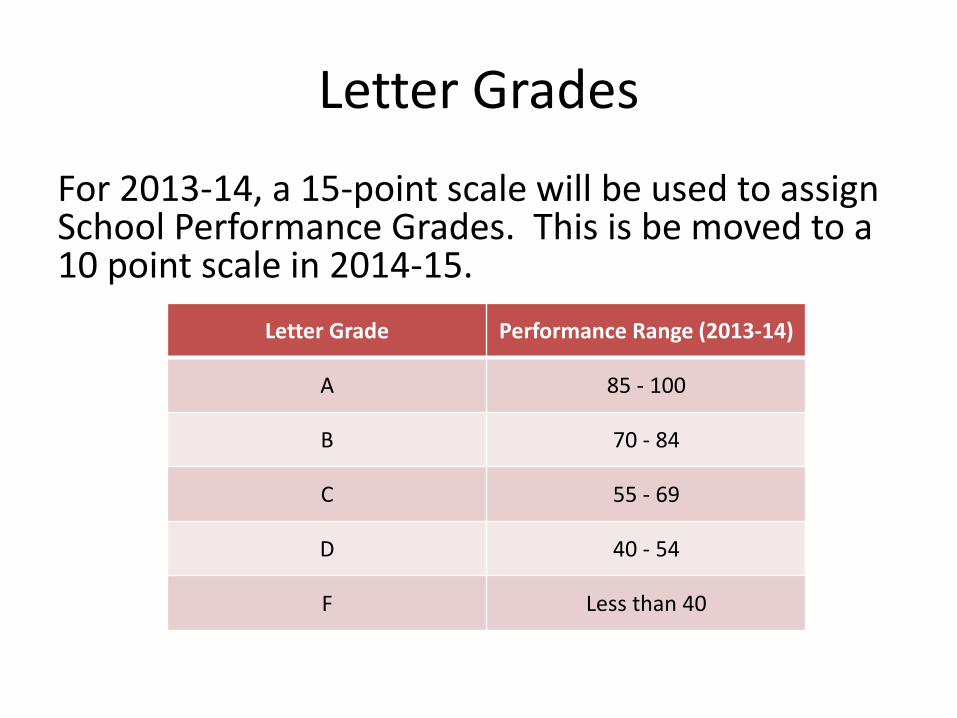
Letter Grades
For 2013-14, a 15-point scale will be used to assign School Performance Grades. This is be moved to a 10 point scale in 2014-15.
Letter Grade Performance Range (2013-14)
A 85 - 100
B 70 - 84
C 55 - 69
D 40 - 54
F Less than 40
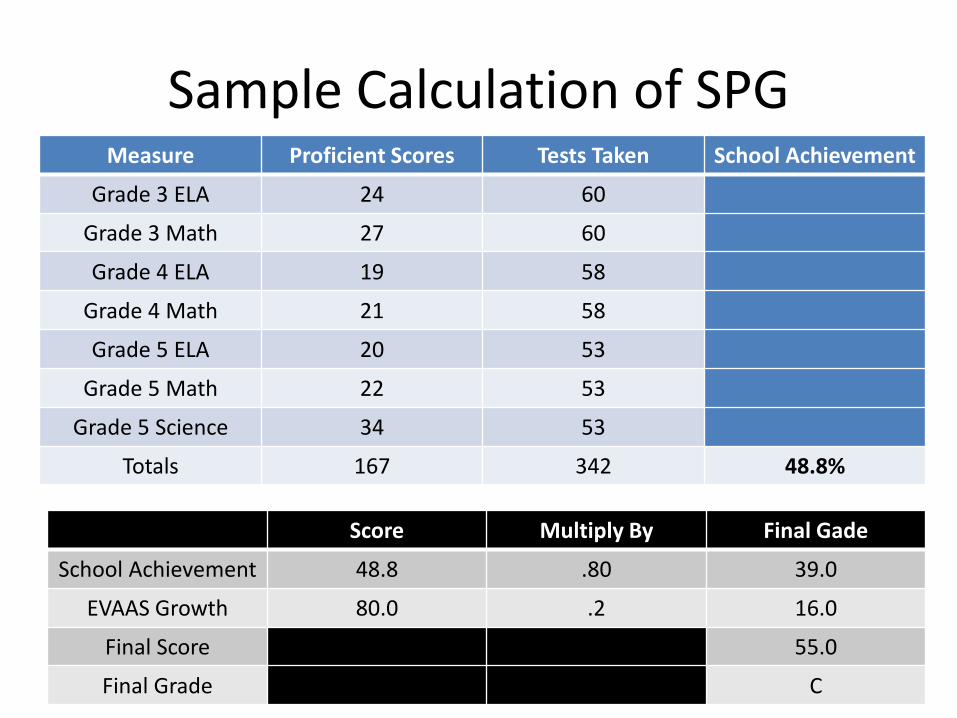
Sample Calculation of SPG Measure Proficient Scores Tests Taken School Achievement
Grade 3 ELA 24 60
Grade 3 Math 27 60
Grade 4 ELA 19 58
Grade 4 Math 21 58
Grade 5 ELA 20 53
Grade 5 Math 22 53
Grade 5 Science 34 53
Totals 167 342 48.8%
Score Multiply By Final Gade
School Achievement 48.8 .80 39.0
EVAAS Growth 80.0 .2 16.0
Final Score 55.0
Final Grade C
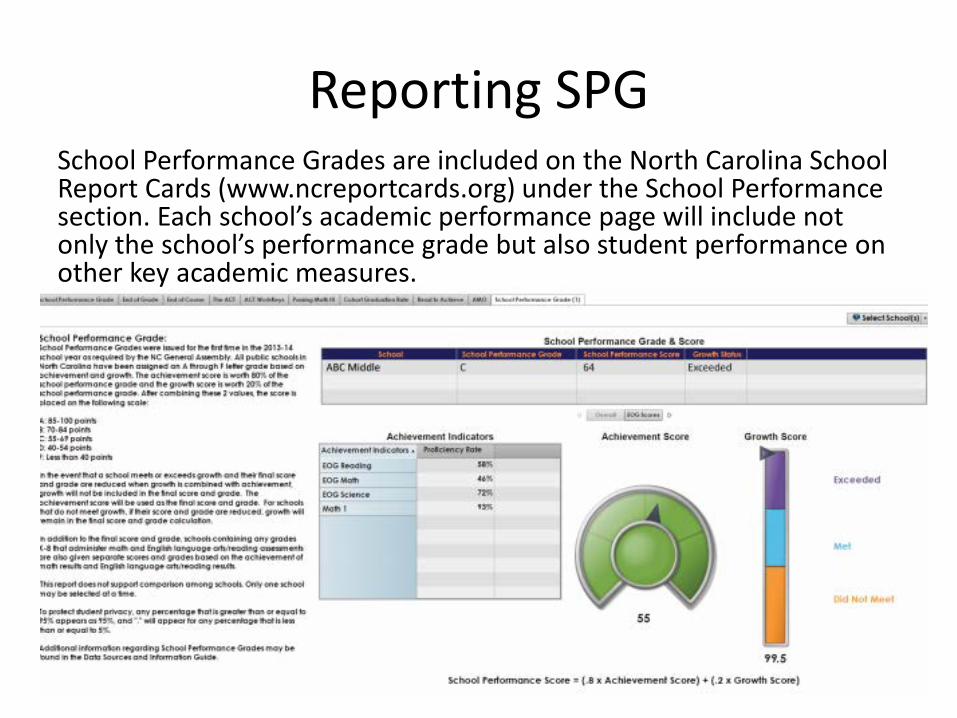
Reporting SPG School Performance Grades are included on the North Carolina School Report Cards (www.ncreportcards.org) under the School Performance section. Each school’s academic performance page will include not only the school’s performance grade but also student performance on other key academic measures.

QUESTIONS
1
North Carolina Guide to
Strengthening Our Public Schools
North Carolina School Superintendents Association
January 2015
PreK-12 Public Education Strategic Plan

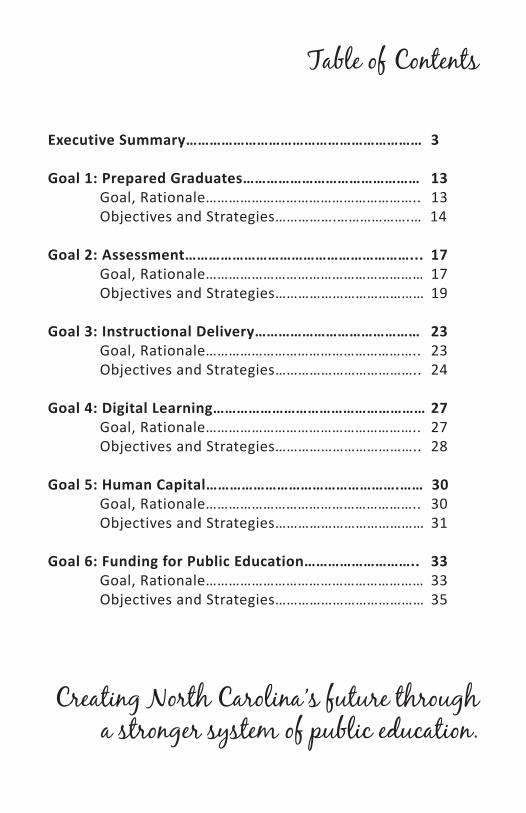
Table of Contents
Executive Summary…………………………………………………… 3
Goal 1: Prepared Graduates……………………………………… 13 Goal, Rationale……………………………………………….. 13 Objectives and Strategies…………….……………….… 14 Goal 2: Assessment…………………………………………………... 17 Goal, Rationale………………………………………………… 17 Objectives and Strategies………………………………… 19 Goal 3: Instructional Delivery…………………………………… 23 Goal, Rationale……………………………………………….. 23 Objectives and Strategies……………………………….. 24 Goal 4: Digital Learning……………………………………………… 27 Goal, Rationale……………………………………………….. 27 Objectives and Strategies……………………………….. 28 Goal 5: Human Capital………………………………………….…… 30 Goal, Rationale……………………………………………….. 30 Objectives and Strategies………………………………… 31 Goal 6: Funding for Public Education……………………….. 33 Goal, Rationale………………………………………………… 33 Objectives and Strategies………………………………… 35
Creating North Carolina’s future through a stronger system of public education.

3
The North Carolina School Superintendents Association (NCSSA) is a professional organization dedicated to the mission of providing leadership and advocacy for public school education throughout North Carolina. The members of NCSSA are compelled by a common mission and a sense of urgency to educate each young person in North Carolina so that our communities, state, and nation will continue to thrive.
North Carolina’s ability to compete for jobs, develop a stronger economy, and promote
greater economic prosperity for all of its citizens is dependent on the quality of its public schools.
Transportation, health and human services, safety, and a pro-business climate are also important, but our state’s greatest asset is its people. Our future depends on today’s public school graduates who must be prepared for success in a highly skilled workforce, committed to continuous learning, and able to participate as productive citizens. We need graduates who are effective communicators, critical thinkers, collaborative workers, and whose creativity will drive entrepreneurship and innovation.
As Superintendents of North Carolina’s Public Schools, we believe it is imperative that North Carolina develops and commits to a shared vision for public education. This vision includes outlining the knowledge and skills that students must know and be able to demonstrate upon graduation in order to be successful learners, employees, and citizens in the 21st century. It also includes the instructional delivery and learning support systems, human capital, and funding needed to provide our students with a world class education.
Executive Summary
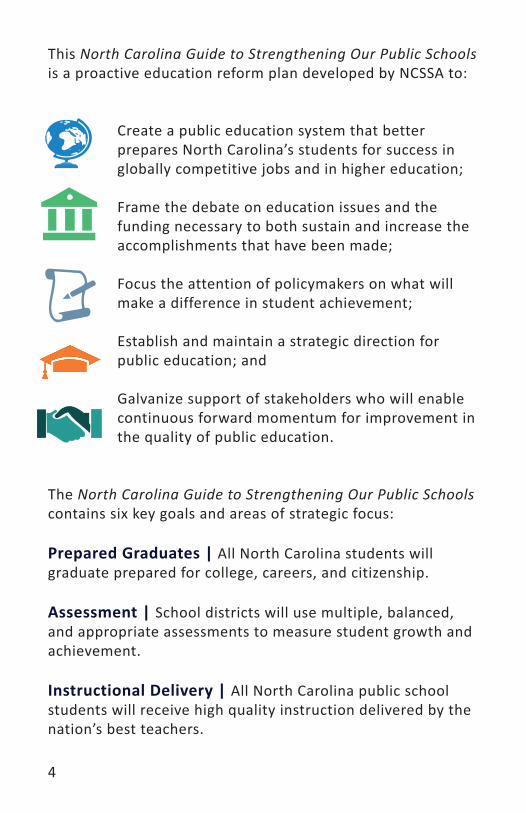
4
This North Carolina Guide to Strengthening Our Public Schools is a proactive education reform plan developed by NCSSA to:
Create a public education system that better prepares North Carolina’s students for success in globally competitive jobs and in higher education;
Frame the debate on education issues and the funding necessary to both sustain and increase the accomplishments that have been made;
Focus the attention of policymakers on what will make a difference in student achievement;
Establish and maintain a strategic direction for public education; and
Galvanize support of stakeholders who will enable continuous forward momentum for improvement in the quality of public education.
The North Carolina Guide to Strengthening Our Public Schools contains six key goals and areas of strategic focus:
Prepared Graduates | All North Carolina students will graduate prepared for college, careers, and citizenship.
Assessment | School districts will use multiple, balanced, and appropriate assessments to measure student growth and achievement.
Instructional Delivery | All North Carolina public school students will receive high quality instruction delivered by the nation’s best teachers.
5
Digital Learning | North Carolina will embrace digital learning to transform our public schools and communities.
Human Capital | Develop North Carolina’s human capital for the provision of high-quality public education.
Funding Public Education | North Carolina will rank 25th nationwide in public school funding by 2025.
Key strategies have been identified to achieve each of the six major goals:
PREPARED GRADUATESGoal 1: All North Carolina students will graduate
prepared for college, careers, and citizenship.
Key Strategies
Integrate rigorous content with internationally benchmarked performance competencies.
Use multiple measures to assess students’ performance on college and career readiness standards.
Create and implement an aligned instructional delivery system.
Ensure all students have grade-appropriate career development experiences.
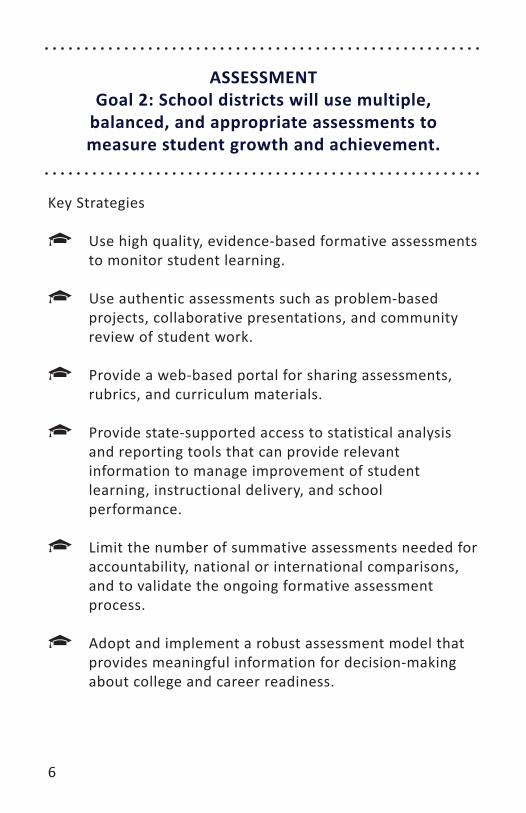
6
ASSESSMENTGoal 2: School districts will use multiple,
balanced, and appropriate assessments to measure student growth and achievement.
Key Strategies
Use high quality, evidence-based formative assessments to monitor student learning.
Use authentic assessments such as problem-based projects, collaborative presentations, and community review of student work.
Provide a web-based portal for sharing assessments, rubrics, and curriculum materials.
Provide state-supported access to statistical analysis and reporting tools that can provide relevant information to manage improvement of student learning, instructional delivery, and school performance.
Limit the number of summative assessments needed for accountability, national or international comparisons, and to validate the ongoing formative assessment process.
Adopt and implement a robust assessment model that provides meaningful information for decision-making about college and career readiness.
7
INSTRUCTIONAL DELIVERYGoal 3: All North Carolina public school
students will receive high quality instruction delivered by the nation’s best teachers.
Key Strategies
Provide funding and access to rich content and instructional resources.
Provide funding and access to digital tools, resources, and support.
Establish a stable timeline for statewide review and revision of curriculum standards.
Assure curriculum is aligned to state standards and meets the needs of a diverse student population.
Develop and implement benchmark assessments aligned with standards.
Provide funding for professional development for teachers and school leaders.
8
DIGITAL LEARNINGGoal 4: North Carolina will embrace digital learning to transform our public schools and communities.
Key Strategies
Include digital learning as a core component of all educational plans for innovation and personalized learning.
Provide reliable and effective infrastructure for all stakeholders at school and at home. Provide state funding to support infrastructure for each district.
Provide technical support that will be available rapidly enough that instructional and business operations are minimally impacted by technology problems.
Provide a mobile device and access to rich digital resources for every educator and student at home and school.
Provide a state funding stream for employing a technology facilitator at each school and professional development to support digital learning.
Develop and implement standards for digital citizenship at every grade level.
9
HUMAN CAPITALGoal 5: Develop North Carolina’s human capital for
the provision of high-quality public education.
Key Strategies Increase salaries and benefits of all teachers, principals,
administrators, superintendents and classified staff so that North Carolina will be in the top of its competitive market and in the top 10% in the nation.
Maintain a strong North Carolina State Retirement System.
Provide programs/incentives to encourage high school students to become teachers.
Provide strong mentoring and induction programs for new teachers and principals. Reform licensure to provide flexibility for reciprocity for
teachers from other states.
Implement a fair and uniform evaluation system that provides for timely reporting of student achievement data and other performance indicators to be considered in teacher and principal evaluations. The data and indicators should be derived from a balanced system of assessments that are valid and reliable.
Pass legislation providing for two-year or four-year contracts for teachers.
Provide funding and resources for professional development for teachers, principals, administrators, and classified staff.
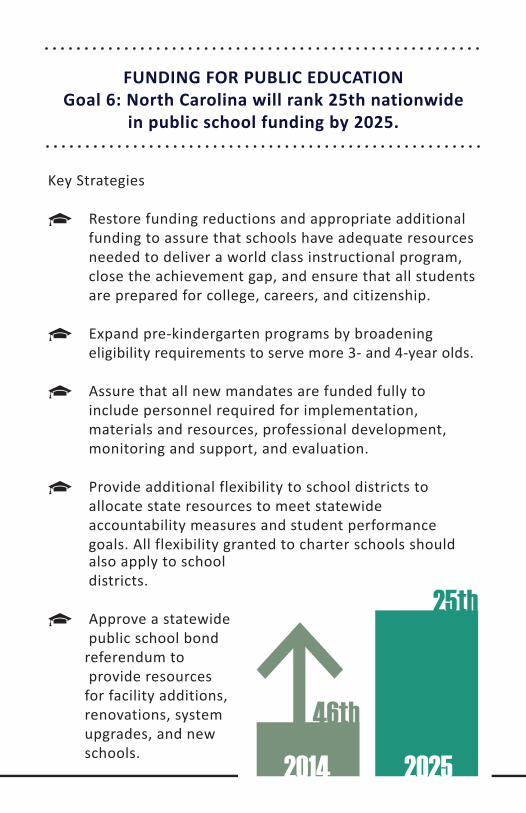
FUNDING FOR PUBLIC EDUCATIONGoal 6: North Carolina will rank 25th nationwide
in public school funding by 2025.
Key Strategies
Restore funding reductions and appropriate additional funding to assure that schools have adequate resources needed to deliver a world class instructional program, close the achievement gap, and ensure that all students are prepared for college, careers, and citizenship.
Expand pre-kindergarten programs by broadening eligibility requirements to serve more 3- and 4-year olds.
Assure that all new mandates are funded fully to include personnel required for implementation, materials and resources, professional development, monitoring and support, and evaluation.
Provide additional flexibility to school districts to allocate state resources to meet statewide accountability measures and student performance goals. All flexibility granted to charter schools should also apply to school districts.
Approve a statewide public school bond referendum to provide resources for facility additions, renovations, system upgrades, and new schools. 2014 2025
46th
25th
This North Carolina Guide to Strengthening Our Public Schools was developed by NCSSA as a proactive education reform plan to better prepare North Carolina’s students for a global job market, continued education, and productive citizenship.
Our intent was to frame the debate and focus attention on the education issues that we believe will make a difference in student achievement, and ultimately, in economic development and quality of life in North Carolina.
We invite policymakers, elected officials, business and industry leaders, educators, parents, students, and all stakeholders to join this conversation, embrace a shared vision and strategic direction for public education, and provide the economic investment and funding needed to continue our forward momentum to improve our public schools and achieve success for our students.
NCSSA members stand ready to work collaboratively with other entities across our state to achieve the goals, objectives, and strategies contained herein and create North Carolina’s future through a stronger system of public education.
Closing

13
Prepared Graduates
Goal: All North Carolina students will graduate prepared for college, careers, and citizenship.
RationaleSince the early 1990’s, the hyper-development of technology, increased world-wide focus on science, technology, engineering, and mathematics integration (STEM), the developing markets of Europe and the emerging markets of Asia and South America, the outsourcings of U.S. services, and the relocation of American businesses have combined to change the focus of American public education. It is no longer sufficient for students to demonstrate competence on standardized tests that measure their ability to succeed in a local economy; it has become paramount for American students to acquire the knowledge and skills that will enable them to ultimately succeed in the workforce, in institutions of higher education, and to compete globally.
The continually changing needs of the 21st century workplace require that skills such as adaptability, flexibility, critical thinking, problem finding, problem-solving, communication, collaboration, creativity, and information technology application must be emphasized in K-12 education. As school superintendents, we are compelled by our common mission and a sense of urgency to educate all students in the state of North Carolina so that our communities, state, and nation can continue to thrive.
14
As Superintendents of North Carolina, we believe:
All students are capable of learning.
All learners in our schools must graduate prepared for careers, college, and citizenship to ensure that they can work successfully in a global market and live as productive citizens.
The economic vitality, democratic health, and future success of our communities, state, and nation depend upon the capacity of today’s students to become tomorrow’s extraordinary leaders, high performance workforce, and contributing citizens.
The curriculum for North Carolina schools must provide a strong foundation for setting challenging expectations of what all students should know and be able to demonstrate.
To move our students forward from content competence to performance excellence, we must embrace a curriculum that incorporates 21st century skills and international benchmarks and surpasses the expectations of current standards.
Objectives and StrategiesStandards, assessments, curriculum, instruction, and professional development must be integrated into an aligned system that will ensure college and career readiness outcomes for today’s high school graduates.
Objective 1College and career readiness standards that align with 21st century learning standards are essential for all students in North Carolina Public Schools. An accountability system that assesses learners’ performance and growth in meeting these standards will be required.
15
Strategy 1A: Define and develop an integrated model of rigorous content and core performance competencies that combines state standards and 21st century/international performance skills.
Strategy 1B: Implement an accountability system that uses multiple measures to assess learners’ performance and growth on college and career readiness standards that benchmark to 21st century learning/international standards.
Objective 2An integrated and aligned instructional system is essential to ensure college and career readiness outcomes for today’s graduates.
Strategy 2A: Create and implement an instructional system to develop curriculum, pedagogies, formative assessments, and teacher and leader professional development programs that support implementation of 21st century/international performance standards for learners.
Strategy 2B: Create and implement an integrated approach to expose all K-12 students to grade- appropriate career development experiences in partnership with local business, industry, and educational institutions.

17
Assessment
Goal: School districts will use multiple, balanced, and appropriate assessments to measure student growth and achievement.
RationaleWe value assessment and recognize the critical role of assessment in the learning process. There are two major types of assessments, formative and summative, and each has a different purpose.
The purpose of formative assessment is to monitor student learning. The goal is to gather feedback about students’ learning that can be used by both teachers and students to guide improvement.
The purpose of summative assessment is to evaluate student learning. The goal is to measure the proficiency of students at the end of an instructional unit, course, or school year. The summative measure is used to compare the students’ proficiency to a standard or benchmark and to compare schools and school districts.
While each type of assessment is useful for one purpose, each has its limitations and may not be useful at all for other important instructional purposes. We believe that North Carolina’s dependence on summative assessments to describe student achievement in our schools leaves an
18
incomplete picture of student learning and perpetuates the achievement gap. The summative assessment results are available after learning rather than during learning and do not meet the day-to-day needs of students and teachers in the learning process. We support the development of a more balanced system that addresses the informational needs of learners, instructors, and decision-makers.
A balanced assessment system assures access for teachers to evidence-based and reliable assessments that are student-centered, developmentally appropriate, and provide continuous meaningful feedback to inform the learning process. Improving the quality of formative classroom assessments is needed in North Carolina if we are to succeed in closing the achievement gap. Furthermore, the formative assessment process should include the use of multiple assessments including but not limited to student portfolios, problem-based projects, collaborative presentations, pre- and post-assessments to measure growth, benchmark assessments, and teacher and student generated self-assessments of learning. We must grow our repertoire of assessments to include authentic performance assessments that can help determine what students are able to do with their learning.
We share deep concerns about the disproportionate attention given to summative assessments in North Carolina. Currently more than 100 assessments are administered each year solely for the purpose of assigning a teacher effectiveness rating in compliance with the Elementary and Secondary Education Act. It is imperative that we re-think the appropriate touch points for mass assessment of every student required for accountability and find a more
19
optimal approach that reduces the number of summative assessments.
Another important assessment issue is our ability to determine our students’ preparedness for college and careers. A balanced assessment system should provide meaningful information toward those exit outcomes for our graduates. The North Carolina Superintendents recommend that our state make available, at no cost to local school districts, a nationally recognized norm-referenced formative assessment product that can be used for the long-term as well as the short-term to measure student progress toward college and career readiness. An example of assessments designed to measure such progress is the Explore, Plan, and ACT suite of assessments.
Overall, a balanced assessment system should emphasize formative processes that provide real time, continuous data and information to teachers and students so that educators and parents can be proactive rather than reactive in the adjustment of their instructional and academic strategies in helping students grow academically. The summative component should be limited to those necessary only to provide meaningful information for accountability, national or international comparisons, and to validate the ongoing formative assessment process.
Objectives and Strategies
Objective 1Classroom teachers will use high quality formative assessments to make informed decisions about student learning and instruction throughout the year.
20
Strategy 1A: Develop and implement classroom use of high quality, evidence-based formative assessments aligned with standards.
Strategy 1B: Identify and promote the use of authentic performance assessments such as student portfolios, problem-based projects, collaborative presentations, and community review of student work. Encourage use of digital portfolios to house performance assessments.
Strategy 1C: Provide a state-developed and supported web-based portal so that North Carolina educators can share assessments, rubrics, and curriculum materials.
Strategy 1D: Provide state-supported access to statistical analysis and reporting tools that provide relevant information to manage improvement of student learning, instructional delivery, and school performance.
Objective 2North Carolina will identify the optimal use of summative assessments as required for accountability and national or international benchmarking.
Strategy 2A: Develop and implement a plan for limiting the number of summative assessments to specific grades or courses needed for accountability, national or international comparisons, and to validate the ongoing formative assessment process.
21
Objective 3An assessment model to ensure that high school graduates are prepared for post-secondary college and/or career experiences is essential.
Strategy 3A: Adopt and implement a robust assessment model that provides meaningful formation for decision-making about college and career readiness. Consider using the ACT Aspire, Explore, Plan, and ACT suite of assessments.
ReferencesHuebner, T. (2009). What Research Says about Balanced Assessment. Educational Leadership, 67 (3), 85-86.
Stiggins, R. (2008). Assessment FOR Learning, the Achievement Gap, and Truly Effective Schools. Presentation at the Educational Testing Service and College Board Conference, Washington, DC, September 8, 2008.

22
23
Instructional Delivery
Goal: All North Carolina public school students will receive high quality instruction delivered
by the nation’s best teachers.
RationaleNorth Carolina’s students are entitled to high quality educational services that develop core academic skills, critical thinking, problem-solving, collaboration, communication, creativity, and digital skills. We expect our graduates to be prepared for further education (including technical education) and employment. We also expect our students to become learners for a lifetime who are capable of a successful transition into post-secondary education, an evolving 21st century workforce, and responsible, productive citizenship. In order to accomplish these goals for students, North Carolina must focus on supporting evidence-based practices pertaining to instructional delivery. To meet the diverse needs of today’s students, educators must have access to a broad range of differentiated learning resources, a wide repertoire of effective instructional practices, and the cultural intelligence to provide instruction across cultures in an inclusive learning environment. Infusing literacy strategies across the curriculum, engaging students in collaborative problem-based projects, promoting creativity and entrepreneurial processes, designing instruction to promote critical thinking, differentiating instruction for diverse learners, designing and analyzing quality assessments, and effectively using digital resources are just a few of the expectations of all teachers in the 21st century.
At a time when expectations of our educators are at an all-time high, both with regards to their professional expertise and our students’ achievement, our state has chosen to end
24
or reduce funding for critical functions needed to support educators in the professional improvement process. Funding for professional development, textbooks and instructional resources, instructional technology and support, and teacher professional development days have been significantly reduced or not funded at all in the past several years.
Salary schedules do not provide incentives for experienced master teachers to enter the field of school administration. Furthermore, the need for technology and digital resources continues to grow as we strive to provide a relevant and engaging educational experience for North Carolina’s students.
Objectives and Strategies
Objective 1Students learn best when all students have access to rich content and resources.
Strategy 1A: Develop and implement a reliable statewide Instructional Management System to house rich instructional content and resources.
Strategy 1B: Provide a dedicated funding stream for instructional materials, including textbooks, digital materials and content, and content-specific manipulatives and hands-on materials.
Strategy 1C: Provide a dedicated funding stream for technology tools to access digital content, robust and reliable infrastructure, and instructional technology support.
Objective 2Students learn best when standards, instructional delivery and assessments are aligned.
25
Strategy 2A: Establish a stable timeline for statewide review, revision, and implementation of curriculum standards.
Strategy 2B: Support local school districts in selecting curriculum aligned to state standards that meets the needs of a diverse student population, including but not limited to racial, cultural, and socioeconomic diversity.
Strategy 2C: Develop and implement high quality evidence-based formative and benchmark assessments that are aligned with standards, can be used to guide instruction, and are part of a statewide Instructional Management System.
Objective 3 Students learn best when educators are engaged in meaningful learning experiences.
Strategy 3A: Provide a dedicated funding stream for professional development for teachers and principals to support implementation of evidence-based instructional practices and effective use of digital media and technology.
Strategy 3B: Create a pipeline for future school-based leadership that includes professional development and incentives/salary to attract excellent instructional leaders.
Strategy 3C: Provide additional dedicated professional development days for teachers to engage in meaningful learning experiences that will enhance and improve instructional delivery and student outcomes.

26
27
Digital Learning
Goal: North Carolina will embrace digital learning to transform our public schools and communities.
Rationale“Digital learning is any instructional practice that effectively uses technology to strengthen a student’s learning experience. It emphasizes high-quality instruction and provides access to challenging content, feedback through formative assessment, opportunities for learning anytime and anywhere, and individualized instruction to ensure all students reach their full potential to succeed in college and a career.
Digital learning encompasses many different facets, tools, and applications to support and empower teachers and students, including online courses, blended or hybrid learning, or digital content and resources. Additionally, digital learning can be used for professional learning opportunities for teachers and to provide personalized learning experiences for students.Digital learning advances school reform by increasing equity and access to educational opportunities, improving effectiveness and productivity of teachers and administrators, providing student-centered learning to ensure college and career readiness for all students, and recognizing teachers as education designers.”
From Alliance for Excellent Education, all4ed.org/issues/digital-learning
28
Objectives and Strategies
Objective 1: Leadership
Strategy 1A: Develop a shared vision across North Carolina public school districts for innovation and personalized learning.
Strategy 1B: Model and value digital learning and include digital learning as a core component of all educational plans.
Strategy 1C: Realign human resources to support digital learning.
Strategy 1D: Provide flexible funding to support infrastructure, devices and digital content.
Objective 2: Connectivity and Digital Infrastructure
Strategy 2A: Provide reliable and effective infrastructure for all stakeholders at school and at home.
Strategy 2B: Provide sufficient network and internet connection bandwidth to support all school district access needs.
Strategy 2C: Provide technical support that will be available rapidly enough that instructional and business operations are minimally impacted by technology problems.
Objective 3: Tools and Hardware
Strategy 3A: Provide a mobile device for every educator and student that can be used at home and at school.
29
Strategy 3B: Assure that all mobile devices have sufficient offline capabilities to meet the needs of the students and school instructional programs.
Objective 4: Learning Management, Instruction and Digital Content
Strategy 4A: Provide students access to digital resources with a rich variety of media types for consumption and creation of information.
Strategy 4B: Provide educators access to high quality digital content.
Strategy 4C: Align digital tools and resources to advance student achievement.
Objective 5: Professional Learning and Support
Strategy 5A: Provide a state funding stream for employing a technology facilitator at each school.
Strategy 5B: Provide professional development to appropriate educators to facilitate training for all types of learners.
Strategy 5C: Provide differentiated, ongoing, sustainable professional development for educators that will meet their individual needs.
Objective 6: Digital Citizenship and Monitoring Safety Strategy 6A: Develop and implement standards for digital citizenship at every grade level.
30
Human Capital
Goal: Develop North Carolina’s human capital for the provision of high-quality public education.
RationaleAccording to a human capital management study out of Aspen Institute¹, research indicates that principals’ and teachers’ performance has more effect on student achievement than any other factor²,³, and that teachers’ effectiveness in increasing student performance varies widely. The variance in teacher effectiveness is largely predicated on poor recruitment systems and an overly-broad application of professional development.
The core of education is teaching and learning, and the teaching-learning connection works best when schools have effective teachers working with every student every day. The quality of an education system cannot exceed the quality of its teachers. Teachers have the challenging task of meeting the educational needs of a diverse student population, and compensation, support, professional development and first-rate evaluation systems are necessary to sustain and improve their efforts. In order to provide the highest quality public education that prepares North Carolina’s students for success in their careers and post-secondary education, schools must have the highest quality staff available.
Reform efforts should strive to increase the quantity, quality and capacity of educators and administrators as a means to improve student achievement and enhance professional growth. According to a survey of principals across North
31
Carolina, there is strong support for well-educated and experienced teachers for increased student achievement.
In order to develop North Carolina’s human capital for this task, professional development, support systems and policies should be developed to encourage and maintain high performance among teachers, administrators and classified staff. Immediate and long-term objectives should be to improve recruitment, retention, performance and professional development so that current and future North Carolina educators and support staff attain their greatest potentials.
References1. Wurtzel, J. & Curtis, R. (2008). Human Capital Framework for K-12 Urban Education: Organizing for Success. The Aspen Institute. 1.
2. Chavez, S. (2006). An audit of human capital. School Administrator, 63(4), 42-44.
3. Darling-Hammond, L. & Friedlaender, D. (2008). Creating excellent and equitable schools. Educational Leadership, 65(8), 14-21.

32
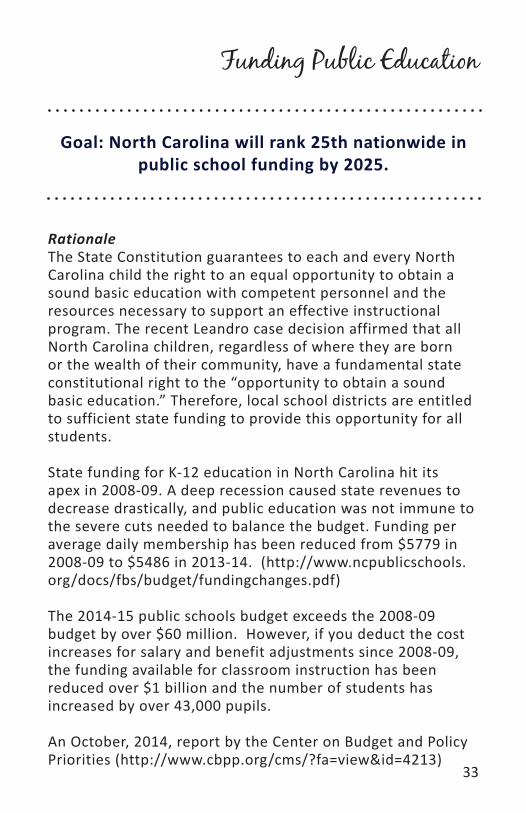
33
Funding Public Education
Goal: North Carolina will rank 25th nationwide in public school funding by 2025.
RationaleThe State Constitution guarantees to each and every North Carolina child the right to an equal opportunity to obtain a sound basic education with competent personnel and the resources necessary to support an effective instructional program. The recent Leandro case decision affirmed that all North Carolina children, regardless of where they are born or the wealth of their community, have a fundamental state constitutional right to the “opportunity to obtain a sound basic education.” Therefore, local school districts are entitled to sufficient state funding to provide this opportunity for all students.
State funding for K-12 education in North Carolina hit its apex in 2008-09. A deep recession caused state revenues to decrease drastically, and public education was not immune to the severe cuts needed to balance the budget. Funding per average daily membership has been reduced from $5779 in 2008-09 to $5486 in 2013-14. (http://www.ncpublicschools.org/docs/fbs/budget/fundingchanges.pdf)
The 2014-15 public schools budget exceeds the 2008-09 budget by over $60 million. However, if you deduct the cost increases for salary and benefit adjustments since 2008-09, the funding available for classroom instruction has been reduced over $1 billion and the number of students has increased by over 43,000 pupils.
An October, 2014, report by the Center on Budget and Policy Priorities (http://www.cbpp.org/cms/?fa=view&id=4213)
34
showed that North Carolina’s percent change in spending per student from 2008-2015 was -14.5% (inflation-adjusted).
This ranks North Carolina 41st out of the 47 states that were included in the study, worse than all other states in the report except Oklahoma, Alabama, Arizona, Idaho, Wisconsin, and Kansas. The dollar impact over this period of time is $855 less per student. And in fiscal year 2014-15, when many other states were increasing per pupil funding, North Carolina’s per pupil funding decreased by 4.7%, the worst one year change in the country except Nevada.
Almost 90% of a school district’s budget is used for salaries and related benefits. The primary strategy that districts have available to reduce expenditures in times of budget reductions is to eliminate personnel positions. As a result, North Carolina school districts are being forced to shed personnel and increase class sizes at a time when expectations for prepared graduates and accountability for high academic achievement are at an all-time high.
Since 1970, the Public School’s share of the State’s General Fund has decreased 15.2%. If our Public Schools were still funded at the same percentage as in 1969-70 (52.5% of the General Fund), we would currently have an additional $3.05 billion for our students. It is imperative that the General Assembly develop a strategy to increase funding for public education to ensure that the state meets its responsibility to provide public education as a core function of state government and to promote economic development and prosperity throughout North Carolina.
School facility needs continue to loom as well. In the 2010-11 Facility Needs Survey conducted by the Department of Public Instruction, over $8 billion in facility needs were identified over the ensuing five-year period across North Carolina by local school districts. Needs identified included new schools, school additions and renovations, furnishings and equipment, and land. With the additional pressure faced by local school districts to make up for losses in state funding with local
35
resources, the local capacity to fund facility improvements is severely jeopardized. Just as a statewide bond referendum was put to the vote of the people and successfully passed in 1996, we believe that today’s immense backlog of school facility projects merits the General Assembly’s action to approve a public school facility bond referendum.
Objectives and Strategies
Objective 1Increase state funding for public education.
Strategy 1A: Restore funding reductions and appropriate additional funding to assure that schools have adequate resources needed to deliver a world class instructional program, close the achievement gap, and ensure that all students are prepared for college, careers, and citizenship.
Strategy 1B: Expand pre-kindergarten programs by broadening eligibility requirements to serve more 3- and 4-year olds.
Strategy 1C: Assure that all new mandates are fully funded to include personnel required for implementation, materials and resources, professional development, monitoring and support, and evaluation.
Strategy 1D: Provide additional flexibility to school districts to allocate state resources to meet statewide accountability measures and student performance goals. All flexibility granted to charter schools should also apply to school districts.
Strategy 1E: Approve a statewide public school bond referendum to provide resources for facility additions, renovations, system upgrades, and new schools.
36
For more information
Detailed information is provided in each of the six areas of strategic focus, including the primary goal, rationale, objectives, and key strategies. This expanded version of the North Carolina Guide to Strengthening Our Public Schools can be accessed on the website of the North Carolina Association of School Administrators at www.ncasa.net.
This guide is supported by the superintendents of North Carolina's 115 public school districts and was created through their collaboration, with leadership from the following Co-Chairs:
Dr. Anthony Jackson, Superintendent, Nash-Rocky Mount Schools
Dr. Frank Till, Jr., Superintendent, Cumberland County Schools
Jack Hoke, Executive Director333 Fayetteville Street, Suite 1410Raleigh, NC [email protected] | 919.828.1426
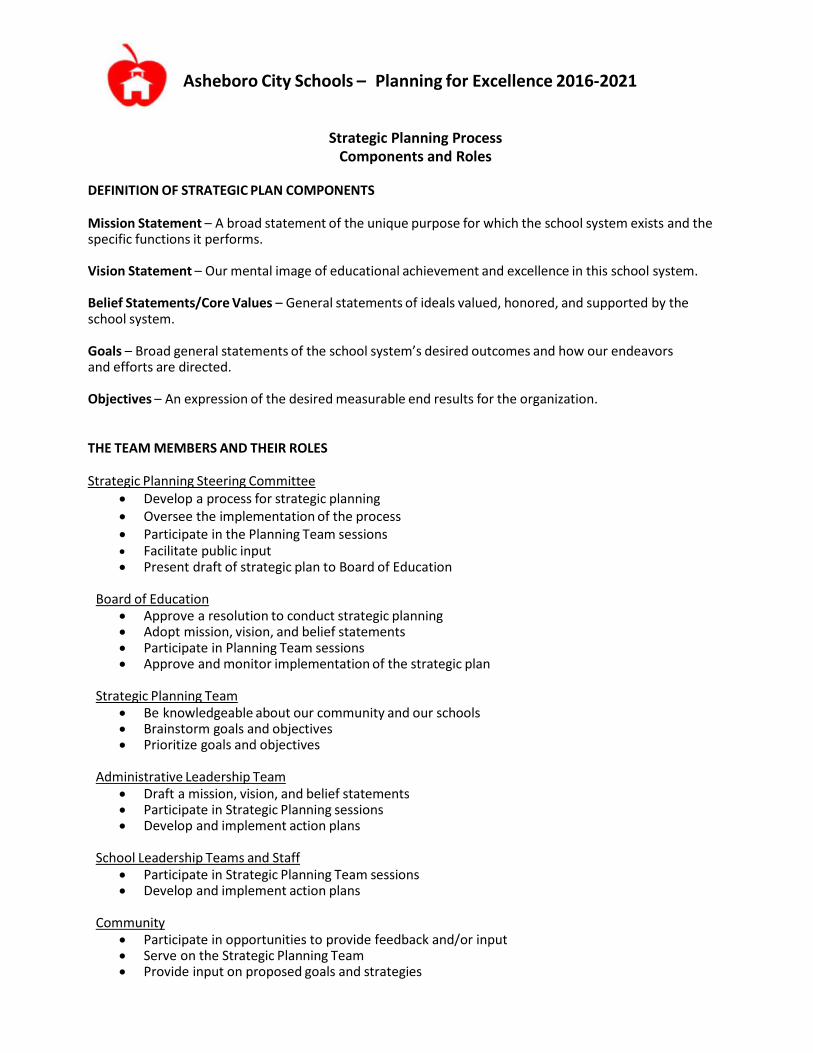
Asheboro City Schools – Planning for Excellence 2016-2021
Strategic Planning Process Components and Roles
DEFINITION OF STRATEGIC PLAN COMPONENTS Mission Statement – A broad statement of the unique purpose for which the school system exists and the specific functions it performs. Vision Statement – Our mental image of educational achievement and excellence in this school system. Belief Statements/Core Values – General statements of ideals valued, honored, and supported by the school system. Goals – Broad general statements of the school system’s desired outcomes and how our endeavors and efforts are directed. Objectives – An expression of the desired measurable end results for the organization. THE TEAM MEMBERS AND THEIR ROLES Strategic Planning Steering Committee
• Develop a process for strategic planning • Oversee the implementation of the process • Participate in the Planning Team sessions • Facilitate public input • Present draft of strategic plan to Board of Education
Board of Education
• Approve a resolution to conduct strategic planning • Adopt mission, vision, and belief statements • Participate in Planning Team sessions • Approve and monitor implementation of the strategic plan
Strategic Planning Team
• Be knowledgeable about our community and our schools • Brainstorm goals and objectives • Prioritize goals and objectives
Administrative Leadership Team
• Draft a mission, vision, and belief statements • Participate in Strategic Planning sessions • Develop and implement action plans
School Leadership Teams and Staff
• Participate in Strategic Planning Team sessions • Develop and implement action plans
Community
• Participate in opportunities to provide feedback and/or input • Serve on the Strategic Planning Team • Provide input on proposed goals and strategies
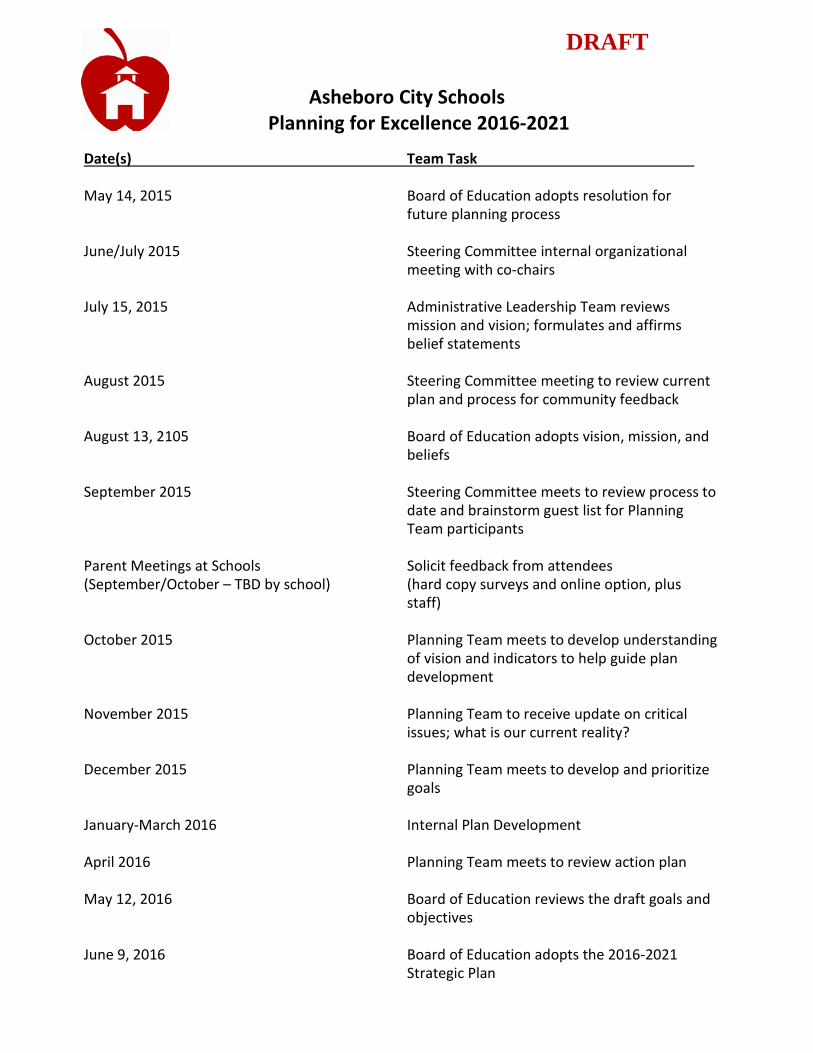
Asheboro City Schools Planning for Excellence 2016-2021
Date(s) Team Task May 14, 2015 Board of Education adopts resolution for future planning process June/July 2015 Steering Committee internal organizational
meeting with co-chairs
July 15, 2015 Administrative Leadership Team reviews mission and vision; formulates and affirms belief statements
August 2015 Steering Committee meeting to review current
plan and process for community feedback August 13, 2105 Board of Education adopts vision, mission, and
beliefs September 2015 Steering Committee meets to review process to
date and brainstorm guest list for Planning Team participants
Parent Meetings at Schools Solicit feedback from attendees (September/October – TBD by school) (hard copy surveys and online option, plus
staff) October 2015 Planning Team meets to develop understanding
of vision and indicators to help guide plan development
November 2015 Planning Team to receive update on critical
issues; what is our current reality? December 2015 Planning Team meets to develop and prioritize
goals January-March 2016 Internal Plan Development April 2016 Planning Team meets to review action plan May 12, 2016 Board of Education reviews the draft goals and
objectives June 9, 2016 Board of Education adopts the 2016-2021
Strategic Plan
DRAFT
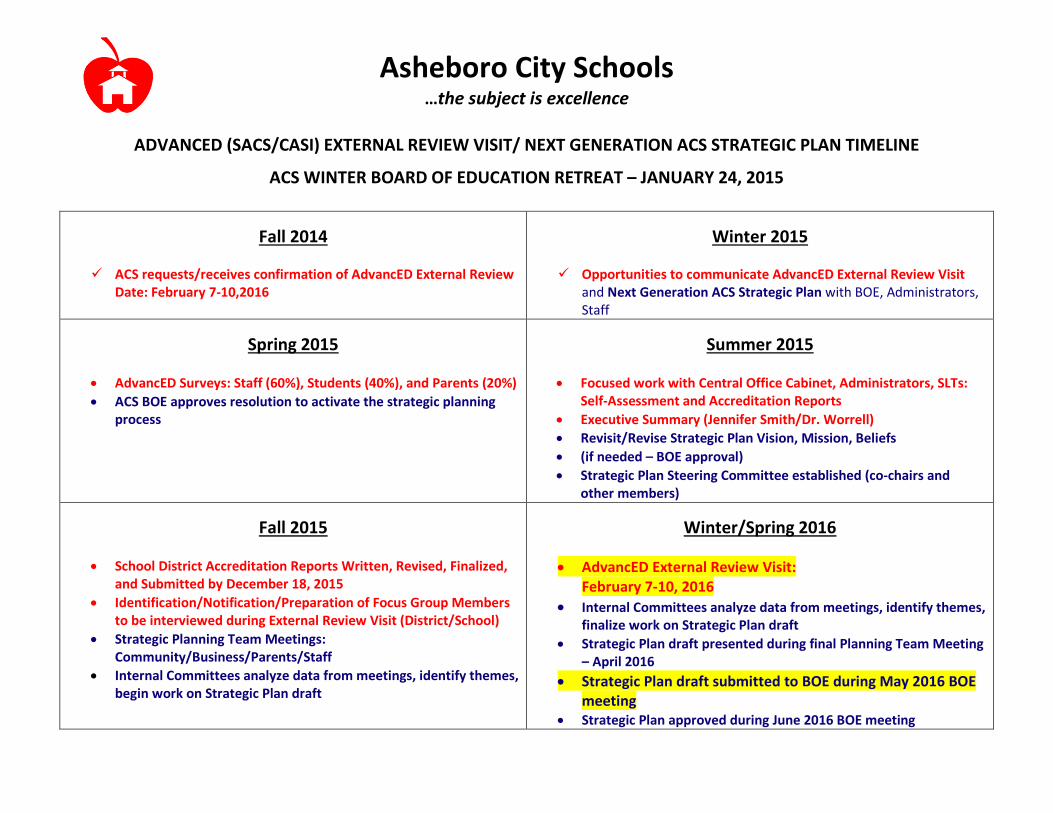
Asheboro City Schools …the subject is excellence
ADVANCED (SACS/CASI) EXTERNAL REVIEW VISIT/ NEXT GENERATION ACS STRATEGIC PLAN TIMELINE
ACS WINTER BOARD OF EDUCATION RETREAT – JANUARY 24, 2015
Fall 2014
ACS requests/receives confirmation of AdvancED External Review Date: February 7-10,2016
Winter 2015
Opportunities to communicate AdvancED External Review Visit and Next Generation ACS Strategic Plan with BOE, Administrators, Staff
Spring 2015
• AdvancED Surveys: Staff (60%), Students (40%), and Parents (20%) • ACS BOE approves resolution to activate the strategic planning
process
Summer 2015
• Focused work with Central Office Cabinet, Administrators, SLTs: Self-Assessment and Accreditation Reports
• Executive Summary (Jennifer Smith/Dr. Worrell) • Revisit/Revise Strategic Plan Vision, Mission, Beliefs • (if needed – BOE approval) • Strategic Plan Steering Committee established (co-chairs and
other members)
Fall 2015
• School District Accreditation Reports Written, Revised, Finalized, and Submitted by December 18, 2015
• Identification/Notification/Preparation of Focus Group Members to be interviewed during External Review Visit (District/School)
• Strategic Planning Team Meetings: Community/Business/Parents/Staff
• Internal Committees analyze data from meetings, identify themes, begin work on Strategic Plan draft
Winter/Spring 2016
• AdvancED External Review Visit: February 7-10, 2016
• Internal Committees analyze data from meetings, identify themes, finalize work on Strategic Plan draft
• Strategic Plan draft presented during final Planning Team Meeting – April 2016
• Strategic Plan draft submitted to BOE during May 2016 BOE meeting
• Strategic Plan approved during June 2016 BOE meeting

E-RATE 2.0WHAT’S CHANGING?
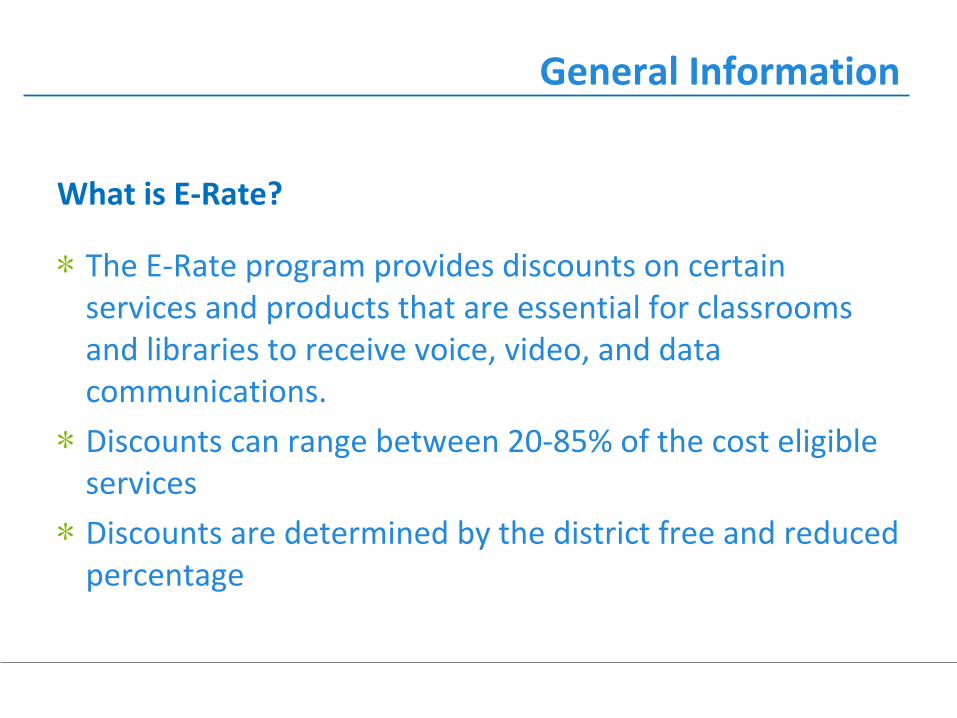
∗ The E-Rate program provides discounts on certain services and products that are essential for classrooms and libraries to receive voice, video, and data communications.
∗ Discounts can range between 20-85% of the cost eligible services
∗ Discounts are determined by the district free and reduced percentage
What is E-Rate?
General Information
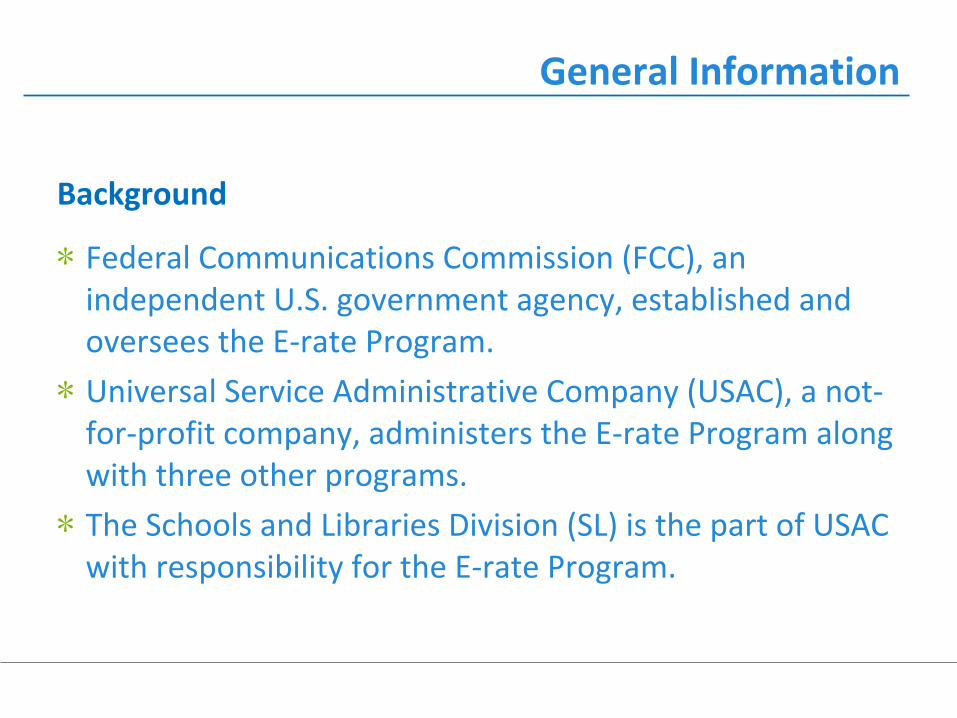
∗ Federal Communications Commission (FCC), an independent U.S. government agency, established and oversees the E-rate Program.
∗ Universal Service Administrative Company (USAC), a not-for-profit company, administers the E-rate Program along with three other programs.
∗ The Schools and Libraries Division (SL) is the part of USAC with responsibility for the E-rate Program.
Background
General Information
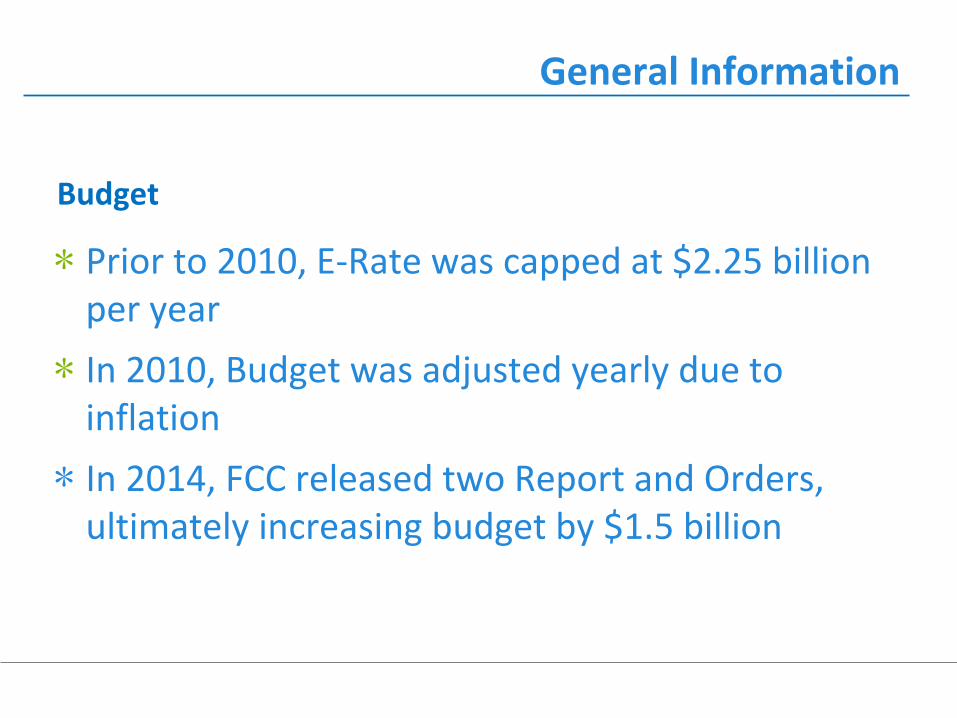
∗ Prior to 2010, E-Rate was capped at $2.25 billion per year
∗ In 2010, Budget was adjusted yearly due to inflation
∗ In 2014, FCC released two Report and Orders, ultimately increasing budget by $1.5 billion
Budget
General Information
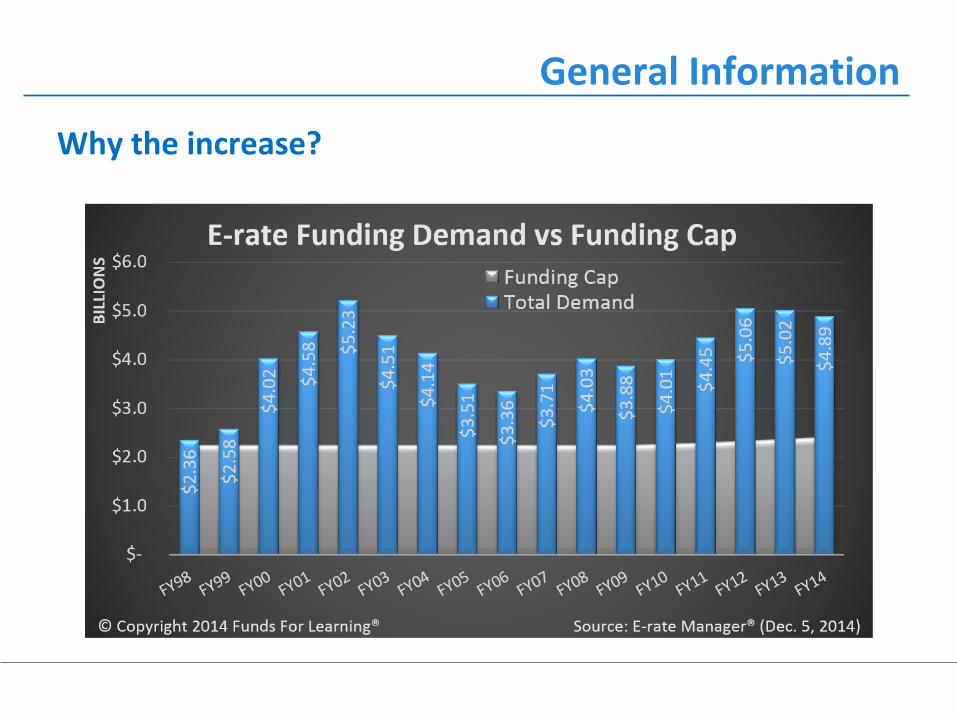
Why the increase?
General Information
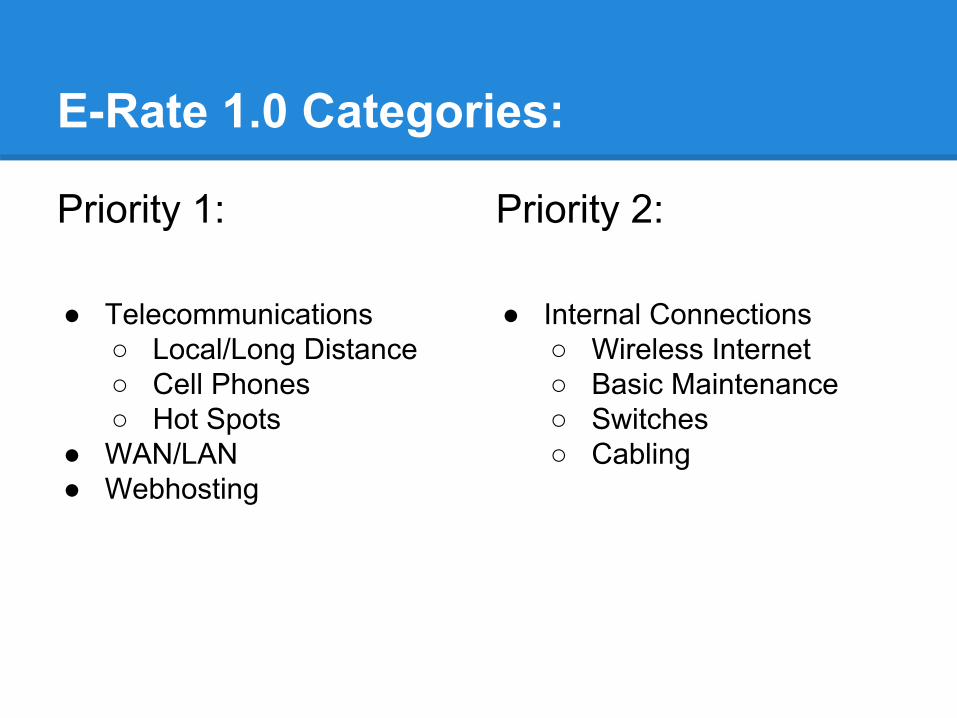
General InformationE-Rate 1.0 Categories:
Priority 1:
● Telecommunications○ Local/Long Distance○ Cell Phones○ Hot Spots
● WAN/LAN● Webhosting
Priority 2:
● Internal Connections○ Wireless Internet○ Basic Maintenance○ Switches○ Cabling
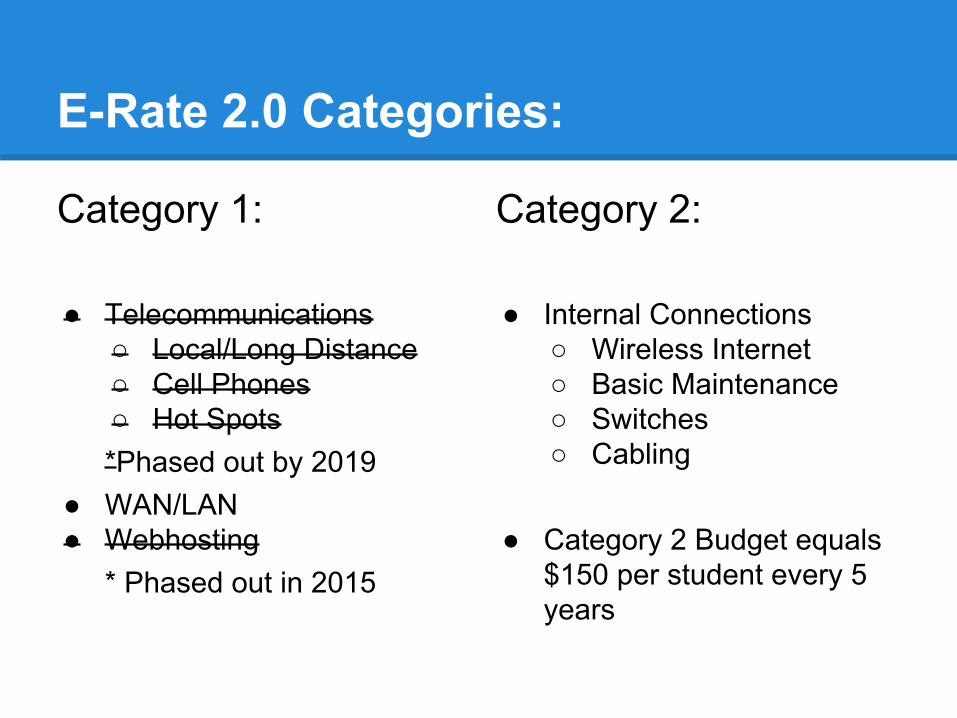
General InformationE-Rate 2.0 Categories:
Category 1:
● Telecommunications○ Local/Long Distance○ Cell Phones○ Hot Spots*Phased out by 2019
● WAN/LAN● Webhosting
* Phased out in 2015
Category 2:
● Internal Connections○ Wireless Internet○ Basic Maintenance○ Switches○ Cabling
● Category 2 Budget equals $150 per student every 5 years
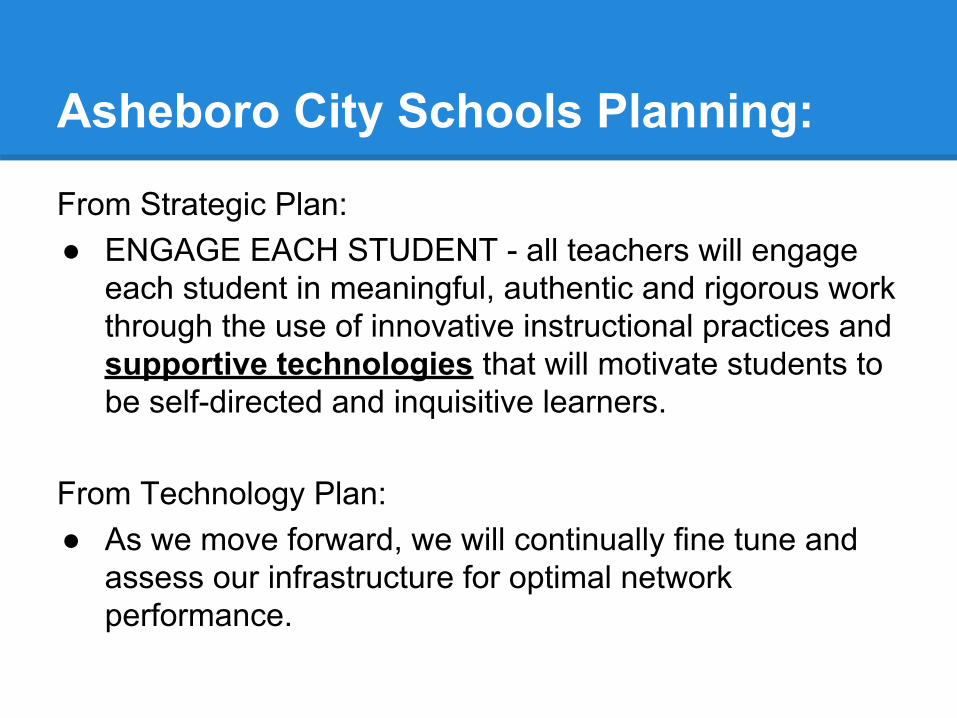
Asheboro City Schools Planning:
From Strategic Plan:● ENGAGE EACH STUDENT - all teachers will engage
each student in meaningful, authentic and rigorous work through the use of innovative instructional practices and supportive technologies that will motivate students to be self-directed and inquisitive learners.
From Technology Plan:● As we move forward, we will continually fine tune and
assess our infrastructure for optimal network performance.
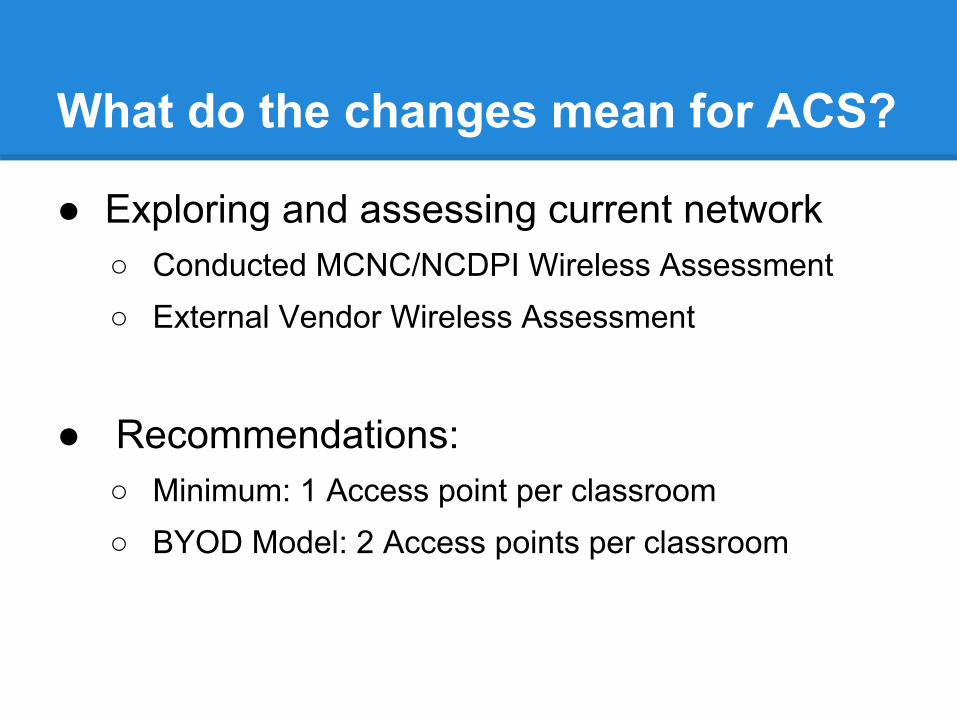
What do the changes mean for ACS?
● Exploring and assessing current network○ Conducted MCNC/NCDPI Wireless Assessment○ External Vendor Wireless Assessment
● Recommendations:○ Minimum: 1 Access point per classroom○ BYOD Model: 2 Access points per classroom
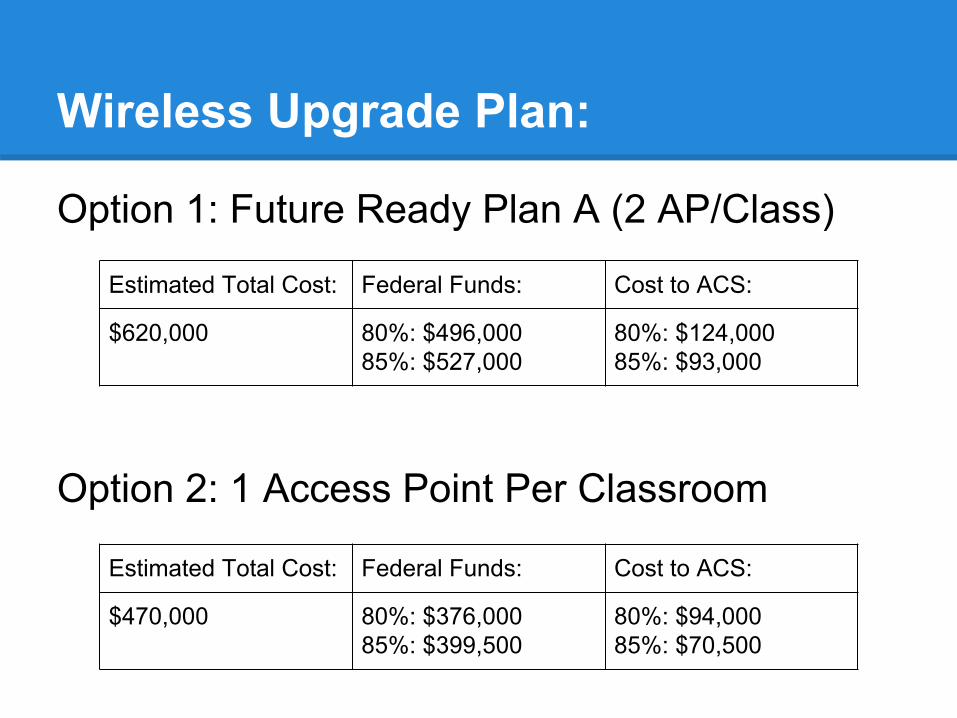
Wireless Upgrade Plan:
Option 1: Future Ready Plan A (2 AP/Class)
Option 2: 1 Access Point Per Classroom
Estimated Total Cost: Federal Funds: Cost to ACS:
$620,000 80%: $496,00085%: $527,000
80%: $124,00085%: $93,000
Estimated Total Cost: Federal Funds: Cost to ACS:
$470,000 80%: $376,00085%: $399,500
80%: $94,00085%: $70,500
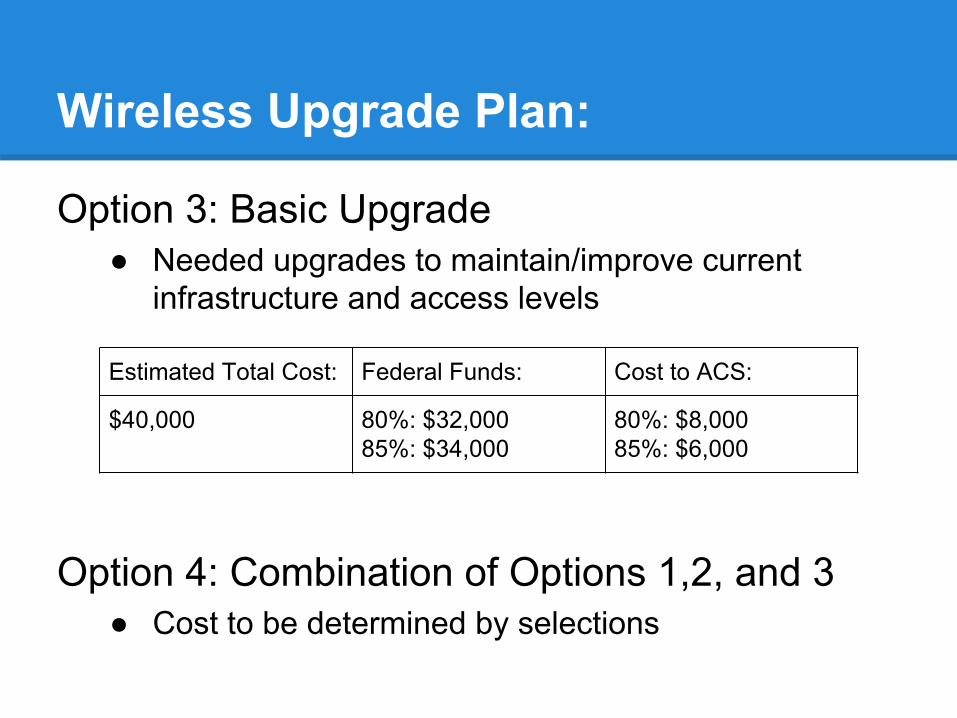
Wireless Upgrade Plan:
Option 3: Basic Upgrade ● Needed upgrades to maintain/improve current
infrastructure and access levels
Option 4: Combination of Options 1,2, and 3● Cost to be determined by selections
Estimated Total Cost: Federal Funds: Cost to ACS:
$40,000 80%: $32,00085%: $34,000
80%: $8,00085%: $6,000
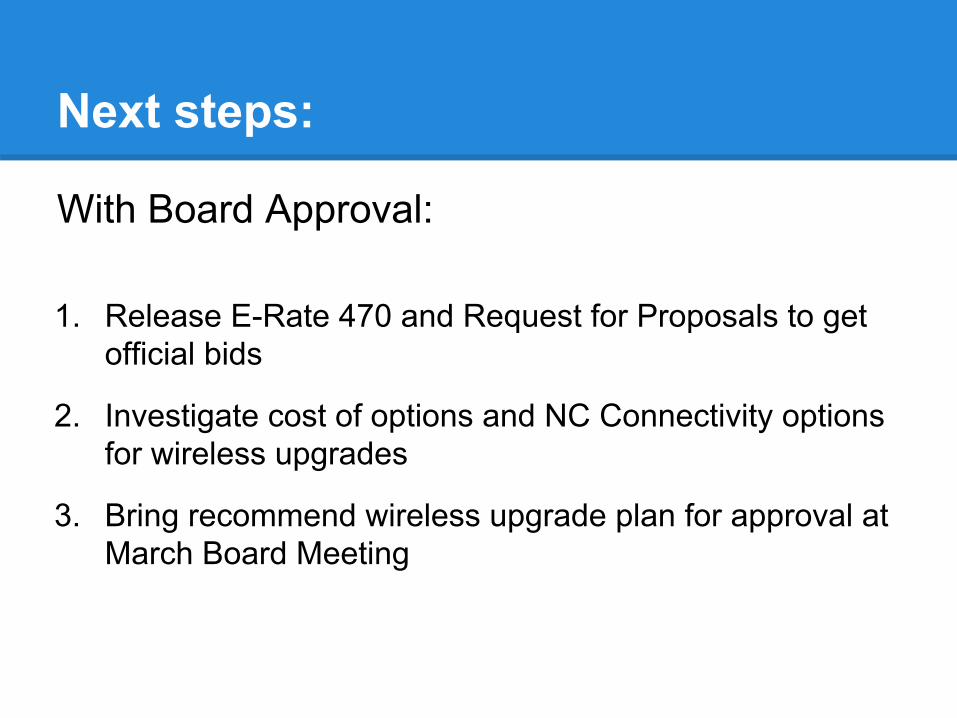
Next steps:
With Board Approval:
1. Release E-Rate 470 and Request for Proposals to get official bids
2. Investigate cost of options and NC Connectivity options for wireless upgrades
3. Bring recommend wireless upgrade plan for approval at March Board Meeting
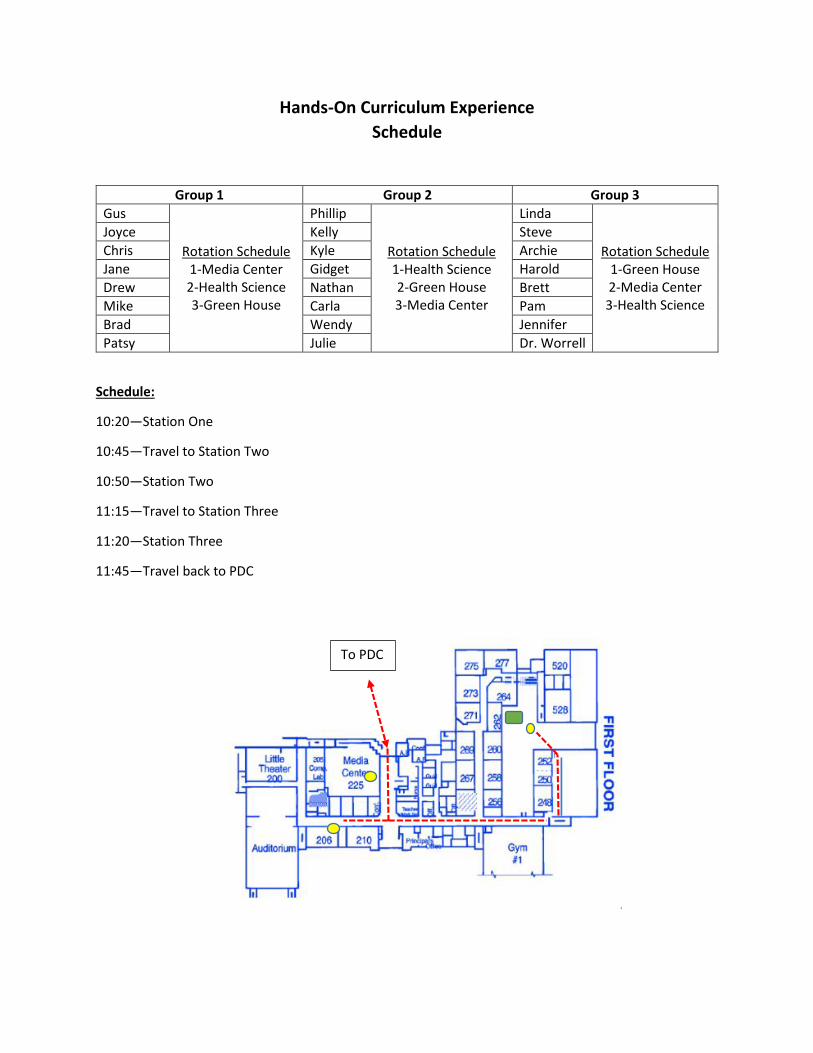
Hands-On Curriculum Experience
Schedule
Group 1 Group 2 Group 3
Gus
Rotation Schedule 1-Media Center 2-Health Science 3-Green House
Phillip
Rotation Schedule 1-Health Science 2-Green House 3-Media Center
Linda
Rotation Schedule 1-Green House 2-Media Center 3-Health Science
Joyce Kelly Steve
Chris Kyle Archie
Jane Gidget Harold
Drew Nathan Brett
Mike Carla Pam
Brad Wendy Jennifer
Patsy Julie Dr. Worrell
Schedule:
10:20—Station One
10:45—Travel to Station Two
10:50—Station Two
11:15—Travel to Station Three
11:20—Station Three
11:45—Travel back to PDC
To PDC

Article 14.
Driver Education.
§ 115C-215. Administration of driver education program by the Department of Public Instruction.
(a) In accordance with criteria and standards approved by the State Board of Education, the
State Superintendent of Public Instruction shall organize and administer a standardized
program of driver education to be offered at the public high schools of this State for all
physically and mentally qualified persons who (i) are older than 14 years and six months,
(ii) are approved by the principal of the school, pursuant to rules adopted by the State
Board of Education, (iii) are enrolled in a public or private high school within the State or
are receiving instruction through a home school as provided by Part 3 of Article 39 of
Chapter 115C of the General Statutes, and (iv) have not previously enrolled in the
program. The State Board of Education shall use for this purpose all funds appropriated
to it for this purpose and may use all other funds that become available for its use for
this purpose.
(b) The driver education curriculum shall include the following:
(1) Instruction on the rights and privileges of the handicapped and the signs and
symbols used to assist the handicapped relative to motor vehicles, including the
"international symbol of accessibility" and other symbols and devices as
provided in Article 2A of Chapter 20 of the General Statutes.
(2) At least six hours of instruction on the offense of driving while impaired and
related subjects.
(3) At least six hours of actual driving experience. To the extent practicable, this
experience may include at least one hour of instruction on the techniques of
defensive driving.
(4) At least one hour of motorcycle safety awareness training.
(c) The State Board of Education shall establish and implement a strategic plan for the
driver education program. At a minimum, the strategic plan shall consist of goals and
performance indicators, including the number of program participants as compared to
the number of persons projected to be eligible to participate in the program, the
implementation of a standard curriculum for the program, expenditures for the
program, and the success rate of program participants in receiving a drivers license as
reported by the Division of Motor Vehicles. The strategic plan shall also outline specific
roles and duties of an advisory committee consisting of employees of the Division of
Motor Vehicles and the Department of Public Instruction and other stakeholders in
driver education.
(d) The State Board of Education shall adopt a salary range for the delivery of driver
education courses by driver education instructors who are public school employees. The
salary range shall be based on the driver education instructor's qualifications,
certification, and licensure specific to driver education.
(e) The State Board of Education shall adopt rules to permit local boards of education to
enter contracts with public or private entities to provide a program of driver education
at public high schools. All driver education instructors shall meet the requirements
established by the State Board of Education; provided, however, driver education
instructors shall not be required to hold teacher certificates. (1953, c. 1196; 1955, c.
1372, art. 23, s. 4; 1959, c. 573, s. 16; 1981, c. 423, s. 1; 1991, c. 689, s. 32(b); 2011-145,
s. 28.37(a); 2011-334, s. 1.)
§ 115C-216. Boards of education required to provide courses in operation of motor vehicles.
(a) Course of Training and Instruction Required in Public High Schools. - Local boards of
education shall offer noncredit driver education courses in high schools using the
standardized curriculum provided by the Department of Public Instruction.
(b) Inclusion of Expense in Budget. - The local boards of education shall include as an item
of instructional service and as a part of the current expense fund of the budget of the
high schools under their supervision, the expense necessary to offer the driver
education course.
(c) through (f) Repealed by Session Laws 1991, c. 689, s. 32(c).
(g) Fee for Instruction. - The local boards of education shall fund driver education courses
from funds available to them and may charge each student participating in a driver
education course a fee of up to sixty-five dollars ($65.00) to offset the costs of providing
the training and instruction. (1955, c. 817; 1965, c. 397; 1981, c. 423, s. 1; 1991, c. 689,
s. 32(c); 2011-145, ss. 28.37(b), 31.1; 2013-360, s. 34.20(a); 2014-100, s. 8.15(c).) §§
115C-217 through 115C-221. Reserved for future codification purposes.
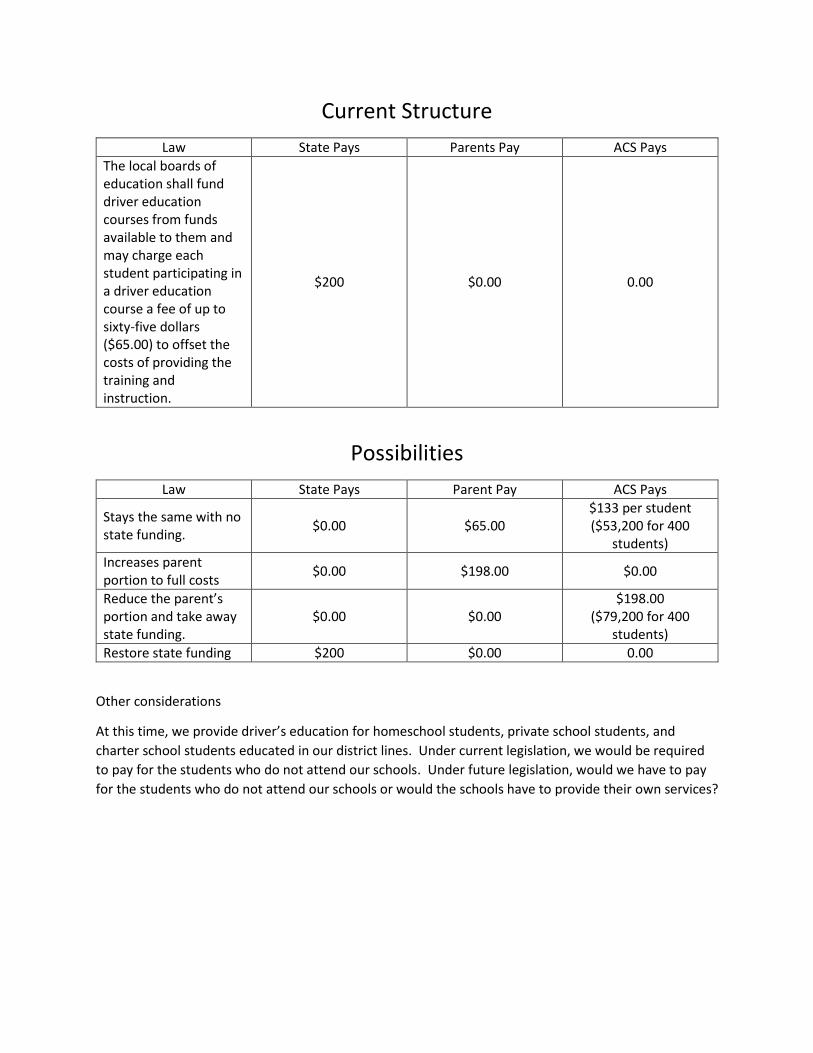
Current Structure
Law State Pays Parents Pay ACS Pays
The local boards of education shall fund driver education courses from funds available to them and may charge each student participating in a driver education course a fee of up to sixty-five dollars ($65.00) to offset the costs of providing the training and instruction.
$200 $0.00 0.00
Possibilities
Law State Pays Parent Pay ACS Pays
Stays the same with no state funding.
$0.00 $65.00 $133 per student ($53,200 for 400
students)
Increases parent portion to full costs
$0.00 $198.00 $0.00
Reduce the parent’s portion and take away state funding.
$0.00 $0.00 $198.00
($79,200 for 400 students)
Restore state funding $200 $0.00 0.00
Other considerations
At this time, we provide driver’s education for homeschool students, private school students, and
charter school students educated in our district lines. Under current legislation, we would be required
to pay for the students who do not attend our schools. Under future legislation, would we have to pay
for the students who do not attend our schools or would the schools have to provide their own services?