Embed Size (px)
Citation preview
Healthy flour and sound margins Ashok K. Sarkar and Linda Malcolmson Canadian International Grains Institute (Cigi), Winnipeg, Manitoba, Canada
Introduction
Market share challenges
Market share of a range of bread products, especially white breads is on the decline in the cereal based food products market. Competitive low carb, no carb and gluten free products are impacting the sales volume alarmingly in some markets.
While gluten free products are meant to cater to a small segment of population that suffer from gluten intolerance, often such claims create confusion among general population leading most consumers to believe that gluten free is healthy and of higher quality.
Introduction cont’d
Confusion with gluten free
Low carb and no carb stemmed largely from the period of once very popular Atkins diet for weight control. Although faded many years ago it seems to have left some lasting impression still affecting the industry.
Introduction cont’d
Low carb popularity
Although weight control related issues leading to obesity involve multiple factors carb, especially from wheat based products si readily identified as contributing factor and seems to be the conspicuous target for most health critics and media.
Introduction cont’d
Wheat carbs – conspicuous target
Obesity has been a burning issue of discussion among multi disciplines engaged in the food industry and public health administration. Rising health care costs associated with health complications related to obesity has become a major concern for many governments around the world.
Introduction cont’d
Rising health care costs
Enhancing nutritive value of flour incorporating processed nutrition rich cereals and/or legumes is an excellent way of serving the needs of the market place while maintaining the core flour grades for conventional products. This is achievable in an existing flour mill with minimal investment. The paper deals with technical aspects of processing these in the form of whole grains or in fractions for end use applications.
Enhancing flour nutrition incorporating nutrition rich cereals
Produce whole grain flour from field
crops that have the good nutritional attributes providing targeted health benefits and are either neutral or add to functionality of the resultant flour for various types of end use applications
Enhancing flour nutrition maintaining functionality
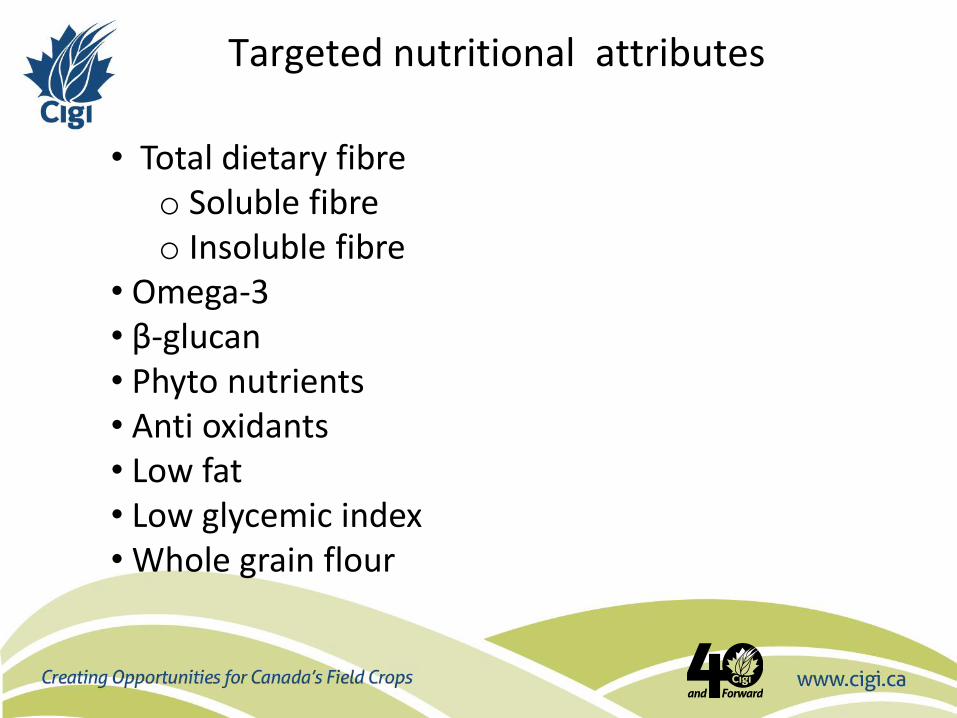
Targeted nutritional attributes
• Total dietary fibre o Soluble fibre o Insoluble fibre
• Omega-3 • β-glucan • Phyto nutrients • Anti oxidants • Low fat • Low glycemic index • Whole grain flour
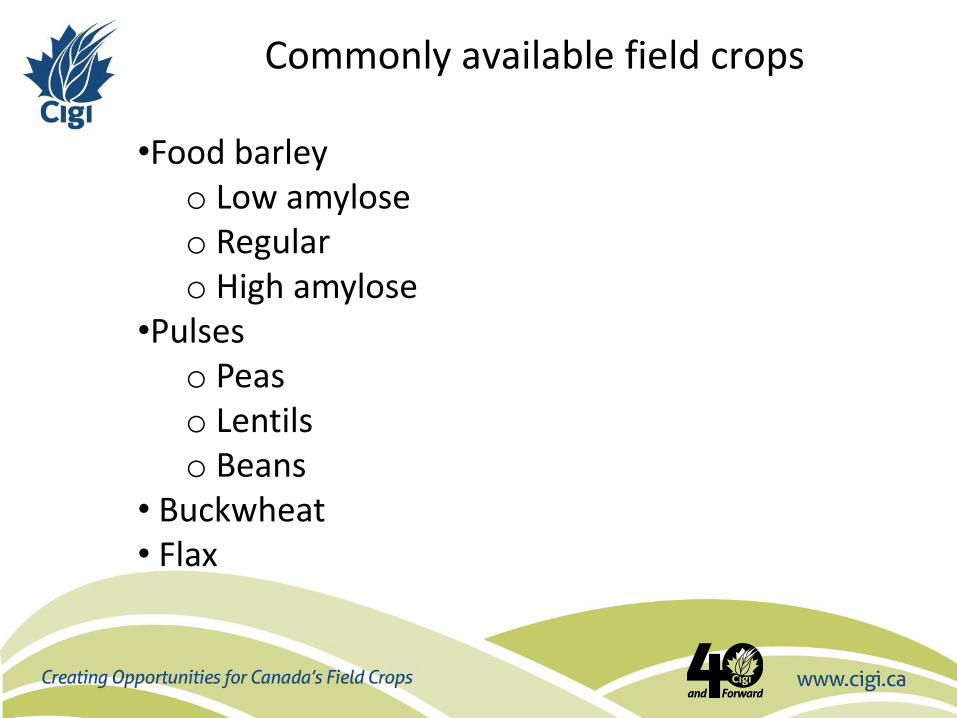
Commonly available field crops
•Food barley o Low amylose o Regular o High amylose
•Pulses o Peas o Lentils o Beans
• Buckwheat • Flax
Nutritive values of various field crops
Food barley
Barley is an excellent source of beta-glucan, contains antioxidants, vitamins, minerals and phytonutrients such as phenolic acids and lignans. These components have biochemical activities that can reduce the risk of coronary heart disease, diabetes, and certain types of cancers. As a whole grain, barley can play a role in weight maintenance. Barley also contributes to satiety.
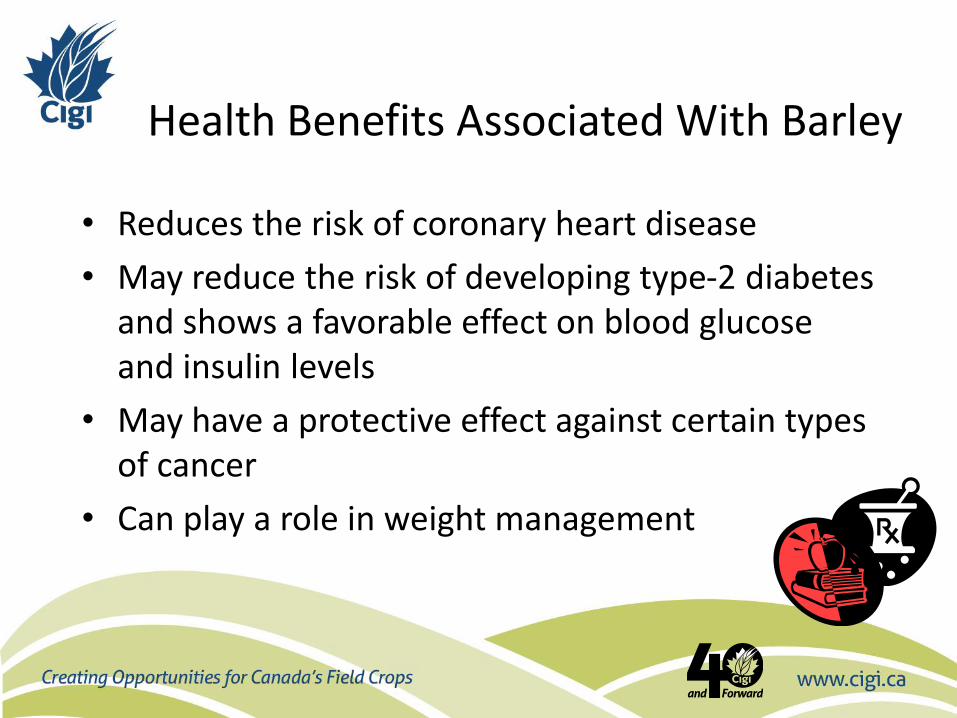
Health Benefits Associated With Barley
• Reduces the risk of coronary heart disease
• May reduce the risk of developing type-2 diabetes and shows a favorable effect on blood glucose and insulin levels
• May have a protective effect against certain types of cancer
• Can play a role in weight management
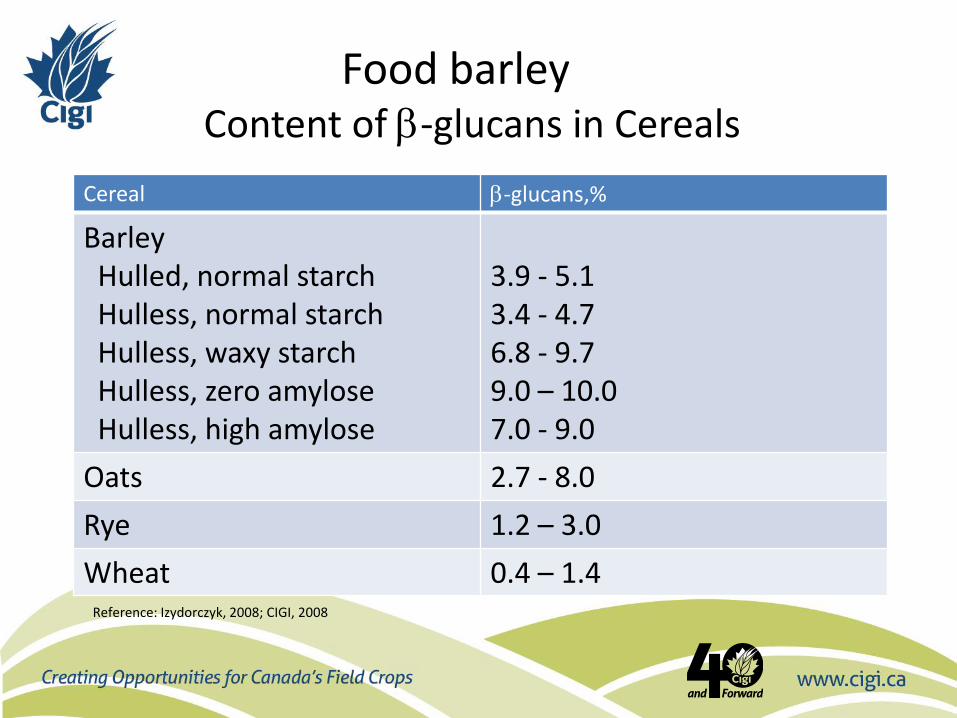
Content of -glucans in Cereals
Cereal -glucans,%
Barley Hulled, normal starch Hulless, normal starch Hulless, waxy starch Hulless, zero amylose Hulless, high amylose
3.9 - 5.1 3.4 - 4.7 6.8 - 9.7 9.0 – 10.0 7.0 - 9.0
Oats 2.7 - 8.0
Rye 1.2 – 3.0
Wheat 0.4 – 1.4 Reference: Izydorczyk, 2008; CIGI, 2008
Food barley
The recent USA and now in Canada diet-health claim for foods containing barley will encourage food manufacturers to use barley ingredients in their products.
Food barley
Health claim
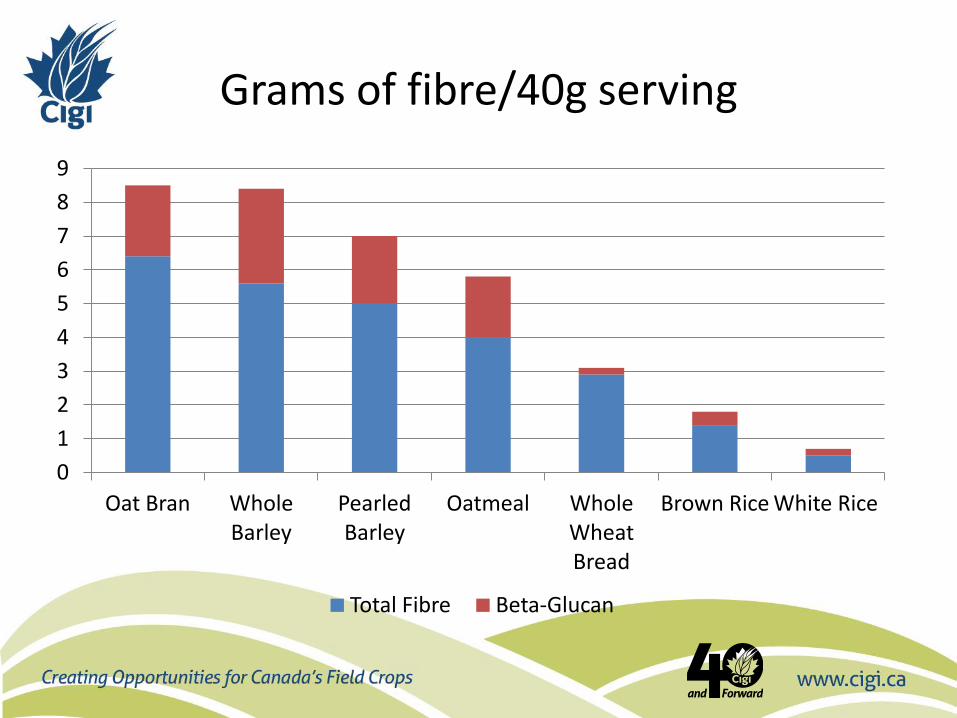
Grams of fibre/40g serving
0
1
2
3
4
5
6
7
8
9
Oat Bran Whole Barley
Pearled Barley
Oatmeal Whole Wheat Bread
Brown Rice White Rice
Total Fibre Beta-Glucan
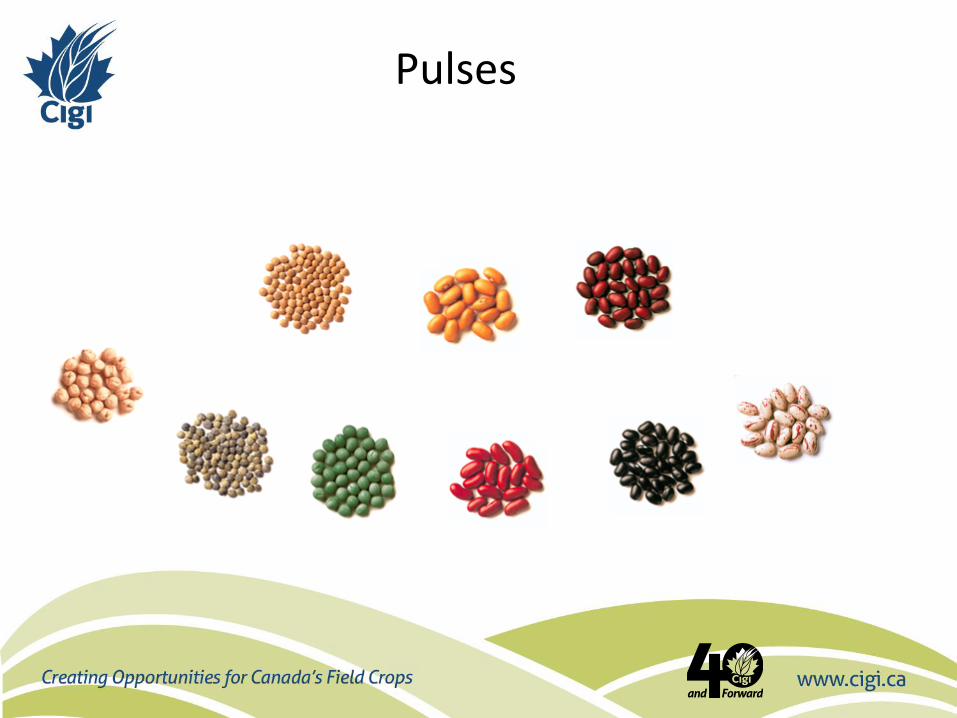
Pulses
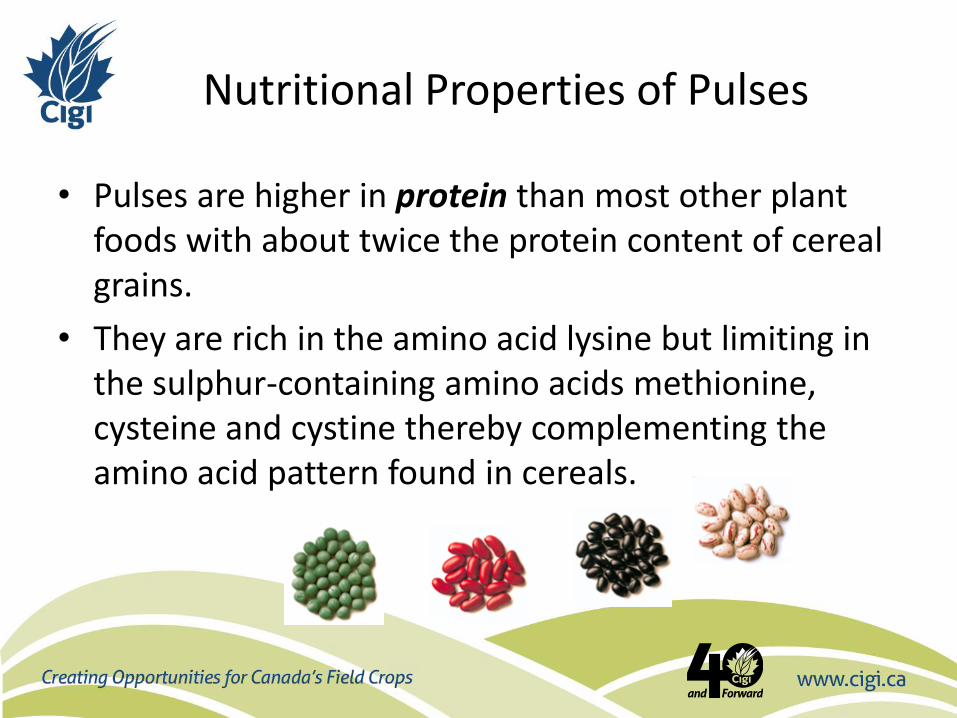
Nutritional Properties of Pulses
• Pulses are higher in protein than most other plant foods with about twice the protein content of cereal grains.
• They are rich in the amino acid lysine but limiting in the sulphur-containing amino acids methionine, cysteine and cystine thereby complementing the amino acid pattern found in cereals.
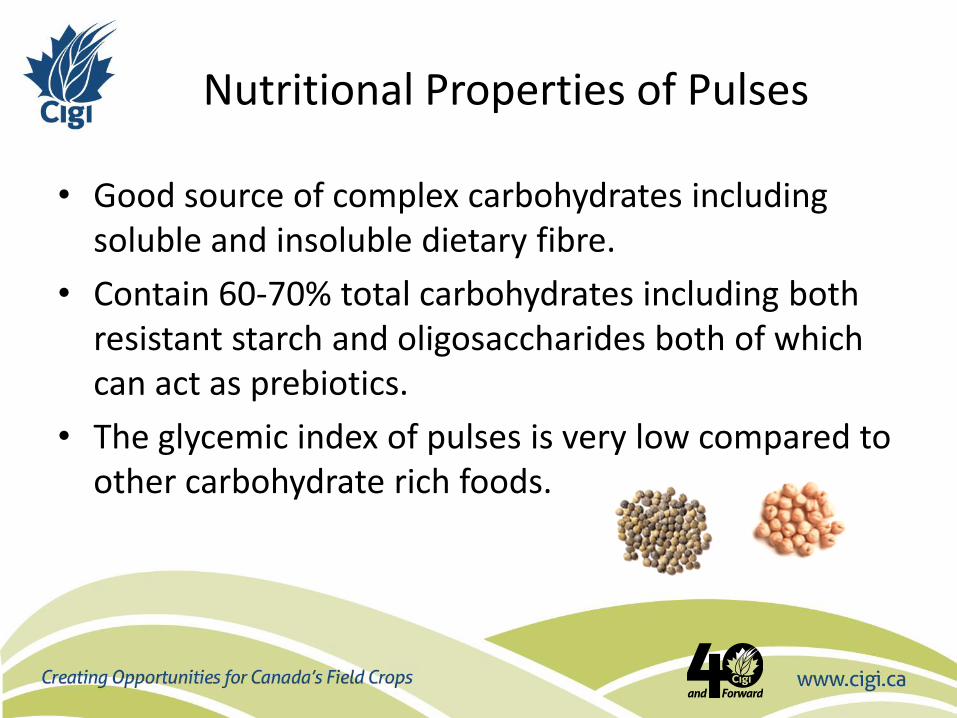
Nutritional Properties of Pulses
• Good source of complex carbohydrates including soluble and insoluble dietary fibre.
• Contain 60-70% total carbohydrates including both resistant starch and oligosaccharides both of which can act as prebiotics.
• The glycemic index of pulses is very low compared to other carbohydrate rich foods.
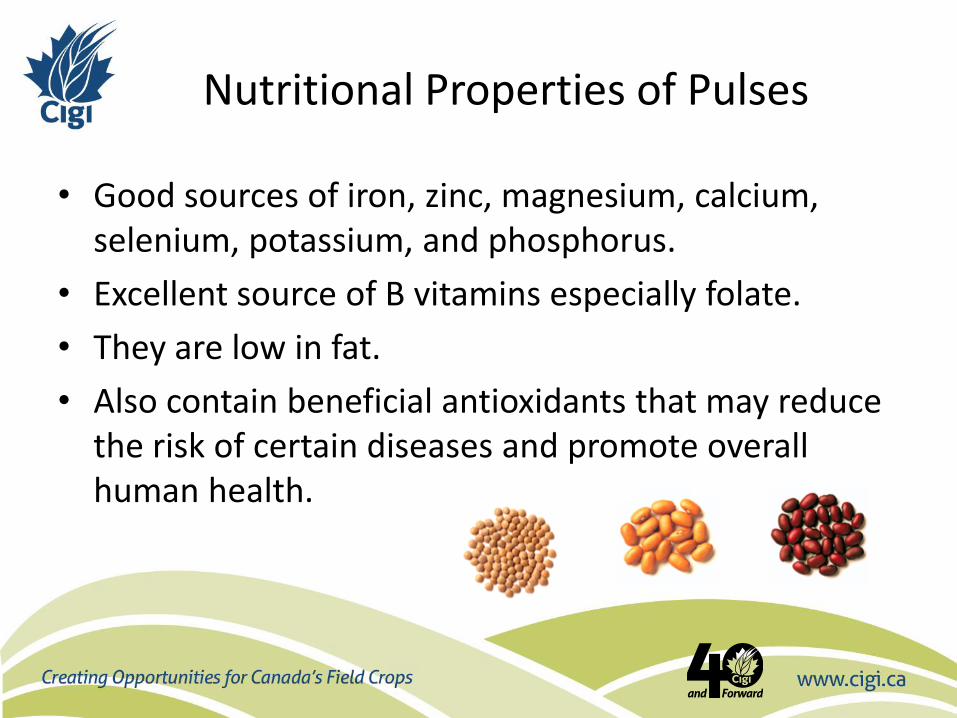
Nutritional Properties of Pulses
• Good sources of iron, zinc, magnesium, calcium, selenium, potassium, and phosphorus.
• Excellent source of B vitamins especially folate.
• They are low in fat.
• Also contain beneficial antioxidants that may reduce the risk of certain diseases and promote overall human health.
Health Benefits Associated with Pulses
• There is strong evidence from epidemiological studies that the consumption of pulses can play a role in preventing cardiovascular disease and diabetes as well as improving gut health.
• Emerging research suggests that when consumed regularly, pulses may help with weight loss and weight regulation.
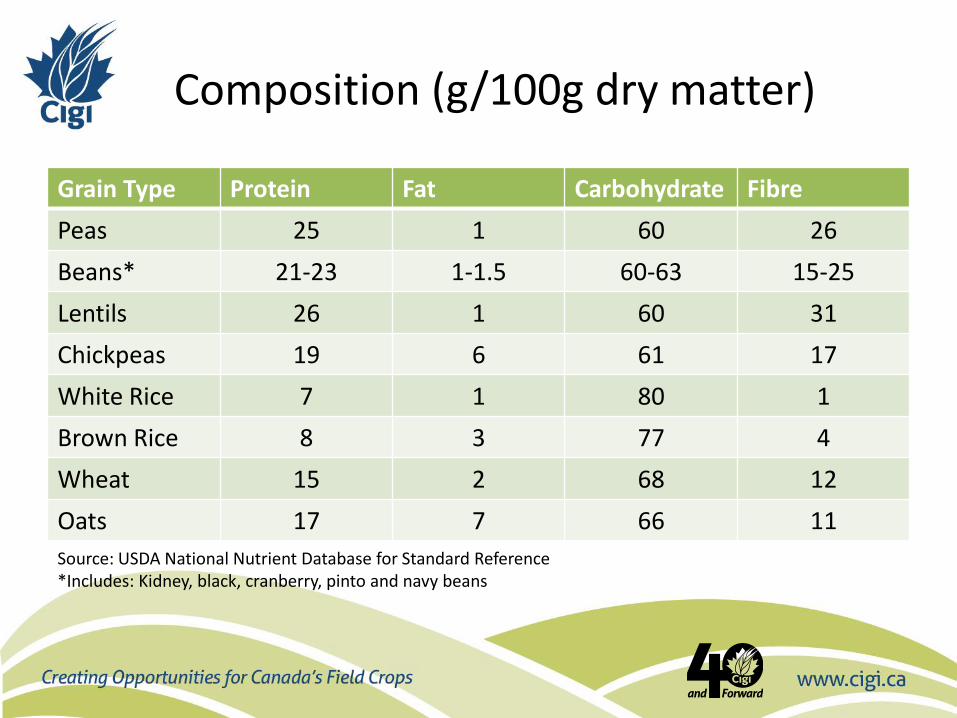
Composition (g/100g dry matter)
Grain Type Protein Fat Carbohydrate Fibre
Peas 25 1 60 26
Beans* 21-23 1-1.5 60-63 15-25
Lentils 26 1 60 31
Chickpeas 19 6 61 17
White Rice 7 1 80 1
Brown Rice 8 3 77 4
Wheat 15 2 68 12
Oats 17 7 66 11
Source: USDA National Nutrient Database for Standard Reference *Includes: Kidney, black, cranberry, pinto and navy beans
Milling properties of various field crops
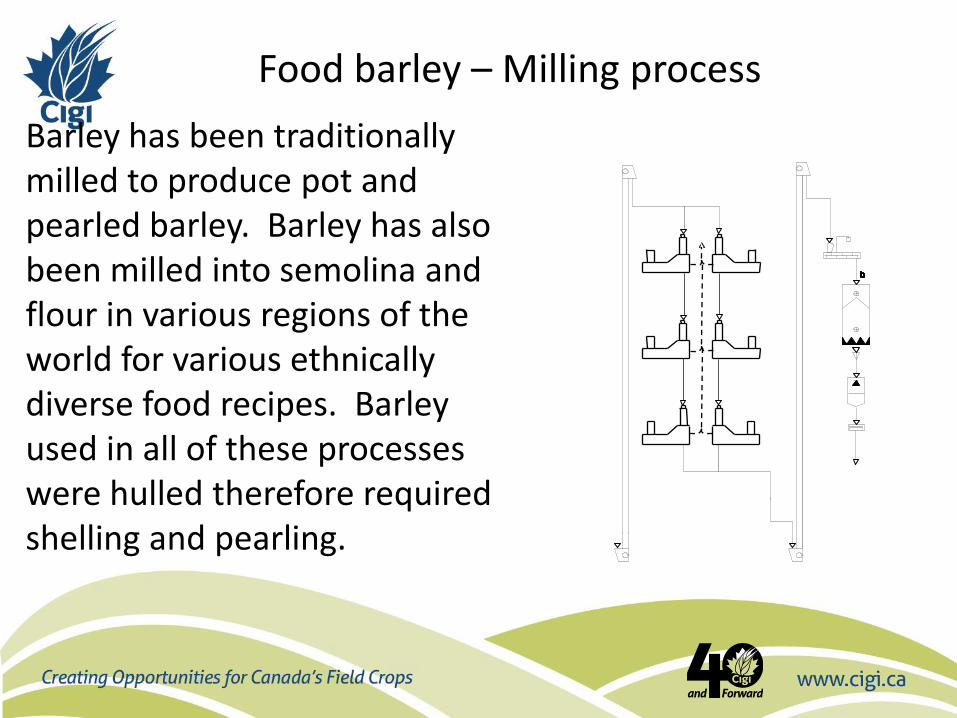
Food barley – Milling process
Barley has been traditionally milled to produce pot and pearled barley. Barley has also been milled into semolina and flour in various regions of the world for various ethnically diverse food recipes. Barley used in all of these processes were hulled therefore required shelling and pearling.
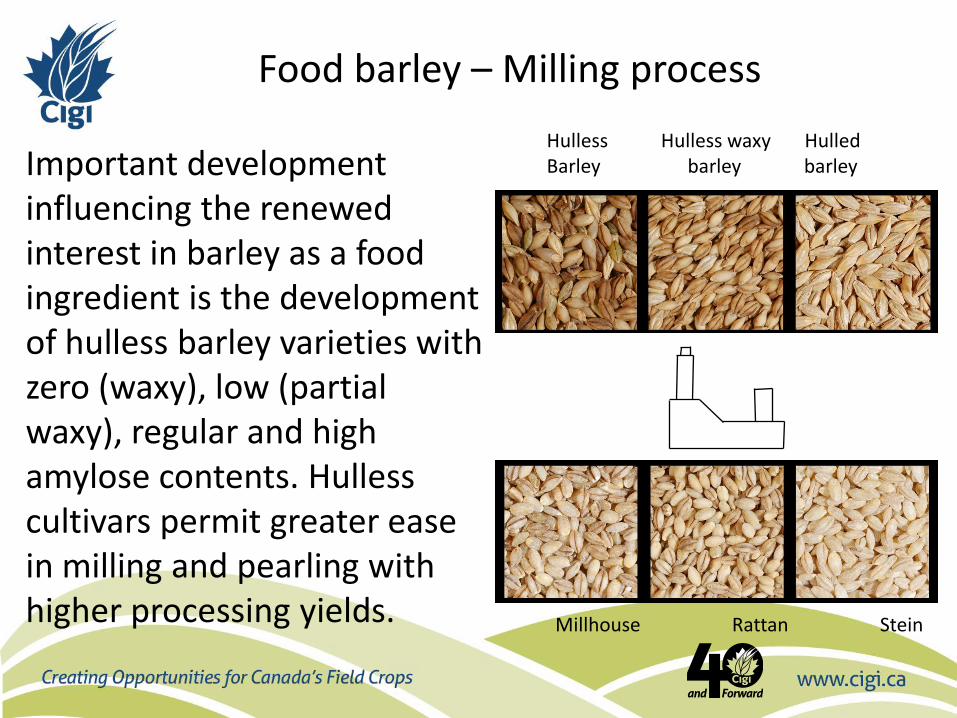
Important development influencing the renewed interest in barley as a food ingredient is the development of hulless barley varieties with zero (waxy), low (partial waxy), regular and high amylose contents. Hulless cultivars permit greater ease in milling and pearling with higher processing yields. Millhouse Rattan Stein
Hulless Hulless waxy Hulled Barley barley barley
Food barley – Milling process
Food barley – Milling process
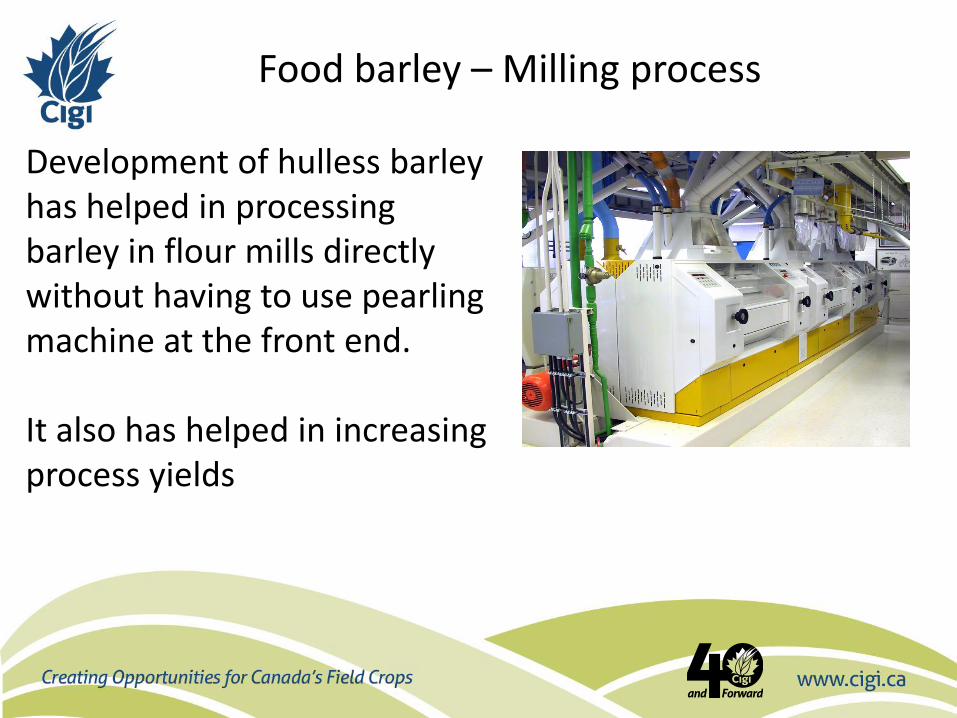
Development of hulless barley has helped in processing barley in flour mills directly without having to use pearling machine at the front end. It also has helped in increasing process yields
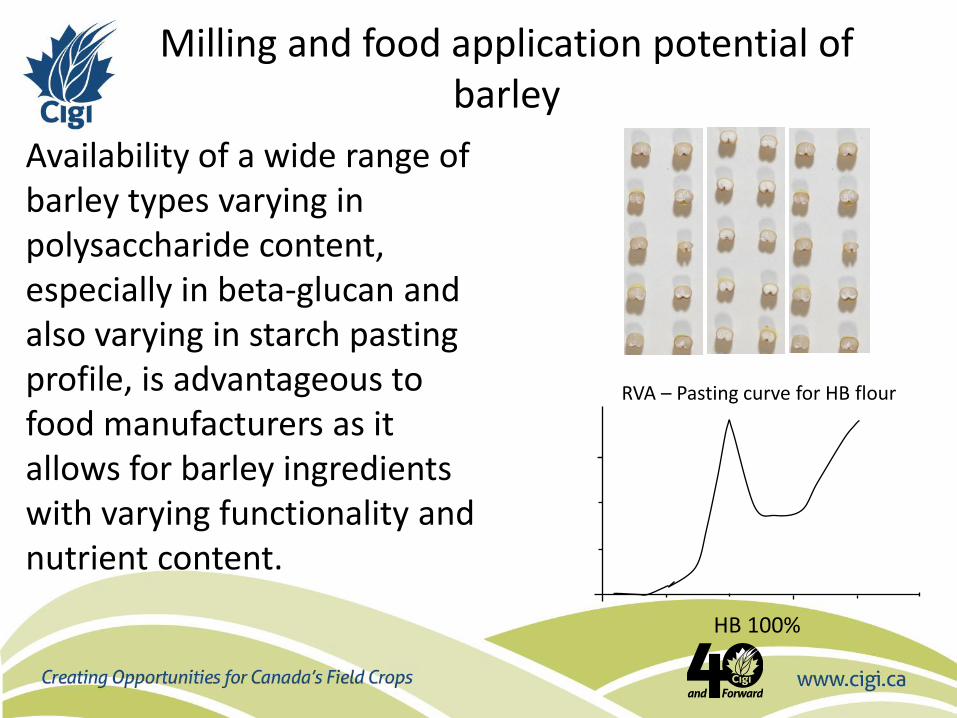
Availability of a wide range of barley types varying in polysaccharide content, especially in beta-glucan and also varying in starch pasting profile, is advantageous to food manufacturers as it allows for barley ingredients with varying functionality and nutrient content.
HB 100%
RVA – Pasting curve for HB flour
Milling and food application potential of barley
2 x 28 W
3 x 40 W
2 x 8 N
4 BK
FLOUR
2 M
P
3 x 45 W
2 x 8.5 N
4 x100 W
2 x 100 W
3 BK
2 x 26 W
1 x 40 W
2 x 45/50
2 x 50 W
1 x 60 W
2 x100W
4 x100W
B D
S D
FLOUR
5 M T
4 BK
SHORTS
0.60
0.75
S D
B D
BRAN
T
T
T
P
4 BK
1M
2Q 2Q
2 BK
SIFTER
40 38 36 34
44 42 38 36
50 46 42 38 4 x 100 W FLOUR
3 BK
P 2 M
FLOUR
5M 2 x 50 W
1 x 80 W
1 X 90 W
3 x 8.5 N
MF
LG
FLOUR MF
LG 1 x 90 W
4 x 100 W
1 X 10N
FLOUR
T
5M
2 x 45 W
2 x 90 W
4 x 100 W
MF
T
5M FLOUR
GERM
GGERM
2 x 18 W
2 x 90 W
3 x 12 N
2 x 12 N
2Q 1 BK
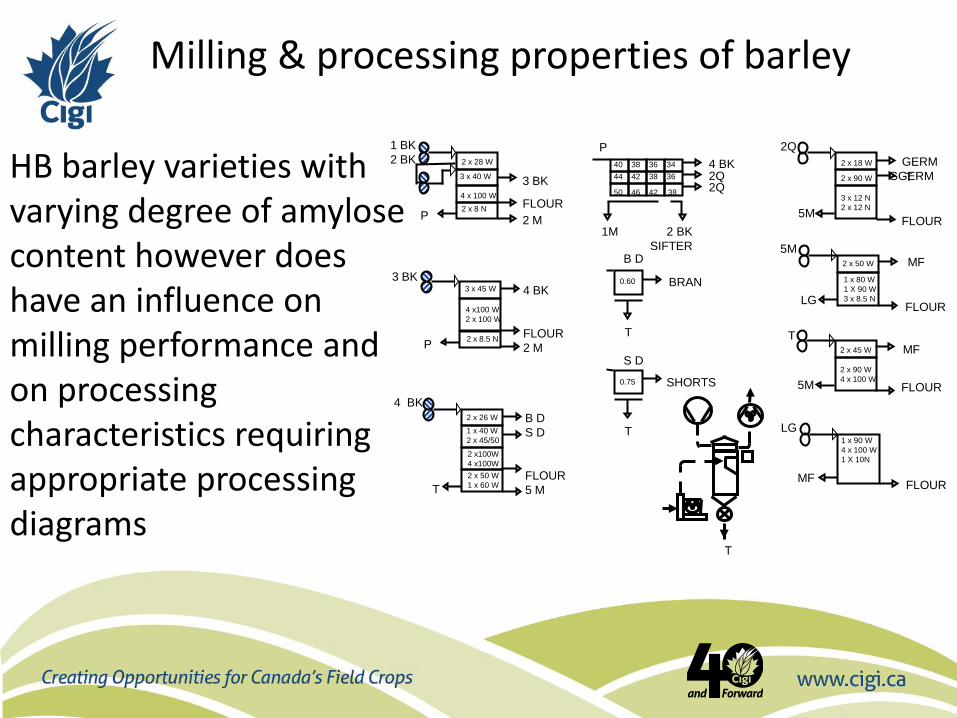
2 BK HB barley varieties with varying degree of amylose content however does have an influence on milling performance and on processing characteristics requiring appropriate processing diagrams
Milling & processing properties of barley
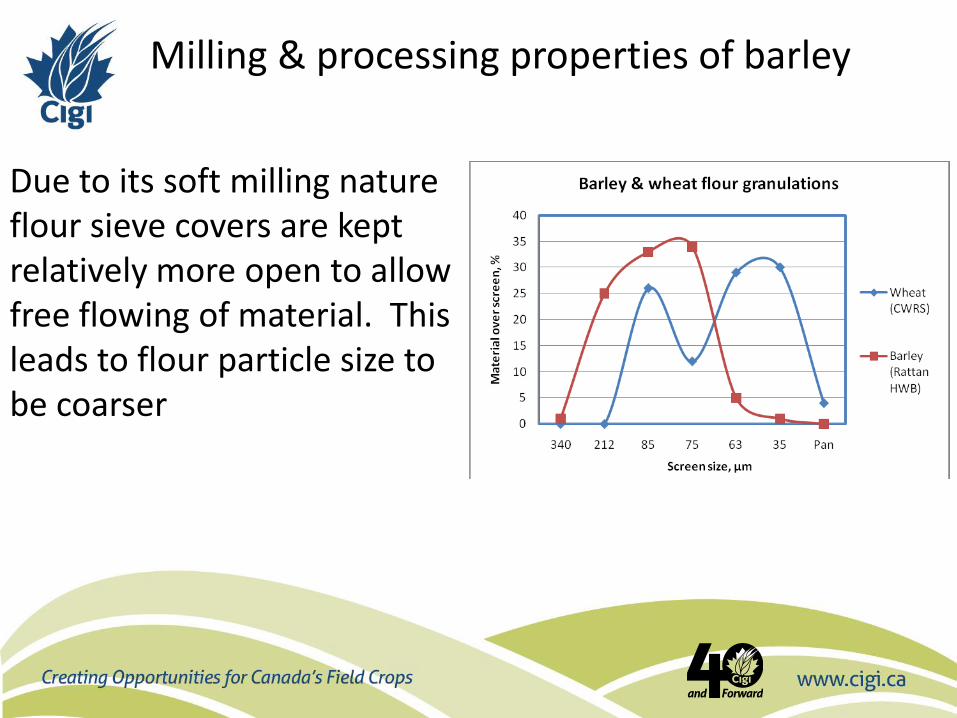
Due to its soft milling nature flour sieve covers are kept relatively more open to allow free flowing of material. This leads to flour particle size to be coarser
Milling & processing properties of barley
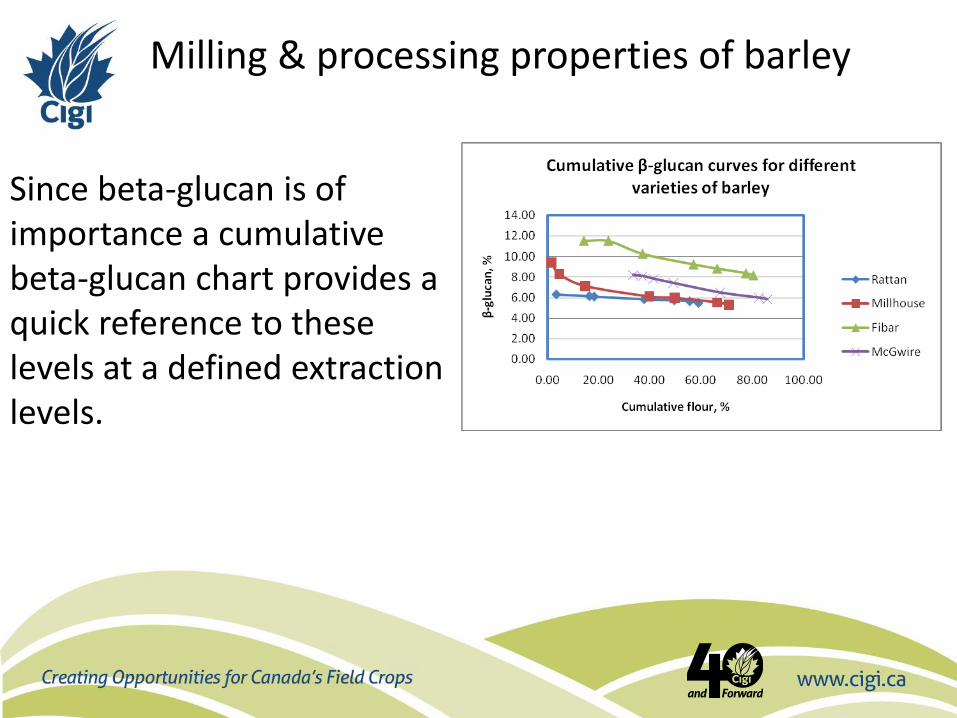
Since beta-glucan is of importance a cumulative beta-glucan chart provides a quick reference to these levels at a defined extraction levels.
Milling & processing properties of barley
Milling wheat and barley blend
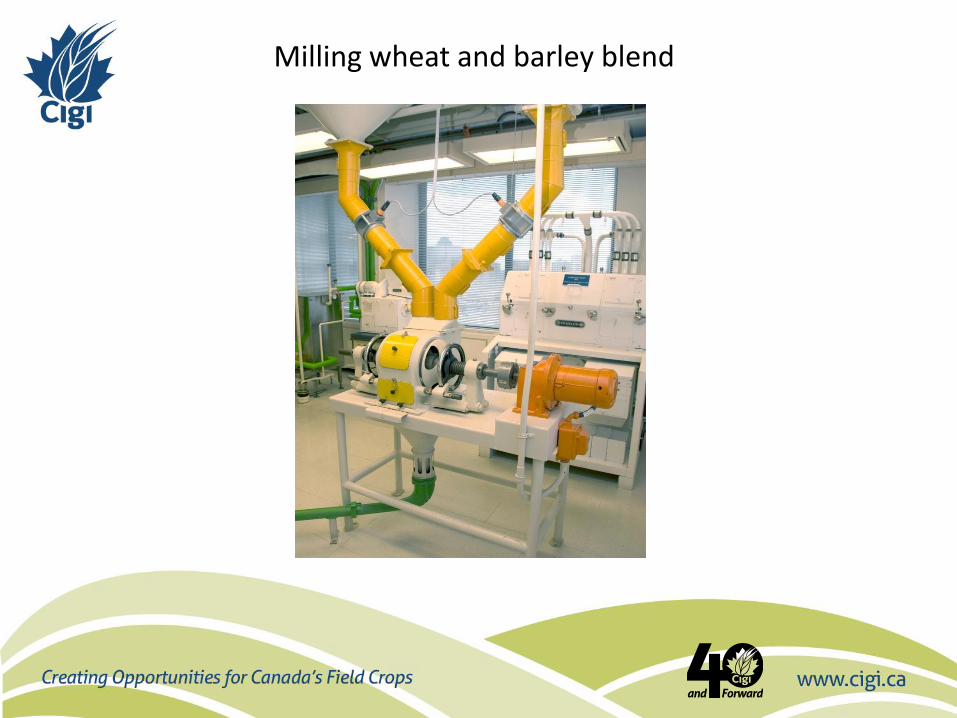
Milling wheat and barley blend
Pulses – Milling process
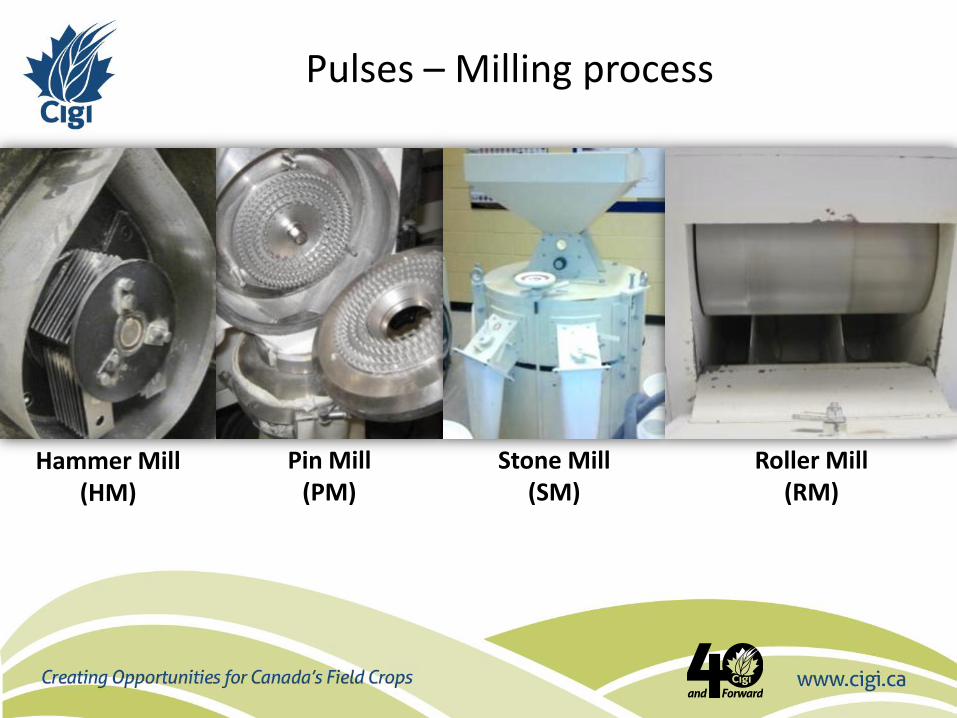
Pulses – Milling process
Hammer Mill (HM)
Pin Mill (PM)
Stone Mill (SM)
Roller Mill (RM)
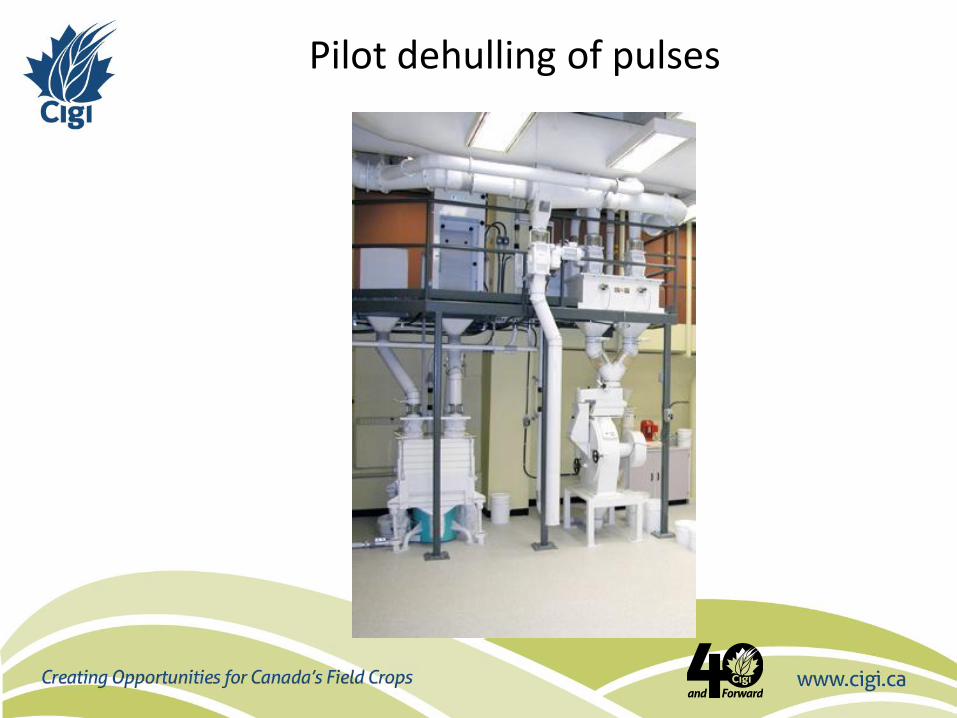
Pilot dehulling of pulses
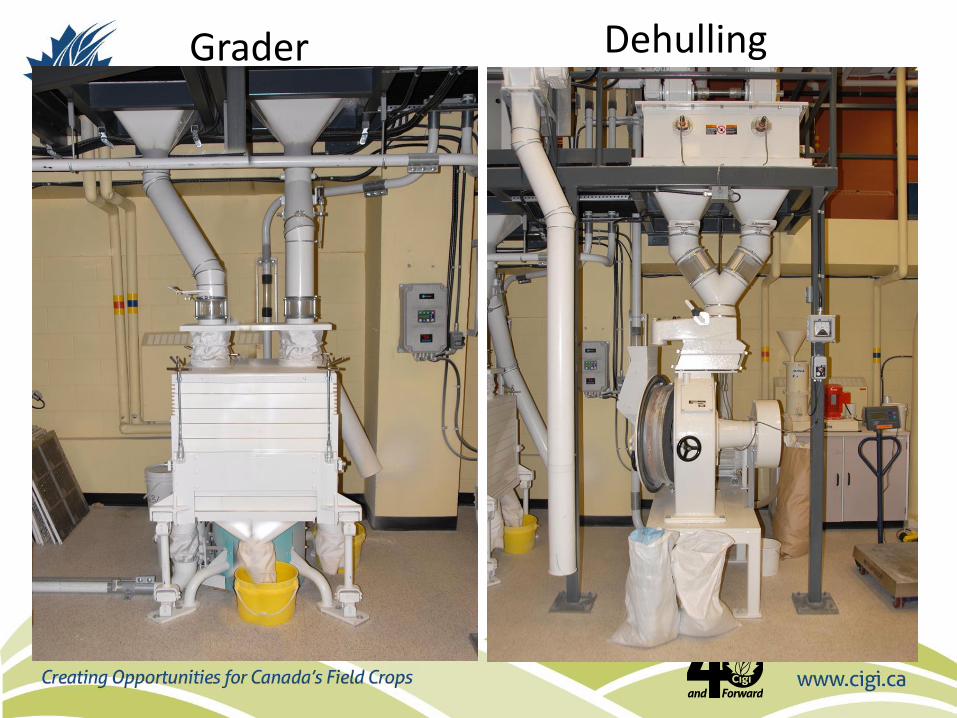
Dehulling Grader
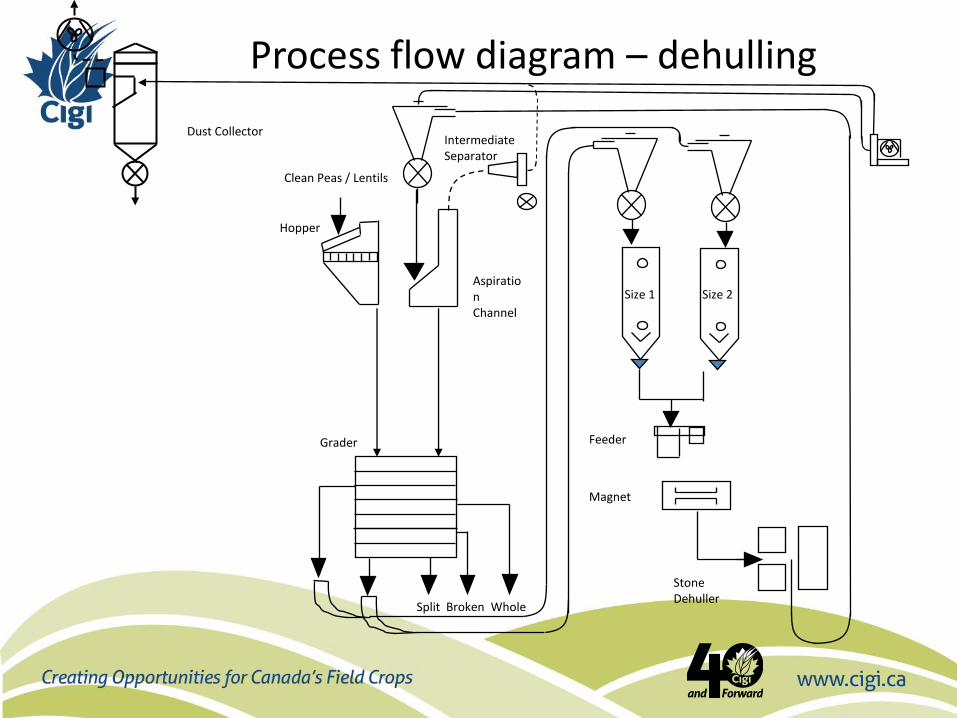
Split Broken Whole
Grader
Aspiration Channel
Hopper
Dust Collector Intermediate Separator
Size 1 Size 2
Feeder
Magnet
Stone Dehuller
Clean Peas / Lentils
Process flow diagram – dehulling
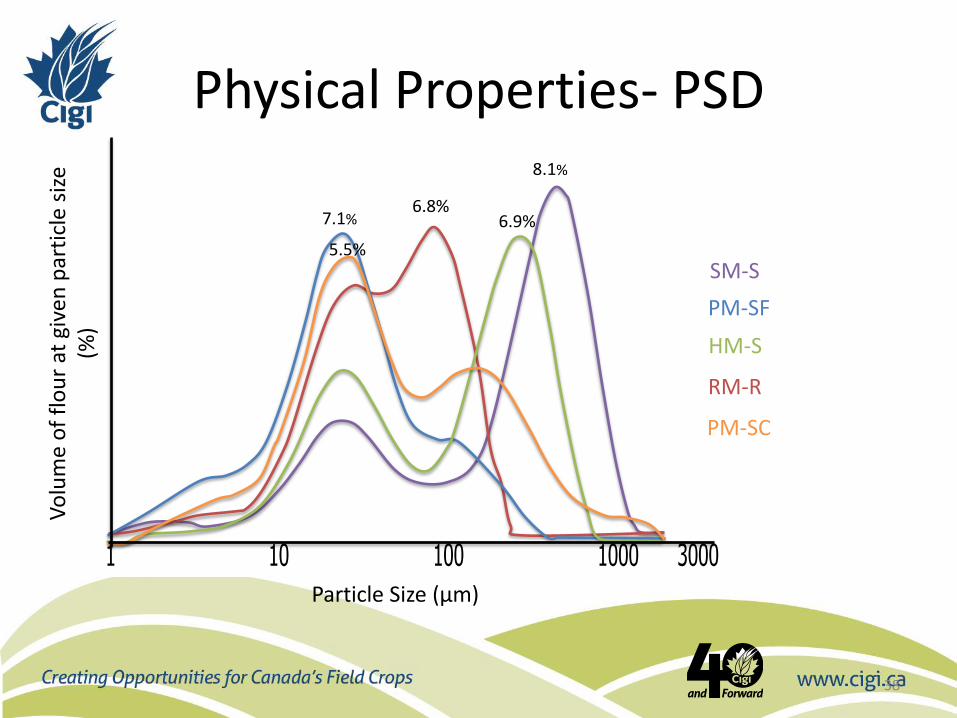
Physical Properties- PSD
38
Particle Size Distribution
0.1 1 10 100 1000 3000
Particle Size (µm)
0
1
2
3
4
5
6
7
8
Volu
me (
%)
SC074-12 - Average, Thursday, April 19, 2012 9:11:18 AM
SM-S
8.1%
RM-R
6.8%
PM-SF
7.1%
HM-S
6.9%
PM-SC
5.5%
Particle Size (µm)
Vo
lum
e o
f fl
ou
r at
giv
en p
arti
cle
size
(%
)
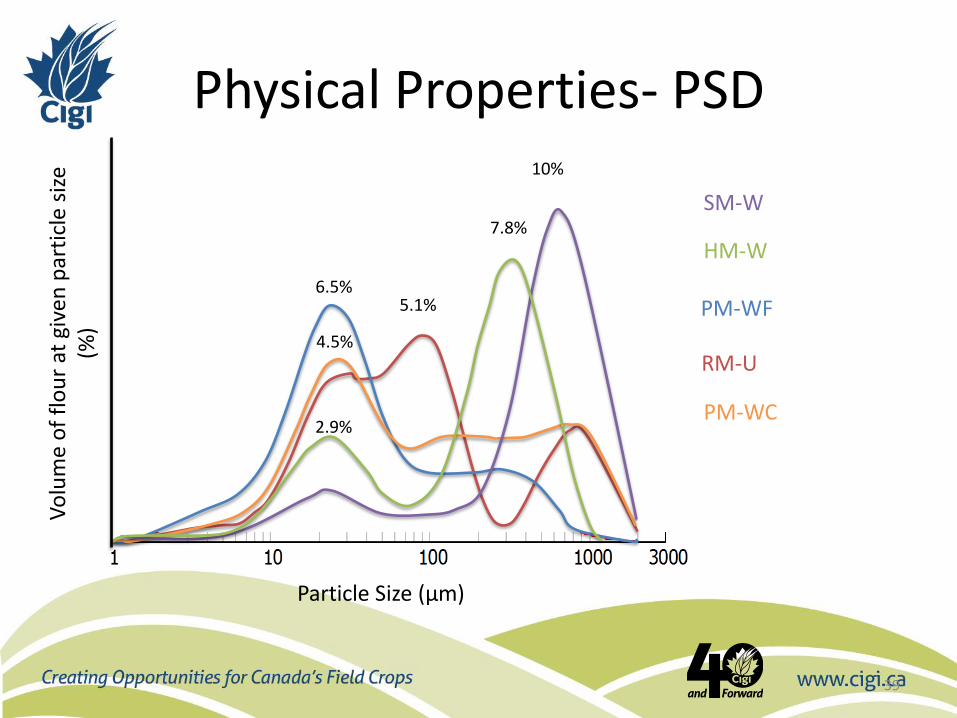
Physical Properties- PSD
39
RM-U
5.1% PM-WF 6.5%
PM-WC
4.5%
10%
SM-W
HM-W 7.8%
2.9%
Particle Size (µm)
Vo
lum
e o
f fl
ou
r at
giv
en p
arti
cle
size
(%
)
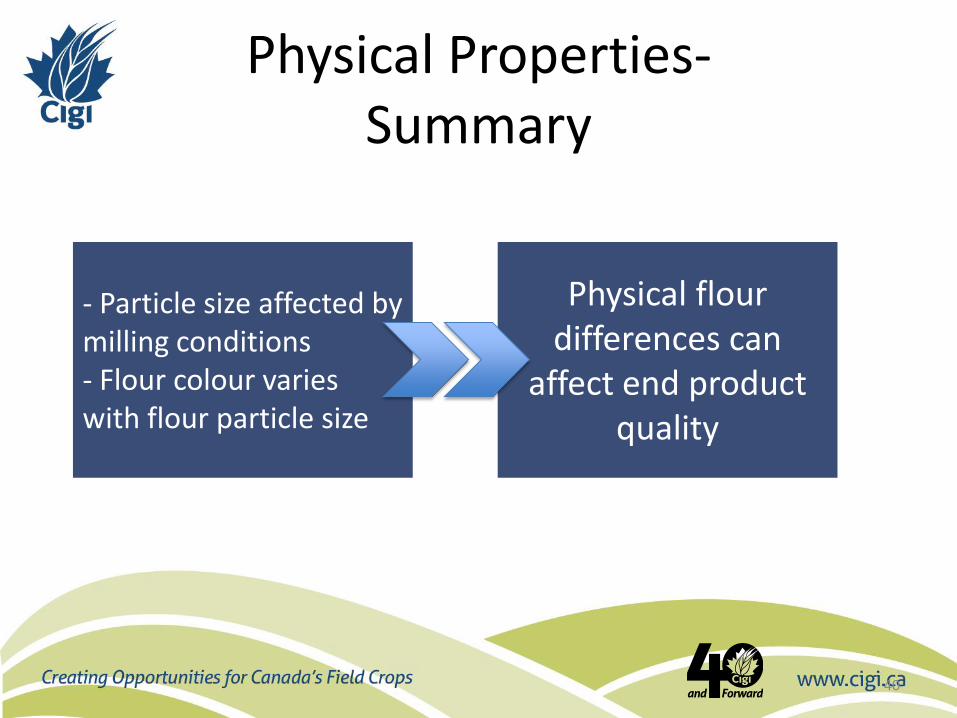
Physical Properties- Summary
40
- Particle size affected by milling conditions - Flour colour varies with flour particle size
Physical flour differences can
affect end product quality
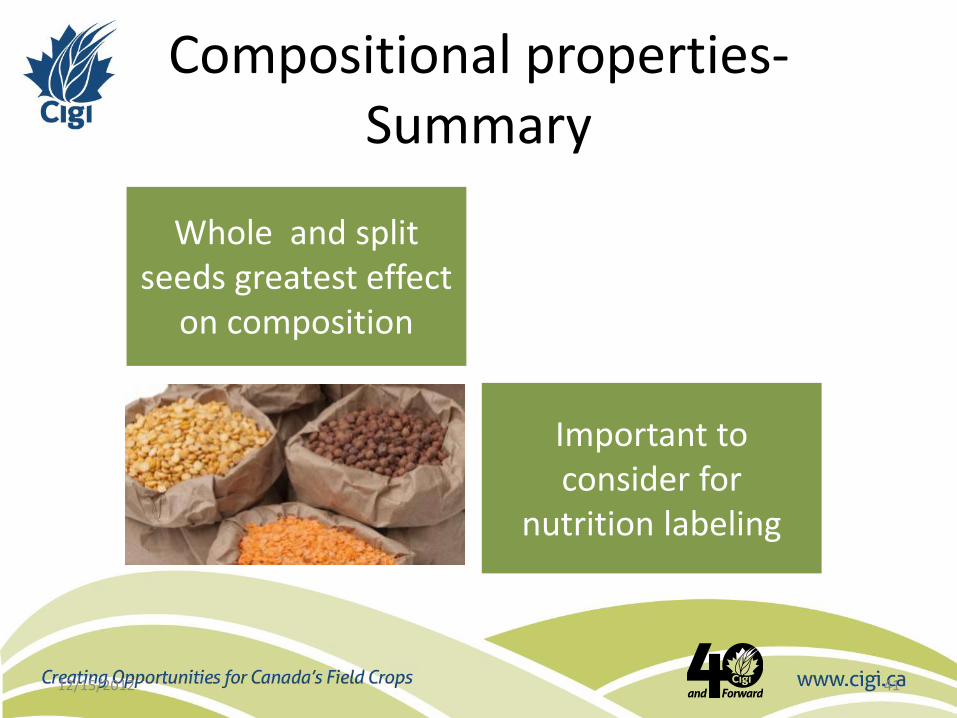
Compositional properties- Summary
12/15/2012 41
Whole and split seeds greatest effect
on composition
Important to consider for
nutrition labeling
Functional properties of various field crops
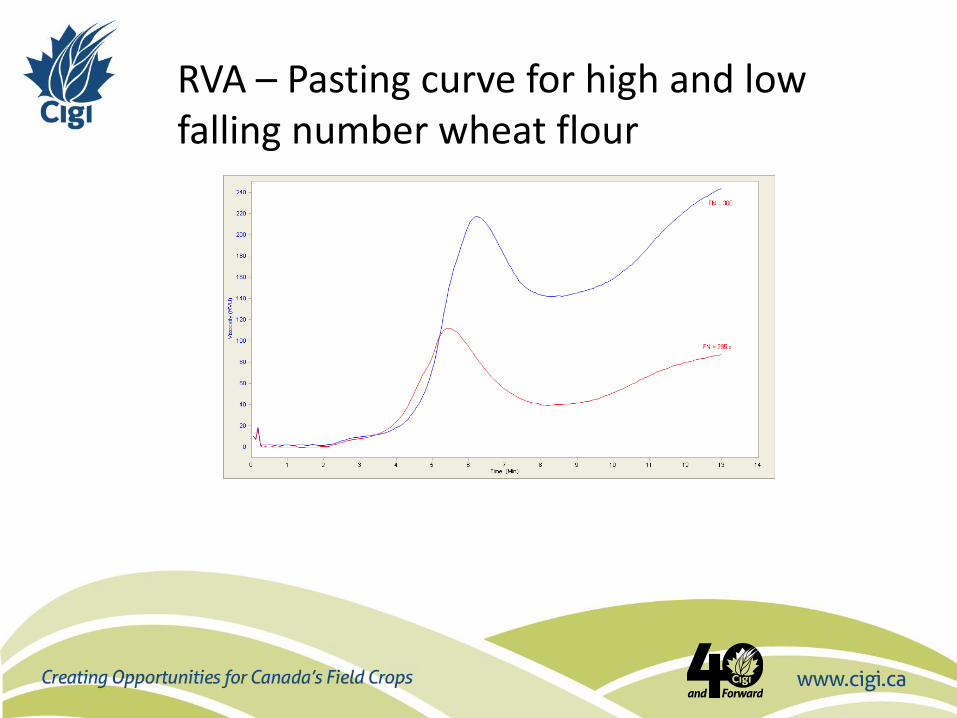
RVA – Pasting curve for high and low falling number wheat flour
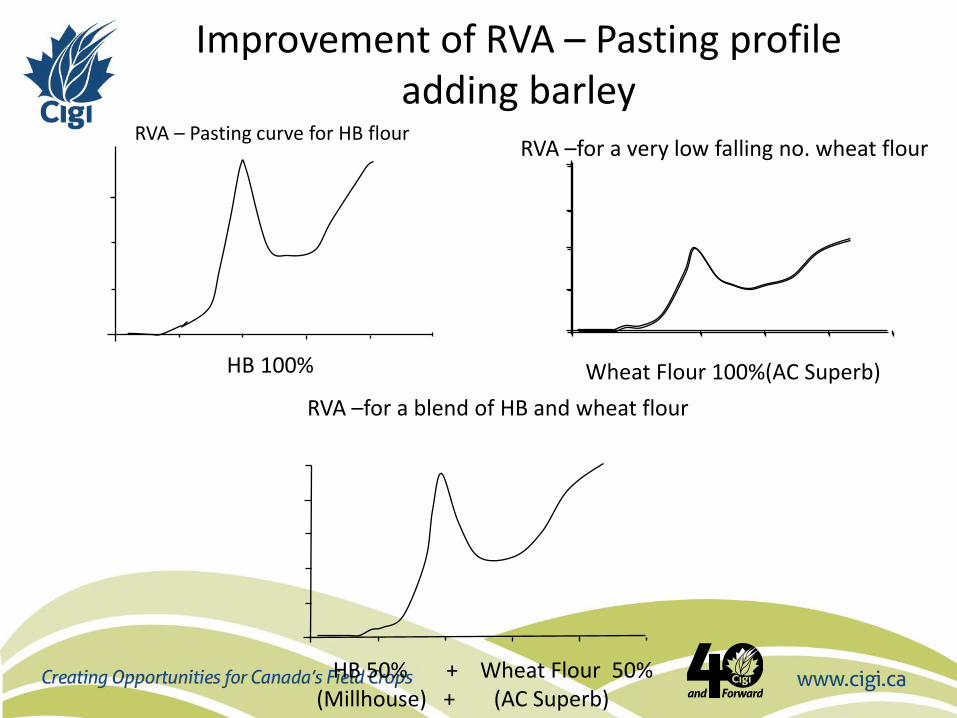
Wheat Flour 100%(AC Superb) HB 100%
RVA – Pasting curve for HB flour RVA –for a very low falling no. wheat flour
HB 50% + Wheat Flour 50% (Millhouse) + (AC Superb)
RVA –for a blend of HB and wheat flour
Improvement of RVA – Pasting profile adding barley
45
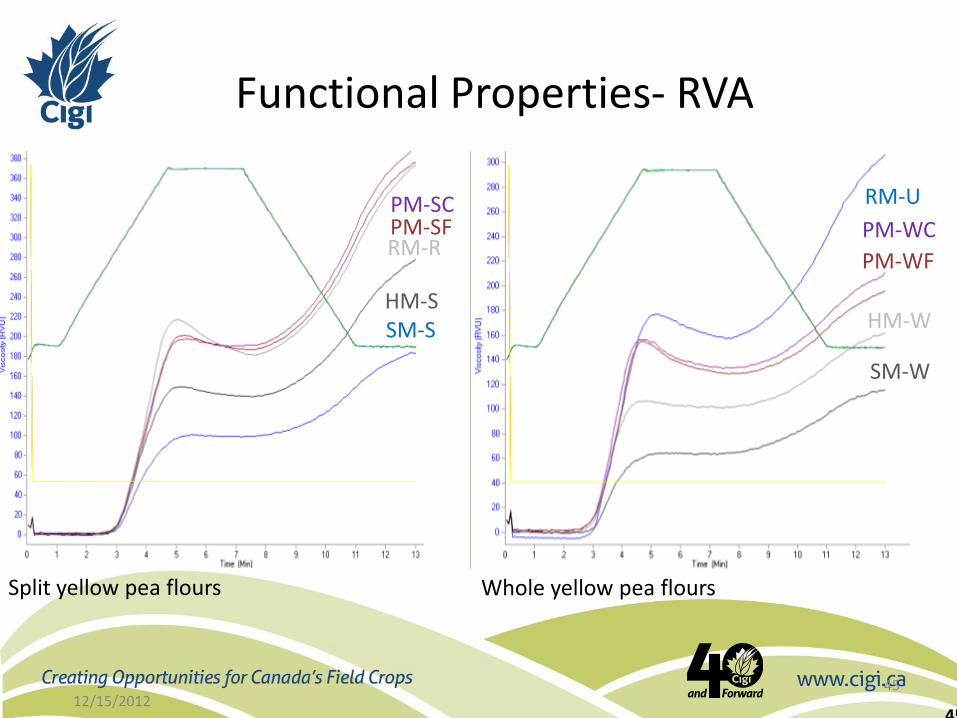
Functional Properties- RVA
12/15/2012 45
PM-SF
SM-S HM-S
PM-SC
RM-R
RM-U
PM-WC
PM-WF
HM-W
SM-W
Split yellow pea flours Whole yellow pea flours
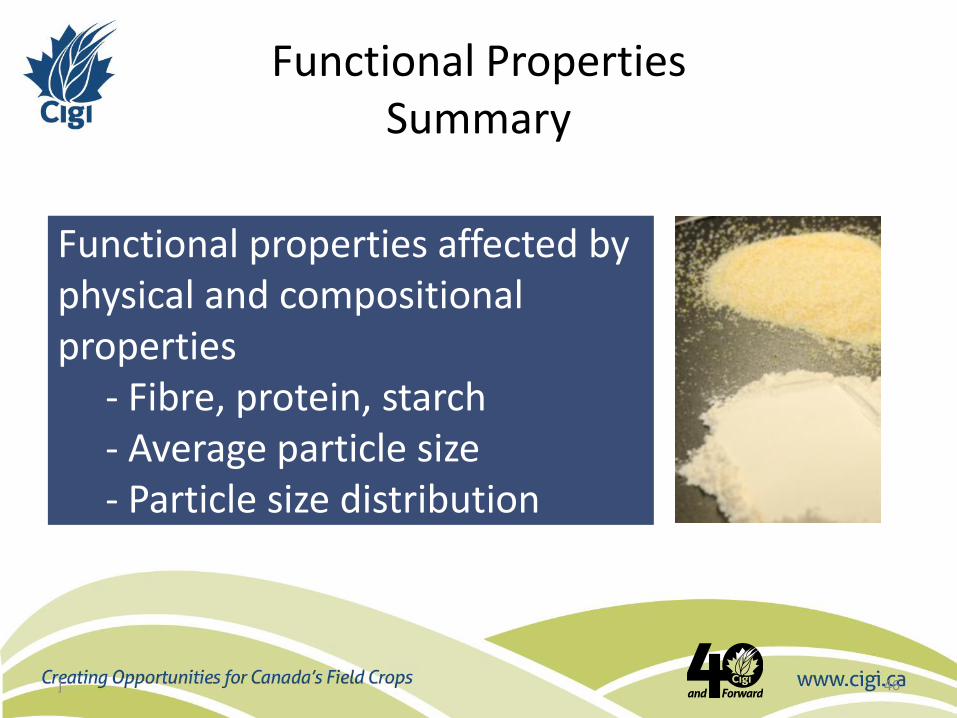
Functional Properties Summary
] 46
Functional properties affected by physical and compositional properties
- Fibre, protein, starch - Average particle size - Particle size distribution
End Product Evaluation
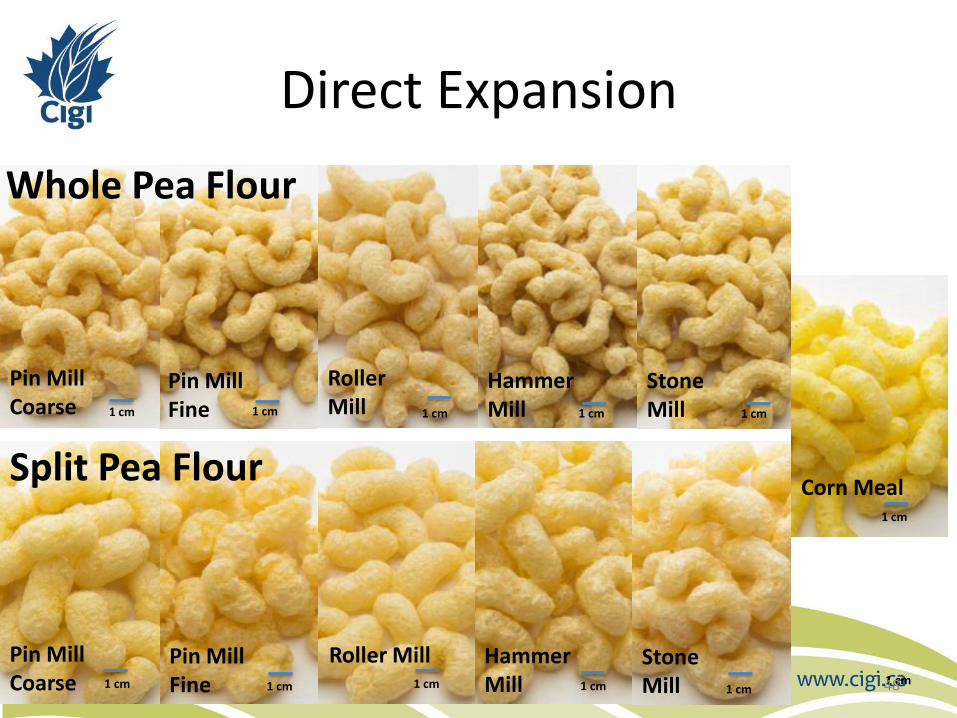
Hammer Mill
Pin Mill Fine
Pin Mill Coarse
Split Pea Flour
Stone Mill
Roller Mill
Corn Meal
1 cm 1 cm 1 cm 1 cm 1 cm 1 cm 48
Pin Mill Fine 1 cm
Pin Mill Coarse 1 cm
Hammer Mill 1 cm
Stone Mill 1 cm
Roller Mill 1 cm
Direct Expansion
Whole Pea Flour
1 cm
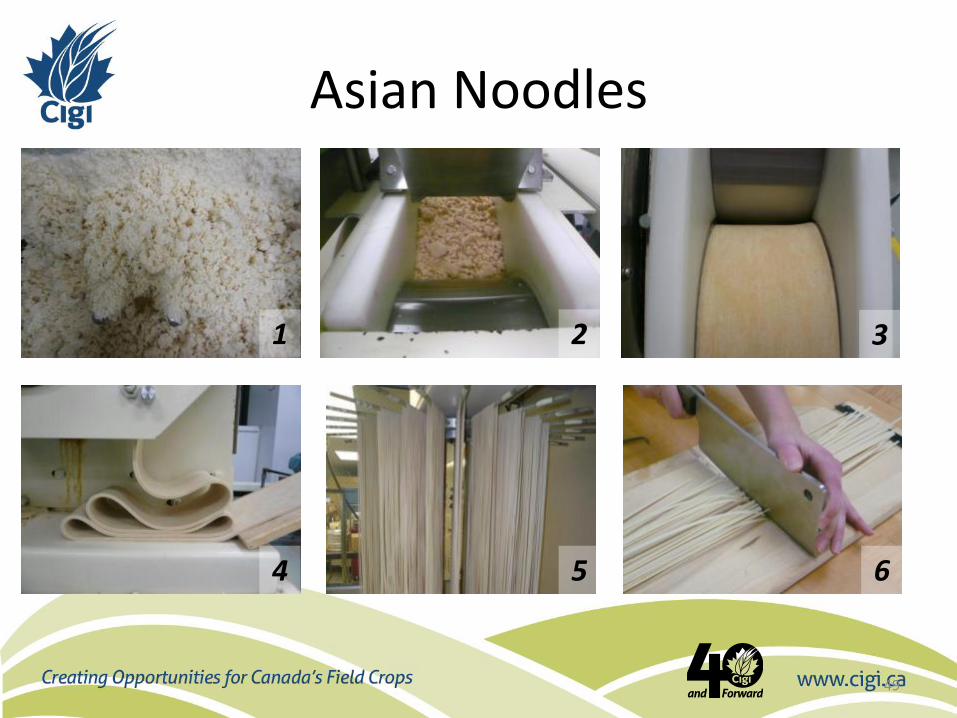
Asian Noodles
1 2 3
4 5 6
49
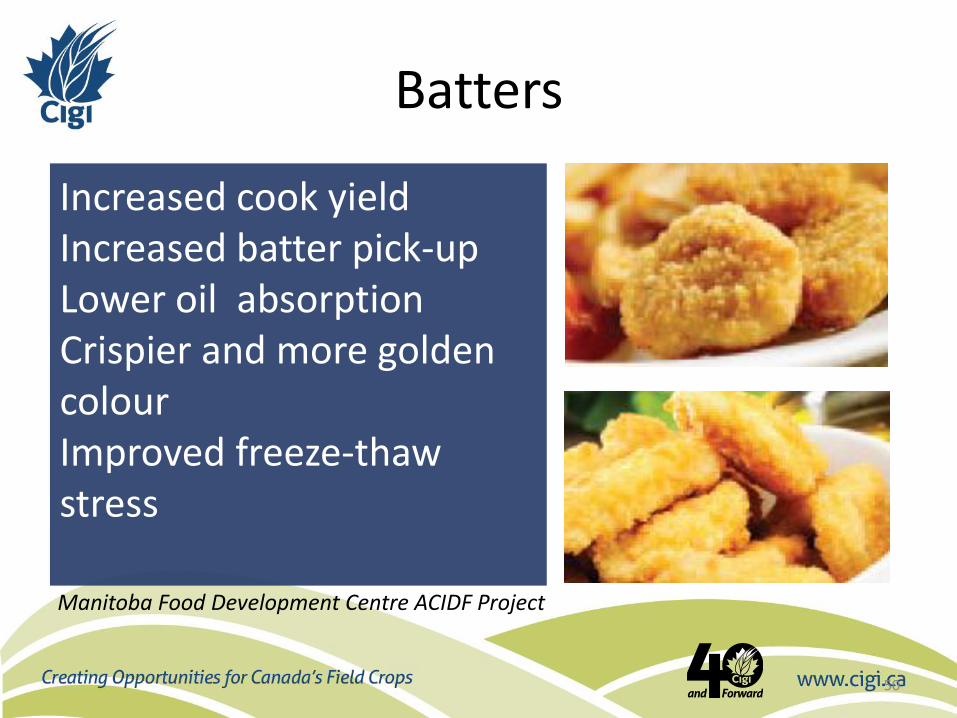
Batters
50
Increased cook yield Increased batter pick-up Lower oil absorption Crispier and more golden colour Improved freeze-thaw stress Manitoba Food Development Centre ACIDF Project
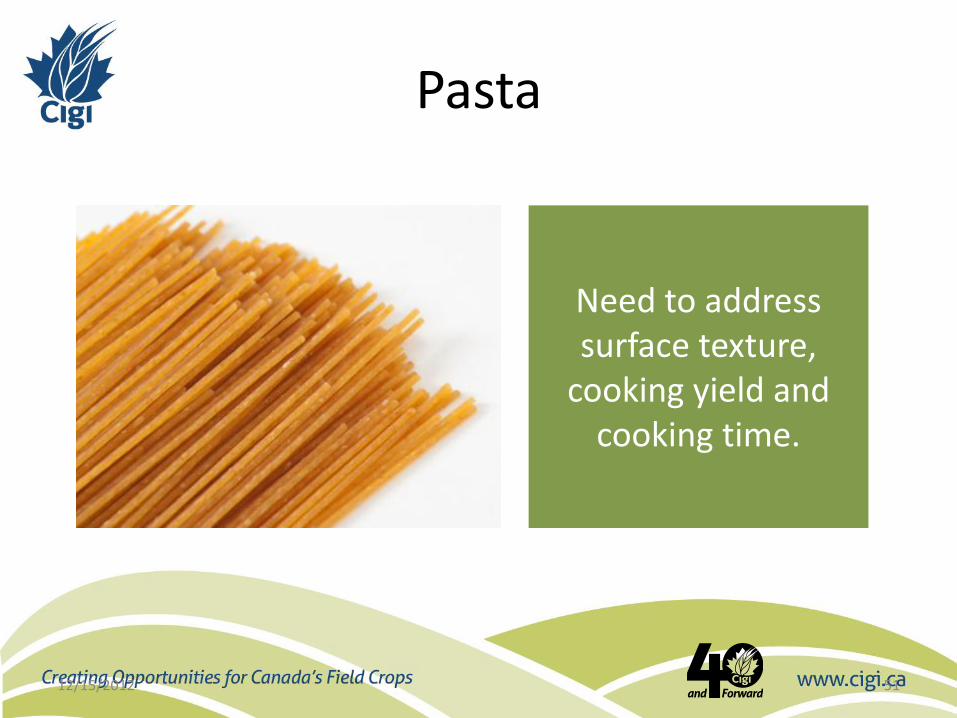
Pasta
12/15/2012 51
Need to address surface texture,
cooking yield and cooking time.
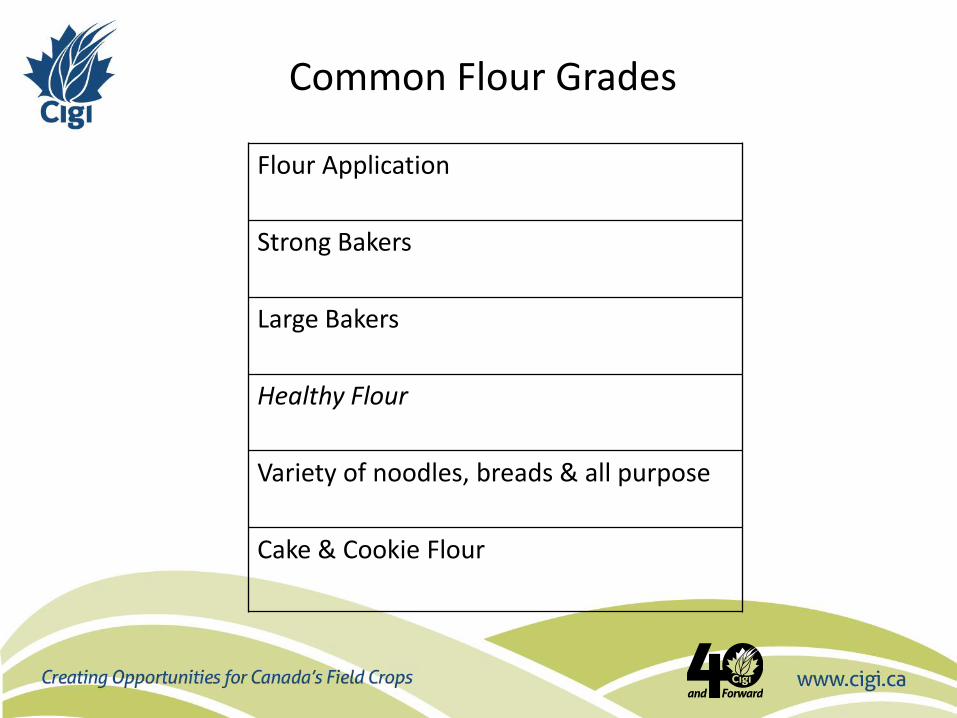
Flour Application
Strong Bakers
Large Bakers
Healthy Flour
Variety of noodles, breads & all purpose
Cake & Cookie Flour
Common Flour Grades
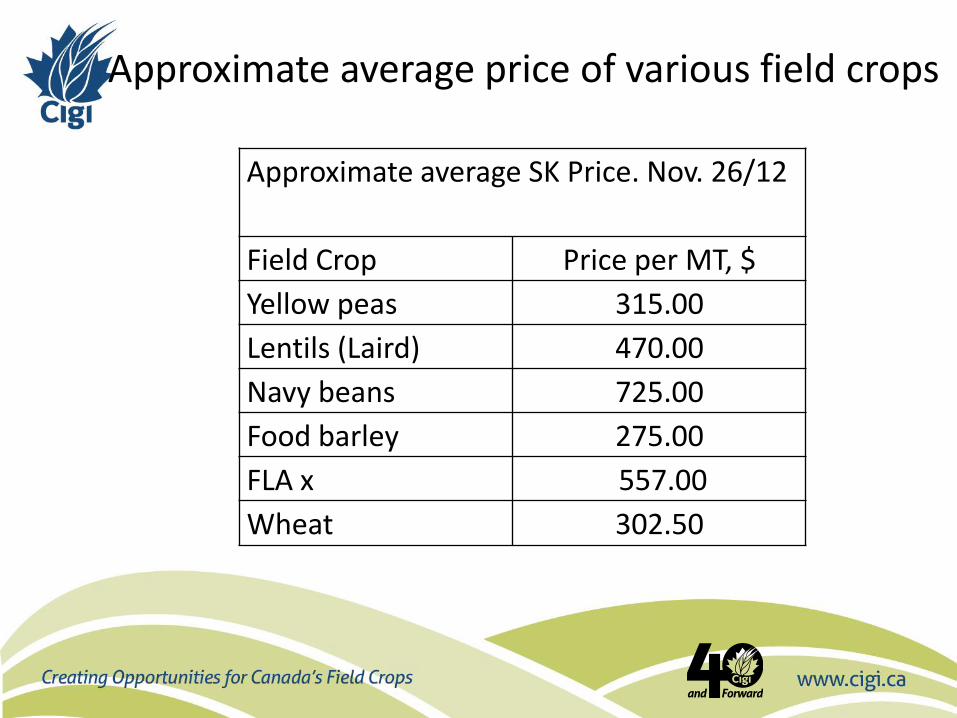
Approximate average SK Price. Nov. 26/12
Field Crop Price per MT, $
Yellow peas 315.00
Lentils (Laird) 470.00
Navy beans 725.00
Food barley 275.00
FLA x 557.00
Wheat 302.50
Approximate average price of various field crops
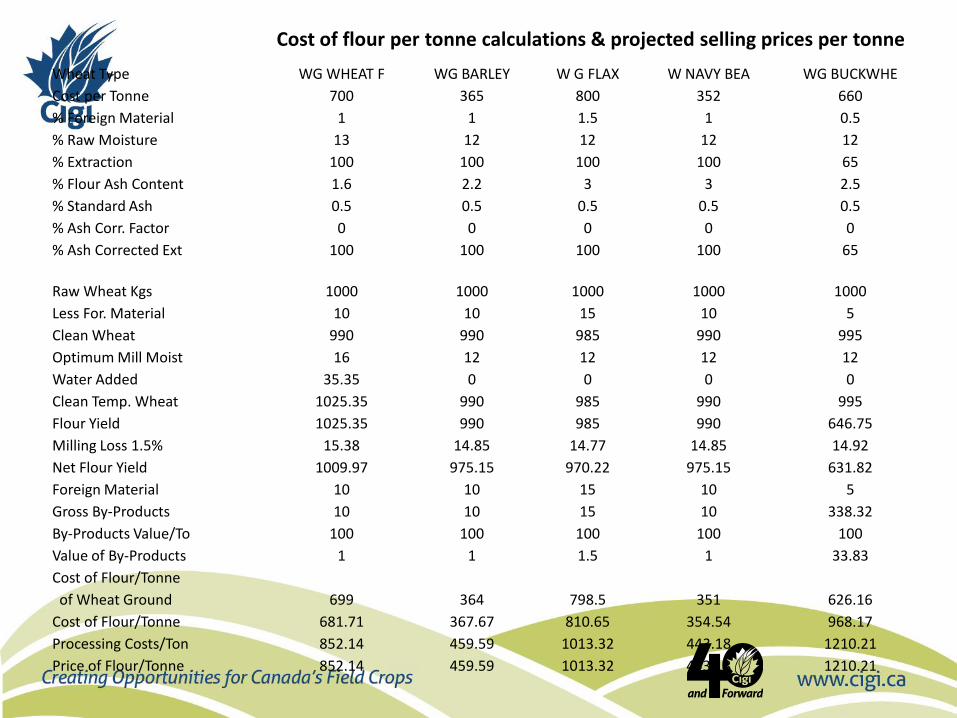
Cost of flour per tonne calculations & projected selling prices per tonne
Wheat Type WG WHEAT F WG BARLEY W G FLAX W NAVY BEA WG BUCKWHE
Cost per Tonne 700 365 800 352 660
% Foreign Material 1 1 1.5 1 0.5
% Raw Moisture 13 12 12 12 12
% Extraction 100 100 100 100 65
% Flour Ash Content 1.6 2.2 3 3 2.5
% Standard Ash 0.5 0.5 0.5 0.5 0.5
% Ash Corr. Factor 0 0 0 0 0
% Ash Corrected Ext 100 100 100 100 65
Raw Wheat Kgs 1000 1000 1000 1000 1000
Less For. Material 10 10 15 10 5
Clean Wheat 990 990 985 990 995
Optimum Mill Moist 16 12 12 12 12
Water Added 35.35 0 0 0 0
Clean Temp. Wheat 1025.35 990 985 990 995
Flour Yield 1025.35 990 985 990 646.75
Milling Loss 1.5% 15.38 14.85 14.77 14.85 14.92
Net Flour Yield 1009.97 975.15 970.22 975.15 631.82
Foreign Material 10 10 15 10 5
Gross By-Products 10 10 15 10 338.32
By-Products Value/To 100 100 100 100 100
Value of By-Products 1 1 1.5 1 33.83
Cost of Flour/Tonne
of Wheat Ground 699 364 798.5 351 626.16
Cost of Flour/Tonne 681.71 367.67 810.65 354.54 968.17
Processing Costs/Ton 852.14 459.59 1013.32 443.18 1210.21
Price of Flour/Tonne 852.14 459.59 1013.32 443.18 1210.21
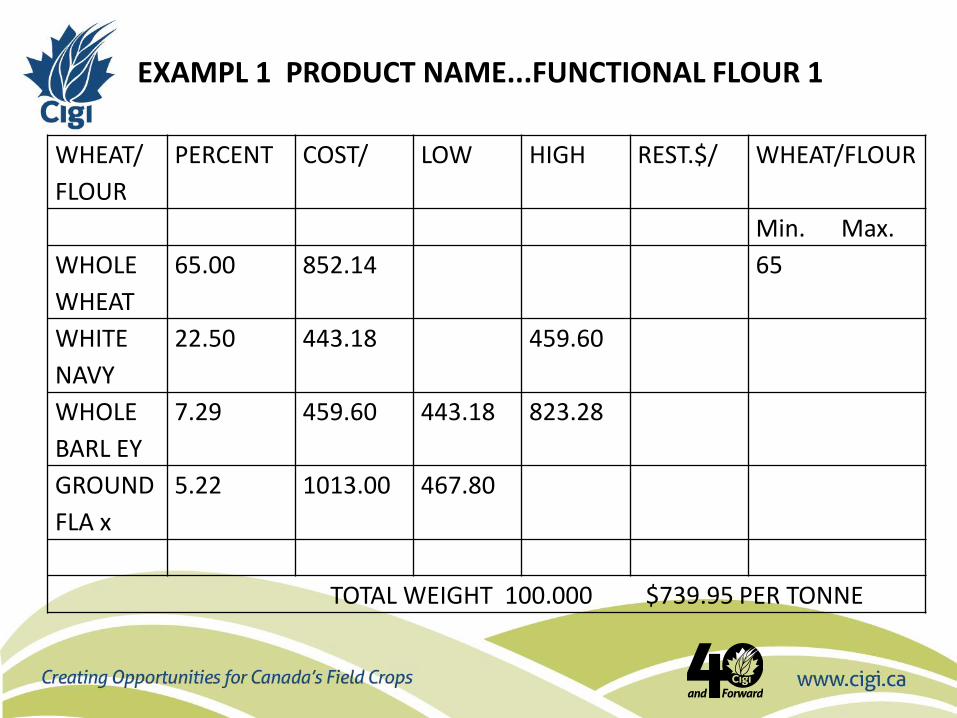
WHEAT/
FLOUR
PERCENT COST/ LOW HIGH REST.$/ WHEAT/FLOUR
Min. Max.
WHOLE
WHEAT
65.00 852.14 65
WHITE
NAVY
22.50 443.18 459.60
WHOLE
BARL EY
7.29 459.60 443.18 823.28
GROUND
FLA x
5.22 1013.00 467.80
TOTAL WEIGHT 100.000 $739.95 PER TONNE
EXAMPL 1 PRODUCT NAME...FUNCTIONAL FLOUR 1
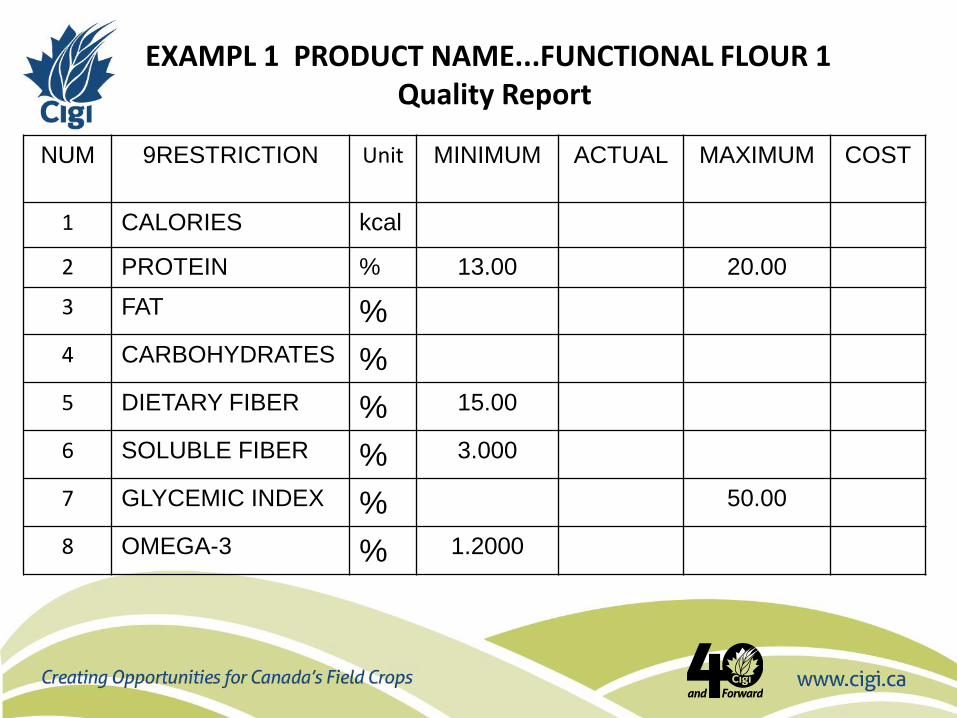
NUM 9RESTRICTION Unit MINIMUM ACTUAL MAXIMUM COST
1 CALORIES kcal
2 PROTEIN % 13.00 20.00
3 FAT %
4 CARBOHYDRATES %
5 DIETARY FIBER % 15.00
6 SOLUBLE FIBER % 3.000
7 GLYCEMIC INDEX % 50.00
8 OMEGA-3 % 1.2000
EXAMPL 1 PRODUCT NAME...FUNCTIONAL FLOUR 1 Quality Report
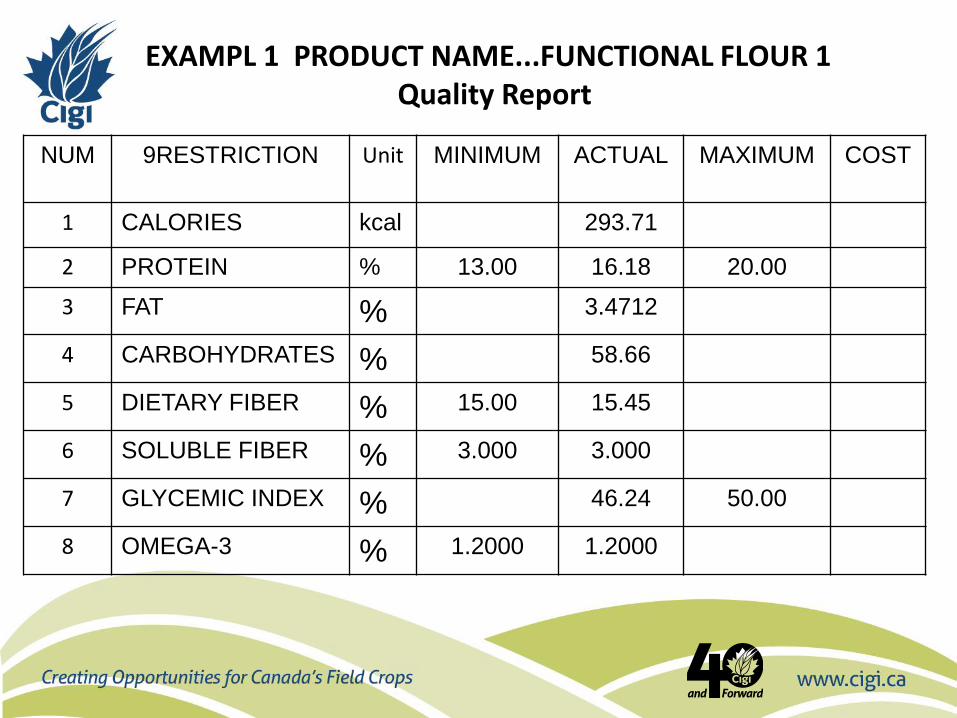
NUM 9RESTRICTION Unit MINIMUM ACTUAL MAXIMUM COST
1 CALORIES kcal 293.71
2 PROTEIN % 13.00 16.18 20.00
3 FAT % 3.4712
4 CARBOHYDRATES % 58.66
5 DIETARY FIBER % 15.00 15.45
6 SOLUBLE FIBER % 3.000 3.000
7 GLYCEMIC INDEX % 46.24 50.00
8 OMEGA-3 % 1.2000 1.2000
EXAMPL 1 PRODUCT NAME...FUNCTIONAL FLOUR 1 Quality Report
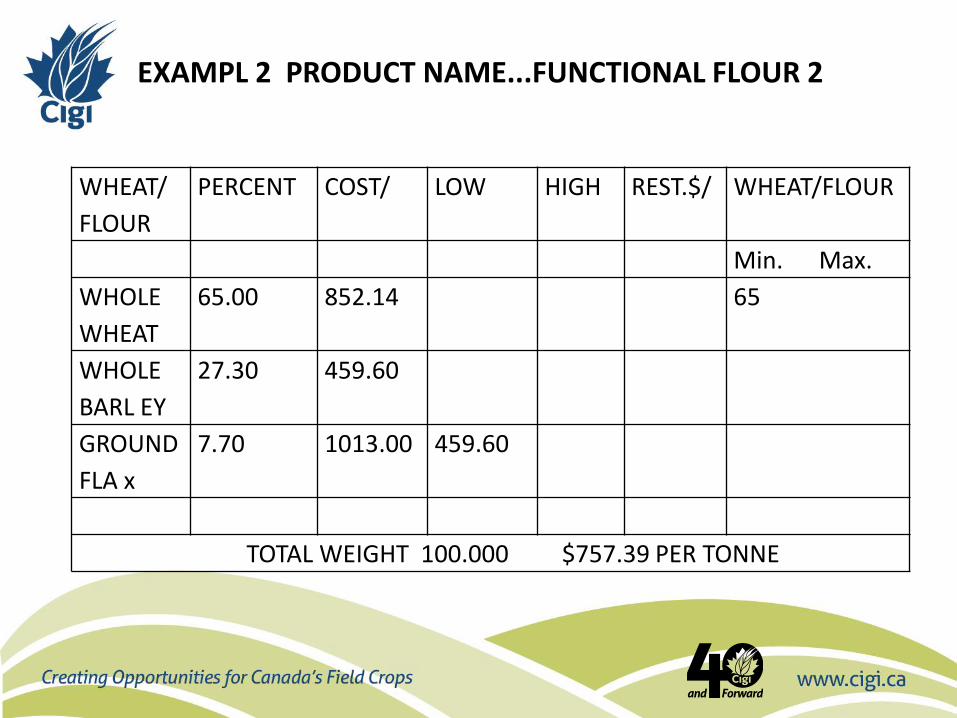
WHEAT/
FLOUR
PERCENT COST/ LOW HIGH REST.$/ WHEAT/FLOUR
Min. Max.
WHOLE
WHEAT
65.00 852.14 65
WHOLE
BARL EY
27.30 459.60
GROUND
FLA x
7.70 1013.00 459.60
TOTAL WEIGHT 100.000 $757.39 PER TONNE
EXAMPL 2 PRODUCT NAME...FUNCTIONAL FLOUR 2
NUM 9RESTRICTION Unit MINIMUM ACTUAL MAXIMUM COST
1 CALORIES kcal
2 PROTEIN % 13.00 20.00
3 FAT %
4 CARBOHYDRATES %
5 DIETARY FIBER % 15.00
6 SOLUBLE FIBER % 3.000
7 GLYCEMIC INDEX % 50.00
8 OMEGA-3 % 1.2000
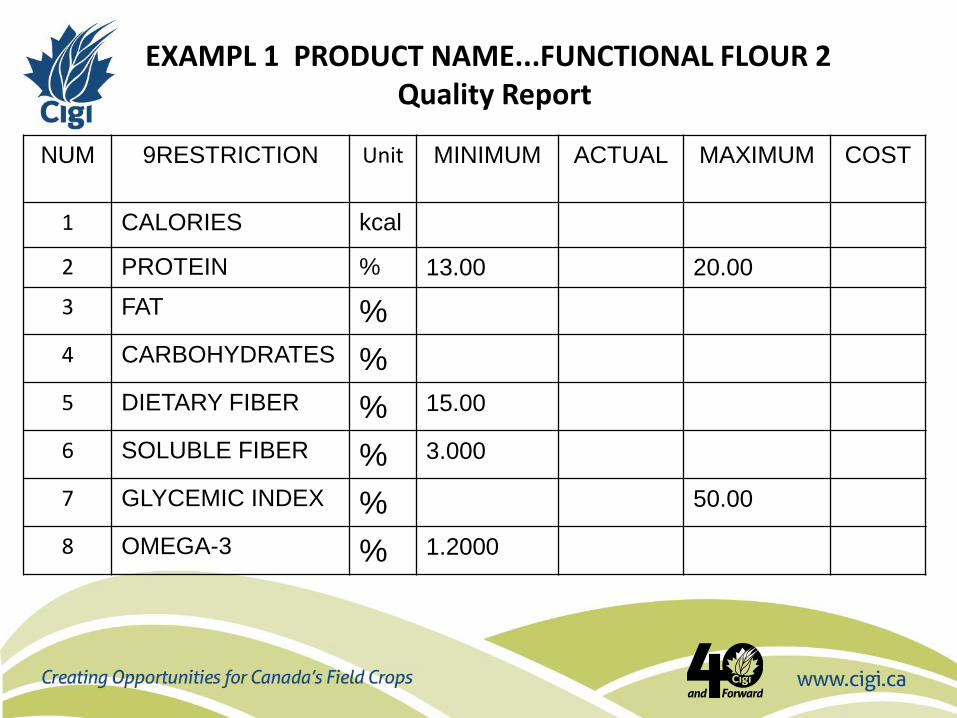
EXAMPL 1 PRODUCT NAME...FUNCTIONAL FLOUR 2 Quality Report

NUM 9RESTRICTION Unit MINIMUM ACTUAL MAXIMUM COST
1 CALORIES kcal 349.19
2 PROTEIN % 13.00 14.34 20.00
3 FAT % 4.8093
4 CARBOHYDRATES % 69.82
5 DIETARY FIBER % 15.00 15.00
6 SOLUBLE FIBER % 3.000 3.9495
7 GLYCEMIC INDEX % 43.64 50.00
8 OMEGA-3 % 1.2000 1.7710
EXAMPL 1 PRODUCT NAME...FUNCTIONAL FLOUR 2 Quality Report
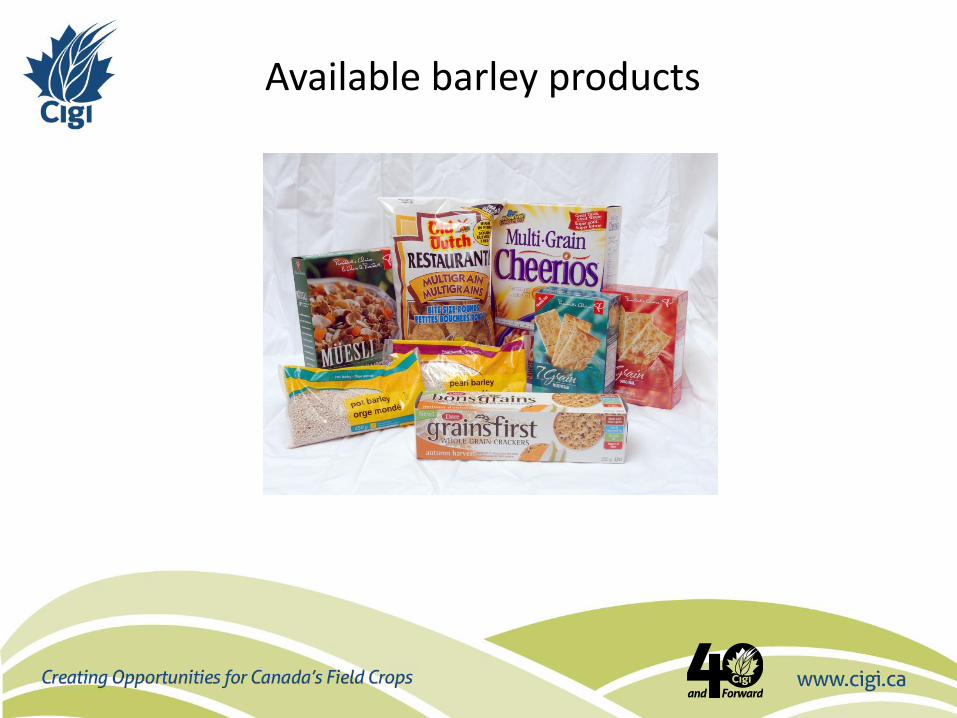
Available barley products
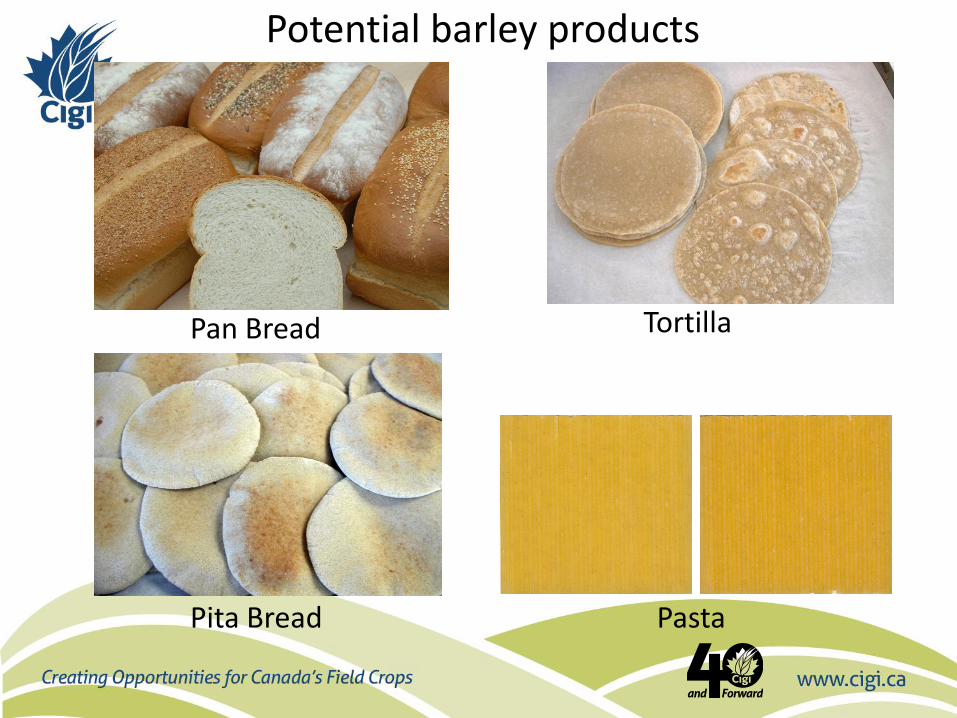
Tortilla Pan Bread
Pita Bread Pasta
Potential barley products
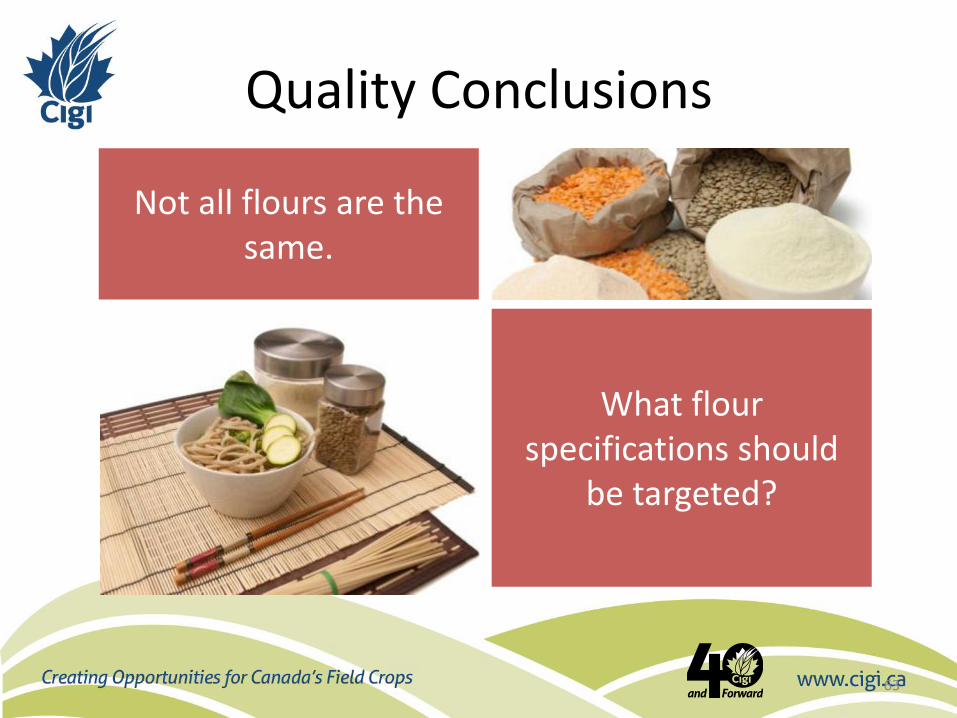
Quality Conclusions
63
Not all flours are the same.
What flour specifications should
be targeted?
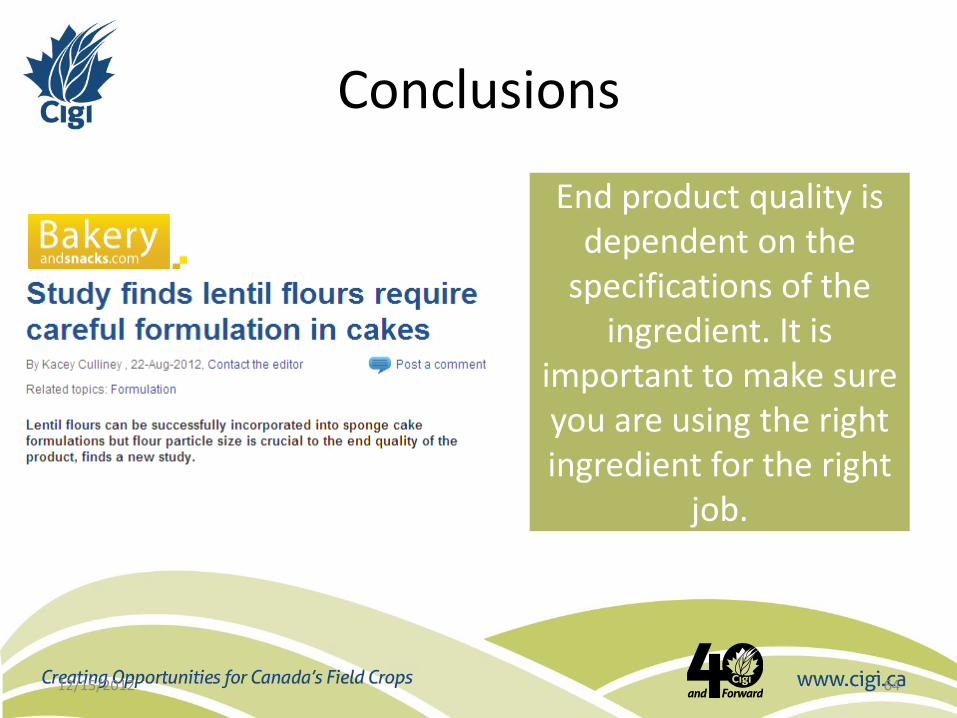
Conclusions
12/15/2012 64
End product quality is dependent on the
specifications of the ingredient. It is
important to make sure you are using the right ingredient for the right
job.
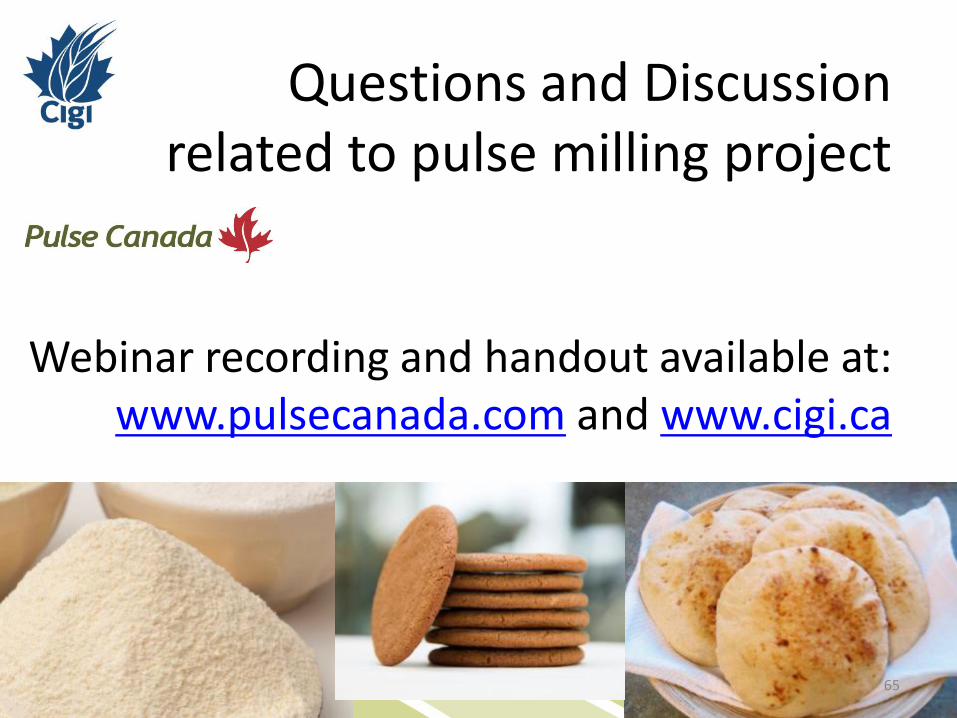
Questions and Discussion related to pulse milling project
Webinar recording and handout available at: www.pulsecanada.com and www.cigi.ca
65
Project Funding for pulse processing was Provided By:
12/15/2012 66
Acknowledgements Specific to pulse related project work
• Pulse Canada
• Saskatoon Food Centre
• Manitoba Food Development Centre
• Leduc Food Processing Development Centre
• Cigi Departments
– Analytical Services
– Bakery
– Noodles and Asian Products
– Pasta and Extrusion
– Pulse and Special Crops
– Communications
67