Embed Size (px)
Citation preview
UnderstandingZero-Energy Buildings
By Paul A. Torcellini, Ph.D., P.E., Member ASHRAE; and Drury B. Crawley, Member ASHRAE
T he U.S. Department of Energy’s (DOE) Building Technologies Program has
set a research goal of making commercial zero-energy buildings (ZEBs)
marketable by 2025.1 In concept, a ZEB has greatly reduced energy loads
such that renewable energy can supply the remaining energy needs. This im-
mediately begs some questions: “This is a far stretch from our current energy-
efficient buildings—is it even possible?” “Are there examples out there that
are even close?”
To address these questions, the National Renewable Energy Laboratory (NREL)
conducted an assessment of the commercial sector to evaluate the technical
potential for meeting this goal based on possible technology improvements for
2025. NREL also evaluated seven low-energy commercial buildings to determine
with respect to their ability to meet a zero energy goal.2
The following article was published in ASHRAE Journal, September 2006. © Copyright 2006 American Society of Heating, Refrigerating and Air-Conditioning Engineers, Inc. It is presented for educational purposes only. This article may not be copied and/or distributed electroni-cally or in paper form without permission of ASHRAE.
Sep tember 2006 ASHRAE Jou rna l 63
About the Authors
Paul A. Torcellini, Ph.D., P.E., is a senior research engineer at the National Renewable Energy Laboratory, Golden, Colo. Drury B. Crawley is a program manager in the Office of Building Technologies, U.S. Department of Energy, Washington, D.C.
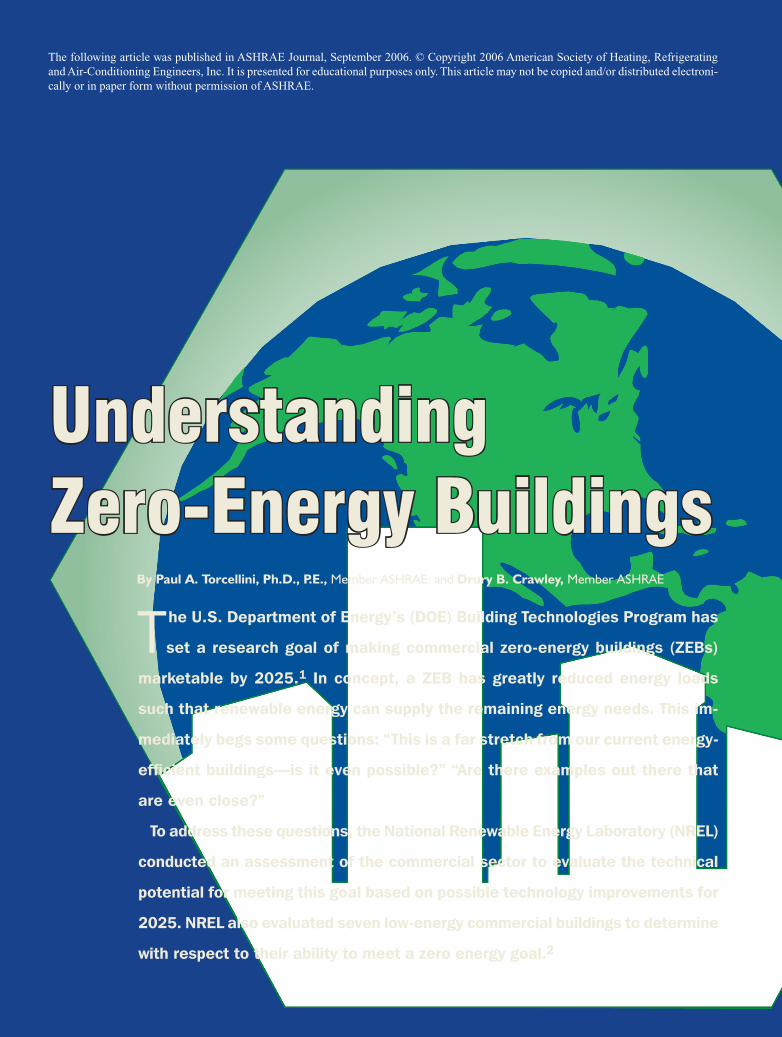
Photovoltaic array on the roof of the Lewis Center at Oberlin College in Oberlin, Ohio.
Justification for Zero-Energy BuildingsWhy are ZEBs important? Residential and commercial
buildings consume 40% of the primary energy and 71% of the total electricity in the United States.3 That is a huge burden on the electrical system, energy resource availability, emissions, and economic viability.
To make matters worse, energy use in the U.S. commercial sector is expected to grow by 1.6% per year—twice as fast as in the residential sector. It is being driven by economic expansion and population growth, which require more and more space each year.4 The total building area and its energy impact are increasing faster than all the energy conservation measures being taken and retrofits being made to buildings.
So how can new commercial buildings be constructed so that they are, in fact, ZEBs? And how can older buildings be retro-fitted to be environmentally sound, comfortable, economical, and energy efficient? In most cases, an older building cannot be a ZEB. However, research has shown that energy consump-tion and costs can be reduced significantly by applying some fairly simple energy-efficiency principles.2,5
Definitions of Zero-Energy BuildingsWhen energy goals are set as percent savings, an energy
scale is implied. The question of “savings from what?” is
often asked. Answers include: “savings from ANSI/ASHRAE/IESNA Standard 90.1-2004, Energy Standard for Buildings Except Low-Rise Residential Buildings.” The other end of the scale is implied to be zero. A 30% energy goal is measured from Standard 90.1-2004 on the path to zero.
Zero is the crossover point between a building that consumes a resource and one that produces the resource. Conceptually, it is envisioned as the point where the energy needs of the building has no impact.
First, on the definition front—the word “zero” is really “net zero.” The sums of the flows in and out are equal and opposite. This does not imply zero flows.
If a building owner has the goal of creating a building that has a net zero, the design team first must define what that means, as it is open to interpretation. What do you mean by energy—is it source energy, site energy, energy cost, or emissions as a result of using energy? At least four ZEB definitions, which are incor-rectly assumed to be interchangeable, are in use today.6
Pho
to c
ourte
sy o
f the
Nat
iona
l Ren
ewab
le E
nerg
y La
bora
tory
64 ASHRAE Jou rna l ash rae .o rg Sep tember 2006
This article will examine:• Net zero source energy building;• Net zero site energy building;• Net zero energy cost building; and• Net zero energy emissions building.
A net zero source energy building produces as much en-ergy as it uses compared to the energy content at the energy source. The system boundary is drawn around the building, the transmission system, the power plant, and the energy required get-ting the fuel source to the power plant. It tends to be a better repre-sentation of the total energy impact. However, it is challenged by dif-ficulties in acquiring site-to-source conversions and by the limitations of these conversions. Fixed con-version factors do not account for dispatch of energy with time of day, and the changes in dispatch as new buildings and the new power plants to supply them come on-line. This definition can depend on how the utility is buying or producing the power, rather than on the energy performance of the building. So, if someone wants to construct a building in an area with a large per-centage of hydroelectric energy, it may have a low source energy impact. However, placing the building in that location may necessitate new fossil fuel generation plants and the building may actually use the new generation capacity, which is coal. This analysis is very difficult.
A net zero site energy building produces as much energy as it uses when measured at the site. This definition as a goal is useful, as it can be verified through on-site metering. It tends to encourage energy-efficient designs. However, it does not distinguish between fuel types or account for inef-ficiencies in the utility grid. The site must also be defined.
Each building we studied has a unique purpose and function, and all have commonalities. These buildings are successful because they are good energy performers. All had owners who pushed low-energy or sustainability goals and considered energy efficiency part of the decision-making process. The architects and engineers created a design to implement the vision, which required a whole-building design process.
The whole-building design process requires that the team responsible for the building design—the architect,
engineers (lighting, electrical, and mechanical), energy and other consultants, and the building’s owner and oc-cupants—work together to set and understand the energy performance goals. The purpose of the whole-building design approach is to enable the entire design team to interact throughout the design process to understand system interdependencies. A systematic analysis of these interdependencies can help ensure that a much more ef-ficient and cost-effective building is produced.
60
50
40
30
20
10
0
–10
Ener
gy U
se In
tens
ity, k
Btu/
ft2
Base Base LZEB LZEB With PV 2005 2025
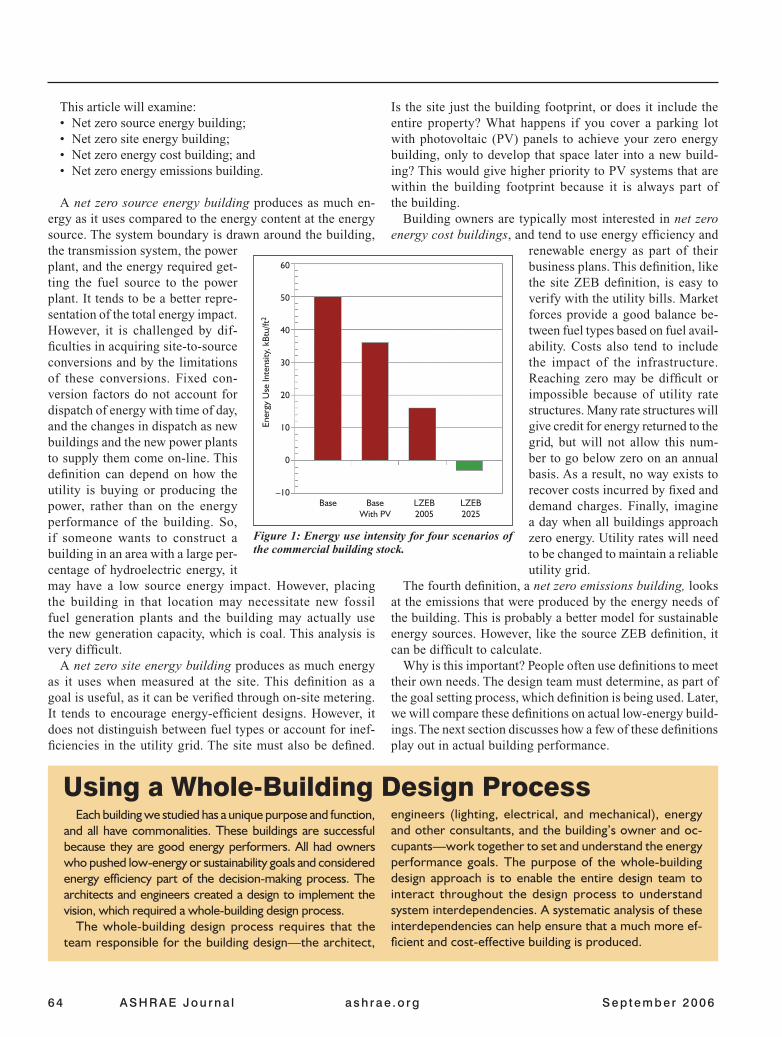
Figure 1: Energy use intensity for four scenarios of the commercial building stock.
Is the site just the building footprint, or does it include the entire property? What happens if you cover a parking lot with photovoltaic (PV) panels to achieve your zero energy building, only to develop that space later into a new build-ing? This would give higher priority to PV systems that are within the building footprint because it is always part of the building.
Building owners are typically most interested in net zero energy cost buildings, and tend to use energy efficiency and
renewable energy as part of their business plans. This definition, like the site ZEB definition, is easy to verify with the utility bills. Market forces provide a good balance be-tween fuel types based on fuel avail-ability. Costs also tend to include the impact of the infrastructure. Reaching zero may be difficult or impossible because of utility rate structures. Many rate structures will give credit for energy returned to the grid, but will not allow this num-ber to go below zero on an annual basis. As a result, no way exists to recover costs incurred by fixed and demand charges. Finally, imagine a day when all buildings approach zero energy. Utility rates will need to be changed to maintain a reliable utility grid.
The fourth definition, a net zero emissions building, looks at the emissions that were produced by the energy needs of the building. This is probably a better model for sustainable energy sources. However, like the source ZEB definition, it can be difficult to calculate.
Why is this important? People often use definitions to meet their own needs. The design team must determine, as part of the goal setting process, which definition is being used. Later, we will compare these definitions on actual low-energy build-ings. The next section discusses how a few of these definitions play out in actual building performance.
Using a Whole-Building Design Process
66 ASHRAE Jou rna l ash rae .o rg Sep tember 2006
Could All Buildings Have Zero Energy Impact?Are ZEBs possible on a wide scale? To answer this question,
NREL researchers took 5,375 buildings in 1999 Commercial Buildings Energy Consumption Survey (CBECS) public use data,7 extracted the key energy-related building parameters, and created energy models to simulate the energy performance representing the entire commercial building sector. We used Standard 90.1-2004 performance requirements for all of the building models to use as a baseline, then applied a set of readily available energy conservation measures and covered 50% of each simu-lated roof with photovoltaic (PV) panels.8
The PV was limited to the roof area and was the only supply-side source ana-lyzed. Other sources were considered, but not used for this analysis. With a broad scan of the building’s sector, technologies needed to have the potential to be applied to large number of buildings. For example, on-site wind generation is limited by wind regime. Biofuels, such as woodchips, must be imported to the building site. Microturbines and fuel cells purchase en-ergy and convert it to heat and power. These units may improve overall efficiency, but energy still enters the boundary of the defined system. PV can be applied to almost any building.
Figure 1 shows the results of this analysis by displaying the net site energy use intensity for the entire commercial building sector for four different scenarios. The Base scenario represents the energy use intensity (EUI) if all buildings were built to Standard 90.1-2004. The EUI for this scenario is 49.7 kBtu/ft2 (564 MJ/m2), which is a 41% reduction from the actual 1999 EUI for the commercial building stock of 84.2 kBtu/ft2 (956 MJ/m2). This result indicates that if we rebuilt and operated all buildings to current standards, we could save a significant amount of energy. Adding PV to the roofs enables
us to reduce energy consumption by an additional 28%, to 35.8 kBtu/ft2 (407 MJ/m2). This is represented in Figure 1 by the scenario Base with PV.
Next, we applied a set of energy-efficiency measures— elongated the buildings along the east-west axis, applied day-lighting strategies within 15 ft (4.6 m) of exterior surfaces, added overhangs to block high summer sun, reduced the lighting power density by 17%, and made modest improve-ments in HVAC efficiency. This yielded a saving of 41% over
the base scenario. Adding the PV results in an EUI of 15.5 kBtu/ft2 (176 MJ/m2). This is scenario LZEB 2005.
Finally, we made additional improvements based on the DOE goals for technologies of the future. The assump-tions in the Future Maxi-mum Technology scenario represent an additional 20 years of research and de-velopment. Improvements in HVAC equipment and lighting technologies are accounted for in this case. Because of small buildings loads, improvements in PV technology allow the entire
sector to start exporting energy. This final case represents an EUI of −2.5 kBtu/ft2 (−28 MJ/m2). (The minus sign means that energy is exported on an annual basis.)
Conceptually, we found that the entire commercial building sector could generate energy, based on aggressive energy sav-ings and using the roof to generate electricity for the building. It does require technology improvements coupled with good integration and control of systems.
Some buildings can achieve zero energy more easily than others. Warehouses present a wonderful opportunity, as they are typically one-story buildings, have minimal plug loads, and can be easily daylit. They can quite easily generate more energy than they consume, which helps those energy-intensive sectors, such as food service and health care.9
Documenting the performance of buildings helps us un-derstand how close we are to achieving the ZEB goal. Even utility information by itself is useful. Experiences and lessons learned can help accelerate the adoption of technologies into the marketplace. Few people like to admit to the “dirty laundry,” but it helps the industry move forward and shows leadership in minimizing the energy impact of buildings. Standardized methods of reporting energy performance
are available through DOE, and guidance is available from ASHRAE standards. DOE also maintains a database to share case studies and experiences from leading-edge buildings (www.eere.energy.gov/buildings/database/). The database is set up to capture lessons learned and energy performance data. Others can search the database to get ideas, and to see what works and what does not. This will help improve the energy efficiency of the building stock.
100
80
60
40
20
0
Perc
enta
ge o
f Flo
or A
rea
Abl
e To
Rea
ch Z
EB
0 1 2 3 4 5 6 7 8 9 10Number of Floors
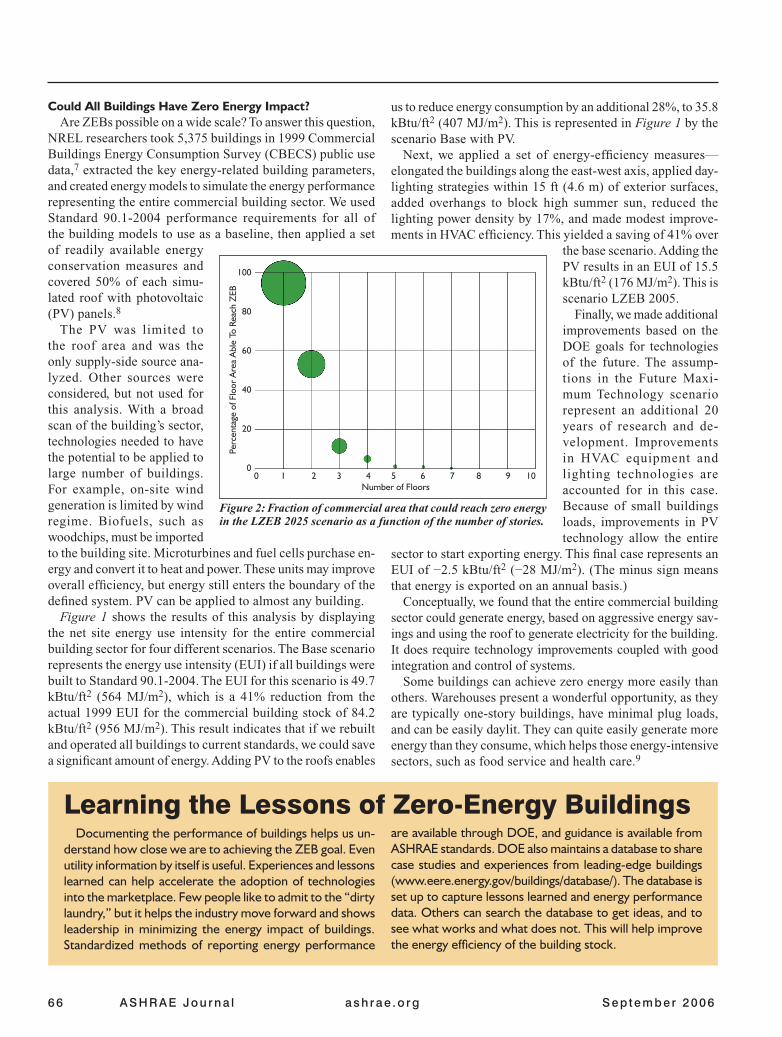
Figure 2: Fraction of commercial area that could reach zero energy in the LZEB 2025 scenario as a function of the number of stories.
Learning the Lessons of Zero-Energy Buildings
Sep tember 2006 ASHRAE Jou rna l 67
An example of a more detailed analysis is to look at number of stories. Figure 2 shows the percentage of commercial floor area that can reach net site ZEB as a function of the number of floors for the future LZEB 2025 case. As the number of stories increases, the ability to achieve ZEB decreases sub-stantially because daylighting the space is difficult and the plug load density increases vis-à-vis the building’s footprint. The amount of PV is fixed by the footprint of the building compounding the problem. The sizes of the green circles in Figure 2 indicate the relative percentage of the building stock represented by the number of floors. We tend to build single-story buildings.
What Has Been Done Today?To see how this applies to buildings today, we selected
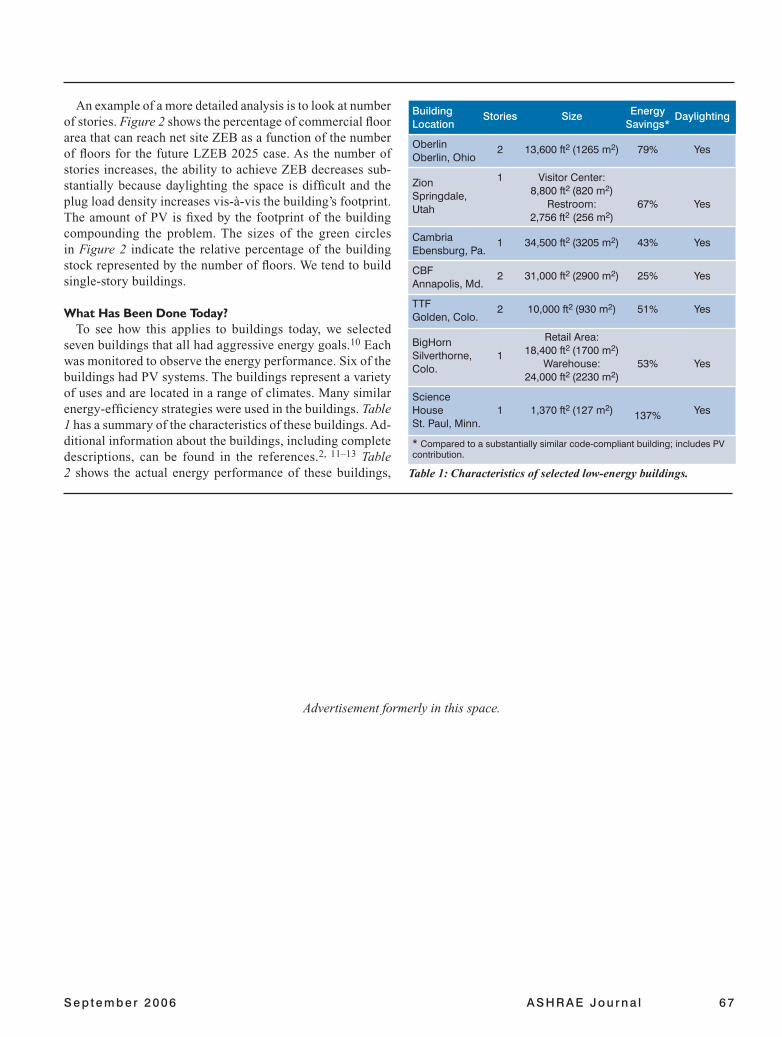
seven buildings that all had aggressive energy goals.10 Each was monitored to observe the energy performance. Six of the buildings had PV systems. The buildings represent a variety of uses and are located in a range of climates. Many similar energy-efficiency strategies were used in the buildings. Table 1 has a summary of the characteristics of these buildings. Ad-ditional information about the buildings, including complete descriptions, can be found in the references.2, 11–13 Table 2 shows the actual energy performance of these buildings, Table 1: Characteristics of selected low-energy buildings.
Building Stories Size Energy DaylightingLocation Savings*
Oberlin 2 13,600ft2(1265m2) 79% YesOberlin,Ohio
Zion 1 VisitorCenter:
Springdale, 8,800ft2(820m2)
Utah Restroom: 67% Yes 2,756ft2(256m2)
Cambria 1 34,500ft2(3205m2) 43% YesEbensburg,Pa.
CBF 2 31,000ft2(2900m2) 25% YesAnnapolis,Md.
TTF 2 10,000ft2(930m2) 51% YesGolden,Colo.
BigHorn RetailArea:
Silverthorne, 1 18,400ft2(1700m2)
Colo. Warehouse: 53% Yes 24,000ft2(2230m2)
Science House 1 1,370ft2(127m2) 137% YesSt.Paul,Minn.
*Comparedtoasubstantiallysimilarcode-compliantbuilding;includesPVcontribution.
Advertisement formerly in this space.
68 ASHRAE Jou rna l ash rae .o rg Sep tember 2006
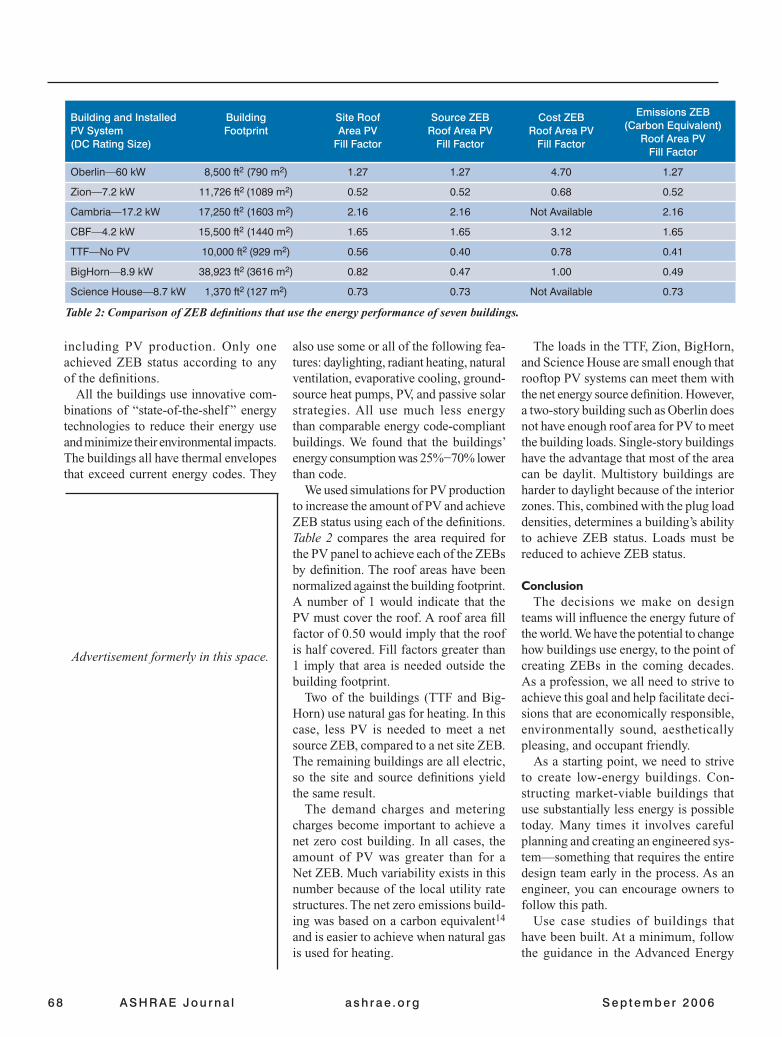
Table 2: Comparison of ZEB definitions that use the energy performance of seven buildings.
Building and Installed Building Site Roof Source ZEB Cost ZEB Emissions ZEB
PV System Footprint Area PV Roof Area PV Roof Area PV (Carbon Equivalent)
(DC Rating Size) Fill Factor Fill Factor Fill Factor Roof Area PV Fill Factor
Oberlin—60kW 8,500ft2(790m2) 1.27 1.27 4.70 1.27
Zion—7.2kW 11,726ft2(1089m2) 0.52 0.52 0.68 0.52
Cambria—17.2kW 17,250ft2(1603m2) 2.16 2.16 NotAvailable 2.16
CBF—4.2kW 15,500ft2(1440m2) 1.65 1.65 3.12 1.65
TTF—NoPV 10,000ft2(929m2) 0.56 0.40 0.78 0.41
BigHorn—8.9kW 38,923ft2(3616m2) 0.82 0.47 1.00 0.49
ScienceHouse—8.7kW 1,370ft2(127m2) 0.73 0.73 NotAvailable 0.73
including PV production. Only one achieved ZEB status according to any of the definitions.
All the buildings use innovative com-binations of “state-of-the-shelf ” energy technologies to reduce their energy use and minimize their environmental impacts. The buildings all have thermal envelopes that exceed current energy codes. They
also use some or all of the following fea-tures: daylighting, radiant heating, natural ventilation, evaporative cooling, ground-source heat pumps, PV, and passive solar strategies. All use much less energy than comparable energy code-compliant buildings. We found that the buildings’ energy consumption was 25%−70% lower than code.
We used simulations for PV production to increase the amount of PV and achieve ZEB status using each of the definitions. Table 2 compares the area required for the PV panel to achieve each of the ZEBs by definition. The roof areas have been normalized against the building footprint. A number of 1 would indicate that the PV must cover the roof. A roof area fill factor of 0.50 would imply that the roof is half covered. Fill factors greater than 1 imply that area is needed outside the building footprint.
Two of the buildings (TTF and Big-Horn) use natural gas for heating. In this case, less PV is needed to meet a net source ZEB, compared to a net site ZEB. The remaining buildings are all electric, so the site and source definitions yield the same result.
The demand charges and metering charges become important to achieve a net zero cost building. In all cases, the amount of PV was greater than for a Net ZEB. Much variability exists in this number because of the local utility rate structures. The net zero emissions build-ing was based on a carbon equivalent14 and is easier to achieve when natural gas is used for heating.
The loads in the TTF, Zion, BigHorn, and Science House are small enough that rooftop PV systems can meet them with the net energy source definition. However, a two-story building such as Oberlin does not have enough roof area for PV to meet the building loads. Single-story buildings have the advantage that most of the area can be daylit. Multistory buildings are harder to daylight because of the interior zones. This, combined with the plug load densities, determines a building’s ability to achieve ZEB status. Loads must be reduced to achieve ZEB status.
ConclusionThe decisions we make on design
teams will influence the energy future of the world. We have the potential to change how buildings use energy, to the point of creating ZEBs in the coming decades. As a profession, we all need to strive to achieve this goal and help facilitate deci-sions that are economically responsible, environmentally sound, aesthetically pleasing, and occupant friendly.
As a starting point, we need to strive to create low-energy buildings. Con-structing market-viable buildings that use substantially less energy is possible today. Many times it involves careful planning and creating an engineered sys-tem—something that requires the entire design team early in the process. As an engineer, you can encourage owners to follow this path.
Use case studies of buildings that have been built. At a minimum, follow the guidance in the Advanced Energy
Advertisement formerly in this space.
Sep tember 2006 ASHRAE Jou rna l 69
Design Guide series.5 Look for op-portunities to create a good thermal envelope—especially look for thermal bridges at the corners and around steel beams. Implement daylighting with automated controls wherever possible and dim, or better yet turn off the lights. Consider natural ventilation. Size the HVAC system to match these reduced loads. Low-energy buildings can be built cost effectively. Most importantly, help the owner to set aggressive goals and follow through by helping shape the architecture and HVAC systems.
To create ZEBs we must:• Set concrete and measurable energy
goals for all building projects;• Strive to meet those goals by using
the envelope of the building to meet the comfort and programmatic needs of the occupants; and
• Measure and report the actual per-formance of buildings.
Finally, share your thoughts and les-sons learned on your experiences to achieve ZEBs, and share areas of con-cern and needs for research. Research is needed to improve system performances and integrated designs if we are to have widespread ZEBs. Together we can dra-matically change how buildings impact the energy future.
AcknowledgmentsThe U.S. Department of Energy’s Of-
fice of Building Technologies managed and funded this research. In addition to the authors, the following NREL staff provided energy analysis: Michael Deru, Brent Griffith, Shanti Pless, and Nicholas Long.
References1. U.S. Department of Energy. 2005.
“Building Technologies Program Re-search, Development, Regulatory and Mar-ket Introduction Plan: Planned Activities for 2006−2011.” www.eere.energy.gov/ buildings/about/mypp.html.
2. Torcellini, P., et al. 2006. “Les-sons Learned from Case Studies of Six High-Performance Buildings.” National Renewable Energy Laboratory Report No. TP-550-37542. www.nrel.gov/docs/fy06osti/37542.pdf.
3. U.S. Department of Energy. 2005. Buildings Energy Data Book.
4. Energy Information Administration. 2006. Annual Energy Outlook 2006. www.eai.doe.gov/ioaf.aeo.index.html.
5. ASHRAE. 2004. Advanced Energy Design Guide for Small Office Buildings. Atlanta: ASHRAE.
6. Torcellini, P., et al. 2006. “Zero2006. “Zero energy buildings: a critical look at the definition.” Proceedings of the 2006 ACEEE Summer Study on Energy Effi-ciency in Buildings. www.nrel.gov/docs/fy06osti/39833.pdf.
7. Energy Information Administra-tion. 2002. 1999 Commercial Buildings Energy Consumption Survey. www.eia.doe.gov/emeu/cbecs/contents.html.
8. Griffith, B., et al. 2006. “Assessment of the technical potential for achieving zero-energy commercial buildings.” Proceedings of the 2006 ACEEE Summer Study on Energy Efficiency in Buildings..
9. Griffith, B., et al. 2006. Assessment of the Technical Potential for Achieving Zero-Energy Commercial Buildings: Preprint. www.nrel.gov/docs/fy06osti/39830.pdf.
10. Deru, M., and P. Torcellini. 2004. “Improving Sustainability of Buildings through a Performance-Based Design Approach: Preprint.” National Renew-able Energy Laboratory Report No. CP-550-36276. World Renewable En-ergy Congress VIII. www.nrel.gov/docs/fy04osti/36276.pdf.
11. Torcellini, P., R. Judkoff, D. Craw-ley. 2004. “Lessons learned, high-per-formance buildings.” ASHRAE Journal 46(9):S4 − S11.
12. U.S. Department of Energy. 2006. Science House at the Science Mu-seum of Minnesota, High Performance Buildings Database. www.eere.en-ergy.gov/buildings/database/overview.cfm?ProjectID=284. Accessed July 15, 2006.
13. Science Museum of Minnesota. www.smm.org/sciencehouse/. Accessed Aug. 4, 2006.
14. Deru, M., and P. Torcellini. 2006. “Source Energy and Emission Factors for Energy Use in Buildings,” National Renewable Energy Laboratory Report No. CP-550-38617. www.nrel.gov/docs/fy06osti/38617.pdf.
Advertisement formerly in this space.
![ASHRAE Journal - July 2017 [36 - 37] - Eley · TECHNICAL FEATURE Feasibility of ZNE by Building and Climate BY CHARLES ELEY, FAIA, P.E., MEMBER ASHRAE Zero net energy buildings are](https://img.pdfslide.net/doc/110x75/5b36bbde7f8b9abd438b5173/ashrae-journal-july-2017-36-37-technical-feature-feasibility-of-zne.jpg)