Embed Size (px)
Citation preview

ASIA CEMENT CORPORATION
2019 Annual Report
Notice to readers This English version annual report is a summary translation of the Chinese version and is not an official document of the shareholders’ meeting. If there is any discrepancy between the English version and Chinese version, the Chinese version shall prevail.
Printed on March 31, 2020
Stock Code: 1102
http://www.acc.com.tw
http://emops.twse.com.tw

Spokesperson Headquarter and Plants Name: W.K. Chou Title: Vice President Tel: 886-2-27378940 E-mail: [email protected]
Headquarter Address: 30~ 31F, No.207, Sec. 2, Dunhua South Rd., Da’an Dist., Taipei City 106, Taiwan Tel: 886-2-27338000 Hsinchu Plant Address: No.109, Sec. 2, Zhongfeng Rd., Hengshan Township, Hsinchu County 312, Taiwan Tel: 886-3-5931011 Hualien Plant Address: No.125, Xinxing Rd., Xincheng Township, Hualien County 971, Taiwan Tel: 886-3-8612101
IR Contact & Deputy Spokesperson Name: Doris Wu Title: Executive Vice President Tel: 886-2-27378945 E-mail: [email protected] Stock Transfer Agent Oriental Securities Corporation Address: 13F., No. 16, Xinzhan Rd., Banqiao Dist., New Taipei City 220, Taiwan Tel: 886-2-77531699 Website: http://www.osc.com.tw/ Auditors Deloitte & Touche Auditors: Xin Wei Tai and Yu Wei Fan Address: 20F., No. 100, Songren Rd., Xinyi Dist., Taipei City 110, Taiwan Tel: 886-2-27259988 Website: http://www.deloitte.com/ Overseas Securities Exchange London Stock Exchange Disclosed information can be found at http://www.londonstockexchange.com/ Singapore Exchange Disclosed information can be found at http://www.sgx.com/ Corporate Website http://www.acc.com.tw/
I
Table of Contents I REPORT TO SHAREHOLDERS ............................................................................................................................ 1 II COMPANY PROFILE ........................................................................................................................................... 10
2.1 DATE OF INCORPORATION: ........................................................................................................................................ 10 2.2 COMPANY HISTORY ................................................................................................................................................. 10
III CORPORATE GOVERNANCE REPORT ........................................................................................................ 14 3.1 ORGANIZATION ....................................................................................................................................................... 14
3.1.1 Organization Chart ..................................................................................................................................... 14 3.1.2 Major Corporate Functions ........................................................................................................................ 15
3.2 DIRECTORS, SUPERVISORS AND MANAGEMENT TEAM .................................................................................................... 17 3.2.1 Directors and Supervisors........................................................................................................................... 17 3.2.2 Major Shareholders of the Institutional Shareholders ............................................................................... 20 3.2.3 Major Shareholders of the Major Shareholders That Are Juridical Persons ............................................... 21 3.2.4 Professional Qualifications and Independence Analysis of Directors ......................................................... 26 3.2.5 Management Team .................................................................................................................................... 28 3.2.6 Remuneration of Directors, Supervisors, President, and Vice Presidents ................................................... 30 3.2.7 Employees Remuneration to Management Team ..................................................................................... 35 3.2.8 Name and Title of the Top 10 Employees Who Were Distributed Employees Remuneration .................... 35
3.3 IMPLEMENTATION OF CORPORATE GOVERNANCE .......................................................................................................... 36 3.3.1 Board of Directors ...................................................................................................................................... 36 3.3.2 Other mentionable items: .......................................................................................................................... 37 3.3.3 Annual priorities of Audit committee ......................................................................................................... 37 3.3.4 Attendance of Audit committee ................................................................................................................. 38 3.3.5 Corporate Governance Execution Status and Deviations from “Corporate Governance Best-Practice
Principles for TWSE/ TPEx Listed Companies” ............................................................................................ 43 3.3.6 The Composition, Duty, and Implementation Status of the Remuneration Committee ............................. 55 3.3.7 Corporate Social Responsibility .................................................................................................................. 58 3.3.8 Implementation Status of Ethical Management ........................................................................................ 63 3.3.9 The Training for Directors ........................................................................................................................... 70 3.3.10 The Training for Managers ....................................................................................................................... 71 3.3.11 The Execution Status of Internal Control System ..................................................................................... 72 3.3.12 Major Resolutions of Shareholders’ Meeting and Board Meetings ......................................................... 73 3.3.13 Resignation or dismissal of the chairman, president, accounting manager, finance manager, auditing
manager, and R&D manager of the Company ........................................................................................... 74 3.4 INFORMATION OF CPA SERVICE FEE ........................................................................................................................... 75 3.5 RELEVANT LICENSES AND CERTIFICATES OBTAINED ABOUT TRANSPARENT FINANCIAL INFORMATION ........................................... 76 3.6 CHANGES IN SHAREHOLDINGS AND PLEDGE OF DIRECTORS, SUPERVISORS, MANAGERS, AND SHAREHOLDERS WITH MORE THAN 10%
SHAREHOLDING ...................................................................................................................................................... 77 3.7 INFORMATION DISCLOSING THE RELATIONSHIP BETWEEN ANY OF THE COMPANY’S TOP 10 SHAREHOLDERS ............................. 79 3.8 SHAREHOLDING PROPORTION OF ACC TO INVESTEES ..................................................................................................... 85
IV CAPITAL FORMATION ..................................................................................................................................... 86 4.1 CAPITAL AND SHARES............................................................................................................................................... 86 4.1 CAPITAL AND SHARES............................................................................................................................................... 86
4.1.1 Capital Increase in the Past Five Years ....................................................................................................... 86 4.1.2 Capital ........................................................................................................................................................ 86 4.1.3 Shelf Registration:None .......................................................................................................................... 86 4.1.4 Shareholder Structure ................................................................................................................................ 86 4.1.5 Shareholding Distribution Status ............................................................................................................... 87 4.1.6 List of Major Shareholders ......................................................................................................................... 87 4.1.7 Market Price, Net Value, Earnings and Dividends per Share ...................................................................... 88 4.1.8 Dividend Policy & Implementation Status .................................................................................................. 88 4.1.9 Effects on Business Performance and EPS Resulting From Stock Dividend Distribution ............................. 89 4.1.10 Employees’ Compensation and Directors’ and Supervisors’ Remuneration ............................................. 89

II
4.2 SUMMARY OF CORPORATE BONDS ............................................................................................................................. 91 4.2.1 Issued Corporate Bonds ............................................................................................................................. 91 4.2.2 Issued Exchangeable Bonds and Convertible Bonds ................................................................................... 95
4.3 SUMMARY OF ISSUED GDR ...................................................................................................................................... 96 4.4 STATUS ON EXECUTION OF CAPITAL UTILIZATION PLANS ................................................................................................. 96
V OVERVIEW OF BUSINESS OPERATION ........................................................................................................ 97 5.1 BUSINESS INTRODUCTION ......................................................................................................................................... 97
5.1.1 Business Scope ........................................................................................................................................... 97 5.1.2 Industry Overview ...................................................................................................................................... 97 5.1.3 Technology and Research Development .................................................................................................... 99 5.1.4 Short-term Business Plan ........................................................................................................................... 99 5.1.5 Long-term Business Plan .......................................................................................................................... 100
5.2 GENERAL INFORMATION OF MARKET & PRODUCTION .................................................................................................. 100 5.2.1. Markets Analysis ..................................................................................................................................... 100 5.2.2 Application of Major Cement Products .................................................................................................... 101 5.2.3 Supply Condition of Main Raw Materials ................................................................................................. 102 5.2.4 Major Suppliers Information for the Last Two Years ............................................................................... 103 5.2.5 Major Clients Information for the Last Two Years .................................................................................... 103 5.2.6 Output of Main Products 2018-2019 ....................................................................................................... 104 5.2.7 Sales of Main Products 2018-2019 .......................................................................................................... 104
4.4 HUMAN RESOURCES ............................................................................................................................................. 105 5.4 EXPENDITURES ON ENVIRONMENTAL PROTECTION ....................................................................................................... 105
5.4.1 ISO-14001 Environmental Management Systems (EMS) ......................................................................... 106 5.4.2 Air Pollution Prevention ........................................................................................................................... 106 5.4.3 Greening and Beautification for Quarry Restoration ............................................................................... 107 5.4.4 Major Environmental Protection Work in the Future ............................................................................... 107 5.4.5 Fulfill Social Responsibilities ..................................................................................................................... 107
5.5 LABOR RELATIONS ................................................................................................................................................. 108 5.6 MAJOR CONTRACTS .............................................................................................................................................. 112
VI FINANCIAL INFORMATION .......................................................................................................................... 113 6.1FINANCIAL REPORTS & AUDIT RESULTS IN RECENT FIVE YEARS ........................................................................................ 113
6.1.1 Consolidated Balance Sheets ................................................................................................................... 113 6.2 FINANCIAL ANALYSIS .............................................................................................................................................. 117
6.2.1 Consolidated Financial Statements .......................................................................................................... 117 6.2.2 Separate Financial Statements................................................................................................................. 118
6.3 AUDIT COMMITTEE’S REVIEW REPORT ON THE 2019 FINANCIAL STATEMENTS .................................................................. 120 6.4 FINANCIAL STATEMENTS AND INDEPENDENT AUDITORS’ REPORT .................................................................................... 121
VII ANALYSIS OF FINANCIAL STATUS, OPERATING RESULT, AND RISK MANAGEMENT .............. 143 7.1 ANALYSIS OF FINANCIAL STATUS .............................................................................................................................. 143 7.2 ANALYSIS OF FINANCIAL PERFORMANCE .................................................................................................................... 144 7.3 ANALYSIS OF CASH FLOW ........................................................................................................................................ 145 7.4 IMPACTS OF MAJOR CAPITAL EXPENDITURES ON FINANCE AND OPERATION ...................................................................... 145 7.5 INVESTMENT STRATEGIES IN THE MOST RECENT YEAR, THE MAJOR REASONS FOR ITS GAIN OR LOSS AND IMPROVEMENT PLAN AND
INVESTMENT PLANS FOR NEXT YEAR......................................................................................................................... 146 7.6 ANALYSIS AND EVALUATION OF RISK MANAGEMENT..................................................................................................... 146
7.6.1 The Impact of Fluctuation of Foreign Exchange, Interest Rates, and Inflation on the Company’s Profit and Loss and Its Countermeasures .................................................................................................................. 146
7.6.2 The Impact of Highly Risky Investments, Highly Leveraged Transaction, Loaning to Others, Endorsement and Guarantee for Others, and Derivatives ............................................................................................. 148
7.6.3 The Prevention of Legal Risks ................................................................................................................... 148 7.7 OTHER MENTIONABLE ISSUES .................................................................................................................................. 149
VIII SPECIAL DISCLOSURE ............................................................................................................................... 150 8.1 ORGANIZATIONAL CHART OF AFFILIATED COMPANIES ................................................................................................... 150 8.2 BASIC INFORMATION OF AFFILIATED COMPANIES ......................................................................................................... 151
III
8.3 MAIN BUSINESS OF AFFILIATED COMPANIES............................................................................................................... 154 8.4 INFORMATION OF THE DIRECTORS, SUPERVISORS, AND PRESIDENTS OF AFFILIATED COMPANIES ............................................ 155 8.5 OPERATING CONDITION OF AFFILIATED COMPANIES ..................................................................................................... 167
1
I Report to Shareholders
2019 Business Report 1. Review of the Year 2019 Review of the international economic situation in 2019
Looking back at the international economic situation in 2019, we found that, influenced by the unending trade disputes between the United States and China, rising geopolitical risks, and weak economic performance in emerging markets, the global economic growth momentum weakened, and international raw material prices generally slowed down. Meanwhile, the high comparative base period data has led to weak foreign trade data for major countries, conservative investment and operations by manufacturers and under-performance by the manufacturing sector in 2019. In Europe, uncertainty has risen because of the Brexit deadline and the ECB's halt to quantitative easing.
Observing the performance of major economies, it was found that China's economic growth slowed in 2019, mainly due to the U.S.-China trade conflict, government regulation of non-bank financial institutions to curb debt risk, and slowing labor force growth. Annual economic growth was 6.1%, 0.6% less than in 2018. In the United States, economic growth is slowing due to the diminishing effect of fiscal stimulus and the uncertainty of a trade war between the United States and China. In the Eurozone, however, the negative effects of export demand and supply interacted with each other, resulting in an annual decrease of 1.7% in industrial production, especially in Germany and Italy. Japan is one of the few countries with relatively significant economic growth, mainly due to slightly more vibrant private consumption and the government's expansion of fiscal spending, which offset the adverse impact of the consumption tax hike.
Review of the domestic economic situation in 2019 In 2019, the momentum of global economic growth was markedly weakened by the ongoing
U.S.-China trade standoff and weak overseas demand. However, Taiwan has benefited from factors such as trade diversion effect, reinvestment by Taiwanese businessmen, and expansion of investment in semiconductor equipment, leading to growth in domestic demand, which has brought back consumption and increased investment.
As far as consumption is concerned, sales of automobiles and automobiles and other consumer goods increased. The turnover of the retail and catering industries hit new highs repeatedly, and the momentum of domestic demand grew. However, the wholesale industry was affected by trade frictions, so the demand slowed down and the sales force was reduced. Regarding investment, more investment in equipment from companies and the recent expansion of advanced manufacturing capacity in the semiconductor industry have helped lift economic growth. As for prices, Taiwan's consumer price index (CPI) rose by 0.56% in 2019, the lowest rate in nearly four years, due to continued weak prices in the international commodity market. Overall prices are moderate and stable. The wholesale price index (WPI) fell by 2.24% in 2019, mainly due to the falling prices of chemical materials and base metals.
According to Statistics from the Directorate-General of Budget, Accounting and Statistics under the Executive Yuan, the annual economic growth rate in 2019 was 2.71%, showing an increase of 0.08% compared with that in 2018.
2
The Company's business performance in 2019 A. In 2019, the overall cement consumption in China amounted to about 2.33 billion MT,
increasing 6.1% compared with 2018. In the same period, the clinker production volume of the Company in China is 24.84 million MT, increasing 0.17% compared with 2018. The total sales of cement, clinker and slag powder are 30.83 million MT, decreasing 0.39% compared with 2018. In 2019, the net income of Asia Cement (China) Holdings Corp. is NT$ 14,106,889 thousand. The Company and its subsidiaries recognized a total investment profit of NT$ 10,156,960 thousand.
B. For domestic cement industry, according to a statistics conducted by the Taiwan Cement Manufacturers’ Association, the 2019 total cement production volume in Taiwan was 11,267,211 MT, increasing 3.00% compared with 2018. Among them, the domestic cement sales was 9,054,712 MT, and exported cement was 2,321,014 MT. Compared with those in 2018, domestic sales increased by 5.60%, exports decreased by 2.43%. The total sales of cement in Taiwan of the Company was 2,564,176 MT which is equivalent to 28.32% of the total production volume in Taiwan, or 22.59% of the overall cement consumption in Taiwan. In 2019, the domestic real estate economy was stable, showing a slight increase in volume and stable in price compared with 2018. The cement consumption increased to 11,350,017 MT, by 6.53%. The 2019 per capita average cement consumption is about 482 kg, increased 10.80% from 435kg in 2018. The overall market is showing steady growth.
C. The 2019 consolidated operating revenue of the Company is NT $89,347,637 thousand, increased 7.98% from 2018. The consolidated profit from operations was NT $22,063,176 thousand, increased 21.54% from 2018. From China Shanshui Cement, Far Eastern New Century Corp., and U-Ming Marine Transport Corp., the Company recognized NT $5,490,375 thousand investment income from equity method. The consolidated net profit after tax reached NT $22,243,953 thousand. The net profit rate after tax was 24.90%. Consolidated net profit attributable to the Company is $17,459,673 thousand. The 12th meeting of the 26th Board of Directors proposed to distribute cash dividend NT $3.0 per share.
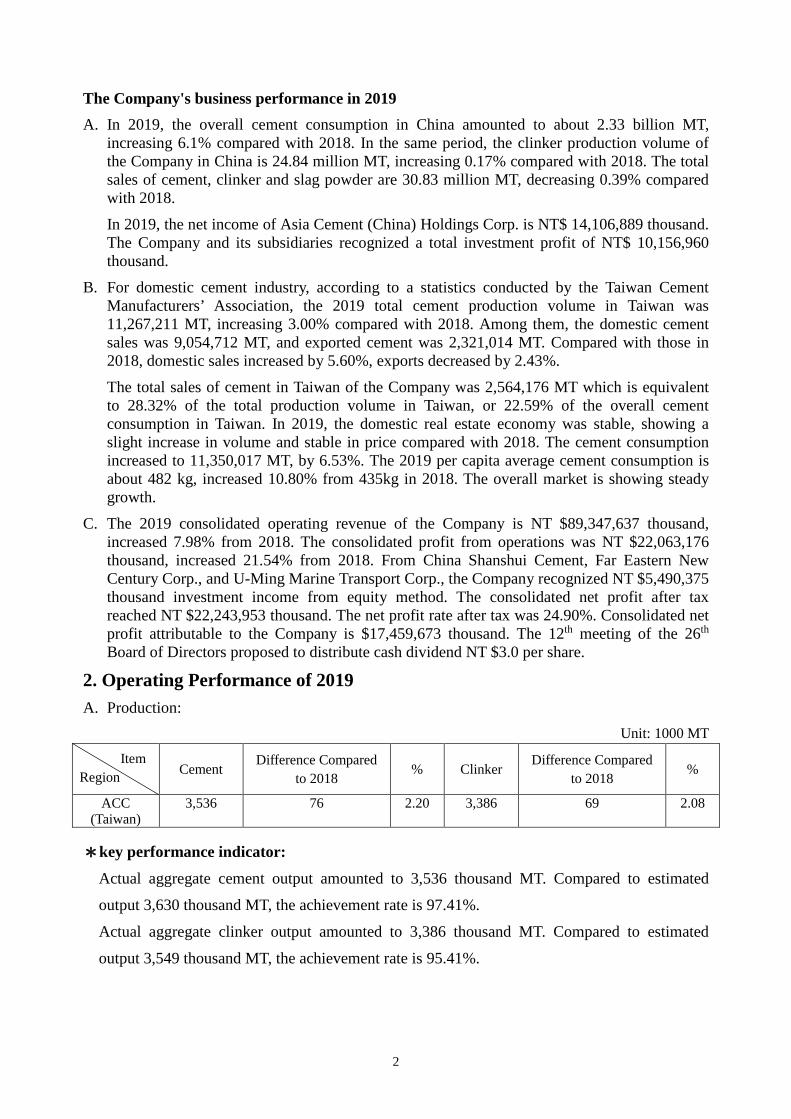
2. Operating Performance of 2019 A. Production:
Unit: 1000 MT
Item Region Cement
Difference Compared to 2018 % Clinker
Difference Compared to 2018 %
ACC (Taiwan)
3,536 76 2.20 3,386 69 2.08
*key performance indicator:
Actual aggregate cement output amounted to 3,536 thousand MT. Compared to estimated
output 3,630 thousand MT, the achievement rate is 97.41%.
Actual aggregate clinker output amounted to 3,386 thousand MT. Compared to estimated
output 3,549 thousand MT, the achievement rate is 95.41%.

3
Unit: 1000 MT
Item Region Cement
Difference Compared to 2018 % Clinker
Difference Compared to 2018 %
ACC (China)
28,747 (296) (1.02) 24,843 42 0.17
*key performance indicator:
Actual aggregate cement output amounted to 28,747 thousand MT. Compared to estimated
output 28,624 thousand MT, the achievement rate is 100.43%.
Actual aggregate clinker output amounted to 24,843 thousand MT. Compared to estimated
output 24,170 thousand MT, the achievement rate is 102.78%. B. Sales
i. Taiwan area:
Unit: 1000 MT; NT$1,000
Volume & Value
Product
2019 Difference Compared to 2018 Domestic Sales Export Sales
Volume Value Volume Value Volume % Value %
Cement & Clinker 2,608 5,792,210 1,039 1,835,779 135 3.84 391,991 5.42
*Key Performance Indicator:
Actual aggregate sales of cement and clinker produced by ACC amounted to 3,647 thousand MT.
Compared to the estimated sales 3,800 thousand MT, the achievement rate is 95.97%.
ii. China area:
Unit: 1000 MT; NT$1,000
Volume & Value
Product
2019 Difference Compared to 2018 Domestic Sales Export Sales
Volume Value Volume Value Volume % Value % Cement & Clinker 30,781 49,729,598 57 64,312 (57) (0.18) 2,748,606 5.84
*Key Performance Indicator:
Actual aggregate sales of cement and clinker produced by ACC (China) amounted to 30,838
thousand MT. Compared to the estimated sales 29,881 thousand MT, the achievement rate is
103.20%.
3. The Company’s Layout Strategy in China Asia Cement Corporation pioneered all domestic rivals to invest in cement business in
China with Taiwan government’s permission since 1997. On May 20, 2008, the subsidiary of the Company, Asia Cement (China) Holdings
4
Corporation {ACC (China) thereafter} was listed on the main board of Hong Kong Exchanges and Clearing Limited. Total assets reach RMB 24 billion.
Currently, the investments of ACC (China) are mainly based alone the Yangtze River in Jiangxi, Sichuan, Hubei, Yangzhou and Shanghai areas. The overall operating strategies are deployed through Jiangxi Yadong Cement (Southeast China), Sichuan Yadong Cement (Southwest China), Hubei Yadong Cement (Middle China), and Yangzhou Yadong Cement (East China) as core production bases. In addition to Sichuan Lanfeng Cement Corp., Huanggang Yadong Cement, and Wuhan Yaxin Cement, there are two grinding factories, five cement products companies, three transportation companies, Wuhan Asia Shipping Co., Ltd (joint-venture), Hubei Xinlongyuan Building Material Company(joint-venture), Hubei Zhongjian Yadong Concrete Company(joint-venture), Tai Zhou Oriental Construction Co., Ltd., Ruichang Yadong New Material Company, three terminals, and twelve sale offices. These constitute an efficient and solid network for production, transportation and sales.
4. Overview of The Company’s Investments in China A. Jiangxi Yadong Cement Co., Ltd
The company originally has six kilns with annual output of clinker 11 million MT of clinker, which can produce 14 million MT cement. Jiangxi Yadong has become one of the largest cement plants in China. The waste heat recycling generators can produce 338 million kWh electricity annually. This substantially reduces electricity costs and minimizes the dependence on external power supply.
B. Sichuan Yadong Cement Co., Ltd The company has three kilns with annual output of clinker 4.95 million MT which can
produce 6 million MT cement. In addition, the waste heat recycling generators can produce 145 million kWh electricity annually. This substantially reduces electricity costs and minimizes the dependence on external power supply.
The conveyor belt transporting the limestone from quarry directly to the plant enhance the transportation efficiency and lower raw-material cost and also completely prevent interfering with surrounding environments, roads, and living of residents.
C. Hubei Yadong Cement Co., Ltd The company has two kilns with annual output of clinker 3.3 million MT which can
produce 4 million MT cement. In addition, the waste heat recycling generators can produce 105 million kWh electricity annually. This substantially reduces electricity costs and minimizes the dependence on external power supply.
D. Huanggang Yadong Cement Co., Ltd The company has one kiln. The annual output of clinker amounts to 1.65 million MT
which can produce 2 million MT cement. E. Wuhan Yaxin Cement Co., Ltd
To enhance the market position and market share of the “Skyscraper” cement in Wuhan areas, Hubei Yadong Cement Co., Ltd acquired Wuhan Xinlingyun Engineering Co., Ltd on July 2010. The annual output of cement amounts to 1.5 million MT.
F. Sichuan Lanfeng Cement Corp. To enhance the market position and market share in Chengdu area, Sichuan Yadong
Cement Co., Ltd in 2014 acquired 100% shares of Sichuan Lanfeng Cement Corp. Lanfeng located in Pengzhou City, Sichuan, China which owns two new dry process clinker production
5
lines with total annual cement production capacity of 5 million MT. The waste heat recycling generators can produce 130 million kWh electricity annually.
G. Yangzhou Yadong Cement Co., Ltd The grinding factory can produce 3 million MT cement annually to supply the market in
Yangzhou area. Besides, the mixer station can produce ready-mixed concrete for the market. H. Wuhan Yadong Cement Co., Ltd
The company can produce 1.7 million MT cement and 0.6 million MT slag powder annually to supply the market in Wuhan area.
I. Nanchang Yadong Cement Co., Ltd The company can produce 0.6 million MT slag powder and 1.2 million MT slag cement
annually to supply the market in Nanchang area.
5. Prospects for the Economic Situations in 2020 A. Prospects for the international economic situation in 2020
Previously, the international economic outlook for 2020 was relatively flat, where the global economic outlook was fragile and unable to recover substantially. The novel coronavirus (COVID-19) epidemic in the beginning of the year had a significant impact on economic activities such as global production, consumption and trade. The momentum of global economic growth has slowed down even more, especially in the United States, which accounts for as much as one-third of global private consumption. The epidemic and epidemic control have dealt a double blow to both the supply and demand sides of the global economy. The global economic outlook is in jeopardy, and the market atmosphere has deteriorated sharply, resulting in significant volatility in international financial markets. Moreover, according to simulations of the International Labor Organization (ILO) in March 2020, it is known that even in the scenario with the smallest impact of the epidemic, the number of global unemployment would increase by 5.3 million, and at the peak of the impact, it would increase to 24.7 million, surpassing the number of global unemployment rate of 22 million during the financial crisis in 2008. The International Monetary Fund (IMF) released the latest World Economic Outlook on April 14, 2020, which predicts that global GDP will shrink by 3% in 2020 and will experience the worst economic recession since the Great Depression of 1930. Although global GDP is expected to rise to 5.8% next year, the international economic outlook will be affected by the follow-up development of trade disputes between the US and China, a faster-than-expected economic slowdown in China, the trend of international oil prices, financial market volatility, the US presidential election and the future economic and trade relations between the UK and the EU.
B. Prospects for the domestic economic situation in 2020 The novel coronavirus (covid-19) outbreak in 2020 has affected global economic growth, and Taiwan's domestic and external demand performance was also greatly affected. Taiwan's economic situation was originally weakened by a prolonged standoff in the trade dispute between China and the United States and weak overseas demand. However, at the same time, Taiwan also benefited from the trade diversion effect, repatriation of investment by Taiwan’s merchants and expansion of investment in semiconductor equipment, which boosted domestic demand growth. The economic situation evaluated by Academia Sinica is "cold outside and warm inside," with an economic growth rate of 2.58%. However, after the outbreak of COVID-19, although the export is facilitated by the reflow and expansion of production capacity of Taiwanese

6
merchants and the development of 5G, artificial intelligence and the Internet of things and other emerging applications, the expansion might be affected. The momentum of private investment in green energy such as semiconductors and offshore wind power continues. In addition, private investment is expected to continue to grow steadily as Taiwanese merchants return to Taiwan. Due to the impact of the epidemic, the growth of private consumption has slowed down significantly. Domestic tourism, catering and other outdoor activities have declined sharply. In addition, some enterprises closed their businesses or reduced their shifts, resulting in the loss of employees' income and the reduction of consumption expenditure. Fortunately, with the booming development of e-commerce and delivery platforms, the overall impact has been somewhat reduced. According to the latest assessment released by the Asian Development Bank in April 2020, Taiwan’s economic growth rate is revised to 1.8% this year. Although it is revised down, it still performs relatively well among the four Asian dragons. Meanwhile, the forecast of the Chung-hua Institution for Economic Research at the same time is relatively optimistic, with the GDP growth rate of 1.03% in 2020, which is 1.68% lower than 2.71% in 2019. According to the Central Bank, the future uncertainties include the future development of COVID-19, the implementation of the China-U.S. trade agreements and the follow-up negotiations, international stock, foreign exchange and bond market fluctuations, the price trend of oil and other raw materials, and the impact of geopolitical situation on the global economy.
6. Prospects for the cement industry on both sides across the Taiwan Straits
A. Cement industry in China
In 2020, affected by covid-19, China suffered a 6.8% economic recession in Q1. However, China has put forward the "six guarantees"1 policy and launched economic stimulus measures, and it is estimated that the annual economic growth will be between 2% and 3%. Compared with 2.33 billion MT in 2019, the cement demand is still expected to be in the range of 2.2 to 2.3 billion MT this year.
The coal market is expected to see a small price decline in 2020 as supply is eased; oil prices will remain low as demand for oil declines due to the widening of the global epidemic.
The operating outlook of the cement industry in China is as follows. a. COVID-19 epidemic has a far-reaching impact: The new trading mode will transform the
existing pattern, and the networked, mobile and intelligent sales mode will become the new development direction. With a serious epidemic overseas and economic turmoil, investment, import and export will be curbed, and the pace of investment by Chinese enterprises overseas will slow down. Cement kilns are actively engaged in the coordinated disposal of medical waste, which will become a new growth point after the epidemic.
b. The trend of continued tightening of supply in the sector remains unchanged: i. Capacity replacement2 is more stringent:
Capacity replacement activities will be strictly regulated, and companies will be prohibited from building new capacity or building more capacity than previously
1 "Six guarantees" refer to ensuring employment of residents, basic livelihood, market players, food and
energy security, industrial and supply chain stability, and community-level operation.
2 "Capacity replacement" means the elimination of backward production capacity and the realization of industrial upgrading by means of marketization, so as to control the industrial capacity.
7
approved by the government. In 2020, some provinces and regions will directly stop the production capacity replacement of cement enterprises in any form.
ii. Improvement to the Staggered Peak Production policy: The Staggered Peak Production policy continues to be refined and perfected, and the overall coverage is more extensive. By setting exemption thresholds for environmental protection emissions and safe production, the conditions for exemption from Staggered Peak Production3 will be more stringent, and the balance between supply and demand of cement will be more stable.
c. Economic Recovery: Infrastructure is the top priority, while the demand for cement shall be stabilized: i. In order to reduce the impact of the COVID-19 epidemic on the economy, China's fiscal
policy will be active in 2020, and the scale of the annual special bond issue will exceed RMB 4 trillion, with a new special bond amount of RMB 350 billion mainly deployed among new infrastructure projects concerning the 5G network, ultra-high voltage, intercity high-speed rail and intercity rail transportation, etc. to effectively stabilize cement demand.
ii. China is actively promoting regional strategies and city cluster construction in China, including transportation construction, Yangtze River Delta integration and the establishment of The Guangdong-Hong Kong-Macau Greater Bay Area and Xiongan New Area. At the same time, China has further expanded its inland liberalization efforts with the establishment of the Jiangxi Inland Open Economic Experimental Zone, bringing incremental demand for cement in the region.
d. Coordination among enterprises for increased concentration: During the epidemic, the coordination, linkage and joint anti-risk capabilities of large enterprises have become prominent, and the advantages of market coordination have gradually emerged. In response to the new changes in the post-epidemic era, large cement groups will initiate a new round of industry mergers and acquisitions in the future to centralize their resource advantages and take the initiative to grasp the market.
e. The era of smart factory is approaching: In 2019, in the cement industry, there are intelligent cement production lines with intelligent production as the core, where operation and maintenance can provide protection and intelligent management can promote operation. As a result, the cement industry has achieved the results of factory operation automation, management visualization, fault pre-control, all-factor coordination and decision-making intelligence, leading the industry to a new direction of development, and it has become a trend for the industry as a whole to use new technology to upgrade smart factories.
f. The e-commerce platform and green logistics have become the standard: We will create and explore new paths for the development of production and marketing, closely connect with each other electronically, develop online e-commerce platforms, and use big data to form a close and efficient Internet development system. The stringent ban on overloading and more stringent environmental requirements for water and land transport have placed higher demands on industry transport. The automated and customized self-owned e-commerce platform and the green logistics system will become the new standard of the industry.
3 "Exemption from Staggered Peak Production" means refers to the situation where cement companies
that meet certain specific conditions to be exempt from performing staggered peak production.
8
g. Extending the industrial chain with resource advantages: Under the normal environmental protection control, resource development pays more attention to ecological protection and promotes the construction of green mines. Restrictions on river sand mining and sand and gravel shortages will prompt the sand and gravel industry to accelerate its transformation and upgrading. Cement giants have been investing in the sand and gravel aggregates industry to speed up the integration of resources, which will become a new profit growth point for the industry in the future.
B. Cement industry in Taiwan
In 2020, the novel coronavirus (COVID-19) epidemic spread from Asia to other parts of the world, and the international oil price collapsed at the beginning of the year, which made the global financial market volatile and Taiwan's economic growth performance facing severe challenges. In order to revive the domestic market, the government will accelerate the implementation of various public construction projects and tenders to expand domestic demand, and set a target of 95% success rate for this year's public construction projects. In addition, the total budget for 2020 includes $164.6 billion for public works projects, $100.5 billion as the special budget for forward-looking infrastructure projects, and $201.9 billion for operating and non-operating special funds, which is $467 billion in total, showing an increase of $81.8 billion or 21.3% compared to that in 2019.
In terms of real estate, the Ministry of the Interior announced that the number of Taiwan's total number of traded and transferred buildings in 2019 was 302,275, showing an annual increase of 8%. It was the first time in five years that the number reached 300,000, and the third consecutive year since its expansion and growth in 2017. The fundamentals of the housing market in 2020 remain solidly structured in terms of demand for owner-occupied housing, but the impact of the novel coronavirus (COVID-19) epidemic will cast a variable on the growth of the housing market.
Overall, due to the impact of COVID-19, the economic situation in 2020 is full of uncertainty. However, driven by the government's accelerated implementation of public works, the total demand for cement in Taiwan is still expected to be the same as last year.
7. Business Outlook of the Company in 2020 In 2020, Taiwan's cement industry is still in an environment of oversupply and fierce
competition. Regarding novel coronavirus (COVID-19) outbreaks, the Taiwanese government has been well advised to prevent them, and its epidemic control effect is world-renowned as all people follow the government's instructions. Therefore, the impact of the epidemic on the cement industry is relatively limited. It is expected that the company's performance this year will be like that of last year, and it will still be in a state of surplus.
As for China, owing the impact of the novel coronavirus (COVID-19) epidemic, the country's policy of extensive city closures has led to widespread work stoppages, which has led to a setback for Asia Cement (China)'s operations in the first four months of the year. But after May, the cement market in China entered its peak period in the first half of the year. In addition, stocks of cement companies in most regions have fallen to moderate or low levels due to the concentrated release of backlogged demand from the epidemic, which has caused cement prices to start rising. It can be expected that the overall profitability of Asia Cement (China) will stabilize quarter-on-quarter and is expected to continue to maintain the high prices of cement and profitability levels in 2019 as the market fully returns to normal.

9
Regardless of the business environment, we will do our best to stick to the established production and marketing strategy and consistently adhere to the policy of "high quality, high efficiency, high environmental protection and low cost."
In 2020, total domestic clinker production is expected to be 3,572 thousand MT, total cement production is expected to be 3,576 thousand MT and sales of self-produced cement and clinker are expected to be 3,822 thousand metric tons. In China, the production of clinker and cement is expected to reach 24,684 MT and 28,748 MT, with 30,100 MT of self-produced cement and clinker as the sales volume.
8. The Company's Operating Status in the First Quarter of 2020 For the first quarter of 2020, the Company's consolidated operating income was $13,138,882
thousand, which was 32% less than $19,385,675 thousand for the same period in 2019. The consolidated net income after tax was $1,130,599 thousand, which was 70% less than $3,810,086 thousand in the same period in 2019. The net after-tax profit attributable to the owner of the Company was $743,772 thousand.
10
II Company Profile
2.1 Date of Incorporation:
Paid-in Capital: NT$ 33,614,471,980.
Scope of Business: 01. C901030 Cement manufacturing 02. C901040 Ready-mixed concrete
manufacturing 03. B601010 Quarrying 04. C901050 Cement and ready-mixed
concrete products 05. C901990 Non-metallic mineral products 06. F111090 Whole sale of building materials 07. F211010 Retail sale of building materials 08. F401010 International trade 09. IZ06010 Tally and packing 10. A201010 Afforestation business
11. H701010 Developing, leasing, and selling residential and business buildings
12. H701020 Developing, leasing, and selling industrial factories
13. H703100 Real estate rental & leasing 14. H703090 Real estate sale & purchase 15. JE01010 Rental and leasing 16. G202010 Parking-lot business 17. G801010 Warehousing 18. I103060 Business management consultation
services 19. J101040 Waste treatment
In addition to permitted scope of business, the Company can broaden its business not prohibited or restricted by laws.
2.2 Company History
Responding to the Taiwan government’s second four-year economic development plan, Asia Cement Corporation (ACC) was founded on March 21, 1957 by Mr. Y.Z. Hsu and others. It built its first manufacturing plant in Hengshan Township, Hsinchu County. In 1973, in response to the government’s call to develop eastern Taiwan, the Company established its second plant in Hsincheng Township, Hualien County. Asia Cement and its “Skyscraper” brand cement have always occupied the core position in Taiwan’s cement business. For now, these two plants can produce 5 million MT of clinker annually.
Asia Cement uses the most modern rotary kilns and introduces waste-heat recycling generators to transform waste heat and hot air into electricity. In addition, for lower cement transportation costs, Asia Cement established storage and transportation facilities in the Keelung, Taichung, Kaohsiung, and Hualien harbor. It also invested in the Group’s U-Ming Marine Transport Co., Ltd., and began using U-Ming’s bulk carriers to transport cement around Taiwan. The Company’s “Three Highs and One Low” strategy, high quality, high efficiency, high environmental protection, and low cost, along with its management capability, have given the Company the competitive edge to efficiently face challenges in the market.
Asia Cement believes that economic growth and environmental protection can be achieved in parallel. Asia Cement introduces the most advanced dust collection equipment to effectively control the dust fall, keeping it far below the national standard. We are also dedicated to making our plant areas like a park especially with the Hualien plant spending tremendous manpower and
March 21, 1957.
11
resources to establish the greenhouse seedling system for cultivation of all kinds of indigenous plants and transplantation in the remaining walls of the mined areas of the quarry, which has brought excellent greening results acclaimed by various awards. In addition to being among the first receivers of ISO-14001 environmental management system certification, the Company has won the Enterprise Environmental Protection Award for 3 years. The Portland cement produced by the Hualien plant has also won international recognition this year by receiving the ISO-14067:2018 (Greenhouse Gases Carbon Footprints of Products), the ISO 14046: 2014 (Greenhouse Gases Water Footprints of Products), and the optimizing level of the BS 8001: 2017 for circular economy model maturity through SGS certification, making Asia Cement the first cement producer to receive the certification for circular economy standard, carbon footprint and water footprint at the same time in the world. In recent years, we have built a butterfly ecological park based on the existing beautified environment of the Hualien plant, luring thousands of visitors to experience the beauty of nature and receiving high recognition from the general public.
Besides establishing its core business, the Company also diversifies its investment by establishing Ya Tung Ready Mixed Concrete Co., Ltd. and Ya Li Precast & Prestressed Concrete Industries Ltd. Together with Far Eastern Construction Co., Ltd. and Far Eastern General Contractor Co., Inc., Asia Cement completed its vertical integration.
ACC’s diversification strategic layout for the world not only includes the complete production and sales channels in Taiwan, it also has representative offices in Hong Kong and Singapore. Furthermore, it is also expanding into the world market, exporting cement to Southeast Asia, North America, Africa, and the Middle East Asia. Meanwhile, Asia Cement began to invest in China from 1994. Currently, with the production and sale bases in Jiangxi, Sichuan, Hubei, Yangzhou, and Shanghai, the total cement production capacity in China reaches 36 million MT. Asia Cement (China) Holdings Corporation has listed on the Main Board of the Hong Kong Stock Exchange in 2008. Asia Cement (China) Holdings Corporation will continue expand capacity through strategy cooperation, or merger & acquisition.
In the future, Asia Cement will keep maintaining its deep roots in Taiwan and continue moving forward by expanding in China and worldwide.
Major events in recent 6 years are shown as the following table:
Year Major Events Feb. 2015 The Company received “Golden Vessel Awards” in honor of our contribution in
environment protection, Taiwan International Ports Corporation. Apr. 2015 The Company received A++ ranking award in the 12th “Information Transparency
and Disclosure Ranking System", Securities and Futures Institute. May 2015 The Company was ranked top 5% in “the 1st Corporate Governance Evaluation”
by the TWSE. June 2015 The Company is listed in “TWSE Corporate Governance 100 Index” Aug. 2015 The Company is ranked 39th in CommonWealth Magazine's Corporate Citizenship
Awards. Nov. 2015 The Hualien Plant was awarded “2015 Excellent Company for Voluntary
Reduction of Greenhouse Gas Emissions” by the Industrial Development Bureau, MOEA.

12
Nov. 2015 The Company’s CSR Report was awarded “Top 50 Corporate Sustainability Report-Gold Award”, TCSA.
Jan. 2016 The Company received 2015 GHG reduction award, EPA. Apr. 2016 The Company was ranked top 6%~20% in “the 2nd Corporate Governance
Evaluation” by the TWSE. Apr. 2016 Sichuan Yadong Cement Co., Ltd completed second conveyor belt transporting the
limestone from quarry directly to the plant on April 2016. Apr. 2016 Jiangxi Yadong Cement Co. was awarded the "Energy Management System
Certification". Jun. 2016 Huanggang Yadong Cement Co. was awarded the honorary certification of "Hubei
Famous Brand". Sep. 2016 Sichuan Lanfeng Cement Co. was awarded 2016 "Chengdu manufacturing top
hundred" and "Chengdu private enterprises top hundred". Nov. 2016 The Hualien Plant was awarded “2016 Excellent Company for Voluntary
Reduction of Greenhouse Gas Emissions” by the Industrial Development Bureau, MOEA.
Dec. 2016 Jiangxi Yadong was awarded the "3rd Mayor Quality Award" certification, in recognition of the company's outstanding contribution to the quality of the city's construction.
Dec. 2016 The Hualien plant obtained ISO 50001: 2011 energy management system certification in which Hsinchenshan Mine is also the first quarry in Taiwan obtained this certification.
Mar. 2017 The Hsinchenshan mining right of the Hualien plant of the Company is allowed to extent for 20 years to November 22, 2037.
Mar. 2017 Ccement.com announced the 2016 top 10 ranking of cement and clinker production capacity in China. ACC (China) ranked the 10th and won a top ten trophy.
Apr. 2017 The Company was ranked top 6%~20% in “the 3rd Corporate Governance Evaluation” by the TWSE.
Jun. 2017 The Hualien plant obtained ISO 14001:2015, the latest version of the environmental management system certification.
Jun. 2017 The Hualien plant obtained ISO 9001:2015, the latest version of the quality management system certification
Oct. 2017 Huanggang Yadong was awarded the “National Excellent Quality Unit for Cement Quality Inspection in 2017” by the National Cement Quality Supervision and Inspection Center.
Nov. 2017 The Hualien Plant was awarded “2017 Excellent Company for Voluntary Reduction of Greenhouse Gas Emissions” by the Industrial Development Bureau, MOEA.
Apr. 2018 Jiangxi Yadong was awarded “Advanced Unit for Safe Production Goal Management in 2017 in Jiujiang”.
Apr. 2018 The Company was ranked top 6%~20% in “the 4th Corporate Governance Evaluation” by the TWSE.
May 2018 Huanggang Yadong participated in the First "China Green Mining Development Conference" and won the third-class technical certificate.

13
Jul. 2018 Sichuan Yadong Phase II and Phase III independent environmental protection acceptance project has been approved by the construction project environmental impact assessment information platform.
Sep. 2018 In order to benefit the long-term development and in response to rapid changes in China, Asia Cement (China) has adjusted human resource deployed in headquarters and each business area.
Nov. 2018 Huanggang Yadong passed four certifications including the new ISO management system (quality, environment, occupational health and safety, energy management).
Nov. 2018 The Hualien plant was awarded the "International Health and Safety Management System " award.
Mar. 2019 The first phase of elite training classes of Asia Cement (China) ended in Hubei Yadong with 40 training successors.
Apr. 2019 The Company was ranked top 6%~20% in “the 5th Corporate Governance Evaluation” by the TWSE.
Apr. 2019 Jiangxi Yadong was awarded the annual advanced production safety management unit by the Ruichang City Government.
May 2019 Jiangxi Yadong was awarded the medal of "Excellent Enterprise of 2018" in Ruichang City.
May 2019 The Company is the first in Taiwan to win the "Asia Responsible Enterprise Awards" for two consecutive years (2018-2019).
Jun. 2019 Sichuan Yadong was granted the "Road Portland Cement Production License" issued by State Administration for Market Regulation, and obtained the production qualification of special cement for airport runways.
Oct. 2019 Sichuan Yadong and Huanggang Yadong won the "National Excellence Award" in the 17th National Cement Quality Index Inspection Competition of the "Gezhouba Cement Cup" in 2019.
Dec. 2019 Hualien Plant won the 2018 Far Eastern Spirit Award. Dec. 2019 Huanggang Yadong was selected as the "2019 Green Factory List in Hubei
Province". Jan.2020 Four mines of ACC (China) were selected by the Ministry of Natural Resources as
2019 Green Mines List. Mar. 2020 The China Cement Association announced the ranking of the top 50 companies in
the country's cement clinker production capacity in 2020, and Asia Cement (China) ranked 10th.
Apr. 2020 The Company is ranked top 20% of the 6th Corporate Governance Evaluation of listed companies.
May 2020 Hualien Plant obtained ISO 14067: 2018 product carbon footprint standard, ISO 14046: 2014 product water footprint standard, BS 8001: 2017 the highest maturity level of circular economy, and was the first cement plant to obtain 3 verifications at the same time.
During the most recent fiscal year and the current fiscal year up to the date of printing of the annual report, there are no important events listed below impacting on the shareholders’ equity of the Company: 1. Mergers and acquisitions. 2. To restructure affiliate companies. 3. Large volume shares transferred or changed by directors, supervisors, or major shareholders who own more than 10% shareholding. 4. Changes in the Company’s management. 5. Significant changes in business modes or business scope.

- 14 - -14-
III Corporate Governance Report
3.1 Organization
3.1.1 Organization Chart
Audit Committee
Chief Engineer Chief Auditor
CSR Committee
President Office
General Plant Manager
___________Administration System
…………….. Technology System
IT Steering Committee
Shareholders’ Meeting
Chairman
Vice Chairman
Vice President
Board of Directors
President
Hualien Plant
Hsinchu Plant Dept.
Export Sales Dept
Finance Dept. Dept.
Domestic Sales Dept
Secretarial Dept.
Auditing Dept.
Human Resource Committee
Credit Committee
HR Dept.
Remuneration Committee

15
3.1.2 Major Corporate Functions Company Organization with Functions of Risk Management
Department Primary Functions Auditing Dept.
Directly report to the Board of Directors. Major duties: 1.Fair presentation of the financial reports, 2.The hiring (and dismissal), independence, and performance of CPA, 3.The effective implementation of the internal control system, 4.Compliance with relevant laws and regulations, and 5.Management of the existing or potential risks.
Remuneration Committee
Directly report to the Board of Directors. Prescribe and periodically review the performance and remuneration policy for directors and managerial officers.
President Office
Assist ACC President to deal with daily affairs, plan operation strategies, and review the middle-term and long-term investment to reduce the risks resulting from improper decisions.
HR Dept. Plan and implement HR policies to reduce relevant risks. HR Department is also responsible for promoting ethical management of the Company.
CSR Committee
Responsible for investigating and identifying corporate sustainability issues and to respond major considerations of stakeholders in order to implement the goal of sustainable development.
Credit Committee
Execute “Regulations for Managing Client’s Credit” enacted by the Company and take charge of risk control of account receivable.
Human Resource Committee
Review and advice to modify the Company’s organization structure, rules of personnel management, and other important human resource matters.
IT Steering Committee
Review all affairs relating to information operation system, office automation, internal and external website applications and information security to the needs of operation, management and provide strategy to prevent the risk of information security and its efficiency.
Secretarial Dept.
Handle the affairs of general services, secretary, legal affairs, public relations, etc. Reinforce legal sense of employees to decrease the risks of violating law.
Occupational Safety Office
Responsible for occupational safety and health management, formulating policies and supervising related affairs to ensure safety of workers and reduce the risk and loss of occupational hazards.
Accounting Dept.
Handle all accounting matters including the costs, accounts, taxation to ensure management efficiency of the Company’s operation, the reliability of financial report, and the adherence of related accounting regulations to reduce company operation risks.
Finance Dept. Responsible for financial operation strategy, investment strategy, financial management, and dividend strategy, as well as investor relationship in order to minimize financial exposure, uphold financial opportunity and maximize shareholders’ best interest.
Domestic Sales Dept.
Plan and implement domestic marketing strategy, credit customers, and identify market trends to achieve business goals and reduce relevant risks.
Export Sales Dept.
Plan and implement oversea marketing strategy, credit customers, and identify market trends to achieve business goals and reduce relevant risks.
Purchasing Dept.
Handle all purchasing and contract issuing matters, setting up hedging mechanism to cope with changes in raw materials prices and shortage of raw materials supply.
Hsinchu Plant Hualien Plant
Take charge of R&D, production technology, quality control, planning production policies in collaboration with sales strategies to reduce production risks.
16
The Company has established an information security risk management framework: An IT Steering Committee was established to review internal information application
systems, office automation, network information, and information security protection measures on a quarterly basis, and to provide tools for operations, management, and decision-making to reduce information security and benefit management risks. We have established “Asia Cement Personal Data Protection Management Measures” and “Asia Cement Computerized Information System Processing” in accordance with Articles 8 and 9 of the Regulations Governing Establishment of Internal Control Systems by Public Companies; in addition, the “Information and Communication Security Inspection Audit” has been incorporated into our 2019 and 2020 annual audit plans. The aforesaid measures have all been submitted to and approved by the Board of Directors. Information security policy:
Our "Computerized Information System Processing" regulates the management system for various types of IT data and information in the process of output, use, and preservation. Besides, the "Regulations for Use of IT Equipment and Information Software by Employees", regulates various information security behaviors that employees must observe in carrying out their business. Specific management plan:
A total of 20 inspections were carried out in 2019, including the "Information Security Audit" (once) "Information System Internal Control Self-assessment" (twice), "SAP Sensitive Permission Authorization and Function Conflict Anomaly Check" (quarterly) and" SAP Super User Sensitive Transaction Check" (monthly) performed each by an external unit and an internal audit unit.

-17-
3.2 Directors, Supervisors and Management Team
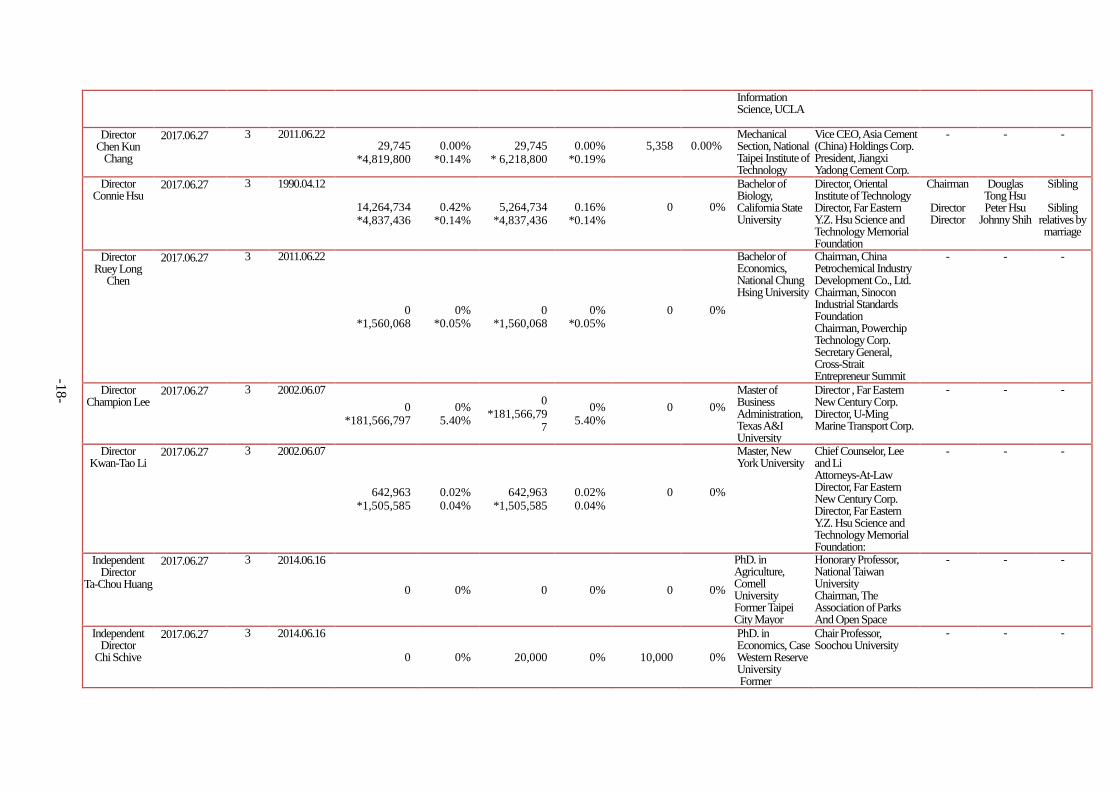
3.2.1 Directors and Supervisors Title
Name Elected Date Term
(Years) Date First Elected
Shareholding when Elected Current Shareholding Spouse & Minor Shareholding
Experience (Education)
Other Position Executives, Directors or Supervisors who are spouses or within two degrees
of kinship Shares % Shares % Shares % Title Name Relation
Chairman Douglas Tong
Hsu
2017.06.27 3 1975.04.28
23,278,334 0.69% 23,278,334 0.69% 6,352,467 0.19%
Honorary Doctor, Chiao Tung University Master of University of Notre Dame, Master of Economics, Columbia University
Chairman, Far Eastern New Century Corp. Chairman, Far Eastone Telecommunications Co., Ltd Chairman, Far Eastern Department Stores Ltd.
Director Director Director
Connie Hsu Peter Hsu
Johnny Shih
Sibling Sibling
relatives by marriage
Director Tsai Hsiung
Chang
2017.06.27 3 1981.04.24
459,350 *750,511,324
0.01% *22.33%
459,350 *750,511,32
4
0.01% *22.33%
110,877
0.00%
Mechanical Technology Section, National Central Industrial College (Chongqing)
Senior Advisor, Asia Cement (China) Holdings Corp. Director, U-Ming Marine Transport Corp. Director, Yuan Ze Uni.
- - -
Director Johnny Shih
2017.06.27 3 1984.04.25
453,745 *750,511,324
0.01% *22.33%
453,745 *750,511,32
4
0.01% *22.33%
7,225,993
0.21%
Master of Computer, Columbia University
Vice Chairman, Far Eastern New Century Corp. Vice Chairman, Oriental Union Chemical Corp.
Chairman
Director
Director
Douglas Tong Hsu
Connie Hsu
Peter Hsu
relatives by marriage
relatives by marriage
relatives by marriage
Director C.V. Chen
2017.06.27 3 1987.04.16 338,429
*750,511,324 0.01%
*22.33%
338,429 *750,511,32
4
0.01% *22.33%
0
0%
S.J.D., Harvard University
Senior Partner, Lee and Li Attorneys-At-Law Chairman, Taipei European School
- - -
Director Chin-Der Ou
2017.06.27 3 2005.06.09 0 *3,849,468
0% *0.11%
0 *3,849,468
0% *0.11%
0
0%
Ph.D., Case Western Reserve University
Director, Taiwan Construction Research Institute
- - -
Director Kun Yen Lee
2017.06.27 3 2005.06.09 2,361,557
*1,895,136 0.07%
*0.06% 2,361,557
*1,895,136 0.07%
*0.06% 0
0%
Yi-Lan Elementary School
President, Asia Cement Corp. Director, U-Ming Marine Transport Corp.
- - -
Director Peter Hsu
2017.06.27 3 2002.06.07
13,454,981 *4,819,800
0.40% *0.14%
13,454,981 *6,218,800
0.40% *0.19%
0
0%
Master of Operations Research, Stanford University Master of
Vice Chairman, Far Eastern New Century Corp. Director, Far Eastone Telecommunications Co., Ltd
Chairman
Director Director
Douglas Tong Hsu
Connie Hsu Johnny Shih
Sibling
Sibling relatives by marriage
-18-
Information Science, UCLA
Director Chen Kun
Chang
2017.06.27 3 2011.06.22 29,745
*4,819,800 0.00%
*0.14% 29,745
* 6,218,800 0.00%
*0.19% 5,358
0.00%
Mechanical Section, National Taipei Institute of Technology
Vice CEO, Asia Cement (China) Holdings Corp. President, Jiangxi Yadong Cement Corp.
- - -
Director Connie Hsu
2017.06.27 3 1990.04.12
14,264,734 *4,837,436
0.42% *0.14%
5,264,734 *4,837,436
0.16% *0.14%
0
0%
Bachelor of Biology, California State University
Director, Oriental Institute of Technology Director, Far Eastern Y.Z. Hsu Science and Technology Memorial Foundation
Chairman
Director Director
Douglas Tong Hsu Peter Hsu
Johnny Shih
Sibling
Sibling relatives by marriage
Director Ruey Long
Chen
2017.06.27 3 2011.06.22
0 *1,560,068
0% *0.05%
0 *1,560,068
0% *0.05%
0
0%
Bachelor of Economics, National Chung Hsing University
Chairman, China Petrochemical Industry Development Co., Ltd. Chairman, Sinocon Industrial Standards Foundation Chairman, Powerchip Technology Corp. Secretary General, Cross-Strait Entrepreneur Summit
- - -
Director Champion Lee
2017.06.27 3 2002.06.07 0
*181,566,797 0%
5.40%
0 *181,566,79
7
0% 5.40%
0
0%
Master of Business Administration, Texas A&I University
Director , Far Eastern New Century Corp. Director, U-Ming Marine Transport Corp.
- - -
Director Kwan-Tao Li
2017.06.27 3 2002.06.07
642,963 *1,505,585
0.02% 0.04%
642,963 *1,505,585
0.02% 0.04%
0
0%
Master, New York University
Chief Counselor, Lee and Li Attorneys-At-Law Director, Far Eastern New Century Corp. Director, Far Eastern Y.Z. Hsu Science and Technology Memorial Foundation:
- - -
Independent Director
Ta-Chou Huang
2017.06.27 3 2014.06.16
0 0% 0 0% 0 0%
PhD. in Agriculture, Cornell University Former Taipei City Mayor
Honorary Professor, National Taiwan University Chairman, The Association of Parks And Open Space
- - -
Independent Director
Chi Schive
2017.06.27 3 2014.06.16
0 0% 20,000 0% 10,000 0%
PhD. in Economics, Case Western Reserve University Former
Chair Professor, Soochou University
- - -
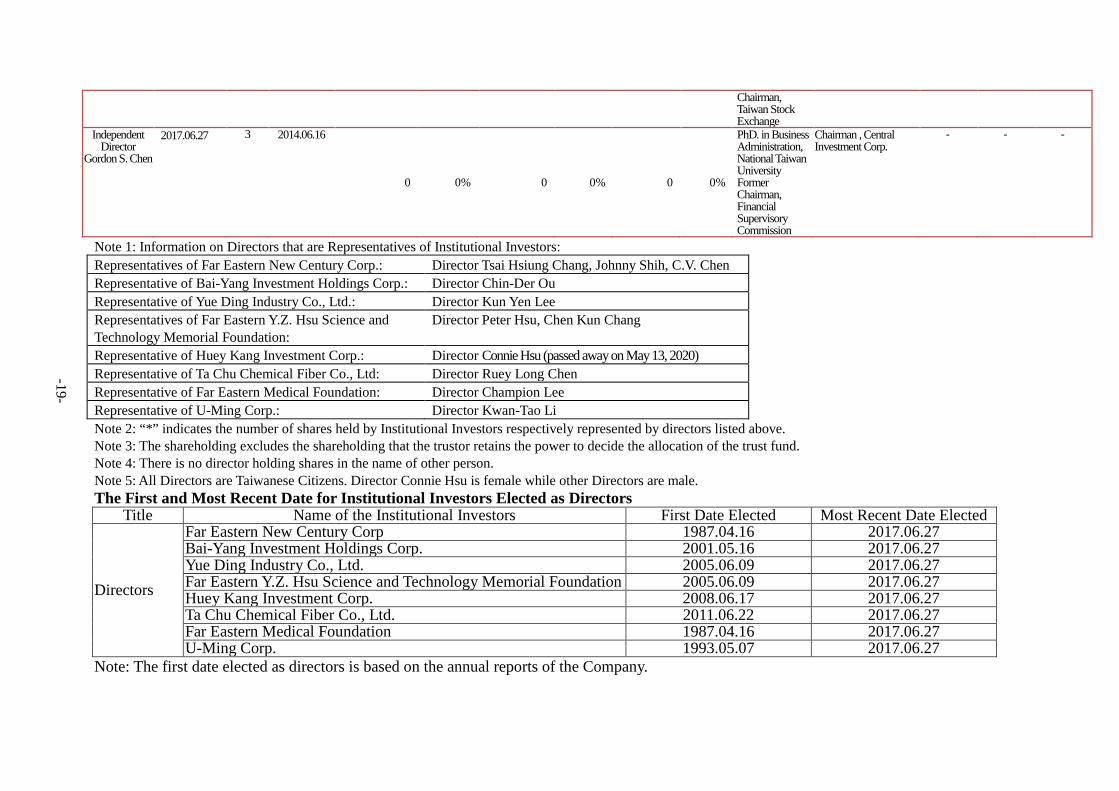
-19-
Note 1: Information on Directors that are Representatives of Institutional Investors: Representatives of Far Eastern New Century Corp.: Director Tsai Hsiung Chang, Johnny Shih, C.V. Chen Representative of Bai-Yang Investment Holdings Corp.: Director Chin-Der Ou Representative of Yue Ding Industry Co., Ltd.: Director Kun Yen Lee Representatives of Far Eastern Y.Z. Hsu Science and Technology Memorial Foundation:
Director Peter Hsu, Chen Kun Chang
Representative of Huey Kang Investment Corp.: Director Connie Hsu (passed away on May 13, 2020) Representative of Ta Chu Chemical Fiber Co., Ltd: Director Ruey Long Chen Representative of Far Eastern Medical Foundation: Director Champion Lee Representative of U-Ming Corp.: Director Kwan-Tao Li Note 2: “*” indicates the number of shares held by Institutional Investors respectively represented by directors listed above. Note 3: The shareholding excludes the shareholding that the trustor retains the power to decide the allocation of the trust fund. Note 4: There is no director holding shares in the name of other person. Note 5: All Directors are Taiwanese Citizens. Director Connie Hsu is female while other Directors are male. The First and Most Recent Date for Institutional Investors Elected as Directors
Title Name of the Institutional Investors First Date Elected Most Recent Date Elected
Directors
Far Eastern New Century Corp 1987.04.16 2017.06.27 Bai-Yang Investment Holdings Corp. 2001.05.16 2017.06.27 Yue Ding Industry Co., Ltd. 2005.06.09 2017.06.27 Far Eastern Y.Z. Hsu Science and Technology Memorial Foundation 2005.06.09 2017.06.27 Huey Kang Investment Corp. 2008.06.17 2017.06.27 Ta Chu Chemical Fiber Co., Ltd. 2011.06.22 2017.06.27 Far Eastern Medical Foundation 1987.04.16 2017.06.27 U-Ming Corp. 1993.05.07 2017.06.27
Note: The first date elected as directors is based on the annual reports of the Company.
Chairman, Taiwan Stock Exchange
Independent Director
Gordon S. Chen
2017.06.27 3 2014.06.16
0 0% 0 0% 0 0%
PhD. in Business Administration, National Taiwan University Former Chairman, Financial Supervisory Commission
Chairman , Central Investment Corp.
- - -

-20-
3.2.2 Major Shareholders of the Institutional Shareholders Name of Institutional
Shareholder Major Shareholder of the Institutional
Shareholders %
Far Eastern New Century Corporation
Asia Cement Corporation 23.77 Oriental Institute of Technology 4.81 Far Eastern Medical Foundation 3.61 Far Eastern Memorial Foundation 3.42 Nan Shan Life Insurance Co. , Ltd. 2.89 Yuan-Ze University 2.74 China Life Insurance Co., Ltd. 1.85 Douglas Tong Hsu 1.71 Der Ching Investment Corp. 1.55 ChungHwa Post Co., Ltd. 1.38
Far Eastern Medical Foundation
Y. Z. Hsu 76.90 He Zongyan 2.31 Wang Shu-peng 2.31 Hsu Wei Yuan 2.31 Huang Ying Chung 2.31 Douglas Tong Hsu 2.31 Laurence M. Yang 2.31 John Hsu 2.31 Johnny Shih 2.31 S.S. Hsu 2.31 Yu Wei San 2.31
Far Eastern Y. Z. Hsu Science and Technology Memorial Foundation
Far Eastern International Bank 25.00 Far Eastern New Century Corporation (Original from Far Eastern Textile Ltd.) 23.00
Asia Cement Corporation 18.00 Far EasTone Telecommunications Co., Ltd 8.00 Far Eastern Department Stores Co.,Ltd. 8.00 U-Ming Marine Transport Corp. 4.00 Oriental Union Chemical Corp. 4.00 Yuan Ding Investment Company 2.00 Oriental Securities Co., Ltd. 2.00
Huey Kang Investment Corp. Connie Hsu 50.58 H.G. Yang 24.71 H.M. Yang 24.71
Bai Yang Investment Corp. Far Eastern Department Stores Co., Ltd. 100.00 U-Ming Corp. Far Eastern Department Stores Co., Ltd. 100.00
Yue Ding Industry Co.,Ltd.
Fu Da Transportation Co., Ltd. 26.95 Yue-Tung Investment Corp. 25.36 An Ho Garment Co., Ltd. 15.66 Ding Yuan International Investment Corp. 13.20 Ton Fu Investment Corp. 4.61 Ta Chu Chemical Fiber Co., Ltd. 3.89 Ya Li Precast Prestressed Concrete Industries Corp. 3.89
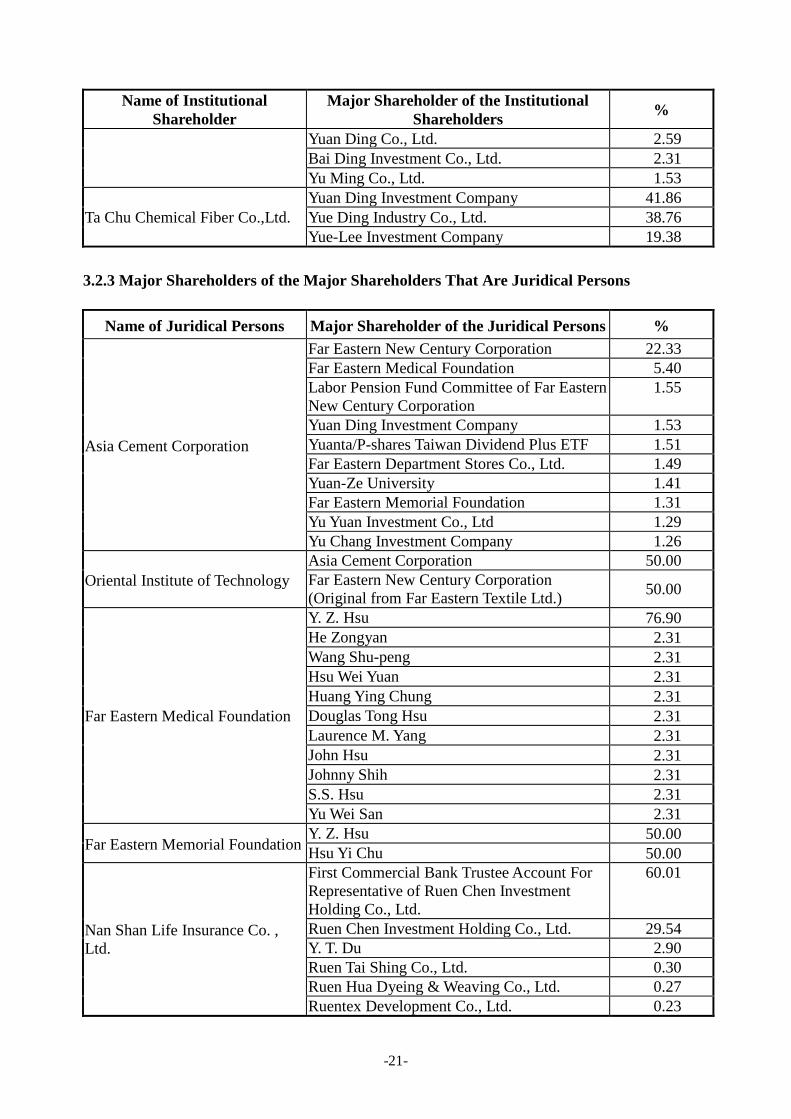
-21-
Name of Institutional Shareholder
Major Shareholder of the Institutional Shareholders %
Yuan Ding Co., Ltd. 2.59 Bai Ding Investment Co., Ltd. 2.31 Yu Ming Co., Ltd. 1.53
Ta Chu Chemical Fiber Co.,Ltd. Yuan Ding Investment Company 41.86 Yue Ding Industry Co., Ltd. 38.76 Yue-Lee Investment Company 19.38
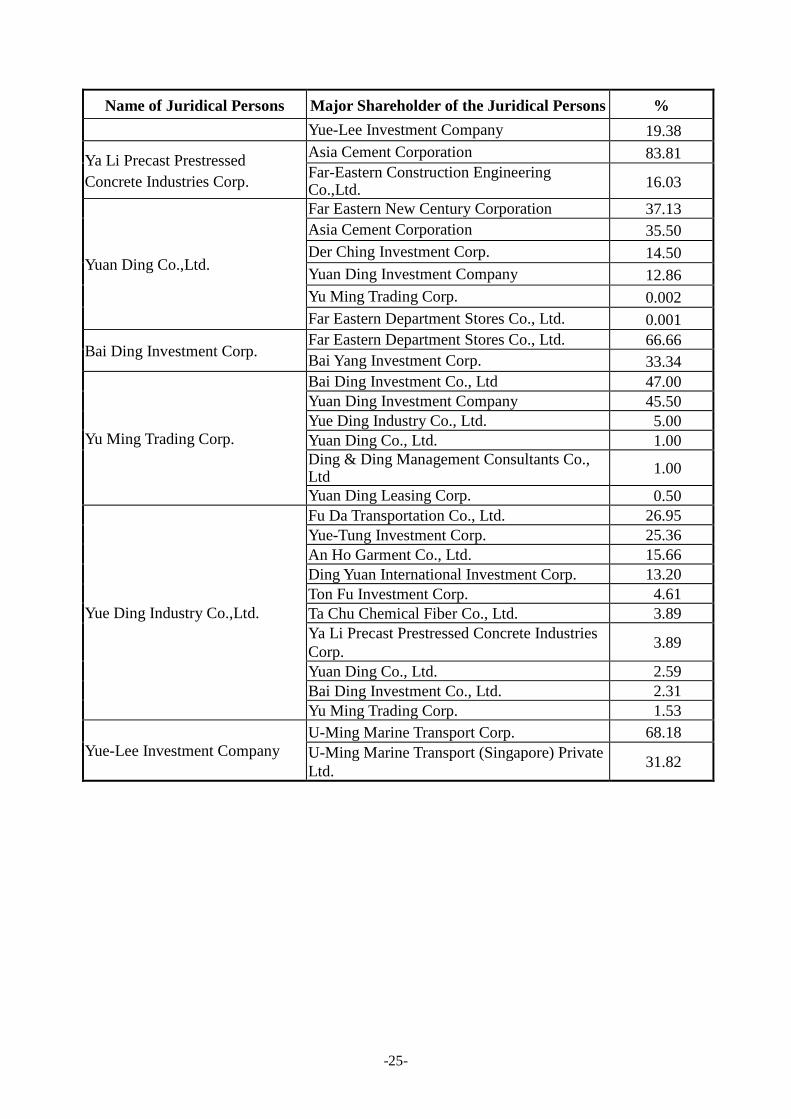
3.2.3 Major Shareholders of the Major Shareholders That Are Juridical Persons
Name of Juridical Persons Major Shareholder of the Juridical Persons %
Asia Cement Corporation
Far Eastern New Century Corporation 22.33 Far Eastern Medical Foundation 5.40 Labor Pension Fund Committee of Far Eastern New Century Corporation
1.55
Yuan Ding Investment Company 1.53 Yuanta/P-shares Taiwan Dividend Plus ETF 1.51 Far Eastern Department Stores Co., Ltd. 1.49 Yuan-Ze University 1.41 Far Eastern Memorial Foundation 1.31 Yu Yuan Investment Co., Ltd 1.29 Yu Chang Investment Company 1.26
Oriental Institute of Technology Asia Cement Corporation 50.00 Far Eastern New Century Corporation (Original from Far Eastern Textile Ltd.) 50.00
Far Eastern Medical Foundation
Y. Z. Hsu 76.90 He Zongyan 2.31 Wang Shu-peng 2.31 Hsu Wei Yuan 2.31 Huang Ying Chung 2.31 Douglas Tong Hsu 2.31 Laurence M. Yang 2.31 John Hsu 2.31 Johnny Shih 2.31 S.S. Hsu 2.31 Yu Wei San 2.31
Far Eastern Memorial Foundation Y. Z. Hsu 50.00 Hsu Yi Chu 50.00
Nan Shan Life Insurance Co. , Ltd.
First Commercial Bank Trustee Account For Representative of Ruen Chen Investment Holding Co., Ltd.
60.01
Ruen Chen Investment Holding Co., Ltd. 29.54 Y. T. Du 2.90 Ruen Tai Shing Co., Ltd. 0.30 Ruen Hua Dyeing & Weaving Co., Ltd. 0.27 Ruentex Development Co., Ltd. 0.23

-22-
Name of Juridical Persons Major Shareholder of the Juridical Persons % Ruentex Industries Ltd. 0.21 Taishin International Bank Trust Account of Nan Shan Life Insurance Co., Ltd.
0.21
Yen Sin Corporation 0.16 Ruentex Leasing Co., Ltd. 0.13
Yuan-Ze University
U-Ming Marine Transport Corp. 55.21 Far Eastern Medical Foundation 26.05 Far Eastern New Century Corporation (Original from Far Eastern Textile Ltd.)
5.52
Fu Ming Transportation Co., Ltd. 5.25 Far Eastern Memorial Foundation 4.91 Asia Cement Corporation 2.76 Connie Hsu 0.28 Y. Z. Hsu 0.01 Yu Chao-Chung 0.01
China Life Insurance Co., Ltd.
China Development Financial Holding Corp. 26.16 KGI Securities Co., Ltd 8.66 Cathay Life Insurance Co. , Ltd. 3.04 Videoland Inc. 2.42 Labor Pension Fund (the New Fund) 1.61 Linglang Zhan 1.24 PGIA Comprehensive International Stock Index Fund Dedicated Account, managed by PGIA, under custody of JP Morgan, Taipei Branch.
1.21
Citi as Trustee For The Government of Singapore Investment Corp.
1.17
The Norwegian Central Bank Investment Dedicated Account, under custody of CITI Bank
1.12
Labor Insurance Fund 1.03
Der Ching Investment Corp. Asia Cement Corporation 99.99 Asia Investment Corp. 0.01
ChungHwa Post Co., Ltd. Ministry of Transportation and Communications 100.00
Far Eastern International Bank
Yu Yuan Investment Co., Ltd. 4.95 Yue Li Investment Corp. 4.39 Asia Investment Corp. 4.03 Der Ching Investment Corp. 4.03 Yue-Tung Investment Corp. 3.89 Yuan Ding Investment Co., Ltd. 3.56 Kai Yuan International Investment Co., Ltd. 3.21 Yuan Tong Investment Co., Ltd. 3.20 Special Account for trust property of Far Eastern International Bank employee in custody of FEIB
3.10

-23-
Name of Juridical Persons Major Shareholder of the Juridical Persons % Ding Yuan International Investment Corp. 2.64
Far Eastern New Century Corporation
Asia Cement Corporation 23.77 Oriental Institute of Technology 4.81 Far Eastern Medical Foundation 3.61 Far Eastern Memorial Foundation 3.42 Nan Shan Life Insurance Co. , Ltd. 2.89 Yuan-Ze University 2.74 China Life Insurance Co., Ltd. 1.85 Douglas Tong Hsu 1.71 Der Ching Investment Corp. 1.55 ChungHwa Post Co., Ltd. 1.38
Far EasTone Telecommunications Co., Ltd
Yuan Ding Investment Co., Ltd. 32.73 Shin Kong Life Insurance Co., Ltd. 9.70 Cathay Life Insurance Co., Ltd. 6.89 NTT DOCOMO Inc. 4.71 ChungHwa Post Co., Ltd. 3.24 Yuan Tong Investment Co., Ltd. 3.08 Fubon Life Insurance Co., Ltd. 1.92 Nan Shan Life Insurance Co., Ltd. 1.82 An Ho Garment Co., Ltd. 1.25 Taiwan Life Insurance Co, Ltd. 1.17
Far Eastern Department Stores Co.,Ltd.
Far Eastern New Century Corporation 17.06 PJ Asset Management Co., Ltd. 7.75 Asia Cement Corporation 5.65 Yuan Ding Investment Co., Ltd. 5.33 Chia Yuan Investment Company 5.05 Yuan-Ze University 4.75 Yuan Tong Investment Co., Ltd 3.61 The Norwegian Central Bank Investment Dedicated Account, under custody of CITI Bank
2.26
The committee of Employee Pension Fund of Far Eastern Department Stores Co., Ltd.
2.11
Yu Yuan Investment Co., Ltd 2.06
U-Ming Marine Transport Corp.
Asia Cement Corporation 39.25 Public Service Pension Fund Management Board
2.08
Cathay Life Insurance Co., Ltd. 1.60 Yuan Ding Investment Co., Ltd. 1.05 Fubon Life Insurance Co., Ltd. 1.04

-24-
Name of Juridical Persons Major Shareholder of the Juridical Persons % Cape Ann Global Developing Markets Fund Investment Dedicated Account, under custody of Bank of Taiwan
1.00
Yu Yuan Investment Co., Ltd 0.94 Ding Shen Investment Co., Ltd. 0.94 TransGlobe Life Insurance Co., Ltd. 0.93 Asia Investment Co., Ltd. 0.92
Oriental Union Chemical Corp.
Far Eastern New Century Corporation 9.17 Yuan Ding Investment Company 8.00 Asia Cement Corporation 7.20 Yuan Tong Investment Co., Ltd 5.61 Yu Yuan Investment Co., Ltd 3.75 Kai Yuan International Investment Co., Ltd. 3.67 Ding Yuan International Investment Co., Ltd. 3.09 Fubon Life Insurance Co., Ltd. 2.80 Cathay Life Insurance Co., Ltd. 2.47 Ton Fu Investment Corp. 1.55
Yuan Ding Investment Company Far Eastern New Century Corporation 99.40 An Ho Garment Co.,Ltd. 0.30 Ta Chu Chemical Fiber Co.,Ltd. 0.30
Oriental Securities Co., Ltd.
Yuan Ding Investment Company 25.96 Far Eastern Department Stores Co.,Ltd. 19.66 Far Eastern New Century Corporation 19.65 Asia Cement Corporation 18.93 Bai Ding Investment Co., Ltd. 13.61 An Ho Garment Co.,Ltd. 1.17 Ta Chu Chemical Fiber Co.,Ltd. 0.51 Douglas Tong Hsu 0.09 Shaw Y. Wang 0.07 Fan Yu Chen 0.03
Fu Da Transportation Co., Ltd. Fu Ming Transportation Co., Ltd. 99.87 Asia Investment Corp. 0.03
Yue-Tung Investment Corp. U-Ming Marine Transport Corp. 73.54 U-Ming Marine Transport (Singapore) Private Ltd.
26.46
An Ho Garment Co., Ltd. Far Eastern New Century Corporation 100.0 Ding Yuan International Investment Corp. Far Eastern New Century Corporation 100.0
Ton Fu Investment Corp. Oriental Union Chemical Corp. 100.0
Ta Chu Chemical Fiber Co., Ltd. Yuan Ding Investment Company 41.86 Yue Ding Industry Co., Ltd. 38.76
-25-
Name of Juridical Persons Major Shareholder of the Juridical Persons % Yue-Lee Investment Company 19.38
Ya Li Precast Prestressed Concrete Industries Corp.
Asia Cement Corporation 83.81 Far-Eastern Construction Engineering Co.,Ltd. 16.03
Yuan Ding Co.,Ltd.
Far Eastern New Century Corporation 37.13 Asia Cement Corporation 35.50 Der Ching Investment Corp. 14.50 Yuan Ding Investment Company 12.86 Yu Ming Trading Corp. 0.002 Far Eastern Department Stores Co., Ltd. 0.001
Bai Ding Investment Corp. Far Eastern Department Stores Co., Ltd. 66.66 Bai Yang Investment Corp. 33.34
Yu Ming Trading Corp.
Bai Ding Investment Co., Ltd 47.00 Yuan Ding Investment Company 45.50 Yue Ding Industry Co., Ltd. 5.00 Yuan Ding Co., Ltd. 1.00 Ding & Ding Management Consultants Co., Ltd 1.00
Yuan Ding Leasing Corp. 0.50
Yue Ding Industry Co.,Ltd.
Fu Da Transportation Co., Ltd. 26.95 Yue-Tung Investment Corp. 25.36 An Ho Garment Co., Ltd. 15.66 Ding Yuan International Investment Corp. 13.20 Ton Fu Investment Corp. 4.61 Ta Chu Chemical Fiber Co., Ltd. 3.89 Ya Li Precast Prestressed Concrete Industries Corp. 3.89
Yuan Ding Co., Ltd. 2.59 Bai Ding Investment Co., Ltd. 2.31 Yu Ming Trading Corp. 1.53
Yue-Lee Investment Company U-Ming Marine Transport Corp. 68.18 U-Ming Marine Transport (Singapore) Private Ltd. 31.82

- 26 - -26-
3.2.4 Professional Qualifications and Independence Analysis of Directors
Note: Please tick the corresponding boxes that apply to the directors or supervisors during the two years prior to being elected or during the term of office. 1. Not an employee of the company or any of its affiliates. 2. Not a director or supervisor of the company or any of its affiliates. Not apply to independent directors appointed in accordance with the Act or the laws and
Criteria Name
Meet One of the Following Professional Qualification Requirements, Together with at Least Five Years Work Experience Independence Criteria (Note)
Number of Other Public Companies in
Which the Individual is Concurrently Serving as an Independent
Director
An Instructor or Higher Position in a Department of Commerce, Law, Finance, Accounting, or Other Academic Department Related to the Business Needs of the Company in a Public or Private Junior College, College or University
A Judge, Public Prosecutor, Attorney, Certified Public Accountant, or Other Professional or Technical Specialist Who has Passed a National Examination and been Awarded a Certificate in a Profession Necessary for the Business of the Company
Have Work Experience in the Areas of Commerce, Law, Finance, or Accounting, or Otherwise Necessary for the Business of the Company 1 2 3 4 5 6 7 8 9 10 11 12
Douglas Tong Hsu ˇ ˇ ˇ ˇ ˇ 0 Tsai Hsiung Chang ˇ ˇ ˇ ˇ ˇ ˇ 0 Johnny Shih ˇ ˇ ˇ ˇ 0 C.V. Chen ˇ ˇ ˇ ˇ ˇ ˇ ˇ ˇ ˇ ˇ ˇ ˇ 1 Kun Yen Lee ˇ ˇ ˇ ˇ ˇ ˇ ˇ 0 Peter Hsu ˇ ˇ ˇ ˇ 0 Chen Kun Chang ˇ ˇ ˇ ˇ ˇ ˇ ˇ 0 Connie Hsu ˇ ˇ ˇ ˇ ˇ ˇ ˇ 0 Ruey Long Chen ˇ ˇ ˇ ˇ ˇ ˇ ˇ ˇ ˇ ˇ ˇ 2 Champion Lee ˇ ˇ ˇ ˇ ˇ ˇ 0 Chin-Der Ou ˇ ˇ ˇ ˇ ˇ ˇ ˇ ˇ ˇ ˇ ˇ ˇ 1 Kwan-Tao Li ˇ ˇ ˇ ˇ ˇ ˇ ˇ ˇ ˇ 0 Ta-Chou Huang
ˇ ˇ ˇ ˇ ˇ ˇ ˇ ˇ ˇ ˇ 0 Chi Schive ˇ ˇ ˇ ˇ ˇ ˇ ˇ ˇ ˇ ˇ ˇ 3 Gordon S. Chen
ˇ ˇ ˇ ˇ ˇ ˇ ˇ ˇ ˇ ˇ ˇ 2

- 27 - -27-
regulations of the local country by, and concurrently serving as such at, a public company and its parent or subsidiary or a subsidiary of the same parent. 3. Not a natural-person shareholder who holds shares, together with those held by the person's spouse, minor children, or held by the person under others' names,
in an aggregate of one percent or more of the total number of issued shares of the company or ranking in the top 10 in holdings. 4. Not a spouse, relative within the second degree of kinship, or lineal relative within the third degree of kinship, of a managerial officer under subparagraph 1
or any of the persons in the preceding two subparagraphs. 5. Not a director, supervisor, or employee of a corporate shareholder that directly holds five percent or more of the total number of issued shares of the company,
or that ranks among the top five in shareholdings, or that designates its representative to serve as a director or supervisor of the company under Article 27, paragraph 1 or 2 of the Company Act. Not apply to independent directors appointed in accordance with the Act or the laws and regulations of the local country by, and concurrently serving as such at, a public company and its parent or subsidiary or a subsidiary of the same parent.
6. If a majority of the company's director seats or voting shares and those of any other company are controlled by the same person: not a director, supervisor, or employee of that other company. Not apply to independent directors appointed in accordance with the Act or the laws and regulations of the local country by, and concurrently serving as such at, a public company and its parent or subsidiary or a subsidiary of the same parent.
7. If the chairperson, general manager, or person holding an equivalent position of the company and a person in any of those positions at another company or institution are the same person or are spouses: not a director (or governor), supervisor, or employee of that other company or institution. Not apply to independent directors appointed in accordance with the Act or the laws and regulations of the local country by, and concurrently serving as such at, a public company and its parent or subsidiary or a subsidiary of the same parent.
8. Not a director, supervisor, officer, or shareholder holding five percent or more of the shares, of a specified company or institution that has a financial or business relationship with the company. Not apply to independent directors appointed in accordance with the Act or the laws and regulations of the local country by, and concurrently serving as such at, a public company and its parent or subsidiary or a subsidiary of the same parent, if the specified company or institution holds 20 percent or more and no more than 50 percent of the total number of issued shares of the public company.
9. Not a professional individual who, or an owner, partner, director, supervisor, or officer of a sole proprietorship, partnership, company, or institution that, provides auditing services to the company or any affiliate of the company, or that provides commercial, legal, financial, accounting or related services to the company or any affiliate of the company for which the provider in the past 2 years has received cumulative compensation exceeding NT$500,000, or a spouse thereof; provided, this restriction does not apply to a member of the remuneration committee, public tender offer review committee, or special committee for merger/consolidation and acquisition, who exercises powers pursuant to the Act or to the Business Mergers and Acquisitions Act or related laws or regulations.
10. Not having a marital relationship, or a relative within the second degree of kinship to any other director of the Company. 11. Not been a person of any conditions defined in Article 30 of the Company Law. 12. Not a governmental, juridical person or its representative as defined in Article 27 of the Company Law.
* The Company elected 3 independent directors, Ta-Chou Huang, Chi Schive, and Gordon S. Chen on the Shareholders’ Meeting on June 27, 2017.
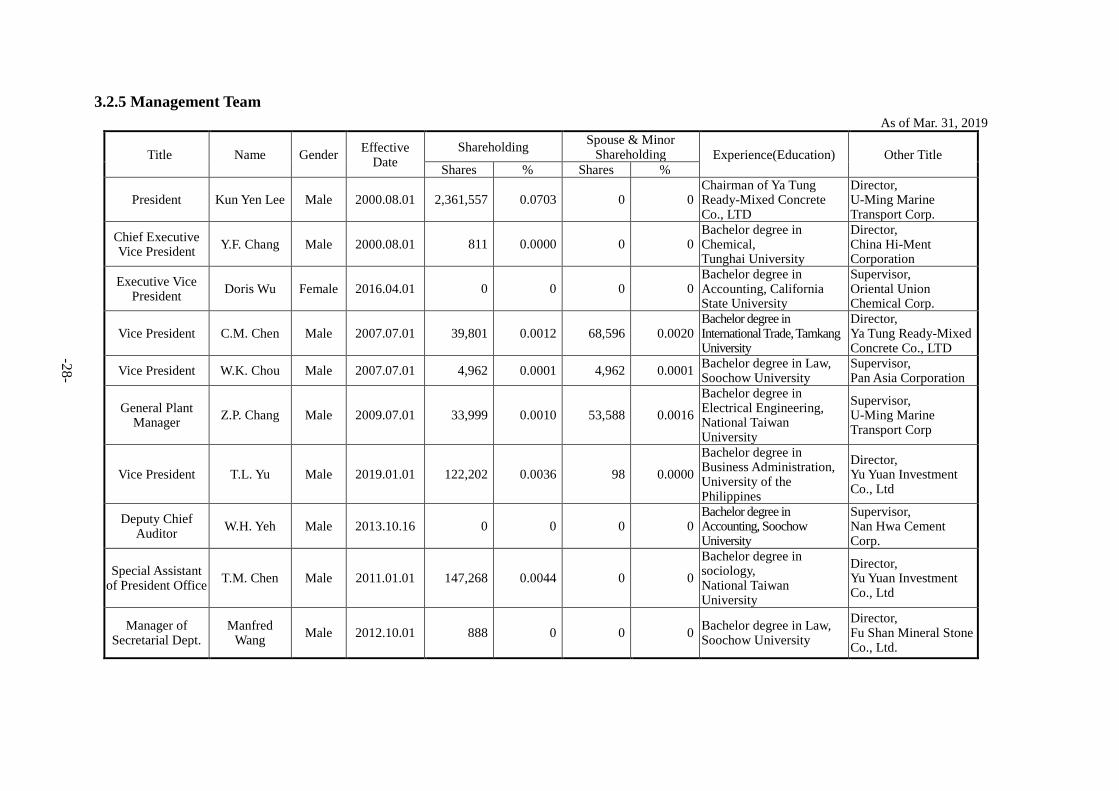
- 28 - -28-
3.2.5 Management Team As of Mar. 31, 2019
Title Name Gender Effective Date
Shareholding Spouse & Minor Shareholding Experience(Education) Other Title
Shares % Shares %
President Kun Yen Lee Male 2000.08.01 2,361,557 0.0703 0 0 Chairman of Ya Tung Ready-Mixed Concrete Co., LTD
Director, U-Ming Marine Transport Corp.
Chief Executive Vice President Y.F. Chang Male 2000.08.01 811 0.0000 0 0
Bachelor degree in Chemical, Tunghai University
Director, China Hi-Ment Corporation
Executive Vice President Doris Wu Female 2016.04.01 0 0 0 0
Bachelor degree in Accounting, California State University
Supervisor, Oriental Union Chemical Corp.
Vice President C.M. Chen Male 2007.07.01 39,801 0.0012 68,596 0.0020 Bachelor degree in International Trade, Tamkang University
Director, Ya Tung Ready-Mixed Concrete Co., LTD
Vice President W.K. Chou Male 2007.07.01 4,962 0.0001 4,962 0.0001 Bachelor degree in Law, Soochow University
Supervisor, Pan Asia Corporation
General Plant Manager Z.P. Chang Male 2009.07.01 33,999 0.0010 53,588 0.0016
Bachelor degree in Electrical Engineering, National Taiwan University
Supervisor, U-Ming Marine Transport Corp
Vice President T.L. Yu Male 2019.01.01 122,202 0.0036 98 0.0000 Bachelor degree in Business Administration, University of the Philippines
Director, Yu Yuan Investment Co., Ltd
Deputy Chief Auditor W.H. Yeh Male 2013.10.16 0 0 0 0
Bachelor degree in Accounting, Soochow University
Supervisor, Nan Hwa Cement Corp.
Special Assistant of President Office T.M. Chen Male 2011.01.01 147,268 0.0044 0 0
Bachelor degree in sociology, National Taiwan University
Director, Yu Yuan Investment Co., Ltd
Manager of Secretarial Dept.
Manfred Wang Male 2012.10.01 888 0 0 0 Bachelor degree in Law,
Soochow University
Director, Fu Shan Mineral Stone Co., Ltd.
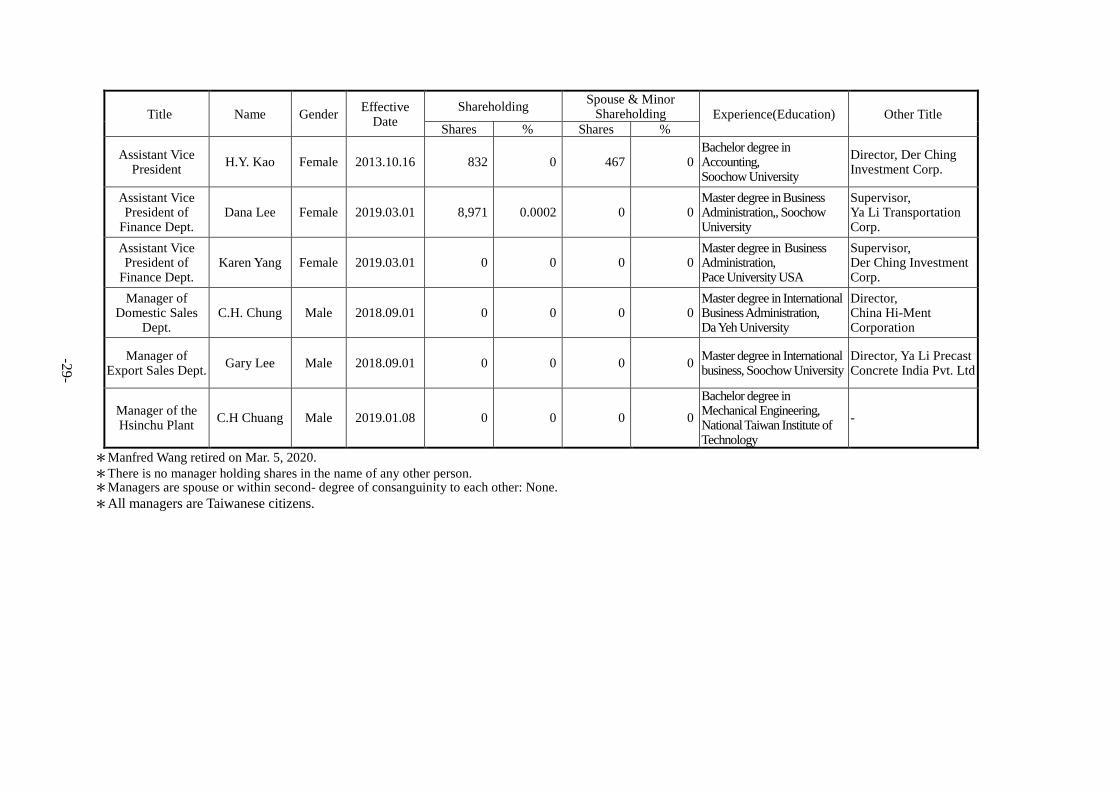
- 29 - -29-
Title Name Gender Effective Date
Shareholding Spouse & Minor Shareholding Experience(Education) Other Title
Shares % Shares %
Assistant Vice President H.Y. Kao Female 2013.10.16 832 0 467 0
Bachelor degree in Accounting, Soochow University
Director, Der Ching Investment Corp.
Assistant Vice President of
Finance Dept. Dana Lee Female 2019.03.01 8,971 0.0002 0 0
Master degree in Business Administration,, Soochow University
Supervisor, Ya Li Transportation Corp.
Assistant Vice President of
Finance Dept. Karen Yang Female 2019.03.01 0 0 0 0
Master degree in Business Administration, Pace University USA
Supervisor, Der Ching Investment Corp.
Manager of Domestic Sales
Dept. C.H. Chung Male 2018.09.01 0 0 0 0
Master degree in International Business Administration, Da Yeh University
Director, China Hi-Ment Corporation
Manager of Export Sales Dept. Gary Lee Male 2018.09.01 0 0 0 0 Master degree in International
business, Soochow University Director, Ya Li Precast Concrete India Pvt. Ltd
Manager of the Hsinchu Plant C.H Chuang Male 2019.01.08 0 0 0 0
Bachelor degree in Mechanical Engineering, National Taiwan Institute of Technology
-
*Manfred Wang retired on Mar. 5, 2020. *There is no manager holding shares in the name of any other person. *Managers are spouse or within second- degree of consanguinity to each other: None. *All managers are Taiwanese citizens.

- 30 - -30-
3.2.6 Remuneration of Directors, Supervisors, President, and Vice Presidents 1. Remuneration of Directors
Title Name
Remuneration Ratio of Total Remuneration
(A+B+C+D) to Net Income (%)
Relevant Remuneration Received by Directors Who are Also Employees Ratio of Total Compensation
(A+B+C+D+E+F+G) to Net Income (%)
Remuneration from ventures
other than subsidiaries or from the parent
company (Note 1)
Base Compensation (A) Severance Pay (B) Directors Compensation(C) Allowances (D) Salary, Bonuses, and
Allowances (E) Severance Pay (F) Employee Compensation (G)
The company
All companies in the
consolidated financial
statements
The company
Companies in the
consolidated financial
statements
The company
Companies in the
consolidated financial
statements
The company
Companies in the
consolidated financial
statements
The company
Companies in the
consolidated financial
statements
The company
Companies in the
consolidated financial
statements
The company
Companies in the
consolidated financial
statements
The company
Companies in the consolidated
financial statements
The company
Companies in the
consolidated financial
statements Cash Cash
Chairman Douglas Tong Hsu
14,511 16,340 0 0 223,896 226,220 1,056 6,596 1.371% 1.427% 7,083 11,680 216 216 6,600 6,600 1.451% 1.533% 216,084
Director Director Director
Far Eastern New Century Corp. Representatives: Tsai Hsiung Chang Johnny Shih C.V. Chen
Director
Yue Ding Industry Co., Ltd. Representative: Kun Yen Lee
Director Director
Far Eastern Y.Z. Hsu Science and Technology Memorial Foundation Representatives: Peter Hsu Chen Kun Chang
Director
Ta Chu Chemical Fiber Co.,Ltd Representative: Ruey Long Chen
Director
Huey Kang Investment Corp. Representative: Connie Hsu
Director
Far Eastern Medical Foundation Representative: Champion Lee
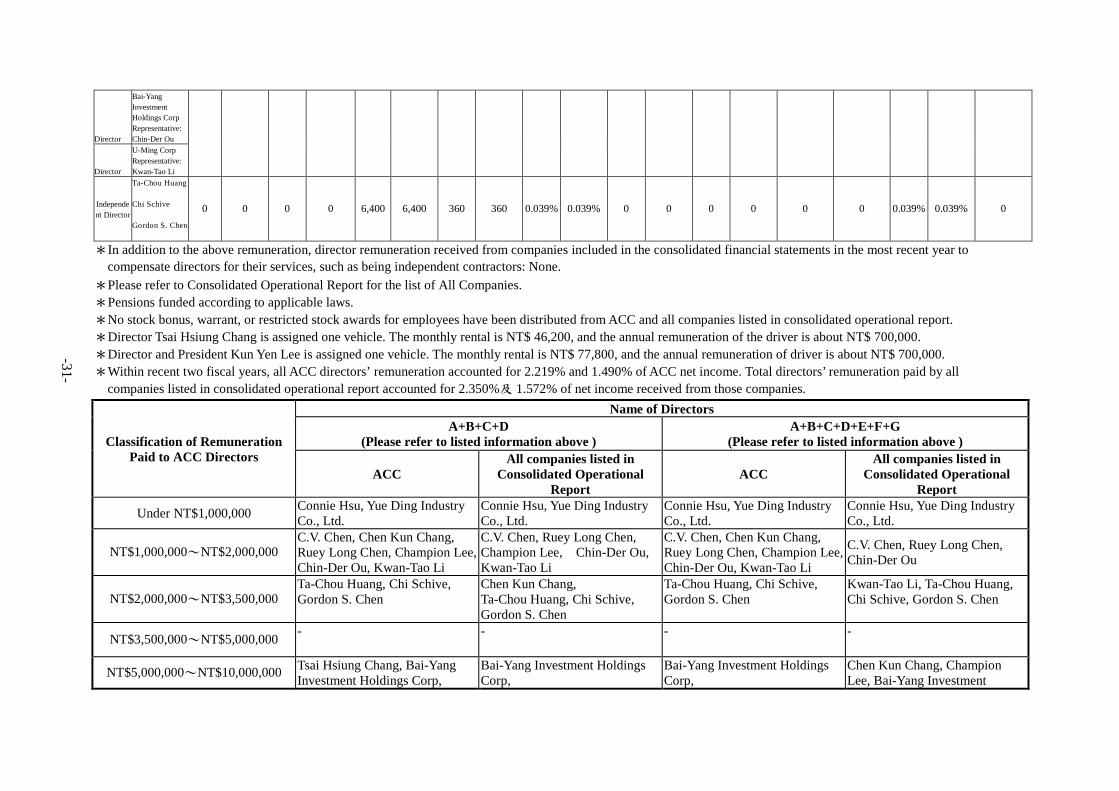
- 31 - -31-
*In addition to the above remuneration, director remuneration received from companies included in the consolidated financial statements in the most recent year to compensate directors for their services, such as being independent contractors: None.
*Please refer to Consolidated Operational Report for the list of All Companies. *Pensions funded according to applicable laws. *No stock bonus, warrant, or restricted stock awards for employees have been distributed from ACC and all companies listed in consolidated operational report. *Director Tsai Hsiung Chang is assigned one vehicle. The monthly rental is NT$ 46,200, and the annual remuneration of the driver is about NT$ 700,000. *Director and President Kun Yen Lee is assigned one vehicle. The monthly rental is NT$ 77,800, and the annual remuneration of driver is about NT$ 700,000. *Within recent two fiscal years, all ACC directors’ remuneration accounted for 2.219% and 1.490% of ACC net income. Total directors’ remuneration paid by all
companies listed in consolidated operational report accounted for 2.350%及 1.572% of net income received from those companies.
Director
Bai-Yang Investment Holdings Corp Representative: Chin-Der Ou
Director
U-Ming Corp Representative: Kwan-Tao Li
Independent Director
Ta-Chou Huang Chi Schive Gordon S. Chen
0 0 0 0 6,400 6,400 360 360 0.039% 0.039% 0 0 0 0 0 0 0.039% 0.039% 0
Classification of Remuneration Paid to ACC Directors
Name of Directors A+B+C+D
(Please refer to listed information above ) A+B+C+D+E+F+G
(Please refer to listed information above )
ACC All companies listed in
Consolidated Operational Report
ACC All companies listed in
Consolidated Operational Report
Under NT$1,000,000 Connie Hsu, Yue Ding Industry Co., Ltd.
Connie Hsu, Yue Ding Industry Co., Ltd.
Connie Hsu, Yue Ding Industry Co., Ltd.
Connie Hsu, Yue Ding Industry Co., Ltd.
NT$1,000,000~NT$2,000,000 C.V. Chen, Chen Kun Chang, Ruey Long Chen, Champion Lee, Chin-Der Ou, Kwan-Tao Li
C.V. Chen, Ruey Long Chen, Champion Lee, Chin-Der Ou, Kwan-Tao Li
C.V. Chen, Chen Kun Chang, Ruey Long Chen, Champion Lee, Chin-Der Ou, Kwan-Tao Li
C.V. Chen, Ruey Long Chen, Chin-Der Ou
NT$2,000,000~NT$3,500,000 Ta-Chou Huang, Chi Schive, Gordon S. Chen
Chen Kun Chang, Ta-Chou Huang, Chi Schive, Gordon S. Chen
Ta-Chou Huang, Chi Schive, Gordon S. Chen
Kwan-Tao Li, Ta-Chou Huang, Chi Schive, Gordon S. Chen
NT$3,500,000~NT$5,000,000 - - - -
NT$5,000,000~NT$10,000,000 Tsai Hsiung Chang, Bai-Yang Investment Holdings Corp,
Bai-Yang Investment Holdings Corp,
Bai-Yang Investment Holdings Corp,
Chen Kun Chang, Champion Lee, Bai-Yang Investment
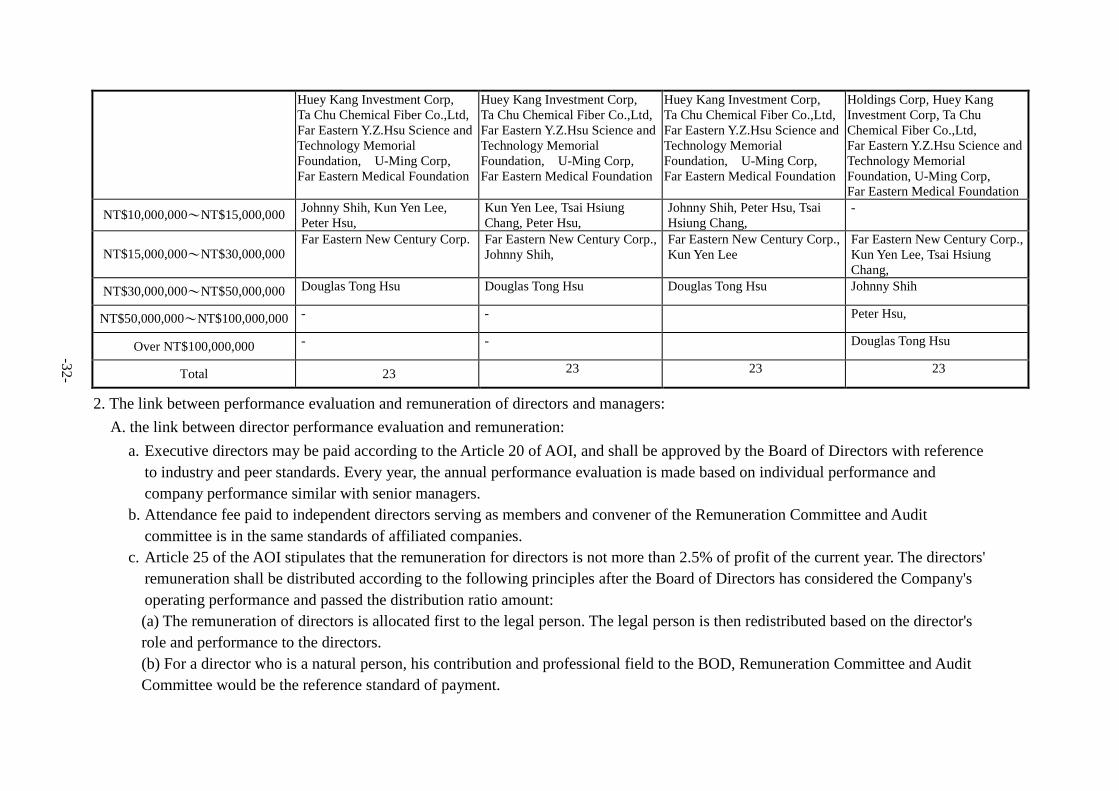
- 32 - -32-
2. The link between performance evaluation and remuneration of directors and managers: A. the link between director performance evaluation and remuneration:
a. Executive directors may be paid according to the Article 20 of AOI, and shall be approved by the Board of Directors with reference to industry and peer standards. Every year, the annual performance evaluation is made based on individual performance and company performance similar with senior managers.
b. Attendance fee paid to independent directors serving as members and convener of the Remuneration Committee and Audit committee is in the same standards of affiliated companies.
c. Article 25 of the AOI stipulates that the remuneration for directors is not more than 2.5% of profit of the current year. The directors' remuneration shall be distributed according to the following principles after the Board of Directors has considered the Company's operating performance and passed the distribution ratio amount: (a) The remuneration of directors is allocated first to the legal person. The legal person is then redistributed based on the director's role and performance to the directors. (b) For a director who is a natural person, his contribution and professional field to the BOD, Remuneration Committee and Audit Committee would be the reference standard of payment.
Huey Kang Investment Corp, Ta Chu Chemical Fiber Co.,Ltd, Far Eastern Y.Z.Hsu Science and Technology Memorial Foundation, U-Ming Corp, Far Eastern Medical Foundation
Huey Kang Investment Corp, Ta Chu Chemical Fiber Co.,Ltd, Far Eastern Y.Z.Hsu Science and Technology Memorial Foundation, U-Ming Corp, Far Eastern Medical Foundation
Huey Kang Investment Corp, Ta Chu Chemical Fiber Co.,Ltd, Far Eastern Y.Z.Hsu Science and Technology Memorial Foundation, U-Ming Corp, Far Eastern Medical Foundation
Holdings Corp, Huey Kang Investment Corp, Ta Chu Chemical Fiber Co.,Ltd, Far Eastern Y.Z.Hsu Science and Technology Memorial Foundation, U-Ming Corp, Far Eastern Medical Foundation
NT$10,000,000~NT$15,000,000 Johnny Shih, Kun Yen Lee, Peter Hsu,
Kun Yen Lee, Tsai Hsiung Chang, Peter Hsu,
Johnny Shih, Peter Hsu, Tsai Hsiung Chang,
-
NT$15,000,000~NT$30,000,000 Far Eastern New Century Corp. Far Eastern New Century Corp.,
Johnny Shih, Far Eastern New Century Corp., Kun Yen Lee
Far Eastern New Century Corp., Kun Yen Lee, Tsai Hsiung Chang,
NT$30,000,000~NT$50,000,000 Douglas Tong Hsu Douglas Tong Hsu Douglas Tong Hsu Johnny Shih
NT$50,000,000~NT$100,000,000 - - Peter Hsu,
Over NT$100,000,000 - - Douglas Tong Hsu
Total 23 23 23 23

- 33 - -33-
d. Performance evaluation and remuneration are reviewed by the Remuneration Committee and the Board of Directors, and are reviewed at any time depending on actual operating conditions, industrial operating risks, trends, and laws.
C. the link between manager performance evaluation and remuneration: a. Article 25 of the AOI stipulates that if a profit is made in the year, 1.0% to 4% shall be set aside for employee compensation. b. The performance evaluation of managers will affect their employee compensation.
*The succession planning of the Company's Board of Directors and important managers
Member of the Board of Directors: 1. In 2017, the Shareholders' meeting amended the "Director Election Rules" which stipulates the director diversity policy in article 3. 2. The Company complies with the Company's AOI and the board of directors adopts the nomination system for candidates. In addition to
assessing the academic experience of each candidate, and referring to the opinions of stakeholders, abide by the "Director Election Rules" and "Corporate Governance Code" to ensure the diversity and independence of directors.
3. 15 directors of the Company's 26th Board of Directors, including 3 independent directors, professional knowledge includes leadership, management, crisis management, industrial knowledge and international outlook, public welfare, legal affairs, legal compliance, economics, administration, finance , Agriculture, etc.
4. The succession of directors is partly from the senior executives of the company, but most of them still have to be promoted from the talent pool of the national society, especially independent directors who emphasize independence.
5. The Far Eastern Group to which the company belongs has a corporate culture that values corporate governance and talents. Due to the long-term succession planning, there are many companies with professional managers as general managers, vice chairman and chairman of the group.
Important managers: 1. The Company has cooperated with Yuanzhi University to set up a "training class" for corporate elites. Course training, followed by 30
high-level conference internships and 30 special seminars, the training has achieved good results. At present, more than 90% of the trainees have been promoted. In addition, trainees need to receive about 12 hours of back-training courses every year in order to continue to grow and improve.
2. Due to the effectiveness of the training, this training plan model has been copied to all subsidiaries of ACC (China).

- 34 - -34-
3. Remuneration of President and Vice Presidents Unit: NT$1000
Title Name
Salary(A) Pensions(B) Reward and Allowance etc. (C)
Employees bonus from Distributable
Earnings (D)
Total Amount (A+B+C+D)/Net
Income Other
remuneration from investment business except
subsidiary ACC All
companies* ACC All companies* ACC All
companies* ACC All
companies* ACC All companies* Cash
Bonus Cash
Bonus President Kun Yen Lee
19,257 20,647 756 756 3,863 4,069 23,769 23,769 0.273% 0.282% 1,010
Chief Executive Vice President Y.F. Chang Executive Vice President Doris Wu Vice President C.M. Chen Vice President W.K. Chou Vice President T.L. Yu General Plant Manager Z.P. Chang *Please refer to Consolidated Operational Report for the list of All Companies. *Pensions funded according to applicable law. *No stock bonus, warrant, or restricted stock awards for employees have been distributed from ACC and all companies listed in consolidated operational report. *The chief executive vice president of the Company, Y.F. Chang is assigned one vehicle. The monthly rental is NT$33,500. *Within recent two fiscal years, total remuneration of the President and Vice Presidents accounted for 0.278% and 0.249% of ACC net income. Total amount of
President and Vice Presidents’ remuneration paid by all companies listed in consolidated operational report accounted for 0.284%及 0.258% of net income received from those companies.
Classification of Remuneration Paid to ACC President
and Vice Presidents
Name of President and Vice Presidents
ACC All companies listed in Consolidated Operational Report
NT$2,000,000~NT$3,500,000 - -
NT$3,500,000~NT$5,000,000 - -
NT$5,000,000~NT$10,000,000 Kun Yen Lee, Y.F. Chang, Doris Wu, C.M. Chen, W.K. Chou, T.L. Yu, Z.P. Chang
Kun Yen Lee, Y.F. Chang, Doris Wu, C.M. Chen, W.K. Chou, T.L. Yu, Z.P. Chang
Total 7 7
*The remuneration of President and Vice Presidents is divided into two parts: 1. Monthly salary based on fixed salary rank. 2. Based on ACC’s bonus system, bonus and compensation are distributed mainly in consideration of the Company’s operating performance and individual annual
performance. *The Remuneration Committee has approved current remuneration system for the President and Vice Presidents.

- 35 - -35-
3.2.7 Employees Remuneration to Management Team Title Name Stock Bonus Cash Bonus Total Amount Total Amount/Net Income
Executive Officers
President Kun Yen Lee
0 34,379 34,379 0.197%
Chief Executive Vice President Y.F. Chang Executive Vice President Doris Wu Vice President C.M. Chen Vice President W.K. Chou General Plant Manager Z.P. Chang Senior Assistant Vice President T.L. Yu Deputy Chief Auditor W.H. Yeh Special Assistant of President Office T.M. Chen Manager of Accounting Dept. H.Y. Kao Assistant Vice President Dana Lee Assistant Vice President Karen Yang
* The 2020 managers’ remunerations have been approved by the BOD and will be reported to 2020 Shareholders’ Meeting. 3.2.8 Name and Title of the Top 10 Employees Who Were Distributed Employees Remuneration
Unit: NT$1000 Rank Title Name Stock Bonus Cash Bonus Total Amount
1 President Kun Yen Lee
0 30,397 30,397
2 Executive Vice President Doris Wu 3 Chief Executive Vice President Y.F. Chang 4 General Plant Manager Z.P. Chang 5 Vice President T.L. Yu 6 Vice President C.M. Chen 7 Vice President W.K. Chou 8 Deputy Chief Auditor W.H. Yeh 9 Special Assistant of President Office T.M. Chen 10 Manager of Accounting Dept. H.Y. Kao
* The employees’ remuneration comes from the profits of 2019. * Doris Wu and T.L. Yu are also responsible for ACC (China) affairs.
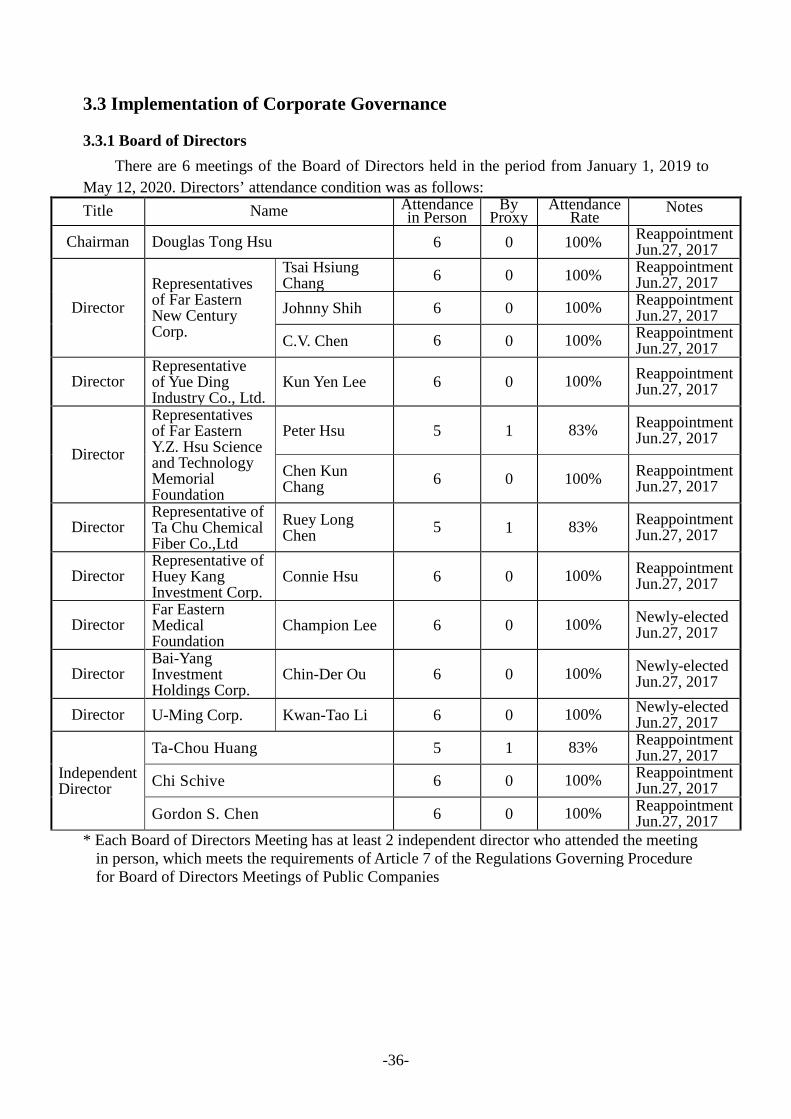
-36-
3.3 Implementation of Corporate Governance
3.3.1 Board of Directors There are 6 meetings of the Board of Directors held in the period from January 1, 2019 to
May 12, 2020. Directors’ attendance condition was as follows: Title Name Attendance
in Person By
Proxy Attendance
Rate Notes
Chairman Douglas Tong Hsu 6 0 100% Reappointment Jun.27, 2017
Director Representatives of Far Eastern New Century Corp.
Tsai Hsiung Chang 6 0 100% Reappointment
Jun.27, 2017 Johnny Shih 6 0 100% Reappointment
Jun.27, 2017 C.V. Chen 6 0 100% Reappointment
Jun.27, 2017
Director Representative of Yue Ding Industry Co., Ltd.
Kun Yen Lee 6 0 100% Reappointment Jun.27, 2017
Director
Representatives of Far Eastern Y.Z. Hsu Science and Technology Memorial Foundation
Peter Hsu 5 1 83% Reappointment Jun.27, 2017
Chen Kun Chang 6 0 100% Reappointment
Jun.27, 2017
Director Representative of Ta Chu Chemical Fiber Co.,Ltd
Ruey Long Chen 5 1 83% Reappointment
Jun.27, 2017
Director Representative of Huey Kang Investment Corp.
Connie Hsu 6 0 100% Reappointment Jun.27, 2017
Director Far Eastern Medical Foundation
Champion Lee 6 0 100% Newly-elected Jun.27, 2017
Director Bai-Yang Investment Holdings Corp.
Chin-Der Ou 6 0 100% Newly-elected Jun.27, 2017
Director U-Ming Corp. Kwan-Tao Li 6 0 100% Newly-elected Jun.27, 2017
Independent Director
Ta-Chou Huang 5 1 83% Reappointment Jun.27, 2017
Chi Schive 6 0 100% Reappointment Jun.27, 2017
Gordon S. Chen 6 0 100% Reappointment Jun.27, 2017
* Each Board of Directors Meeting has at least 2 independent director who attended the meeting in person, which meets the requirements of Article 7 of the Regulations Governing Procedure for Board of Directors Meetings of Public Companies
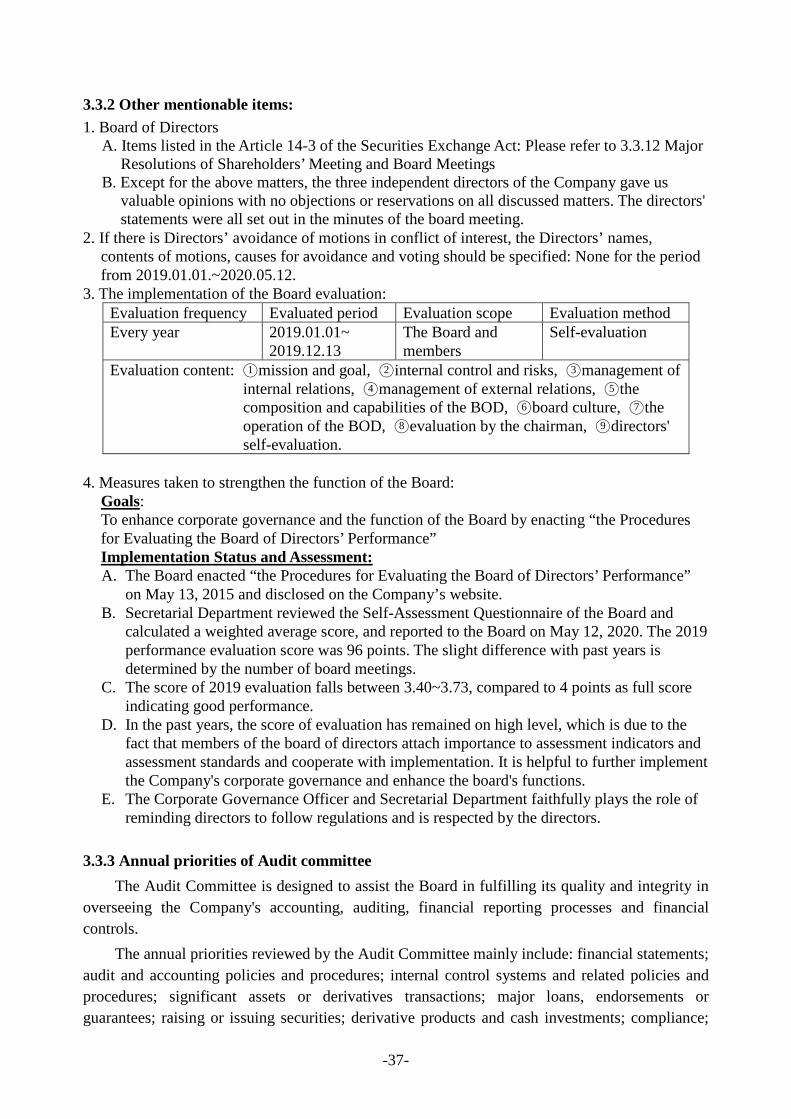
-37-
3.3.2 Other mentionable items: 1. Board of Directors
A. Items listed in the Article 14-3 of the Securities Exchange Act: Please refer to 3.3.12 Major Resolutions of Shareholders’ Meeting and Board Meetings
B. Except for the above matters, the three independent directors of the Company gave us valuable opinions with no objections or reservations on all discussed matters. The directors' statements were all set out in the minutes of the board meeting.
2. If there is Directors’ avoidance of motions in conflict of interest, the Directors’ names, contents of motions, causes for avoidance and voting should be specified: None for the period from 2019.01.01.~2020.05.12.
3. The implementation of the Board evaluation: Evaluation frequency Evaluated period Evaluation scope Evaluation method Every year 2019.01.01~
2019.12.13 The Board and members
Self-evaluation
Evaluation content: ○1 mission and goal, ○2 internal control and risks, ○3 management of internal relations, ○4 management of external relations, ○5 the composition and capabilities of the BOD, ○6 board culture, ○7 the operation of the BOD, ○8 evaluation by the chairman, ○9 directors' self-evaluation.
4. Measures taken to strengthen the function of the Board:
Goals: To enhance corporate governance and the function of the Board by enacting “the Procedures for Evaluating the Board of Directors’ Performance” Implementation Status and Assessment: A. The Board enacted “the Procedures for Evaluating the Board of Directors’ Performance”
on May 13, 2015 and disclosed on the Company’s website. B. Secretarial Department reviewed the Self-Assessment Questionnaire of the Board and
calculated a weighted average score, and reported to the Board on May 12, 2020. The 2019 performance evaluation score was 96 points. The slight difference with past years is determined by the number of board meetings.
C. The score of 2019 evaluation falls between 3.40~3.73, compared to 4 points as full score indicating good performance.
D. In the past years, the score of evaluation has remained on high level, which is due to the fact that members of the board of directors attach importance to assessment indicators and assessment standards and cooperate with implementation. It is helpful to further implement the Company's corporate governance and enhance the board's functions.
E. The Corporate Governance Officer and Secretarial Department faithfully plays the role of reminding directors to follow regulations and is respected by the directors.
3.3.3 Annual priorities of Audit committee
The Audit Committee is designed to assist the Board in fulfilling its quality and integrity in overseeing the Company's accounting, auditing, financial reporting processes and financial controls.
The annual priorities reviewed by the Audit Committee mainly include: financial statements; audit and accounting policies and procedures; internal control systems and related policies and procedures; significant assets or derivatives transactions; major loans, endorsements or guarantees; raising or issuing securities; derivative products and cash investments; compliance;
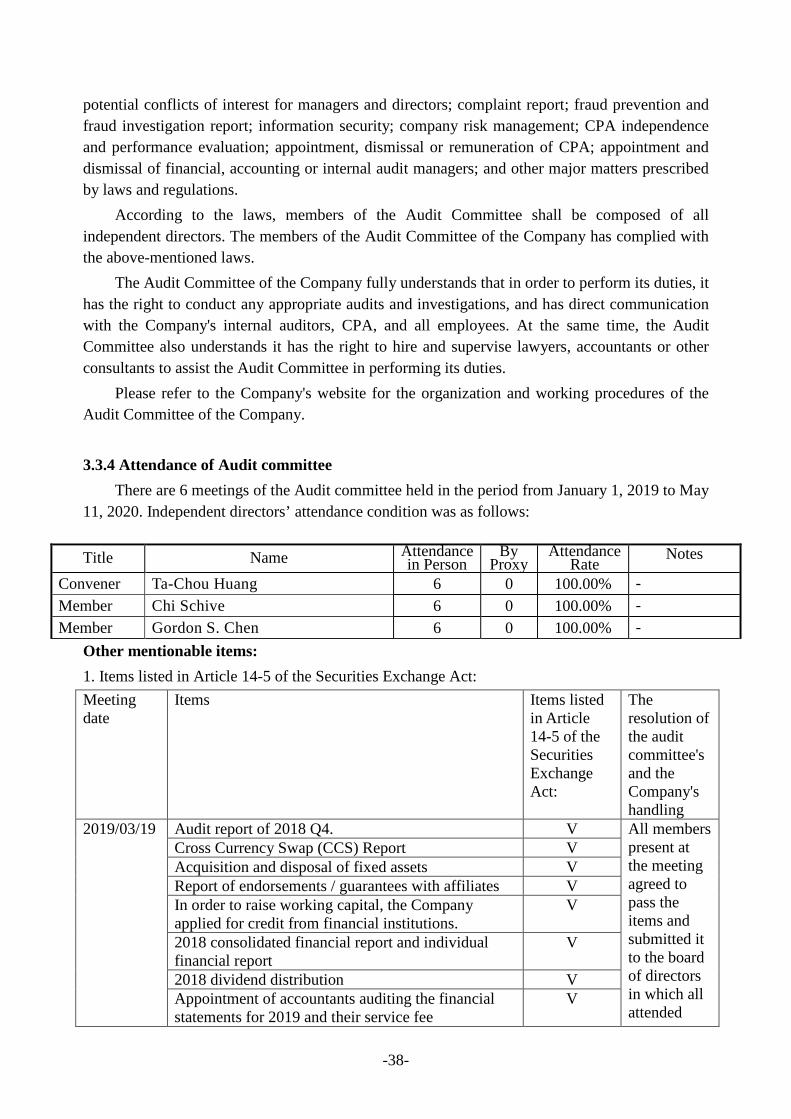
-38-
potential conflicts of interest for managers and directors; complaint report; fraud prevention and fraud investigation report; information security; company risk management; CPA independence and performance evaluation; appointment, dismissal or remuneration of CPA; appointment and dismissal of financial, accounting or internal audit managers; and other major matters prescribed by laws and regulations.
According to the laws, members of the Audit Committee shall be composed of all independent directors. The members of the Audit Committee of the Company has complied with the above-mentioned laws.
The Audit Committee of the Company fully understands that in order to perform its duties, it has the right to conduct any appropriate audits and investigations, and has direct communication with the Company's internal auditors, CPA, and all employees. At the same time, the Audit Committee also understands it has the right to hire and supervise lawyers, accountants or other consultants to assist the Audit Committee in performing its duties.
Please refer to the Company's website for the organization and working procedures of the Audit Committee of the Company.
3.3.4 Attendance of Audit committee
There are 6 meetings of the Audit committee held in the period from January 1, 2019 to May 11, 2020. Independent directors’ attendance condition was as follows:
Title Name Attendance
in Person By
Proxy Attendance
Rate Notes
Convener Ta-Chou Huang 6 0 100.00% - Member Chi Schive 6 0 100.00% - Member Gordon S. Chen 6 0 100.00% -
Other mentionable items: 1. Items listed in Article 14-5 of the Securities Exchange Act: Meeting date
Items Items listed in Article 14-5 of the Securities Exchange Act:
The resolution of the audit committee's and the Company's handling
2019/03/19 Audit report of 2018 Q4. V All members present at the meeting agreed to pass the items and submitted it to the board of directors in which all attended
Cross Currency Swap (CCS) Report V Acquisition and disposal of fixed assets V Report of endorsements / guarantees with affiliates V In order to raise working capital, the Company applied for credit from financial institutions.
V
2018 consolidated financial report and individual financial report
V
2018 dividend distribution V Appointment of accountants auditing the financial statements for 2019 and their service fee
V

-39-
Approval to 2018 "Internal Control System Statement"
V directors the approved without objection.
To amend Internal Control System V To amend Accounting System V Issuance of Long-term Commercial paper V Proposed to issue medium and long-term unsecured commercial paper with total amount not exceeding NT$10 billion in order to repay the loan, enrich the medium and long-term working capital, and strengthen the financial structure.
V
Proposed to issue unsecured corporate bonds in once or in a batch with total amount not exceeding NT$10 billion in order to repay the loan, enrich the medium and long-term working capital, and strengthen the financial structure.
V
To issue a letter of support for the Company’s subsidiary, Chiahui Power Corp., for 20-year-term NT$10.5 billion syndicated loan.
V
To amend “Procedure for Acquisition and Disposal of Assets”
V
To amend “Procedure for Making Endorsements and Guarantees”.
V
To amend “Procedure for Loan to Others”. V 2019/05/10 Audit report of 2019 Q1 V
Consolidated financial report of 2019 Q1 V Acquisition and disposal of fixed assets V Report of endorsements / guarantees with affiliates V In order to raise working capital, the Company applied for credit from financial institutions.
V
Report the Company’s issued 2019 corporation bond V Report the Company's 2018 annual business report V
2019/08/01 Audit report of 2019 Q2 V Acquisition and disposal of real estate, equipment or right-of-use assets
V
Report of endorsements / guarantees with affiliates V Revision of the Company's "Internal Control System" and "Internal Audit System and Implementation Rules"
V
2019/11/06 Audit report of 2019Q3 V Consolidated financial report of 2019 Q3 V Acquisition and disposal of real estate, equipment or right-of-use assets
V
Report of endorsements / guarantees with affiliates V The implementation report of the Company's second unsecured corporate bond in 2019
V
2019 audit plan V Revision of the Company's "Internal Control System" and "Internal Audit System and Implementation Rules"
V
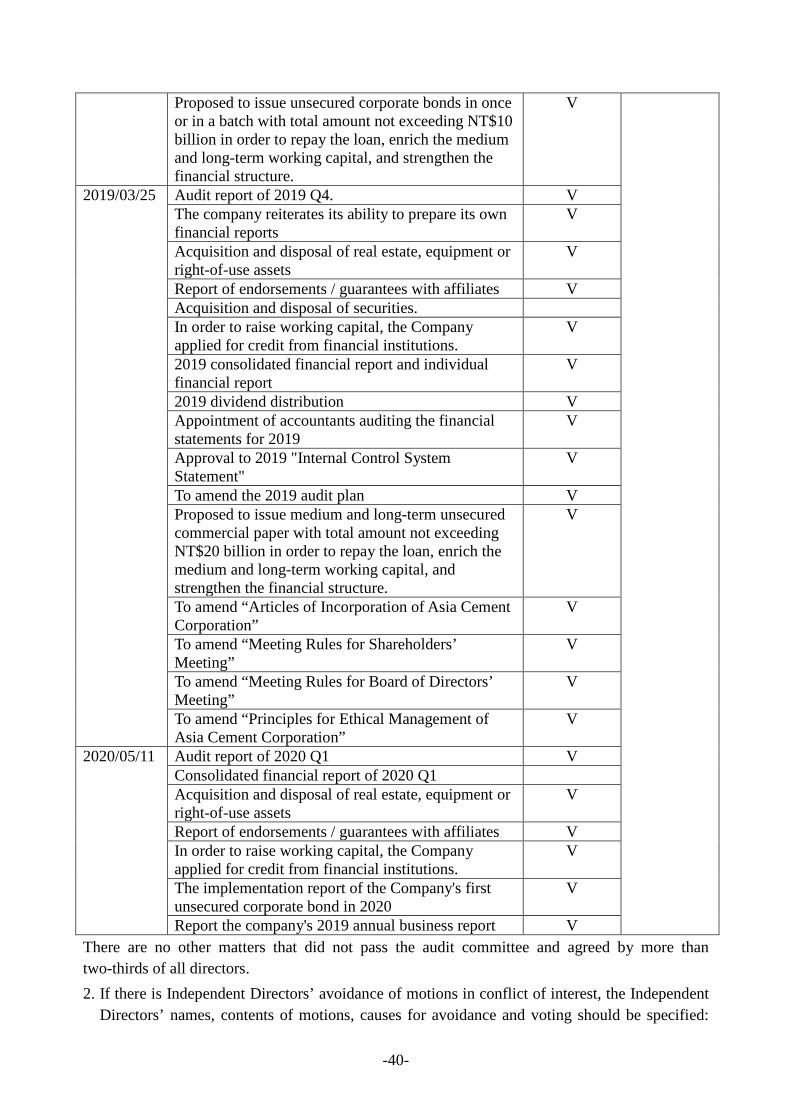
-40-
There are no other matters that did not pass the audit committee and agreed by more than two-thirds of all directors. 2. If there is Independent Directors’ avoidance of motions in conflict of interest, the Independent
Directors’ names, contents of motions, causes for avoidance and voting should be specified:
Proposed to issue unsecured corporate bonds in once or in a batch with total amount not exceeding NT$10 billion in order to repay the loan, enrich the medium and long-term working capital, and strengthen the financial structure.
V
2019/03/25 Audit report of 2019 Q4. V The company reiterates its ability to prepare its own financial reports
V
Acquisition and disposal of real estate, equipment or right-of-use assets
V
Report of endorsements / guarantees with affiliates V Acquisition and disposal of securities. In order to raise working capital, the Company applied for credit from financial institutions.
V
2019 consolidated financial report and individual financial report
V
2019 dividend distribution V Appointment of accountants auditing the financial statements for 2019
V
Approval to 2019 "Internal Control System Statement"
V
To amend the 2019 audit plan V Proposed to issue medium and long-term unsecured commercial paper with total amount not exceeding NT$20 billion in order to repay the loan, enrich the medium and long-term working capital, and strengthen the financial structure.
V
To amend “Articles of Incorporation of Asia Cement Corporation”
V
To amend “Meeting Rules for Shareholders’ Meeting”
V
To amend “Meeting Rules for Board of Directors’ Meeting”
V
To amend “Principles for Ethical Management of Asia Cement Corporation”
V
2020/05/11 Audit report of 2020 Q1 V Consolidated financial report of 2020 Q1 Acquisition and disposal of real estate, equipment or right-of-use assets
V
Report of endorsements / guarantees with affiliates V In order to raise working capital, the Company applied for credit from financial institutions.
V
The implementation report of the Company's first unsecured corporate bond in 2020
V
Report the company's 2019 annual business report V

-41-
None. 3. Communications with internal audit manager and CPA:
(1) Internal audit manager reports the plans and execution of audit works to Independent Directors every quarter and implement the instructions and follow-up of each independent director.
(2) CPA and accounting manager report financial and operation business to Independent Directors every quarter
Meeting date
Items discussed with internal auditor Items discussed with CPA
2019/03/19 1. Audit report of 2018 Q4. 2. Approval to 2018 "Internal Control
System Statement" 3. To amend the 2018 audit plan
1. The 2018 individual and consolidated financial statements
2. Assessment of accounting professional judgment, accounting policies and estimation changes.
3. Communication of key check matters.
4. The impact of the new laws and accounting standards on the Company.
5. Other. 2019/05/10 Audit report of 2019 Q1 1. The results of 2019 Q1
consolidated financial statements.
2. The impact of the new accounting standards on the Company.
3. Regulations update. 2019/08/01 Audit report of 2019 Q2 1. The results of 2019 H1
consolidated financial statements.
2. Other communication matters. 3. Regulations update.
2019/11/05 Audit report of 2019 Q3 1. Declaration of independence. 2. The scope and method of
review. 3. Group review. 4. Major accounting policies,
major accounting estimates, major events, and major transactions
5. Other communication matters. 6. Annual auditing plan (key audit
items, significant risks). 2019/03/23 Audit report of 2019 Q4 1. Declaration of independence.
2. The scope and method of review.
3. Group review. 4. Major accounting policies,
major accounting estimates,
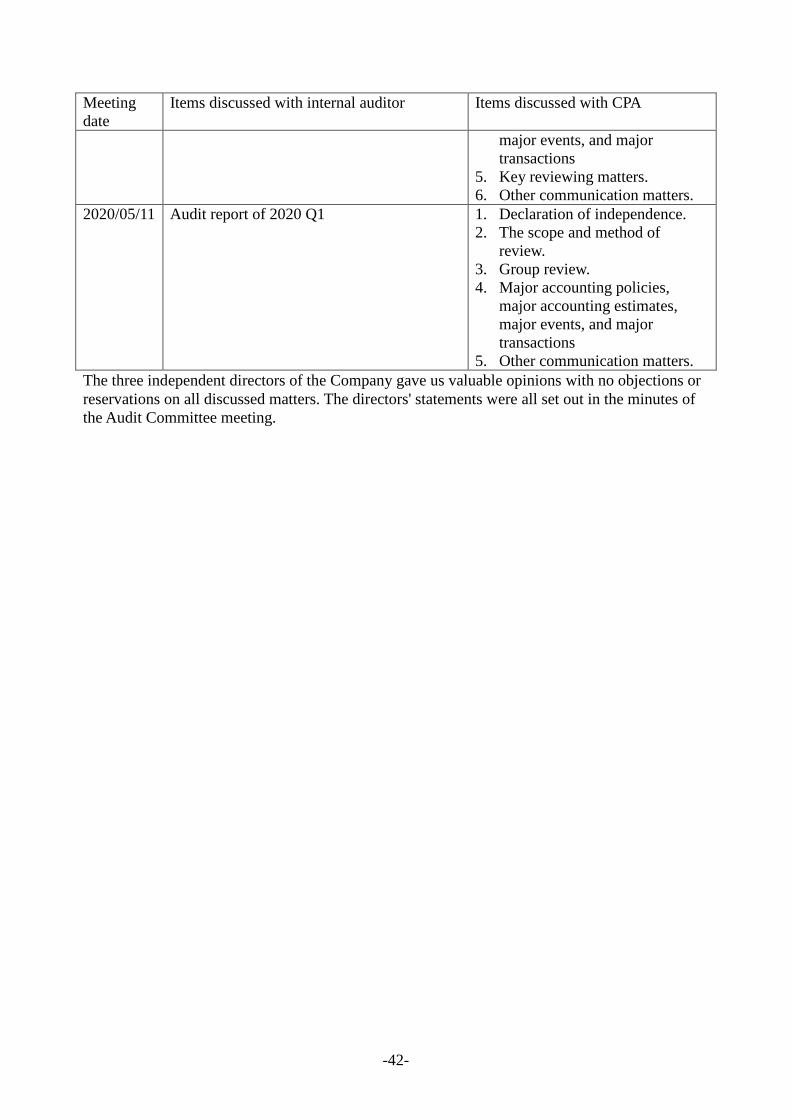
-42-
Meeting date
Items discussed with internal auditor Items discussed with CPA
major events, and major transactions
5. Key reviewing matters. 6. Other communication matters.
2020/05/11 Audit report of 2020 Q1 1. Declaration of independence. 2. The scope and method of
review. 3. Group review. 4. Major accounting policies,
major accounting estimates, major events, and major transactions
5. Other communication matters. The three independent directors of the Company gave us valuable opinions with no objections or reservations on all discussed matters. The directors' statements were all set out in the minutes of the Audit Committee meeting.
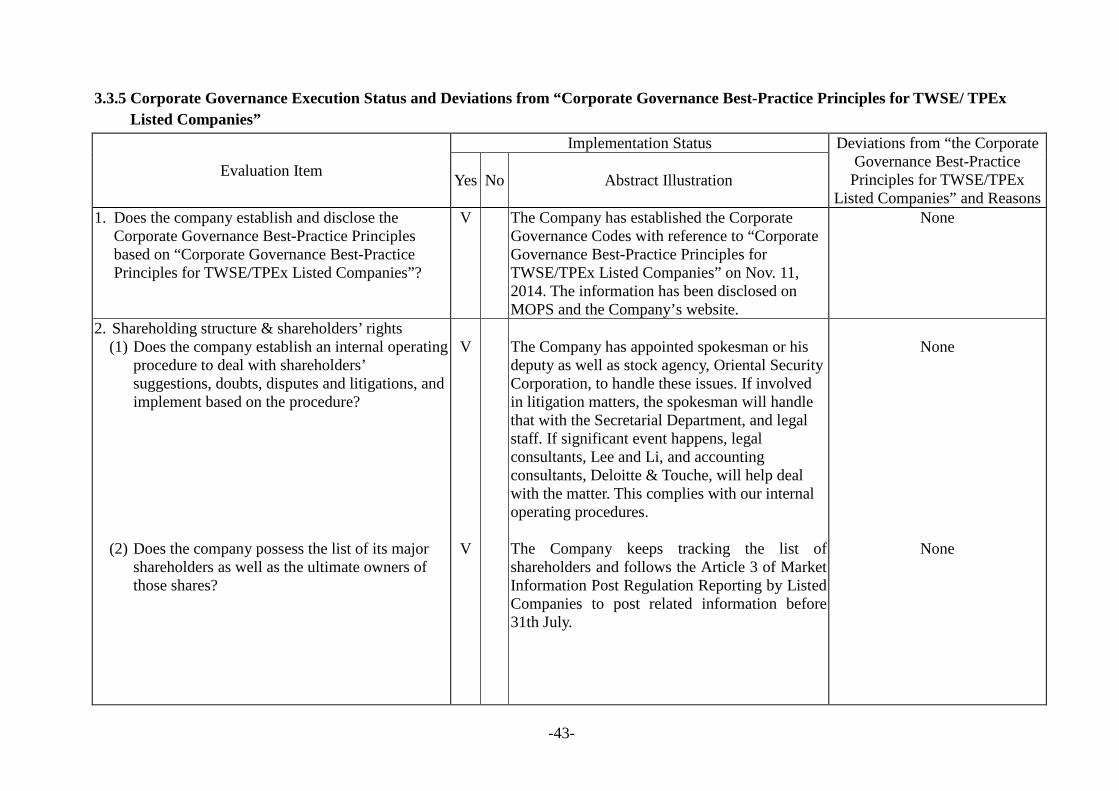
-43-
3.3.5 Corporate Governance Execution Status and Deviations from “Corporate Governance Best-Practice Principles for TWSE/ TPEx Listed Companies”
Evaluation Item
Implementation Status Deviations from “the Corporate Governance Best-Practice
Principles for TWSE/TPEx Listed Companies” and Reasons
Yes No Abstract Illustration
1. Does the company establish and disclose the Corporate Governance Best-Practice Principles based on “Corporate Governance Best-Practice Principles for TWSE/TPEx Listed Companies”?
V The Company has established the Corporate Governance Codes with reference to “Corporate Governance Best-Practice Principles for TWSE/TPEx Listed Companies” on Nov. 11, 2014. The information has been disclosed on MOPS and the Company’s website.
None
2. Shareholding structure & shareholders’ rights (1) Does the company establish an internal operating
procedure to deal with shareholders’ suggestions, doubts, disputes and litigations, and implement based on the procedure?
(2) Does the company possess the list of its major shareholders as well as the ultimate owners of those shares?
V
V
The Company has appointed spokesman or his deputy as well as stock agency, Oriental Security Corporation, to handle these issues. If involved in litigation matters, the spokesman will handle that with the Secretarial Department, and legal staff. If significant event happens, legal consultants, Lee and Li, and accounting consultants, Deloitte & Touche, will help deal with the matter. This complies with our internal operating procedures. The Company keeps tracking the list of shareholders and follows the Article 3 of Market Information Post Regulation Reporting by Listed Companies to post related information before 31th July.
None
None
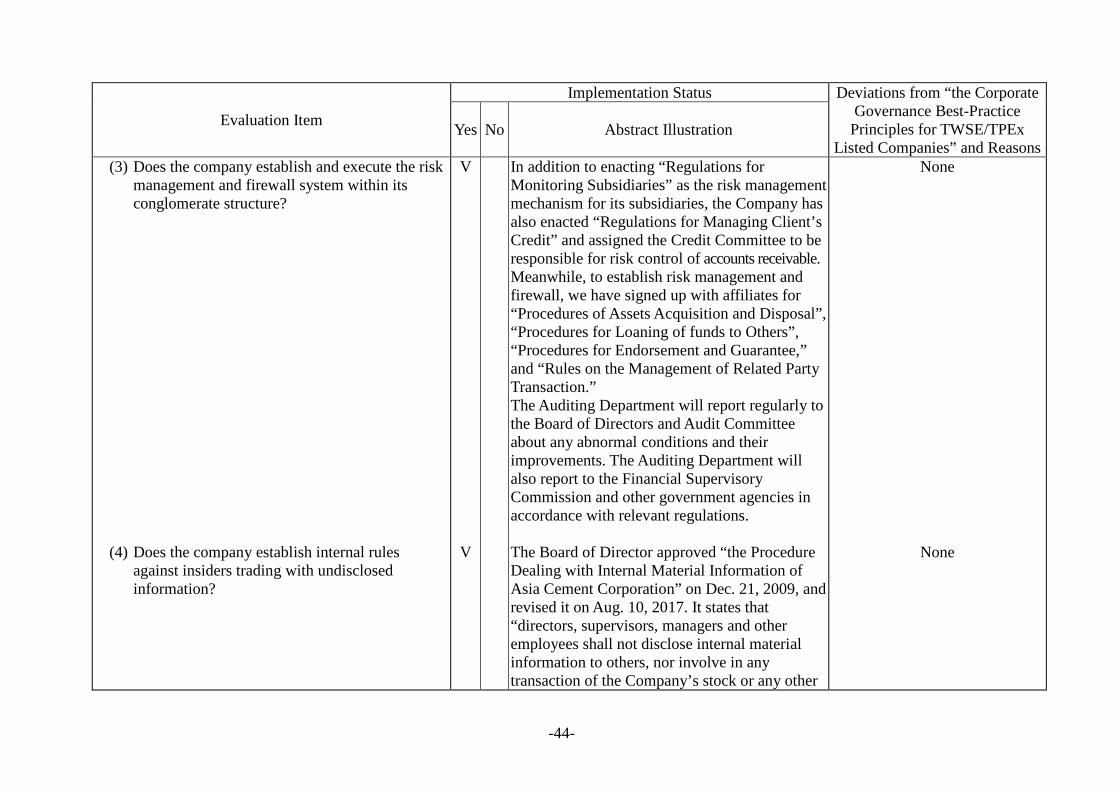
-44-
Evaluation Item
Implementation Status Deviations from “the Corporate Governance Best-Practice
Principles for TWSE/TPEx Listed Companies” and Reasons
Yes No Abstract Illustration
(3) Does the company establish and execute the risk management and firewall system within its conglomerate structure?
(4) Does the company establish internal rules against insiders trading with undisclosed information?
V
V
In addition to enacting “Regulations for Monitoring Subsidiaries” as the risk management mechanism for its subsidiaries, the Company has also enacted “Regulations for Managing Client’s Credit” and assigned the Credit Committee to be responsible for risk control of accounts receivable. Meanwhile, to establish risk management and firewall, we have signed up with affiliates for “Procedures of Assets Acquisition and Disposal”, “Procedures for Loaning of funds to Others”, “Procedures for Endorsement and Guarantee,” and “Rules on the Management of Related Party Transaction.” The Auditing Department will report regularly to the Board of Directors and Audit Committee about any abnormal conditions and their improvements. The Auditing Department will also report to the Financial Supervisory Commission and other government agencies in accordance with relevant regulations. The Board of Director approved “the Procedure Dealing with Internal Material Information of Asia Cement Corporation” on Dec. 21, 2009, and revised it on Aug. 10, 2017. It states that “directors, supervisors, managers and other employees shall not disclose internal material information to others, nor involve in any transaction of the Company’s stock or any other
None
None

-45-
Evaluation Item
Implementation Status Deviations from “the Corporate Governance Best-Practice
Principles for TWSE/TPEx Listed Companies” and Reasons
Yes No Abstract Illustration
forms of security.” The Procedure has been post on the Company’s website and internal bulletin board.
3. Composition and Responsibilities of the Board of Directors (1) Does the Board develop and implement a
diversified policy for the composition of its members?
V
The Board members considered its member diversification and approved “strengthening the function of the Board” Section of “the Corporate Governance Codes”. The Company adopts candidate nomination system for the election of directors. In addition to the assessment of each candidate's education and experience, opinion of the stakeholder and full compliance with “the election rules for directors " and “Corporate Governance Codes” are also considered. In the members of the 26th Board of Directors, except for one female member, there are members who have abilities of leadership, operation analysis, management, crisis management, industry knowledge and international view, such as Douglas Tong Hsu, Tsai Hsiung Chang, Johnny Shih, Peter Hsu, Kun Yen Lee, and Chen Kun Chang. Members who represent public welfare is Connie Hsu. C.V. Chen and Kwan-Tao Li specialize in legal matters. Ruey Long Chen served as Minister of Economy. Chin-Der Ou served as vice mayor of Taipei City. As for independent directors,
None
-46-
Evaluation Item
Implementation Status Deviations from “the Corporate Governance Best-Practice
Principles for TWSE/TPEx Listed Companies” and Reasons
Yes No Abstract Illustration
(2) Does the company voluntarily establish other
functional committees in addition to the Remuneration Committee and the Audit Committee?
V
Ta-Chou Huang Chi Schive, and Gordon S. Chen, they are expert in administrative management and financial matters. It is also mentionable that Ta-Chou Huang had served in agriculture affair for the government. He gave us many advices in green vegetation and environmental protection of plants and mines. In summary, the present members of the Board do have diversity. The diversified policy for the composition of the Board of Directors has been disclosed on the Company’s website and MOPS. The Company has established Remuneration Committee and Audit Committee pursuant to government regulations. Other voluntarily established functional committees are: Human Resource Committee: Review and advice to modify the Company’s organization structure, rules of personnel management, and other important human resource matters with reference to the Universal Declaration of Human Rights and International Labor Conventions. Credit Committee: Execute “Regulations for Managing Client’s Credit” enacted by the Company and take charge of risk control of account receivable.
None

-47-
Evaluation Item
Implementation Status Deviations from “the Corporate Governance Best-Practice
Principles for TWSE/TPEx Listed Companies” and Reasons
Yes No Abstract Illustration
(3) Does the company establish a standard to measure the performance of the Board, and implement it annually?
V
CSR Committee: Responsible for investigating and identifying corporate sustainability issues and to respond major considerations of stakeholders in order to implement the goal of sustainable development. IT Steering Committee: Review all affairs relating to information operation system, office automation, internal and external website applications and information security to the needs of operation, management and provide strategy to prevent the risk of information security and its efficiency. The company enacted “Procedures for Evaluating the Board’s Performance” on May 13, 2015 and conducts it annually. Evaluation methods: 1. Self-assessment of Board members
Board members fill in the” Self-Assessment Questionnaire for Board Members” at the end of each year.
2. Assessment by Secretarial Department: Secretarial Department will evaluate evaluation items at the end of each year and modify evaluation items if needed.
3. Procedures: a. regularly review the effectiveness of the
evaluation. b. at the end of each year, Secretarial
None
-48-
Evaluation Item
Implementation Status Deviations from “the Corporate Governance Best-Practice
Principles for TWSE/TPEx Listed Companies” and Reasons
Yes No Abstract Illustration
Department will review the Self-Assessment Questionnaire and evaluation items, calculate a weighted average score, and report to the Board of Directors.
4. Implementation: At the beginning of each year, Secretarial Department will remind every Board’s member about items in the Self-Assessment Questionnaire and other issues, such as “recognition and discussion issues of the Board in accordance with law, "Quarterly meeting requirement of the Board", "rules regarding to conflicts of interests of Directors", "the minimum annual training hour of directors", and “to enhance attendance rate of board of directors and shareholders meeting”.
5. Secretarial Department reviewed the Self-Assessment Questionnaire of the Board and calculated a weighted average score, and reported to the Board on May 12, 2020. The Company's corporate governance department is studying whether the board's performance evaluation to be evaluated externally.
6. Although the results of performance evaluation will not affect the remuneration of individual directors, it will be used as a

-49-
Evaluation Item
Implementation Status Deviations from “the Corporate Governance Best-Practice
Principles for TWSE/TPEx Listed Companies” and Reasons
Yes No Abstract Illustration
(4) Does the company regularly assess the
independence of accountants?
reference for nomination renewal, especially the attendance rate
7. The Procedures for Evaluating the Board of Directors’ Performance has been disclosed on the Company’s website.
1. The Company appointed Li Wen Kuo and Yu Wei Fan of Deloitte & Touche to audit 2018 financial statements. The independence assessment of these two CPAs was based on Article 47 of the Accountants Law and related regulations. The result has been approved on March 19, 2018 and Marh 23, 2018 by the Audit Committee and Board of Directors.
2. In 2019, due to internal function adjustments in Deloitte & Touche-Taiwan, it adjusted the Company’s CPA to Xin Wei Tai and You Wei Fan. The independent assessment and qualifications of the CPA have been submitted to the Audit Committee on March 19, 2019 and the Board of Directors on March 20.
3. The Audit Committee and the Board of Directors meeting will regularly in March each year to assess the independence of CPAs.
None
4. Does the company establish specialized units or dedicated members and personnel responsible for corporate governance affairs, as well as carrying out key actions and reporting statuses (e.g. : including but not limited to provide the
V 1. On May 10, 2019, the Board of Directors appoints Vice President, Wei Kun Chou of the Secretarial Dept. as the Corporate Governance Officer. The secretarial Dept. serves as the secretary of the board of directors to promote
None
-50-
Evaluation Item
Implementation Status Deviations from “the Corporate Governance Best-Practice
Principles for TWSE/TPEx Listed Companies” and Reasons
Yes No Abstract Illustration
information that board directors and supervisors request to perform their duties, ensuring the general affairs of board meetings and shareholders’ meetings are held in accordance with regulations, applying and changing of company registration, and taking meeting minutes for board meetings and shareholders’ meetings.)
corporate governance. Each member of the Secretarial Dept. has more than 20 years' working experience in the management of legal affairs and board affairs.
2. 2. The main responsibilities are as follows: Convene internal corporate governance
regulations seminars twice a year. Develop company and organizational
structure to promote the independence of the board of directors, transparency, corporate governance, and internal control.
Plan to convene the Board of Directors and Audit Committee and their agenda at least prior 7 days before the meetings with sufficient meeting information to facilitate the directors to understand the contents of the relevant issues and conflict of interests in advance.
To registry the date of the shareholders' meeting every year, and to issue the meeting notice, annual report and handbook in both English and Chinese. The relevant documents shall be approved by the vice president and president.
To survey the Board’s performance evaluation and report to the board of directors annually.
3. Training hours for Corporate Governance Officer have been declared to MOPS

-51-
Evaluation Item
Implementation Status Deviations from “the Corporate Governance Best-Practice
Principles for TWSE/TPEx Listed Companies” and Reasons
Yes No Abstract Illustration
according to the regulations. 5. Does the company establish a communication
channel and build a designated section on its website for stakeholders, as well as handle all the issues they care for in terms of corporate social responsibilities?
V The Company provides “Stakeholder Area” section of the Company’s website for the communication channel with shareholders and stakeholders with respect to any CSR issues. http://www.acc.com.tw/
None
6. Does the company appoint a professional shareholder service agency to deal with shareholder affairs?
V The Company designates stock agency, Oriental Security Corporation, to deal with shareholder affairs.
None
7. Information Disclosure (1) Does the company have a corporate website to
disclose both financial standings and the status of corporate governance?
(2) Does the company have other information disclosure channels (e.g. building an English website, appointing designated people to handle information collection and disclosure, creating a spokesman system, webcasting investor conferences)?
V
V
The Company has set up a Chinese/English website (www.acc.com.tw) to disclose information regarding the Company’s financials, business and corporate governance status. The Company has assigned a spokesman or his deputy to handle information collection and disclosure. The Company will also convene the institutional investors’ conference upon request and post relevant information on MOPS and ACC website. Please refer to Section 3.3.5 8(2) Investor Relations of this Annual Report.
None
None
8. Is there any other important information to facilitate a better understanding of the company’s corporate governance practices (e.g., including but not limited to employee rights, employee wellness, investor relations, supplier relations, rights of stakeholders,
V (1) Status of employee rights and employee wellness: Please refer to the “Section 5.5 Labor Relation” of this Annual Report.
(2) Investor Relations:
None

-52-
Evaluation Item
Implementation Status Deviations from “the Corporate Governance Best-Practice
Principles for TWSE/TPEx Listed Companies” and Reasons
Yes No Abstract Illustration
directors’ and supervisors’ training records, the implementation of risk management policies and risk evaluation measures, the implementation of customer relations policies, and purchasing insurance for directors and supervisors)?
For the efficient communication between investors and the Company, in addition to the spokesman or his deputy, the Company specifies its Finance Department to serve as investor relation contact. Moreover, the Company will attend or hold investor conference if necessary. In order to ensure the information symmetry of disclosure, the Company will post relevant information and materials to MOPS and the Company's website.
(3) Supplier relations: The Company regards our suppliers as partners. Except requiring good service, high quality, and reasonable prices to our suppliers, the Company also brings our construction contractors into its safety management system, and set up safety regulations for contractors, such as access control and issuing construction permission, and holds training courses to help contractors fulfill safety requirements.
(4) Stakeholders’ Rights: For the transparency and timely disclosure of the Company, the information of finance, business, and corporate governance could be accessed on the Company’s website and MOPS in both Chinese and English.
(5) The training for directors:

-53-
Evaluation Item
Implementation Status Deviations from “the Corporate Governance Best-Practice
Principles for TWSE/TPEx Listed Companies” and Reasons
Yes No Abstract Illustration
Please refer to section 3.3.8 for detail. (6) Risk managements and assessments:
Based on the principles of “protecting assets, promote interests, reducing damages and ensuring sustainable development" of the Company, the Company forms its company organization with functions of risk management. Please refer to section 3.1.2 for detail. Besides of routine business goals, each departments of the Company would timely adjust to rapidly-changing world for risk management.
(7) Customer policy: The Company serves its customers with the principles of “good service, high quality, and reasonable prices, and customer-oriented”. The Company will also meet all customers’ need by stringent quality control.
(8) Responsibility insurance purchase for directors and supervisors: On November 8, 2019, the Board of Directors agreed to renew the liability insurance for directors, and supervisors, and important employees of the Company and affiliates in the consolidated financial statements, and it took effect on December 1, 2019.
-54-
Evaluation Item
Implementation Status Deviations from “the Corporate Governance Best-Practice
Principles for TWSE/TPEx Listed Companies” and Reasons
Yes No Abstract Illustration
9. Base on the result of ”Corporate governance Evaluation” announced by TWSE ( Taiwan Stock Exchange Corporation) in a recent year to illustrate the status of matters have been already improved and priority measures to reinforce matters haven’t been improved:
V The Company was ranked 6%~20% in “the 2019 Corporate Governance Evaluation” by the TWSE. This year will focus on improving non-scored items: whether the company website or annual report exposes the integrity management policy, as well as the specific practices and prevention of dishonesty. Improvement: The Board of Directors has amended the company's code of integrity management on March 25, 2020, and instructed Corporate Governance Officer and HR Dept. to report to the BOD regularly with education and training issues.
None
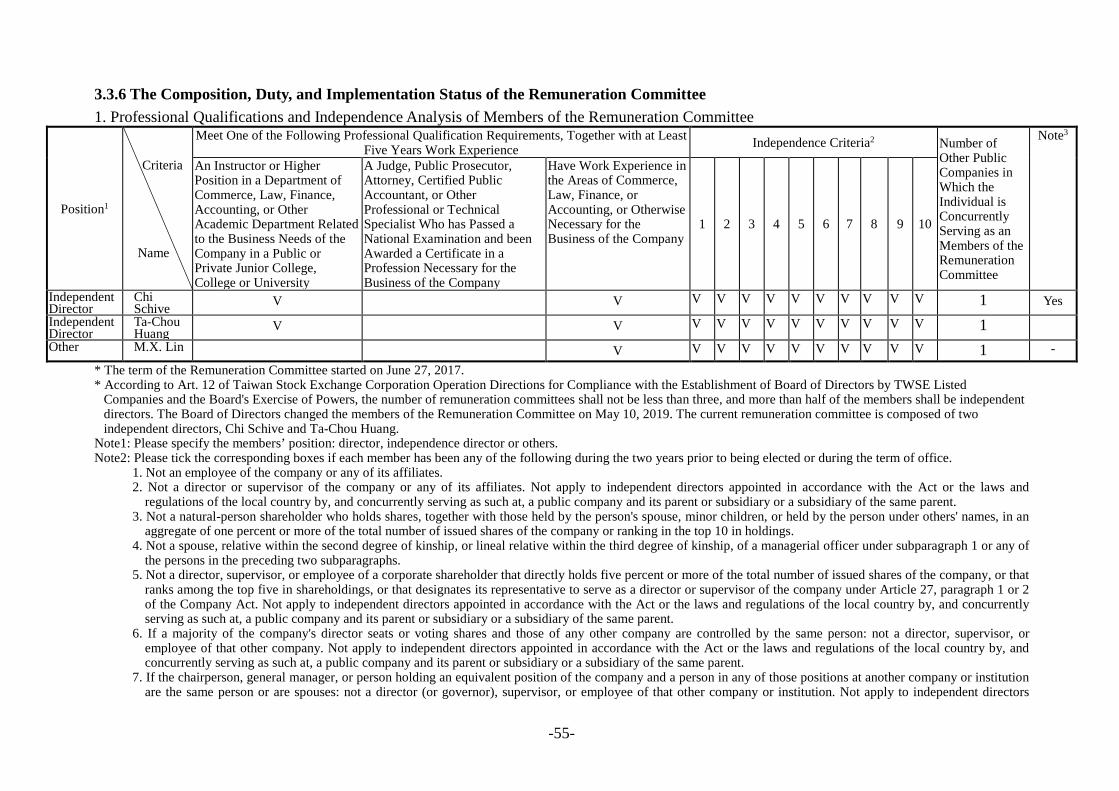
-55-
3.3.6 The Composition, Duty, and Implementation Status of the Remuneration Committee 1. Professional Qualifications and Independence Analysis of Members of the Remuneration Committee
Position1
Criteria
Name
Meet One of the Following Professional Qualification Requirements, Together with at Least Five Years Work Experience Independence Criteria2 Number of
Other Public Companies in Which the Individual is Concurrently Serving as an Members of the Remuneration Committee
Note3
An Instructor or Higher Position in a Department of Commerce, Law, Finance, Accounting, or Other Academic Department Related to the Business Needs of the Company in a Public or Private Junior College, College or University
A Judge, Public Prosecutor, Attorney, Certified Public Accountant, or Other Professional or Technical Specialist Who has Passed a National Examination and been Awarded a Certificate in a Profession Necessary for the Business of the Company
Have Work Experience in the Areas of Commerce, Law, Finance, or Accounting, or Otherwise Necessary for the Business of the Company
1 2 3 4 5 6 7 8 9 10
Independent Director
Chi Schive V V V V V V V V V V V V 1 Yes
Independent Director
Ta-Chou Huang V V V V V V V V V V V V 1
Other M.X. Lin V V V V V V V V V V V 1 - * The term of the Remuneration Committee started on June 27, 2017. * According to Art. 12 of Taiwan Stock Exchange Corporation Operation Directions for Compliance with the Establishment of Board of Directors by TWSE Listed
Companies and the Board's Exercise of Powers, the number of remuneration committees shall not be less than three, and more than half of the members shall be independent directors. The Board of Directors changed the members of the Remuneration Committee on May 10, 2019. The current remuneration committee is composed of two independent directors, Chi Schive and Ta-Chou Huang.
Note1: Please specify the members’ position: director, independence director or others. Note2: Please tick the corresponding boxes if each member has been any of the following during the two years prior to being elected or during the term of office.
1. Not an employee of the company or any of its affiliates. 2. Not a director or supervisor of the company or any of its affiliates. Not apply to independent directors appointed in accordance with the Act or the laws and
regulations of the local country by, and concurrently serving as such at, a public company and its parent or subsidiary or a subsidiary of the same parent. 3. Not a natural-person shareholder who holds shares, together with those held by the person's spouse, minor children, or held by the person under others' names, in an
aggregate of one percent or more of the total number of issued shares of the company or ranking in the top 10 in holdings. 4. Not a spouse, relative within the second degree of kinship, or lineal relative within the third degree of kinship, of a managerial officer under subparagraph 1 or any of
the persons in the preceding two subparagraphs. 5. Not a director, supervisor, or employee of a corporate shareholder that directly holds five percent or more of the total number of issued shares of the company, or that
ranks among the top five in shareholdings, or that designates its representative to serve as a director or supervisor of the company under Article 27, paragraph 1 or 2 of the Company Act. Not apply to independent directors appointed in accordance with the Act or the laws and regulations of the local country by, and concurrently serving as such at, a public company and its parent or subsidiary or a subsidiary of the same parent.
6. If a majority of the company's director seats or voting shares and those of any other company are controlled by the same person: not a director, supervisor, or employee of that other company. Not apply to independent directors appointed in accordance with the Act or the laws and regulations of the local country by, and concurrently serving as such at, a public company and its parent or subsidiary or a subsidiary of the same parent.
7. If the chairperson, general manager, or person holding an equivalent position of the company and a person in any of those positions at another company or institution are the same person or are spouses: not a director (or governor), supervisor, or employee of that other company or institution. Not apply to independent directors
-56-
appointed in accordance with the Act or the laws and regulations of the local country by, and concurrently serving as such at, a public company and its parent or subsidiary or a subsidiary of the same parent.
8. Not a director, supervisor, officer, or shareholder holding five percent or more of the shares, of a specified company or institution that has a financial or business relationship with the company. Not apply to independent directors appointed in accordance with the Act or the laws and regulations of the local country by, and concurrently serving as such at, a public company and its parent or subsidiary or a subsidiary of the same parent, if the specified company or institution holds 20 percent or more and no more than 50 percent of the total number of issued shares of the public company.
9. Not a professional individual who, or an owner, partner, director, supervisor, or officer of a sole proprietorship, partnership, company, or institution that, provides auditing services to the company or any affiliate of the company, or that provides commercial, legal, financial, accounting or related services to the company or any affiliate of the company for which the provider in the past 2 years has received cumulative compensation exceeding NT$500,000, or a spouse thereof; provided, this restriction does not apply to a member of the remuneration committee, public tender offer review committee, or special committee for merger/consolidation and acquisition, who exercises powers pursuant to the Act or to the Business Mergers and Acquisitions Act or related laws or regulations.
10. Not been a person of any conditions defined in Article 30 of the Company Law. Note3: If the member is a director, please specify whether he/she fulfills the qualification set in the paragraph 5, Article 6 of the “Regulations Governing the Appointment and
Exercise of Powers by the Remuneration Committee of a Company Whose Stock is Listed on the Stock Exchange or Traded over the Counter.”

-57-
2. Implementation Status of the Remuneration Committee There are 3 members of the Remuneration Committee. Their terms of office start from June
27, 2017 to June 26, 2020. Totally, 2 meetings of the Remuneration Committee were held in the latest year. Members’ attendance condition was as follows:
Position Name Attendance in Person
Attendance in Proxy
Attendance rate Notes
Convener Chi Schive 2 0 100 Incumbent
Member Ta-Chou Huang 2 0 100 Incumbent
Member M.X. Lin 2 0 100 Incumbent
Other mentionable items: 1. If the board of directors declined to adopt, or modified a recommendation of the Remuneration
Committee, please specify the date, term, content, resolution, and the Company’s processing situations for Remuneration Committee’s resolution: None.
Meeting Date Discussion item Approve Opinion processing
situations
2019/03/18
President and vice president's 2018 performance evaluation V All members present at the meeting agreed to pass the items without objection. .
2018 directors' and employees’ remuneration V President and vice president's 2019 performance evaluation items V
2019/11/05 2018 directors', president’s, and vice presidents' remuneration, and the situation of the cement industry V
2. If any objections or reservations expressed by any committee member in record or in written to
Remuneration Committee’s resolution, please specify the date, term, content, and the committee’s processing situations for objections or reservations: None.

-58-
3.3.7 Corporate Social Responsibility Evaluation Item Implementation Status Deviations from “the
CSR Best-Practice Principles for TWSE/TPEx Listed Companies” and Reasons
Yes No Abstract Explanation
1. Does the company assess ESG risks associated with its operations based on the principle of materiality, and establish related risk management policies or strategies?
V The Company enacted “Corporate Social Responsibility Policy” on Nov. 11, 2014 and published first CSR report on Dec. 2014. These have been disclosed on the Company’s website. The CSR Committee (operated by the Secretarial Department) will report to the Board on May and November about the implement status and review of the CSR policy. The Company also briefed to the shareholders' meeting held on June 26, 2018 on the CSR implement plans and its results which is disclosed in the Company's website and CSR Report. The Company's corporate social responsibility policy and CSR report have been disclosed on the Company's website. After the mining rights extension of the Hualien Plant was approved, it caused dissatisfaction of environmental groups and misunderstandings of the indigenous tribes. After 3 years of communication, there has been a goodwill feedback on "home security" and "truth investigation".
None
2. The company establishes exclusively (or concurrently) dedicated units to be in charge of proposing and enforcing the corporate social responsibility policies.
V CSR Committee established on Nov. 11, 2014 and is responsible for investigating and identifying CSR issues (operated by the Secretarial Department). The CSR Committee will report to the Board on May and November about the implement status and review of the CSR policy. The Secretarial Department will report the effectiveness about CSR activity twice a year.
None
3. Fostering a Sustainable Environment
(1)The company establishes proper environmental management systems based
V
In November 1996, the Hualien plant of the Company became one of the first organizations in Taiwan to receive ISO-14001 certification. This management system was completed by the Hualien plant personnel itself based on the
None
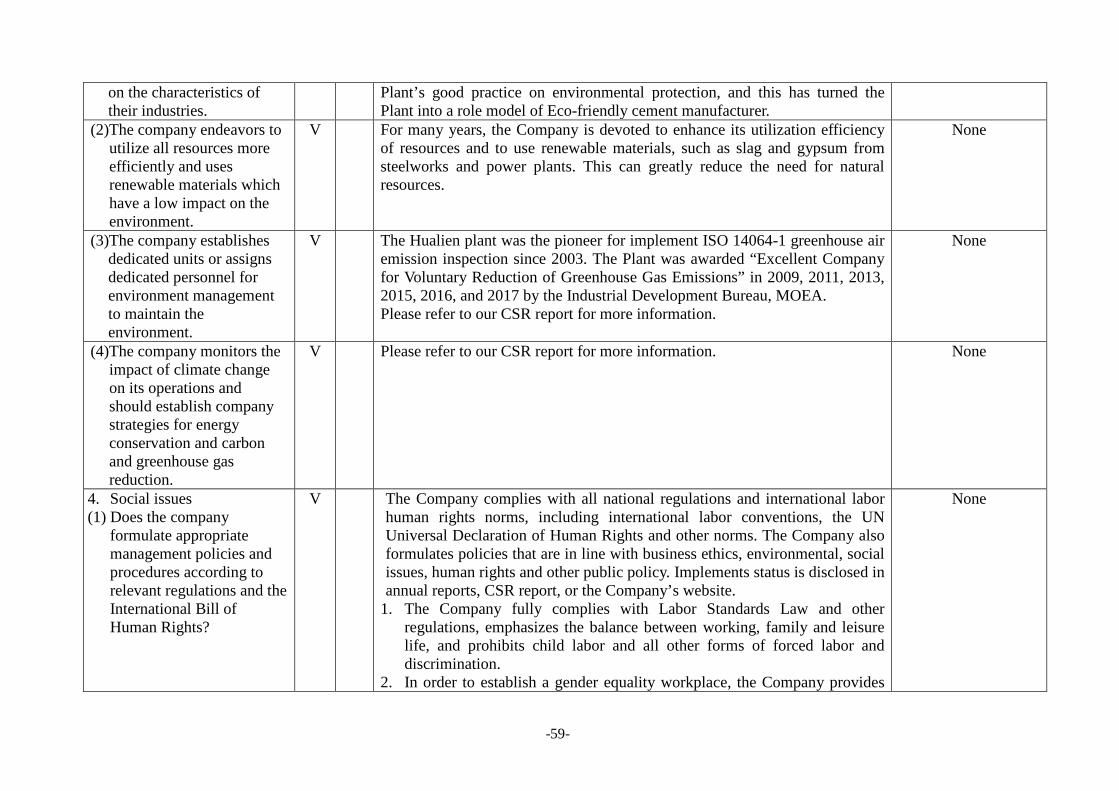
-59-
on the characteristics of their industries.
Plant’s good practice on environmental protection, and this has turned the Plant into a role model of Eco-friendly cement manufacturer.
(2)The company endeavors to utilize all resources more efficiently and uses renewable materials which have a low impact on the environment.
V For many years, the Company is devoted to enhance its utilization efficiency of resources and to use renewable materials, such as slag and gypsum from steelworks and power plants. This can greatly reduce the need for natural resources.
None
(3)The company establishes dedicated units or assigns dedicated personnel for environment management to maintain the environment.
V The Hualien plant was the pioneer for implement ISO 14064-1 greenhouse air emission inspection since 2003. The Plant was awarded “Excellent Company for Voluntary Reduction of Greenhouse Gas Emissions” in 2009, 2011, 2013, 2015, 2016, and 2017 by the Industrial Development Bureau, MOEA. Please refer to our CSR report for more information.
None
(4)The company monitors the impact of climate change on its operations and should establish company strategies for energy conservation and carbon and greenhouse gas reduction.
V Please refer to our CSR report for more information. None
4. Social issues (1) Does the company
formulate appropriate management policies and procedures according to relevant regulations and the International Bill of Human Rights?
V The Company complies with all national regulations and international labor human rights norms, including international labor conventions, the UN Universal Declaration of Human Rights and other norms. The Company also formulates policies that are in line with business ethics, environmental, social issues, human rights and other public policy. Implements status is disclosed in annual reports, CSR report, or the Company’s website.
1. The Company fully complies with Labor Standards Law and other regulations, emphasizes the balance between working, family and leisure life, and prohibits child labor and all other forms of forced labor and discrimination.
2. In order to establish a gender equality workplace, the Company provides
None

-60-
childcare leave, family care leave, physiology leave, maternity leave, paternity leave, and breastfeeding room.
3. Every year, the Company arranges employee health examinations, holds health seminars, and promotes the employee assistance program (EAP). For details, please refer to the 5.5 Labor Relations and the CSR Report.
4. Human Resource Committee of the Company follows the provisions of Article 18, Item 2 of the Code of Practice for Corporate Social Responsibility, formulates the human rights policy of the Company, and regularly evaluates the impact of the Company's operating activities and internal management on human rights, and has corresponding procedures.
5. Specific management plan: The Company provided training on human-rights related issues in 2019 (including corporate social responsibility in human rights practice, cross-cultural communication and understanding, labor education, health management and mental health related courses) with total 55 courses for 120 hours and 1,410 trainees.
(2) Does the company have reasonable employee benefit measures (including salaries, leave, and other benefits), and do business performance or results reflect on employee salaries?
V Article 25 of the Company's AOI stipulates that: if the Company makes a profit in the year, it shall allocate 1.0% to 4.0% as employee remuneration. The remuneration policy clearly states that employee remuneration includes performance bonuses, and the calculation of the bonus is based on the Company ’s operating performance for the year. 1. When formulating the remuneration system, the Company will be equal
regardless of gender, age, race, socioeconomic class, religion, and marital and family status, except for education level, work experience, license and professional skills.
2. In order to plan a fair and reasonable remuneration system, the Company also participates in market salary surveys every year to ensure that the Company's employees are ranked among the best in the industry.
※ In 2019, the Company was renewed as a constituent stock of the "Taiwan High Salary 100 Index" by the stock exchange.
3. Thanks to the rational participation of the labor unions of Hsinchu and Hualien plant for years in achieving the Company's remuneration policy. The Company and the Unions were awarded the "2013 Signed Group Agreement Outstanding Unit" issued by the Ministry of Labor
None

-61-
4. Employee performance, training and volunteer services are all included in the performance assessment of the "employee work rules", and there is a clear reward and punishment system. Please refer to the CSR report for a description of sustainable and happy workplace.
5. The company will consider the company's profitability every year, and make salary adjustments or promotions based on individual performance results. The average salary adjustment range is 1% to 3%.
(3) Does the company provide a healthy and safe working environment and organize training on health and safety for its employees on a regular basis?
V Please refer to Section 5.5 “Labor Relation” for detail. None
(4) Does the company provide its employees with career development and training sessions?
V For employees’ career development and training sessions, in addition to relevant management skills, the Company provides systematic training courses to strengthen the employees’ abilities and enhance the competitiveness of both employees and corporation. Recently, the Company cooperates with Yuan Ze University to conducts employee career development training programs for a 2-years period. Please refer to our CSR report for more information.
None
(5)Do the company's products and services comply with relevant laws and international standards in relation to customer health and safety, customer privacy, and marketing and labeling of products and services, and are relevant consumer protection and grievance procedure policies implemented?
V The Company has set up a standard operation procedure dealing with customers’ complaint and protects consumers’ health and safety. Besides, the Company will keep the transparency of information to meet customers’ need while consumers’ personal information will be kept security according to Personal Information Protection Act. All products and services of the Company are advertised and labeled according to relevant regulations and international standards. Asia Cement received CNS Mark for Portland Cement (Type 1) since Sep. 22, 1961. Thus, the Company received "Special Honor for CNS Mark" for using CNS Mark more than 50 years on Oct. 2011. The trademark of “Skyscraper Cement” of the Company is registered pursuant to the Trademark Law.
None

-62-
All authorized uses of “Skyscraper Cement” to our subsidiaries in China are approved by China’s Trademark Office of the State Administration for Industry and Commerce. The Company serves our customers with the principles of “customer-oriented good service, high quality, and reasonable prices”. To protect consumers’ rights, the Company sets up consumer services to manage consumers’ complaints from domestic and oversea clients. The Hsinchu and Hualien plants will manage our product quality to meet all customers’ need. Domestic and Foreign Sale Departments have set up "management practices for customer satisfaction" which establishes an effective communication channel for our clients.
(6) Does the company implement supplier management policies, requiring suppliers to observe relevant regulations on environmental protection, occupational health and safety, or labor and human rights? If so, describe the results.
V Our Purchasing Department has "supplier evaluation procedures". Suppliers certified with ISO-9000, CNS marks, or other quality inspection mark will be rated as excellent suppliers. Furthermore, the Purchasing Department will assess the past impact of the supplier on CSR issues, such as ethics behaviors, legal compliance, matters relating to the health and security. This would be important basis for contractor selection. Please refer to Section 3.3.5 “Supplier relations” for detail. Upon the signing of any contract, the Company will require every supplier to follow labor laws, avoid environmental hazards, and commit to CSR policy. Whenever violation occurs, the Company has the right to terminate the contract. Please refer to our CSR report for more information.
None
5. Does the company reference internationally accepted reporting standards or guidelines, and prepare reports that disclose non-financial information of the company, such as corporate social
V The Company’s CSR report was prepared in accordance with the GRI Standards and verified by SGS Taiwan Limited in according with AA 1000 Assurance Standard.
None.

-63-
responsibility reports? Do the reports above obtain assurance from a third party verification unit?
6. Describe the difference, if any, between actual practice and the corporate social responsibility principles, if the company has implemented such principles based on the Corporate Social Responsibility Best Practice Principles for TWSE/TPEx Listed Companies: None.
7. Other useful information for explaining the status of corporate social responsibility practices: Please refer to section 5.4 “Expenditures on Environmental Protection” and CSR report for more information. * CSR website: https://csr.acc.com.tw/en/ 3.3.8 Implementation Status of Ethical Management
Evaluation Item
Implementation Status 1 Deviations from the “Ethical Corporate Management Best
Practice Principles for TWSE/GTSM Listed
Companies” and Reasons
Yes No Abstract Illustration
1. Establishment of ethical corporate management policies and programs
(1) Does the company have a Board-approved ethical corporate management policy and stated in its regulations and external correspondence the ethical corporate management policy and practices, as well as the active commitment of the Board of Directors and management towards enforcement of such policy?
V 1. “Codes of Ethical Conduct” and “Principles for Ethical Management” of Asia Cement Corporation have been adopted by Board of Directors on June 27, 2012 and reported to the 2013 shareholders’ meeting. “Principles for Ethical Management” was amended on March 25, 2020.
2. The Company has post “Codes of Ethical Conduct” and “Principles for Ethical Management” on the Company’s intranet for compliance.
3. The Company has also promoted “Codes of Ethical Conduct” and “Principles for Ethical Management” to its suppliers and contractors.
None

-64-
Evaluation Item
Implementation Status 1 Deviations from the “Ethical Corporate Management Best
Practice Principles for TWSE/GTSM Listed
Companies” and Reasons
Yes No Abstract Illustration
(2) Does the company have mechanisms in place to assess the risk of unethical conduct, and perform regular analysis and assessment of business activities with higher risk of unethical conduct within the scope of business? Does the company implement programs to prevent unethical conduct based on the above and ensure the programs cover at least the matters described in Paragraph 2, Article 7 of the Ethical Corporate Management Best Practice Principles for TWSE/TPEx Listed Companies?
(3) Does the company provide clearly the operating procedures, code of conduct, disciplinary actions, and appeal procedures in the programs against unethical conduct? Does the company enforce the programs above
The Company establish precautions for directors, managers, employees for preventing high-potential unethical conducts: 1. Set a standard distinguishing improper
benefits, 2. Set procedures for political donations, 3. Set procedures for charity donations or
sponsorship, 4. Set reporting and handling procedures to avoid
job-related conflicts of interest, 5. Set an information firewall to prevent sensitive
information or undisclosed information and to prevent the use of the non-disclosed information in insider trading,
6. Set working procedures dealing with dishonest actions involved by suppliers, customers, and trading partners and others,
7. Set working procedures dealing with violators of Principles for Ethical Management,
8. Set punishment for violators and reward for whistleblowers.
For the purpose of developing a corporate culture of ethical management and preventing unethical conduct, HR Department enacted “Working procedures and Guidelines for Ethical Management”. It clearly expresses all kinds of bad
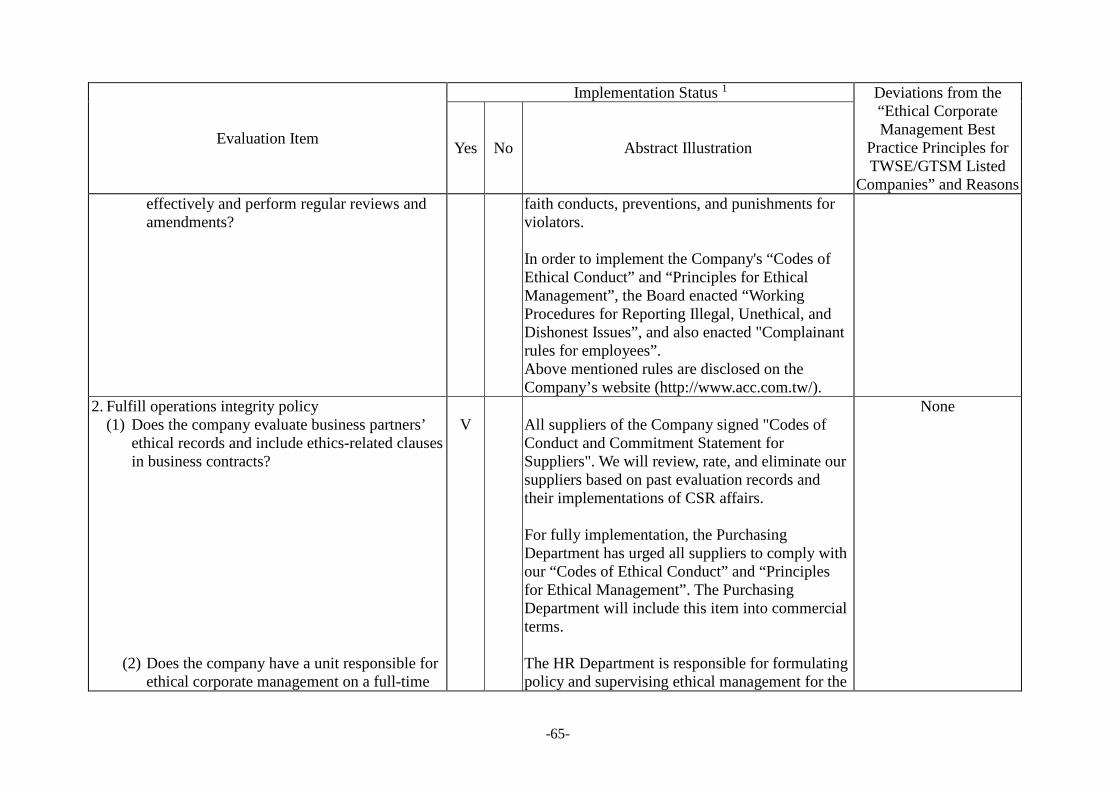
-65-
Evaluation Item
Implementation Status 1 Deviations from the “Ethical Corporate Management Best
Practice Principles for TWSE/GTSM Listed
Companies” and Reasons
Yes No Abstract Illustration
effectively and perform regular reviews and amendments?
faith conducts, preventions, and punishments for violators. In order to implement the Company's “Codes of Ethical Conduct” and “Principles for Ethical Management”, the Board enacted “Working Procedures for Reporting Illegal, Unethical, and Dishonest Issues”, and also enacted "Complainant rules for employees”. Above mentioned rules are disclosed on the Company’s website (http://www.acc.com.tw/).
2. Fulfill operations integrity policy (1) Does the company evaluate business partners’
ethical records and include ethics-related clauses in business contracts?
(2) Does the company have a unit responsible for ethical corporate management on a full-time
V
All suppliers of the Company signed "Codes of Conduct and Commitment Statement for Suppliers". We will review, rate, and eliminate our suppliers based on past evaluation records and their implementations of CSR affairs. For fully implementation, the Purchasing Department has urged all suppliers to comply with our “Codes of Ethical Conduct” and “Principles for Ethical Management”. The Purchasing Department will include this item into commercial terms. The HR Department is responsible for formulating policy and supervising ethical management for the
None

-66-
Evaluation Item
Implementation Status 1 Deviations from the “Ethical Corporate Management Best
Practice Principles for TWSE/GTSM Listed
Companies” and Reasons
Yes No Abstract Illustration
basis under the Board of Directors which reports the ethical corporate management policy and programs against unethical conduct regularly (at least once a year) to the Board of Directors while overseeing such operations?
(3) Does the company establish policies to prevent conflicts of interest and provide appropriate communication channels, and implement it?
(4) Does the company have effective accounting
and internal control systems in place to implement ethical corporate management? Does the internal audit unit follow the results
Company. It will report the implementation status to the Board on a regular basis. In addition to report implementation status of ethical management to the Board, the HR Department will also report to independent directors. The Company provides that no manager shall engage in any affairs with conflicts of interest to the Company unless otherwise released restriction by the Board and the shareholders’ Meeting. All members of our Board of Directors are highly disciplined. Once there are conflicts of interests, such member will not participate in discussion and voting of the issue according to relevant regulation and keep it in the meeting minutes. The Company also has standard procedures for employees to report any potential conflicts of interests. The Company has a strict accounting system and dedicated accounting department. For ensuring accuracy and transparency, all financial statements are audited or reviewed by Deloitte & Touche in
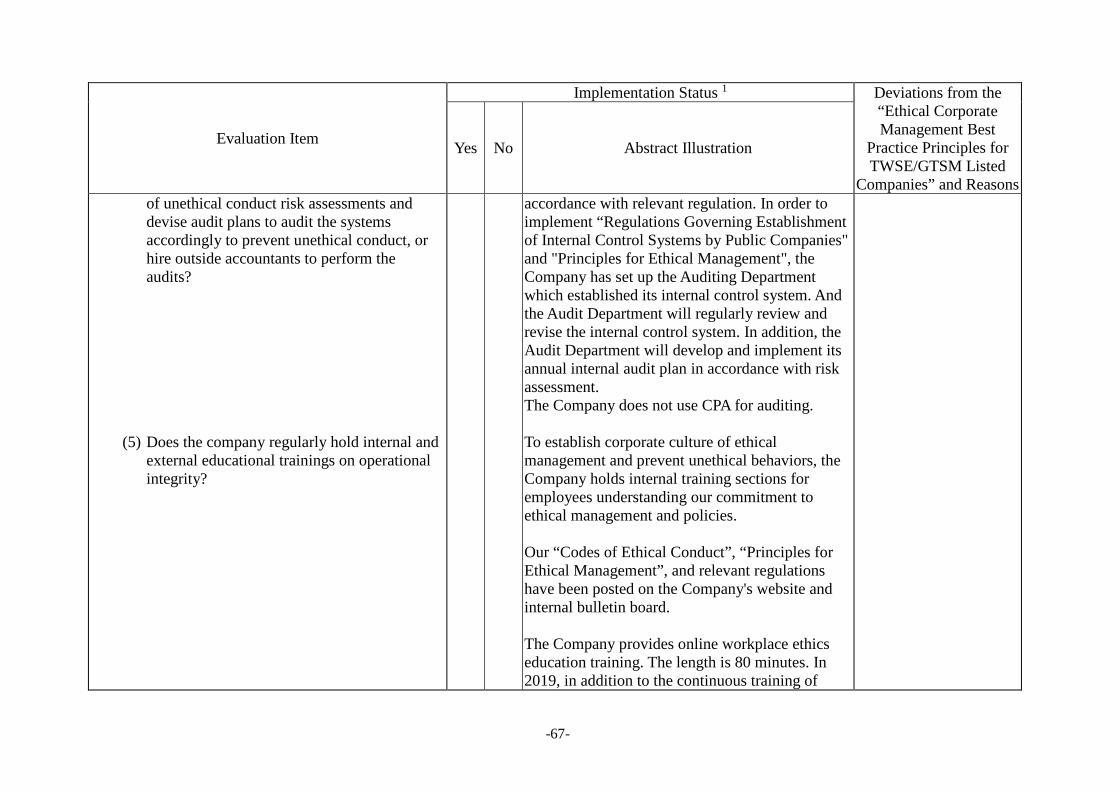
-67-
Evaluation Item
Implementation Status 1 Deviations from the “Ethical Corporate Management Best
Practice Principles for TWSE/GTSM Listed
Companies” and Reasons
Yes No Abstract Illustration
of unethical conduct risk assessments and devise audit plans to audit the systems accordingly to prevent unethical conduct, or hire outside accountants to perform the audits?
(5) Does the company regularly hold internal and external educational trainings on operational integrity?
accordance with relevant regulation. In order to implement “Regulations Governing Establishment of Internal Control Systems by Public Companies" and "Principles for Ethical Management", the Company has set up the Auditing Department which established its internal control system. And the Audit Department will regularly review and revise the internal control system. In addition, the Audit Department will develop and implement its annual internal audit plan in accordance with risk assessment. The Company does not use CPA for auditing. To establish corporate culture of ethical management and prevent unethical behaviors, the Company holds internal training sections for employees understanding our commitment to ethical management and policies. Our “Codes of Ethical Conduct”, “Principles for Ethical Management”, and relevant regulations have been posted on the Company's website and internal bulletin board. The Company provides online workplace ethics education training. The length is 80 minutes. In 2019, in addition to the continuous training of

-68-
Evaluation Item
Implementation Status 1 Deviations from the “Ethical Corporate Management Best
Practice Principles for TWSE/GTSM Listed
Companies” and Reasons
Yes No Abstract Illustration
employees, 30 new employees were required to be trained.
3. Operation of the integrity channel (1) Does the company establish both a
reward/punishment system and an integrity hotline? Can the accused be reached by an appropriate person for follow-up?
(2) Does the company have in place standard
operating procedures for investigating accusation cases, as well as follow-up actions and relevant post-investigation confidentiality measures?
(3) Does the company provide proper
whistleblower protection?
The Board of Directors enacted “Working Procedures for Reporting Illegal, Unethical, and Dishonest Issues”, and also enacted “Complainant rules for employees” on May 13, 2015. Alleged violator has the right to appeal to the investigation team while investigation hearing could be made if necessary. According to the above rules, the Company will treat all complaint confidentially and protect whistleblowers. The identification informants of whistleblowers will be kept confidential. The Company will also ensure that whistleblowers won’t be revenged because of reporting improper issues. Above mentioned rules are disclosed on the Company’s website.
None
4. Strengthening information disclosure (1) Does the company disclose its ethical corporate
management policies and the results of its implementation on the company’s website and MOPS?
Our “Codes of Ethical Conduct”, “Principles for Ethical Management”, and relevant regulations have been posted on the Company's website and internal bulletin board.
None

-69-
Evaluation Item
Implementation Status 1 Deviations from the “Ethical Corporate Management Best
Practice Principles for TWSE/GTSM Listed
Companies” and Reasons
Yes No Abstract Illustration
The Company has designated employees responsible for disclosing relevant information on MOPS and the Company's website (http://www.acc.com.tw). Since the adoption of Principles for Ethical Management, there is no violation needed to be disclosed.
5. If the company has established the ethical corporate management policies based on the Ethical Corporate Management Best-Practice Principles for TWSE/TPEx Listed Companies, please describe any discrepancy between the policies and their implementation.
There have been no differences. 6. Other important information to facilitate a better understanding of the company’s ethical corporate management policies (e.g., review and
amend its policies). The company adds integrity information to the procurement system to ensure supplier compliance, and there are appeal channels available. The Company treats its employees and business partners with the highest standards of ethical conducts. Any bribery or unethical conducts made by its employees or suppliers will be punished, such as disposition, rejection of transaction, or legal prosecution.
◎ Access to Corporate Governance Best-Practice Principles and relevant regulations: Please visit the Company's website at http://www.acc.com.tw.
◎ Any other important information to facilitate better understanding of the Company’s corporate governance practices: None. ◎ During the most recent fiscal year and the current fiscal year up to the date of printing of this annual report, any punishment occurred for the
Company and its employees violating laws, and any punishment, fault and improvement occurred for the Company’s employees against the regulations of Internal Audit System: None.
◎ To appoint certified accountants to audit internal audit system: None.

-70-
3.3.9 The Training for Directors Name Date Organizer Course Title and Lecturer Hours
Directors Douglas Tong Hsu Tsai Hsiung Chang Johnny Shih Peter Hsu Kun Yen Lee Connie Hsu C.V.Chen C.K.Chang Chin-Der Ou Champion Lee Independent Directors Ta-Chou Huang Chi Schive Gordon S.Chen
Jul.23,2019
Taiwan Academy of Banking and Finance
Board Operations Practice and Corporate Governance Workshop 3
Directors Douglas Tong Hsu Tsai Hsiung Chang Johnny Shih Kun Yen Lee Connie Hsu C.K.Chang Chin-Der Ou Champion Lee Kwan-Tao Li Independent Directors Ta-Chou Huang
Nov.14,2019 Taiwan Academy of Banking and Finance
Board Operations Practice and Corporate Governance Workshop 3
Directors Peter Hsu May.8,2019 Corporate Governance
Association Important Issues of Group Corporate Governance 3
Directors Peter Hsu Aug.2,2019 Corporate Governance
Association Cloud Computing: The benefit and the risk 3
Directors Ruey Long Chen
Sep.3,2019 Securities & Futures Institute
Directors and supervisors in the performance of their duties and principles of business judgment
3
Directors Ruey Long Chen
Sep.3,2019 Securities & Futures
Institute
The development of international and Taiwan's anti-tax avoidance and the ways for enterprises to respond
3
Directors Kwan-Tao Li
Dec.10,2019 Corporate Governance Association
Viewing the impact of economic substantive law and global anti-tax avoidance on corporate governance from the perspective of directors and supervisors
3
Directors C.V. Chen
Sep. 18,2019 Corporate Governance
Association
Discussion on the influence of new law on Money Laundering Prevention on enterprises
3
Independent Directors Chi Schive
Sep. 24,2019 Corporate Governance
Association Anti-money laundering and bribery risk practices 3
Independent Directors Gordon S.Chen Nov.25,2019 TWSE Publicity meeting for effective use
of directors' functions 3

-71-
3.3.10 The Training for Managers Title Name Date Organizer Course Title and Lecturer Ho
urs Deputy Chief Auditor
W.H.Yeh May.30,2019- May.31,2019
Accounting Research and Development Foundation
Training courses for internal auditors of public issuing companies 12
Assistant Vice President
Nancy Kao Oct.21,2019-
Oct.22,2019
Accounting Research and Development Foundation
Training courses for accounting managers 12
President Chief Executive Vice President Executive Vice President Vice President Vice President Vice President General Plant Manager Deputy Chief Auditor Assistant Vice President Special Assistant Manager Manager Manager Manager
Kun Yen Lee Y.F.Chang
Doris Wu
C.M.Chen W.K.Chou
T.L.Yu Z.P.Chang
W.H.Yeh
Nancy Kao
T.M.Chen
Manfred Wang Chenho Chung
Gary Lee Yuchi Tsai
Apr.17,2019
Aug.21,2019
Asia Cement
Using digital leverage to accelerate innovation and transformation: Chun-Yao Huang, Professor of College of Management, National Taiwan University Innovative learning ability for survival of the fittest in AI Age: Sega Cheng, iKala CEO
4
Chief Executive Vice President Executive Vice President Vice President Vice President Special Assistant Manager Manager
Y.F.Chang
Doris Wu
C.M.Chen W.K.Chou T.M.Chen
Manfred Wang Chenho Chung
Jul.23,2019
Taiwan Academy of Banking and Finance
Board Operations Practice and Corporate Governance Workshop 3
Chief Executive Vice President Executive Vice President Vice President Vice President Special Assistant
Y.F.Chang
Doris Wu
C.M.Chen W.K.Chou T.M.Chen
Nov.14,2019 Taiwan Academy of Banking and Finance
Board Operations Practice and Corporate Governance Workshop 3
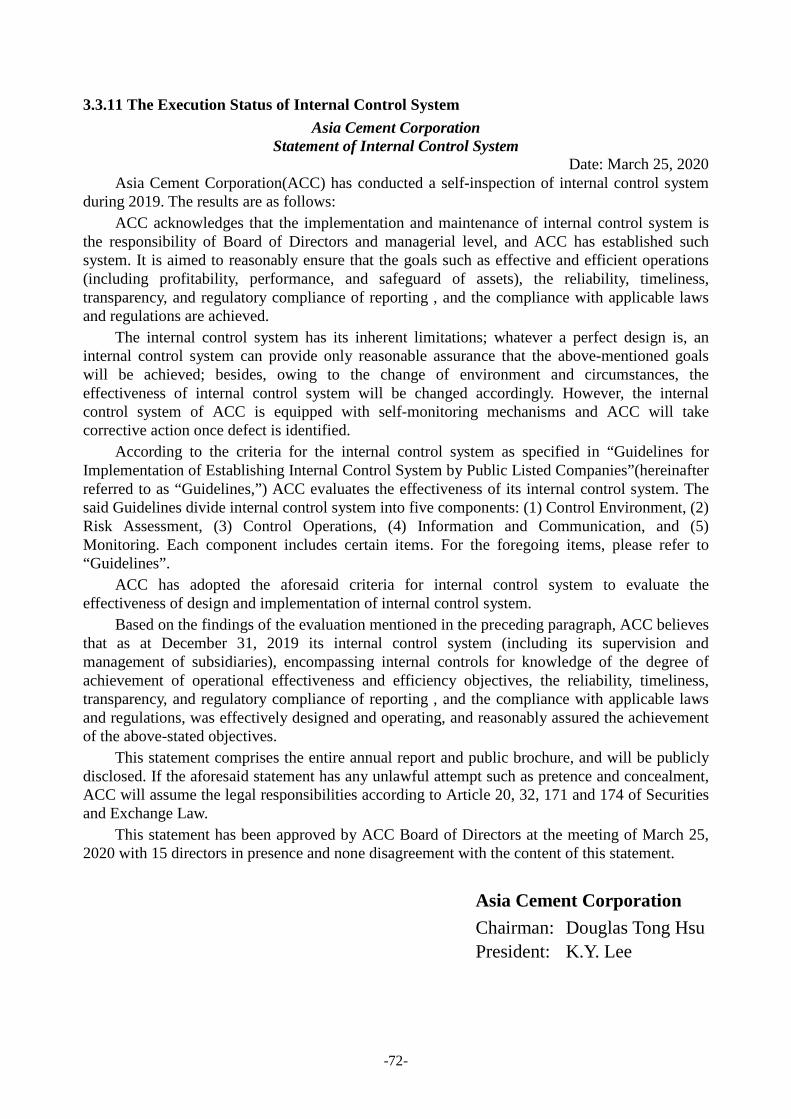
-72-
3.3.11 The Execution Status of Internal Control System Asia Cement Corporation
Statement of Internal Control System Date: March 25, 2020
Asia Cement Corporation(ACC) has conducted a self-inspection of internal control system during 2019. The results are as follows:
ACC acknowledges that the implementation and maintenance of internal control system is the responsibility of Board of Directors and managerial level, and ACC has established such system. It is aimed to reasonably ensure that the goals such as effective and efficient operations (including profitability, performance, and safeguard of assets), the reliability, timeliness, transparency, and regulatory compliance of reporting , and the compliance with applicable laws and regulations are achieved.
The internal control system has its inherent limitations; whatever a perfect design is, an internal control system can provide only reasonable assurance that the above-mentioned goals will be achieved; besides, owing to the change of environment and circumstances, the effectiveness of internal control system will be changed accordingly. However, the internal control system of ACC is equipped with self-monitoring mechanisms and ACC will take corrective action once defect is identified.
According to the criteria for the internal control system as specified in “Guidelines for Implementation of Establishing Internal Control System by Public Listed Companies”(hereinafter referred to as “Guidelines,”) ACC evaluates the effectiveness of its internal control system. The said Guidelines divide internal control system into five components: (1) Control Environment, (2) Risk Assessment, (3) Control Operations, (4) Information and Communication, and (5) Monitoring. Each component includes certain items. For the foregoing items, please refer to “Guidelines”.
ACC has adopted the aforesaid criteria for internal control system to evaluate the effectiveness of design and implementation of internal control system.
Based on the findings of the evaluation mentioned in the preceding paragraph, ACC believes that as at December 31, 2019 its internal control system (including its supervision and management of subsidiaries), encompassing internal controls for knowledge of the degree of achievement of operational effectiveness and efficiency objectives, the reliability, timeliness, transparency, and regulatory compliance of reporting , and the compliance with applicable laws and regulations, was effectively designed and operating, and reasonably assured the achievement of the above-stated objectives.
This statement comprises the entire annual report and public brochure, and will be publicly disclosed. If the aforesaid statement has any unlawful attempt such as pretence and concealment, ACC will assume the legal responsibilities according to Article 20, 32, 171 and 174 of Securities and Exchange Law.
This statement has been approved by ACC Board of Directors at the meeting of March 25, 2020 with 15 directors in presence and none disagreement with the content of this statement.
Asia Cement Corporation Chairman: Douglas Tong Hsu President: K.Y. Lee

-73-
3.3.12 Major Resolutions of Shareholders’ Meeting and Board Meetings 1. Major resolution of 2018 Regular Shareholders’ Meeting
Date Major resolutions
2019/06/24
1. Acceptance of 2018 financial statements and consolidated financial statements 2. Acceptance of the proposal for distribution of 2018 profits. 3. Amendment to “Articles of Incorporation of Asia Cement Corporation”. 4. Amendment to “Procedure for Acquisition and Disposal of Assets”. 5. Amendment to “Procedure for Making Endorsements and Guarantees”. 6. Amendment to “Procedure for Loan to Others”.
Execution Status
Major resolutions of the Shareholders’ meeting have been fully implemented. 1. The record date for distribution of 2018 profits was Jul. 30, 2019. Cash
dividends have been distributed on Aug. 16, 2019. 2. Relevant amendments have been disclosed on our website.
2. Major Resolutions of the Board of Directors
Totally 6 meetings of the Board of Directors were held in the period from Jan. 1, 2019 to May 12 2020.Directors have no opposition to major resolutions in this period.
Regarding the items listed in Article 14(3) of the Securities Exchange Act, all attended independent directors approved without disagreement. Date Major resolutions
2019/03/21 1. Acceptance of the 2018 employees’ compensation and Directors’ and Supervisors’ remuneration.
2. Acceptance of 2018 financial statements and consolidated financial statements. 3. Acceptance of the proposal for distribution of 2018 profits. 4. Acceptance of 2019 business budget. 5. Acceptance of 2019 CPA service fee of Deloitte & Touche. 6. To convene 2019 regular shareholders' meeting. 7. Acceptance to issue 2018 Statement of Internal Control System. 8. Amendment to the "internal control system". 9. Amendment to the "accounting system". 10. Tto issue medium and long-term unsecured commercial paper with total amount
not exceeding NT$10 billion in order to repay the loan, enrich the medium and long-term working capital, and strengthen the financial structure.
11. To issue unsecured corporate bonds in once or in a batch with total amount not exceeding NT$10 billion in order to repay the loan, enrich the medium and long-term working capital, and strengthen the financial structure.
12. To issue a letter of support for the Company’s subsidiary, Chiahui Power Corp., for 20-year-term NT$10.5 billion syndicated loan.
13. Amendment to “Articles of Incorporation of Asia Cement Corporation” 14. Amendment to “the Working Procedures for the Acquisition and Disposal of
Assets”. 15. Amendment to “the Procedure for Making Endorsements and Guarantees” 16. Amendment to “the Procedure for Loans of Funds to Others” 17. Amendment to “the Procedure for Employee Retirement.
2019/05/10 1. Acceptance of 2018 Business Report. 2. Amendment to "Corporate Governance Code", "Meeting Rules of the Board of
Directors", "Organization Rules of the Audit Committee" and "Organization Rules for the Remuneration Committee".
3. To change the member of remuneration committee. 4. To set up Corporate Governance Officer.
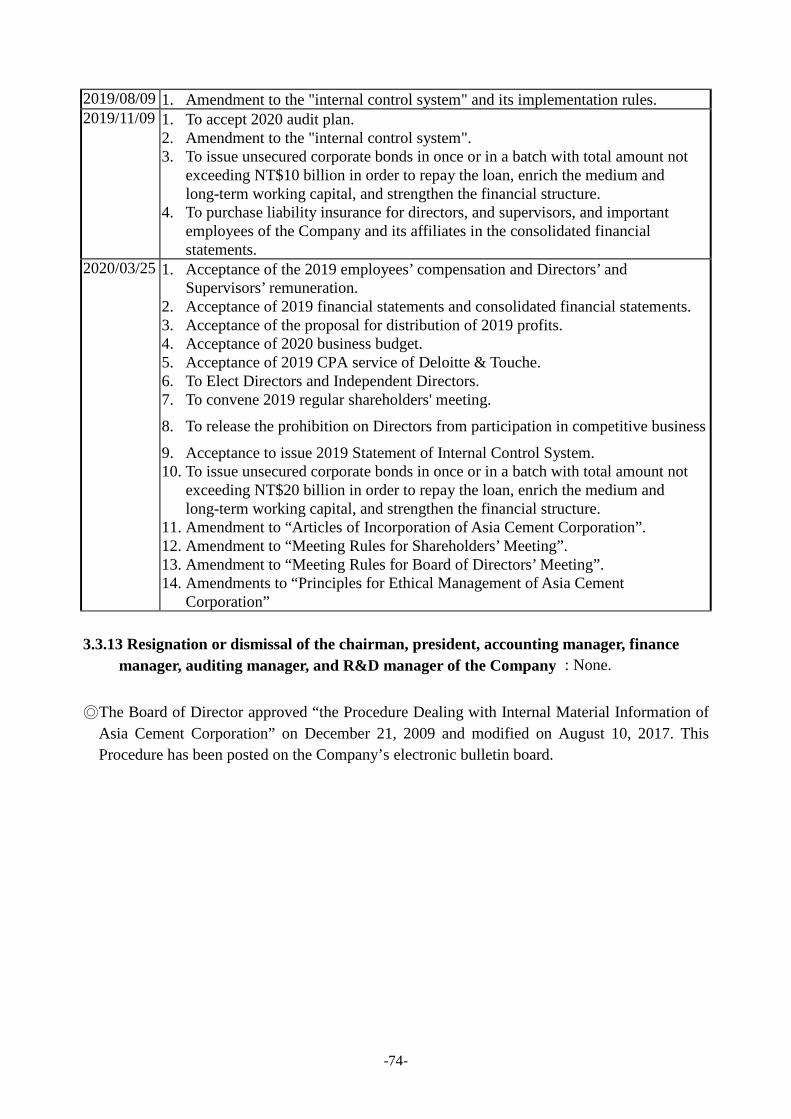
-74-
: None.
2019/08/09 1. Amendment to the "internal control system" and its implementation rules. 2019/11/09 1. To accept 2020 audit plan.
2. Amendment to the "internal control system". 3. To issue unsecured corporate bonds in once or in a batch with total amount not
exceeding NT$10 billion in order to repay the loan, enrich the medium and long-term working capital, and strengthen the financial structure.
4. To purchase liability insurance for directors, and supervisors, and important employees of the Company and its affiliates in the consolidated financial statements.
2020/03/25 1. Acceptance of the 2019 employees’ compensation and Directors’ and Supervisors’ remuneration.
2. Acceptance of 2019 financial statements and consolidated financial statements. 3. Acceptance of the proposal for distribution of 2019 profits. 4. Acceptance of 2020 business budget. 5. Acceptance of 2019 CPA service of Deloitte & Touche. 6. To Elect Directors and Independent Directors. 7. To convene 2019 regular shareholders' meeting.
8. To release the prohibition on Directors from participation in competitive business
9. Acceptance to issue 2019 Statement of Internal Control System. 10. To issue unsecured corporate bonds in once or in a batch with total amount not
exceeding NT$20 billion in order to repay the loan, enrich the medium and long-term working capital, and strengthen the financial structure.
11. Amendment to “Articles of Incorporation of Asia Cement Corporation”. 12. Amendment to “Meeting Rules for Shareholders’ Meeting”. 13. Amendment to “Meeting Rules for Board of Directors’ Meeting”. 14. Amendments to “Principles for Ethical Management of Asia Cement
Corporation”
3.3.13 Resignation or dismissal of the chairman, president, accounting manager, finance manager, auditing manager, and R&D manager of the Company
◎The Board of Director approved “the Procedure Dealing with Internal Material Information of Asia Cement Corporation” on December 21, 2009 and modified on August 10, 2017. This Procedure has been posted on the Company’s electronic bulletin board.

-75-
3.4 Information of CPA Service Fee
1. Information of CPA service fee
Accounting Firm
Name of CPA
Audit Fee
Non-audit Fee Audit period System
design Business
Registration Human
Resource Other (Note) Subtotal
Deloitte & Touche
X.W. Tai 7,560 0 10 50 874 934 01/01/2019-12/31/2019
Y. W. Fan
Note: Others including (1)Transfer Pricing report 280 thousands (2)Application of tax rulings 300 thousands (3)Audit fee for investment in mainland china 80 thousands (4)Corporate Bonds issuance expenses and opinions 214 thousands. 2. If the audit fee in the year CPA firm changes is lower than that in the prior year, specify the
amount of audit fee before and after and the reason: None.
3. If the audit fee dropped year on year by more than 10%, specifies the amount, percentage, reason of the reduction: None.
4. Change of CPA in recent two fiscal years and subsequent periods: The Company commissioned Deloitte & Touche-Taiwan to audit the financial statements. Due to internal function adjustments in Deloitte & Touche-Taiwan, the audit has been commissioned from CPA Li Wen Kuo and Yu Wei Fan to CPA Shin Wei Tai and Yu Wei Fan since 2019Q1.
5. The ACC Chairman, President, and managers who are responsible for finance and accounting do not have any position at CPA Firm or its affiliated companies in the most recent fiscal year.

-76-
3.5 Relevant licenses and certificates obtained about transparent financial
information
Department Name Title Licenses and Certificates
Finance Doris Wu Executive Vice President CPA, Taiwan and United States
Finance Yu Ling Yang Assistant Vice President CPA, Taiwan and China Finance Ya Ping Li Manager CPA, Taiwan
Finance Yu De Liao Deputy Manager Certified Internal Auditor Certified Information Systems Auditor
Finance Wei Zhong Chen Section Chief Chartered Financial Analyst
Auditing Chi Wen Lu Assistant Specialist Certified Internal Auditor Certification in Risk Management Assurance
Accounting Jia Ning Hsu Senior Clerk CPA, Taiwan Accounting Guang Ren Peng Assistant Administrator CPA, United States Accounting Ying Bei Lin Assistant Administrator CPA, Taiwan Accounting Bi Chen Weng Assistant Administrator CPA, Taiwan
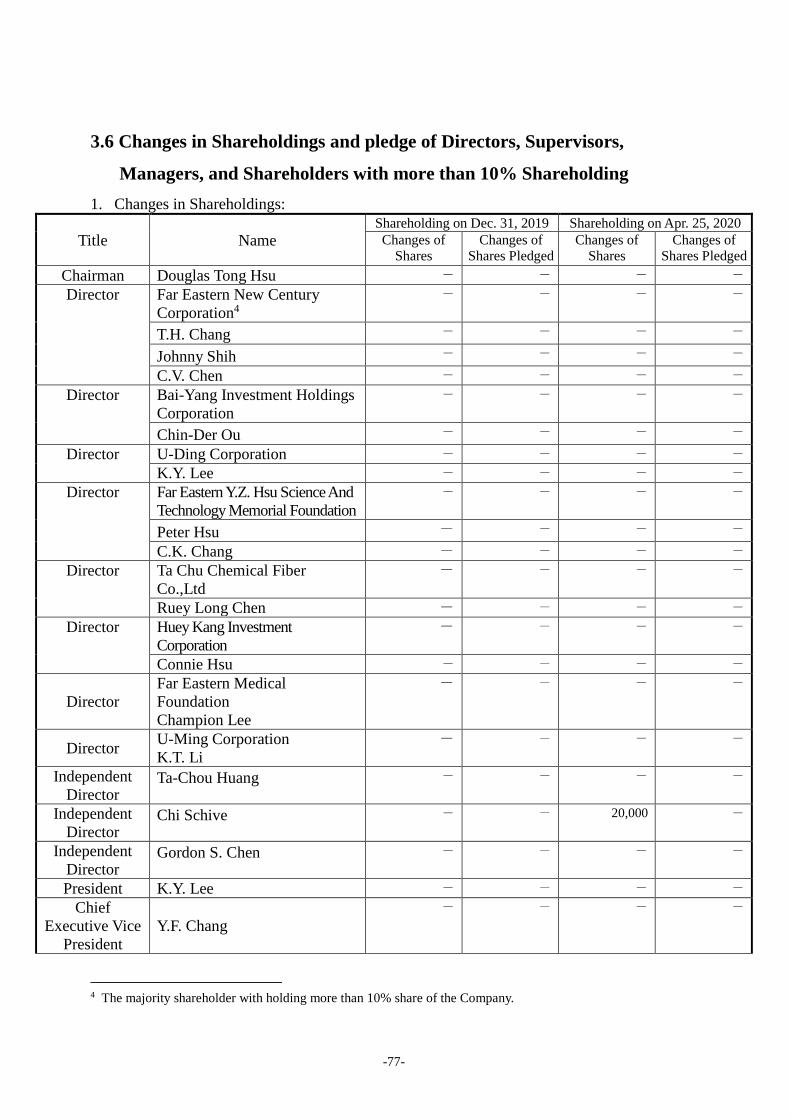
-77-
3.6 Changes in Shareholdings and pledge of Directors, Supervisors,
Managers, and Shareholders with more than 10% Shareholding 1. Changes in Shareholdings:
Title Name Shareholding on Dec. 31, 2019 Shareholding on Apr. 25, 2020 Changes of
Shares Changes of
Shares Pledged Changes of
Shares Changes of
Shares Pledged Chairman Douglas Tong Hsu - - - - Director Far Eastern New Century
Corporation4 - - - -
T.H. Chang - - - -
Johnny Shih - - - -
C.V. Chen - - - - Director Bai-Yang Investment Holdings
Corporation - - - -
Chin-Der Ou - - - -
Director U-Ding Corporation - - - - K.Y. Lee - - - -
Director Far Eastern Y.Z. Hsu Science And Technology Memorial Foundation
- - - -
Peter Hsu - - - -
C.K. Chang - - - - Director Ta Chu Chemical Fiber
Co.,Ltd - - - -
Ruey Long Chen - - - - Director Huey Kang Investment
Corporation - - - -
Connie Hsu - - - -
Director Far Eastern Medical Foundation Champion Lee
- - - -
Director U-Ming Corporation K.T. Li
- - - -
Independent Director
Ta-Chou Huang - - - -
Independent Director
Chi Schive - - 20,000 -
Independent Director
Gordon S. Chen - - - -
President K.Y. Lee - - - - Chief
Executive Vice President
Y.F. Chang - - - -
4 The majority shareholder with holding more than 10% share of the Company.

-78-
Title Name Shareholding on Dec. 31, 2019 Shareholding on Apr. 25, 2020 Changes of
Shares Changes of
Shares Pledged Changes of
Shares Changes of
Shares Pledged Executive Vice
President Doris Wu - - - -
Vice President C.M. Chen - - - - Vice President W.K. Chou - - - - General Plant
Manager Z.P. Chang - - - -
Vice President T.L. Yu - - - - Deputy Chief
Auditor W.H. Yeh - - - -
Special Assistant T.M. Chen
- - - -
Accounting Manager H.Y. Kao
- - - -
Assistant Vice President Dana Lee
- - - -
Assistant Vice President Karen Yang
- - - -
Manager Z.H Zhong - - - - Manager Gary Lee - - - -
Plant Manager Z.X. Zhuang - - - -
2. Shareholders transfer information: Since the relative transfer of shareholders is non-related
person, so there is no information on this information. 3. Shareholders pledge information: no shareholders pledged.
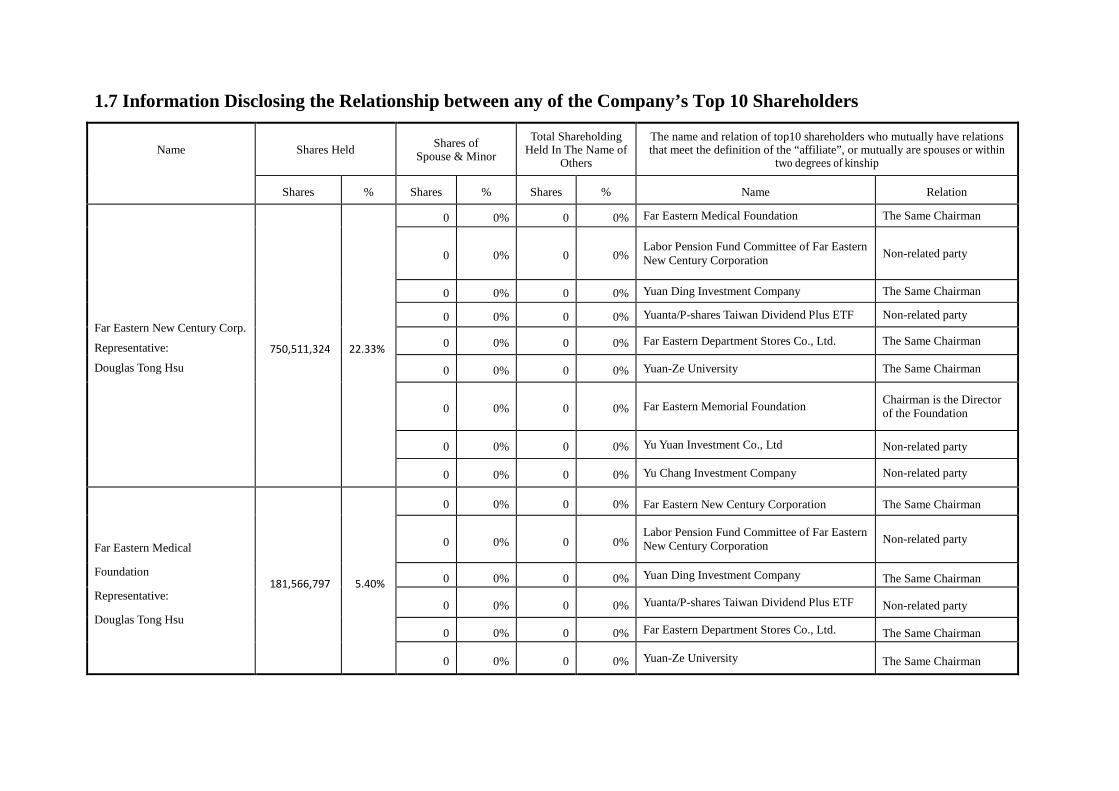
1.7 Information Disclosing the Relationship between any of the Company’s Top 10 Shareholders
Name Shares Held Shares of Spouse & Minor
Total Shareholding Held In The Name of
Others
The name and relation of top10 shareholders who mutually have relations that meet the definition of the “affiliate”, or mutually are spouses or within
two degrees of kinship
Shares % Shares % Shares % Name Relation
Far Eastern New Century Corp.
Representative:
Douglas Tong Hsu 750,511,324 22.33%
0 0% 0 0% Far Eastern Medical Foundation The Same Chairman
0 0% 0 0% Labor Pension Fund Committee of Far Eastern New Century Corporation Non-related party
0 0% 0 0% Yuan Ding Investment Company The Same Chairman
0 0% 0 0% Yuanta/P-shares Taiwan Dividend Plus ETF Non-related party
0 0% 0 0% Far Eastern Department Stores Co., Ltd. The Same Chairman
0 0% 0 0% Yuan-Ze University The Same Chairman
0 0% 0 0% Far Eastern Memorial Foundation Chairman is the Director of the Foundation
0 0% 0 0% Yu Yuan Investment Co., Ltd Non-related party
0 0% 0 0% Yu Chang Investment Company Non-related party
Far Eastern Medical
Foundation
Representative:
Douglas Tong Hsu
181,566,797 5.40%
0 0% 0 0% Far Eastern New Century Corporation The Same Chairman
0 0% 0 0% Labor Pension Fund Committee of Far Eastern New Century Corporation Non-related party
0 0% 0 0% Yuan Ding Investment Company The Same Chairman
0 0% 0 0% Yuanta/P-shares Taiwan Dividend Plus ETF Non-related party
0 0% 0 0% Far Eastern Department Stores Co., Ltd. The Same Chairman
0 0% 0 0% Yuan-Ze University The Same Chairman

Name Shares Held Shares of Spouse & Minor
Total Shareholding Held In The Name of
Others
The name and relation of top10 shareholders who mutually have relations that meet the definition of the “affiliate”, or mutually are spouses or within
two degrees of kinship
Shares % Shares % Shares % Name Relation
0 0% 0 0% Far Eastern Memorial Foundation Chairman is the Director
of the Foundation
0 0% 0 0% Yu Yuan Investment Co., Ltd Non-related party
0 0% 0 0% Yu Chang Investment Company Non-related party
Labor Pension Fund Committee
of Far Eastern New Century
Corporation
51,999,049 1.55%
0 0% 0 0% Far Eastern New Century Corporation Non-related party
0 0% 0 0% Far Eastern Medical Foundation Non-related party
0 0% 0 0% Yuan Ding Investment Company Non-related party
0 0% 0 0% Yuanta/P-shares Taiwan Dividend Plus ETF Non-related party
0 0% 0 0% Far Eastern Department Stores Co., Ltd. Non-related party
0 0% 0 0% Yuan-Ze University Non-related party
0 0% 0 0% Far Eastern Memorial Foundation Non-related party
0 0% 0 0% Yu Yuan Investment Co., Ltd Non-related party
0 0% 0 0% Yu Chang Investment Company Non-related party
Yuan Ding Investment Company Representative: Douglas Tong Hsu
51,287,518 1.53%
0 0% 0 0% Far Eastern New Century Corporation The Same Chairman
0 0% 0 0% Far Eastern Medical Foundation The Same Chairman
0 0% 0 0% Labor Pension Fund Committee of Far Eastern
New Century Corporation Non-related party
0 0% 0 0% Yuanta/P-shares Taiwan Dividend Plus ETF Non-related party
0 0% 0 0% Far Eastern Department Stores Co., Ltd. The Same Chairman
0 0% 0 0% Yuan-Ze University The Same Chairman

Name Shares Held Shares of Spouse & Minor
Total Shareholding Held In The Name of
Others
The name and relation of top10 shareholders who mutually have relations that meet the definition of the “affiliate”, or mutually are spouses or within
two degrees of kinship
Shares % Shares % Shares % Name Relation
0 0% 0 0% Far Eastern Memorial Foundation Chairman is the Director
of the Foundation
0 0% 0 0% Yu Yuan Investment Co., Ltd Non-related party
0 0% 0 0% Yu Chang Investment Company Non-related party
Yuanta/P-shares Taiwan Dividend Plus ETF 50,780,342 1.51%
0 0% 0 0% Far Eastern New Century Corporation Non-related party
0 0% 0 0% Far Eastern Medical Foundation Non-related party
0 0% 0 0% Labor Pension Fund Committee of Far Eastern
New Century Corporation Non-related party
0 0% 0 0% Yuan Ding Investment Company Non-related party
0 0% 0 0% Far Eastern Department Stores Co., Ltd. Non-related party
0 0% 0 0% Yuan-Ze University Non-related party
0 0% 0 0% Far Eastern Memorial Foundation Non-related party
0 0% 0 0% Yu Yuan Investment Co., Ltd Non-related party
0 0% 0 0% Yu Chang Investment Company Non-related party
Far Eastern Department Stores
Co., Ltd.
Representative:
Douglas Tong Hsu
50,000,492 1.49%
0 0% 0 0% Far Eastern New Century Corporation The Same Chairman
0 0% 0 0% Far Eastern Medical Foundation The Same Chairman
0 0% 0 0% Labor Pension Fund Committee of Far Eastern
New Century Corporation Non-related party
0 0% 0 0% Yuan Ding Investment Company The Same Chairman
0 0% 0 0% Yuanta/P-shares Taiwan Dividend Plus ETF Non-related party

Name Shares Held Shares of Spouse & Minor
Total Shareholding Held In The Name of
Others
The name and relation of top10 shareholders who mutually have relations that meet the definition of the “affiliate”, or mutually are spouses or within
two degrees of kinship
Shares % Shares % Shares % Name Relation
0 0% 0 0% Yuan-Ze University The Same Chairman
0 0% 0 0% Far Eastern Memorial Foundation Chairman is the Director
of the Foundation
0 0% 0 0% Yu Yuan Investment Co., Ltd Non-related party
0 0% 0 0% Yu Chang Investment Company Non-related party
Yuan-Ze University
Representative:
Douglas Tong Hsu
47,499,567 1.41%
0 0% 0 0% Far Eastern New Century Corporation The Same Chairman
0 0% 0 0% Far Eastern Medical Foundation The Same Chairman
0 0% 0 0% Labor Pension Fund Committee of Far Eastern
New Century Corporation Non-related party
0 0% 0 0% Yuan Ding Investment Company The Same Chairman
0 0% 0 0% Yuanta/P-shares Taiwan Dividend Plus ETF Non-related party
0 0% 0 0% Far Eastern Department Stores Co., Ltd. The Same Chairman
0 0% 0 0% Far Eastern Memorial Foundation Chairman is the Director
of the Foundation
0 0% 0 0% Yu Yuan Investment Co., Ltd Non-related party
0 0% 0 0% Yu Chang Investment Company Non-related party
Far Eastern Memorial Foundation Representative:
44,115,478 1.31% 0 0% 0 0% Far Eastern New Century Corporation Director of the Foundation
is the Chairman
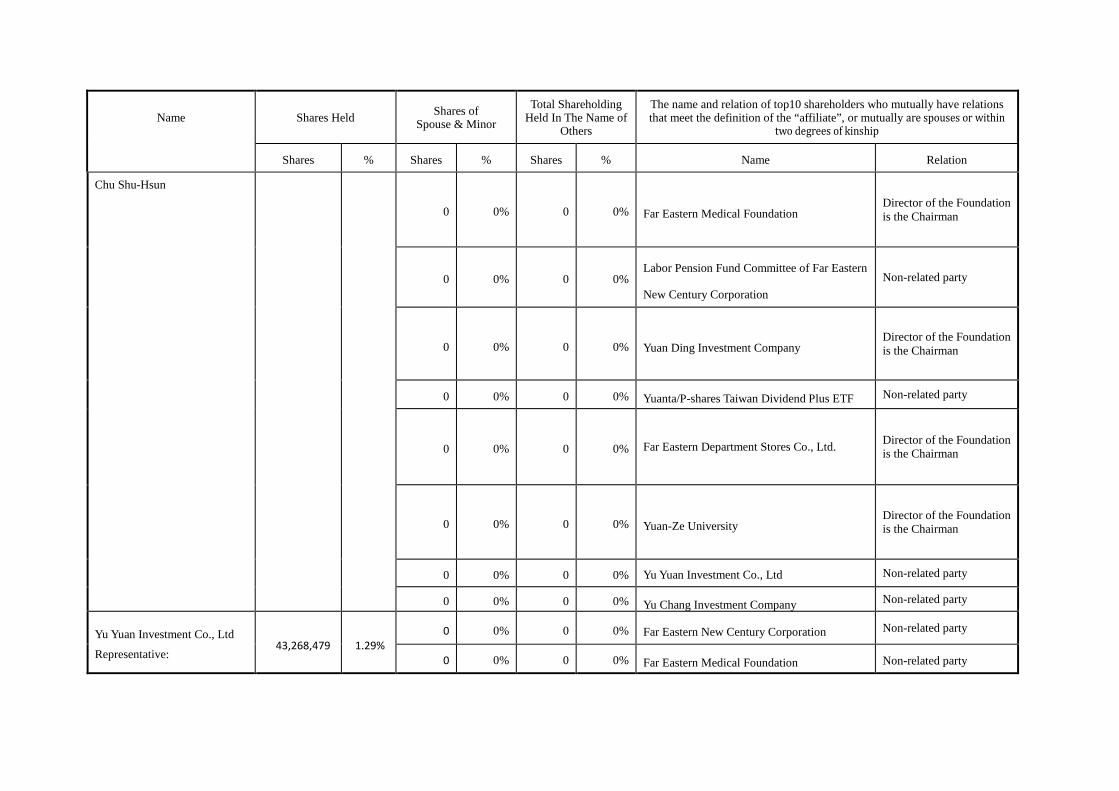
Name Shares Held Shares of Spouse & Minor
Total Shareholding Held In The Name of
Others
The name and relation of top10 shareholders who mutually have relations that meet the definition of the “affiliate”, or mutually are spouses or within
two degrees of kinship
Shares % Shares % Shares % Name Relation
Chu Shu-Hsun
0 0% 0 0% Far Eastern Medical Foundation Director of the Foundation is the Chairman
0 0% 0 0% Labor Pension Fund Committee of Far Eastern
New Century Corporation Non-related party
0 0% 0 0% Yuan Ding Investment Company Director of the Foundation is the Chairman
0 0% 0 0% Yuanta/P-shares Taiwan Dividend Plus ETF Non-related party
0 0% 0 0% Far Eastern Department Stores Co., Ltd. Director of the Foundation is the Chairman
0 0% 0 0% Yuan-Ze University Director of the Foundation is the Chairman
0 0% 0 0% Yu Yuan Investment Co., Ltd Non-related party
0 0% 0 0% Yu Chang Investment Company Non-related party
Yu Yuan Investment Co., Ltd
Representative: 43,268,479 1.29%
0 0% 0 0% Far Eastern New Century Corporation Non-related party
0 0% 0 0% Far Eastern Medical Foundation Non-related party

Name Shares Held Shares of Spouse & Minor
Total Shareholding Held In The Name of
Others
The name and relation of top10 shareholders who mutually have relations that meet the definition of the “affiliate”, or mutually are spouses or within
two degrees of kinship
Shares % Shares % Shares % Name Relation
C.M. Chen 0 0% 0 0%
Labor Pension Fund Committee of Far Eastern
New Century Corporation Non-related party
0 0% 0 0% Yuan Ding Investment Company Non-related party
0 0% 0 0% Yuanta/P-shares Taiwan Dividend Plus ETF Non-related party
0 0% 0 0% Far Eastern Department Stores Co., Ltd. Non-related party
0 0% 0 0% Yuan-Ze University Non-related party
0 0% 0 0% Far Eastern Memorial Foundation Non-related party
0 0% 0 0% Yu Chang Investment Company Non-related party
Yu Chang Investment Company
Representative:
Dong Wang-Miao-Fang
42,419,430 1.26%
0 0% 0 0% Far Eastern New Century Corporation Non-related party
0 0% 0 0% Far Eastern Medical Foundation Non-related party
0 0% 0 0% Labor Pension Fund Committee of Far Eastern
New Century Corporation Non-related party
0 0% 0 0% Yuan Ding Investment Company Non-related party
0 0% 0 0% Yuanta/P-shares Taiwan Dividend Plus ETF Non-related party
0 0% 0 0% Far Eastern Department Stores Co., Ltd. Non-related party
0 0% 0 0% Yuan-Ze University Non-related party
0 0% 0 0% Far Eastern Memorial Foundation Non-related party
0 0% 0 0% Yu Yuan Investment Co., Ltd Non-related party

-85-
3.8 Shareholding Proportion of ACC to Investees Dec. 31, 2019
Investees Investments by ACC
Investments by Directors, Supervisors, Managers and Directly or Indirectly Controlled
Businesses
Total Investments
Shares % Shares % Shares % Asia Investment Corp. 222,039,596 100.00% - 0.00% 222,039,596 100.00%
Sunrise Industrial Holdings Ltd. 90,000 100.00% - 0.00% 90,000 100.00%
Yuan Long Stainless Steel Corp. 200,000,000 100.00% - 0.00% 200,000,000 100.00%
Der Ching Investment Corp. 595,576,603 99.99% 25,326 0.00% 595,601,929 99.99%
Ya Tung Ready-Mixed Concrete Corp.
159,067,779 99.99% 6,909 0.00% 159,074,688 99.99%
Nan Hwa Cement Corp. 26,128,171 99.94% 12,396 0.05% 26,140,567 99.99%
Asia Cement (Singapore) Pte. Ltd. 10,495,495 99.96% 2 0.00% 10,495,497 99.96%
Fu Ming Transportation Co., Ltd. 29,517,188 99.82% 39,944 0.14% 29,557,132 99.96%
Asia Engineering Enterprise Corp. 7,970,703 98.23% 123,243 1.52% 8,093,946 99.75%
FEDS Development Ltd. 53,250,000 25.00% 149,100,000 70.00% 202,350,000 95.00%
Yuan Ding Co., Ltd. 178,707,648 35.50% 259,921,774 51.62% 438,629,422 87.12%
Ya Li Precast and Prestressed Concrete Industries
16,241,083 83.81% 14,366 0.08% 16,255,449 83.89%
Asia Cement (China) Holdings Corp. 1,061,209,202 67.73% 71,064,298 4.54% 1,132,273,500 72.27%
Chiahui Power Corp. 280,093,521 59.59% 1,100,069 0.24% 281,193,590 59.83%
Ya Li Transportation Corp. 5,100,000 51.00% 60,817 0.61% 5,160,817 51.61%
Everstrong Iron & Steel Foundry Ltd.
3,199,823 40.40% 660,000 8.34% 3,859,823 48.74%
Yuan Ding Leasing Corp.. 34,640,189 43.60% - 0.00% 34,640,189 43.60%
U-Ming Marine Transport Corp.
331,701,152 39.25% 20,514,219 2.43% 352,215,371 41.68%
Oriental Securities Corp..
135,092,154 18.93% 144,591,810 20.26% 279,683,964 39.19%
Far Eastern New Century Corp. 1,272,277,085 23.77% 556,345,442 10.39% 1,828,622,527 34.16%
Yue Yuan Investment Corp. 155,000,803 29.92% 515,024 0.10% 155,515,827 30.02%
China Shanshui Cement Group Ltd 331,878,315 7.62% 428,393,000 9.84% 760,271,315 17.46%
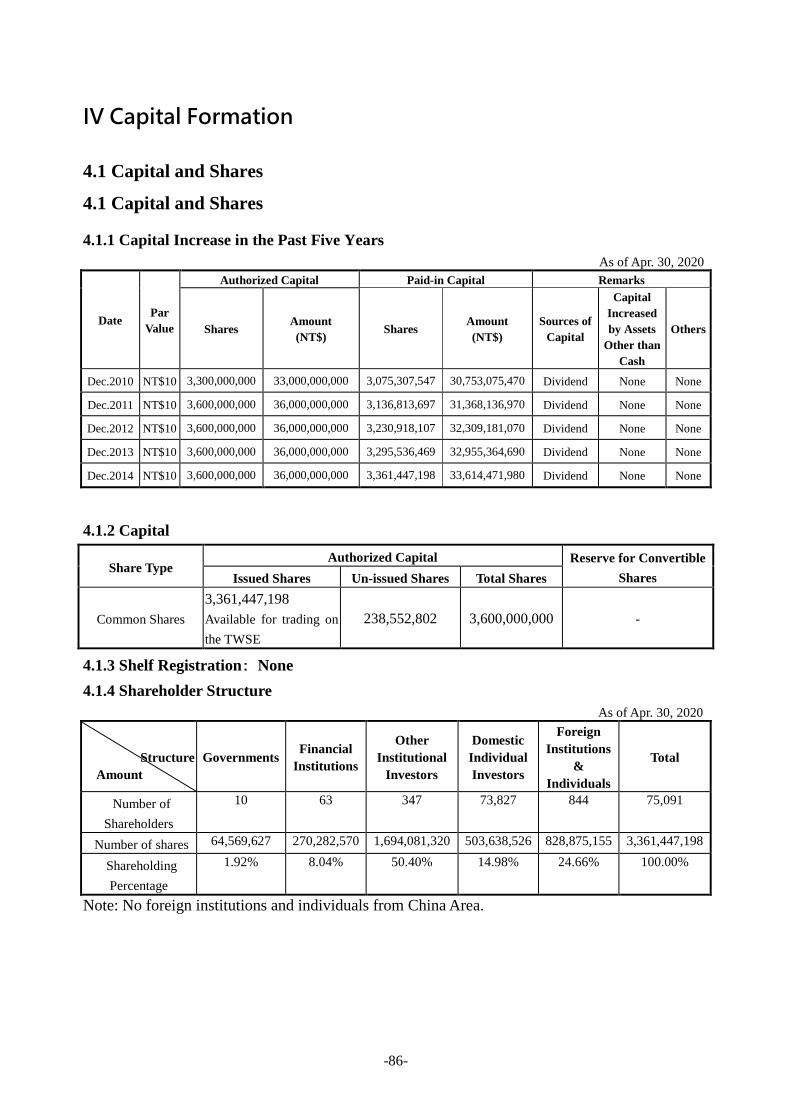
-86-
IV Capital Formation
4.1 Capital and Shares
4.1 Capital and Shares
4.1.1 Capital Increase in the Past Five Years As of Apr. 30, 2020
Date Par
Value
Authorized Capital Paid-in Capital Remarks
Shares Amount (NT$)
Shares Amount (NT$)
Sources of Capital
Capital Increased by Assets
Other than Cash
Others
Dec.2010 NT$10 3,300,000,000 33,000,000,000 3,075,307,547 30,753,075,470 Dividend None None
Dec.2011 NT$10 3,600,000,000 36,000,000,000 3,136,813,697 31,368,136,970 Dividend None None
Dec.2012 NT$10 3,600,000,000 36,000,000,000 3,230,918,107 32,309,181,070 Dividend None None
Dec.2013 NT$10 3,600,000,000 36,000,000,000 3,295,536,469 32,955,364,690 Dividend None None
Dec.2014 NT$10 3,600,000,000 36,000,000,000 3,361,447,198 33,614,471,980 Dividend None None
4.1.2 Capital
Share Type Authorized Capital Reserve for Convertible
Shares Issued Shares Un-issued Shares Total Shares
Common Shares 3,361,447,198 Available for trading on the TWSE
238,552,802 3,600,000,000 -
4.1.3 Shelf Registration: None 4.1.4 Shareholder Structure
As of Apr. 30, 2020
Structure
Amount Governments Financial
Institutions
Other Institutional
Investors
Domestic Individual Investors
Foreign Institutions
& Individuals
Total
Number of Shareholders
10 63 347 73,827 844 75,091
Number of shares 64,569,627 270,282,570 1,694,081,320 503,638,526 828,875,155 3,361,447,198
Shareholding Percentage
1.92% 8.04% 50.40% 14.98% 24.66% 100.00%
Note: No foreign institutions and individuals from China Area.

-87-
4.1.5 Shareholding Distribution Status As of Apr. 30, 2020
Class of Shareholding (Unit: Share)
Number of shareholders Number of shares Holding Percentage
1-999 34,080 8,191,662 0.24% 1,000-5,000 28,161 61,149,165 1.82%
5,001-10,000 5,483 40,671,537 1.21% 10,001-15,000 2,140 26,223,434 0.78% 15,001-20,000 1,148 20,494,587 0.61% 20,001-30,000 1,204 29,856,446 0.89% 30,001-40,000 569 19,846,864 0.59% 40,001-50,000 384 17,535,807 0.52%
50,001-100,000 779 55,430,899 1.65% 100,001-200,000 402 56,142,770 1.67% 200,001-400,000 273 76,817,534 2.29% 400,001-600,000 100 48,739,048 1.45% 600,001-800,000 71 48,804,780 1.45%
800,001-1,000,000 44 39,749,969 1.18% Over 1,000,001 253 2,811,792,696 83.65%
Total 75,091 3,361,447,198 100%
Preferred Share As of Apr. 30, 2020
Class of Shareholding (Unit: Share)
Number of shareholders Number of shares Holding Percentage
NA 0 0 0 4.1.6 List of Major Shareholders
As of Apr. 30, 2020 Shares
Major Shareholder Number of Shares Holding Percentage
Far Eastern New Century Corporation 750,511,324 22.33%
Far Eastern Medical Foundation 181,566,797 5.40%
Labor Pension Fund Committee of Far Eastern New
Century Corporation
51,999,049 1.55%
Yuan Ding Investment Company 51,287,518 1.53%
Yuanta/P-shares Taiwan Dividend Plus ETF 50,780,342 1.51%
Far Eastern Department Stores Co., Ltd. 50,000,492 1.49%
Yuan-Ze University 47,499,567 1.41%
Far Eastern Memorial Foundation 44,115,478 1.31%
Yu Yuan Investment Co., Ltd 43,268,479 1.29%
Yu Chang Investment Company 42,419,430 1.26%
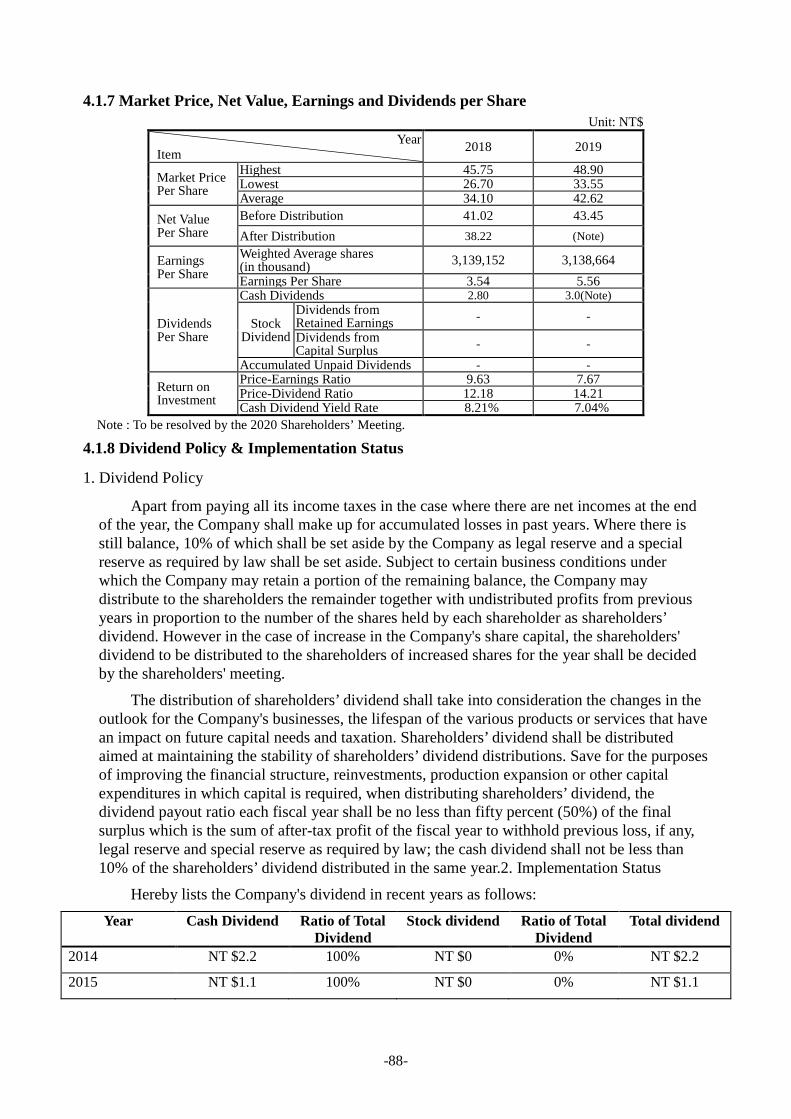
-88-
4.1.7 Market Price, Net Value, Earnings and Dividends per Share Unit: NT$
Year Item 2018 2019
Market Price Per Share
Highest 45.75 48.90 Lowest 26.70 33.55 Average 34.10 42.62
Net Value Per Share
Before Distribution 41.02 43.45 After Distribution 38.22 (Note)
Earnings Per Share
Weighted Average shares (in thousand) 3,139,152 3,138,664 Earnings Per Share 3.54 5.56
Dividends Per Share
Cash Dividends 2.80 3.0(Note)
Stock Dividend
Dividends from Retained Earnings - -
Dividends from Capital Surplus - -
Accumulated Unpaid Dividends - -
Return on Investment
Price-Earnings Ratio 9.63 7.67 Price-Dividend Ratio 12.18 14.21 Cash Dividend Yield Rate 8.21% 7.04%
Note : To be resolved by the 2020 Shareholders’ Meeting.
4.1.8 Dividend Policy & Implementation Status
1. Dividend Policy
Apart from paying all its income taxes in the case where there are net incomes at the end of the year, the Company shall make up for accumulated losses in past years. Where there is still balance, 10% of which shall be set aside by the Company as legal reserve and a special reserve as required by law shall be set aside. Subject to certain business conditions under which the Company may retain a portion of the remaining balance, the Company may distribute to the shareholders the remainder together with undistributed profits from previous years in proportion to the number of the shares held by each shareholder as shareholders’ dividend. However in the case of increase in the Company's share capital, the shareholders' dividend to be distributed to the shareholders of increased shares for the year shall be decided by the shareholders' meeting.
The distribution of shareholders’ dividend shall take into consideration the changes in the outlook for the Company's businesses, the lifespan of the various products or services that have an impact on future capital needs and taxation. Shareholders’ dividend shall be distributed aimed at maintaining the stability of shareholders’ dividend distributions. Save for the purposes of improving the financial structure, reinvestments, production expansion or other capital expenditures in which capital is required, when distributing shareholders’ dividend, the dividend payout ratio each fiscal year shall be no less than fifty percent (50%) of the final surplus which is the sum of after-tax profit of the fiscal year to withhold previous loss, if any, legal reserve and special reserve as required by law; the cash dividend shall not be less than 10% of the shareholders’ dividend distributed in the same year.2. Implementation Status
Hereby lists the Company's dividend in recent years as follows: Year Cash Dividend Ratio of Total
Dividend Stock dividend Ratio of Total
Dividend Total dividend
2014 NT $2.2 100% NT $0 0% NT $2.2
2015 NT $1.1 100% NT $0 0% NT $1.1

-89-
2016 NT $0.9 100% NT $0 0% NT $0.9
2017 NT $1.2 100% NT $0 0% NT $1.2
2018 NT $2.8 100% NT $0 0% NT $2.8
2019 (Proposed) NT $3.0 100% NT $0 0% NT $3.0
The net income after tax for FY2019 as NT$ 17,459,673,128. After the appropriation of Legal Reserve and Special Reserve, NT$ 14,909,359,017 is left. The Broad has proposed a cash dividend of NT$ 3.0 per share, which is summed up to NT$ 10,084,341,594 in total.
4.1.9 Effects on Business Performance and EPS Resulting From Stock Dividend Distribution Unit: NT$
Year Item 2020Estimated)
Paid-In Capital (Beginning of The Year) NT $33,614,471,980 Stock&Cash Dividend Distribution
Cash Dividend Per Share NT$3.0 Stock Dividend From Retained Earnings Per Share 0.00 Share Stock Dividend From Capital Surplus Per Share 0.00 Share
Variance In Business Performance
Operating Income Not Applicable* % Change In Operating Income 〃 Net Income 〃 % Change In Net Income 〃 Earnings Per Share 〃 % Change In EPS 〃 Average Return on Investment (%) (Reciprocal of Average P/E Ratio) 〃
Pro Forma EPS & P/E Ratio
If Retained Earnings Distributed In Cash Dividend
Pro Forma Earnings Per Share 〃 Pro Forma Average Yearly Return on Investment 〃
If Capital Surplus Not Distributed In Stock Dividend
Pro Forma Earnings Per Share 〃 Pro Forma Average Yearly Return on Investment 〃
If Retained Earnings & Capital Surplus Distributed In Cash Dividend Rather Than Stock Dividend
Pro Forma Earnings Per Share 〃
Pro Forma Average Yearly Return on Investment 〃
* As the Company does not disclose its financial forecast information, in compliance with relevant governmental regulations, there is no need to provide this information.
4.1.10 Employees’ Compensation and Directors’ and Supervisors’ Remuneration
1. The percentages or ranges with respect to employees' compensation and directors' remuneration as set forth in the Asia Cement Corporation's Articles of Incorporation: Pursuant to the Articles of Incorporation for distribution 1%~4% as employees' compensation and distribution less than 2.5% as directors' remuneration base on the profit of the current year. However, the company's accumulated losses shall have been covered. The company may, by a

-90-
resolution adopted by a majority vote at a meeting of Board of Directors attended by two-thirds of the total number of directors, determine the actual ratio, amount, form (in the form of shares or in cash) and the number of shares of the profit distributable as employees’ compensation; and a report of such distribution shall be submitted to the shareholders' meeting. The actual ratio and amount of the profit distributable as directors’ remuneration shall also be determined by Board of Directors, and a report of such distribution shall be submitted to the shareholders' meeting.
2. (1)The basis for estimating the amount of employees' compensation and directors' remuneration: Distribution 1%~4% as employees' compensation and less than 2.5% as directors' remuneration shall be based on the profit before income tax of the current year.
(2)The number of shares to be distributed as employees’ compensation: NA (3)The accounting treatment of the discrepancy, if any, between the actual distributed amount
and the estimated figure for the current period: the difference would be regarded as accounting estimation adjustment and recognized as the profit and loss of 2020.
3. Information on resolved by the Board of Directors on March 25, 2020 for distribution of compensation: (1)The amount of any compensation distributed in cash or stocks : Employees’ cash
compensation is NT$ 261,064,444. Directors' cash remuneration is NT$ 230,296,135. (2)If there is any discrepancy between that amount and the estimated are recognized for the
fiscal year shall be disclosed the discrepancy amount, its cause, and the status of treatment: No discrepancy.
(3)The amount of any employees' compensation distributed in stocks, and the amount as a percentage of the sum of profit after income tax base on the separated financial report and total employees’ compensation: NA
4. The actual distribution of employees' compensation and directors' remuneration for the previous fiscal year (with an indication of the number of shares, amount and stock price of the shares distributed), and if there is any discrepancy between the actual distribution and the recognized employees' compensation and directors' remuneration shall be disclosed the discrepancy, its cause, and the status of treatment: The Board of Directors resolved on March 21, 2019 to distribute employees’ compensation NT$ 253,436,520 and directors’ remuneration NT$ 223,657,728. The employees' compensation and directors' remuneration was fully distributed and no discrepancy with 2018 separate financial report。
◎Buyback of Treasury Stock: None.
◎Preferred Stock: None.
◎Employee Stock Option: None.
◎Restricted Stock Awards for employees: None.
◎Merger or acquisition of other company’ share to issue new share: None.
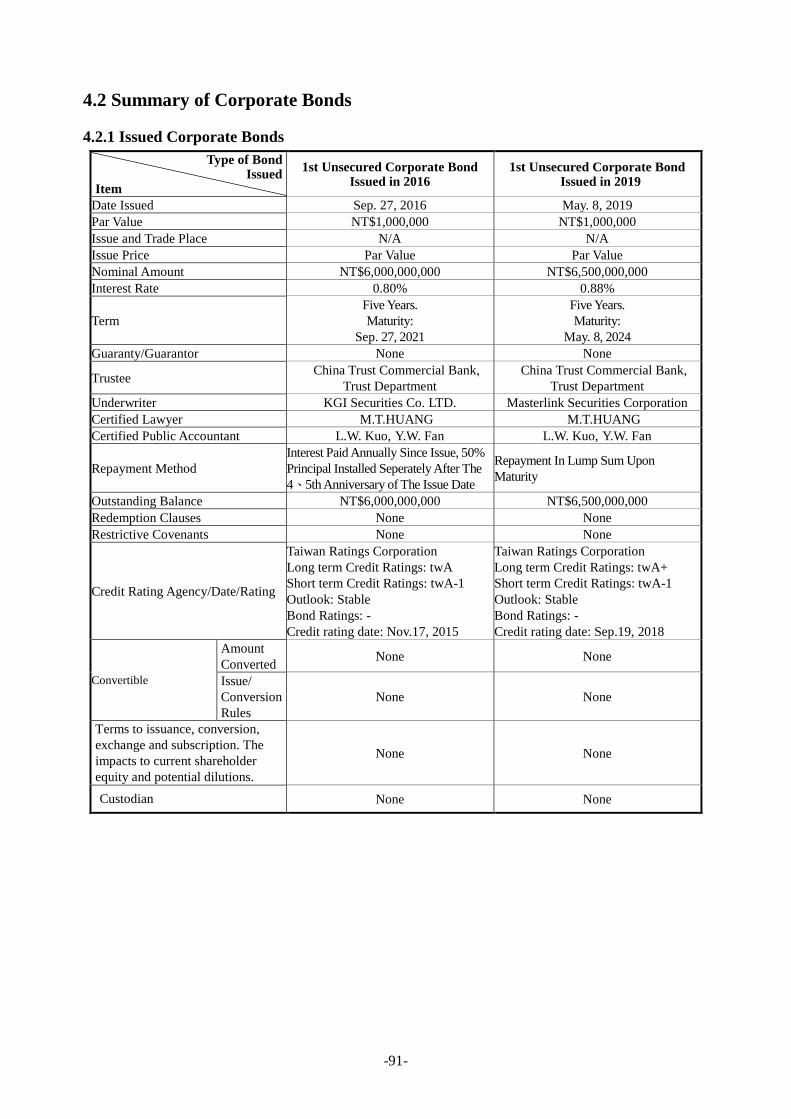
-91-
4.2 Summary of Corporate Bonds
4.2.1 Issued Corporate Bonds Type of Bond
Issued Item
1st Unsecured Corporate Bond Issued in 2016
1st Unsecured Corporate Bond Issued in 2019
Date Issued Sep. 27, 2016 May. 8, 2019 Par Value NT$1,000,000 NT$1,000,000 Issue and Trade Place N/A N/A Issue Price Par Value Par Value Nominal Amount NT$6,000,000,000 NT$6,500,000,000 Interest Rate 0.80% 0.88%
Term Five Years. Maturity:
Sep. 27, 2021
Five Years. Maturity:
May. 8, 2024 Guaranty/Guarantor None None
Trustee China Trust Commercial Bank, Trust Department
China Trust Commercial Bank, Trust Department
Underwriter KGI Securities Co. LTD. Masterlink Securities Corporation Certified Lawyer M.T.HUANG M.T.HUANG Certified Public Accountant L.W. Kuo, Y.W. Fan L.W. Kuo, Y.W. Fan
Repayment Method Interest Paid Annually Since Issue, 50% Principal Installed Seperately After The 4、5th Anniversary of The Issue Date
Repayment In Lump Sum Upon Maturity
Outstanding Balance NT$6,000,000,000 NT$6,500,000,000 Redemption Clauses None None Restrictive Covenants None None
Credit Rating Agency/Date/Rating
Taiwan Ratings Corporation Long term Credit Ratings: twA Short term Credit Ratings: twA-1 Outlook: Stable Bond Ratings: - Credit rating date: Nov.17, 2015
Taiwan Ratings Corporation Long term Credit Ratings: twA+ Short term Credit Ratings: twA-1 Outlook: Stable Bond Ratings: - Credit rating date: Sep.19, 2018
Convertible
Amount Converted None None
Issue/ Conversion Rules
None None
Terms to issuance, conversion, exchange and subscription. The impacts to current shareholder equity and potential dilutions.
None None
Custodian None None

-92-
Type of Bond
Issued Item
2nd Unsecured Corporate Bond Issued in 2019
1st Unsecured Corporate Bond Issued in 2020
Date Issued Aug. 16, 2019 Apr. 20, 2020 Par Value NT$1,000,000 NT$1,000,000 Issue and Trade Place N/A N/A Issue Price Par Value Par Value Nominal Amount NT$3,500,000,000 NT$7,700,000,000 Interest Rate 0.79% 0.66%
Term Five Years. Maturity:
Aug. 16, 2024
Five Years. Maturity:
Apr. 20, 2025 Guaranty/Guarantor None None
Trustee China Trust Commercial Bank, Trust Department
China Trust Commercial Bank, Trust Department
Underwriter Yuanta Securities Co., Ltd. Yuanta Securities Co., Ltd. Certified Lawyer M.T.HUANG M.T.HUANG Certified Public Accountant X.W. Tai, Y.W. Fan X.W. Tai, Y.W. Fan Repayment Method Repayment In Lump Sum Upon Maturity Repayment In Lump Sum Upon Maturity Outstanding Balance NT$3,500,000,000 NT$7,700,000,000 Redemption Clauses None None Restrictive Covenants None None
Credit Rating Agency/Date/Rating
Taiwan Ratings Corporation Long term Credit Ratings: twA+ Short term Credit Ratings: twA-1 Outlook: Stable Bond Ratings: - Credit rating date: Sep.19, 2018
Taiwan Ratings Corporation Long term Credit Ratings: twA+ Short term Credit Ratings: twA-1 Outlook: Stable Bond Ratings: - Credit rating date: Oct.23, 2019
Convertible
Amount Converted None None
Issue/ Conversion Rules
None None
Terms to issuance, conversion, exchange and subscription. The impacts to current shareholder equity and potential dilutions.
None None
Custodian None None
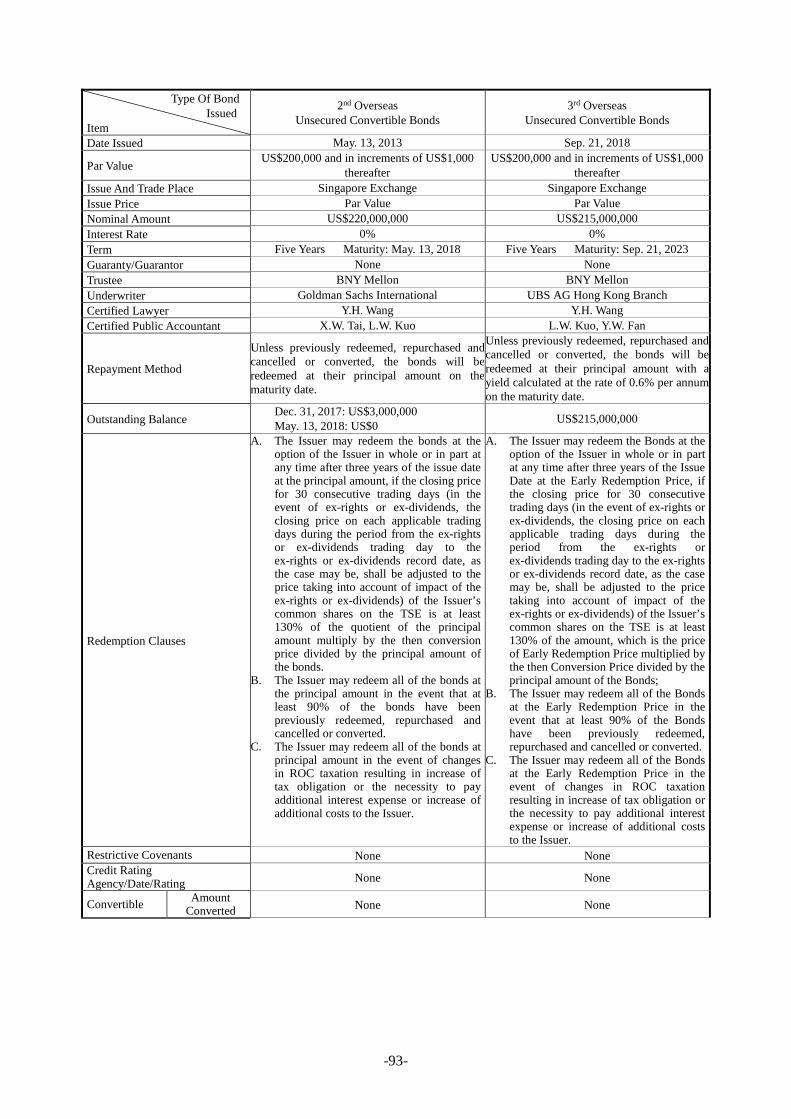
-93-
Type Of Bond Issued
Item
2nd Overseas Unsecured Convertible Bonds
3rd Overseas Unsecured Convertible Bonds
Date Issued May. 13, 2013 Sep. 21, 2018
Par Value US$200,000 and in increments of US$1,000 thereafter
US$200,000 and in increments of US$1,000 thereafter
Issue And Trade Place Singapore Exchange Singapore Exchange Issue Price Par Value Par Value Nominal Amount US$220,000,000 US$215,000,000 Interest Rate 0% 0% Term Five Years Maturity: May. 13, 2018 Five Years Maturity: Sep. 21, 2023 Guaranty/Guarantor None None Trustee BNY Mellon BNY Mellon Underwriter Goldman Sachs International UBS AG Hong Kong Branch Certified Lawyer Y.H. Wang Y.H. Wang Certified Public Accountant X.W. Tai, L.W. Kuo L.W. Kuo, Y.W. Fan
Repayment Method
Unless previously redeemed, repurchased and cancelled or converted, the bonds will be redeemed at their principal amount on the maturity date.
Unless previously redeemed, repurchased and cancelled or converted, the bonds will be redeemed at their principal amount with a yield calculated at the rate of 0.6% per annum on the maturity date.
Outstanding Balance Dec. 31, 2017: US$3,000,000 May. 13, 2018: US$0 US$215,000,000
Redemption Clauses
A. The Issuer may redeem the bonds at the option of the Issuer in whole or in part at any time after three years of the issue date at the principal amount, if the closing price for 30 consecutive trading days (in the event of ex-rights or ex-dividends, the closing price on each applicable trading days during the period from the ex-rights or ex-dividends trading day to the ex-rights or ex-dividends record date, as the case may be, shall be adjusted to the price taking into account of impact of the ex-rights or ex-dividends) of the Issuer’s common shares on the TSE is at least 130% of the quotient of the principal amount multiply by the then conversion price divided by the principal amount of the bonds.
B. The Issuer may redeem all of the bonds at the principal amount in the event that at least 90% of the bonds have been previously redeemed, repurchased and cancelled or converted.
C. The Issuer may redeem all of the bonds at principal amount in the event of changes in ROC taxation resulting in increase of tax obligation or the necessity to pay additional interest expense or increase of additional costs to the Issuer.
A. The Issuer may redeem the Bonds at the option of the Issuer in whole or in part at any time after three years of the Issue Date at the Early Redemption Price, if the closing price for 30 consecutive trading days (in the event of ex-rights or ex-dividends, the closing price on each applicable trading days during the period from the ex-rights or ex-dividends trading day to the ex-rights or ex-dividends record date, as the case may be, shall be adjusted to the price taking into account of impact of the ex-rights or ex-dividends) of the Issuer’s common shares on the TSE is at least 130% of the amount, which is the price of Early Redemption Price multiplied by the then Conversion Price divided by the principal amount of the Bonds;
B. The Issuer may redeem all of the Bonds at the Early Redemption Price in the event that at least 90% of the Bonds have been previously redeemed, repurchased and cancelled or converted.
C. The Issuer may redeem all of the Bonds at the Early Redemption Price in the event of changes in ROC taxation resulting in increase of tax obligation or the necessity to pay additional interest expense or increase of additional costs to the Issuer.
Restrictive Covenants None None Credit Rating Agency/Date/Rating None None
Convertible Amount Converted None None

-94-
Issue/ Conversion
Rules
Except for closed periods as prescribed by ROC laws and regulations or otherwise described in the Indenture, the bondholders shall have the right to require the Issuer to convert the bonds into the converted securities at any time during the period from the 41th day after the issuance of the bonds to the date falling 30th day prior to the maturity date. The aforementioned closed periods shall mean:
A. The Issuer has to close its shareholders' register, which period currently includes 60 days prior to the date of the annual general shareholders' meeting, 30 days prior to a special shareholders' meeting, or any other period prescribed by law.
B. In the event of free distribution of shares, distribution of cash dividends or rights issues, by Issuer, the period from the fifteen trading days prior to the commencement day of the closed period with respect to the record date for determination of shareholders entitled to receive dividends, subscription of new shares or other benefits to the record date for the distribution or allocation of the relevant dividends, rights and benefits, and in the event of capital reduction, the period from the record date for determination of the shareholders participating in such capital reduction to the first trading day immediately prior to the date on which the common shares resume trading after such capital reduction and other closed period as required by ROC laws and regulations or by the TSE.
C. Where any ROC laws and regulations governing closed period as above-mentioned has been changed or amended, the closed period shall be amended to comply with the prevailing laws and regulations.
Except for closed periods as prescribed by ROC laws and regulations or otherwise described in the Indenture, the bondholders shall have the right to require the Issuer to convert the bonds into the converted securities at any time during the period from the next day immediately after the end of a three-month period following the Issue Date to 30th day prior to the Maturity Date. The aforementioned closed periods shall mean:
A. The period during which under the laws of the ROC the Issuer has to close its shareholders' register, which period currently includes 60 days prior to the date of the annual general shareholders' meeting, 30 days prior to a special shareholders' meeting, or any other period prescribed by law.
B. In the event of free distribution of shares, distribution of cash divided or rights issues, the period from the fifteen trading days prior to the commencement day of the closed period with respect to the record date for determination of shareholders entitled to receive dividends, subscription of new shares or other benefits to the record date for the distribution or allocation of the relevant dividends, rights and benefits.
C. In the event of capital reduction, the period from the record date for determination of the shareholders participating in such capital reduction to the first trading day immediately prior to the date on which the Common Shares resume trading after such capital reduction.
D. Other closed period as required by ROC laws and regulations or by the TSE.
E. Where any ROC laws and regulations governing closed period as above-mentioned has been changed or amended, the closed period shall be amended to comply with the prevailing laws and regulations.
Terms to issuance, conversion, exchange and subscription. The impacts to current shareholder equity and potential dilutions.
The 2nd overseas unsecured convertible bonds with a zero coupon rate, the bonds provide a low-cost source of long-term funds and reduce the interest expenses, and therefore have a positive boost on the Issuer's profitability.
The 3rd overseas unsecured convertible bonds with a zero coupon rate, the bonds provide a low-cost source of long-term funds and reduce the interest expenses, and therefore have a positive boost on the Issuer's profitability.
Custodian None None

-95-
4.2.2 Issued Exchangeable Bonds and Convertible Bonds
Type of Bonds Issued 2nd Overseas Unsecured Convertible Bonds
Year Item
Launch Date 2013 2014 2015 2016 Note1 2017
Jan. 1, 2018 to May. 13, 2018
Note3
Market Price of
Convertible
Bonds(US$)
Highest 100 105.71 108.12 104.68 101.10 100.16 99.83
Lowest 100 98.10 101.27 98.08 98.61 98.73 99.28
Average 100 101.52 103.83 100.50 99.70 99.49 99.60
Conversion Price/Share 48 44.7 42 39.28 37.85 36.6 Note2 36.6
Issuing (handling) date and
conversion price in issuing
Issued on May. 13, 2013
NT$48/share
Method of performing
conversion obligations Issuance of new shares
Note1: Pursuant to the Indenture, any holders of the bonds may exercise the holders’ Put Right to require the company to redeem the bonds held by the holders in whole or in part only on 13 May 2016. As of the date of redemption, the total redemption amount is US$217,000,000, and the outstanding balance is US$3,000,000.
Note2: Pursuant to the Indenture, the conversion price of the bonds had been adjusted to NT$36.6/Share since September 6, 2017 as ACC distributed cash dividends and stock dividends.
Note3: After final redemption on May. 13, 2018, there is no outstanding balance.
Type of Bonds Issued 3rd Overseas Unsecured Convertible Bonds
Year Item
Launch Date 2018 2019
From the current year to
March. 31, 2020
Market Price of
Convertible
Bonds(US$)
Highest 100 107.07 126.37 129.09
Lowest 100 99.23 101.38 104.49
Average 100 102.37 111.90 120.15
Conversion Price/Share 42.24 42.24 39.7 Note1 39.7
Issuing (handling) date and
conversion price in issuing
Issued on September. 21, 2018
NT$42.24/share
Method of performing
conversion obligations Issuance of new shares
Note1: Pursuant to the Indenture, the conversion price of the bonds had been adjusted to NT$39.7/Share since July 31, 2019 as ACC distributed cash dividends and stock dividends.
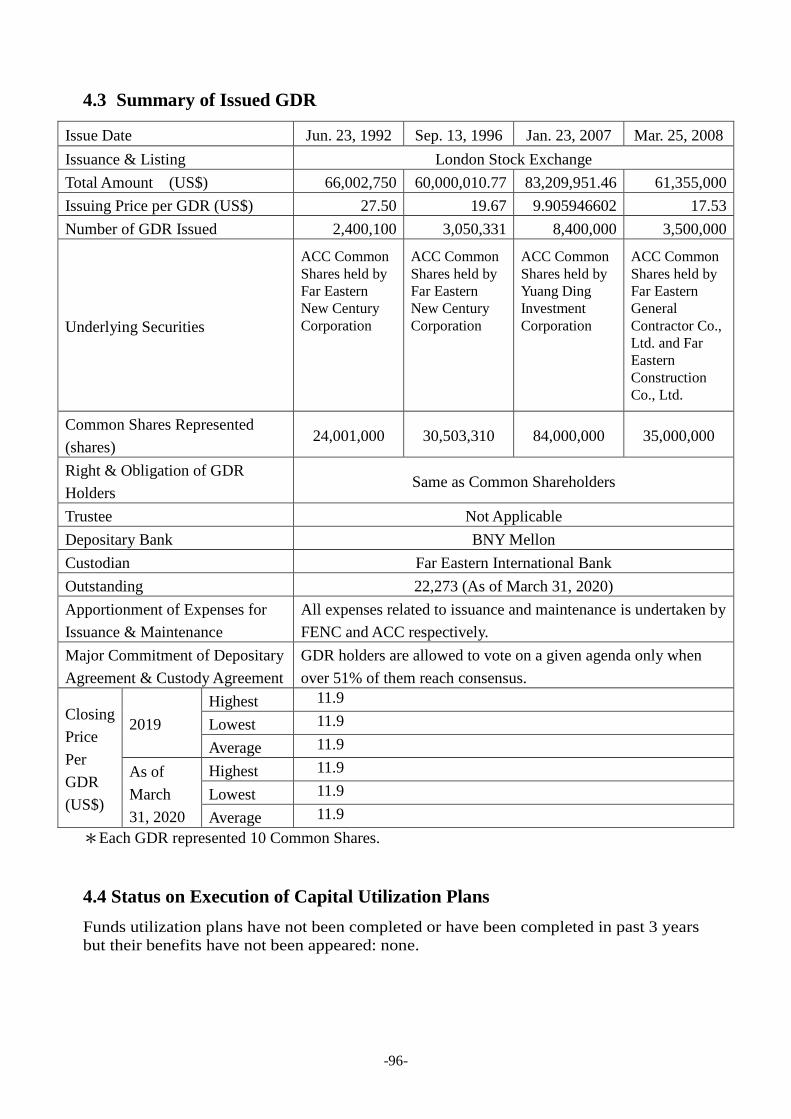
-96-
4.3 Summary of Issued GDR
Issue Date Jun. 23, 1992 Sep. 13, 1996 Jan. 23, 2007 Mar. 25, 2008 Issuance & Listing London Stock Exchange Total Amount (US$) 66,002,750 60,000,010.77 83,209,951.46 61,355,000 Issuing Price per GDR (US$) 27.50 19.67 9.905946602 17.53 Number of GDR Issued 2,400,100 3,050,331 8,400,000 3,500,000
Underlying Securities
ACC Common Shares held by Far Eastern New Century Corporation
ACC Common Shares held by Far Eastern New Century Corporation
ACC Common Shares held by Yuang Ding Investment Corporation
ACC Common Shares held by Far Eastern General Contractor Co., Ltd. and Far Eastern Construction Co., Ltd.
Common Shares Represented (shares)
24,001,000 30,503,310 84,000,000 35,000,000
Right & Obligation of GDR Holders
Same as Common Shareholders
Trustee Not Applicable Depositary Bank BNY Mellon Custodian Far Eastern International Bank Outstanding 22,273 (As of March 31, 2020) Apportionment of Expenses for Issuance & Maintenance
All expenses related to issuance and maintenance is undertaken by FENC and ACC respectively.
Major Commitment of Depositary Agreement & Custody Agreement
GDR holders are allowed to vote on a given agenda only when over 51% of them reach consensus.
Closing Price Per GDR (US$)
2019 Highest 11.9
Lowest 11.9
Average 11.9
As of March 31, 2020
Highest 11.9
Lowest 11.9
Average 11.9 *Each GDR represented 10 Common Shares. 4.4 Status on Execution of Capital Utilization Plans Funds utilization plans have not been completed or have been completed in past 3 years but their benefits have not been appeared: none.

-97-
V Overview of Business Operation
5.1 Business Introduction
5.1.1 Business Scope 1. Scope of Business: Please refer to Section 2.1: “Scope of Business.” 2. Main Business and Percentage: A. Production and sales of Cement and clinker: 96%. B. Granulated blast-furnace slag: 4%. 3. New Product Research & Development: None. 5.1.2 Industry Overview
1. Market situation and future outlook
A. The 2019 total cement production volume in Taiwan was 11,267,211 MT, increased 3% compared to 2018. Among them, the domestic cement sales was 9,054,712 MT, and exported cement was 2,321,014 MT. Compared with those in 2018, domestic sales increased by 5.6%, exports decreased by 2.43%. In 2019, the domestic real estate market showed slight growth. Compared with 2018, the price and trading volume of the real estate market showed a stable trend. The cement consumption increased to 11,350,017 MT, increased by 6.53%. The 2019 per capita average cement consumption is about 482 kg, increased 10.80% from 435 kg in 2018. As a result, the cement market in Taiwan is still showing oversupply.
B. For the year 2020:
(1) Outlook of the domestic market:
With the coronavirus spreading across the world and the international oil price crashing in 2020, the global financial market was jolted. Despite emergency rate cut and QE measures taken by Fed and central banks of many countries, the market panic continued, which resulted in the lowering of the economic growth rate of all the countries. For example, the 2020 growth rate of the United States is expected to decline by 5.38%; the first-quarter growth rate of mainland China in 2020 is estimated to drop by 7.59% and 2.04% for the whole year; the 2020 growth rate of the Euro zone is estimated to be -4.61%. The global economy is showing a recessive trend.
In Taiwan, economic growth performance is facing a severe test. According to the forecast released by the Chung-Hua Institution for Economic Research in April 2020, the GDP growth rate in 2020 will be revised down to 1.03%, which is 1.68% lower than 2.71% in 2019. In order to revitalize the domestic market, the government will accelerate the implementation of various public construction to expand domestic demand, and set a target of 95% expenditure for the public construction budget. In addition, the total budget for 2020 is NT$ 164.6 billion for public construction and design, plus a special budget for forward-looking infrastructure NT$ 100.5 billion, and operating and non-operating special funds for TW$ 201.9 billion, totaling TW$ 467
-98-
billion, increased NT$ 81.8 billion or 21.3% compared with 2019
In terms of real estate, the number of houses transaction in the housing market in 2019 was 300,275, an increase of 8% compared to those in 2018. This is the first time in 5 years to reach 300,000, and to grow for three consecutive years since 2017 years. In 2020, the fundamentals of the housing market have maintained a stable because of housing need. However, it would be affected under the influence and uncertainty of the coronavirus. Meanwhile, driven by the government's accelerated implementation of public projects, the total cement demand is expected to remain the same as last year.
(2) Outlook of the global markets:
For the outlook of 2020, the global market saw a shrinkage due to the COVID-19 pandemic as many countries implemented the lockdown policy, which affected the international cement prices. Fortunately, the Chinese market picked up slowly from April with a bullish demand for the second half of the year. This will trigger the rise of cement clinker prices. In the international market, exports from Eastern Asian and Southeastern Asian countries was affected as they stopped operation of the kilns and reduced production as they were hit hard by the coronavirus pandemic. The production is expected to come back to normal after the third quarter and Japan will largely increase it exports as the Olympic Games are postponed to a year later. The rebound of the U.S. and European markets will be dependent on the control of the pandemic. The western U.S. and Hawaiian markets to which Asia Cement supplies have been impacted only temporarily thanks to the economic policies maintained by the local governments. Asia Cement will shift part of its export from the declined Southeastern Asian market to western U.S. to maintain its export contribution. In addition, Asia Cement will continue to cooperate with the government’s export policy for the cement industry by keeping the export volume under the upper limit prescribed by the policy and supplying to few long-term markets. To maintain its business profits, Asia Cement will actively purchase cement, clinker, plaster and silicon sands from other countries and supply them to the Southeastern Asian market. For the year 2020, Asia Cement will continue with its export strategy to maintain the export volume from Taiwan and expand the raw material business.
Overall, the domestic market will rise slightly, while foreign markets have growth potential
C. In addition to root in Taiwan for on-going cement business operation, the Company will keep enhancing its competitiveness by largely expansion in China both in production and sales.
2. The relationships among the value chain of cement industry
The upstream, midstream and downstream sectors of cement industry, namely ready-mixed concrete, precast, and construction industry, are co-existed and blooming together. Nowadays, vertical integration is the trend in cement industry. As a result, the Company’s operation strategy is to establish the downstream subsidiaries-Ya Tung Ready-mixed Concrete Corp. and Yali Precast & Prestressed Concrete Industries Corp., and to invest Far Eastern Construction Company and Far Eastern General Contractor Company to grasp the business

-99-
opportunities.
3. Product development and company competitiveness Although the cement products include Portland Cement Type I, Type II, and Special Cement, the major market demand is Portland Cement Type I. However, the overseas market has stronger demand for Special Cement in recent years. The ability to produce quality products and the shipping & loading efficiency has become the key competitive factors.
5.1.3 Technology and Research Development As of April 30, 2020
Unit: NT$1,000
Item Amount
Industrial 4.0 project - Intelligent shipment - Analysis and forecasting to kiln refractory - Intelligent quality control
5,000
Industrial 4.0 Project Phase 2: - Cloud War Room - Product Line Machine Predictive Maintenance - Intelligent Mining
4,000
Big Data Analysis - Predictive Analysis Project 1,000
Analysis Method for Cement Hydration Heat 100
Hualien Plant No. 2 and No. 3 rotary kiln alternative fuel using system project 82,650
No.1 cement mill rolling machine hydraulic system update 2,900
No.3 cement mill rolling machine hydraulic system update 3,100
No.3 cement mill PLC system update 9,500
Secondary Crushing Equipment PLC system update 4,200
Geological and Detailed Investigation (Scale 1/1200) in Xinchengshan Quarry 3,450
Quarry blasting vibration monitoring work 530
Total 119,430 5.1.4 Short-term Business Plan ◎ To strengthen the existing domestic and international channels of cement sales. ◎ To reduce costs and to maintain fully sell out the estimated production volume and sound
profitability. ◎ To fulfill the vertical integration policy and to expand into downstream market channels. ◎ To keep good relationship with customers and foresee market trend.

-100-
5.1.5 Long-term Business Plan ◎ Maintain solid position in Taiwan - improve producing efficiency. ◎ Increase the investment in China (Please refer to the “I Report to Shareholders” at page 1 and
the “8.2 Basic Information of Affiliates” at section 8.2 of this annual report. ◎ Extend the global market - Find new markets, new opportunities to expand overseas
operations. 5.2 General Information of Market & Production
5.2.1. Markets Analysis 1. Major Sale Markets
A. Cement and Clinker: “Skyscraper” is the Company’s brand-name for marketing all kinds of our products. Our domestic market includes Taiwan, Penghu, Kinmen and Matsu, and our overseas market includes United States, Philippine, Malaysia, Hawaii, Guam, Singapore, etc.
B. Ready-Mixed Concrete: To provide better customer service, our subsidiary, Ya Tung Ready-Mixed Concrete Corp., has set up many plants around Taiwan, and furthermore established strategic alliance with local firms.
2. Market Share In 2019, the Company domestic sales was 2,564,176 MT, i.e. 28.32% of the sales amount of all domestic cement producers, which was equal to 22.59% of total cement consumption in Taiwan.
3. Market supply forecast, growth opportunity, and business competitiveness: A. According to the prediction of the Chung-Hua Institution for Economic Research, due to the
impact of the coronavirus epidemic in 2020, Taiwan’s GDP growth rate would be 1.03%, a significant decrease of 1.68% compared with last year. Taiwan Institute of Economic Research investigated that the domestic real estate developers estimated that the epidemic will affect the public’s willingness to buy houses. As a result, the progress of new developing case would be delayed, which may cause the future transaction volume to be less than expected. Some real estate investors are pessimistic about the future. However, in order to expand domestic demand, the government will accelerate the progress of public works. Overall, the demand for private construction projects is expected to decrease in 2020, but the amount of public works will increase, and the domestic demand for the whole year is expected to be the same to 2019. In addition, energy, raw materials, labor costs, sea freight prices and the quantity of imported cement are other important factors that affect sales.
B. For the export sales, the Company is expected to export 1.1~1.1 million MT of cement and clinker in 2020, which is equivalent to 2019. The Company has long term major customers in Philippine, Malaysia, Hawaii, etc. and shall continue to maintain an excellent business relationship with them in the years to come. The Company has also expanded its trading business for cement.
C. In the view of the vast and steady growth market in China, Asia Cement Corporation actively expands production base as well as storage and transportation facilities. In addition,
-101-
with the markets both in Taiwan and China, it constitutes an effective competitive niche and profitability for the Company.
4. Positive factors for the industry development A. In response to the impact of Covid19, Taiwan Government are promoting industrial
innovation, forward-looking infrastructure construction, improving the quality of public construction, and regional balanced development.
B. The budget (including special budget) for 2020 Public Works Projects increase 21.3% to NT $467 billion. Taiwan’s cement industry believes that the implementations of several infrastructure projects will drive private investment.
C. In 2019, the floor area of the application for the building license increased by 9% compared with 2018, indicating that the private investment continued to expand. Moreover, the number and amount of overseas Taiwanese businesses to return to invest in Taiwan continued to increase. Taiwan government also accelerated house reconstruction, urban renewal, and implemented the public construction. All these help to increase domestic construction investment. However, affected by the Covid19 epidemic, the future uncertainty is high.
D. The Ministry of Finance announced in February 2017 to continue to levy cement and clinker from China at the original approved tax rate of 91.58% anti-dumping duties for five years. This will help stability of the domestic industry.
5. Negative factors and the solutions A. Industry relocation, environmental awareness, and emission limits of carbon dioxide will
increase the difficulties in both public constructions and private housing sectors, and cause the construction industry more conservative. This will constrain the growth of cement demand.
B. The Ministry of Economic Affairs has set limitations on trade volume of domestic cement industry according the Foreign Trade Law. The limitations will gradually lower the export-production ratio from 50% in 2011 to 25% in 2020. The over-supply condition will be worse.
C. Mining Industry Law is currently in the occasion of amending, the industry will face more stringent operating requirements and limitations.
D. Limestone tax is raised from NT$ 10 to NT$ 70 per metric ton. As well as the recent rise in coal prices will bring to the cement industry to more difficult condition.
E. Solutions: Improve the efficiency of current production, transportation and marketing activities and strengthen the downstream distribution channels in both domestic and overseas market. Continue selecting good target markets, establish production and distribution channels, expand customers in emerging countries, and realize reasonable profitability.
5.2.2 Application of Major Cement Products 1. Portland Cement Type I:
It is known as ordinary cement, used for all structural projects which are not particularly exposed to sulphuric acid or underground water. Most of the current market supply is in this category.
-102-
2. Portland Cement Type II: With lower hydration heat than Portland Cement Type I as well as low alkalis and moderate resistance to sulfate, Portland Cement Type II is for large-scale structures. It is resistant against cracking and erosion by sea water, salt, and alkali. The general purposes are as follows: A. Underground foundation engineering: Tower Building Basement, underpass, sewers, tunnels
and massive underground rapid transit systems. B. Large-scale concrete works: Bridges, dams, water retention facilities, valve based structure. C. Construction subject to erosion by sea water and sea wind: dock, breakwaters, caisson, breeding
plants, harbors, and others. D. Project that requires resistance to sulfate: Sewage treatment plants and chemical engineering.
3. Special Purpose Cement: Produced to meet customers’ special needs. 4. Production process:
All types of cement are produced in accordance to a fixed proportion of mixtures, in the following steps: A. Limestone and clay are mixed and ground into raw meal. B. Raw meal is poured into the rotary kiln and burned in high temperature to produce clinker. C. Clinker is mixed with gypsum and ground into cement. D. Cement is sold in bulk or packages.
5.2.3 Supply Condition of Main Raw Materials
The major raw materials used by the Company consist of limestone, clay, gypsum, pyrite, iron slag, and raw coal for fuel. Except a little limestone, most limestone is produced and used by the Company. Clay is purchased from domestic suppliers through long-term contracts. Gypsum and pyrite are supplied by qualified domestic and foreign firms. Fuel coal is supplied by Australian providers via long or short term contracts.

- 103 - -103-
5.2.4 Major Suppliers Information for the Last Two Years Unit: NT$1,000
2018 2019 Item Company Name Amount % Relation with Issuer Company Name Amount % Relation with Issuer
1 BB Co., Australia 1,579,103 46.29 Raw material supplier BB Co., Australia 853,694 32.23 Raw material supplier 2 Chung Ling Co. 468,335 13.73 Raw material supplier Chung Ling Co. 498,363 18.82 Raw material supplier 3 AA Co., Australia 229,872 6.74 Raw material supplier Young Year
(Gypsum) 77,521 2.93 Raw material supplier 4 KENWAY 74,989 2.20 Equipment supplier Anhe Engineering 76,337 2.88 Equipment supplier Others 1,058,698 31.04 Others 1,142,578 43.14
Net Total Supplies 3,410,997 100.00 Net Total Supplies 2,648,493 100.00
Note: Variations are because of market mechanisms. 5.2.5 Major Clients Information for the Last Two Years
Unit: NT$1,000 2018 2019 Item Company Name Amount % Relation with Issuer Company Name Amount % Relation with Issuer
1 Ya Tung Ready-Mixed Concrete Co. 1,582,083 18.95 Subsidiary Ya Tung Ready-Mixed
Concrete Co. 1,805,262 20.99 Subsidiary
Others 6,766,506 81.05 Others 6,794,161 79.01 Net Sales 8,348,589 100.00 Net Sales 8,599,423 100.00
Note: Variations are because of market mechanisms.

-104-
5.2.6 Output of Main Products 2018-2019
1. ACC (Taiwan) Unit: NT $1,000, Cement and Clinker 1,000 MT
Year Output
Product
2018 2019
Capacity Production Volume
Production Value Capacity Production
Volume Production
Value
Cement & Clinker
5,597 3,555 7,256,280 5,597 3,630 7,348,535
2. ACC (China) Unit: NT $1,000, Cement and Clinker 1,000 MT
Year Output
Product
2018 2019
Capacity Production Volume
Production Value Capacity Production
Volume Production
Value
Cement & Clinker
35,500 30,528 27,702,318 35,500 30,501 27,536,086
5.2.7 Sales of Main Products 2018-2019
1. ACC (Taiwan) Unit: NT $1,000, Cement and Clinker 1,000 MT
Year
Sales Product
2018 2019 Domestic Sales Export Sales Domestic Sales Export Sales
Volume Value Volume Value Volume Value Volume Value
Cement & Clinker*
2,584 5,754,142 928 1,481,856 2,608 5,792,210 1,039 1,835,779
* Cement & Clinker produced by the Company. 2. ACC (China)
Unit: NT $1,000, Cement and Clinker 1,000 MT Year
Sales Product
2018 2019 Domestic Sales Export Sales Domestic Sales Export Sales
Volume Value Volume Value Volume Value Volume Value
Cement & Clinker* 30,676 46,803,136 219 242,168 30,781 49,729,598 57 64,312
* Cement & Clinker produced by the Company.
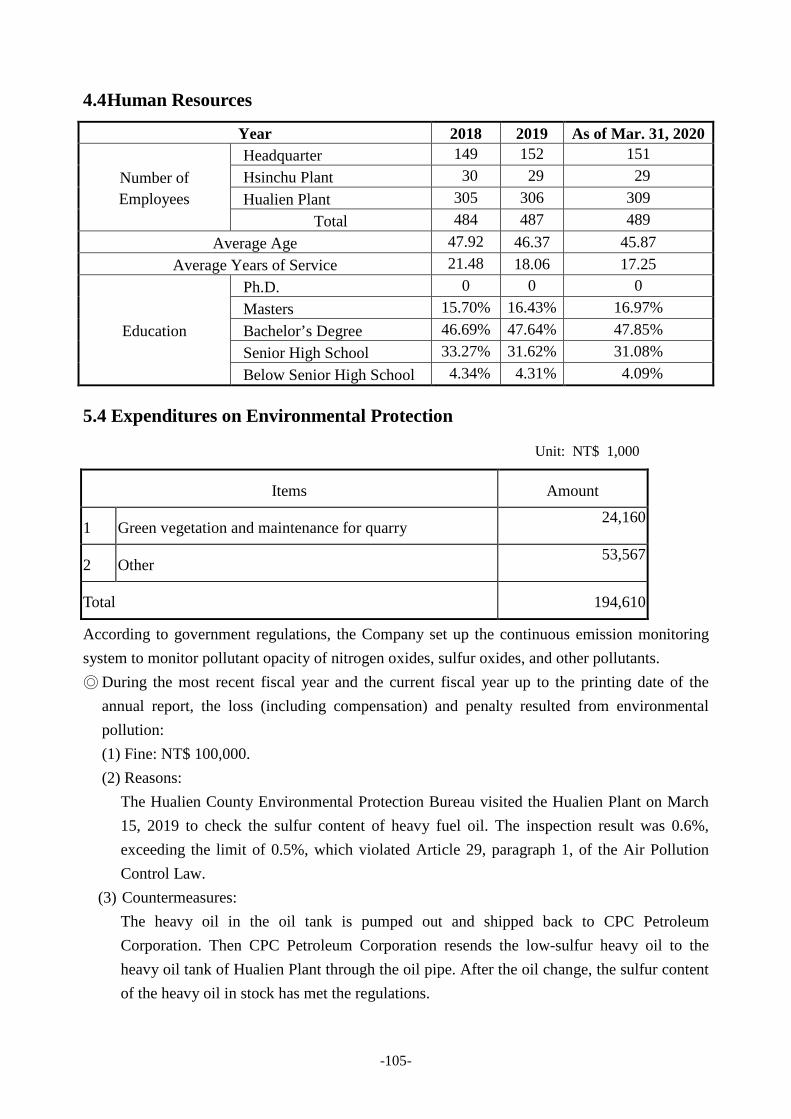
-105-
4.4 Human Resources
Year 2018 2019 As of Mar. 31, 2020
Number of Employees
Headquarter 149 152 151 Hsinchu Plant 30 29 29 Hualien Plant 305 306 309
Total 484 487 489 Average Age 47.92 46.37 45.87
Average Years of Service 21.48 18.06 17.25
Education
Ph.D. 0 0 0 Masters 15.70% 16.43% 16.97% Bachelor’s Degree 46.69% 47.64% 47.85% Senior High School 33.27% 31.62% 31.08% Below Senior High School 4.34% 4.31% 4.09%
5.4 Expenditures on Environmental Protection
Unit: NT$ 1,000
Items Amount
1 Green vegetation and maintenance for quarry 24,160
2 Other 53,567
Total 194,610
According to government regulations, the Company set up the continuous emission monitoring system to monitor pollutant opacity of nitrogen oxides, sulfur oxides, and other pollutants. ◎ During the most recent fiscal year and the current fiscal year up to the printing date of the
annual report, the loss (including compensation) and penalty resulted from environmental pollution: (1) Fine: NT$ 100,000. (2) Reasons:
The Hualien County Environmental Protection Bureau visited the Hualien Plant on March 15, 2019 to check the sulfur content of heavy fuel oil. The inspection result was 0.6%, exceeding the limit of 0.5%, which violated Article 29, paragraph 1, of the Air Pollution Control Law.
(3) Countermeasures: The heavy oil in the oil tank is pumped out and shipped back to CPC Petroleum Corporation. Then CPC Petroleum Corporation resends the low-sulfur heavy oil to the heavy oil tank of Hualien Plant through the oil pipe. After the oil change, the sulfur content of the heavy oil in stock has met the regulations.
-106-
◎ The restriction of RoHS (to restrict the use of hazardous chemicals) is not applicable to the Company.
5.4.1 ISO-14001 Environmental Management Systems (EMS) 1. ISO-14001 EMS has become the trend in many advanced countries. 2. In August 1996, the Hualien plant of the Company passed certification by the Bureau of
Commodity Inspection and Quarantine of the Ministry of Economic Affairs (MOEA), and in November of the same year, Hualien plant became one of the first organizations in Taiwan to receive ISO-14001 certification. In July 2000, Taiwan’s first Environmental Report was completed by Hualien plant according to Sustainability Reporting Guidelines of Global Reporting Initiative (GRI).
3. The affiliated Jiangxi Yadong Cement Co., Sichuan Yadong Cement Co., Hubei Yadong Cement Co., Huanggang Yadong Cement Co., and Wuhan Yaxin Cement Co., have awarded ISO-14001 certification.
5.4.2 Air Pollution Prevention 1. One of the main environmental concerns relating to cement production is air pollution caused
by the dust generated from production processes. Therefore, the work of dust disposal is an important duty, not only to prevent air pollution, but also to reduce the loss of raw materials and finished products. Consequently, ACC has always emphasized on the efficiency of dust collection equipment.
For increasing dust preventive facilities, Hsinchenshan Mine of the Hualien plant had built 440-meters-long fully-closed belt conveyor in 2015, which could completely prevent dust shed or spread, moreover, the Hualien plant has set up dustproof net outside of the belt conveyor and continued to build 180-meters-long fully-closed belt conveyor in 2016.
2. At present, ACC's Hsinchu plant has 2 electrostatic precipitators and 35 bag filters, with a total investment cost of NT $174 million. The Hualien plant has 9 electrostatic precipitators and 80 bag filters, with a total investment cost more than NT $950 million.
3. The good maintenance of above equipment ensures dust collection efficiency which is within the legal limit. Consequently, the quality of air around the plants is higher than national standard. As a result, the Environmental Protection Administration (EPA) especially recognized the two plants as environmental protection demonstration plants.
4. In particular, the amount of dust including chimney emissions measured by environmental protection agencies at the Hualien plant was less than 25 milligrams/m3, which was far better than national standard. The plant was awarded by the Chinese National Federation of Industries for its excellent performance of preventing industrial pollution. In addition, the Hualien plant was listed by the EPA as one of the top 10 factories in pollution prevention and has received the Enterprise Environmental Protection Award for three years in a row.
5. In 2019, the environment expenditure of the Hualien plant, such as purchasing and maintenance of precipitators, training courses, greening and beautification was NT$ 53,567,000.
-107-
5.4.3 Greening and Beautification for Quarry Restoration 1. Both Hsinchu and Hualien plants have implemented measures for soil conservation and taken
actions to green the environment by planting trees and other vegetation. For many years, the Hualien plant promotes the cultivation of the native species of trees for greening the quarry and the plant.
2. As of 2019, the green restoring area is 65.1 acres which is 76.5% of the quarry, while exploiting operation area is 22.0 acres. Recently, the quarry of the Hualien plant is visible from nearby high way and railroad. In order to integrate the quarry into the surrounding environment, the Hualien Plant introduced a new forestation method for quarry restoration. Within merely two year, trees could grow up to 4 meters high. The green restoring area will increase 2 acres every year.
In 2019, the Hualien plant devoted NT$ 241,606,000 to the greening and beautification of the quarry.
3. Due to Hualien Plant’s dedication of environmental protection and engaging in community activities, the Taroko National Park cooperates with the Company to preserve native species of trees for greening and beatification of the National Park and environment guidance.
4. In 2007, the Hualien Plant was awarded for the excellent performance in the project of “promoting green communities” by the Environmental Protection Administration.
5. In 2018, the Hualian plant’s Quarry's Green Sustainable Action Plan was awarded the “Asia Responsible Enterprise Awards” by the Enterprise Asia.
In 2019, the Hualian plant’s "Deeply Rooting the Seeds of Sustainable Hope – Asia Cement environment education Project" was awarded the “Asia Responsible Enterprise Awards” by the Enterprise Asia.
5.4.4 Major Environmental Protection Work in the Future 1. Reinforcing and ensuring the normal operation of environmental facilities. 2. Practicing in industry waste reduction; avoiding pollution. 3. Improving the greening rate in factory and quarry areas. 4. Utilizing wastes as resources to take social responsibilities. 5. Endlessly enhancing the environmental measures and techniques; expecting to reach the goal
of “zero pollution”. 5.4.5 Fulfill Social Responsibilities 1. The Company volunteered to take care of greenbelts and pavements alone the Dun-Hua South
Road and An-He Road over a long period of time to fulfill its social responsibilities and strengthen relations with neighborhood.
2. Since 2001 on, Hualien plant has annually participated in local festivals such as lily blossom in Buluowan held by the Taroko National Park and donated potted flowers and plants for all visitors.
3. For our neighbors’ traffic safety, the Hualien plant has regularly sponsored Xincheng Branch of the Hualien County Police Office to renew police stands and street lamps.

-108-
4. The Company will also sponsor local activities and facilities of the villages and towns nearby the Hsinchu and Hualien plant.
5. Employees are encouraged to serve as hospital volunteers. 6. Based on ACC corporate philosophy of “feeding back to society whatever takes from society,”
the Company sponsors Far Eastern Medical Foundation, Far Eastern Y.Z. Hsu Science and Technology Memorial Foundation, and Far Eastern Memory Foundation and participates in all kinds of public service activities.
5.5 Labor Relations
The Company complies with every regulation of labor relationship. Due to the excellent labor relations, there were no damages or penalties causing from labor disputes.
1. According to law, The Company has Industrial Welfare Committee to allot welfare fund for staffs and conduct many welfare-related activities. In factory, we have basketball courts, tennis courts, badminton courts, table tennis courts, and swimming pools, etc., as staff's recreational facilities. Health examination, group insurance, subsidies for employee’s education, trips, and clubs are also included in welfare plans.
2. Employee Relations
The Company provides Employee Assistance Program (EAP) service from Hsinchu Lifeline Association, EAP Center, which offers professional counsel to all issues employees may meet, such as career development, family issues, and interpersonal relationship. We will also conduct a new personnel care questionnaire to understand the workplace adaptability of new employees and provide necessary assistance based on their feedback. In addition, various types of psychological education and care and propaganda will be posted on the company's electronic bulletin board to promote employees' mental health knowledge.
3. Each year, the Human Resources Department conducts curriculums based on the functional needs of different departments and levels, combines the company's development strategies, and provides opportunities for supervisors and employees to fully study and train. It not only achieves the goal of training, but also links with the development of employees' careers. The training courses include: new personnel training, core competency training, professional/functional training, leadership training, and so on. In 2019, the special training project “Innovative learning ability” was completed.
At the same time, the various departments of the company can also recommend their colleagues to participate in vocational training courses introduced by related companies, government agencies and social organizations, to improve their professional functions, and to link with social pulsations.
In 2019, the high-potential leadership training program was continuously implemented, covering all middle and high-level supervisors of all subsidiaries of the Asia Cement, with a
-109-
total of 12 hours of training courses. Since 2014, after intensive 225-hour course training, 30 high-level conference internships, and 30 seminars, more than half of the training talents have been promoted. The program also has a training mechanism to enable these potential successors to continue learning to make sure under the increasingly severe environmental challenges of the company, more backbone talents can lead the organization to continue to develop.
Furthermore, Human Resource Department holds reading club, inviting a professional lecturer monthly to guide reading and facilitate discussion, encouraging employees to absorb new concepts and sharing knowledge.
In 2019, totally 680 training courses were held for ACC employees, roughly 8031 participants; the relevant expenditures amounted to NT$ 2.45 million.
4. The “Employment Rules of Asia Cement Corporation” articulates regulations in connection with appointment, service, assessment, and rewards as well as punishments, promotion, retirement, and compensation, etc. In order to guarantee the rights relating to retirement and compensation, in accordance with the law the Company sets up Supervisory Committee of the Labor Retirement Fund, allocates work’s retirement reserve fund into the special account managed by assigned institutions, regularly convenes the supervisory committee, and audits the allocation and practice of work’s retirement reserve fund. In addition, in compliance with Labor Pension Act, the Company monthly set aside pension fund for the employees who choose to be subject to the pension mechanism.
5. The Company’s management philosophy “Sincerity, Diligence, Thrift, Prudence and innovation” has been firmly in every employee’s heart. “Sincerity” implies honest and enthusiasm. “Diligence” indicates dedication. “Thrift” signifies frugality and modesty. “Prudence” represents deliberation and accuracy. In short, one important corporate culture of ACC is that every job should be done thoroughly, precisely, and perfectly.
In “Employment Rules of Asia Cement Corporation” mentioned above, the chapter 4 ‘Service’, and chapter 7 ‘Assessment, Reward, Punishment, and Promotion’ clearly illustrate the principles of conduct. In terms of management, besides emphasizing staff self-discipline, the Company also asks every department managers to take responsibilities of educating, advising, and leading their subordinates, which enables employees to fully understand the behavior and ethics criteria.
For better compliance with corporation governance, the Company has also enacted “Codes of Ethical Conduct” and “Principles for Ethical Management”.
6. Policies of labor safety and health
A. Management in Labor Safety and Health
The Company’s policy of labor safety and health is based on the following vision-“protecting labor safety, improving occupational environment, and building up friendly workplace.” Also, we comply with Labor Safety and Health Act, carry out
-110-
systematical management in occupational health and safety, and implement identification of the hazardous factors, risk evaluation and control in workplace. Besides setting up safety standards and developing safety management system, the safety-related training courses, such as prevention of hidden dangers, emergency response planning, and safety self-management are regularly and irregularly held, to ensure that all employees can obey safety related rules and operate safety equipment and protective outfits well.
In February 2009, the Hualien plant has passed TOSHMS (Taiwan Occupational Safety and Health Management System). The "CNS15506: 2011 Taiwan Occupational Safety and Health Management System" and "OHSAS18001: 2007 Occupational Safety and Health Management System" currently implemented by Hualien Plant were evaluated and approved by the Foundation for Research and Development of Metal Industry Research and Development Center on June 28, 2016. Its effective period is to June 27, 2019. It passed certification on June 28, 2019 and changed to "ISO45001:2018" and "CNS15506:2011". It is expected to be changed to "CNS45001:2018 Z2158" again in June 2020. The Headquarters and Hsinchu Plant also follows the model of Hualien plant for establishing a faultless occupational safety and health management System.
A major occupational disaster occurred in the Company's Hualien Manufacturing Plant in 2017. It was caused by the failure of laborers to comply with SOP operations and non-compliance with hazard warnings. Under conditions without approval and without protective gear, the laborers rushed into the material cabinet and suffocated and died as buried in fallen gypsum material. The Company held a review meeting on July 19, 2017 for effectively improving the management of occupational safety and health, and proposed a strategy for improving the related management and safety to effectively reduce the agglomeration of materials and the frequency of clearing operations. Also, the risk assessment will be re-adopted. The Company will amend the SOP, implement training, and introduce new types of equipment to increase the labor safety.
Due to the major occupational disaster, the Company was designated as the Enhance Enforcement Program (EEP) target by the Occupational Safety and Health Department of the Ministry of Labor to strengthen inspections. The Company will strengthen risk assessment, divide the responsible areas to implement active inspections and autonomous management proposals, and reduce irregularities in workplaces to ensure work safety and health. In March 7, 2019, the Occupational Safety and Health Department of the Ministry of Labor agreed to remove the Company from the special list of Enhance Enforcement Program (EEP) target. The company has learned lessons and will continue to improve to build a corporate safety culture toward zero disasters target.
B. Workplace environment and labor safety protection
To assure employee safety and health, protect the assets of the Company, and make comfortable and safe workplace, based on safety-related rules, we have the following active measures:
a. Following procurement to assure the intrinsic safety of raw materials and equipment:
-111-
Conforming to the safety and health standard is the essential consideration of purchasing raw materials and equipment to assure the intrinsic safety of manufacture procedure, products, and equipment.
b. General safety management, training courses, and related auditing:
We monthly hold safety and health committee and safety-related courses for employees and contractors to make sure that everyone working with ACC fully understands the possible hazardous factors and prevention measures in workplace, and obeys safety-related standards to preclude the occurrence of any disaster. Also, by means of “the walking around management” and frequently patrols, we investigate flaws and also improve them to assure the effective operation in safety management.
c. Workplace environmental monitoring system and usage of protective outfits:
All plants regularly monitor noise, high temperature, and radiation around workplace, so the unusual condition can be immediately detected and eliminated. Also, all employees can be protected from possible dangers by protective outfits designed for different hidden hazardous factors in workplace.
d. Health Care Management for Employees:
All plants set up medical offices with nursing staff and contracted doctors, and prepare emergency medicine, equipment, and supplies. According to related rules, all employees regularly accept health assessment and carry out health care management.
e. Emergency Drills and Exercises
All plants shall regularly exercise emergency response drills by following their emergency response plan. All employees shall be familiar with relevant details, which ensures the losses could be minimized in case of emergency.
7. ACC has enjoyed harmonious relations between management and employees for years. Employees devoted their time and hard work to the Company. In recent years, the Company's continuous excellent performance of sales and production is a proof of employees' effort. The Company's work and employment regulations are based on the Labor Law and in some cases even exceed the minimum requirements of the law. Besides reasonable payment, ACC gives seasonal bonuses to encourage clinker production, attendance award, and cost and resource-saving measures, as well as year-end bonuses based on the Company's annual performance.
The Company was awarded “2013 Excellence Recognition for its collective agreement with employees” by the Ministry of Labor.
8. In the most recent year and up to the date of publication of the annual report, losses suffered due to labor disputes: The Hualien Plant was fined NT$20,000 for overtime pay. Counter measures: handled in accordance with labor standards regulations
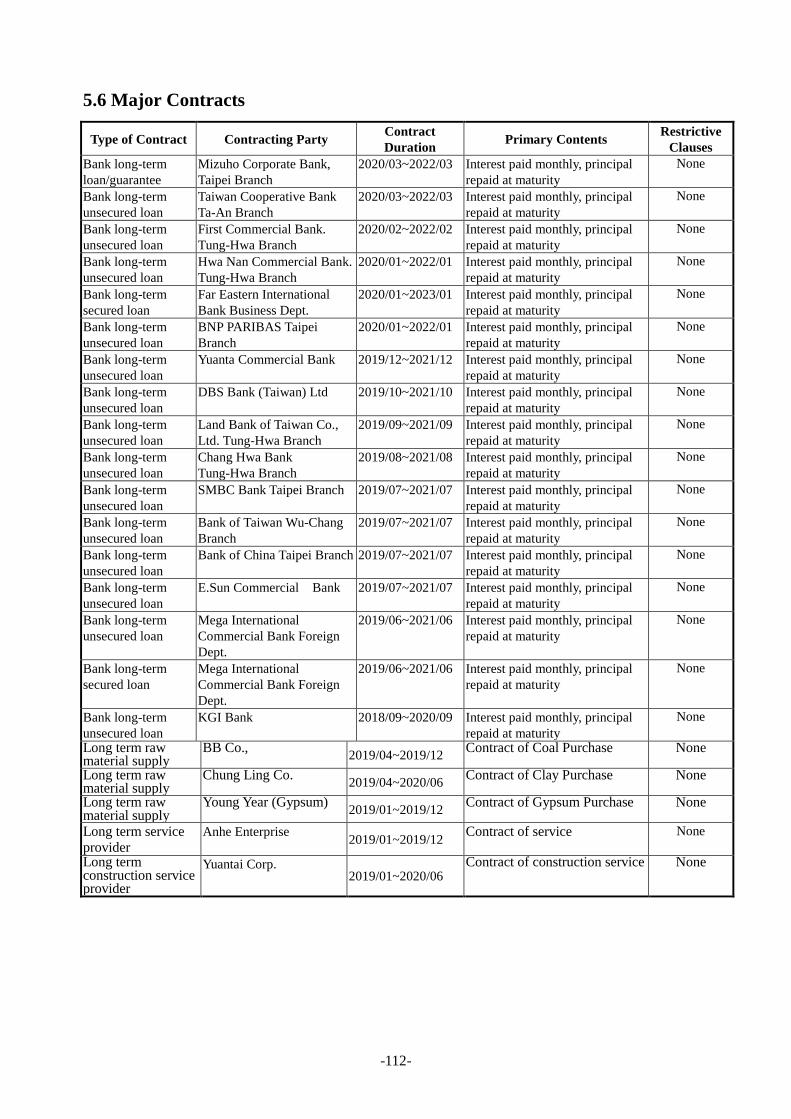
-112-
5.6 Major Contracts
Type of Contract Contracting Party Contract Duration Primary Contents Restrictive
Clauses Bank long-term loan/guarantee
Mizuho Corporate Bank, Taipei Branch
2020/03~2022/03 Interest paid monthly, principal repaid at maturity
None
Bank long-term unsecured loan
Taiwan Cooperative Bank Ta-An Branch
2020/03~2022/03 Interest paid monthly, principal repaid at maturity
None
Bank long-term unsecured loan
First Commercial Bank. Tung-Hwa Branch
2020/02~2022/02 Interest paid monthly, principal repaid at maturity
None
Bank long-term unsecured loan
Hwa Nan Commercial Bank. Tung-Hwa Branch
2020/01~2022/01 Interest paid monthly, principal repaid at maturity
None
Bank long-term secured loan
Far Eastern International Bank Business Dept.
2020/01~2023/01 Interest paid monthly, principal repaid at maturity
None
Bank long-term unsecured loan
BNP PARIBAS Taipei Branch
2020/01~2022/01 Interest paid monthly, principal repaid at maturity
None
Bank long-term unsecured loan
Yuanta Commercial Bank 2019/12~2021/12 Interest paid monthly, principal repaid at maturity
None
Bank long-term unsecured loan
DBS Bank (Taiwan) Ltd 2019/10~2021/10 Interest paid monthly, principal repaid at maturity
None
Bank long-term unsecured loan
Land Bank of Taiwan Co., Ltd. Tung-Hwa Branch
2019/09~2021/09 Interest paid monthly, principal repaid at maturity
None
Bank long-term unsecured loan
Chang Hwa Bank Tung-Hwa Branch
2019/08~2021/08 Interest paid monthly, principal repaid at maturity
None
Bank long-term unsecured loan
SMBC Bank Taipei Branch 2019/07~2021/07 Interest paid monthly, principal repaid at maturity
None
Bank long-term unsecured loan
Bank of Taiwan Wu-Chang Branch
2019/07~2021/07 Interest paid monthly, principal repaid at maturity
None
Bank long-term unsecured loan
Bank of China Taipei Branch 2019/07~2021/07 Interest paid monthly, principal repaid at maturity
None
Bank long-term unsecured loan
E.Sun Commercial Bank 2019/07~2021/07 Interest paid monthly, principal repaid at maturity
None
Bank long-term unsecured loan
Mega International Commercial Bank Foreign Dept.
2019/06~2021/06 Interest paid monthly, principal repaid at maturity
None
Bank long-term secured loan
Mega International Commercial Bank Foreign Dept.
2019/06~2021/06 Interest paid monthly, principal repaid at maturity
None
Bank long-term unsecured loan
KGI Bank 2018/09~2020/09 Interest paid monthly, principal repaid at maturity
None
Long term raw material supply
BB Co., 2019/04~2019/12 Contract of Coal Purchase None
Long term raw material supply
Chung Ling Co. 2019/04~2020/06 Contract of Clay Purchase None
Long term raw material supply
Young Year (Gypsum) 2019/01~2019/12 Contract of Gypsum Purchase None
Long term service provider
Anhe Enterprise 2019/01~2019/12 Contract of service None
Long term construction service provider
Yuantai Corp. 2019/01~2020/06
Contract of construction service None

113
VI Financial Information
6.1Financial Reports & Audit Results in Recent five Years
6.1.1 Consolidated Balance Sheets
UNIT: NT$1,000
Year Item
Five-Year Financial Summary
2015 2016 2017 2018 2019
Current Assets 52,844,285 42,148,568 50,262,702 80,358,506 89,242,066
Property, Plant and Equipment 67,264,573 58,832,486 53,738,838 52,549,341 50,681,281
Intangible Assets 5,304,367 4,866,642 4,552,561 3,694,783 7,000,317
Other Assets 144,663,984 132,623,089 138,510,247 142,585,368 150,354,848
Total Assets 270,077,209 238,470,785 247,064,348 279,187,998 297,278,512
Current Liabilities
Before Apportioned 65,223,927 40,857,530 53,948,167 62,804,294 74,335,619
After Apportioned 68,921,519 43,882,832 57,981,903 72,216,346 -
Non-current Liabilities 49,999,090 56,950,034 47,319,817 57,335,358 53,493,855
Total Liabilities
Before Apportioned 115,223,017 97,807,564 101,267,984 120,139,652 127,829,474
After Apportioned 118,920,609 100,832,866 105,301,720 129,551,704 - Equity Attributable To Owners Of The Corporation 135,898,873 122,663,077 127,435,565 137,892,226 146,067,358
Share Capital 33,614,472 33,614,472 33,614,472 33,614,472 33,614,472
Capital Surplus 1,155,643 1,167,881 1,168,692 1,362,554 1,456,054
Retained Earnings
Before Apportioned 91,552,336 91,599,413 94,196,274 99,918,986 108,564,355
After Apportioned 87,854,744 88,574,111 90,162,538 90,506,934 -
Other Equity 9,576,422 (3,718,689) (1,543,873) 2,996,214 2,432,477
Non-Controlling Interests 18,955,319 18,000,144 18,360,799 21,156,120 23,381,680
Total Equity
Before Apportioned 154,854,192 140,663,221 145,796,364 159,048,346 169,449,038
After Apportioned 151,156,600 137,637,919 141,762,628 149,636,294 -

114
6.1.2 Consolidated Statements Of Comprehensive Income UNIT: NT$1,000
Year
Item
Five-Year Financial Summary
2015 2016 2017 2018 2019
Operating Revenue 66,287,480 60,946,190 64,899,248 82,741,004 89,347,637
Realized Gross Profit 7,058,747 8,588,274 10,170,478 21,171,461 25,586,317
Profit From Operations 4,039,945 6,233,048 7,436,716 18,153,110 22,063,176 Non-operating Income And Expenses
2,774,213 243,541 1,062,443 2,217,008 6,330,006
Income Before Income Tax 6,814,158 6,476,589 8,499,159 20,370,118 28,393,182
Net Profit For The Period 4,934,483 4,683,297 6,665,541 14,889,197 22,243,953 Other Comprehensive Income , Net
(3,860,529) (14,688,396) 2,119,539 1,436,173 (617,304) Total Comprehensive Income For The Period
1,073,954 (10,005,099) 8,785,080 16,325,370 21,626,649 Net Profit Attributable To Owner Of The Company 4,860,241 3,945,769 5,469,007 11,117,094 17,459,673 Net Profit Attributable To Non-Controlling Interests 74,242 737,528 1,196,534 3,772,103 4,784,280 Total Comprehensive Income Attributable To Owner Of The Company
1,343,662 (9,550,011) 7,895,746 12,811,353 17,652,536
Total Comprehensive Income Attributable To Non-Controlling Interests
(269,708) (455,088) 889,334 3,514,017 3,974,113
Earnings Per Share 1.55 1.26 1.74 3.54 5.56
Earnings Per Share (Note1) 1.55 1.26 1.74 3.54 5.56 Note: Based on weighted average outstanding shares in 2019 after subtracting the shares of the Corporation held by
the associates treated as treasury stock.
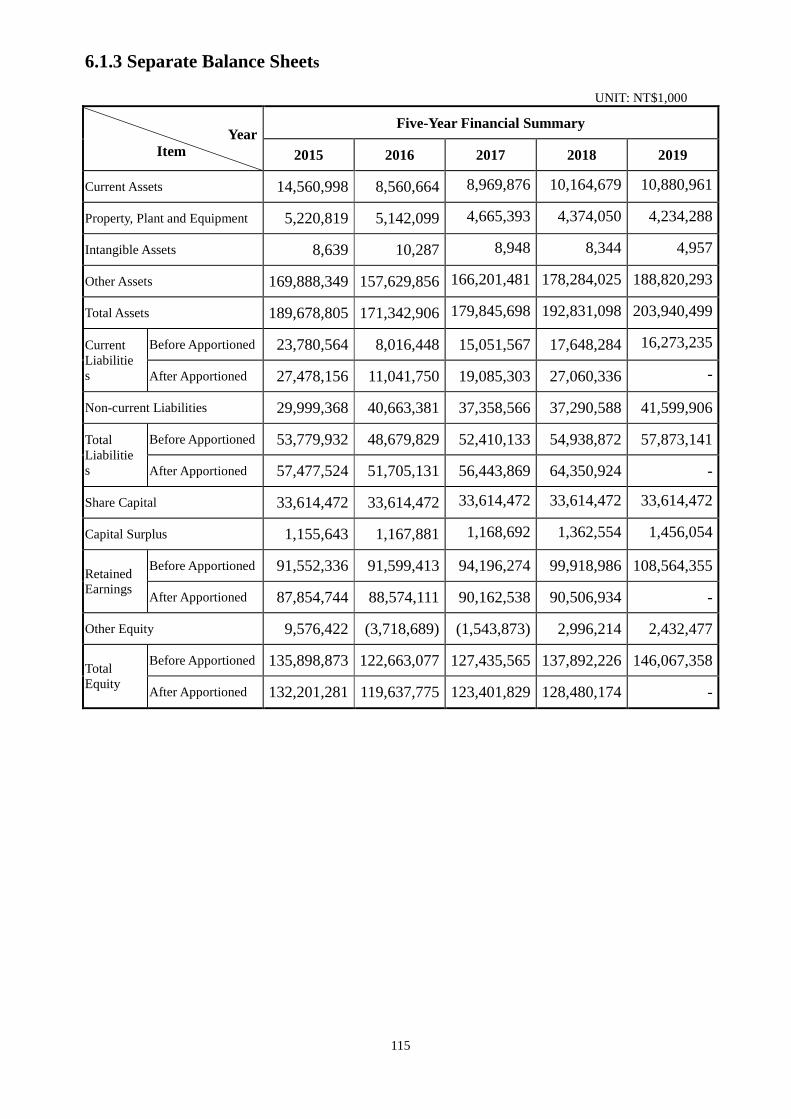
115
6.1.3 Separate Balance Sheets
UNIT: NT$1,000 Year Item
Five-Year Financial Summary
2015 2016 2017 2018 2019
Current Assets 14,560,998 8,560,664 8,969,876 10,164,679 10,880,961
Property, Plant and Equipment 5,220,819 5,142,099 4,665,393 4,374,050 4,234,288
Intangible Assets 8,639 10,287 8,948 8,344 4,957
Other Assets 169,888,349 157,629,856 166,201,481 178,284,025 188,820,293
Total Assets 189,678,805 171,342,906 179,845,698 192,831,098 203,940,499
Current Liabilities
Before Apportioned 23,780,564 8,016,448 15,051,567 17,648,284 16,273,235
After Apportioned 27,478,156 11,041,750 19,085,303 27,060,336 -
Non-current Liabilities 29,999,368 40,663,381 37,358,566 37,290,588 41,599,906
Total Liabilities
Before Apportioned 53,779,932 48,679,829 52,410,133 54,938,872 57,873,141
After Apportioned 57,477,524 51,705,131 56,443,869 64,350,924 -
Share Capital 33,614,472 33,614,472 33,614,472 33,614,472 33,614,472
Capital Surplus 1,155,643 1,167,881 1,168,692 1,362,554 1,456,054
Retained Earnings
Before Apportioned 91,552,336 91,599,413 94,196,274 99,918,986 108,564,355
After Apportioned 87,854,744 88,574,111 90,162,538 90,506,934 -
Other Equity 9,576,422 (3,718,689) (1,543,873) 2,996,214 2,432,477
Total Equity
Before Apportioned 135,898,873 122,663,077 127,435,565 137,892,226 146,067,358
After Apportioned 132,201,281 119,637,775 123,401,829 128,480,174 -
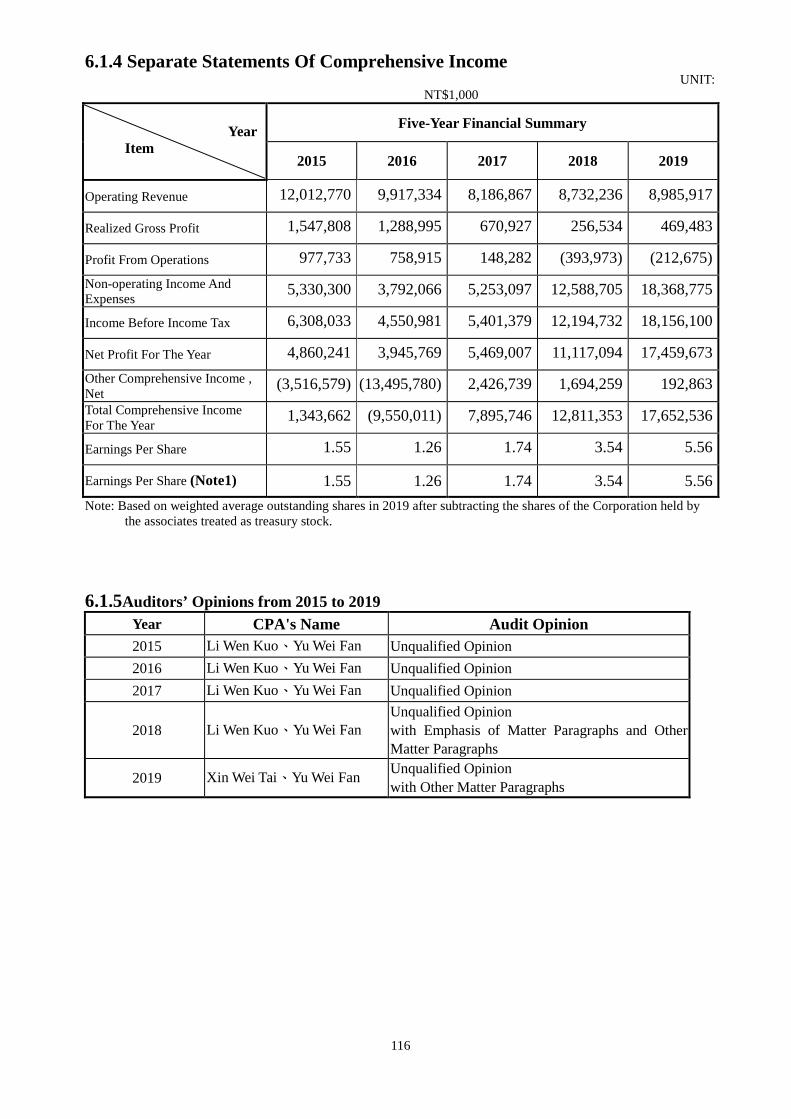
116
6.1.4 Separate Statements Of Comprehensive Income UNIT:
NT$1,000 Year Item
Five-Year Financial Summary
2015 2016 2017 2018 2019
Operating Revenue 12,012,770 9,917,334 8,186,867 8,732,236 8,985,917
Realized Gross Profit 1,547,808 1,288,995 670,927 256,534 469,483
Profit From Operations 977,733 758,915 148,282 (393,973) (212,675) Non-operating Income And Expenses
5,330,300 3,792,066 5,253,097 12,588,705 18,368,775
Income Before Income Tax 6,308,033 4,550,981 5,401,379 12,194,732 18,156,100
Net Profit For The Year 4,860,241 3,945,769 5,469,007 11,117,094 17,459,673 Other Comprehensive Income , Net
(3,516,579) (13,495,780) 2,426,739 1,694,259 192,863 Total Comprehensive Income For The Year
1,343,662 (9,550,011) 7,895,746 12,811,353 17,652,536
Earnings Per Share 1.55 1.26 1.74 3.54 5.56
Earnings Per Share (Note1) 1.55 1.26 1.74 3.54 5.56 Note: Based on weighted average outstanding shares in 2019 after subtracting the shares of the Corporation held by
the associates treated as treasury stock. 6.1.5Auditors’ Opinions from 2015 to 2019
Year CPA's Name Audit Opinion 2015 Li Wen Kuo、Yu Wei Fan Unqualified Opinion 2016 Li Wen Kuo、Yu Wei Fan Unqualified Opinion 2017 Li Wen Kuo、Yu Wei Fan Unqualified Opinion
2018 Li Wen Kuo、Yu Wei Fan Unqualified Opinion with Emphasis of Matter Paragraphs and Other Matter Paragraphs
2019 Xin Wei Tai、Yu Wei Fan Unqualified Opinion with Other Matter Paragraphs

117
6.2 Financial Analysis 6.2.1 Consolidated Financial Statements
Year
Item Financial Analysis (2015~2019)
2015 2016 2017 2018 2019
Capital Structure Analysis
Debts Ratio (%) 42.66 41.01 40.99 43.03 43.00 Long-term Fund to Property, Plant and Equipment (%) 304.55 335.89 359.36 411.77 439.89
Liquidity Analysis
Current Ratio (%) 81.02 103.16 93.17 127.95 120.05
Quick Ratio (%) 69.80 86.22 80.98 112.34 109.57
Times Interest Earned (Times) 5.14 4.95 5.80 13.17 16.60
Operating Performance
Analysis
Average Collection Turnover (Times) 3.55 3.85 3.96 3.99 3.95
Days Sales Outstanding 103 95 92 91 92
Average Inventory Turnover (Times) 7.08 7.35 8.11 7.52 7.25
Average Payment Turnover (Times) 6.42 6.64 7.30 7.73 5.85
Average Inventory Turnover Days 52 50 45 49 50 Property, Plant and Equipment Turnover (Times) 0.96 0.97 1.15 1.56 1.73
Total Assets Turnover (Times) 0.24 0.24 0.27 0.31 0.31
Profitability Analysis
Return on Total Assets (%) 2.28 2.38 3.35 6.17 8.22
Return on Shareholders’ Equity (%) 3.12 3.17 4.65 9.77 13.54 Pre-tax Income to Paid-in Capital Ratio (%) 20.27 19.27 25.28 60.60 84.47
Net Margin (%) 7.44 7.68 10.27 17.99 24.90 Basic Earnings Per Share (NT$) (Based on outstanding shares in 2019) 1.55 1.26 1.74 3.54 5.56
Cash Flow
Cash Flow Ratio (%) 20.95 31.37 15.09 14.75 50.14
Cash Flow Adequacy Ratio (%) 112.25 126.91 133.25 127.58 180.16
Cash Reinvestment Ratio (%) 2.97 4.43 2.49 2.24 11.73
Leverage Operating Leverage 2.42 1.87 1.70 1.27 1.28
Financial Leverage 1.69 1.36 1.31 1.10 1.09
Analysis of deviation of 2019 vs. 2018 over 20%: The decrease in Average Payment Turnover was mainly due to the increase of accounts payable and accrued expenses at year-end of 2019. The increase in Times Interest Earned, Return on Total Assets, Return on Shareholders’ Equity, Pre-tax Income to Paid-in Capital Ratio, Net Margin and Basic Earnings Per Share were mainly due to the increase of net income in 2019. The increase in Cash Flow Ratio, Cash Flow Adequacy Ratio and Cash Reinvestment Ratio were mainly due to an increase in cash provided by operating activities in 2019.
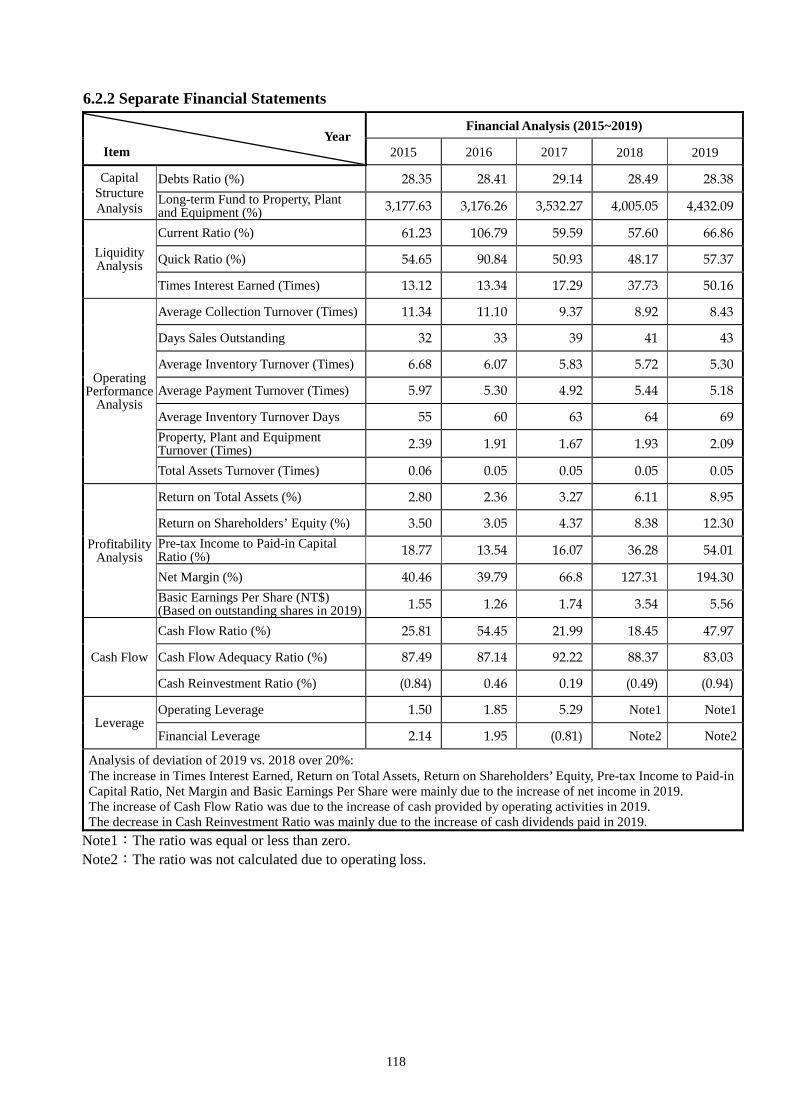
118
6.2.2 Separate Financial Statements
Year Item
Financial Analysis (2015~2019)
2015 2016 2017 2018 2019
Capital Structure Analysis
Debts Ratio (%) 28.35 28.41 29.14 28.49 28.38 Long-term Fund to Property, Plant and Equipment (%) 3,177.63 3,176.26 3,532.27 4,005.05 4,432.09
Liquidity Analysis
Current Ratio (%) 61.23 106.79 59.59 57.60 66.86
Quick Ratio (%) 54.65 90.84 50.93 48.17 57.37
Times Interest Earned (Times) 13.12 13.34 17.29 37.73 50.16
Operating Performance
Analysis
Average Collection Turnover (Times) 11.34 11.10 9.37 8.92 8.43
Days Sales Outstanding 32 33 39 41 43
Average Inventory Turnover (Times) 6.68 6.07 5.83 5.72 5.30
Average Payment Turnover (Times) 5.97 5.30 4.92 5.44 5.18
Average Inventory Turnover Days 55 60 63 64 69 Property, Plant and Equipment Turnover (Times) 2.39 1.91 1.67 1.93 2.09
Total Assets Turnover (Times) 0.06 0.05 0.05 0.05 0.05
Profitability Analysis
Return on Total Assets (%) 2.80 2.36 3.27 6.11 8.95
Return on Shareholders’ Equity (%) 3.50 3.05 4.37 8.38 12.30 Pre-tax Income to Paid-in Capital Ratio (%) 18.77 13.54 16.07 36.28 54.01
Net Margin (%) 40.46 39.79 66.8 127.31 194.30 Basic Earnings Per Share (NT$) (Based on outstanding shares in 2019) 1.55 1.26 1.74 3.54 5.56
Cash Flow
Cash Flow Ratio (%) 25.81 54.45 21.99 18.45 47.97
Cash Flow Adequacy Ratio (%) 87.49 87.14 92.22 88.37 83.03
Cash Reinvestment Ratio (%) (0.84) 0.46 0.19 (0.49) (0.94)
Leverage Operating Leverage 1.50 1.85 5.29 Note1 Note1
Financial Leverage 2.14 1.95 (0.81) Note2 Note2
Analysis of deviation of 2019 vs. 2018 over 20%: The increase in Times Interest Earned, Return on Total Assets, Return on Shareholders’ Equity, Pre-tax Income to Paid-in Capital Ratio, Net Margin and Basic Earnings Per Share were mainly due to the increase of net income in 2019. The increase of Cash Flow Ratio was due to the increase of cash provided by operating activities in 2019. The decrease in Cash Reinvestment Ratio was mainly due to the increase of cash dividends paid in 2019.
Note1:The ratio was equal or less than zero. Note2:The ratio was not calculated due to operating loss.
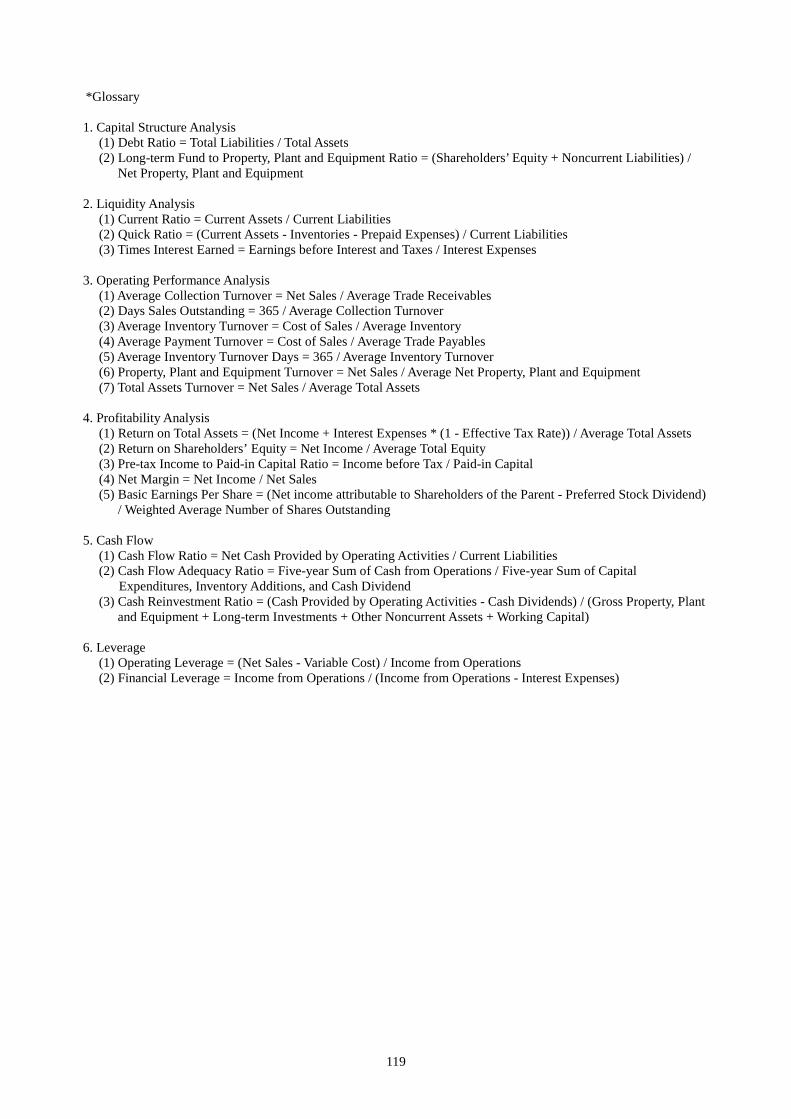
119
*Glossary 1. Capital Structure Analysis
(1) Debt Ratio = Total Liabilities / Total Assets (2) Long-term Fund to Property, Plant and Equipment Ratio = (Shareholders’ Equity + Noncurrent Liabilities) /
Net Property, Plant and Equipment 2. Liquidity Analysis
(1) Current Ratio = Current Assets / Current Liabilities (2) Quick Ratio = (Current Assets - Inventories - Prepaid Expenses) / Current Liabilities (3) Times Interest Earned = Earnings before Interest and Taxes / Interest Expenses
3. Operating Performance Analysis
(1) Average Collection Turnover = Net Sales / Average Trade Receivables (2) Days Sales Outstanding = 365 / Average Collection Turnover (3) Average Inventory Turnover = Cost of Sales / Average Inventory (4) Average Payment Turnover = Cost of Sales / Average Trade Payables (5) Average Inventory Turnover Days = 365 / Average Inventory Turnover (6) Property, Plant and Equipment Turnover = Net Sales / Average Net Property, Plant and Equipment (7) Total Assets Turnover = Net Sales / Average Total Assets
4. Profitability Analysis
(1) Return on Total Assets = (Net Income + Interest Expenses * (1 - Effective Tax Rate)) / Average Total Assets (2) Return on Shareholders’ Equity = Net Income / Average Total Equity (3) Pre-tax Income to Paid-in Capital Ratio = Income before Tax / Paid-in Capital (4) Net Margin = Net Income / Net Sales (5) Basic Earnings Per Share = (Net income attributable to Shareholders of the Parent - Preferred Stock Dividend)
/ Weighted Average Number of Shares Outstanding
5. Cash Flow (1) Cash Flow Ratio = Net Cash Provided by Operating Activities / Current Liabilities (2) Cash Flow Adequacy Ratio = Five-year Sum of Cash from Operations / Five-year Sum of Capital
Expenditures, Inventory Additions, and Cash Dividend (3) Cash Reinvestment Ratio = (Cash Provided by Operating Activities - Cash Dividends) / (Gross Property, Plant
and Equipment + Long-term Investments + Other Noncurrent Assets + Working Capital) 6. Leverage
(1) Operating Leverage = (Net Sales - Variable Cost) / Income from Operations (2) Financial Leverage = Income from Operations / (Income from Operations - Interest Expenses)

120
6.3 Audit Committee’s Review Report on the 2019 Financial Statements
To: The 2020 Regular Shareholders’ Meeting
The Board of Directors has prepared the Company’s 2019 Business Report, the Proposal for
Profit Distribution, and the Financial Statements certified by CPA Mr. Xin Wei Tai and Mr. Yu
Wei Fan of the Deloitte & Touche. The Business Report, Financial Statements, and the Proposal
for Profit Distribution have been reviewed and determined to be correct and accurate by the Audit
Committee members of Asia Cement Corporation. According to Article 14-4 of the Securities and
Exchange Act and Article 219 of the Company Act, we hereby submit this report.
Chairman of the Audit Committee: Ta-Chou Huang
May 11, 2020
121
6.4 Financial Statements and Independent Auditors’ Report
Please refer to Attachment for the Notes to Financial Statements.
INDEPENDENT AUDITORS’ REPORT The Board of Directors and Shareholders Asia Cement Corporation Opinion We have audited the accompanying consolidated financial statements of Asia Cement Corporation and its subsidiaries (collectively referred to as the “Group”), which comprise the consolidated balance sheets as of December 31, 2019 and 2018, and the consolidated statements of comprehensive income, changes in equity and cash flows for the years then ended, and the notes to the consolidated financial statements, including a summary of significant accounting policies (collectively referred to as the “consolidated financial statements”). In our opinion, based on our audits and the reports of other auditors (refer to Other Matter section), the accompanying consolidated financial statements present fairly, in all material respects, the consolidated financial position of the Group as of December 31, 2019 and 2018, and its consolidated financial performance and its consolidated cash flows for the years then ended in accordance with the Regulations Governing the Preparation of Financial Reports by Securities Issuers, and International Financial Reporting Standards (IFRS), International Accounting Standards (IAS), IFRIC Interpretations (IFRIC), and SIC Interpretations (SIC) endorsed and issued into effect by the Financial Supervisory Commission of the Republic of China. Basis for Opinion We conducted our audits in accordance with the Regulations Governing Auditing and Attestation of Financial Statements by Certified Public Accountants and auditing standards generally accepted in the Republic of China. Our responsibilities under those standards are further described in the Auditors’ Responsibilities for the Audit of the Consolidated Financial Statements section of our report. We are independent of the Group in accordance with The Norm of Professional Ethics for Certified Public Accountant of the Republic of China, and we have fulfilled our other ethical responsibilities in accordance with these requirements. We believe that the audit evidence we have obtained is sufficient and appropriate to provide a basis for our opinion. Key Audit Matters Key audit matters are those matters that, in our professional judgment, were of most significance in our audit of the consolidated financial statements for the year ended December 31, 2019. These matters were addressed in the context of our audit of the consolidated financial statements as a whole, and in forming our opinion thereon, and we do not provide a separate opinion on these matters.
122
The key audit matters identified in the Group’s consolidated financial statements for the year ended December 31, 2019 are stated as follows: Estimated Impairment of Trade Receivables The estimated provision for impairment of trade receivables is based on the assumptions of defaults and expected loss rates. The assumptions and selection of inputs for impairment calculation are based on the Group’s historical experience, existing market conditions as well as forward looking estimates. When the actual future cash flows are less than expected, a material impairment loss may arise, refer to Notes 5 and 13 to the consolidated financial statements. Because key assumptions and inputs used for measuring expected credit losses on trade receivables involve significant judgments and uncertainties, we considered the estimated impairment of trade receivables as one of the key audit matters. The corresponding audit procedures that we performed for the estimated impairment of trade receivables are as follows: 1. We obtained an understanding of the internal control procedures with respect to management’s
allowance for impairment loss of trade receivables. 2. We evaluated the reasonableness of allowance for impairment loss by testing the aging of trade
receivables and by quantifying the potential risk of trade receivables that were overdue at the balance sheet date.
3. We tested the recoverability of the trade receivables by vouching cash receipts after the balance sheet
date. 4. For the estimated impairment of accounts receivable, we evaluated the adequacy of management’s
provision for impairment based on customers’ past default experience, current financial position, any collateral pledged, existing market conditions as well as forward looking estimates.
Fair Value Measurement of Investment Properties The Group’s investment properties are subsequently measured using the fair value model and valued by an independent qualified professional appraiser, a member of the ROC certified real estate appraisers, refer to Notes 5 and 18 to the consolidated financial statements. Because the valuation of investment properties involves significant judgments and uncertainties, we considered the fair value measurement of investment properties as one of the key audit matters. The corresponding audit procedures that we performed for the fair value measurement of investment properties are as follows: 1. We assessed the professional competence and independence of the appraiser engaged by management
and we obtained an understanding of the appraiser’s scope of work and process of engagement to confirm that no circumstances affect the appraiser’s independence and limit the scope of his work.
2. We obtained an understanding of and assessed the reasonableness of management’s assumptions and
methods used in the valuation.
123
3. We sample-tested items from management’s supporting documents, which include the effective gross income, expenses, and property rights of land and buildings to verify the valuation process used by management and recalculated the fair value of investment properties to assess the reasonableness of management’s calculation.
Other Matter The financial statements of China Shanshui Cement Group Limited (CSCGL), an associate accounted for using equity method, were audited by other auditors as of December 31, 2019 and 2018. Our opinion, insofar as it relates to the amounts included in the accompanying financial statements for CSCGL, is based solely on the reports of other auditors. As of December 31, 2019 and 2018, the aggregate carrying value of the equity-method investments in CSCGL was NT$12,024,837 thousand and NT$10,217,370 thousand, respectively, both representing 4% of the consolidated total assets. For the years ended December 31, 2019 and 2018, the share of profit or loss of CSCGL was NT$2,211,559 thousand and NT$376,557 thousand, respectively, representing 8% and 2%, respectively, of the consolidated profit before income tax. We have also audited the parent company only financial statements of Asia Cement Corporation as of and for the years ended December 31, 2019 and 2018 on which we have issued an unmodified opinion with other matter paragraph. Responsibilities of Management and Those Charged with Governance for the Consolidated
Financial Statements Management is responsible for the preparation and fair presentation of the consolidated financial statements in accordance with the Regulations Governing the Preparation of Financial Reports by Securities Issuers, and IFRS, IAS, IFRIC, and SIC endorsed and issued into effect by the Financial Supervisory Commission of the Republic of China, and for such internal control as management determines is necessary to enable the preparation of consolidated financial statements that are free from material misstatement, whether due to fraud or error. In preparing the consolidated financial statements, management is responsible for assessing the Group’s ability to continue as a going concern, disclosing, as applicable, matters related to going concern and using the going concern basis of accounting unless management either intends to liquidate the Group or to cease operations, or has no realistic alternative but to do so. Those charged with governance, including the audit committee, are responsible for overseeing the Group’s financial reporting process. Auditors’ Responsibilities for the Audit of the Consolidated Financial Statements Our objectives are to obtain reasonable assurance about whether the consolidated financial statements as a whole are free from material misstatement, whether due to fraud or error, and to issue an auditors’ report that includes our opinion. Reasonable assurance is a high level of assurance, but is not a guarantee that an audit conducted in accordance with the auditing standards generally accepted in the Republic of China will always detect a material misstatement when it exists. Misstatements can arise from fraud or error and are considered material if, individually or in the aggregate, they could reasonably be expected to influence the economic decisions of users taken on the basis of these consolidated financial statements.
124
As part of an audit in accordance with the auditing standards generally accepted in the Republic of China, we exercise professional judgment and maintain professional skepticism throughout the audit. We also: 1. Identify and assess the risks of material misstatement of the consolidated financial statements,
whether due to fraud or error, design and perform audit procedures responsive to those risks, and obtain audit evidence that is sufficient and appropriate to provide a basis for our opinion. The risk of not detecting a material misstatement resulting from fraud is higher than for one resulting from error, as fraud may involve collusion, forgery, intentional omissions, misrepresentations, or the override of internal control.
2. Obtain an understanding of internal control relevant to the audit in order to design audit procedures
that are appropriate in the circumstances, but not for the purpose of expressing an opinion on the effectiveness of the Group’s internal control.
3. Evaluate the appropriateness of accounting policies used and the reasonableness of accounting
estimates and related disclosures made by management. 4. Conclude on the appropriateness of management’s use of the going concern basis of accounting and,
based on the audit evidence obtained, whether a material uncertainty exists related to events or conditions that may cast significant doubt on the Group’s ability to continue as a going concern. If we conclude that a material uncertainty exists, we are required to draw attention in our auditors’ report to the related disclosures in the consolidated financial statements or, if such disclosures are inadequate, to modify our opinion. Our conclusions are based on the audit evidence obtained up to the date of our auditors’ report. However, future events or conditions may cause the Group to cease to continue as a going concern.
5. Evaluate the overall presentation, structure and content of the consolidated financial statements,
including the disclosures, and whether the consolidated financial statements represent the underlying transactions and events in a manner that achieves fair presentation.
6. Obtain sufficient and appropriate audit evidence regarding the financial information of entities or
business activities within the Group to express an opinion on the consolidated financial statements. We are responsible for the direction, supervision, and performance of the group audit. We remain solely responsible for our audit opinion.
We communicate with those charged with governance regarding, among other matters, the planned scope and timing of the audit and significant audit findings, including any significant deficiencies in internal control that we identify during our audit. We also provide those charged with governance with a statement that we have complied with relevant ethical requirements regarding independence, and to communicate with them all relationships and other matters that may reasonably be thought to bear on our independence, and where applicable, related safeguards. From the matters communicated with those charged with governance, we determine those matters that were of most significance in the audit of the consolidated financial statements for the year ended December 31, 2019 and are therefore the key audit matters. We describe these matters in our auditors’ report unless law or regulation precludes public disclosure about the matter or when, in extremely rare circumstances, we determine that a matter should not be communicated in our report because the adverse consequences of doing so would reasonably be expected to outweigh the public interest benefits of such communication.

125
The engagement partners on the audit resulting in this independent auditors’ report are Tai, Xin Wei and Fan, Yu Wei. Deloitte & Touche Taipei, Taiwan Republic of China March 25, 2020
Notice to Readers The accompanying consolidated financial statements are intended only to present the consolidated financial position, financial performance and cash flows in accordance with accounting principles and practices generally accepted in the Republic of China and not those of any other jurisdictions. The standards, procedures and practices to audit such consolidated financial statements are those generally applied in the Republic of China. For the convenience of readers, the independent auditors’ report and the accompanying consolidated financial statements have been translated into English from the original Chinese version prepared and used in the Republic of China. If there is any conflict between the English version and the original Chinese version or any difference in the interpretation of the two versions, the Chinese-language independent auditors’ report and consolidated financial statements shall prevail.
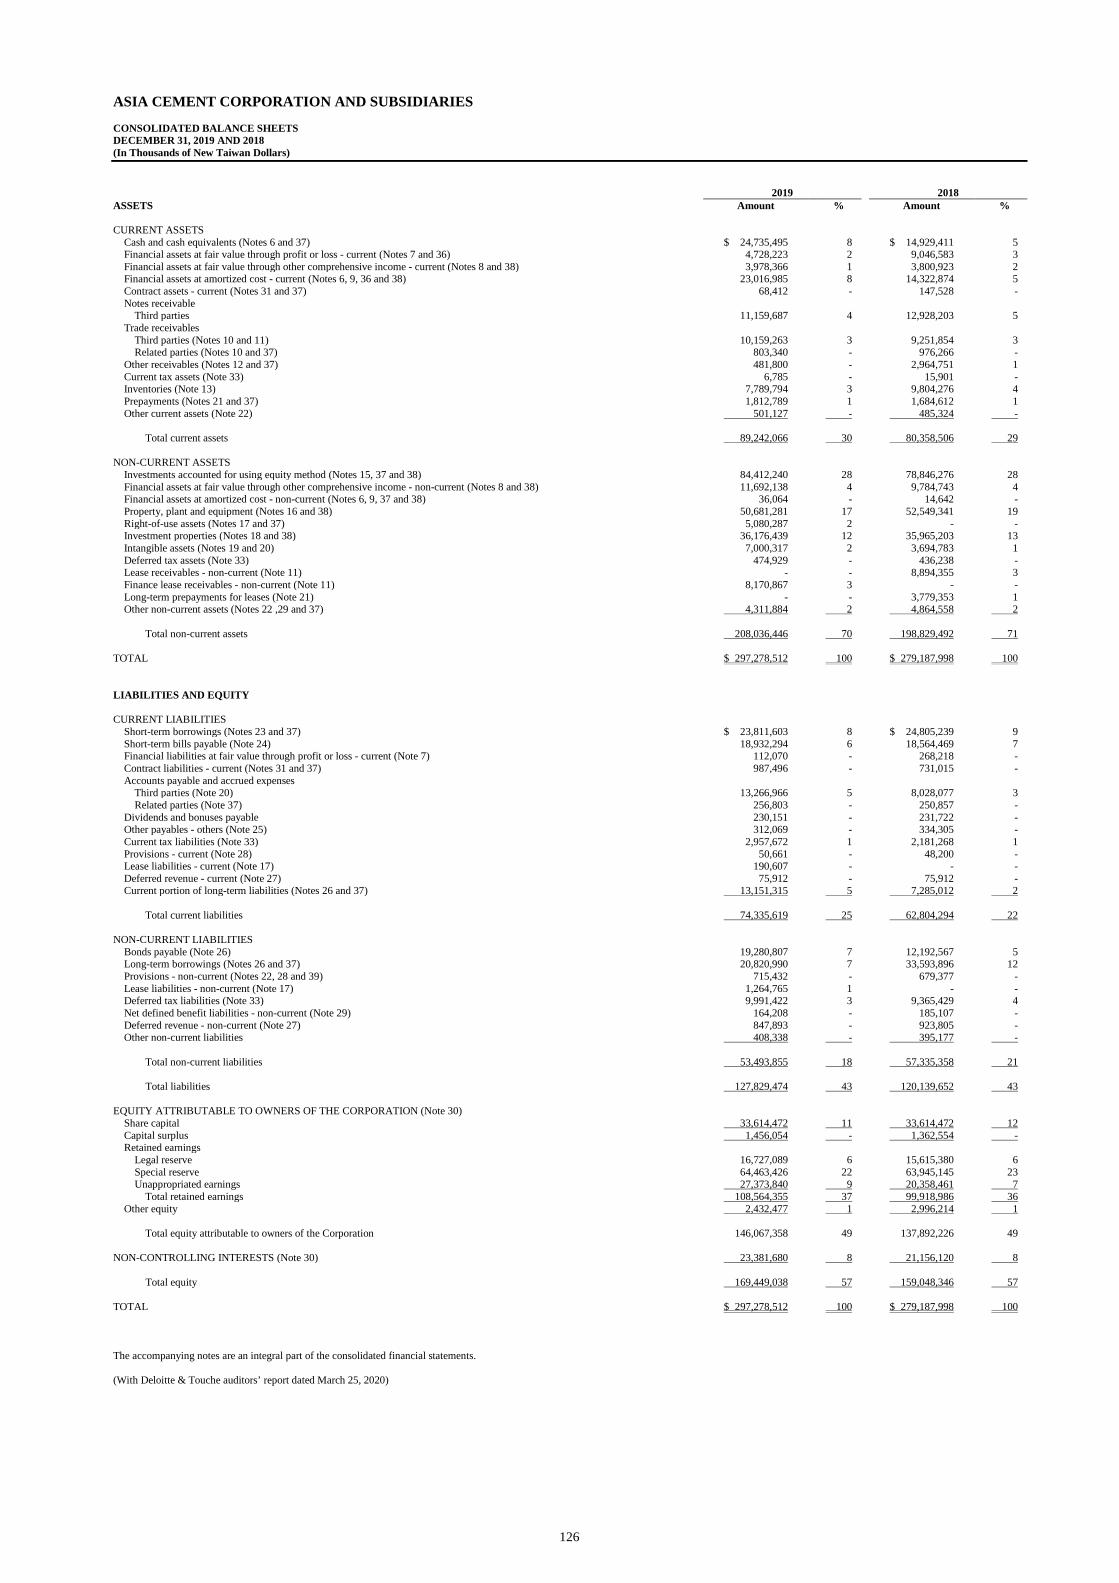
126
ASIA CEMENT CORPORATION AND SUBSIDIARIES CONSOLIDATED BALANCE SHEETS DECEMBER 31, 2019 AND 2018 (In Thousands of New Taiwan Dollars) 2019 2018 ASSETS Amount % Amount % CURRENT ASSETS
Cash and cash equivalents (Notes 6 and 37) $ 24,735,495 8 $ 14,929,411 5 Financial assets at fair value through profit or loss - current (Notes 7 and 36) 4,728,223 2 9,046,583 3 Financial assets at fair value through other comprehensive income - current (Notes 8 and 38) 3,978,366 1 3,800,923 2 Financial assets at amortized cost - current (Notes 6, 9, 36 and 38) 23,016,985 8 14,322,874 5 Contract assets - current (Notes 31 and 37) 68,412 - 147,528 - Notes receivable
Third parties 11,159,687 4 12,928,203 5 Trade receivables
Third parties (Notes 10 and 11) 10,159,263 3 9,251,854 3 Related parties (Notes 10 and 37) 803,340 - 976,266 -
Other receivables (Notes 12 and 37) 481,800 - 2,964,751 1 Current tax assets (Note 33) 6,785 - 15,901 - Inventories (Note 13) 7,789,794 3 9,804,276 4 Prepayments (Notes 21 and 37) 1,812,789 1 1,684,612 1 Other current assets (Note 22) 501,127 - 485,324 -
Total current assets 89,242,066 30 80,358,506 29
NON-CURRENT ASSETS
Investments accounted for using equity method (Notes 15, 37 and 38) 84,412,240 28 78,846,276 28 Financial assets at fair value through other comprehensive income - non-current (Notes 8 and 38) 11,692,138 4 9,784,743 4 Financial assets at amortized cost - non-current (Notes 6, 9, 37 and 38) 36,064 - 14,642 - Property, plant and equipment (Notes 16 and 38) 50,681,281 17 52,549,341 19 Right-of-use assets (Notes 17 and 37) 5,080,287 2 - - Investment properties (Notes 18 and 38) 36,176,439 12 35,965,203 13 Intangible assets (Notes 19 and 20) 7,000,317 2 3,694,783 1 Deferred tax assets (Note 33) 474,929 - 436,238 - Lease receivables - non-current (Note 11) - - 8,894,355 3 Finance lease receivables - non-current (Note 11) 8,170,867 3 - - Long-term prepayments for leases (Note 21) - - 3,779,353 1 Other non-current assets (Notes 22 ,29 and 37) 4,311,884 2 4,864,558 2
Total non-current assets 208,036,446 70 198,829,492 71
TOTAL $ 297,278,512 100 $ 279,187,998 100 LIABILITIES AND EQUITY CURRENT LIABILITIES
Short-term borrowings (Notes 23 and 37) $ 23,811,603 8 $ 24,805,239 9 Short-term bills payable (Note 24) 18,932,294 6 18,564,469 7 Financial liabilities at fair value through profit or loss - current (Note 7) 112,070 - 268,218 - Contract liabilities - current (Notes 31 and 37) 987,496 - 731,015 - Accounts payable and accrued expenses
Third parties (Note 20) 13,266,966 5 8,028,077 3 Related parties (Note 37) 256,803 - 250,857 -
Dividends and bonuses payable 230,151 - 231,722 - Other payables - others (Note 25) 312,069 - 334,305 - Current tax liabilities (Note 33) 2,957,672 1 2,181,268 1 Provisions - current (Note 28) 50,661 - 48,200 - Lease liabilities - current (Note 17) 190,607 - - - Deferred revenue - current (Note 27) 75,912 - 75,912 - Current portion of long-term liabilities (Notes 26 and 37) 13,151,315 5 7,285,012 2
Total current liabilities 74,335,619 25 62,804,294 22
NON-CURRENT LIABILITIES
Bonds payable (Note 26) 19,280,807 7 12,192,567 5 Long-term borrowings (Notes 26 and 37) 20,820,990 7 33,593,896 12 Provisions - non-current (Notes 22, 28 and 39) 715,432 - 679,377 - Lease liabilities - non-current (Note 17) 1,264,765 1 - - Deferred tax liabilities (Note 33) 9,991,422 3 9,365,429 4 Net defined benefit liabilities - non-current (Note 29) 164,208 - 185,107 - Deferred revenue - non-current (Note 27) 847,893 - 923,805 - Other non-current liabilities 408,338 - 395,177 -
Total non-current liabilities 53,493,855 18 57,335,358 21
Total liabilities 127,829,474 43 120,139,652 43
EQUITY ATTRIBUTABLE TO OWNERS OF THE CORPORATION (Note 30)
Share capital 33,614,472 11 33,614,472 12 Capital surplus 1,456,054 - 1,362,554 - Retained earnings
Legal reserve 16,727,089 6 15,615,380 6 Special reserve 64,463,426 22 63,945,145 23 Unappropriated earnings 27,373,840 9 20,358,461 7
Total retained earnings 108,564,355 37 99,918,986 36 Other equity 2,432,477 1 2,996,214 1
Total equity attributable to owners of the Corporation 146,067,358 49 137,892,226 49
NON-CONTROLLING INTERESTS (Note 30) 23,381,680 8 21,156,120 8
Total equity 169,449,038 57 159,048,346 57 TOTAL $ 297,278,512 100 $ 279,187,998 100 The accompanying notes are an integral part of the consolidated financial statements. (With Deloitte & Touche auditors’ report dated March 25, 2020)

127
ASIA CEMENT CORPORATION AND SUBSIDIARIES CONSOLIDATED STATEMENTS OF COMPREHENSIVE INCOME FOR THE YEARS ENDED DECEMBER 31, 2019 AND 2018 (In Thousands of New Taiwan Dollars, Except Earnings Per Share) 2019 2018 Amount % Amount % OPERATING REVENUE (Notes 31 and 37) $ 89,347,637 100 $ 82,741,004 100 OPERATING COSTS (Notes 13, 31 and 37) 63,746,928 71 61,584,690 74 GROSS PROFIT 25,600,709 29 21,156,314 26 UNREALIZED GAIN ON TRANSACTIONS WITH
ASSOCIATES 14,392 - - - REALIZED GAIN ON TRANSACTIONS WITH
ASSOCIATES - - 15,147 - REALIZED GROSS PROFIT 25,586,317 29 21,171,461 26 OPERATING EXPENSES
Administrative expenses (Notes 32 and 37) 3,332,110 4 2,875,798 4 Expected credit loss (Note 10) 191,031 - 142,553 -
Total operating expenses 3,523,141 4 3,018,351 4
OPERATING INCOME 22,063,176 25 18,153,110 22 NON-OPERATING INCOME AND EXPENSES
Other income (Note 32) 1,998,600 2 1,479,803 2 Other gains and losses (Note 32) 661,654 1 (1,733,766) (2) Finance costs (Note 32) (1,820,623) (2) (1,673,185) (2) Share of profit of associates and joint ventures 5,490,375 6 4,144,156 5
Total non-operating income and expenses 6,330,006 7 2,217,008 3
PROFIT BEFORE INCOME TAX 28,393,182 32 20,370,118 25 INCOME TAX EXPENSE (Note 33) 6,149,229 7 5,480,921 7 NET INCOME FOR THE YEAR 22,243,953 25 14,889,197 18
(Continued)

128
ASIA CEMENT CORPORATION AND SUBSIDIARIES CONSOLIDATED STATEMENTS OF COMPREHENSIVE INCOME FOR THE YEARS ENDED DECEMBER 31, 2019 AND 2018 (In Thousands of New Taiwan Dollars, Except Earnings Per Share) 2019 2018 Amount % Amount % OTHER COMPREHENSIVE INCOME, NET
Items that will not be reclassified subsequently to profit or loss: Unrealized gain on investments in equity
instruments at fair value through other comprehensive income $ 1,193,292 1 $ 707,605 1
Remeasurement of defined benefit plans 486,711 1 265,511 - Share of other comprehensive income of
associates and joint ventures 1,778,252 2 723,519 1 3,458,255 4 1,696,635 2
Items that may be reclassified subsequently to profit or loss: Exchange differences on translating the financial
statements of foreign operations (2,635,629) (3) (894,761) (1) Cash flow hedges - - (2,434) - Share of other comprehensive (loss) income of
associates and joint ventures (1,439,930) (2) 636,733 1 (4,075,559) (5) (260,462) -
Other comprehensive (loss) income for the year,
net of income tax (617,304) (1) 1,436,173 2 TOTAL COMPREHENSIVE INCOME FOR THE
YEAR $ 21,626,649 24 $ 16,325,370 20 NET PROFIT ATTRIBUTABLE TO:
Owners of the Corporation $ 17,459,673 20 $ 11,117,094 13 Non-controlling interests 4,784,280 5 3,772,103 5
$ 22,243,953 25 $ 14,889,197 18
TOTAL COMPREHENSIVE INCOME
ATTRIBUTABLE TO: Owners of the Corporation $ 17,652,536 20 $ 12,811,353 16 Non-controlling interests 3,974,113 4 3,514,017 4
$ 21,626,649 24 $ 16,325,370 20 EARNINGS PER SHARE (Note 34)
Basic $ 5.56 $ 3.54 Diluted $ 5.25 $ 3.49
The accompanying notes are an integral part of the consolidated financial statements. (With Deloitte & Touche auditors’ report dated March 25, 2020) (Concluded)
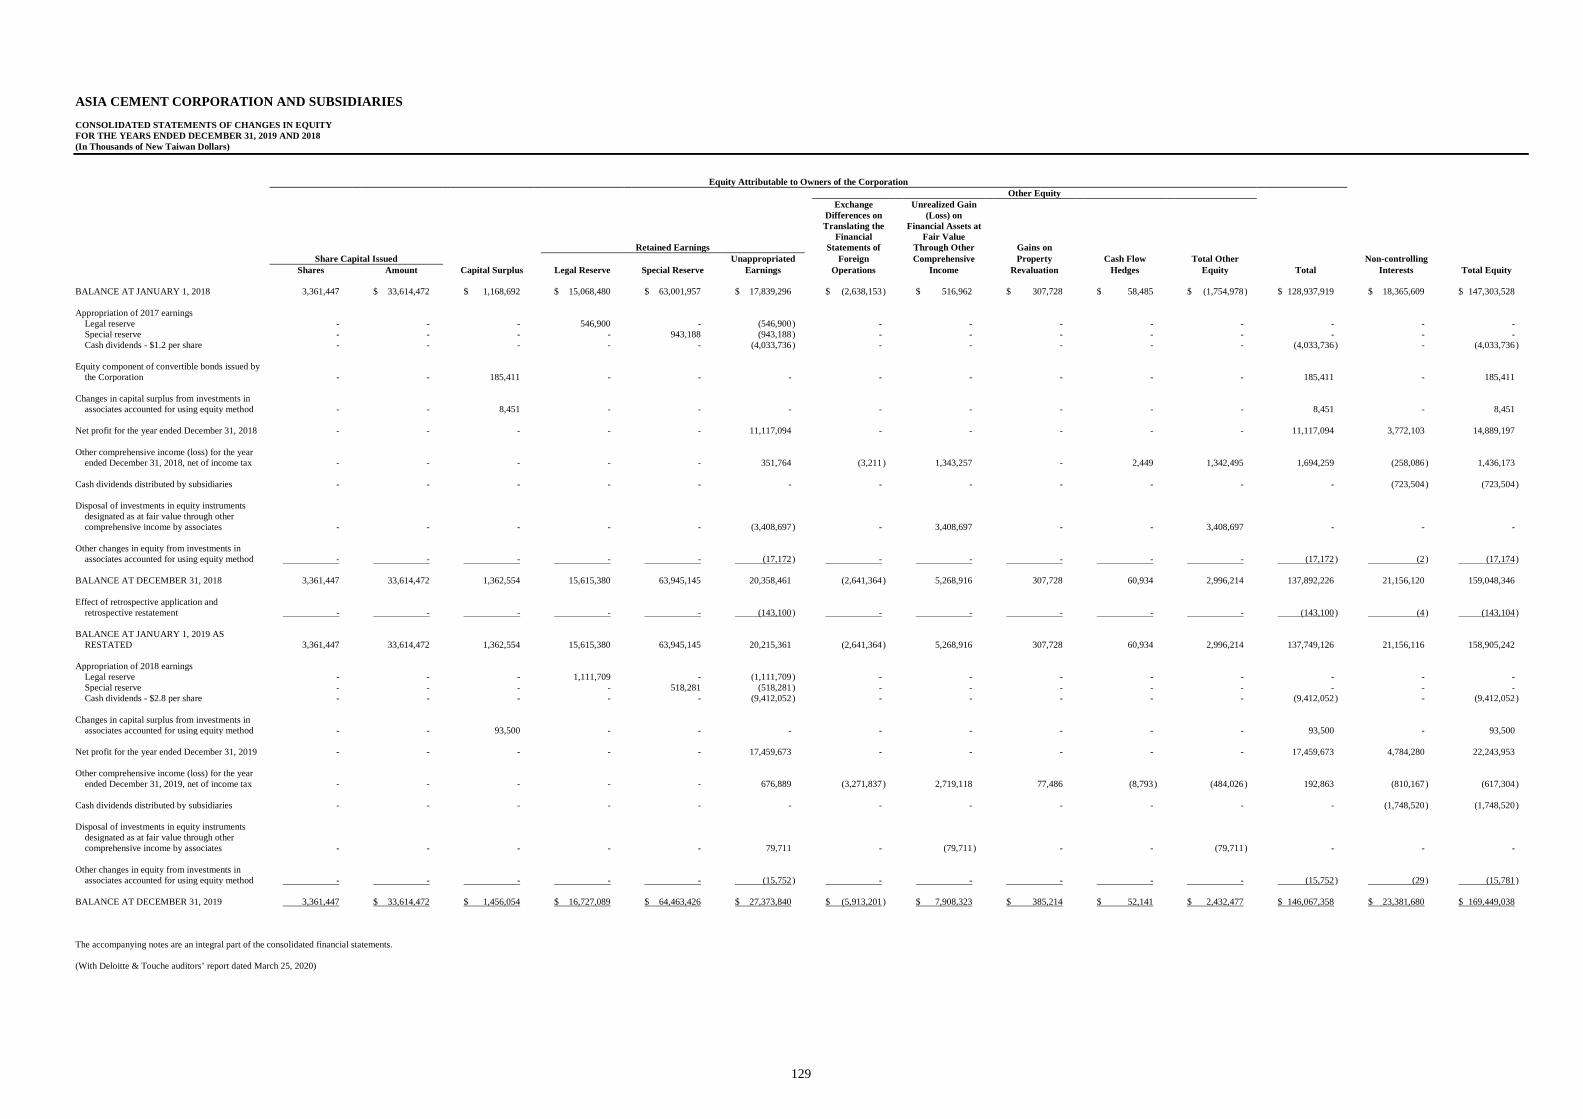
129
ASIA CEMENT CORPORATION AND SUBSIDIARIES CONSOLIDATED STATEMENTS OF CHANGES IN EQUITY FOR THE YEARS ENDED DECEMBER 31, 2019 AND 2018 (In Thousands of New Taiwan Dollars) Equity Attributable to Owners of the Corporation Other Equity
Exchange
Differences on Unrealized Gain
(Loss) on
Translating the
Financial Financial Assets at
Fair Value Retained Earnings Statements of Through Other Gains on Share Capital Issued Unappropriated Foreign Comprehensive Property Cash Flow Total Other Non-controlling Shares Amount Capital Surplus Legal Reserve Special Reserve Earnings Operations Income Revaluation Hedges Equity Total Interests Total Equity BALANCE AT JANUARY 1, 2018 3,361,447 $ 33,614,472 $ 1,168,692 $ 15,068,480 $ 63,001,957 $ 17,839,296 $ (2,638,153 ) $ 516,962 $ 307,728 $ 58,485 $ (1,754,978 ) $ 128,937,919 $ 18,365,609 $ 147,303,528 Appropriation of 2017 earnings
Legal reserve - - - 546,900 - (546,900 ) - - - - - - - - Special reserve - - - - 943,188 (943,188 ) - - - - - - - - Cash dividends - $1.2 per share - - - - - (4,033,736 ) - - - - - (4,033,736 ) - (4,033,736 )
Equity component of convertible bonds issued by
the Corporation - - 185,411 - - - - - - - - 185,411 - 185,411 Changes in capital surplus from investments in
associates accounted for using equity method - - 8,451 - - - - - - - - 8,451 - 8,451 Net profit for the year ended December 31, 2018 - - - - - 11,117,094 - - - - - 11,117,094 3,772,103 14,889,197 Other comprehensive income (loss) for the year
ended December 31, 2018, net of income tax - - - - - 351,764 (3,211 ) 1,343,257 - 2,449 1,342,495 1,694,259 (258,086 ) 1,436,173 Cash dividends distributed by subsidiaries - - - - - - - - - - - - (723,504 ) (723,504 ) Disposal of investments in equity instruments
designated as at fair value through other comprehensive income by associates - - - - - (3,408,697 ) - 3,408,697 - - 3,408,697 - - -
Other changes in equity from investments in
associates accounted for using equity method - - - - - (17,172 ) - - - - - (17,172 ) (2 ) (17,174 ) BALANCE AT DECEMBER 31, 2018 3,361,447 33,614,472 1,362,554 15,615,380 63,945,145 20,358,461 (2,641,364 ) 5,268,916 307,728 60,934 2,996,214 137,892,226 21,156,120 159,048,346 Effect of retrospective application and
retrospective restatement - - - - - (143,100 ) - - - - - (143,100 ) (4 ) (143,104 ) BALANCE AT JANUARY 1, 2019 AS
RESTATED 3,361,447 33,614,472 1,362,554 15,615,380 63,945,145 20,215,361 (2,641,364 ) 5,268,916 307,728 60,934 2,996,214 137,749,126 21,156,116 158,905,242 Appropriation of 2018 earnings
Legal reserve - - - 1,111,709 - (1,111,709 ) - - - - - - - - Special reserve - - - - 518,281 (518,281 ) - - - - - - - - Cash dividends - $2.8 per share - - - - - (9,412,052 ) - - - - - (9,412,052 ) - (9,412,052 )
Changes in capital surplus from investments in
associates accounted for using equity method - - 93,500 - - - - - - - - 93,500 - 93,500 Net profit for the year ended December 31, 2019 - - - - - 17,459,673 - - - - - 17,459,673 4,784,280 22,243,953 Other comprehensive income (loss) for the year
ended December 31, 2019, net of income tax - - - - - 676,889 (3,271,837 ) 2,719,118 77,486 (8,793 ) (484,026 ) 192,863 (810,167 ) (617,304 ) Cash dividends distributed by subsidiaries - - - - - - - - - - - - (1,748,520 ) (1,748,520 ) Disposal of investments in equity instruments
designated as at fair value through other comprehensive income by associates - - - - - 79,711 - (79,711 ) - - (79,711 ) - - -
Other changes in equity from investments in
associates accounted for using equity method - - - - - (15,752 ) - - - - - (15,752 ) (29 ) (15,781 ) BALANCE AT DECEMBER 31, 2019 3,361,447 $ 33,614,472 $ 1,456,054 $ 16,727,089 $ 64,463,426 $ 27,373,840 $ (5,913,201 ) $ 7,908,323 $ 385,214 $ 52,141 $ 2,432,477 $ 146,067,358 $ 23,381,680 $ 169,449,038 The accompanying notes are an integral part of the consolidated financial statements. (With Deloitte & Touche auditors’ report dated March 25, 2020)

130
ASIA CEMENT CORPORATION AND SUBSIDIARIES CONSOLIDATED STATEMENTS OF CASH FLOWS FOR THE YEARS ENDED DECEMBER 31, 2019 AND 2018 (In Thousands of New Taiwan Dollars) 2019 2018 CASH FLOWS FROM OPERATING ACTIVITIES
Income before income tax $ 28,393,182 $ 20,370,118 Adjustments for:
Share of loss of associates and joint ventures (5,490,375) (4,144,156) Depreciation expenses 4,827,418 4,649,561 Finance costs 1,820,623 1,673,185 Amortization expenses 1,292,725 269,631 Net (gain) loss on fair value changes of financial assets and
liabilities designated as at fair value through profit or loss (1,129,040) 256,294 Interest income (1,126,001) (370,571) Dividend income (761,309) (770,314) Gain on disposal of financial assets (365,192) (251,859) Unrealized gain on foreign exchange (295,492) (15,575) Gain on changes in fair value of investment properties (197,647) (98,015) Expected credit loss recognized on trade receivables 191,031 142,553 (Reversal of) write-downs of inventories (18,619) 315,353 Loss on disposal of property, plant and equipment 44,225 33,455 Loss on disposal of investments accounted for using equity method 5,761 - Impairment loss recognized on investments accounted for using
equity method - 200,245 Impairment loss recognized on goodwill - 630,631 Impairment loss on property, plant and equipment - 51,888 Gain on disposal of subsidiaries - (40,440) Effect of changes in exchange rate of bonds payable - 300 Other items - (755) Changes in operating assets and liabilities
Financial assets mandatorily classified as at fair value through profit or loss 5,660,259 (3,051,110)
Contract assets 79,116 (44,533) Notes receivable 1,351,524 (4,805,502) Trade receivables 273,510 525,258 Other receivables 1,769,088 (487,332) Inventories 1,857,463 (3,566,055) Prepayments (408,758) (31,307) Other current assets (34,246) (74,718) Contract liabilities 256,481 (20,934) Accounts payable and accrued expenses 697,124 806,044 Provisions 35,916 176,021 Net defined benefit liabilities (5,682) (12,254) Deferred revenue (75,912) (68,085)
Cash generated from operations 38,647,173 12,247,022 Interests received 1,161,528 254,393 Dividends received 4,062,869 3,172,662
(Continued)

131
ASIA CEMENT CORPORATION AND SUBSIDIARIES CONSOLIDATED STATEMENTS OF CASH FLOWS FOR THE YEARS ENDED DECEMBER 31, 2019 AND 2018 (In Thousands of New Taiwan Dollars) 2019 2018
Interests paid $ (1,803,500) $ (1,658,691) Income tax paid (4,796,169) (3,304,318)
Net cash generated from operating activities 37,271,901 10,711,068
CASH FLOWS FROM INVESTING ACTIVITIES
Purchase of financial assets at amortized cost (8,715,533) (9,537,968) Payments for property, plant and equipment (3,754,851) (4,274,600) Acquisition of associates (3,326,114) (123,120) Decrease (increase) in refundable deposits 596,780 (9,678) Purchase of financial assets at fair value through other comprehensive
income (275,281) (556,016) Increase in long-term prepayments for investment (11,224) (83,721) Net cash inflow on disposal of associates 63,008 - Payments for intangible assets (58,941) (13,037) Proceeds from disposal of property, plant and equipment 37,708 90,395 Payments for investment properties (27,224) (1,269) Decrease in other non-current assets 5,300 1,559 Net cash inflow on disposal of subsidiaries - 48,391
Net cash used in investing activities (15,466,372) (14,459,064)
CASH FLOWS FROM FINANCING ACTIVITIES
Repayments of long-term borrowings (92,064,122) (30,396,615) Proceeds from long-term borrowings 86,653,202 34,819,996 Proceeds from issuance of bonds 10,000,000 6,574,843 Dividends paid (9,412,164) (4,033,715) Repayments of bonds (4,000,000) (4,089,430) Dividends paid to non-controlling interests (1,748,520) (723,504) (Decrease) increase in short-term borrowings (704,248) 6,445,333 Increase in short-term bills payable 369,075 2,439,125 Repayment of the principal portion of lease liabilities (267,792) - Increase (decrease) in other non-current liabilities 21,680 (59,096) (Decrease) increase in guarantee deposits received (10,073) 14,691
Net cash (used in) generated from financing activities (11,162,962) 10,991,628
EFFECTS OF EXCHANGE RATE CHANGES ON THE BALANCE
OF CASH AND CASH EQUIVALENTS HELD IN FOREIGN CURRENCIES (836,483) (53,713)
(Continued)

132
ASIA CEMENT CORPORATION AND SUBSIDIARIES CONSOLIDATED STATEMENTS OF CASH FLOWS FOR THE YEARS ENDED DECEMBER 31, 2019 AND 2018 (In Thousands of New Taiwan Dollars) 2019 2018 NET INCREASE IN CASH AND CASH EQUIVALENTS $ 9,806,084 $ 7,189,919 CASH AND CASH EQUIVALENTS AT THE BEGINNING OF THE
YEAR 14,929,411 7,739,492 CASH AND CASH EQUIVALENTS AT THE END OF THE YEAR $ 24,735,495 $ 14,929,411 The accompanying notes are an integral part of the consolidated financial statements. (With Deloitte & Touche auditors’ report dated March 25, 2020) (Concluded)
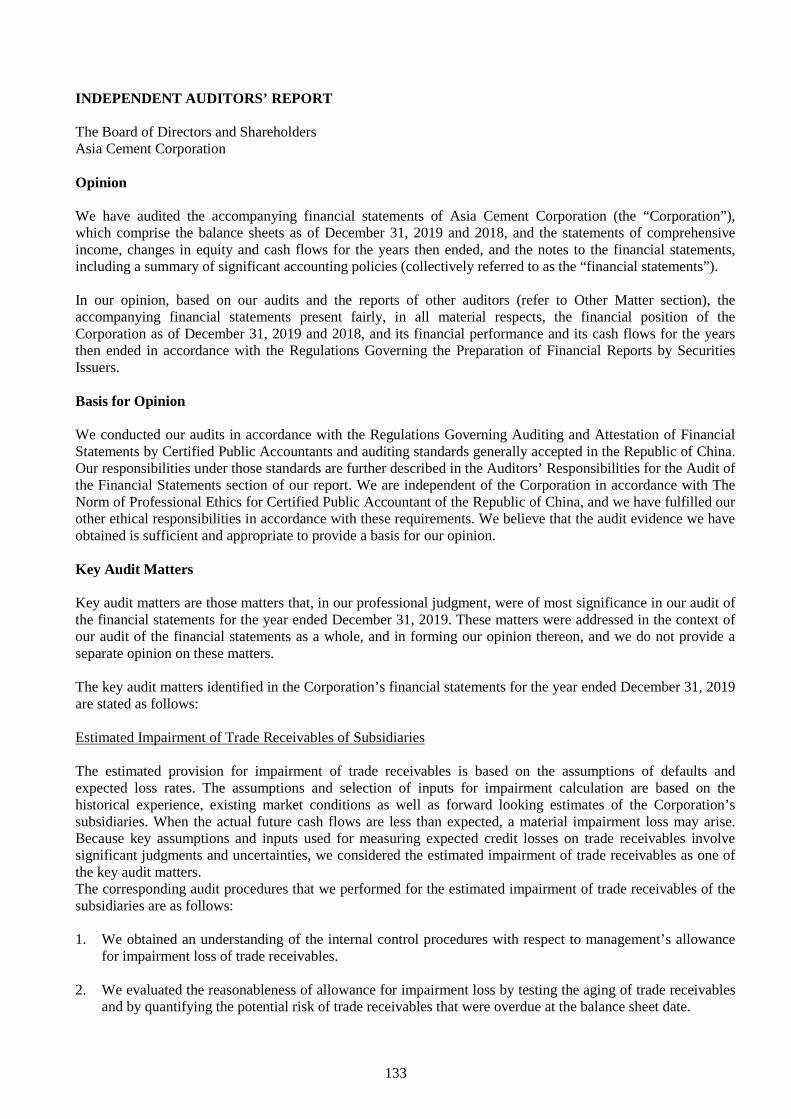
133
INDEPENDENT AUDITORS’ REPORT The Board of Directors and Shareholders Asia Cement Corporation Opinion We have audited the accompanying financial statements of Asia Cement Corporation (the “Corporation”), which comprise the balance sheets as of December 31, 2019 and 2018, and the statements of comprehensive income, changes in equity and cash flows for the years then ended, and the notes to the financial statements, including a summary of significant accounting policies (collectively referred to as the “financial statements”). In our opinion, based on our audits and the reports of other auditors (refer to Other Matter section), the accompanying financial statements present fairly, in all material respects, the financial position of the Corporation as of December 31, 2019 and 2018, and its financial performance and its cash flows for the years then ended in accordance with the Regulations Governing the Preparation of Financial Reports by Securities Issuers. Basis for Opinion We conducted our audits in accordance with the Regulations Governing Auditing and Attestation of Financial Statements by Certified Public Accountants and auditing standards generally accepted in the Republic of China. Our responsibilities under those standards are further described in the Auditors’ Responsibilities for the Audit of the Financial Statements section of our report. We are independent of the Corporation in accordance with The Norm of Professional Ethics for Certified Public Accountant of the Republic of China, and we have fulfilled our other ethical responsibilities in accordance with these requirements. We believe that the audit evidence we have obtained is sufficient and appropriate to provide a basis for our opinion. Key Audit Matters Key audit matters are those matters that, in our professional judgment, were of most significance in our audit of the financial statements for the year ended December 31, 2019. These matters were addressed in the context of our audit of the financial statements as a whole, and in forming our opinion thereon, and we do not provide a separate opinion on these matters. The key audit matters identified in the Corporation’s financial statements for the year ended December 31, 2019 are stated as follows: Estimated Impairment of Trade Receivables of Subsidiaries The estimated provision for impairment of trade receivables is based on the assumptions of defaults and expected loss rates. The assumptions and selection of inputs for impairment calculation are based on the historical experience, existing market conditions as well as forward looking estimates of the Corporation’s subsidiaries. When the actual future cash flows are less than expected, a material impairment loss may arise. Because key assumptions and inputs used for measuring expected credit losses on trade receivables involve significant judgments and uncertainties, we considered the estimated impairment of trade receivables as one of the key audit matters. The corresponding audit procedures that we performed for the estimated impairment of trade receivables of the subsidiaries are as follows: 1. We obtained an understanding of the internal control procedures with respect to management’s allowance
for impairment loss of trade receivables. 2. We evaluated the reasonableness of allowance for impairment loss by testing the aging of trade receivables
and by quantifying the potential risk of trade receivables that were overdue at the balance sheet date.

134
3. We tested the recoverability of the trade receivables by vouching cash receipts after the balance sheet date. 4. For the estimated impairment of accounts receivable, we evaluated the adequacy of management’s
provision for impairment based on customers’ past default experience, current financial position, any collateral pledged, existing market conditions as well as forward looking estimates.
Fair Value Measurement of Investment Properties The Corporation’s and its subsidiaries’ investment properties are subsequently measured using the fair value model and valued by an independent qualified professional appraiser, a member of the ROC certified real estate appraisers, refer to Notes 5 and 15 to the financial statements. Because the valuation of investment properties involves significant judgments and uncertainties, we considered the fair value measurement of investment properties as one of the key audit matters. The corresponding audit procedures that we performed for the fair value measurement of investment properties are as follows: 1. We assessed the professional competence and independence of the appraiser engaged by management and
we obtained an understanding of the appraiser’s scope of work and process of engagement to confirm that no circumstances affect the appraiser’s independence and limit the scope of his work.
2. We obtained an understanding of and assessed the reasonableness of management’s assumptions and
methods used in the valuation. 3. We sample-tested items from management’s supporting documents, which include the effective gross
income, expenses, and property rights of land and buildings to verify the valuation process used by management and recalculated the fair value of investment properties to assess the reasonableness of management’s calculation.
Other Matter The financial statements of China Shanshui Cement Group Limited (CSCGL), an associate accounted for using equity method, were audited by other auditors as of December 31, 2019 and 2018. Our opinion, insofar as it relates to the amounts included in the accompanying financial statements for CSCGL, is based solely on the reports of other auditors. As of December 31, 2019 and 2018, the aggregate carrying value of the equity-method investments in CSCGL was NT$12,022,105 thousand and NT$10,215,045 thousand, respectively, representing 6% and 5%, respectively, of the total assets. For the years ended December 31, 2019 and 2018, the share of profit or loss of CSCGL was NT$2,211,060 thousand and NT$376,472 thousand, respectively, representing 12% and 3%, respectively, of the profit before income tax Responsibilities of Management and Those Charged with Governance for the Financial Statements Management is responsible for the preparation and fair presentation of the financial statements in accordance with the Regulations Governing the Preparation of Financial Reports by Securities Issuers and for such internal control as management determines is necessary to enable the preparation of financial statements that are free from material misstatement, whether due to fraud or error. In preparing the financial statements, management is responsible for assessing the Corporation’s ability to continue as a going concern, disclosing, as applicable, matters related to going concern and using the going concern basis of accounting unless management either intends to liquidate the Corporation or to cease operations, or has no realistic alternative but to do so. Those charged with governance, including the audit committee, are responsible for overseeing the Corporation’s financial reporting process.

135
Auditors’ Responsibilities for the Audit of the Financial Statements Our objectives are to obtain reasonable assurance about whether the financial statements as a whole are free from material misstatement, whether due to fraud or error, and to issue an auditors’ report that includes our opinion. Reasonable assurance is a high level of assurance, but is not a guarantee that an audit conducted in accordance with the auditing standards generally accepted in the Republic of China will always detect a material misstatement when it exists. Misstatements can arise from fraud or error and are considered material if, individually or in the aggregate, they could reasonably be expected to influence the economic decisions of users taken on the basis of these financial statements. As part of an audit in accordance with the auditing standards generally accepted in the Republic of China, we exercise professional judgment and maintain professional skepticism throughout the audit. We also: 1. Identify and assess the risks of material misstatement of the financial statements, whether due to fraud or
error, design and perform audit procedures responsive to those risks, and obtain audit evidence that is sufficient and appropriate to provide a basis for our opinion. The risk of not detecting a material misstatement resulting from fraud is higher than for one resulting from error, as fraud may involve collusion, forgery, intentional omissions, misrepresentations, or the override of internal control.
2. Obtain an understanding of internal control relevant to the audit in order to design audit procedures that are
appropriate in the circumstances, but not for the purpose of expressing an opinion on the effectiveness of the Corporation’s internal control.
3. Evaluate the appropriateness of accounting policies used and the reasonableness of accounting estimates
and related disclosures made by management. 4. Conclude on the appropriateness of management’s use of the going concern basis of accounting and, based
on the audit evidence obtained, whether a material uncertainty exists related to events or conditions that may cast significant doubt on the Corporation’s ability to continue as a going concern. If we conclude that a material uncertainty exists, we are required to draw attention in our auditors’ report to the related disclosures in the financial statements or, if such disclosures are inadequate, to modify our opinion. Our conclusions are based on the audit evidence obtained up to the date of our auditors’ report. However, future events or conditions may cause the Corporation to cease to continue as a going concern.
5. Evaluate the overall presentation, structure and content of the financial statements, including the disclosures,
and whether the financial statements represent the underlying transactions and events in a manner that achieves fair presentation.
6. Obtain sufficient and appropriate audit evidence regarding the financial information of entities or business
activities within the Corporation to express an opinion on the financial statements. We are responsible for the direction, supervision, and performance of the company audit. We remain solely responsible for our audit opinion.
We communicate with those charged with governance regarding, among other matters, the planned scope and timing of the audit and significant audit findings, including any significant deficiencies in internal control that we identify during our audit. We also provide those charged with governance with a statement that we have complied with relevant ethical requirements regarding independence, and to communicate with them all relationships and other matters that may reasonably be thought to bear on our independence, and where applicable, related safeguards. From the matters communicated with those charged with governance, we determine those matters that were of most significance in the audit of the financial statements for the year ended December 31, 2019 and are therefore the key audit matters. We describe these matters in our auditors’ report unless law or regulation precludes public disclosure about the matter or when, in extremely rare circumstances, we determine that a

136
matter should not be communicated in our report because the adverse consequences of doing so would reasonably be expected to outweigh the public interest benefits of such communication. The engagement partners on the audit resulting in this independent auditors’ report are Tai, Xin Wei and Fan, Yu Wei. Deloitte & Touche Taipei, Taiwan Republic of China March 25, 2020
Notice to Readers The accompanying financial statements are intended only to present the financial position, financial performance and cash flows in accordance with accounting principles and practices generally accepted in the Republic of China and not those of any other jurisdictions. The standards, procedures and practices to audit such financial statements are those generally applied in the Republic of China. For the convenience of readers, the independent auditors’ report and the accompanying financial statements have been translated into English from the original Chinese version prepared and used in the Republic of China. If there is any conflict between the English version and the original Chinese version or any difference in the interpretation of the two versions, the Chinese-language independent auditors’ report and financial statements shall prevail.
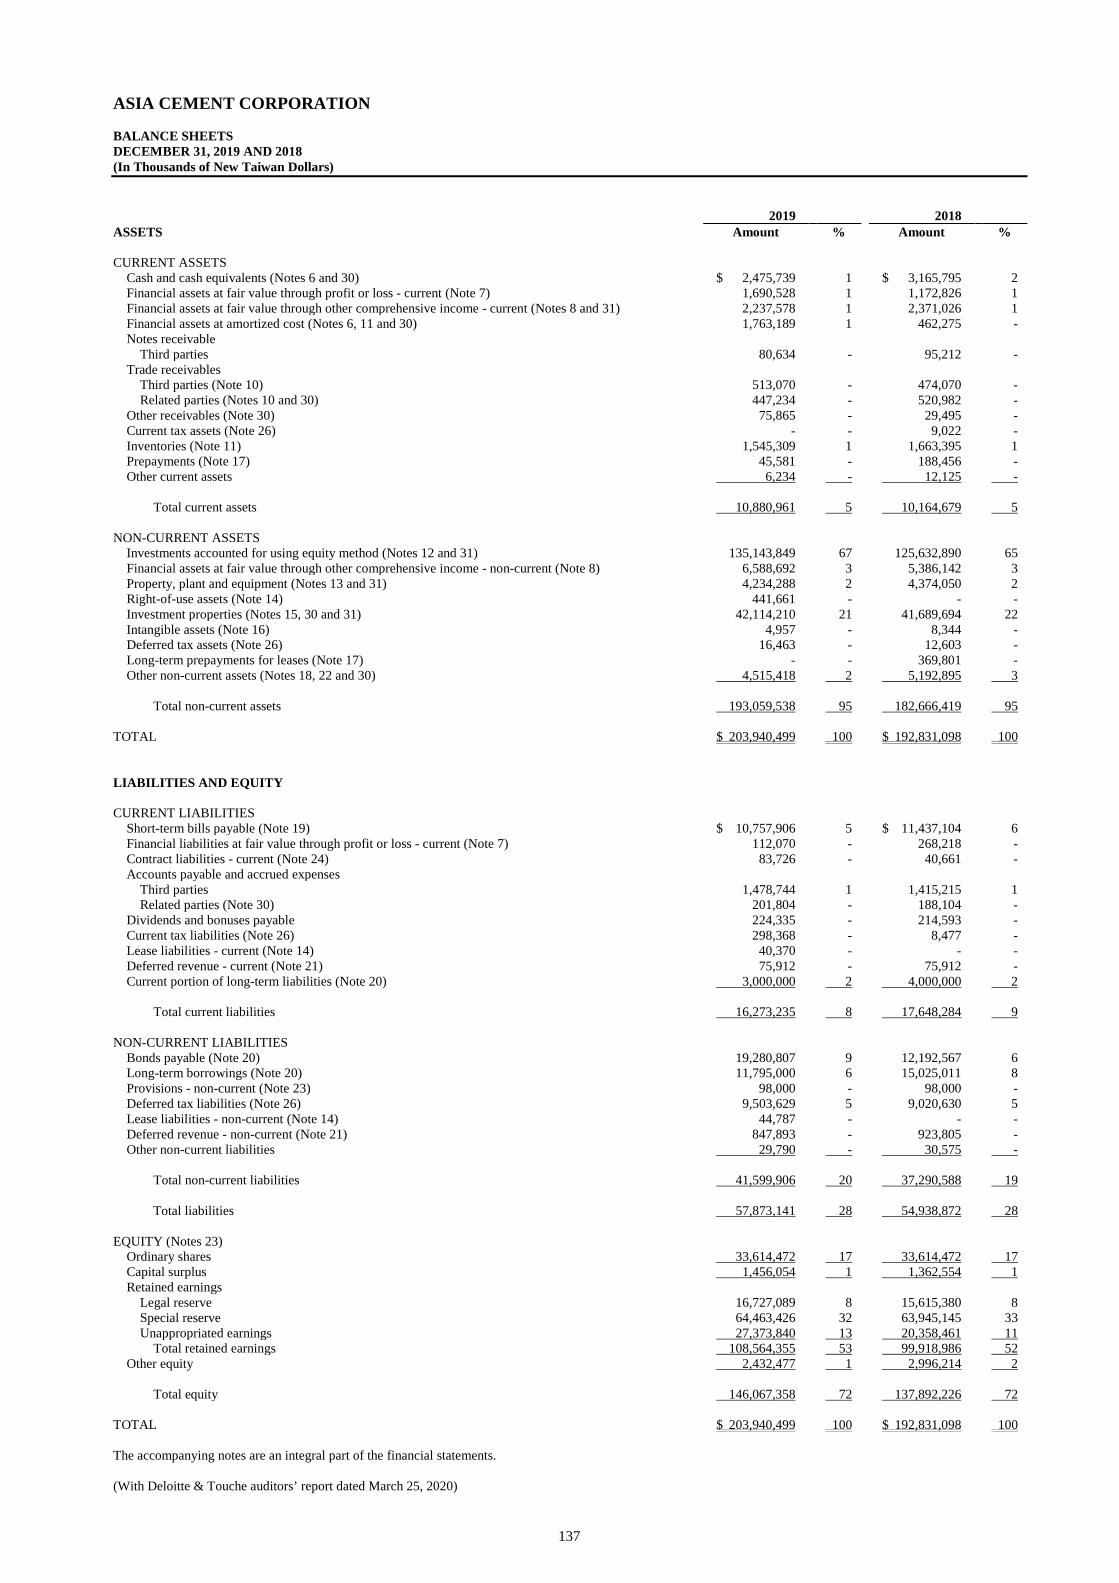
137
ASIA CEMENT CORPORATION BALANCE SHEETS DECEMBER 31, 2019 AND 2018 (In Thousands of New Taiwan Dollars) 2019 2018 ASSETS Amount % Amount % CURRENT ASSETS
Cash and cash equivalents (Notes 6 and 30) $ 2,475,739 1 $ 3,165,795 2 Financial assets at fair value through profit or loss - current (Note 7) 1,690,528 1 1,172,826 1 Financial assets at fair value through other comprehensive income - current (Notes 8 and 31) 2,237,578 1 2,371,026 1 Financial assets at amortized cost (Notes 6, 11 and 30) 1,763,189 1 462,275 - Notes receivable
Third parties 80,634 - 95,212 - Trade receivables
Third parties (Note 10) 513,070 - 474,070 - Related parties (Notes 10 and 30) 447,234 - 520,982 -
Other receivables (Note 30) 75,865 - 29,495 - Current tax assets (Note 26) - - 9,022 - Inventories (Note 11) 1,545,309 1 1,663,395 1 Prepayments (Note 17) 45,581 - 188,456 - Other current assets 6,234 - 12,125 -
Total current assets 10,880,961 5 10,164,679 5
NON-CURRENT ASSETS
Investments accounted for using equity method (Notes 12 and 31) 135,143,849 67 125,632,890 65 Financial assets at fair value through other comprehensive income - non-current (Note 8) 6,588,692 3 5,386,142 3 Property, plant and equipment (Notes 13 and 31) 4,234,288 2 4,374,050 2 Right-of-use assets (Note 14) 441,661 - - - Investment properties (Notes 15, 30 and 31) 42,114,210 21 41,689,694 22 Intangible assets (Note 16) 4,957 - 8,344 - Deferred tax assets (Note 26) 16,463 - 12,603 - Long-term prepayments for leases (Note 17) - - 369,801 - Other non-current assets (Notes 18, 22 and 30) 4,515,418 2 5,192,895 3
Total non-current assets 193,059,538 95 182,666,419 95
TOTAL $ 203,940,499 100 $ 192,831,098 100 LIABILITIES AND EQUITY CURRENT LIABILITIES
Short-term bills payable (Note 19) $ 10,757,906 5 $ 11,437,104 6 Financial liabilities at fair value through profit or loss - current (Note 7) 112,070 - 268,218 - Contract liabilities - current (Note 24) 83,726 - 40,661 - Accounts payable and accrued expenses
Third parties 1,478,744 1 1,415,215 1 Related parties (Note 30) 201,804 - 188,104 -
Dividends and bonuses payable 224,335 - 214,593 - Current tax liabilities (Note 26) 298,368 - 8,477 - Lease liabilities - current (Note 14) 40,370 - - - Deferred revenue - current (Note 21) 75,912 - 75,912 - Current portion of long-term liabilities (Note 20) 3,000,000 2 4,000,000 2
Total current liabilities 16,273,235 8 17,648,284 9
NON-CURRENT LIABILITIES
Bonds payable (Note 20) 19,280,807 9 12,192,567 6 Long-term borrowings (Note 20) 11,795,000 6 15,025,011 8 Provisions - non-current (Note 23) 98,000 - 98,000 - Deferred tax liabilities (Note 26) 9,503,629 5 9,020,630 5 Lease liabilities - non-current (Note 14) 44,787 - - - Deferred revenue - non-current (Note 21) 847,893 - 923,805 - Other non-current liabilities 29,790 - 30,575 -
Total non-current liabilities 41,599,906 20 37,290,588 19
Total liabilities 57,873,141 28 54,938,872 28
EQUITY (Notes 23)
Ordinary shares 33,614,472 17 33,614,472 17 Capital surplus 1,456,054 1 1,362,554 1 Retained earnings
Legal reserve 16,727,089 8 15,615,380 8 Special reserve 64,463,426 32 63,945,145 33 Unappropriated earnings 27,373,840 13 20,358,461 11
Total retained earnings 108,564,355 53 99,918,986 52 Other equity 2,432,477 1 2,996,214 2
Total equity 146,067,358 72 137,892,226 72
TOTAL $ 203,940,499 100 $ 192,831,098 100 The accompanying notes are an integral part of the financial statements. (With Deloitte & Touche auditors’ report dated March 25, 2020)

- 138 -
ASIA CEMENT CORPORATION STATEMENTS OF COMPREHENSIVE INCOME FOR THE YEARS ENDED DECEMBER 31, 2019 AND 2018 (In Thousands of New Taiwan Dollars, Except Earnings Per Share) 2019 2018 Amount % Amount % OPERATING REVENUE (Notes 24 and 30) $ 8,985,917 100 $ 8,732,236 100 OPERATING COSTS (Notes 11, 24, 25 and 30) 8,507,992 95 8,479,146 97 GROSS PROFIT 477,925 5 253,090 3 (UNREALIZED) REALIZED GAIN ON
TRANSACTIONS WITH SUBSIDIARIES AND ASSOCIATES (8,442) - 3,444 -
REALIZED GROSS PROFIT 469,483 5 256,534 3 OPERATING EXPENSES
Administrative expenses (Notes 25 and 30) 678,405 7 649,813 8 Expected credit loss (Note 10) 3,753 - 694 -
Total operating expenses 682,158 7 650,507 8
OPERATING LOSS (212,675) (2) (393,973) (5) NON-OPERATING INCOME AND EXPENSES
Other income (Note 25) 812,795 9 592,445 7 Other gains and losses (Note 25) 814,110 9 (641,800) (7) Finance costs (Note 25) (369,349) (4) (331,984) (4) Share of profit of subsidiaries and associates 17,111,219 190 12,970,044 148
Total non-operating income and expenses 18,368,775 204 12,588,705 144
PROFIT BEFORE INCOME TAX 18,156,100 202 12,194,732 139 INCOME TAX EXPENSE (Note 26) 696,427 8 1,077,638 12 NET INCOME FOR THE YEAR 17,459,673 194 11,117,094 127
(Continued)
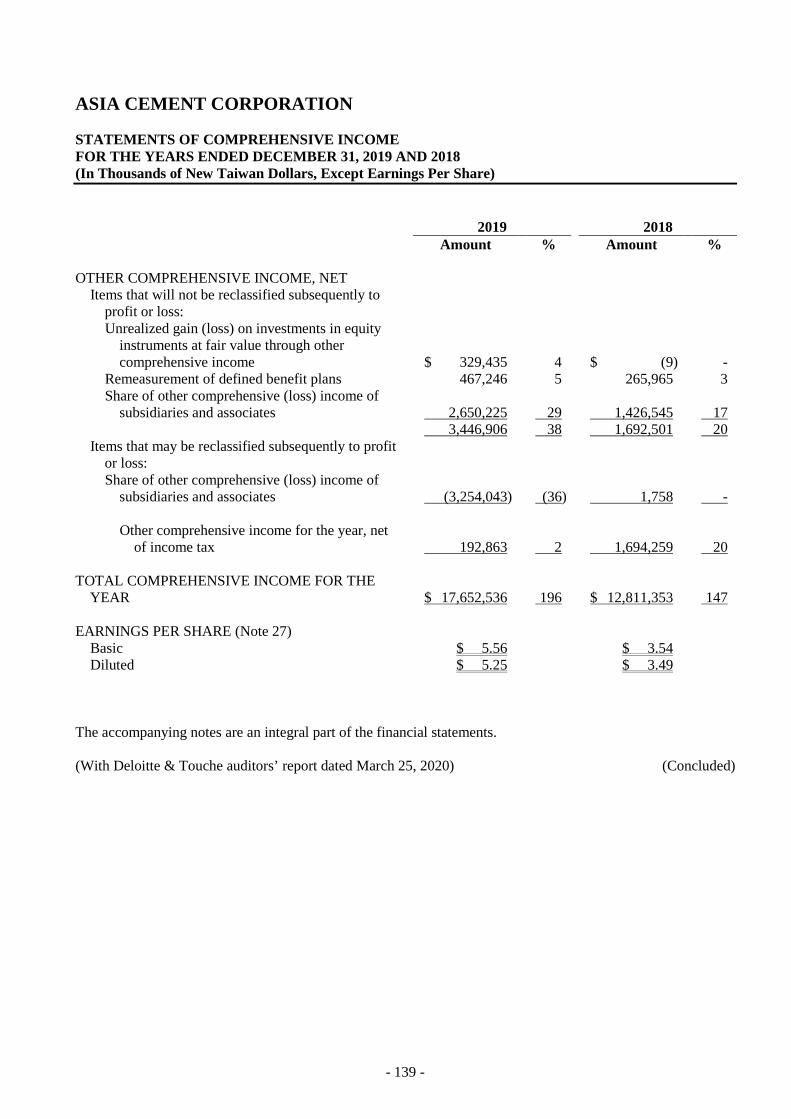
- 139 -
ASIA CEMENT CORPORATION STATEMENTS OF COMPREHENSIVE INCOME FOR THE YEARS ENDED DECEMBER 31, 2019 AND 2018 (In Thousands of New Taiwan Dollars, Except Earnings Per Share) 2019 2018 Amount % Amount % OTHER COMPREHENSIVE INCOME, NET
Items that will not be reclassified subsequently to profit or loss: Unrealized gain (loss) on investments in equity
instruments at fair value through other comprehensive income $ 329,435 4 $ (9) -
Remeasurement of defined benefit plans 467,246 5 265,965 3 Share of other comprehensive (loss) income of
subsidiaries and associates 2,650,225 29 1,426,545 17 3,446,906 38 1,692,501 20
Items that may be reclassified subsequently to profit or loss: Share of other comprehensive (loss) income of
subsidiaries and associates (3,254,043) (36) 1,758 -
Other comprehensive income for the year, net of income tax 192,863 2 1,694,259 20
TOTAL COMPREHENSIVE INCOME FOR THE
YEAR $ 17,652,536 196 $ 12,811,353 147 EARNINGS PER SHARE (Note 27)
Basic $ 5.56 $ 3.54 Diluted $ 5.25 $ 3.49
The accompanying notes are an integral part of the financial statements. (With Deloitte & Touche auditors’ report dated March 25, 2020) (Concluded)

- 140 -
ASIA CEMENT CORPORATION STATEMENTS OF CHANGES IN EQUITY FOR THE YEARS ENDED DECEMBER 31, 2019 AND 2018 (In Thousands of New Taiwan Dollars)
Other Equity
Exchange Differences on Translating the
Unrealized Gain (Loss) on
Financial Assets Financial at Fair Value Retained Earnings Statements of Through Other Gains on Share Capital Issued Unappropriated Foreign Comprehensive Property Cash Flow Shares Amount Capital Surplus Legal Reserve Special Reserve Earnings Operations Income Revaluation Hedge Total Total Equity
BALANCE AT JANUARY 1, 2018 3,361,447 $ 33,614,472 $ 1,168,692 $ 15,068,480 $ 63,001,957 $ 17,839,296 $ (2,638,153 ) $ 516,962 $ 307,728 $ 58,485 $ (1,754,978 ) $ 128,937,919 Appropriation of 2017 earnings
Legal reserve - - - 546,900 - (546,900 ) - - - - - - Special reserve - - - - 943,188 (943,188 ) - - - - - - Cash dividends - $1.2 per share - - - - - (4,033,736 ) - - - - - (4,033,736 )
Equity component of convertible bonds issued by the Corporation - - 185,411 - - - - - - - - 185,411 Changes in capital surplus from investments in subsidiaries and associates
accounted for using equity method - - 8,451 - - - - - - - - 8,451 Net profit for the year ended December 31, 2018 - - - - - 11,117,094 - - - - - 11,117,094 Other comprehensive income (loss) for the year ended December 31, 2018,
net of income tax - - - - - 351,764 (3,211 ) 1,343,257 - 2,449 1,342,495 1,694,259 Disposal of investments in equity instruments designated as at fair value
through other comprehensive income - - - - - (3,408,697 ) - 3,408,697 - - 3,408,697 - Other changes in equity from investments in subsidiaries and associates
accounted for using equity method - - - - - (17,172 ) - - - - - (17,172 ) BALANCE AT DECEMBER 31, 2018 3,361,447 33,614,472 1,362,554 15,615,380 63,945,145 20,358,461 (2,641,364 ) 5,268,916 307,728 60,934 2,996,214 137,892,226 Effect of retrospective application and retrospective restatement - - - - - (143,100 ) - - - - - (143,100 ) BALANCE AT JANUARY 1, 2019 AS RESTATED 3,361,447 33,614,472 1,362,554 15,615,380 63,945,145 20,215,361 (2,641,364 ) 5,268,916 307,728 60,934 2,996,214 137,749,126 Appropriation of 2018 earnings
Legal reserve - - - 1,111,709 - (1,111,709 ) - - - - - - Special reserve - - - - 518,281 (518,281 ) - - - - - - Cash dividends - $2.8 per share - - - - - (9,412,052 ) - - - - - (9,412,052 )
Changes in capital surplus from investments in subsidiaries and associates
accounted for using equity method - - 93,500 - - - - - - - - 93,500 Net profit for the year ended December 31, 2019 - - - - - 17,459,673 - - - - - 17,459,673 Other comprehensive income (loss) for the year ended December 31, 2019,
net of income tax - - - - - 676,889 (3,271,837 ) 2,719,118 77,486 (8,793 ) (484,026 ) 192,863 Disposal of investments in equity instruments designated as at fair value
through other comprehensive income by associates - - - - - 79,711 - (79,711 ) - - (79,711 ) - Other changes in equity from investments in subsidiaries and associates
accounted for using equity method - - - - - (15,752 ) - - - - - (15,752 ) BALANCE AT DECEMBER 31, 2019 3,361,447 $ 33,614,472 $ 1,456,054 $ 16,727,089 $ 64,463,426 $ 27,373,840 $ (5,913,201 ) $ 7,908,323 $ 385,214 $ 52,141 $ 2,432,477 $ 146,067,358 The accompanying notes are an integral part of the financial statements. (With Deloitte & Touche auditors’ report dated March 25, 2020)
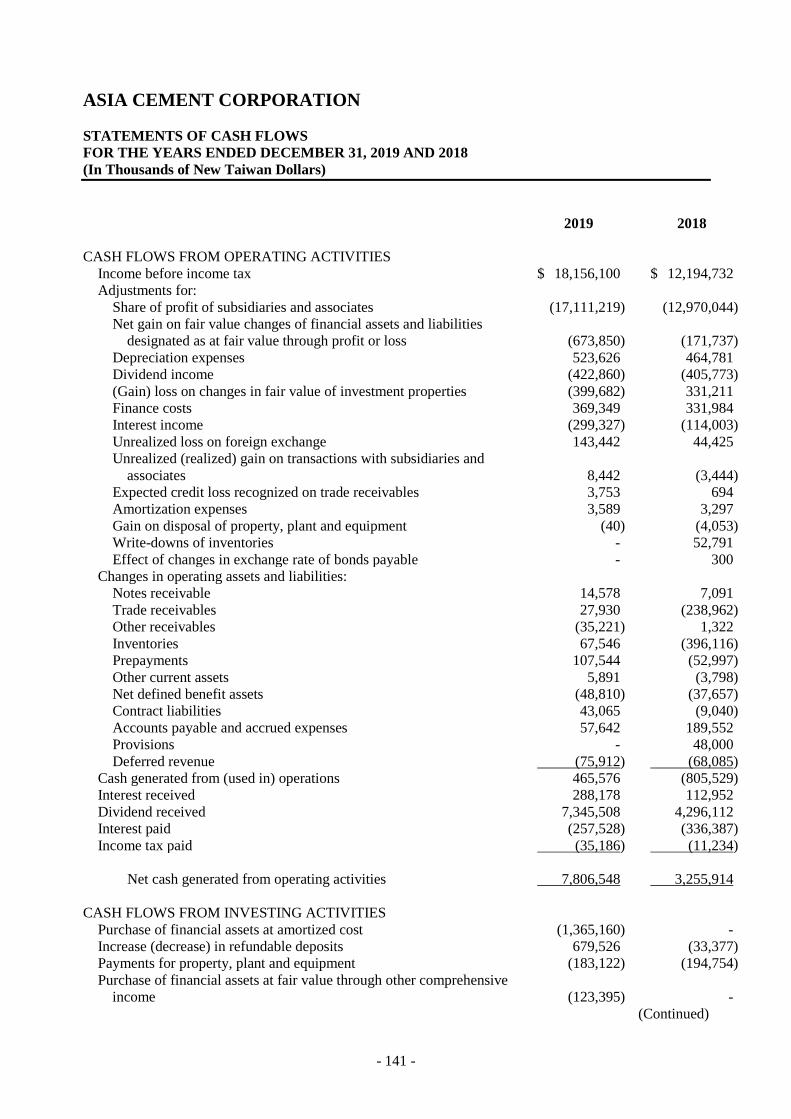
- 141 -
ASIA CEMENT CORPORATION STATEMENTS OF CASH FLOWS FOR THE YEARS ENDED DECEMBER 31, 2019 AND 2018 (In Thousands of New Taiwan Dollars) 2019 2018 CASH FLOWS FROM OPERATING ACTIVITIES
Income before income tax $ 18,156,100 $ 12,194,732 Adjustments for:
Share of profit of subsidiaries and associates (17,111,219) (12,970,044) Net gain on fair value changes of financial assets and liabilities
designated as at fair value through profit or loss (673,850) (171,737) Depreciation expenses 523,626 464,781 Dividend income (422,860) (405,773) (Gain) loss on changes in fair value of investment properties (399,682) 331,211 Finance costs 369,349 331,984 Interest income (299,327) (114,003) Unrealized loss on foreign exchange 143,442 44,425 Unrealized (realized) gain on transactions with subsidiaries and
associates 8,442 (3,444) Expected credit loss recognized on trade receivables 3,753 694 Amortization expenses 3,589 3,297 Gain on disposal of property, plant and equipment (40) (4,053) Write-downs of inventories - 52,791 Effect of changes in exchange rate of bonds payable - 300
Changes in operating assets and liabilities: Notes receivable 14,578 7,091 Trade receivables 27,930 (238,962) Other receivables (35,221) 1,322 Inventories 67,546 (396,116) Prepayments 107,544 (52,997) Other current assets 5,891 (3,798) Net defined benefit assets (48,810) (37,657) Contract liabilities 43,065 (9,040) Accounts payable and accrued expenses 57,642 189,552 Provisions - 48,000 Deferred revenue (75,912) (68,085)
Cash generated from (used in) operations 465,576 (805,529) Interest received 288,178 112,952 Dividend received 7,345,508 4,296,112 Interest paid (257,528) (336,387) Income tax paid (35,186) (11,234)
Net cash generated from operating activities 7,806,548 3,255,914
CASH FLOWS FROM INVESTING ACTIVITIES
Purchase of financial assets at amortized cost (1,365,160) - Increase (decrease) in refundable deposits 679,526 (33,377) Payments for property, plant and equipment (183,122) (194,754) Purchase of financial assets at fair value through other comprehensive
income (123,395) - (Continued)

- 142 -
ASIA CEMENT CORPORATION STATEMENTS OF CASH FLOWS FOR THE YEARS ENDED DECEMBER 31, 2019 AND 2018 (In Thousands of New Taiwan Dollars) 2019 2018
Payments for investment properties $ (24,834) $ (1,269) Payments for intangible assets (202) (2,693) Proceeds from disposal of property, plant and equipment 46 4,059 Proceeds from sale of financial assets at amortized cost - 2,096,122
Net cash (used in) generated from investing activities (1,017,141) 1,868,088
CASH FLOWS FROM FINANCING ACTIVITIES
Repayments of long-term borrowings (61,746,000) (18,588,000) Proceeds from long-term borrowings 58,508,000 15,033,000 Proceeds from issuance of bonds 10,000,000 6,574,843 Dividends paid (9,412,164) (4,033,715) Repayments of bonds (4,000,000) (4,089,430) (Decrease) increase in short-term bills payable (680,000) 2,310,000 Repayment of the principal portion of lease liabilities (86,929) - Decrease in guarantee deposits received (785) (1,010)
Net cash used in financing activities (7,417,878) (2,794,312)
EFFECTS OF EXCHANGE RATE CHANGES ON THE BALANCE
OF CASH AND CASH EQUIVALENTS HELD IN FOREIGN CURRENCIES (61,585) 20,179
NET (DECREASE) INCREASE IN CASH AND CASH
EQUIVALENTS (690,056) 2,349,869 CASH AND CASH EQUIVALENTS AT THE BEGINNING OF THE
YEAR 3,165,795 815,926 CASH AND CASH EQUIVALENTS AT THE END OF THE YEAR $ 2,475,739 $ 3,165,795 The accompanying notes are an integral part of the financial statements. (With Deloitte & Touche auditors’ report dated March 25, 2020) (Concluded)
※The Company and its affiliates have not experienced financial difficulties in the most recent fiscal year or during the current fiscal year up to the printing date of the annual report.

- 143 -
VII Analysis of Financial Status, Operating Result, and Risk
Management
7.1 Analysis of Financial Status UNIT: NT$1,000
Year Item 2018 2019
Variance Amount %
Current Assets 80,358,506 89,242,066 8,883,560 11 Property, Plant and Equipment 52,549,341 50,681,281 (1,868,060) (4)
Intangible Assets 3,694,783 7,000,317 3,305,534 89 Other Assets 142,585,368 150,354,848 7,769,480 5 Total Assets 279,187,998 297,278,512 18,090,514 6 Current Liabilities 62,804,294 74,335,619 11,531,325 18 Non-Current Liabilities 57,335,358 53,493,855 (3,841,503) (7) Total Liabilities 120,139,652 127,829,474 7,689,822 6 Equity Attributable To Owners Of The Corporation 137,892,226 146,067,358 8,175,132 6
Share Capital 33,614,472 33,614,472 - - Capital Surplus 1,362,554 1,456,054 93,500 7 Retained Earnings 99,918,986 108,564,355 8,645,369 9 Other Equity 2,996,214 2,432,477 (563,737) (19) Non-Controlling Interests 21,156,120 23,381,680 2,225,560 11 Total Equity 159,048,346 169,449,038 10,400,692 7 Analysis of deviation over 20%: 1. The increase of Intangible assets was mainly due to the increase of quarry right.

- 144 -
7.2 Analysis of Financial Performance
UNIT: NT$1,000
Year
Item 2018 2019
Variance
Amount %
Operating Revenue 82,741,004 89,347,637 6,606,633 8 Operating Costs 61,584,690 63,746,928 2,162,238 4 Gross Profit 21,156,314 25,600,709 4,444,395 21 Realized (Unrealized) Gross Profit 15,147 (14,392) (29,539) (195) Realized Gross Profit 21,171,461 25,586,317 4,414,856 21 Operating Expenses 3,018,351 3,523,141 504,790 17 Profit From Operations 18,153,110 22,063,176 3,910,066 22 Non-operating Income And Expenses 2,217,008 6,330,006 4,112,998 186 Income Before Income Tax 20,370,118 28,393,182 8,023,064 39 Income Tax Expense 5,480,921 6,149,229 668,308 12 Net Profit For The Year 14,889,197 22,243,953 7,354,756 49 Other Comprehensive Income , Net 1,436,173 (617,304) (2,053,477) (143) Total Comprehensive Income For The Year 16,325,370 21,626,649 5,301,279 32 Net Profit Attributable To Owner Of The Company 11,117,094 17,459,673 6,342,579 57 Net Profit Attributable To Non-Controlling Interests 3,772,103 4,784,280 1,012,177 27 Total Comprehensive Income Attributable To Owner Of The Company 12,811,353 17,652,536 4,841,183 38 Total Comprehensive Income Attributable To Non-Controlling Interests 3,514,017 3,974,113 460,096 13 1. Analysis of deviation over 20%:
(1).The increase of gross profit, realized gross profit and profit from operations were mainly due to the increase of average selling price of cement in mainland China in 2019.
(2).The decrease of the realized gross profit resulted from the transactions with affiliated companies in 2019.
(3).The increase of non-operating income was mainly due to the increase of investment income recognized under equity method, gain on fair value changes of financial assets and the decrease of net interest expense in 2019.
(4).The increase of the income before income tax and net profit for the year were mainly due to the profit increase of business in mainland China, investment income recognized under equity method, gain on fair value changes of financial assets in 2019.
(5).The decrease of net other comprehensive income was mainly due to the increase of exchange loss on translating the financial statements of foreign operations in 2019.
2. Expected sales volume in next one year and the reason for such expectation. The impact of such expectation on the Company’s financial situation and operational performances, and the
Company’s plan: Please refer to the “Letter to Shareholders”.

- 145 -
7.3 Analysis of Cash Flow (1)The Analysis for Changing of Cash Flow for 2019
Unit: NT$1,000
Cash Balance in the Beginning
Net Cash Inflows from Operating
Activities Total Cash Outflows
The Cash Surplus
Source of Funding for Negative Cash Balance Investing
Plans Financing
Plans 14,929,411 37,271,901 27,465,817 24,735,495 - -
1. Operating Activities: Mainly generated from operations NT$38,647,173 thousand and dividends received NT$4,062,869 thousand .
2. Investing Activities: Mostly for net increase in financial assets NT$8,990,814 thousand and net increase in property, plant and equipment NT$3,717,143 thousand.
3. Financing activities: Mostly for cash dividends paid NT$9,412,164 thousand.
(2)Remedy plans for insufficient liquidity for 2019:Not Applicable. (3)Liquidity Analysis for the Coming Year
Unit: NT$1,000
Cash Balance in the Beginning
Expected Net Cash Inflows from
Operating Activities Expected Total Cash Outflows
Expected Cash
Surplus
Expected Source of Funding for Negative Cash Balance Investing
Plans Financing
Plans 24,735,495 20,455,140 26,683,732 18,506,903 - -
1. Operating Activities:Mainly from operating income and cash dividends received. 2. Investing Activities:Primarily for investment in capital expenditures. 3. Financing activities: Mostly for net increase in short-term and long-term loans and payout of
cash dividends.
7.4 Impacts of Major Capital Expenditures on Finance and Operation
7.4.1 Major Capital Expenditures and Funding Sources UNIT: NT$1,000
Projects
Actual or Expected Source of Capital
Actual or Expected Date of Completion
Total Capital
Capital Expenditures
Actual Expected
2012~2018 2019 2020 2021 2022 2023
Installation constructions of new indoor coal bunker , stacker reclaimer and material conveyor system in Hualien plant
Self-owned capital
Dec. 2023 556,160 9,164 75 11,500 140,000 100,000 295,421
Chiahui Power natural gas fueled combined cycle power plant (Phase II Expansion)
Syndicated loan Dec. 2020 10,527,736 2,874,902 2,295,186 5,357,648 - - -

- 146 -
7.4.2 Expected Benefit to Finance and Operation from the Major Capital Expenditure
1. Installation constructions of new indoor coal bunker, stacker reclaimer and material
conveyor system in Hualien plant
(1) To prevent coal heaps from collapsing due to heavy rain, and the corresponding cost
from the damage to the machine and from rebuilding the coal heaps, and to ensure the
water discharge during the period is in compliance with the environmental regulations.
(2) To prevent coal from absorbing excessive water during the heavy rain, which could
cause some loss due to the reduction or interruption of clinker production.
2. After the completion of the natural gas fueled combined cycle power plant (Phase II
Expansion) of Chiahui Power, it will increase the stable profit every year.
7.5 Investment Strategies in the Most Recent Year, the Major Reasons for its
Gain or Loss and Improvement Plan and Investment Plans for Next Year
The majority of the Company’s investments were for long-term strategic purposes. In 2019,
the total gain through equity method by the company was NT$ 5,490,375 (on consolidated basis).
In the future, the Company will continue to focus on strategic purposes through prudent
assessment. 7.6 Analysis and Evaluation of Risk Management
7.6.1 The Impact of Fluctuation of Foreign Exchange, Interest Rates, and Inflation on the Company’s Profit and Loss and Its Countermeasures
※Foreign exchange impact:
The percentage of foreign exchange gains/losses over operating revenue and operating income in 2019 are as follows:
Unit:NT$1,000 Item \ Year 2019
Foreign Exchange Gains (Losses) (A) (260,069) Operating Revenue (B) 89,347,637 % of Operating Revenue (A)/(B) (0.3%) Operating Income (C) 22,063,176 % of Operating Income (A)/(C) (1.2%)
Foreign exchange rate fluctuates constantly because of the variation in market demand and supply. Thus, the risk of foreign exchange may occur to the Company by means of various trading. For the Company, most of the procurements of raw materials were disbursed in USD; foreign sales were collected in USD. Currently, the revenue mostly

- 147 -
equals to the disbursement, which led to the effect of natural hedge, minimizing the impact of fluctuation of foreign exchange on the Company’s profit and loss.
Besides natural hedge, in order to minimize the risk of foreign exchange, the Company and subsidiaries had adopted such risk management policies against the uncertainty.
1. Monitoring the impact to foreign exchange rate from global macro-economic change and building up a necessary hedge mechanism.
2. Planning future’s demand for currencies and establishing the foreign currency position from relatively lower level to reduce overall cost. Convert weak currencies to strong currencies.
※Interest rate impact:
The percentage of interest revenue/losses over operating revenue and operating income in 2019 are as follows:
Unit:NT$1,000 Item \ Year 2019
Interest Revenue (Losses) (A) (694,622) Operating Revenue (B) 89,347,637 % of Operating Revenue (A)/(B) (0.8%) Operating Income (C) 22,063,176 % of Operating Income (A)/(C) (3.1%)
If market interest rates had been 0.01% higher/lower, the group’s pretax profit for the year ended December 31, 2019 would have decreased/increased by NT$2,238 thousand, mainly due to the Group’s exposure to interest rates on its floating-rate bank borrowings and bank deposits’ interest revenue and expenses. The Company primarily utilizes short-term bank loans and issues long-term debt instruments to finance its short, mid, and long term funding demands. According to the terms and conditions of agreements entered with banks, short-term bank loan, subject to floating interest rate basis, can be utilized in revolving method within the duration of the agreements. Since the Company has been maintaining stable status operationally and financially, it is capable of obtaining relatively lower interest rate with aggressive negotiations with banks. Besides, the duration of utilizing short-term loan is less than one year. In a whole, the impact of the fluctuation of interest rates on the Company’s short-term loans is limited. In order to minimize the risk of interest rate, the Company and subsidiaries had adopted such risk management policies against the uncertainty: The Company mainly issues long-term and fixed interest rate debt instruments to lock relatively lower funding cost, which can reduce interest expense and impact of interest fluctuation, spare banks’ credit lines for temporary funding demand, replenish working

- 148 -
capital, and improve financial structure to comply with the principle for long-term sustainable operation.
※Inflation rate impact: Taiwan inflation rate was about 0.56% in 2019. This inflation rate did not have substantial effect on the Company’s operation and profit. In order to minimize the risk of inflation rate, the Company and subsidiaries maintained stable and long-term cooperative relationships with our major suppliers.
7.6.2 The Impact of Highly Risky Investments, Highly Leveraged Transaction, Loaning to Others, Endorsement and Guarantee for Others, and Derivatives
The Company has no highly risky and highly leveraged investments or loaning to others. The Company provided endorsement and guarantee for its subsidiaries according to
“Procedures for Endorsement and Guarantee”. Its balance was NT$25,561,342,000 and NT$ 26,333,392,000 by the end of 2019 and the end of March 2020 respectively. Based on conservative operating policy, the operations of its subsidiaries bring considerable income to the Company. Besides that, the Company supervises its subsidiaries regularly and controls related risks.
The financial transactions with “derivative” nature which the Company entered into were strictly for hedging purposes and not for any trading or speculative purposes. To control various types of financial trading risks, the Company has established internal policies and procedures based on sound financial and business practices, and in compliance with the relevant rules and regulations issued by the Taiwan Securities and Futures Bureau. The Company entered into USD/TWD CCS transactions and its balance was NT$6,634,450,000 (fair value was NT$6,604,104,000) by the end of 2019, and NT$ 6,634,450,000 (fair value was NT$6,664,717,000) by the end of March 2020. 7.6.3 The Prevention of Legal Risks
In view of current company’s operations, in addition to compliance with laws and regulations, there are many different areas involved in the legal norms, such as dealing with other companies, government agency, stakeholders, employees, and other foreign-related cases. Preventing legal risks shall be the first priority in today’s business operators
In response to this situation, the Company asks those who majored in law to be in charge of the Secretarial Department. Besides, the Company teaches and requires every employee to comply with every regulation in daily operations. The Company also cooperates with the Group’s legal department to handle labor, general affairs, sales, factory management, taxation and other issues. Lawyers and accountants would be consulted if necessary. These could ensure legal risks reduced to maintain the Company's interests.
◎R&D project and estimated expenditures in the future: Unit: NT$1,000

- 149 -
Item Amount 1 Development of Weighing System in Hualien Plant 800 2 Industry 4.0 Phase 3 Project: Smart Occupational Safety, Data Analysis
Applied to Production, Quality Control, and Segment Cost Analysis 9,000
3 Establish a systematic observation and analysis method of cement and clinker to introduce routine control 1,500
4 Technology for improving the ability of using alternative materials for circular economy 50,400
5 Replacing No. 2 kiln PLC system equipment 6,000 6 Renewal of PLC system equipment for packaging and shipping 2,800 Total 70,500
◎Effect on the Company’s finance and operation from any changes in major policies and laws at home and abroad in the most recent fiscal year: None.
◎Effect on the Company's finance and operation due to the technological improvement and the change of industrial environment in the most recent fiscal year: None.
◎Events influencing the Company's corporate image in the most recent fiscal year: None.
◎Merger or acquisition plan in the most recent fiscal year: None.
◎Plan of expanding capacity in the most recent fiscal year: None.
◎Supply and sale of the Company in the most recent fiscal year: Normal and steady.
◎Large volume shares transferred or changed by directors, supervisors, or shareholders with more than 10% shareholdings in the most recent fiscal year: None.
◎Change of the Company’s management in the most recent fiscal year: None.
◎Litigation, non-litigation incidents or administrative disputes of directors, supervisors, president, shareholders with more than 10% shareholdings, or subsidiaries which could materially affect shareholders' equity or the prices of the Company's securities: None.
◎Other major risks: None.
7.7 Other Mentionable Issues
: None.
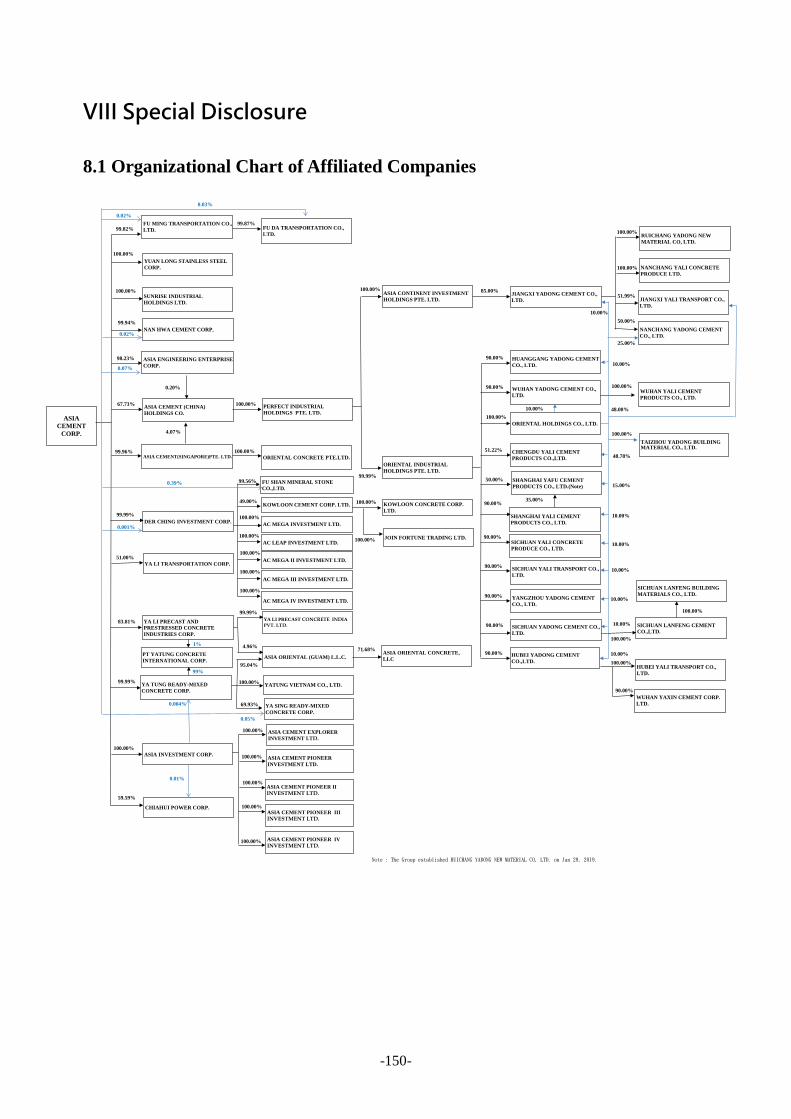
-150-
VIII Special Disclosure
8.1 Organizational Chart of Affiliated Companies
Note : The Group established RUICHANG YADONG NEW MATERIAL CO, LTD. on Jan 29, 2019.
SHANGHAI YAFU CEMENT PRODUCTS CO., LTD.(Note)
SHANGHAI YALI CEMENT PRODUCTS CO., LTD.
90.00%
50.00% 15.00%
10.00%
100.00%
99.56%
DER CHING INVESTMENT CORP.99.99%
FU SHAN MINERAL STONE CO.,LTD.
KOWLOON CONCRETE CORP. LTD.
KOWLOON CEMENT CORP. LTD.49.00%
90.00%
90.00%
51.22%
100.00%
99.87%
ASIA CEMENT
CORP.
SUNRISE INDUSTRIAL HOLDINGS LTD.
100.00%
YA LI PRECAST ANDPRESTRESSED CONCRETE INDUSTRIES CORP.
83.81% SICHUAN YADONG CEMENT CO., LTD.
90.00%
CHIAHUI POWER CORP.
ASIA CEMENT PIONEER INVESTMENT LTD.
59.59%
100.00%
99.82%
ASIA INVESTMENT CORP.100.00%
NAN HWA CEMENT CORP.99.94%
98.23%
100.00%
ASIA CEMENT (CHINA) HOLDINGS CO.
4.07%
67.73%
99.96%
PERFECT INDUSTRIAL HOLDINGS PTE. LTD.
ASIA CONTINENT INVESTMENT HOLDINGS PTE. LTD.
100.00% JIANGXI YADONG CEMENT CO.,LTD. JIANGXI YALI TRANSPORT CO.,
LTD.
85.00%
ORIENTAL INDUSTRIAL HOLDINGS PTE. LTD.
99.99%
WUHAN YADONG CEMENT CO., LTD.
ORIENTAL HOLDINGS CO., LTD.
NANCHANG YADONG CEMENT CO., LTD.
NANCHANG YALI CONCRETE PRODUCE LTD.
90.00%
100.00% 10.00%
25.00%
90.00% HUBEI YADONG CEMENT CO.,LTD.
48.00%
10.00%
0.01%
SICHUAN YALI TRANSPORT CO., LTD.
SICHUAN YALI CONCRETE PRODUCE CO., LTD.
10.00%
YANGZHOU YADONG CEMENT CO., LTD.
90.00%
10.00%
HUBEI YALI TRANSPORT CO., LTD.
HUANGGANG YADONG CEMENT CO., LTD.
CHENGDU YALI CEMENT PRODUCTS CO.,LTD. 48.78%
90.00%
35.00%
10.00%
10.00%
10.00%
51.99%
100.00%
50.00%
WUHAN YALI CEMENT PRODUCTS CO., LTD.
100.00%
10.00%
YUAN LONG STAINLESS STEEL CORP.
100.00%
YA LI PRECAST CONCRETE INDIA PVT. LTD.
99.99%
ASIA CEMENT EXPLORER INVESTMENT LTD.
100.00%
95.04%
YA SING READY-MIXED CONCRETE CORP.
YA TUNG READY-MIXED CONCRETE CORP.
99.99% YATUNG VIETNAM CO., LTD.
69.93% WUHAN YAXIN CEMENT CORP. LTD.
90.00%
100.00%
100.00%
ASIA ORIENTAL (GUAM) L.L.C.
4.96%
AC MEGA INVESTMENT LTD.
AC LEAP INVESTMENT LTD.
100.00%
100.00%
AC MEGA II INVESTMENT LTD.
AC MEGA III INVESTMENT LTD.
AC MEGA IV INVESTMENT LTD.
100.00%
100.00%
100.00%
ASIA CEMENT PIONEER II INVESTMENT LTD.
100.00% ASIA CEMENT PIONEER III INVESTMENT LTD.
100.00%
FU DA TRANSPORTATION CO., LTD.
FU MING TRANSPORTATION CO., LTD.
ASIA ENGINEERING ENTERPRISE CORP.
0.03%
0.02%
0.02%
0.20%
ASIA CEMENT(SINGAPORE)PTE. LTD. ORIENTAL CONCRETE PTE.LTD.
0.39%
0.05%
0.001%
ASIA CEMENT PIONEER IVINVESTMENT LTD.
100.00%
JOIN FORTUNE TRADING LTD.100.00%
TAIZHOU YADONG BUILDING MATERIAL CO., LTD.
100.00%
0.07%
YA LI TRANSPORTATION CORP.51.00%
ASIA ORIENTAL CONCRETE, LLC
71.68%
SICHUAN LANFENG CEMENT CO.,LTD.
SICHUAN LANFENG BUILDING MATERIALS CO., LTD.
100.00%
100.00%
0.004%
PT YATUNG CONCRETE INTERNATIONAL CORP.
1%
99%
100.00% RUICHANG YADONG NEWMATERIAL CO, LTD.
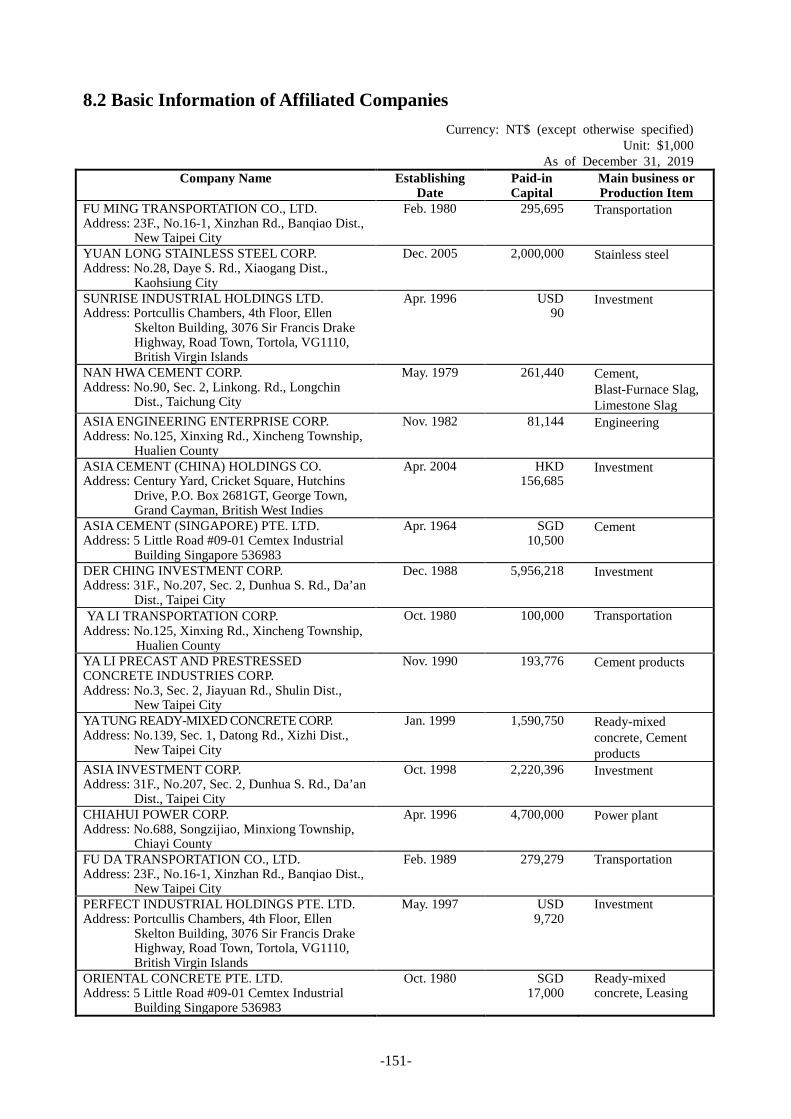
-151-
8.2 Basic Information of Affiliated Companies Currency: NT$ (except otherwise specified)
Unit: $1,000 As of December 31, 2019
Company Name Establishing Date
Paid-in Capital
Main business or Production Item
FU MING TRANSPORTATION CO., LTD. Address: 23F., No.16-1, Xinzhan Rd., Banqiao Dist.,
New Taipei City
Feb. 1980 295,695 Transportation
YUAN LONG STAINLESS STEEL CORP. Address: No.28, Daye S. Rd., Xiaogang Dist.,
Kaohsiung City
Dec. 2005 2,000,000 Stainless steel
SUNRISE INDUSTRIAL HOLDINGS LTD. Address: Portcullis Chambers, 4th Floor, Ellen
Skelton Building, 3076 Sir Francis Drake Highway, Road Town, Tortola, VG1110, British Virgin Islands
Apr. 1996 USD 90
Investment
NAN HWA CEMENT CORP. Address: No.90, Sec. 2, Linkong. Rd., Longchin
Dist., Taichung City
May. 1979 261,440 Cement, Blast-Furnace Slag, Limestone Slag
ASIA ENGINEERING ENTERPRISE CORP. Address: No.125, Xinxing Rd., Xincheng Township,
Hualien County
Nov. 1982 81,144 Engineering
ASIA CEMENT (CHINA) HOLDINGS CO. Address: Century Yard, Cricket Square, Hutchins
Drive, P.O. Box 2681GT, George Town, Grand Cayman, British West Indies
Apr. 2004 HKD 156,685
Investment
ASIA CEMENT (SINGAPORE) PTE. LTD. Address: 5 Little Road #09-01 Cemtex Industrial
Building Singapore 536983
Apr. 1964 SGD 10,500
Cement
DER CHING INVESTMENT CORP. Address: 31F., No.207, Sec. 2, Dunhua S. Rd., Da’an
Dist., Taipei City
Dec. 1988 5,956,218 Investment
YA LI TRANSPORTATION CORP. Address: No.125, Xinxing Rd., Xincheng Township,
Hualien County
Oct. 1980 100,000 Transportation
YA LI PRECAST AND PRESTRESSED CONCRETE INDUSTRIES CORP. Address: No.3, Sec. 2, Jiayuan Rd., Shulin Dist.,
New Taipei City
Nov. 1990 193,776 Cement products
YA TUNG READY-MIXED CONCRETE CORP. Address: No.139, Sec. 1, Datong Rd., Xizhi Dist.,
New Taipei City
Jan. 1999 1,590,750 Ready-mixed concrete, Cement products
ASIA INVESTMENT CORP. Address: 31F., No.207, Sec. 2, Dunhua S. Rd., Da’an
Dist., Taipei City
Oct. 1998 2,220,396 Investment
CHIAHUI POWER CORP. Address: No.688, Songzijiao, Minxiong Township,
Chiayi County
Apr. 1996 4,700,000 Power plant
FU DA TRANSPORTATION CO., LTD. Address: 23F., No.16-1, Xinzhan Rd., Banqiao Dist.,
New Taipei City
Feb. 1989 279,279 Transportation
PERFECT INDUSTRIAL HOLDINGS PTE. LTD. Address: Portcullis Chambers, 4th Floor, Ellen
Skelton Building, 3076 Sir Francis Drake Highway, Road Town, Tortola, VG1110, British Virgin Islands
May. 1997 USD 9,720
Investment
ORIENTAL CONCRETE PTE. LTD. Address: 5 Little Road #09-01 Cemtex Industrial
Building Singapore 536983
Oct. 1980 SGD 17,000
Ready-mixed concrete, Leasing
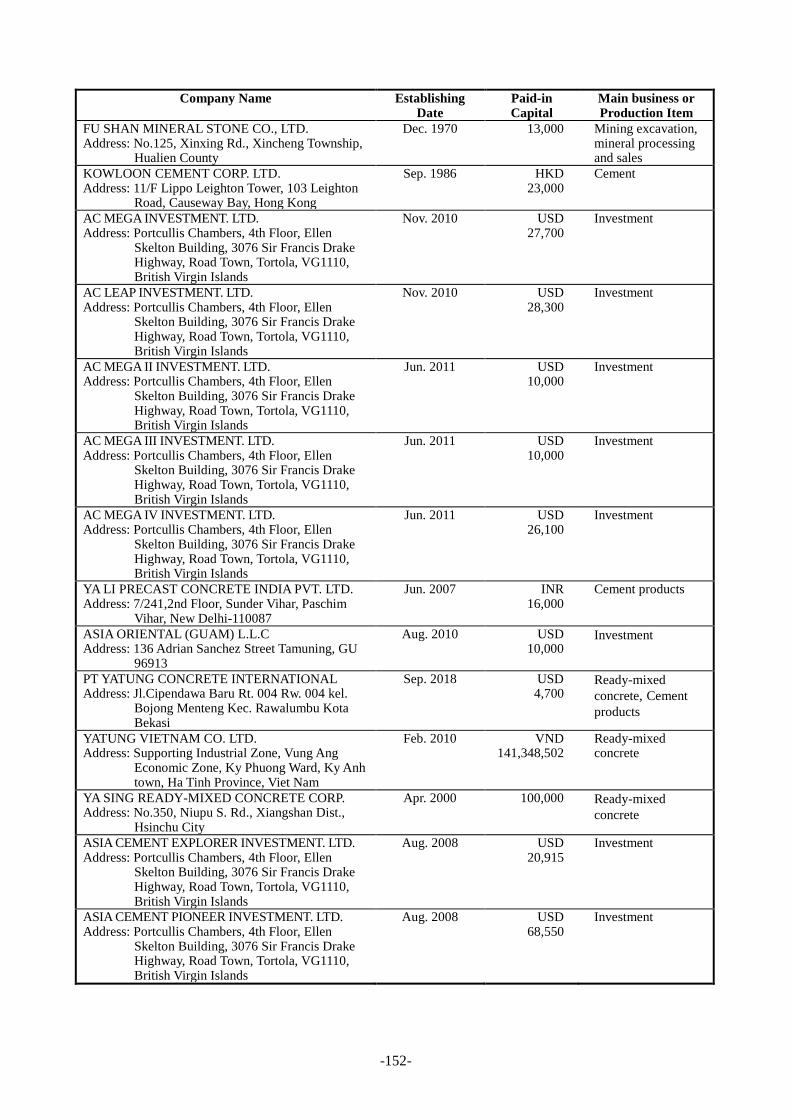
-152-
Company Name Establishing Date
Paid-in Capital
Main business or Production Item
FU SHAN MINERAL STONE CO., LTD. Address: No.125, Xinxing Rd., Xincheng Township,
Hualien County
Dec. 1970 13,000 Mining excavation, mineral processing and sales
KOWLOON CEMENT CORP. LTD. Address: 11/F Lippo Leighton Tower, 103 Leighton
Road, Causeway Bay, Hong Kong
Sep. 1986 HKD 23,000
Cement
AC MEGA INVESTMENT. LTD. Address: Portcullis Chambers, 4th Floor, Ellen
Skelton Building, 3076 Sir Francis Drake Highway, Road Town, Tortola, VG1110, British Virgin Islands
Nov. 2010 USD 27,700
Investment
AC LEAP INVESTMENT. LTD. Address: Portcullis Chambers, 4th Floor, Ellen
Skelton Building, 3076 Sir Francis Drake Highway, Road Town, Tortola, VG1110, British Virgin Islands
Nov. 2010 USD 28,300
Investment
AC MEGA II INVESTMENT. LTD. Address: Portcullis Chambers, 4th Floor, Ellen
Skelton Building, 3076 Sir Francis Drake Highway, Road Town, Tortola, VG1110, British Virgin Islands
Jun. 2011 USD 10,000
Investment
AC MEGA III INVESTMENT. LTD. Address: Portcullis Chambers, 4th Floor, Ellen
Skelton Building, 3076 Sir Francis Drake Highway, Road Town, Tortola, VG1110, British Virgin Islands
Jun. 2011 USD 10,000
Investment
AC MEGA IV INVESTMENT. LTD. Address: Portcullis Chambers, 4th Floor, Ellen
Skelton Building, 3076 Sir Francis Drake Highway, Road Town, Tortola, VG1110, British Virgin Islands
Jun. 2011 USD 26,100
Investment
YA LI PRECAST CONCRETE INDIA PVT. LTD. Address: 7/241,2nd Floor, Sunder Vihar, Paschim
Vihar, New Delhi-110087
Jun. 2007 INR 16,000
Cement products
ASIA ORIENTAL (GUAM) L.L.C Address: 136 Adrian Sanchez Street Tamuning, GU
96913
Aug. 2010 USD 10,000
Investment
PT YATUNG CONCRETE INTERNATIONAL Address: Jl.Cipendawa Baru Rt. 004 Rw. 004 kel.
Bojong Menteng Kec. Rawalumbu Kota Bekasi
Sep. 2018 USD 4,700
Ready-mixed concrete, Cement products
YATUNG VIETNAM CO. LTD. Address: Supporting Industrial Zone, Vung Ang
Economic Zone, Ky Phuong Ward, Ky Anh town, Ha Tinh Province, Viet Nam
Feb. 2010 VND 141,348,502
Ready-mixed concrete
YA SING READY-MIXED CONCRETE CORP. Address: No.350, Niupu S. Rd., Xiangshan Dist.,
Hsinchu City
Apr. 2000 100,000 Ready-mixed concrete
ASIA CEMENT EXPLORER INVESTMENT. LTD. Address: Portcullis Chambers, 4th Floor, Ellen
Skelton Building, 3076 Sir Francis Drake Highway, Road Town, Tortola, VG1110, British Virgin Islands
Aug. 2008 USD 20,915
Investment
ASIA CEMENT PIONEER INVESTMENT. LTD. Address: Portcullis Chambers, 4th Floor, Ellen
Skelton Building, 3076 Sir Francis Drake Highway, Road Town, Tortola, VG1110, British Virgin Islands
Aug. 2008 USD 68,550
Investment

-153-
Company Name Establishing Date
Paid-in Capital
Main business or Production Item
ASIA CEMENT PIONEER II INVESTMENT. LTD. Address: Portcullis Chambers, 4th Floor, Ellen
Skelton Building, 3076 Sir Francis Drake Highway, Road Town, Tortola, VG1110, British Virgin Islands
Jun. 2011 USD 28,000
Investment
ASIA CEMENT PIONEER III INVESTMENT. LTD. Address: Portcullis Chambers, 4th Floor, Ellen
Skelton Building, 3076 Sir Francis Drake Highway, Road Town, Tortola, VG1110, British Virgin Islands
Jun. 2011 USD 19,500
Investment
ASIA CEMENT PIONEER IV INVESTMENT. LTD. Address: Portcullis Chambers, 4th Floor, Ellen
Skelton Building, 3076 Sir Francis Drake Highway, Road Town, Tortola, VG1110, British Virgin Islands
Jun. 2011 USD 19,010
Investment
ASIA CONTINENT INVESTMENT HOLDINGS PTE. LTD. Address: 5 Little Road #09-01 Cemtex Industrial
Building Singapore 536983
Apr. 1995 USD 288,847
Investment
ORIENTAL INDUSTRIAL HOLDINGS PTE. LTD Address: 5 Little Road #09-01 Cemtex Industrial
Building Singapore 536983
May. 1994 USD 837,744
Investment
KOWLOON CONCRETE CORP. LTD. Address: 11/F Lippo Leighton Tower, 103 Leighton
Road, Causeway Bay, Hong Kong
Mar. 1992 HKD 10
Ready-mixed concrete, Barges
JOIN FORTUNE TRADING LTD Address: 263 MAIN STREET, ROAD TOWN, TORTOLA, BRITISH VIRGIN ISLANDS
Jul. 2012 USD 2,980
Investment
ASIA ORIENTAL CONCRETE,LLC Address: 136 Adrian Sanchez Street Tamuning,
GU 96913
Mar. 2011 USD 11,600
Ready-mixed concrete, Cement products
JIANGXI YADONG CEMENT CO., LTD. Address: No.6, Yadong Road, Ma-Tou Town, Rui
Chang City, Jiangxi Province, China
Oct. 1997 USD 356,104
Cement, Clinker, Blast-Furnace Slag, Cement products
HUANGGANG YADONG CEMENT CO., LTD. Address: 5 Tiyu Avenue,Huangzhou Zone,
Huanggang City, Hubei Province, China
Aug. 2006 USD 86,170
Cement, Clinker, Blast-Furnace Slag, Cement products
WUHAN YADONG CEMENT CO., LTD. Address: Cihui Avenue, Wujiashan Taiwan Business
Investment Zone, Dongxihu, Wuhan, China
Nov. 1999 USD 36,140
Cement Grinding, Blast-Furnace Slag
ORIENTAL HOLDINGS CO., LTD. Address: Room 305A,No 2875,South Yanggao Rd,
Pudong New Area, Shanghai
Jul. 2003 USD 204,188
Investment
CHENGDU YALI CEMENT PRODUCTS CO., LTD. Address: No.68 AnPeng Road, Tianpeng Town,
Pengzhou, Chengdu City, Sichuan, China
Dec. 2004 USD 4,100
Ready-mixed concrete, Cement products
SHANGHAI YALI CEMENT PRODUCTS CO., LTD. Address: No.3000 Longwu Road Minhang
Shanghai China
Nov. 1995 USD 15,000
Ready-mixed concrete, Cement products
SICHUAN YALI CONCRETE PRODUCE CO., LTD. Address: No.268,Three Passage,Wenquan Road
Wenjiang District,Chendu City,Sichuan,China
Nov. 2005 USD 3,300
Ready-mixed concrete, Cement products
SICHUAN YALI TRANSPORT CO., LTD. Address: No.68 AnPeng Road, Tianpeng Town,
Pengzhou, Chengdu City, Sichuan, China
May. 2006 USD 3,500
Transportation
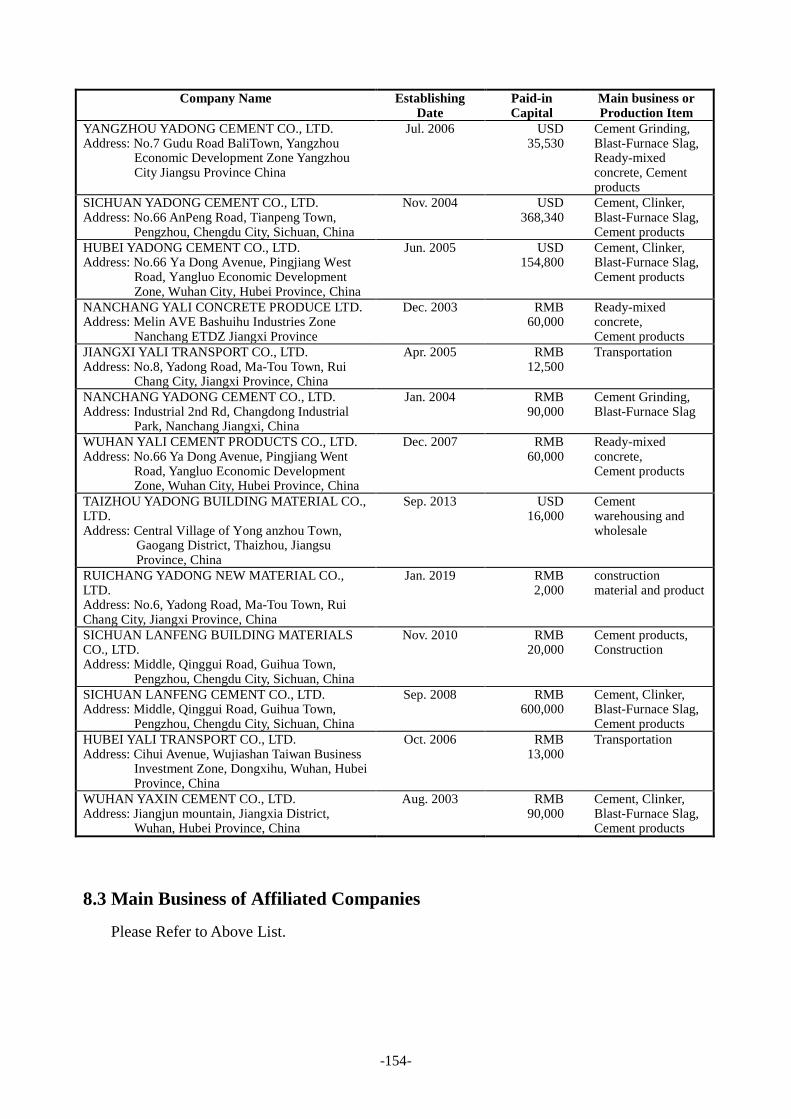
-154-
Company Name Establishing Date
Paid-in Capital
Main business or Production Item
YANGZHOU YADONG CEMENT CO., LTD. Address: No.7 Gudu Road BaliTown, Yangzhou
Economic Development Zone Yangzhou City Jiangsu Province China
Jul. 2006 USD 35,530
Cement Grinding, Blast-Furnace Slag, Ready-mixed concrete, Cement products
SICHUAN YADONG CEMENT CO., LTD. Address: No.66 AnPeng Road, Tianpeng Town,
Pengzhou, Chengdu City, Sichuan, China
Nov. 2004 USD 368,340
Cement, Clinker, Blast-Furnace Slag, Cement products
HUBEI YADONG CEMENT CO., LTD. Address: No.66 Ya Dong Avenue, Pingjiang West
Road, Yangluo Economic Development Zone, Wuhan City, Hubei Province, China
Jun. 2005 USD 154,800
Cement, Clinker, Blast-Furnace Slag, Cement products
NANCHANG YALI CONCRETE PRODUCE LTD. Address: Melin AVE Bashuihu Industries Zone
Nanchang ETDZ Jiangxi Province
Dec. 2003 RMB 60,000
Ready-mixed concrete, Cement products
JIANGXI YALI TRANSPORT CO., LTD. Address: No.8, Yadong Road, Ma-Tou Town, Rui
Chang City, Jiangxi Province, China
Apr. 2005 RMB 12,500
Transportation
NANCHANG YADONG CEMENT CO., LTD. Address: Industrial 2nd Rd, Changdong Industrial
Park, Nanchang Jiangxi, China
Jan. 2004 RMB 90,000
Cement Grinding, Blast-Furnace Slag
WUHAN YALI CEMENT PRODUCTS CO., LTD. Address: No.66 Ya Dong Avenue, Pingjiang Went
Road, Yangluo Economic Development Zone, Wuhan City, Hubei Province, China
Dec. 2007 RMB 60,000
Ready-mixed concrete, Cement products
TAIZHOU YADONG BUILDING MATERIAL CO., LTD. Address: Central Village of Yong anzhou Town, Gaogang District, Thaizhou, Jiangsu Province, China
Sep. 2013 USD 16,000
Cement warehousing and wholesale
RUICHANG YADONG NEW MATERIAL CO., LTD. Address: No.6, Yadong Road, Ma-Tou Town, Rui Chang City, Jiangxi Province, China
Jan. 2019 RMB 2,000
construction material and product
SICHUAN LANFENG BUILDING MATERIALS CO., LTD. Address: Middle, Qinggui Road, Guihua Town,
Pengzhou, Chengdu City, Sichuan, China
Nov. 2010 RMB 20,000
Cement products, Construction
SICHUAN LANFENG CEMENT CO., LTD. Address: Middle, Qinggui Road, Guihua Town,
Pengzhou, Chengdu City, Sichuan, China
Sep. 2008 RMB 600,000
Cement, Clinker, Blast-Furnace Slag, Cement products
HUBEI YALI TRANSPORT CO., LTD. Address: Cihui Avenue, Wujiashan Taiwan Business
Investment Zone, Dongxihu, Wuhan, Hubei Province, China
Oct. 2006 RMB 13,000
Transportation
WUHAN YAXIN CEMENT CO., LTD. Address: Jiangjun mountain, Jiangxia District,
Wuhan, Hubei Province, China
Aug. 2003 RMB 90,000
Cement, Clinker, Blast-Furnace Slag, Cement products
8.3 Main Business of Affiliated Companies
Please Refer to Above List.
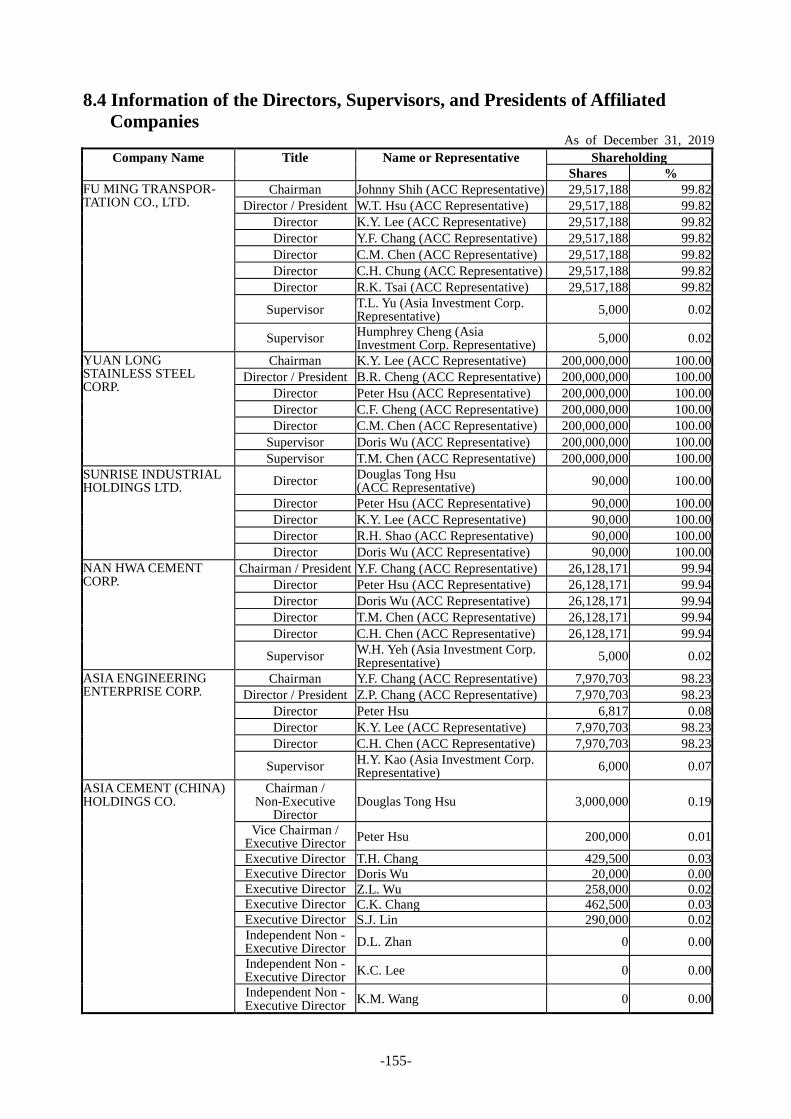
-155-
8.4 Information of the Directors, Supervisors, and Presidents of Affiliated Companies
As of December 31, 2019 Company Name Title Name or Representative Shareholding
Shares % FU MING TRANSPOR- TATION CO., LTD.
Chairman Johnny Shih (ACC Representative) 29,517,188 99.82 Director / President W.T. Hsu (ACC Representative) 29,517,188 99.82
Director K.Y. Lee (ACC Representative) 29,517,188 99.82 Director Y.F. Chang (ACC Representative) 29,517,188 99.82 Director C.M. Chen (ACC Representative) 29,517,188 99.82 Director C.H. Chung (ACC Representative) 29,517,188 99.82 Director R.K. Tsai (ACC Representative) 29,517,188 99.82
Supervisor T.L. Yu (Asia Investment Corp. Representative) 5,000 0.02
Supervisor Humphrey Cheng (Asia Investment Corp. Representative) 5,000 0.02
YUAN LONG STAINLESS STEEL CORP.
Chairman K.Y. Lee (ACC Representative) 200,000,000 100.00 Director / President B.R. Cheng (ACC Representative) 200,000,000 100.00
Director Peter Hsu (ACC Representative) 200,000,000 100.00 Director C.F. Cheng (ACC Representative) 200,000,000 100.00 Director C.M. Chen (ACC Representative) 200,000,000 100.00
Supervisor Doris Wu (ACC Representative) 200,000,000 100.00 Supervisor T.M. Chen (ACC Representative) 200,000,000 100.00
SUNRISE INDUSTRIAL HOLDINGS LTD. Director Douglas Tong Hsu
(ACC Representative) 90,000 100.00
Director Peter Hsu (ACC Representative) 90,000 100.00 Director K.Y. Lee (ACC Representative) 90,000 100.00 Director R.H. Shao (ACC Representative) 90,000 100.00 Director Doris Wu (ACC Representative) 90,000 100.00
NAN HWA CEMENT CORP.
Chairman / President Y.F. Chang (ACC Representative) 26,128,171 99.94 Director Peter Hsu (ACC Representative) 26,128,171 99.94 Director Doris Wu (ACC Representative) 26,128,171 99.94 Director T.M. Chen (ACC Representative) 26,128,171 99.94 Director C.H. Chen (ACC Representative) 26,128,171 99.94
Supervisor W.H. Yeh (Asia Investment Corp. Representative) 5,000 0.02
ASIA ENGINEERING ENTERPRISE CORP.
Chairman Y.F. Chang (ACC Representative) 7,970,703 98.23 Director / President Z.P. Chang (ACC Representative) 7,970,703 98.23
Director Peter Hsu 6,817 0.08 Director K.Y. Lee (ACC Representative) 7,970,703 98.23 Director C.H. Chen (ACC Representative) 7,970,703 98.23
Supervisor H.Y. Kao (Asia Investment Corp. Representative) 6,000 0.07
ASIA CEMENT (CHINA) HOLDINGS CO.
Chairman / Non-Executive
Director Douglas Tong Hsu 3,000,000 0.19
Vice Chairman / Executive Director Peter Hsu 200,000 0.01
Executive Director T.H. Chang 429,500 0.03 Executive Director Doris Wu 20,000 0.00 Executive Director Z.L. Wu 258,000 0.02 Executive Director C.K. Chang 462,500 0.03 Executive Director S.J. Lin 290,000 0.02 Independent Non - Executive Director D.L. Zhan 0 0.00 Independent Non - Executive Director K.C. Lee 0 0.00 Independent Non - Executive Director K.M. Wang 0 0.00
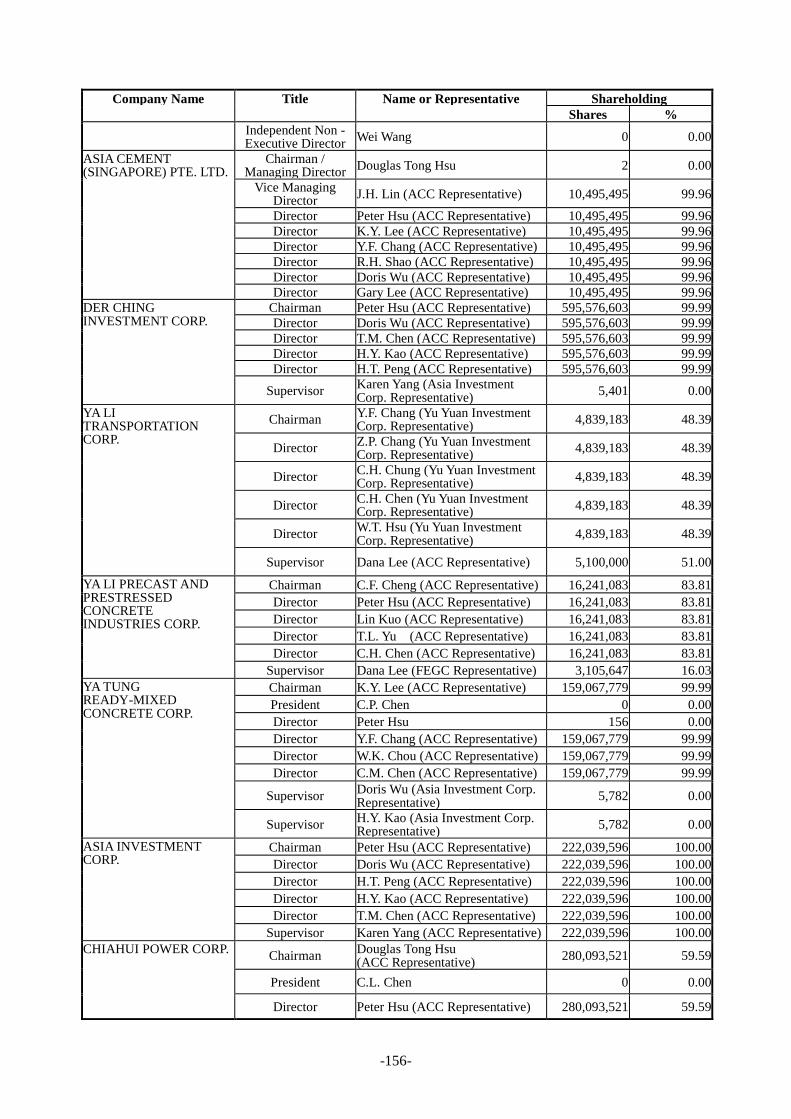
-156-
Company Name Title Name or Representative Shareholding Shares %
Independent Non - Executive Director Wei Wang 0 0.00
ASIA CEMENT (SINGAPORE) PTE. LTD.
Chairman / Managing Director Douglas Tong Hsu 2 0.00
Vice Managing Director J.H. Lin (ACC Representative) 10,495,495 99.96 Director Peter Hsu (ACC Representative) 10,495,495 99.96 Director K.Y. Lee (ACC Representative) 10,495,495 99.96 Director Y.F. Chang (ACC Representative) 10,495,495 99.96 Director R.H. Shao (ACC Representative) 10,495,495 99.96 Director Doris Wu (ACC Representative) 10,495,495 99.96 Director Gary Lee (ACC Representative) 10,495,495 99.96
DER CHING INVESTMENT CORP.
Chairman Peter Hsu (ACC Representative) 595,576,603 99.99 Director Doris Wu (ACC Representative) 595,576,603 99.99 Director T.M. Chen (ACC Representative) 595,576,603 99.99 Director H.Y. Kao (ACC Representative) 595,576,603 99.99 Director H.T. Peng (ACC Representative) 595,576,603 99.99
Supervisor Karen Yang (Asia Investment Corp. Representative) 5,401 0.00
YA LI TRANSPORTATION CORP.
Chairman Y.F. Chang (Yu Yuan Investment Corp. Representative) 4,839,183 48.39
Director Z.P. Chang (Yu Yuan Investment Corp. Representative) 4,839,183 48.39
Director C.H. Chung (Yu Yuan Investment Corp. Representative) 4,839,183 48.39
Director C.H. Chen (Yu Yuan Investment Corp. Representative) 4,839,183 48.39
Director W.T. Hsu (Yu Yuan Investment Corp. Representative) 4,839,183 48.39
Supervisor Dana Lee (ACC Representative) 5,100,000 51.00 YA LI PRECAST AND PRESTRESSED CONCRETE INDUSTRIES CORP.
Chairman C.F. Cheng (ACC Representative) 16,241,083 83.81 Director Peter Hsu (ACC Representative) 16,241,083 83.81 Director Lin Kuo (ACC Representative) 16,241,083 83.81 Director T.L. Yu (ACC Representative) 16,241,083 83.81 Director C.H. Chen (ACC Representative) 16,241,083 83.81
Supervisor Dana Lee (FEGC Representative) 3,105,647 16.03 YA TUNG READY-MIXED CONCRETE CORP.
Chairman K.Y. Lee (ACC Representative) 159,067,779 99.99 President C.P. Chen 0 0.00 Director Peter Hsu 156 0.00 Director Y.F. Chang (ACC Representative) 159,067,779 99.99 Director W.K. Chou (ACC Representative) 159,067,779 99.99 Director C.M. Chen (ACC Representative) 159,067,779 99.99
Supervisor Doris Wu (Asia Investment Corp. Representative) 5,782 0.00
Supervisor H.Y. Kao (Asia Investment Corp. Representative) 5,782 0.00
ASIA INVESTMENT CORP.
Chairman Peter Hsu (ACC Representative) 222,039,596 100.00 Director Doris Wu (ACC Representative) 222,039,596 100.00 Director H.T. Peng (ACC Representative) 222,039,596 100.00 Director H.Y. Kao (ACC Representative) 222,039,596 100.00 Director T.M. Chen (ACC Representative) 222,039,596 100.00
Supervisor Karen Yang (ACC Representative) 222,039,596 100.00 CHIAHUI POWER CORP. Chairman Douglas Tong Hsu
(ACC Representative) 280,093,521 59.59
President C.L. Chen 0 0.00
Director Peter Hsu (ACC Representative) 280,093,521 59.59

-157-
Company Name Title Name or Representative Shareholding Shares %
Director K.Y. Lee (ACC Representative) 280,093,521 59.59
Director Michihide Kita (J-Power Investment Netherlands B.V. Representative)
187,854,807 39.97
Director Takashi Jahana (J-Power Investment Netherlands B.V. Representative)
187,854,807 39.97
Independent Director S.Y. Su 0 0.00
Independent Director M.Z. Jiang 0 0.00
Supervisor Doris Wu (Asia Investment Corp. Representative) 37,574 0.01
Supervisor W.H. Yeh (Asia Investment Corp. Representative) 37,574 0.01
FU DA TRANSPORTATION CO., LTD.
Chairman Johnny Shih (Fu Ming Transportation Co., Ltd. Representative)
27,892,834 99.87
Director / President W.T. Hsu (Fu Ming Transportation Co., Ltd. Representative)
27,892,834 99.87
Director K.Y. Lee (Fu Ming Transportation Co., Ltd. Representative)
27,892,834 99.87
Director Y.F. Chang (Fu Ming Transportation Co., Ltd. Representative)
27,892,834 99.87
Director Y.X. Wu (Fu Ming Transportation Co., Ltd. Representative)
27,892,834 99.87
Director Humphrey Cheng (Fu Ming Transportation Co., Ltd. Representative)
27,892,834 99.87
Supervisor R.K. Tsai (Asia Investment Corp. Representative) 7,145 0.03
Supervisor C.M. Shi (Asia Investment Corp. Representative) 7,145 0.03
PERFECT INDUSTRIAL HOLDINGS PTE. LTD.
Director Douglas Tong Hsu 0 0.00 Director Doris Wu 0 0.00
ORIENTAL CONCRETE PTE. LTD. Chairman
Douglas Tong Hsu (Asia Cement (Singapore) Pte. Ltd. Representative)
17,000,000 100.00
Director / Managing Director
J.H. Lin (Asia Cement (Singapore) Pte. Ltd. Representative)
17,000,000 100.00
Director Peter Hsu (Asia Cement (Singapore) Pte. Ltd. Representative)
17,000,000 100.00
Director K.Y. Lee (Asia Cement (Singapore) Pte. Ltd. Representative)
17,000,000 100.00
Director Gary Lee (Asia Cement (Singapore) Pte. Ltd. Representative)
17,000,000 100.00
FU SHAN MINERAL STONE CO., LTD. Chairman Y.F. Chang (Der Ching Investment
Corp. Representative) 1,294,270 99.56
Director / President Z.P. Chang (Der Ching Investment Corp. Representative) 1,294,270 99.56
Director Peter Hsu (Der Ching Investment Corp. Representative) 1,294,270 99.56
Director C.M. Chen (Der Ching Investment Corp. Representative) 1,294,270 99.56

-158-
Company Name Title Name or Representative Shareholding Shares %
Director Manfred Wang (Der Ching
Investment Corp. Representative) 1,294,270 99.56
Supervisor W.H. Yeh (Asia Investment Corp. Representative) 5,000 0.38
KOWLOON CEMENT CORP. LTD. Chairman Douglas Tong Hsu 0 0.00
Director Johnny Shih 0 0.00
Director K.Y. Lee 0 0.00
Director Y.F. Chang 0 0.00
Director R.H. Shao 0 0.00
Director Gary Lee 0 0.00 AC MEGA INVESTMENT LTD. Director C.M. Chen (Der Ching Investment
Corp. Representative) 27,700,000 100.00
Director Doris Wu (Der Ching Investment Corp. Representative) 27,700,000 100.00
Director H.Y. Kao (Der Ching Investment Corp. Representative) 27,700,000 100.00
AC LEAP INVESTMENT LTD. Director C.M. Chen (Der Ching Investment
Corp. Representative) 28,300,000 100.00
Director Doris Wu (Der Ching Investment Corp. Representative) 28,300,000 100.00
Director H.Y. Kao (Der Ching Investment Corp. Representative) 28,300,000 100.00
AC MEGA II INVESTMENT LTD. Director C.M. Chen (Der Ching Investment
Corp. Representative) 10,000,000 100.00
Director Doris Wu (Der Ching Investment Corp. Representative) 10,000,000 100.00
Director H.Y. Kao Doris Wu (Der Ching Investment Corp. Representative) 10,000,000 100.00
AC MEGA III INVESTMENT LTD. Director C.M. Chen (Der Ching Investment
Corp. Representative) 10,000,000 100.00
Director Doris Wu (Der Ching Investment Corp. Representative) 10,000,000 100.00
Director H.Y. Kao Doris Wu (Der Ching Investment Corp. Representative) 10,000,000 100.00
AC MEGA IV INVESTMENT LTD. Director C.M. Chen (Der Ching Investment
Corp. Representative) 26,100,000 100.00
Director Doris Wu (Der Ching Investment Corp. Representative) 26,100,000 100.00
Director H.Y. Kao (Der Ching Investment Corp. Representative) 26,100,000 100.00
YA LI PRECAST CONCRETE INDIA PVT. LTD. Chairman
X.M. He (Ya Li Precast And Prestressed Concrete Industries Corp. Representative)
*INR 1,599,990 99.99
Director W.H. Yeh (Ya Li Precast And Prestressed Concrete Industries Corp. Representative)
*INR 1,599,990 99.99
Director H.Y. Kao (Ya Li Precast And Prestressed Concrete Industries Corp. Representative)
*INR 1,599,990 99.99
Director Gary Lee (Ya Li Precast And Prestressed Concrete Industries Corp. Representative)
*INR 1,599,990 99.99

-159-
Company Name Title Name or Representative Shareholding Shares %
Director H.C. Lee (Ya Li Precast And Prestressed Concrete Industries Corp. Representative)
*INR 1,599,990 99.99
ASIA ORIENTAL (GUAM) L.L.C Manager C.P. Chen 0 0.00
PT YATUNG CONCRETE INTERNATIONAL Chairman
C.P. Chen (Ya Tung Ready-Mixed Concrete Corp. Representative)
*USD 1,980 99.00
Director P.R. Chen (Ya Tung Ready-Mixed Concrete Corp. Representative)
*USD 1,980 99.00
Director Karen Yang (Ya Tung Ready-Mixed Concrete Corp. Representative)
*USD 1,980 99.00
Supervisor H.Y. Kao (Ya Li Precast And Prestressed Concrete Industries Corp. Representative)
*USD 20 1.00
YATUNG VIETNAM CO. LTD. Manager C.P. Chen 0 0.00
YA SING READY-MIXED CONCRETE CORP. Chairman
C.P. Chen (Ya Tung Ready-Mixed Concrete Corp. Representative)
6,993,000 69.93
Director / President
Z.G. He (Ya Tung Ready-Mixed Concrete Corp. Representative)
6,993,000 69.93
Director C.H. Chung (Ya Tung Ready-Mixed Concrete Corp. Representative)
6,993,000 69.93
Director P.R. Chen (Ya Tung Ready-Mixed Concrete Corp. Representative)
6,993,000 69.93
Director W.B. Lin (Ya Tung Ready-Mixed Concrete Corp. Representative)
6,993,000 69.93
Director W.S. Tsai (Ya Tung Ready-Mixed Concrete Corp. Representative)
6,993,000 69.93
Director J.F. Tsai (Nan Kung Enterprise Corp.Ltd. Representative)
1,000,000 10.00
Director J.B. Zhuo (Lien Fang Enterprise Corp.Ltd. Representative)
500,000 5.00
Director T.Y. Huang (Chu Chiang Enterprise Corp.Ltd. Representative)
1,000,000 10.00
Supervisor F.C. Wu (Ho Hwei Enterprise Corp.Ltd. Representative)
500,000 5.00
Supervisor W.K. Chou (Asia Investment Corp. Representative)
5,000 0.05

-160-
Company Name Title Name or Representative Shareholding Shares %
Supervisor H.Y. Kao (Asia Investment Corp. Representative)
5,000 0.05
ASIA CEMENT EXPLORER INVESTMENT LTD.
Director C.M. Chen (Asia Investment Corp. Representative)
20,915,000 100.00
Director Doris Wu (Asia Investment Corp. Representative)
20,915,000 100.00
Director H.Y. Kao (Asia Investment Corp. Representative)
20,915,000 100.00
ASIA CEMENT PIONEER INVESTMENT LTD. Director
C.M. Chen (Asia Investment Corp. Representative)
68,550,000 100.00
Director Doris Wu (Asia Investment Corp. Representative)
68,550,000 100.00
Director H.Y. Kao (Asia Investment Corp. Representative)
68,550,000 100.00
ASIA CEMENT PIONEER II INVESTMENT LTD. Director
C.M. Chen (Asia Investment Corp. Representative)
28,000,000 100.00
Director Doris Wu (Asia Investment Corp. Representative)
28,000,000 100.00
Director H.Y. Kao (Asia Investment Corp. Representative)
28,000,000 100.00
ASIA CEMENT PIONEER III INVESTMENT LTD. Director
C.M. Chen (Asia Investment Corp. Representative)
19,500,000 100.00
Director Doris Wu (Asia Investment Corp. Representative)
19,500,000 100.00
Director H.Y. Kao (Asia Investment Corp. Representative)
19,500,000 100.00
ASIA CEMENT PIONEER IV INVESTMENT LTD. Director
C.M. Chen (Asia Investment Corp. Representative)
19,010,000 100.00
Director Doris Wu (Asia Investment Corp. Representative)
19,010,000 100.00
Director H.Y. Kao (Asia Investment Corp. Representative)
19,010,000 100.00
ASIA CONTINENT INVESTMENT HOLDINGS PTE. LTD.
Chairman Douglas Tong Hsu 0 0.00
Director Peter Hsu 0 0.00
Director K.Y. Lee 0 0.00
Director Doris Wu 0 0.00
Director Soon Heng Leong 0 0.00 ORIENTAL INDUSTRIAL HOLDINGS PTE. LTD. Chairman Douglas Tong Hsu 4,000 0.00
Director Peter Hsu 0 0.00

-161-
Company Name Title Name or Representative Shareholding Shares %
Director R.H. Shao 1,000 0.00
Director Doris Wu 0 0.00
Director Soon Heng Leong 0 0.00 KOWLOON CONCRETE CORP. LTD. Chairman Douglas Tong Hsu 0 0.00
Director K.Y. Lee 0 0.00
Director L.H. Fang 0 0.00
Director Doris Wu 0 0.00
Director Gary Lee 0 0.00
JOIN FORTUNE TRADING LTD Manager Gary Lee 0 0.00
ASIA ORIENTAL CONCRETE,LLC Manager C.L. Lai 0 0.00
JIANGXI YADONG CEMENT CO., LTD. Chairman
Z.L. Wu (Asia Continent Investment Holdings Pte. Ltd. Representative)
*USD 302,689 85.00
President J.B. Yu *USD 0 0.00
Director H.He (Oriental Holdings Co., Ltd. Representative)
*USD 35,610 10.00
Director Ping Shen (Jiangxi Provincial Investment Group Corp. Representative)
*USD 17,805 5.00
Supervisor T.Z. Wu (Asia Continent Investment Holdings Pte. Ltd. Representative)
*USD 302,689 85.00
HUANGGANG YADONG CEMENT CO., LTD. Chairman
L.H. Fang (Oriental Industrial Holdings Pte. Ltd. Representative)
*USD 77,553 90.00
President W.F. Hsu 0 0.00
Director L.M. Ou Yang (Oriental Industrial Holdings Pte. Ltd. Representative)
*USD 77,553 90.00
Director S.S. Wu (Oriental Holdings Co., Ltd. Representative)
*USD 8,617 10.00
Supervisor Michael Ting (Oriental Industrial Holdings Pte. Ltd. Representative)
*USD 77,553 90.00
WUHAN YADONG CEMENT CO., LTD. Chairman
J.B. Yu (Oriental Industrial Holdings Pte. Ltd. Representative)
*USD 32,526 90.00
President J.F. Jiang *USD 0 0.00
Director H.Q. Zhang (Oriental Industrial Holdings Pte. Ltd. Representative)
*USD 32,526 90.00
Director G Chen (Oriental Holdings Co., Ltd. Representative)
*USD 3,614 10.00
Supervisor W.Y. Liu (Oriental Industrial Holdings Pte. Ltd. Representative)
*USD 32,526 90.00

-162-
Company Name Title Name or Representative Shareholding Shares %
ORIENTAL HOLDINGS CO., LTD. Chairman / President
Doris Wu (Oriental Industrial Holdings Pte. Ltd. Representative)
*USD 204,188 100.00
Director Dana Lee (Oriental Industrial Holdings Pte. Ltd. Representative)
*USD 204,188 100.00
Director Karen Yang (Oriental Industrial Holdings Pte. Ltd. Representative)
*USD 204,188 100.00
Supervisor J.H. Wu (Oriental Industrial Holdings Pte. Ltd. Representative)
*USD 204,188 100.00
CHENGDU YALI CEMENT PRODUCTS CO., LTD.
Chairman L. Tian (Oriental Industrial Holdings Pte. Ltd. Representative)
*USD 2,100 51.22
President L.C. Lee *USD 0 0.00
Director G.W. Ciou (Oriental Industrial Holdings Pte. Ltd. Representative)
*USD 2,100 51.22
Director L.J. Zeng (Oriental Holdings Co., Ltd. Representative)
*USD 2,000 48.78
Supervisor Y. Chen (Oriental Industrial Holdings Pte. Ltd. Representative)
*USD 2,100 51.22
SHANGHAI YALI CEMENT PRODUCTS CO., LTD.
Chairman L.H. Fang (Oriental Industrial Holdings Pte. Ltd. Representative)
*USD 13,500 90.00
President H.He *USD 0 0.00
Director Y.G. Zhang (Oriental Industrial Holdings Pte. Ltd. Representative)
*USD 13,500 90.00
Director X.W. Xiao (Oriental Holdings Co., Ltd. Representative)
*USD 1,500 10.00
Supervisor R.F. Huang (Oriental Industrial Holdings Pte. Ltd. Representative)
*USD 13,500 90.00

-163-
Company Name Title Name or Representative Shareholding Shares %
SICHUAN YALI CONCRETE PRODUCE CO., LTD.
Chairman L. Tian (Oriental Industrial Holdings Pte. Ltd. Representative)
*USD 2,970 90.00
President L.C. Lee *USD 0 0.00
Director Y.H. Lu (Oriental Industrial Holdings Pte. Ltd. Representative)
*USD 2,970 90.00
Director X.T. Kao (Oriental Holdings Co., Ltd. Representative)
*USD 330 10.00
Supervisor Q.P. Zhou (Oriental Industrial Holdings Pte. Ltd. Representative)
*USD 2,970 90.00
SICHUAN YALI TRANSPORT CO., LTD. Chairman
L. Tian (Oriental Industrial Holdings Pte. Ltd. Representative)
*USD 3,150 90.00
President Y.H. Lu *USD 0 0.00
Director G.C. Wang (Oriental Industrial Holdings Pte. Ltd. Representative)
*USD 3,150 90.00
Director C.H. Xiang (Oriental Holdings Co., Ltd. Representative)
*USD 350 10.00
Supervisor H.B. Feng (Oriental Industrial Holdings Pte. Ltd. Representative)
*USD 3,150 90.00
YANGZHOU YADONG CEMENT CO., LTD. Chairman
L.H. Fang (Oriental Industrial Holdings Pte. Ltd. Representative)
*USD 31,977 90.00
President H.He *USD 0 0.00
Director Y.T. Li (Oriental Industrial Holdings Pte. Ltd. Representative)
*USD 31,977 90.00
Director T.M. Jiang (Oriental Holdings Co., Ltd. Representative)
*USD 3,553 10.00
Supervisor J. Chen (Oriental Industrial Holdings Pte. Ltd. Representative)
*USD 31,977 90.00
SICHUAN YADONG CEMENT CO., LTD. Chairman
L. Tian (Oriental Industrial Holdings Pte. Ltd. Representative)
*USD 331,506 90.00
President L.H. Fang *USD 0 0.00
Director L.C. Lee (Oriental Industrial Holdings Pte. Ltd. Representative)
*USD 331,506 90.00
Director H.C Wang (Oriental Holdings Co., Ltd. Representative)
*USD 36,834 10.00
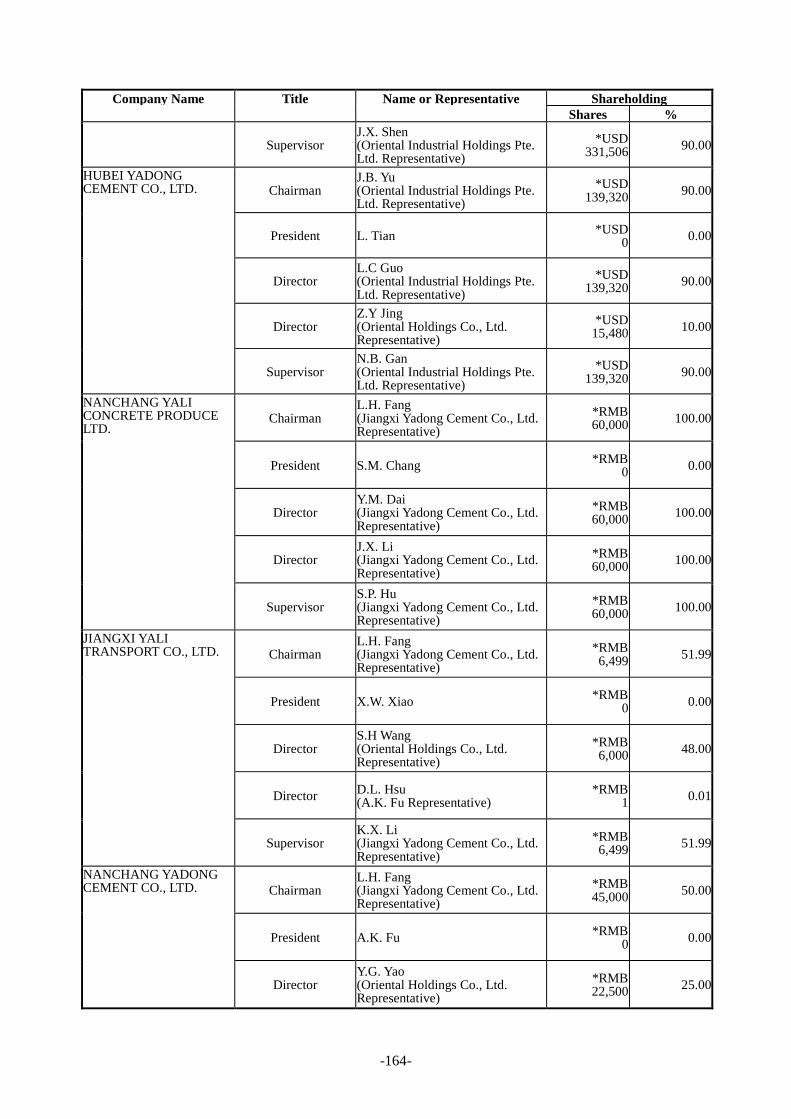
-164-
Company Name Title Name or Representative Shareholding Shares %
Supervisor J.X. Shen (Oriental Industrial Holdings Pte. Ltd. Representative)
*USD 331,506 90.00
HUBEI YADONG CEMENT CO., LTD. Chairman
J.B. Yu (Oriental Industrial Holdings Pte. Ltd. Representative)
*USD 139,320 90.00
President L. Tian *USD 0 0.00
Director L.C Guo (Oriental Industrial Holdings Pte. Ltd. Representative)
*USD 139,320 90.00
Director Z.Y Jing (Oriental Holdings Co., Ltd. Representative)
*USD 15,480 10.00
Supervisor N.B. Gan (Oriental Industrial Holdings Pte. Ltd. Representative)
*USD 139,320 90.00
NANCHANG YALI CONCRETE PRODUCE LTD.
Chairman L.H. Fang (Jiangxi Yadong Cement Co., Ltd. Representative)
*RMB 60,000 100.00
President S.M. Chang *RMB 0 0.00
Director Y.M. Dai (Jiangxi Yadong Cement Co., Ltd. Representative)
*RMB 60,000 100.00
Director J.X. Li (Jiangxi Yadong Cement Co., Ltd. Representative)
*RMB 60,000 100.00
Supervisor S.P. Hu (Jiangxi Yadong Cement Co., Ltd. Representative)
*RMB 60,000 100.00
JIANGXI YALI TRANSPORT CO., LTD. Chairman
L.H. Fang (Jiangxi Yadong Cement Co., Ltd. Representative)
*RMB 6,499 51.99
President X.W. Xiao *RMB 0 0.00
Director S.H Wang (Oriental Holdings Co., Ltd. Representative)
*RMB 6,000 48.00
Director D.L. Hsu (A.K. Fu Representative)
*RMB 1 0.01
Supervisor K.X. Li (Jiangxi Yadong Cement Co., Ltd. Representative)
*RMB 6,499 51.99
NANCHANG YADONG CEMENT CO., LTD. Chairman
L.H. Fang (Jiangxi Yadong Cement Co., Ltd. Representative)
*RMB 45,000 50.00
President A.K. Fu *RMB 0 0.00
Director Y.G. Yao (Oriental Holdings Co., Ltd. Representative)
*RMB 22,500 25.00

-165-
Company Name Title Name or Representative Shareholding Shares %
Director Y.S. Yao (Fangda Special Steel Technology
Co., Ltd. Representative) *RMB
22,500 25.00
Supervisor D.B. Wang (Jiangxi Yadong Cement Co., Ltd. Representative)
*RMB 45,000 50.00
WUHAN YALI CEMENT PRODUCTS CO., LTD. Chairman
J.B. Yu (Wuhan Yadong Cement Co., Ltd. Representative)
*RMB 60,000 100.00
President X.L. Yu *RMB 0 0.00
Director A.C. Hsu (Wuhan Yadong Cement Co., Ltd. Representative)
*RMB 60,000 100.00
Director G.F. He (Wuhan Yadong Cement Co., Ltd. Representative)
*RMB 60,000 100.00
Supervisor J.F. Jiang (Wuhan Yadong Cement Co., Ltd. Representative)
*RMB 60,000 100.00
TAIZHOU YADONG BUILDING MATERIAL CO., LTD.
Chairman L.H. Fang (Oriental Holdings Co., Ltd. Representative)
*USD 16,000 100.00
President H.He *USD 0 0.00
Director G.J. Shen (Oriental Holdings Co., Ltd. Representative)
*USD 16,000 100.00
Director D.M. Yi (Oriental Holdings Co., Ltd. Representative)
*USD 16,000 100.00
Supervisor M. Zhang (Oriental Holdings Co., Ltd. Representative)
*USD 16,000 100.00
Ruichang Yadong New Material Co., Ltd. Chairman
L.H. Fang (Jiangxi Yadong Cement Co., Ltd. Representative)
*RMB 2,000 100.00
President J.B. Yu
*RMB 0 0.00
Director W.T. Chang (Jiangxi Yadong Cement Co., Ltd. Representative)
*RMB 2,000 100.00
Director W.Y. Wang (Jiangxi Yadong Cement Co., Ltd. Representative)
*RMB 2,000 100.00
Supervisor B. Dai (Jiangxi Yadong Cement Co., Ltd. Representative)
*RMB 2,000 100.00
SICHUAN LANFENG BUILDING MATERIALS CO., LTD.
Chairman L. Tian (Sichuan Lanfeng Cement Co., Ltd. Representative)
*RMB 20,000 100.00
President X.M. Guo *RMB 0 0.00
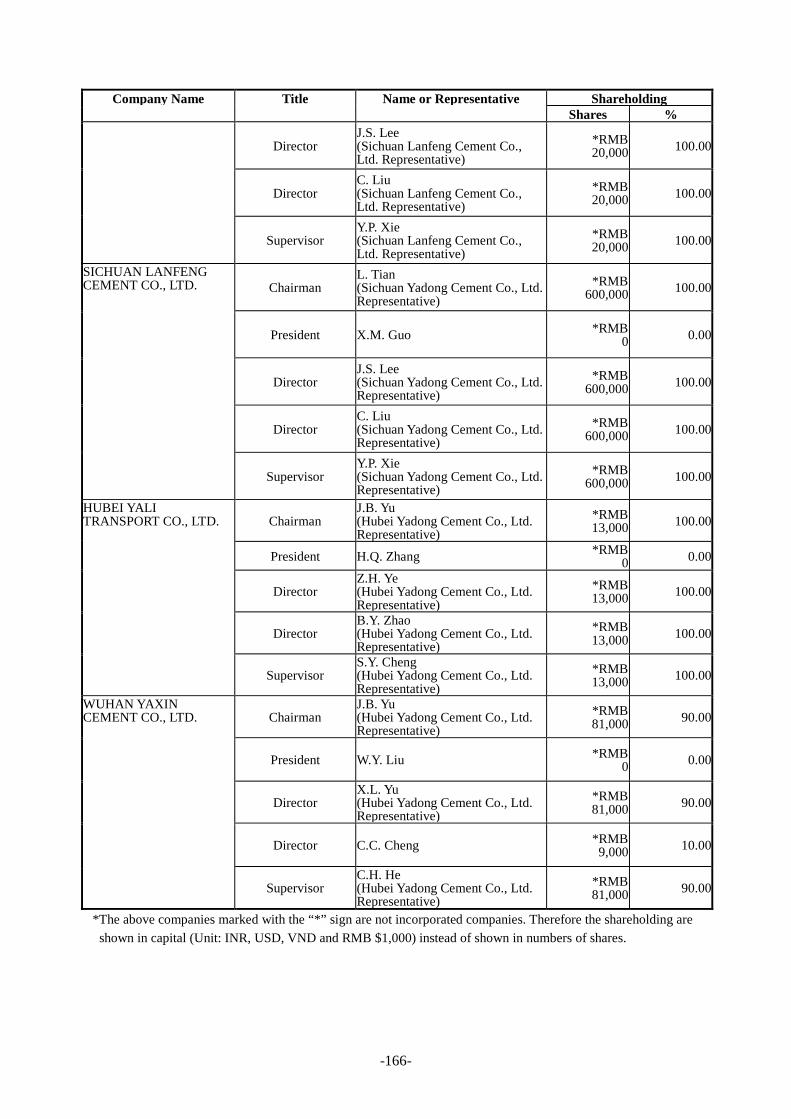
-166-
Company Name Title Name or Representative Shareholding Shares %
Director J.S. Lee (Sichuan Lanfeng Cement Co., Ltd. Representative)
*RMB 20,000 100.00
Director C. Liu (Sichuan Lanfeng Cement Co., Ltd. Representative)
*RMB 20,000 100.00
Supervisor Y.P. Xie (Sichuan Lanfeng Cement Co., Ltd. Representative)
*RMB 20,000 100.00
SICHUAN LANFENG CEMENT CO., LTD. Chairman
L. Tian (Sichuan Yadong Cement Co., Ltd. Representative)
*RMB 600,000 100.00
President X.M. Guo *RMB 0 0.00
Director J.S. Lee (Sichuan Yadong Cement Co., Ltd. Representative)
*RMB 600,000 100.00
Director C. Liu (Sichuan Yadong Cement Co., Ltd. Representative)
*RMB 600,000 100.00
Supervisor Y.P. Xie (Sichuan Yadong Cement Co., Ltd. Representative)
*RMB 600,000 100.00
HUBEI YALI TRANSPORT CO., LTD. Chairman
J.B. Yu (Hubei Yadong Cement Co., Ltd. Representative)
*RMB 13,000 100.00
President H.Q. Zhang *RMB 0 0.00
Director Z.H. Ye (Hubei Yadong Cement Co., Ltd. Representative)
*RMB 13,000 100.00
Director B.Y. Zhao (Hubei Yadong Cement Co., Ltd. Representative)
*RMB 13,000 100.00
Supervisor S.Y. Cheng (Hubei Yadong Cement Co., Ltd. Representative)
*RMB 13,000 100.00
WUHAN YAXIN CEMENT CO., LTD. Chairman
J.B. Yu (Hubei Yadong Cement Co., Ltd. Representative)
*RMB 81,000 90.00
President W.Y. Liu *RMB 0 0.00
Director X.L. Yu (Hubei Yadong Cement Co., Ltd. Representative)
*RMB 81,000 90.00
Director C.C. Cheng *RMB 9,000 10.00
Supervisor C.H. He (Hubei Yadong Cement Co., Ltd. Representative)
*RMB 81,000 90.00
*The above companies marked with the “*” sign are not incorporated companies. Therefore the shareholding are shown in capital (Unit: INR, USD, VND and RMB $1,000) instead of shown in numbers of shares.

-167-
8.5 Operating Condition of Affiliated Companies Unit: NT$1,000
Book closure date: 31 December 2019
No. Company Name Capital Total Assets Total
Liabilities Net Value Net Sales
Operating Income (Loss)
Income (Loss) After
Income Tax
Earnings (Loss)
per Share (After
Income Tax)
1 FU MING TRANSPORTATION CO., LTD.
295,695 1,827,649 414,647 1,413,002 1,082,244 97,625 213,189 7.21
2 YUAN LONG STAINLESS STEEL CORP.
2,000,000 5,767,420 3,963,111 1,804,309 5,438,907 84,752 1,347 0.01
3 SUNRISE INDUSTRIAL HOLDINGS LTD.
2,909 131,287 76,365 54,922 0 (96) 3,038 33.75
4 NAN HWA CEMENT CORP. 261,440 746,513 484,983 261,530 375,711 20,873 52,531 2.01
5 ASIA ENGINEERING ENTERPRISE CORP.
81,144 350,356 164,798 185,558 71,586 10,410 59,946 7.39
6 ASIA CEMENT (CHINA) HOLDINGS CO.
634,911 92,909,406 31,640,052 61,269,354 0 (512,748) 14,106,889 9.08
7 ASIA CEMENT (SINGAPORE) PTE. LTD.
250,425 5,074,964 931,295 4,143,669 821,802 (35,512) 693,709 66.07
8 DER CHING INVESTMENT CORP.
5,956,218 20,198,633 6,541,067 13,657,566 333,742 330,583 1,262,905 2.12
9 YA LI TRANSPORTATION CORP.
100,000 497,048 17,883 479,165 179,498 (2,463) 22,796 2.28
10 YA LI PRECAST AND PRESTRESSED CONCRETE INDUSTRIES CORP.
193,776 329,681 239,484 90,197 176,332 7,110 1,040 0.05
11 YA TUNG READY-MIXED CONCRETE CORP.
1,590,750 5,130,833 3,329,063 1,801,770 9,072,752 312,414 146,801 0.92
12 ASIA INVESTMENT CORP. 2,220,396 10,232,880 6,976,681 3,256,199 289,257 288,423 977,016 4.40
13 CHIAHUI POWER CORP. 4,700,000 16,863,247 7,241,999 9,621,248 7,115,116 1,382,268 1,097,061 2.33
14 FU DA TRANSPORTATION CO., LTD.
279,279 1,262,659 521,049 741,610 881,218 87,835 109,850 3.93
15 PERFECT INDUSTRIAL HOLDINGS PTE. LTD.
290,905 74,365,545 0 74,365,545 0 (80) 15,638,825 1,609.01
16 ORIENTAL CONCRETE PTE. LTD.
377,230 261,152 908 260,244 12,440 4,947 3,400 0.20
17 FU SHAN MINERAL STONE CO.,LTD.
13,000 77,478 49,617 27,861 1,897 (6,357) (6,936) (5.34)
18 KOWLOON CEMENT CORP. LTD.
93,150 929,482 18,964 910,518 12,070 (4,748) 40,881 17.77
19 AC MEGA INVESTMENT LTD.
828,313 774,004 0 774,004 1,787 1,635 86,138 3.11
20 AC LEAP INVESTMENT LTD.
846,224 855,589 0 855,589 1,787 1,635 100,918 3.57
21 AC MEGA II INVESTMENT LTD.
289,050 281,337 0 281,337 0 (85) 46,877 4.69
22 AC MEGA III INVESTMENT LTD.
289,050 319,223 0 319,223 0 (85) 52,787 5.28

-168-
No. Company Name Capital Total Assets Total
Liabilities Net Value Net Sales
Operating Income (Loss)
Income (Loss) After
Income Tax
Earnings (Loss)
per Share (After
Income Tax)
23 AC MEGA IV INVESTMENT LTD.
780,510 888,698 0 888,698 1,787 1,638 106,605 4.08
24 YA LI PRECAST CONCRETE INDIA PVT. LTD.
8,338 4,927 3,011 1,916 0 (219) (219) Note 1
25 ASIA ORIENTAL (GUAM) L.L.C
242,046 68,628 18 68,610 804 (893) (43,552) Note 1
26 PT YATUNG CONCRETE INTERNATIONAL CORP.
62,060 211,374 142,092 69,282 116,547 (46,897) (72,481) Note 1
27 YATUNG VIETNAM CO., LTD. 201,823 338,251 47,005 291,246 130,085 2,500 7,838 Note 1
28 YA SING READY-MIXED CONCRETE CORP.
100,000 269,305 143,912 125,393 720,312 42,125 27,530 2.75
29 ASIA CEMENT EXPLORER INVESTMENT LTD.
623,340 442,420 0 442,420 0 (89) 14,774 0.71
30 ASIA CEMENT PIONEER INVESTMENT LTD.
2,100,779 2,121,134 56,808 2,064,326 0 (89) 306,888 4.48
31 ASIA CEMENT PIONEER II INVESTMENT LTD.
833,410 891,935 0 891,935 0 (85) 101,257 3.62
32 ASIA CEMENT PIONEER III INVESTMENT LTD.
578,325 542,204 0 542,204 0 (85) 36,662 1.88
33 ASIA CEMENT PIONEER IV INVESTMENT LTD.
575,538 588,459 0 588,459 0 (85) 48,009 2.53
34 ASIA CONTINENT INVESTMENT HOLDINGS PTE. LTD.
8,645,188 21,926,906 93 21,926,813 0 (151) 5,472,063 16.50
35 ORIENTAL INDUSTRIAL HOLDINGS PTE. LTD.
25,073,666 52,420,077 142 52,419,935 0 (324) 9,991,482 14.26
36 KOWLOON CONCRETE CORP. LTD.
38 138,999 410 138,589 2,852 (663) 13,198 1,319.76
37 JOIN FORTUNE TRADING LTD.
88,372 36,282 17,325 18,957 0 (99) 584 0.20
38 ASIA ORINTAL CONCRETE,LLC
347,188 191,177 178,188 12,989 188,063 (62,093) (66,247) Note 1
39 JIANGXI YADONG CEMENT CO., LTD.
10,658,193 30,117,749 4,322,780 25,794,969 23,344,232 8,290,223 6,675,264 Note 1
40 HUANGGANG YADONG CEMENT CO., LTD.
2,579,068 6,046,607 593,413 5,453,194 3,754,736 1,476,295 1,191,577 Note 1
41 WUHAN YADONG CEMENT CO., LTD.
1,081,670 2,947,858 334,690 2,613,168 1,652,541 46,766 130,126 Note 1
42 ORIENTAL HOLDINGS CO., LTD.
3,903,082 12,389,715 8,250 12,381,465 0 (676) 1,730,872 Note 1
43 CHENGDU YA LI CEMENT PRODUCTS CO., LTD.
122,713 432,973 79,986 352,987 465,699 32,364 63,381 Note 1
44 SHANGHAI YALI CEMENT PRODUCTS CO., LTD.
448,950 262,643 200,640 62,003 37,712 (15,057) 63,986 Note 1
45 SICHUAN YALI CONCRETE PRODUCE CO., LTD.
98,769 837,133 606,879 230,254 1,323,776 135,524 79,571 Note 1

-169-
No. Company Name Capital Total Assets Total
Liabilities Net Value Net Sales
Operating Income (Loss)
Income (Loss) After
Income Tax
Earnings (Loss)
per Share (After
Income Tax)
46 SICHUAN YALI TRANSPORT CO., LTD.
104,755 219,717 33,473 186,244 346,637 15,020 18,323 Note 1
47 YANGZHOU YADONG CEMENT CO., LTD.
1,063,413 2,250,627 357,114 1,893,513 4,078,292 357,732 226,061 Note 1
48 SICHUAN YADONG CEMENT CO., LTD.
11,024,416 24,155,190 1,667,157 22,488,033 9,998,218 3,728,794 5,671,266 Note 1
49 HUBEI YADONG CEMENT CO., LTD.
4,633,164 12,389,945 1,157,575 11,232,370 7,452,467 2,214,273 1,930,247 Note 1
50 RUICHANG YADONG NEW MATERIAL CO., LTD.
8,581 321,015 107,909 213,106 389,316 284,687 213,741 Note 1
51 NANCHANG YALI CONCRETE PRODUCE LTD.
257,419 827,186 122,826 704,360 756,225 57,858 (29,379) Note 1
52 JIANGXI YALI TRANSPORT CO., LTD.
53,629 232,954 75,225 157,729 368,861 37,972 28,680 Note 1
53 NANCHANG YADONG CEMENT CO., LTD.
386,128 882,611 154,880 727,731 1,319,721 78,909 69,883 Note 1
54 WUHAN YALI CEMENT PRODUCTS CO., LTD.
257,419 548,026 160,476 387,550 843,423 101,453 103,702 Note 1
55 TAIZHOU YADONG BUILDING MATERIAL CO., LTD.
478,880 1,026,493 493,388 533,105 1,459,198 83,177 58,875 Note 1
56 SICHUAN LANFENG BUILDING MATERIALS CO., LTD.
85,806 54,416 143,879 (89,463) 0 (1,992) (2,254) Note 1
57 SICHUAN LANFENG CEMENT CO., LTD.
2,574,190 8,135,637 1,682,006 6,453,631 6,990,157 3,061,142 2,550,570 Note 1
58 HUBEI YALI TRANSPORT CO., LTD.
55,774 91,286 11,939 79,347 109,194 568 501 Note 1
59 WUHAN YAXIN CEMENT CORP. LTD.
386,128 1,870,672 251,454 1,619,218 1,783,301 232,266 202,157 Note 1
Note 1: The subsidiaries in China or overseas are limited liability companies; therefore it’s not able to count earnings per share. Note 2: The data in Balance Sheet are converted according to the exchange rate at the end of 2019( USD:29.93;SGD:22.19;RMB:4.290316;
HKD:3.819;INR:0.42;VND:0.001293;IDR:0.002153 ); the data in Income Statement are converted according to the 2019 average exchange rate ( USD:30.9119;SGD:22.6642;RMB:4.483617;HKD:3.9449;INR:0.4387;VND:0.00134;IDR:0.002188 ).
◎Consolidated Financial Reports: Please read section 6.4 for details. ◎Relationship Report: Not applicable. ◎Private placement: None. ◎The shares held or disposed by subsidiaries in the most recent fiscal year and the current fiscal
year up to the date of printing of the annual report: None. ◎In the most recent fiscal year and the current fiscal year up to the date of printing of the annual
report, any event which has a material impact on shareholders' equity or securities prices: About the information of the Company's investment in China Shanshui Cement Group Ltd., please refer to the Note 7,18,24, 41 in consolidated financial report.
◎Any other matters listed in Article 36, paragraph 3, subparagraph 2 of the Securities and Exchange Act which might materially affect shareholders' equity or the price of the company's securities, occurred during the most recent fiscal year or during the current fiscal year up to the date of printing of the annual report: None.

Asia Cement Corporation and Subsidiaries Consolidated Financial Statements for the Years Ended December 31, 2019 and 2018 and Independent Auditors’ Report
- 1 -
DECLARATION OF CONSOLIDATION OF FINANCIAL STATEMENTS OF AFFILIATES The companies required to be included in the consolidated financial statements of affiliates in accordance
with the “Criteria Governing Preparation of Affiliation Reports, Consolidated Business Reports and
Consolidated Financial Statements of Affiliated Enterprises” for the year ended December 31, 2019 are
all the same as the companies required to be included in the consolidated financial statements of parent
and subsidiary companies as provided in International Financial Reporting Standard 10 “Consolidated
Financial Statements”. Relevant information that should be disclosed in the consolidated financial
statements of affiliates has all been disclosed in the consolidated financial statements of parent and
subsidiary companies. Hence, we did not prepare a separate set of consolidated financial statements of
affiliates.
Very truly yours, ASIA CEMENT CORPORATION By DOUGLAS TONG HSU Chairman March 25, 2020
- 2 -
INDEPENDENT AUDITORS’ REPORT The Board of Directors and Shareholders Asia Cement Corporation Opinion We have audited the accompanying consolidated financial statements of Asia Cement Corporation and its subsidiaries (collectively referred to as the “Group”), which comprise the consolidated balance sheets as of December 31, 2019 and 2018, and the consolidated statements of comprehensive income, changes in equity and cash flows for the years then ended, and the notes to the consolidated financial statements, including a summary of significant accounting policies (collectively referred to as the “consolidated financial statements”). In our opinion, based on our audits and the reports of other auditors (refer to Other Matter section), the accompanying consolidated financial statements present fairly, in all material respects, the consolidated financial position of the Group as of December 31, 2019 and 2018, and its consolidated financial performance and its consolidated cash flows for the years then ended in accordance with the Regulations Governing the Preparation of Financial Reports by Securities Issuers, and International Financial Reporting Standards (IFRS), International Accounting Standards (IAS), IFRIC Interpretations (IFRIC), and SIC Interpretations (SIC) endorsed and issued into effect by the Financial Supervisory Commission of the Republic of China. Basis for Opinion We conducted our audits in accordance with the Regulations Governing Auditing and Attestation of Financial Statements by Certified Public Accountants and auditing standards generally accepted in the Republic of China. Our responsibilities under those standards are further described in the Auditors’ Responsibilities for the Audit of the Consolidated Financial Statements section of our report. We are independent of the Group in accordance with The Norm of Professional Ethics for Certified Public Accountant of the Republic of China, and we have fulfilled our other ethical responsibilities in accordance with these requirements. We believe that the audit evidence we have obtained is sufficient and appropriate to provide a basis for our opinion. Key Audit Matters Key audit matters are those matters that, in our professional judgment, were of most significance in our audit of the consolidated financial statements for the year ended December 31, 2019. These matters were addressed in the context of our audit of the consolidated financial statements as a whole, and in forming our opinion thereon, and we do not provide a separate opinion on these matters.

- 3 -
The key audit matters identified in the Group’s consolidated financial statements for the year ended December 31, 2019 are stated as follows: Estimated Impairment of Trade Receivables The estimated provision for impairment of trade receivables is based on the assumptions of defaults and expected loss rates. The assumptions and selection of inputs for impairment calculation are based on the Group’s historical experience, existing market conditions as well as forward looking estimates. When the actual future cash flows are less than expected, a material impairment loss may arise, refer to Notes 5 and 13 to the consolidated financial statements. Because key assumptions and inputs used for measuring expected credit losses on trade receivables involve significant judgments and uncertainties, we considered the estimated impairment of trade receivables as one of the key audit matters. The corresponding audit procedures that we performed for the estimated impairment of trade receivables are as follows: 1. We obtained an understanding of the internal control procedures with respect to management’s
allowance for impairment loss of trade receivables. 2. We evaluated the reasonableness of allowance for impairment loss by testing the aging of trade
receivables and by quantifying the potential risk of trade receivables that were overdue at the balance sheet date.
3. We tested the recoverability of the trade receivables by vouching cash receipts after the
balance sheet date. 4. For the estimated impairment of accounts receivable, we evaluated the adequacy of
management’s provision for impairment based on customers’ past default experience, current financial position, any collateral pledged, existing market conditions as well as forward looking estimates.
Fair Value Measurement of Investment Properties The Group’s investment properties are subsequently measured using the fair value model and valued by an independent qualified professional appraiser, a member of the ROC certified real estate appraisers, refer to Notes 5 and 18 to the consolidated financial statements. Because the valuation of investment properties involves significant judgments and uncertainties, we considered the fair value measurement of investment properties as one of the key audit matters. The corresponding audit procedures that we performed for the fair value measurement of investment properties are as follows: 1. We assessed the professional competence and independence of the appraiser engaged by
management and we obtained an understanding of the appraiser’s scope of work and process of engagement to confirm that no circumstances affect the appraiser’s independence and limit the scope of his work.
2. We obtained an understanding of and assessed the reasonableness of management’s
assumptions and methods used in the valuation.

- 4 -
3. We sample-tested items from management’s supporting documents, which include the effective gross income, expenses, and property rights of land and buildings to verify the valuation process used by management and recalculated the fair value of investment properties to assess the reasonableness of management’s calculation.
Other Matter The financial statements of China Shanshui Cement Group Limited (CSCGL), an associate accounted for using equity method, were audited by other auditors as of December 31, 2019 and 2018. Our opinion, insofar as it relates to the amounts included in the accompanying financial statements for CSCGL, is based solely on the reports of other auditors. As of December 31, 2019 and 2018, the aggregate carrying value of the equity-method investments in CSCGL was NT$12,024,837 thousand and NT$10,217,370 thousand, respectively, both representing 4% of the consolidated total assets. For the years ended December 31, 2019 and 2018, the share of profit or loss of CSCGL was NT$2,211,559 thousand and NT$376,557 thousand, respectively, representing 8% and 2%, respectively, of the consolidated profit before income tax. We have also audited the parent company only financial statements of Asia Cement Corporation as of and for the years ended December 31, 2019 and 2018 on which we have issued an unmodified opinion with other matter paragraph. Responsibilities of Management and Those Charged with Governance for the Consolidated
Financial Statements Management is responsible for the preparation and fair presentation of the consolidated financial statements in accordance with the Regulations Governing the Preparation of Financial Reports by Securities Issuers, and IFRS, IAS, IFRIC, and SIC endorsed and issued into effect by the Financial Supervisory Commission of the Republic of China, and for such internal control as management determines is necessary to enable the preparation of consolidated financial statements that are free from material misstatement, whether due to fraud or error. In preparing the consolidated financial statements, management is responsible for assessing the Group’s ability to continue as a going concern, disclosing, as applicable, matters related to going concern and using the going concern basis of accounting unless management either intends to liquidate the Group or to cease operations, or has no realistic alternative but to do so. Those charged with governance, including the audit committee, are responsible for overseeing the Group’s financial reporting process. Auditors’ Responsibilities for the Audit of the Consolidated Financial Statements Our objectives are to obtain reasonable assurance about whether the consolidated financial statements as a whole are free from material misstatement, whether due to fraud or error, and to issue an auditors’ report that includes our opinion. Reasonable assurance is a high level of assurance, but is not a guarantee that an audit conducted in accordance with the auditing standards generally accepted in the Republic of China will always detect a material misstatement when it exists. Misstatements can arise from fraud or error and are considered material if, individually or in the aggregate, they could reasonably be expected to influence the economic decisions of users taken on the basis of these consolidated financial statements.
- 5 -
As part of an audit in accordance with the auditing standards generally accepted in the Republic of China, we exercise professional judgment and maintain professional skepticism throughout the audit. We also: 1. Identify and assess the risks of material misstatement of the consolidated financial statements,
whether due to fraud or error, design and perform audit procedures responsive to those risks, and obtain audit evidence that is sufficient and appropriate to provide a basis for our opinion. The risk of not detecting a material misstatement resulting from fraud is higher than for one resulting from error, as fraud may involve collusion, forgery, intentional omissions, misrepresentations, or the override of internal control.
2. Obtain an understanding of internal control relevant to the audit in order to design audit
procedures that are appropriate in the circumstances, but not for the purpose of expressing an opinion on the effectiveness of the Group’s internal control.
3. Evaluate the appropriateness of accounting policies used and the reasonableness of accounting
estimates and related disclosures made by management. 4. Conclude on the appropriateness of management’s use of the going concern basis of
accounting and, based on the audit evidence obtained, whether a material uncertainty exists related to events or conditions that may cast significant doubt on the Group’s ability to continue as a going concern. If we conclude that a material uncertainty exists, we are required to draw attention in our auditors’ report to the related disclosures in the consolidated financial statements or, if such disclosures are inadequate, to modify our opinion. Our conclusions are based on the audit evidence obtained up to the date of our auditors’ report. However, future events or conditions may cause the Group to cease to continue as a going concern.
5. Evaluate the overall presentation, structure and content of the consolidated financial statements,
including the disclosures, and whether the consolidated financial statements represent the underlying transactions and events in a manner that achieves fair presentation.
6. Obtain sufficient and appropriate audit evidence regarding the financial information of entities
or business activities within the Group to express an opinion on the consolidated financial statements. We are responsible for the direction, supervision, and performance of the group audit. We remain solely responsible for our audit opinion.
We communicate with those charged with governance regarding, among other matters, the planned scope and timing of the audit and significant audit findings, including any significant deficiencies in internal control that we identify during our audit. We also provide those charged with governance with a statement that we have complied with relevant ethical requirements regarding independence, and to communicate with them all relationships and other matters that may reasonably be thought to bear on our independence, and where applicable, related safeguards. From the matters communicated with those charged with governance, we determine those matters that were of most significance in the audit of the consolidated financial statements for the year ended December 31, 2019 and are therefore the key audit matters. We describe these matters in our auditors’ report unless law or regulation precludes public disclosure about the matter or when, in extremely rare circumstances, we determine that a matter should not be communicated in our report because the adverse consequences of doing so would reasonably be expected to outweigh the public interest benefits of such communication.

- 6 -
The engagement partners on the audit resulting in this independent auditors’ report are Tai, Xin Wei and Fan, Yu Wei. Deloitte & Touche Taipei, Taiwan Republic of China March 25, 2020
Notice to Readers The accompanying consolidated financial statements are intended only to present the consolidated financial position, financial performance and cash flows in accordance with accounting principles and practices generally accepted in the Republic of China and not those of any other jurisdictions. The standards, procedures and practices to audit such consolidated financial statements are those generally applied in the Republic of China. For the convenience of readers, the independent auditors’ report and the accompanying consolidated financial statements have been translated into English from the original Chinese version prepared and used in the Republic of China. If there is any conflict between the English version and the original Chinese version or any difference in the interpretation of the two versions, the Chinese-language independent auditors’ report and consolidated financial statements shall prevail.

- 7 -
ASIA CEMENT CORPORATION AND SUBSIDIARIES CONSOLIDATED BALANCE SHEETS DECEMBER 31, 2019 AND 2018 (In Thousands of New Taiwan Dollars) 2019 2018 ASSETS Amount % Amount % CURRENT ASSETS
Cash and cash equivalents (Notes 6 and 37) $ 24,735,495 8 $ 14,929,411 5 Financial assets at fair value through profit or loss - current (Notes 7 and 36) 4,728,223 2 9,046,583 3 Financial assets at fair value through other comprehensive income - current (Notes 8 and 38) 3,978,366 1 3,800,923 2 Financial assets at amortized cost - current (Notes 6, 9, 36 and 38) 23,016,985 8 14,322,874 5 Contract assets - current (Notes 31 and 37) 68,412 - 147,528 - Notes receivable
Third parties 11,159,687 4 12,928,203 5 Trade receivables
Third parties (Notes 10 and 11) 10,159,263 3 9,251,854 3 Related parties (Notes 10 and 37) 803,340 - 976,266 -
Other receivables (Notes 12 and 37) 481,800 - 2,964,751 1 Current tax assets (Note 33) 6,785 - 15,901 - Inventories (Note 13) 7,789,794 3 9,804,276 4 Prepayments (Notes 21 and 37) 1,812,789 1 1,684,612 1 Other current assets (Note 22) 501,127 - 485,324 -
Total current assets 89,242,066 30 80,358,506 29
NON-CURRENT ASSETS
Investments accounted for using equity method (Notes 15, 37 and 38) 84,412,240 28 78,846,276 28 Financial assets at fair value through other comprehensive income - non-current (Notes 8 and 38) 11,692,138 4 9,784,743 4 Financial assets at amortized cost - non-current (Notes 6, 9, 37 and 38) 36,064 - 14,642 - Property, plant and equipment (Notes 16 and 38) 50,681,281 17 52,549,341 19 Right-of-use assets (Notes 17 and 37) 5,080,287 2 - - Investment properties (Notes 18 and 38) 36,176,439 12 35,965,203 13 Intangible assets (Notes 19 and 20) 7,000,317 2 3,694,783 1 Deferred tax assets (Note 33) 474,929 - 436,238 - Lease receivables - non-current (Note 11) - - 8,894,355 3 Finance lease receivables - non-current (Note 11) 8,170,867 3 - - Long-term prepayments for leases (Note 21) - - 3,779,353 1 Other non-current assets (Notes 22 ,29 and 37) 4,311,884 2 4,864,558 2
Total non-current assets 208,036,446 70 198,829,492 71
TOTAL $ 297,278,512 100 $ 279,187,998 100 LIABILITIES AND EQUITY CURRENT LIABILITIES
Short-term borrowings (Notes 23 and 37) $ 23,811,603 8 $ 24,805,239 9 Short-term bills payable (Note 24) 18,932,294 6 18,564,469 7 Financial liabilities at fair value through profit or loss - current (Note 7) 112,070 - 268,218 - Contract liabilities - current (Notes 31 and 37) 987,496 - 731,015 - Accounts payable and accrued expenses
Third parties (Note 20) 13,266,966 5 8,028,077 3 Related parties (Note 37) 256,803 - 250,857 -
Dividends and bonuses payable 230,151 - 231,722 - Other payables - others (Note 25) 312,069 - 334,305 - Current tax liabilities (Note 33) 2,957,672 1 2,181,268 1 Provisions - current (Note 28) 50,661 - 48,200 - Lease liabilities - current (Note 17) 190,607 - - - Deferred revenue - current (Note 27) 75,912 - 75,912 - Current portion of long-term liabilities (Notes 26 and 37) 13,151,315 5 7,285,012 2
Total current liabilities 74,335,619 25 62,804,294 22
NON-CURRENT LIABILITIES
Bonds payable (Note 26) 19,280,807 7 12,192,567 5 Long-term borrowings (Notes 26 and 37) 20,820,990 7 33,593,896 12 Provisions - non-current (Notes 22, 28 and 39) 715,432 - 679,377 - Lease liabilities - non-current (Note 17) 1,264,765 1 - - Deferred tax liabilities (Note 33) 9,991,422 3 9,365,429 4 Net defined benefit liabilities - non-current (Note 29) 164,208 - 185,107 - Deferred revenue - non-current (Note 27) 847,893 - 923,805 - Other non-current liabilities 408,338 - 395,177 -
Total non-current liabilities 53,493,855 18 57,335,358 21
Total liabilities 127,829,474 43 120,139,652 43
EQUITY ATTRIBUTABLE TO OWNERS OF THE CORPORATION (Note 30)
Share capital 33,614,472 11 33,614,472 12 Capital surplus 1,456,054 - 1,362,554 - Retained earnings
Legal reserve 16,727,089 6 15,615,380 6 Special reserve 64,463,426 22 63,945,145 23 Unappropriated earnings 27,373,840 9 20,358,461 7
Total retained earnings 108,564,355 37 99,918,986 36 Other equity 2,432,477 1 2,996,214 1
Total equity attributable to owners of the Corporation 146,067,358 49 137,892,226 49
NON-CONTROLLING INTERESTS (Note 30) 23,381,680 8 21,156,120 8
Total equity 169,449,038 57 159,048,346 57 TOTAL $ 297,278,512 100 $ 279,187,998 100 The accompanying notes are an integral part of the consolidated financial statements. (With Deloitte & Touche auditors’ report dated March 25, 2020)
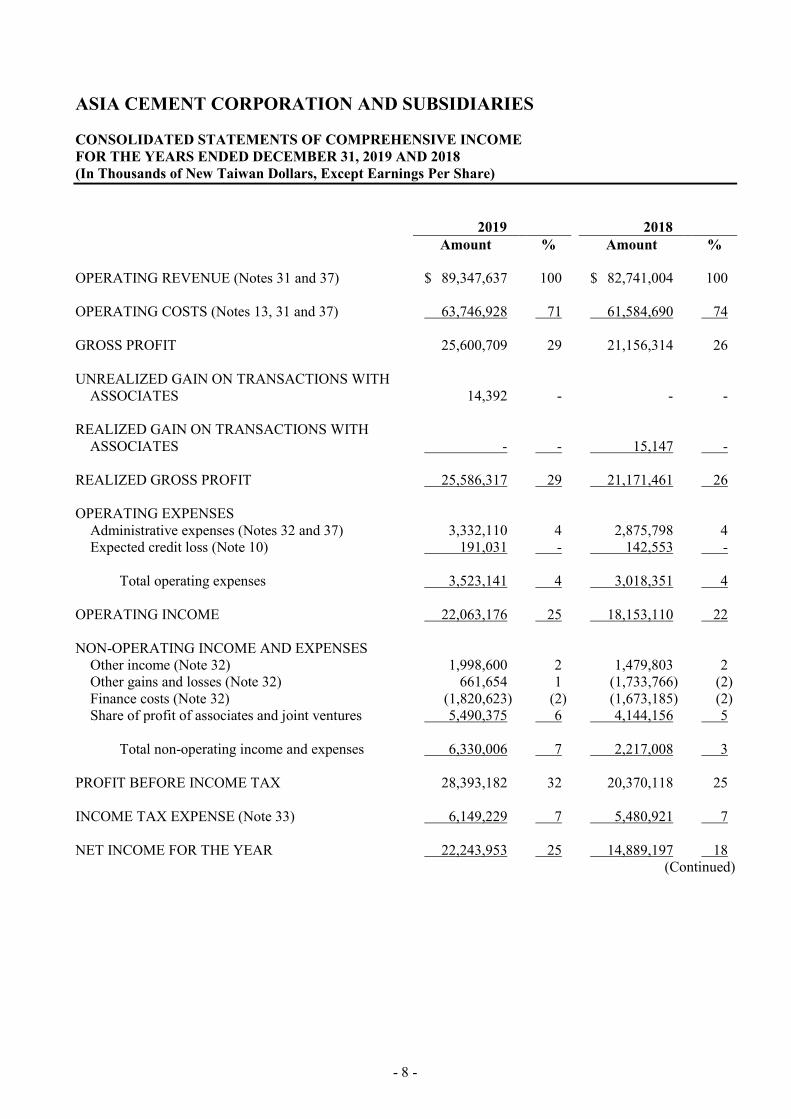
- 8 -
ASIA CEMENT CORPORATION AND SUBSIDIARIES CONSOLIDATED STATEMENTS OF COMPREHENSIVE INCOME FOR THE YEARS ENDED DECEMBER 31, 2019 AND 2018 (In Thousands of New Taiwan Dollars, Except Earnings Per Share) 2019 2018 Amount % Amount % OPERATING REVENUE (Notes 31 and 37) $ 89,347,637 100 $ 82,741,004 100 OPERATING COSTS (Notes 13, 31 and 37) 63,746,928 71 61,584,690 74 GROSS PROFIT 25,600,709 29 21,156,314 26 UNREALIZED GAIN ON TRANSACTIONS WITH
ASSOCIATES 14,392 - - - REALIZED GAIN ON TRANSACTIONS WITH
ASSOCIATES - - 15,147 - REALIZED GROSS PROFIT 25,586,317 29 21,171,461 26 OPERATING EXPENSES
Administrative expenses (Notes 32 and 37) 3,332,110 4 2,875,798 4 Expected credit loss (Note 10) 191,031 - 142,553 -
Total operating expenses 3,523,141 4 3,018,351 4
OPERATING INCOME 22,063,176 25 18,153,110 22 NON-OPERATING INCOME AND EXPENSES
Other income (Note 32) 1,998,600 2 1,479,803 2 Other gains and losses (Note 32) 661,654 1 (1,733,766) (2) Finance costs (Note 32) (1,820,623) (2) (1,673,185) (2) Share of profit of associates and joint ventures 5,490,375 6 4,144,156 5
Total non-operating income and expenses 6,330,006 7 2,217,008 3
PROFIT BEFORE INCOME TAX 28,393,182 32 20,370,118 25 INCOME TAX EXPENSE (Note 33) 6,149,229 7 5,480,921 7 NET INCOME FOR THE YEAR 22,243,953 25 14,889,197 18
(Continued)

- 9 -
ASIA CEMENT CORPORATION AND SUBSIDIARIES CONSOLIDATED STATEMENTS OF COMPREHENSIVE INCOME FOR THE YEARS ENDED DECEMBER 31, 2019 AND 2018 (In Thousands of New Taiwan Dollars, Except Earnings Per Share) 2019 2018 Amount % Amount % OTHER COMPREHENSIVE INCOME, NET
Items that will not be reclassified subsequently to profit or loss: Unrealized gain on investments in equity
instruments at fair value through other comprehensive income $ 1,193,292 1 $ 707,605 1
Remeasurement of defined benefit plans 486,711 1 265,511 - Share of other comprehensive income of
associates and joint ventures 1,778,252 2 723,519 1 3,458,255 4 1,696,635 2
Items that may be reclassified subsequently to profit or loss: Exchange differences on translating the financial
statements of foreign operations (2,635,629) (3) (894,761) (1) Cash flow hedges - - (2,434) - Share of other comprehensive (loss) income of
associates and joint ventures (1,439,930) (2) 636,733 1 (4,075,559) (5) (260,462) -
Other comprehensive (loss) income for the year,
net of income tax (617,304) (1) 1,436,173 2 TOTAL COMPREHENSIVE INCOME FOR THE
YEAR $ 21,626,649 24 $ 16,325,370 20 NET PROFIT ATTRIBUTABLE TO:
Owners of the Corporation $ 17,459,673 20 $ 11,117,094 13 Non-controlling interests 4,784,280 5 3,772,103 5
$ 22,243,953 25 $ 14,889,197 18
TOTAL COMPREHENSIVE INCOME
ATTRIBUTABLE TO: Owners of the Corporation $ 17,652,536 20 $ 12,811,353 16 Non-controlling interests 3,974,113 4 3,514,017 4
$ 21,626,649 24 $ 16,325,370 20 EARNINGS PER SHARE (Note 34)
Basic $ 5.56 $ 3.54 Diluted $ 5.25 $ 3.49
The accompanying notes are an integral part of the consolidated financial statements. (With Deloitte & Touche auditors’ report dated March 25, 2020) (Concluded)

- 10 -
ASIA CEMENT CORPORATION AND SUBSIDIARIES CONSOLIDATED STATEMENTS OF CHANGES IN EQUITY FOR THE YEARS ENDED DECEMBER 31, 2019 AND 2018 (In Thousands of New Taiwan Dollars) Equity Attributable to Owners of the Corporation Other Equity
Exchange
Differences on Unrealized Gain
(Loss) on
Translating the
Financial Financial Assets at
Fair Value Retained Earnings Statements of Through Other Gains on Share Capital Issued Unappropriated Foreign Comprehensive Property Cash Flow Total Other Non-controlling Shares Amount Capital Surplus Legal Reserve Special Reserve Earnings Operations Income Revaluation Hedges Equity Total Interests Total Equity BALANCE AT JANUARY 1, 2018 3,361,447 $ 33,614,472 $ 1,168,692 $ 15,068,480 $ 63,001,957 $ 17,839,296 $ (2,638,153 ) $ 516,962 $ 307,728 $ 58,485 $ (1,754,978 ) $ 128,937,919 $ 18,365,609 $ 147,303,528 Appropriation of 2017 earnings
Legal reserve - - - 546,900 - (546,900 ) - - - - - - - - Special reserve - - - - 943,188 (943,188 ) - - - - - - - - Cash dividends - $1.2 per share - - - - - (4,033,736 ) - - - - - (4,033,736 ) - (4,033,736 )
Equity component of convertible bonds issued by
the Corporation - - 185,411 - - - - - - - - 185,411 - 185,411 Changes in capital surplus from investments in
associates accounted for using equity method - - 8,451 - - - - - - - - 8,451 - 8,451 Net profit for the year ended December 31, 2018 - - - - - 11,117,094 - - - - - 11,117,094 3,772,103 14,889,197 Other comprehensive income (loss) for the year
ended December 31, 2018, net of income tax - - - - - 351,764 (3,211 ) 1,343,257 - 2,449 1,342,495 1,694,259 (258,086 ) 1,436,173 Cash dividends distributed by subsidiaries - - - - - - - - - - - - (723,504 ) (723,504 ) Disposal of investments in equity instruments
designated as at fair value through other comprehensive income by associates - - - - - (3,408,697 ) - 3,408,697 - - 3,408,697 - - -
Other changes in equity from investments in
associates accounted for using equity method - - - - - (17,172 ) - - - - - (17,172 ) (2 ) (17,174 ) BALANCE AT DECEMBER 31, 2018 3,361,447 33,614,472 1,362,554 15,615,380 63,945,145 20,358,461 (2,641,364 ) 5,268,916 307,728 60,934 2,996,214 137,892,226 21,156,120 159,048,346 Effect of retrospective application and
retrospective restatement - - - - - (143,100 ) - - - - - (143,100 ) (4 ) (143,104 ) BALANCE AT JANUARY 1, 2019 AS
RESTATED 3,361,447 33,614,472 1,362,554 15,615,380 63,945,145 20,215,361 (2,641,364 ) 5,268,916 307,728 60,934 2,996,214 137,749,126 21,156,116 158,905,242 Appropriation of 2018 earnings
Legal reserve - - - 1,111,709 - (1,111,709 ) - - - - - - - - Special reserve - - - - 518,281 (518,281 ) - - - - - - - - Cash dividends - $2.8 per share - - - - - (9,412,052 ) - - - - - (9,412,052 ) - (9,412,052 )
Changes in capital surplus from investments in
associates accounted for using equity method - - 93,500 - - - - - - - - 93,500 - 93,500 Net profit for the year ended December 31, 2019 - - - - - 17,459,673 - - - - - 17,459,673 4,784,280 22,243,953 Other comprehensive income (loss) for the year
ended December 31, 2019, net of income tax - - - - - 676,889 (3,271,837 ) 2,719,118 77,486 (8,793 ) (484,026 ) 192,863 (810,167 ) (617,304 ) Cash dividends distributed by subsidiaries - - - - - - - - - - - - (1,748,520 ) (1,748,520 ) Disposal of investments in equity instruments
designated as at fair value through other comprehensive income by associates - - - - - 79,711 - (79,711 ) - - (79,711 ) - - -
Other changes in equity from investments in
associates accounted for using equity method - - - - - (15,752 ) - - - - - (15,752 ) (29 ) (15,781 ) BALANCE AT DECEMBER 31, 2019 3,361,447 $ 33,614,472 $ 1,456,054 $ 16,727,089 $ 64,463,426 $ 27,373,840 $ (5,913,201 ) $ 7,908,323 $ 385,214 $ 52,141 $ 2,432,477 $ 146,067,358 $ 23,381,680 $ 169,449,038 The accompanying notes are an integral part of the consolidated financial statements. (With Deloitte & Touche auditors’ report dated March 25, 2020)
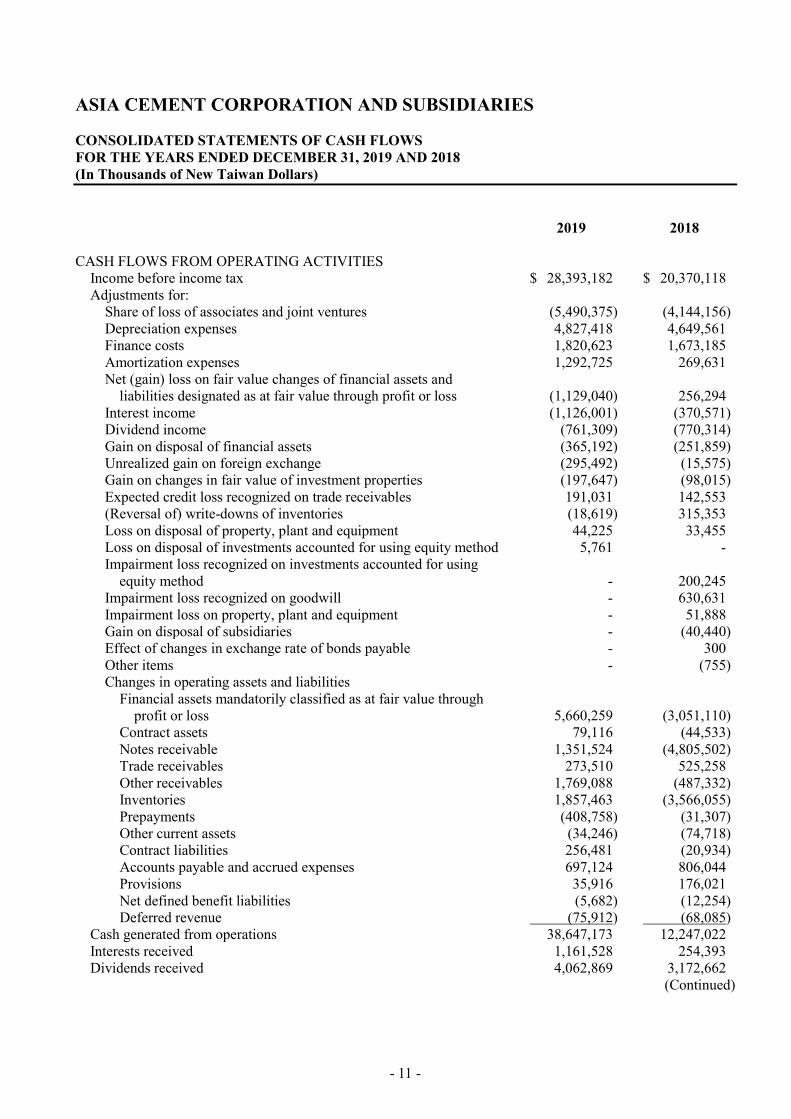
- 11 -
ASIA CEMENT CORPORATION AND SUBSIDIARIES CONSOLIDATED STATEMENTS OF CASH FLOWS FOR THE YEARS ENDED DECEMBER 31, 2019 AND 2018 (In Thousands of New Taiwan Dollars) 2019 2018 CASH FLOWS FROM OPERATING ACTIVITIES
Income before income tax $ 28,393,182 $ 20,370,118 Adjustments for:
Share of loss of associates and joint ventures (5,490,375) (4,144,156) Depreciation expenses 4,827,418 4,649,561 Finance costs 1,820,623 1,673,185 Amortization expenses 1,292,725 269,631 Net (gain) loss on fair value changes of financial assets and
liabilities designated as at fair value through profit or loss (1,129,040) 256,294 Interest income (1,126,001) (370,571) Dividend income (761,309) (770,314) Gain on disposal of financial assets (365,192) (251,859) Unrealized gain on foreign exchange (295,492) (15,575) Gain on changes in fair value of investment properties (197,647) (98,015) Expected credit loss recognized on trade receivables 191,031 142,553 (Reversal of) write-downs of inventories (18,619) 315,353 Loss on disposal of property, plant and equipment 44,225 33,455 Loss on disposal of investments accounted for using equity method 5,761 - Impairment loss recognized on investments accounted for using
equity method - 200,245 Impairment loss recognized on goodwill - 630,631 Impairment loss on property, plant and equipment - 51,888 Gain on disposal of subsidiaries - (40,440) Effect of changes in exchange rate of bonds payable - 300 Other items - (755) Changes in operating assets and liabilities
Financial assets mandatorily classified as at fair value through profit or loss 5,660,259 (3,051,110)
Contract assets 79,116 (44,533) Notes receivable 1,351,524 (4,805,502) Trade receivables 273,510 525,258 Other receivables 1,769,088 (487,332) Inventories 1,857,463 (3,566,055) Prepayments (408,758) (31,307) Other current assets (34,246) (74,718) Contract liabilities 256,481 (20,934) Accounts payable and accrued expenses 697,124 806,044 Provisions 35,916 176,021 Net defined benefit liabilities (5,682) (12,254) Deferred revenue (75,912) (68,085)
Cash generated from operations 38,647,173 12,247,022 Interests received 1,161,528 254,393 Dividends received 4,062,869 3,172,662
(Continued)

- 12 -
ASIA CEMENT CORPORATION AND SUBSIDIARIES CONSOLIDATED STATEMENTS OF CASH FLOWS FOR THE YEARS ENDED DECEMBER 31, 2019 AND 2018 (In Thousands of New Taiwan Dollars) 2019 2018
Interests paid $ (1,803,500) $ (1,658,691) Income tax paid (4,796,169) (3,304,318)
Net cash generated from operating activities 37,271,901 10,711,068
CASH FLOWS FROM INVESTING ACTIVITIES
Purchase of financial assets at amortized cost (8,715,533) (9,537,968) Payments for property, plant and equipment (3,754,851) (4,274,600) Acquisition of associates (3,326,114) (123,120) Decrease (increase) in refundable deposits 596,780 (9,678) Purchase of financial assets at fair value through other comprehensive
income (275,281) (556,016) Increase in long-term prepayments for investment (11,224) (83,721) Net cash inflow on disposal of associates 63,008 - Payments for intangible assets (58,941) (13,037) Proceeds from disposal of property, plant and equipment 37,708 90,395 Payments for investment properties (27,224) (1,269) Decrease in other non-current assets 5,300 1,559 Net cash inflow on disposal of subsidiaries - 48,391
Net cash used in investing activities (15,466,372) (14,459,064)
CASH FLOWS FROM FINANCING ACTIVITIES
Repayments of long-term borrowings (92,064,122) (30,396,615) Proceeds from long-term borrowings 86,653,202 34,819,996 Proceeds from issuance of bonds 10,000,000 6,574,843 Dividends paid (9,412,164) (4,033,715) Repayments of bonds (4,000,000) (4,089,430) Dividends paid to non-controlling interests (1,748,520) (723,504) (Decrease) increase in short-term borrowings (704,248) 6,445,333 Increase in short-term bills payable 369,075 2,439,125 Repayment of the principal portion of lease liabilities (267,792) - Increase (decrease) in other non-current liabilities 21,680 (59,096) (Decrease) increase in guarantee deposits received (10,073) 14,691
Net cash (used in) generated from financing activities (11,162,962) 10,991,628
EFFECTS OF EXCHANGE RATE CHANGES ON THE BALANCE
OF CASH AND CASH EQUIVALENTS HELD IN FOREIGN CURRENCIES (836,483) (53,713)
(Continued)
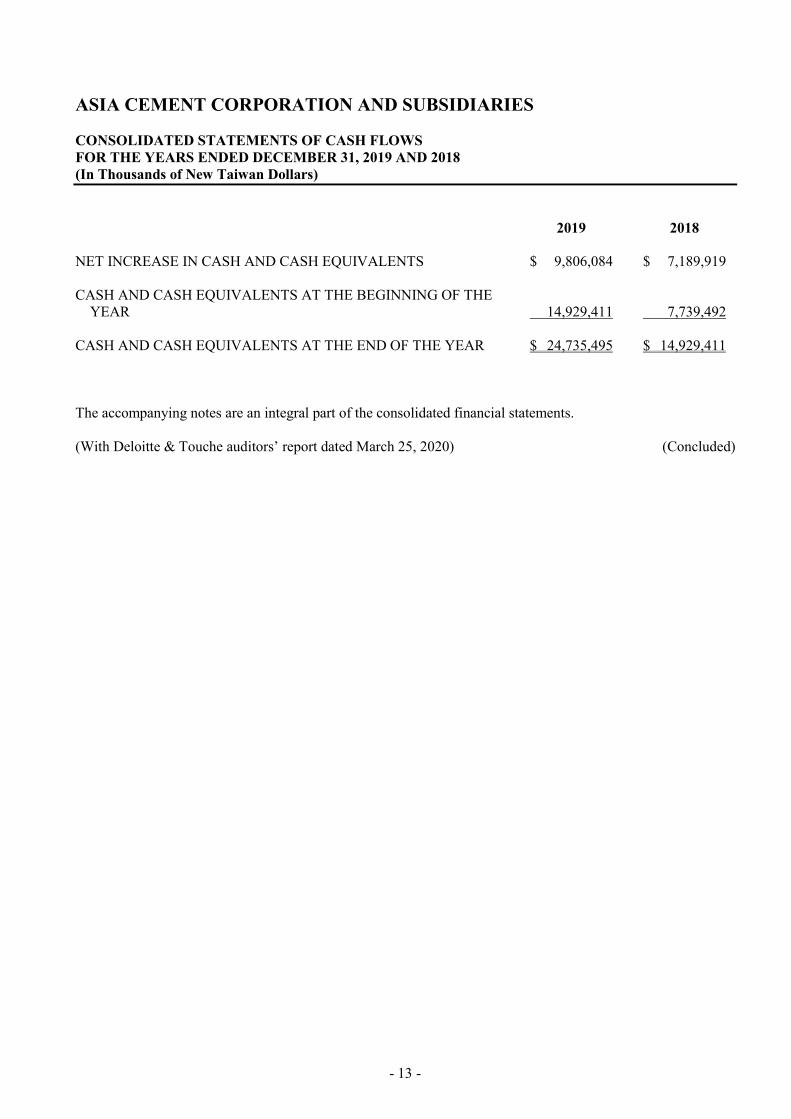
- 13 -
ASIA CEMENT CORPORATION AND SUBSIDIARIES CONSOLIDATED STATEMENTS OF CASH FLOWS FOR THE YEARS ENDED DECEMBER 31, 2019 AND 2018 (In Thousands of New Taiwan Dollars) 2019 2018 NET INCREASE IN CASH AND CASH EQUIVALENTS $ 9,806,084 $ 7,189,919 CASH AND CASH EQUIVALENTS AT THE BEGINNING OF THE
YEAR 14,929,411 7,739,492 CASH AND CASH EQUIVALENTS AT THE END OF THE YEAR $ 24,735,495 $ 14,929,411 The accompanying notes are an integral part of the consolidated financial statements. (With Deloitte & Touche auditors’ report dated March 25, 2020) (Concluded)

- 14 -
ASIA CEMENT CORPORATION AND SUBSIDIARIES NOTES TO CONSOLIDATED FINANCIAL STATEMENTS FOR THE YEARS ENDED DECEMBER 31, 2019 AND 2018 (In Thousands of New Taiwan Dollars, Unless Stated Otherwise) 1. ORGANIZATION AND OPERATIONS
Asia Cement Corporation (the “Corporation”) was incorporated in March 1957. It manufactures and sells cement, clinker, cement-related products and ready-mixed concrete, and engages in leasing activities. The Corporation is also required to undertake reforestation activities in designated areas. The Corporation’s shares have been listed on the Taiwan Stock Exchange since June 1962. In June 1992 and September 1996, certain shares of the Corporation were sold by Far Eastern New Century Corporation (FENC) in the form of global depositary shares (GDSs). Such GDSs have been quoted through the SEAQ system of the London Stock Exchange and traded through the portal system of the National Association of Securities Dealers, Inc. As of December 31, 2019, the issued and outstanding GDSs aggregated 17,049 units, representing 170,487 shares of the Corporation. The consolidated financial statements are presented in the Corporation’s functional currency, New Taiwan dollar.
2. APPROVAL OF FINANCIAL STATEMENTS
The consolidated financial statements were approved by the Corporation’s board of directors and authorized for issue on March 25, 2020.
3. APPLICATION OF NEW, AMENDED AND REVISED STANDARDS AND INTERPRETATIONS
a. Initial application of the amendments to the Regulations Governing the Preparation of Financial Reports by Securities Issuers and the International Financial Reporting Standards (IFRS), International Accounting Standards (IAS), IFRIC Interpretations (IFRIC), and SIC Interpretations (SIC) (collectively, the “IFRSs”) endorsed and issued into effect by the Financial Supervisory Commission (FSC) Except for the following, the initial application of the amendments to the Regulations Governing the Preparation of Financial Reports by Securities Issuers and the IFRSs endorsed and issued into effect by the FSC did not have any material impact on the Group’s accounting policies: IFRS 16 “Leases” IFRS 16 provides a comprehensive model for the identification of lease arrangements and their treatment in the financial statements of both lessee and lessor. It supersedes IAS 17 “Leases”, IFRIC 4 “Determining whether an Arrangement contains a Lease”, and a number of related interpretations. Refer to Note 4 for information relating to the relevant accounting policies. Definition of a lease The Group elects to apply the guidance of IFRS 16 in determining whether contracts are, or contain, a lease only to contracts entered into (or changed) on or after January 1, 2019. Contracts identified as containing a lease under IAS 17 and IFRIC 4 are not reassessed and are accounted for in accordance with the transitional provisions under IFRS 16.

- 15 -
The Group as lessee The Group recognizes right-of-use assets and lease liabilities for all leases on the consolidated balance sheets except for those whose payments under low-value asset and short-term leases are recognized as expenses on a straight-line basis. On the consolidated statements of comprehensive income, the Group presents the depreciation expense charged on right-of-use assets separately from the interest expense accrued on lease liabilities; interest is computed using the effective interest method. On the consolidated statements of cash flows, cash payments for the principal portion of lease liabilities are classified within financing activities; cash payments for the interest portion are classified within operating activities. Prior to the application of IFRS 16, payments under operating lease contracts were recognized as expenses on a straight-line basis. Prepaid lease payments for land use rights of land located in mainland China, Hong Kong, Singapore and Vietnam are recognized as prepayments for leases. Cash flows for operating leases were classified within operating activities on the consolidated statements of cash flows. The Group elects to apply IFRS 16 retrospectively with the cumulative effect of the initial application of this standard recognized in retained earnings on January 1, 2019. Comparative information is not restated. Lease liabilities were recognized on January 1, 2019 for leases previously classified as operating leases under IAS 17. Lease liabilities were measured at the present value of the remaining lease payments, discounted using the lessee’s incremental borrowing rate on January 1, 2019. Right-of-use assets are measured at an amount equal to the lease liabilities, adjusted by the amount of any prepaid or accrued lease payments. The Group applies IAS 36 to all right-of-use assets. The Group also applies the following practical expedients: 1) The Group applies a single discount rate to a portfolio of leases with reasonably similar
characteristics to measure lease liabilities. 2) The Group accounts for those leases for which the lease term ends on or before December 31, 2019
as short-term leases. 3) The Group uses hindsight, such as in determining lease terms, to measure lease liabilities. For leases previously classified as finance leases under IAS 17, the carrying amounts of right-of-use assets and lease liabilities on January 1, 2019 are determined as at the carrying amounts of the respective leased assets and finance lease payables on December 31, 2018. The lessee’s incremental borrowing rate applied to lease liabilities recognized on January 1, 2019 is 1.06%-3.79%. The difference between the lease liabilities recognized and operating lease commitments disclosed under IAS 17 on December 31, 2018 is explained as follows: The future minimum lease payments of non-cancellable operating lease
commitments on December 31, 2018 $ 3,765,752 Less: Recognition exemption for short-term leases and low-value assets leases (217,813) Less: Adjustments relating to changes in the index or rate affecting variable
payments (1,786,274) Undiscounted amounts on January 1, 2019 $ 1,761,665 Lease liabilities recognized on January 1, 2019 $ 1,260,607
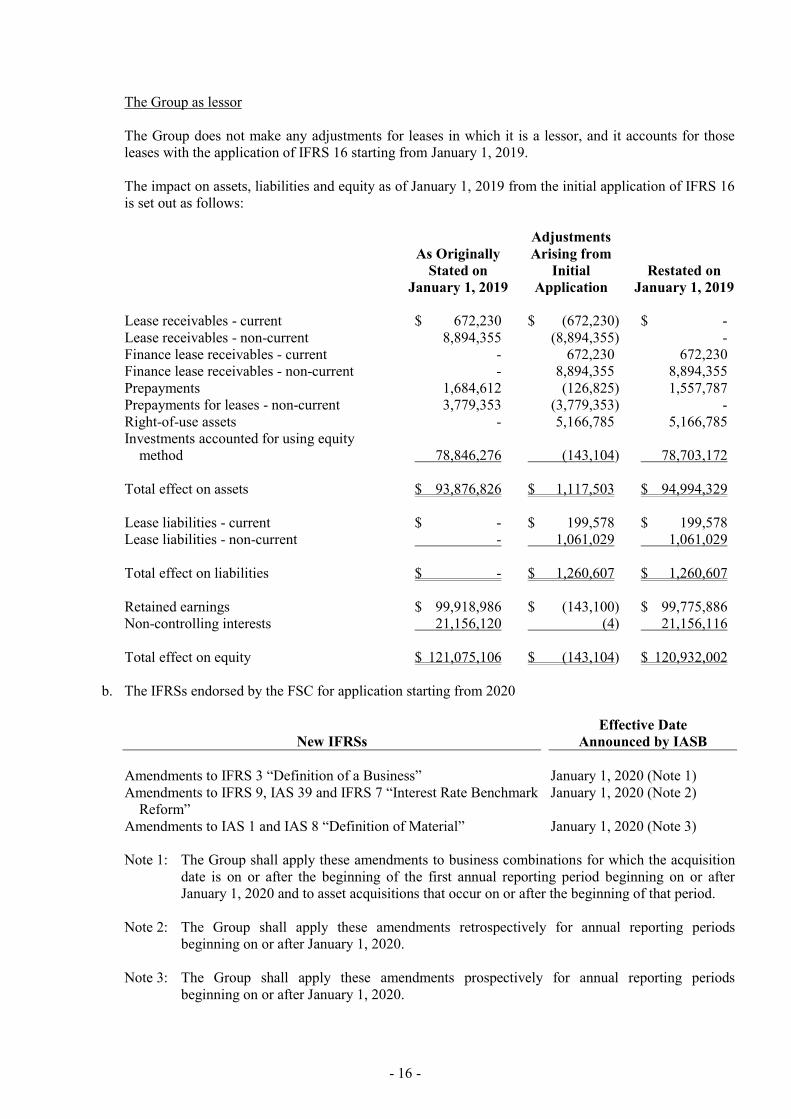
- 16 -
The Group as lessor The Group does not make any adjustments for leases in which it is a lessor, and it accounts for those leases with the application of IFRS 16 starting from January 1, 2019. The impact on assets, liabilities and equity as of January 1, 2019 from the initial application of IFRS 16 is set out as follows:
As Originally Stated on
January 1, 2019
Adjustments Arising from
Initial Application
Restated on January 1, 2019
Lease receivables - current $ 672,230 $ (672,230) $ - Lease receivables - non-current 8,894,355 (8,894,355) - Finance lease receivables - current - 672,230 672,230 Finance lease receivables - non-current - 8,894,355 8,894,355 Prepayments 1,684,612 (126,825) 1,557,787 Prepayments for leases - non-current 3,779,353 (3,779,353) - Right-of-use assets - 5,166,785 5,166,785 Investments accounted for using equity
method 78,846,276 (143,104) 78,703,172 Total effect on assets $ 93,876,826 $ 1,117,503 $ 94,994,329 Lease liabilities - current $ - $ 199,578 $ 199,578 Lease liabilities - non-current - 1,061,029 1,061,029 Total effect on liabilities $ - $ 1,260,607 $ 1,260,607 Retained earnings $ 99,918,986 $ (143,100) $ 99,775,886 Non-controlling interests 21,156,120 (4) 21,156,116 Total effect on equity $ 121,075,106 $ (143,104) $ 120,932,002
b. The IFRSs endorsed by the FSC for application starting from 2020
New IFRSs Effective Date
Announced by IASB Amendments to IFRS 3 “Definition of a Business” January 1, 2020 (Note 1) Amendments to IFRS 9, IAS 39 and IFRS 7 “Interest Rate Benchmark
Reform” January 1, 2020 (Note 2)
Amendments to IAS 1 and IAS 8 “Definition of Material” January 1, 2020 (Note 3) Note 1: The Group shall apply these amendments to business combinations for which the acquisition
date is on or after the beginning of the first annual reporting period beginning on or after January 1, 2020 and to asset acquisitions that occur on or after the beginning of that period.
Note 2: The Group shall apply these amendments retrospectively for annual reporting periods
beginning on or after January 1, 2020. Note 3: The Group shall apply these amendments prospectively for annual reporting periods
beginning on or after January 1, 2020.

- 17 -
As of the date the consolidated financial statements were authorized for issue, the Group is continuously assessing the possible impact that the application of the above standards and interpretations will have on the Group’s financial position and financial performance and will disclose the relevant impact when the assessment is completed.
c. New IFRSs in issue but not yet endorsed and issued into effect by the FSC
New IFRSs Effective Date
Announced by IASB (Note) Amendments to IFRS 10 and IAS 28 “Sale or Contribution of Assets
between an Investor and its Associate or Joint Venture” To be determined by IASB
IFRS 17 “Insurance Contracts” January 1, 2021 Amendments to IAS 1 “Classification of Liabilities as Current or
Non-current” January 1, 2022
Note: Unless stated otherwise, the above New IFRSs are effective for annual reporting periods
beginning on or after their respective effective dates. As of the date the consolidated financial statements were authorized for issue, the Group is continuously assessing the possible impact that the application of the above standards and interpretations will have on the Group’s financial position and financial performance and will disclose the relevant impact when the assessment is completed.
4. SUMMARY OF SIGNIFICANT ACCOUNTING POLICIES
a. Statement of compliance
The consolidated financial statements have been prepared in accordance with the Regulations Governing the Preparation of Financial Reports by Securities Issuers and IFRSs as endorsed and issued into effect by the FSC.
b. Basis of preparation The consolidated financial statements have been prepared on the historical cost basis except for financial instruments, investment properties which are measured at fair value, and net defined benefit assets (liabilities) which are measured at the present value of the defined benefit obligation less the fair value of plan assets. The fair value measurements, which are grouped into Levels 1 to 3 based on the degree to which the fair value measurement inputs are observable and based on the significance of the inputs to the fair value measurement in its entirety, are described as follows: 1) Level 1 inputs are quoted prices (unadjusted) in active markets for identical assets or liabilities; 2) Level 2 inputs are inputs other than quoted prices included within Level 1 that are observable for an
asset or liability, either directly (i.e., as prices) or indirectly (i.e., derived from prices); and 3) Level 3 inputs are unobservable inputs for an asset or liability.

- 18 -
Classification of Current and Non-current Assets and Liabilities Current assets include: a. Assets held primarily for the purpose of trading; b. Assets expected to be realized within 12 months after the reporting period; and c. Cash and cash equivalents unless the asset is restricted from being exchanged or used to settle a liability
for at least 12 months after the reporting period. Current liabilities include: a. Liabilities held primarily for the purpose of trading; b. Liabilities due to be settled within 12 months after the reporting period, even if an agreement to
refinance, or to reschedule payments, on a long-term basis is completed after the reporting period and before the consolidated financial statements are authorized for issue; and
c. Liabilities for which the Group does not have an unconditional right to defer settlement for at least 12
months after the reporting period. Terms of a liability that could, at the option of the counterparty, result in its settlement by the issue of equity instruments do not affect its classification.
Assets and liabilities that are not classified as current are classified as non-current. Ya Li Precast and Prestressed Concrete Industries Corp., Asia Engineering Enterprise Corp. and Ya Li Precast Concrete India Pvt. Ltd. engage in construction related businesses, which have operating cycles of over one year. The assets and liabilities of the aforementioned companies related to the construction contracts are classified as current or non-current according to the length of their operating cycles. Basis of Consolidation Principles for preparing consolidated financial statements The consolidated financial statements incorporate the financial statements of the Corporation and the entities controlled by the Corporation (i.e., its subsidiaries). Income and expenses of subsidiaries acquired or disposed of during the period are included in the consolidated statement of profit or loss and other comprehensive income from the effective dates of acquisitions up to the effective dates of disposals, as appropriate. When necessary, adjustments are made to the financial statements of subsidiaries to bring their accounting policies into line with those used by the Corporation. All intra-group transactions, balances, income and expenses are eliminated in full upon consolidation. Total comprehensive income of subsidiaries is attributed to the owners of the Corporation and to the non-controlling interests even if this results in the non-controlling interests having a deficit balance. Changes in the Group’s ownership interests in subsidiaries that do not result in the Group losing control over the subsidiaries are accounted for as equity transactions. The carrying amounts of the interests of the Group and the non-controlling interests are adjusted to reflect the changes in their relative interests in the subsidiaries. Any difference between the amount by which the non-controlling interests are adjusted and the fair value of the consideration paid or received is recognized directly in equity and attributed to the owners of the Corporation.

- 19 -
Refer to Note 14, Tables 7 and 8 for detailed information on subsidiaries (including percentages of ownership and main businesses). Foreign Currencies In preparing the financial statements of each individual entity, transactions in currencies other than the entity’s functional currency (i.e., foreign currencies) are recognized at the rates of exchange prevailing at the dates of the transactions. At the end of each reporting period, monetary items denominated in foreign currencies are retranslated at the rates prevailing at that date. Exchange differences on monetary items arising from settlement or translation are recognized in profit or loss in the period in which they arise. Non-monetary items measured at fair value that are denominated in foreign currencies are retranslated at the rates prevailing at the date when the fair value was determined. Exchange differences arising from the retranslation of non-monetary items are included in profit or loss for the period except for exchange differences arising from the retranslation of non-monetary items in respect of which gains and losses are recognized directly in other comprehensive income, in which cases, the exchange differences are also recognized directly in other comprehensive income. Non-monetary items that are measured at historical cost in a foreign currency are translated using the exchange rate at the date of the transaction. For the purpose of presenting consolidated financial statements, the functional currencies of the Group (including subsidiaries, associates, joint ventures and branches in other countries that use currencies which are different from the currency of the Corporation) are translated into the presentation currency, the New Taiwan dollar, as follows: Assets and liabilities are translated at the exchange rates prevailing at the end of the reporting period; and income and expense items are translated at the average exchange rates for the period. The resulting currency translation differences are recognized in other comprehensive income (attributed to the owners of the Corporation and non-controlling interests as appropriate). On the disposal of a foreign operation, all of the exchange differences accumulated in equity in respect of that operation attributable to the owners of the Corporation are reclassified to profit or loss. Inventories Inventories consist of raw materials, supplies, finished goods and work-in-process and are stated at the lower of cost or net realizable value. Inventory write-downs are made by item, except where it may be appropriate to group similar or related items. The net realizable value is the estimated selling price of inventories less all estimated costs of completion and costs necessary to make the sale. Inventories are recorded at the weighted-average cost on the balance sheet date. Investments in Associates and Joint Ventures An associate is an entity over which the Group has significant influence and which is neither a subsidiary nor an interest in a joint venture. A joint venture is a joint arrangement whereby the Group and other parties that have joint control of the arrangement have rights to the net assets of the arrangement. The Group uses the equity method to account for its investments in associates and joint ventures. Under the equity method, investments in an associate and a joint venture are initially recognized at cost and adjusted thereafter to recognize the Group’s share of profit or loss and other comprehensive income of the associate and joint venture. The Group also recognizes the changes in the Group’s share of equity of associates and joint ventures attributable to the Group.

- 20 -
Any excess of the cost of acquisition over the Group’s share of net fair value of the identifiable assets and liabilities of an associate or a joint venture at the date of acquisition is recognized as goodwill, which is included within the carrying amount of the investment and is not amortized. Any excess of the Group’s share of net fair value of the identifiable assets and liabilities over the cost of acquisition, after reassessment, is recognized immediately in profit or loss. If the measurement of the fair values of the identifiable net assets and liabilities of an associate acquired in stage is incomplete by the end of the reporting period, the Group reports provisional amounts for the items for which the accounting is incomplete. Those provisional amounts are adjusted retrospectively during the measurement period. Measurement period adjustments are adjustments that arise from additional information obtained during the measurement period about facts and circumstances that existed as of the acquisition date. The measurement period does not exceed 1 year from the acquisition date. When the Group subscribes for additional new shares of an associate and joint venture at a percentage different from its existing ownership percentage, the resulting carrying amount of the investment differs from the amount of the Group’s proportionate interest in the associate and joint venture. The Group records such a difference as an adjustment to investments with the corresponding amount charged or credited to capital surplus - changes in capital surplus from investments in associates and joint ventures accounted for using equity method. If the Group’s ownership interest is reduced due to its additional subscription of the new shares of the associate and joint venture, the proportionate amount of the gains or losses previously recognized in other comprehensive income in relation to that associate and joint venture is reclassified to profit or loss on the same basis as would be required if the investee had directly disposed of the related assets or liabilities. When the adjustment should be debited to capital surplus, but the capital surplus recognized from investments accounted for using equity method is insufficient, the shortage is debited to retained earnings. The entire carrying amount of an investment (including goodwill) is tested for impairment as a single asset by comparing its recoverable amount with its carrying amount. Any impairment loss recognized is deducted from the carrying amount of the investment. Any reversal of that impairment loss is recognized to the extent that the recoverable amount of the investment subsequently increases. The Group discontinues the use of the equity method from the date on which its investment ceases to be an associate and a joint venture. Any retained investment is measured at fair value at that date, and the fair value is regarded as the investment’s fair value on initial recognition as a financial asset. The difference between the previous carrying amount of the associate and joint venture attributable to the retained interest and its fair value is included in the determination of the gain or loss on disposal of the associate and the joint venture. The Group accounts for all amounts previously recognized in other comprehensive income in relation to that associate and joint venture on the same basis as would be required if that associate had directly disposed of the related assets or liabilities. If an investment in an associate becomes an investment in a joint venture or an investment in a joint venture becomes an investment in an associate, the Group continues to apply the equity method and does not remeasure the retained interest. When the Group transacts with its associate and joint venture, profits and losses resulting from the transactions with the associate and joint venture are recognized in the Group’s consolidated financial statements only to the extent of unrelated parties’ interests in the associate and joint venture. The Group’s share of comprehensive income of associates or joint ventures is recognized using the treasury share method if there are reciprocal holdings between investors and investees. The reciprocally held shares of the Group are treated as treasury shares and are deducted from the outstanding shares in computing basic earnings per share.

- 21 -
Property, Plant and Equipment Property, plant and equipment are stated at cost, less accumulated depreciation and accumulated impairment loss. Major renewals and betterments are capitalized, while maintenance and repairs are expensed currently. Properties in the course of construction are depreciated and classified to the appropriate categories of property, plant and equipment when completed and ready for intended use. Depreciation is recognized using the fixed-percentage-on-declining-balance method or the straight-line method. Each significant part is depreciated separately. The estimated useful lives, residual values and depreciation methods are reviewed at the end of each reporting period, with the effect of any changes in estimate accounted for on a prospective basis. On derecognition of an item of property, plant and equipment, the difference between the sales proceeds and the carrying amount of the asset is recognized in profit or loss. Investment Properties Investment properties are properties held to earn rentals and/or for capital appreciation. Investment properties also include land held for a currently undetermined future use. Freehold investment properties are initially measured at cost, including transaction costs, and are subsequently measured using the fair value model. Changes in the fair value of investment properties are included in profit or loss for the period in which they arise. For a transfer from property, plant and equipment to investment property at the end of owner-occupation, any difference between the fair value and the carrying amount of the property at the date of transfer is recognized in other comprehensive income. On derecognition of an investment property, the difference between the net disposal proceeds and the carrying amount of the asset is included in profit or loss. Goodwill Goodwill arising from the acquisition of a business is measured at cost as established at the date of acquisition of the business less accumulated impairment loss. For the purposes of impairment testing, goodwill is allocated to each of the Group’s cash-generating units or groups of cash-generating units (referred to as “cash-generating units”) that is expected to benefit from the synergies of the combination. A cash-generating unit to which goodwill has been allocated is tested for impairment annually or more frequently when there is an indication that the unit may be impaired, by comparing its carrying amount, including the attributed goodwill, with its recoverable amount. However, if the goodwill allocated to a cash-generating unit was acquired in a business combination during the current annual period, that unit is tested for impairment before the end of the current annual period. If the recoverable amount of the cash-generating unit is less than its carrying amount, the impairment loss is allocated first to reduce the carrying amount of any goodwill allocated to the unit and then pro rata to the other assets of the unit based on the carrying amount of each asset in the unit. Any impairment loss is recognized directly in profit or loss. Any impairment loss recognized for goodwill is not reversed in subsequent periods.
- 22 -
Intangible Assets Intangible assets with finite useful lives that are acquired separately are initially measured at cost and subsequently measured at cost less accumulated amortization and accumulated impairment loss. Amortization is recognized on a straight-line basis. The estimated useful life, residual value, and amortization method are reviewed at the end of each reporting period, with the effect of any changes in estimate accounted for on a prospective basis. Intangible assets acquired in a business combination and recognized separately from goodwill are initially recognized at their fair value at the acquisition date (which is regarded as their cost). Subsequent to initial recognition, they are measured on the same basis as intangible assets that are acquired separately. On derecognition of an intangible asset, the difference between the net disposal proceeds and the carrying amount of the asset is recognized in profit or loss. Impairment of Tangible and Intangible Assets Other than Goodwill At the end of each reporting period, the Group reviews the carrying amounts of its tangible and intangible assets, excluding goodwill, to determine whether there is any indication that those assets have suffered any impairment loss. If any such indication exists, the recoverable amount of the asset is estimated in order to determine the extent of the impairment loss. When it is not possible to estimate the recoverable amount of an individual asset, the Group estimates the recoverable amount of the cash-generating unit to which the asset belongs. Corporate assets are allocated to the smallest group of cash-generating units on a reasonable and consistent basis of allocation. Intangible assets with indefinite useful lives and intangible assets not yet available for use are tested for impairment at least annually, and whenever there is an indication that the asset may be impaired. The recoverable amount is the higher of fair value less costs to sell and value in use. If the recoverable amount of an asset or cash-generating unit is estimated to be less than its carrying amount, the carrying amount of the asset or cash-generating unit is reduced to its recoverable amount, with the resulting impairment loss recognized in profit or loss. When an impairment loss is subsequently reversed, the carrying amount of the corresponding asset or cash-generating unit is increased to the revised estimate of its recoverable amount, but only to the extent of the carrying amount that would have been determined had no impairment loss been recognized for the asset or cash-generating unit in prior years. A reversal of an impairment loss is recognized in profit or loss. Financial Instruments Financial assets and financial liabilities are recognized when the Group becomes a party to the contractual provisions of the instruments. Financial assets and financial liabilities are initially measured at fair value. Transaction costs that are directly attributable to an acquisition or issuance of financial assets and financial liabilities (other than financial assets and financial liabilities at FVTPL) are added to or deducted from the fair value of the financial assets or financial liabilities, as appropriate, on initial recognition. Transaction costs directly attributable to the acquisition of financial assets or financial liabilities at FVTPL are recognized immediately in profit or loss.

- 23 -
Financial assets All regular way purchases or sales of financial assets are recognized and derecognized on a trade date basis. a. Measurement category
Financial assets are classified into the following categories: Financial assets at FVTPL, financial assets at amortized cost, and investments in equity instruments at FVTOCI. 1) Financial assets at FVTPL
Financial asset is classified as at FVTPL when the financial asset is mandatorily classified as at FVTPL. Financial assets mandatorily classified as at FVTPL include investments in equity instruments which are not designated as at FVTOCI and debt instruments that do not meet the amortized cost criteria or the FVTOCI criteria. Financial assets at FVTPL are subsequently measured at fair value, with any gains or losses arising on remeasurement recognized in profit or loss. The net gain or loss recognized in profit or loss does not incorporate any dividend or interest earned on the financial asset. Fair value is determined in the manner described in Note 36.
2) Financial assets at amortized cost Financial assets that meet the following conditions are subsequently measured at amortized cost: a) The financial asset is held within a business model whose objective is to hold financial asset in
order to collect contractual cash flows; and b) The contractual terms of the financial asset give rise on specified dates to cash flows that are
solely payments of principal and interest on the principal amount outstanding. Subsequent to initial recognition, financial assets at amortized cost, including cash and cash equivalents, trade receivables, other receivables and debt instruments at amortized cost, are measured at amortized cost, which is the gross carrying amount determined by the effective interest method less any impairment loss. Exchange differences are recognized in profit or loss. Interest income is calculated by applying the effective interest rate to the gross carrying amount of the financial asset. Cash equivalents include time deposits, bonds sold under repurchase agreements and commercial papers with original maturities within 3 months from the date of acquisition, which are highly liquid, readily convertible to a known amount of cash and are subject to an insignificant risk of changes in value. These cash equivalents are held for the purpose of meeting short-term cash commitments.
3) Investments in equity instruments at FVTOCI On initial recognition, the Group may make an irrevocable election to designate investments in equity instruments as at FVTOCI. Designation at FVTOCI is not permitted if the equity investment is held for trading or if it is contingent consideration recognized by an acquirer in a business combination. Investments in equity instruments at FVTOCI are subsequently measured at fair value with gains and losses arising from changes in fair value recognized in other comprehensive income and accumulated in other equity. The cumulative gain or loss will not be reclassified to profit or loss on disposal of the equity investments, instead, they will be transferred to retained earnings.

- 24 -
Dividends on these investments in equity instruments are recognized in profit or loss when the Group’s right to receive the dividends is established, unless the dividends clearly represent a recovery of part of the cost of the investment.
b. Impairment of financial assets
The Group recognizes a loss allowance for expected credit loss (ECLs) on financial assets at amortized cost (including trade receivables) as well as finance lease receivables at the end of each reporting period. The Group always recognizes lifetime ECLs for trade receivables. For all other financial instruments and finance lease receivables, the Group recognizes lifetime ECLs when there has been a significant increase in credit risk since initial recognition. If, on the other hand, the credit risk on the financial instrument has not increased significantly since initial recognition, the Group measures the loss allowance for that financial instrument at an amount equal to 12-month ECLs. ECLs reflect the weighted average of credit losses with the respective risks of default occurring as the weights. Lifetime ECLs represent the expected credit losses that will result from all possible default events over the expected life of a financial instrument. In contrast, 12-month ECLs represent the portion of lifetime ECLs that is expected to result from default events on a financial instrument that are possible within 12 months after the reporting date. Impairment loss on all financial instruments is recognized with a corresponding adjustment to their carrying amount through a loss allowance account.
c. Derecognition of financial assets The Group derecognizes a financial asset only when the contractual rights to the cash flows from the asset expire, or when it transfers the financial asset and substantially all the risks and rewards of ownership of the asset to another party. On derecognition of a financial asset at amortized cost in its entirety, the difference between the asset’s carrying amount and the sum of the consideration received and receivable is recognized in profit or loss. On derecognition of an investment in an equity instrument at FVTOCI, the cumulative gain or loss which had been recognized in other comprehensive income is transferred directly to retained earnings, without recycling through profit or loss.
Financial liabilities a. Subsequent measurement
Except the following situation, all financial liabilities are measured at amortized cost using the effective interest method: Financial liabilities are held for trading and are stated at fair value, and any interest paid on such financial liabilities is recognized in finance costs; any remeasurement gains or losses on such financial liabilities are recognized in other gains or losses. Fair value is determined in the manner described in Note 36.
b. Derecognition of financial liabilities
The difference between the carrying amount of the financial liability derecognized and the consideration paid, including any non-cash assets transferred or liabilities assumed, is recognized in profit or loss.
- 25 -
Convertible bonds The component parts of convertible bonds issued by the Group are classified separately as financial liabilities and equity in accordance with the substance of the contractual arrangements and the definitions of a financial liability and an equity instrument. On initial recognition, the fair value of the liability component is estimated using the prevailing market interest rate for similar non-convertible instruments. This amount is recorded as a liability on an amortized cost basis using the effective interest method until extinguished upon conversion or upon the instrument’s maturity date. Any embedded derivative liability is measured at fair value. The conversion option classified as equity is determined by deducting the amount of the liability component from the fair value of the compound instrument as a whole. This is recognized and included in equity, net of income tax effects, and is not subsequently remeasured. In addition, the conversion option classified as equity will remain in equity until the conversion option is exercised; in which case, the balance recognized in equity will be transferred to capital surplus - share premiums. When the conversion option remains unexercised at maturity, the balance recognized in equity will be transferred to capital surplus - share premiums. Transaction costs that relate to the issuance of the convertible notes are allocated to the liability and equity components in proportion to the allocation of the gross proceeds. Transaction costs relating to the liability component are included in the carrying amount of the liability component. Transaction costs relating to the equity component are recognized directly in equity. Derivative financial instruments The Group enters into cross-currency swap contracts to manage its exposure to interest rate and foreign exchange rate risks. Derivatives are initially recognized at fair value at the date on which the derivative contracts are entered into and are subsequently remeasured to their fair value at the end of each reporting period. The resulting gain or loss is recognized in profit or loss immediately. When the fair value of a derivative financial instrument is positive, the derivative is recognized as a financial asset; when the fair value of a derivative financial instrument is negative, the derivative is recognized as a financial liability. Derivatives embedded in hybrid contracts that contain financial asset hosts that is within the scope of IFRS 9 are not separated; instead, the classification is determined in accordance with the entire hybrid contract. Derivatives embedded in non-derivative host contracts that are not financial assets that is within the scope of IFRS 9 (e.g., financial liabilities) are treated as separate derivatives when they meet the definition of a derivative; their risks and characteristics are not closely related to those of the host contracts; and the mixed contracts are not measured at FVTPL. Provisions Provisions are measured at the best estimate of the consideration required to settle the present obligation at the end of the reporting period, taking into account the risks and uncertainties surrounding the obligation. When a provision is measured using the cash flows estimated to settle the present obligation, its carrying amount is the present value of those cash flows. Revenue Recognition The Group identifies the contract with the customers, identifies the performance obligations in the contract, allocates the transaction price to the performance obligations, and recognizes revenue when performance obligations are satisfied.

- 26 -
When another party is involved in providing goods or services to a customer, the Group is a principal if it controls the specified good or service before that good or service is transferred to a customer; otherwise, the Group is acting as an agent. The principal recognizes revenues and costs associated with providing the goods or services at the gross amount, while an agent recognizes revenue at the net amount. When a specified good or service is a distinct good or service, the Group determines whether it is a principal or an agent for each specified good or service. The Group is a principal if it obtains control of any one of the following: a. Before the good or another asset transfers to the customer, the Group acquire the good or the control of
asset from another party. b. The right to a service to be performed by another party which gives the Group the ability to direct that
party to provide the service to the customer on its behalf. c. A good or service from another party that it then combines with other goods or services in providing a
specified good or service to the customer. Indicators to support the Group’s assessment of whether it controls a specified good or service include, but are not limited to, the following: a. The Group is primarily responsible for fulfilling the promise to provide the specified good or service. b. The Group has inventory risk before or after the specified good or service is transferred to the customer. c. The Group has discretion in establishing the price of the specified good or service. Leases 2019 At the inception of a contract, the Group assesses whether the contract is, or contains, a lease. For a contract that contains a lease component and non-lease components, the Group allocates the consideration in the contract to each component on the basis of the relative stand-alone price and accounts for each component separately. a. The Group as lessor
Leases are classified as finance leases whenever the terms of a lease transfer substantially all the risks and rewards of ownership to the lessee. All other leases are classified as operating leases. Under finance leases, the lease payments comprise fixed payments, variable lease payments which depend on an index or a rate, and residual value guarantees. The net investment in a lease is measured at (a) the present value of the sum of the lease payments receivable by a lessor and any unguaranteed residual value accrued to the lessor plus (b) initial direct costs and is presented as a finance lease receivable. Finance lease income is allocated to the relevant accounting periods so as to reflect a constant, periodic rate of return on the Group’s net investment outstanding in respect of leases. Lease payments from operating leases are recognized as income on a straight-line basis over the terms of the relevant leases. Initial direct costs incurred in obtaining operating leases are added to the carrying amounts of the underlying assets and recognized as expenses on a straight-line basis over the lease terms. Variable lease payments that do not depend on an index or a rate are recognized as income in the periods in which they are incurred.
- 27 -
When a lease includes both land and building elements, the Group assesses the classification of each element separately as a finance or an operating lease based on the assessment as to whether substantially all the risks and rewards incidental to ownership of each element have been transferred to the lessee. The lease payments are allocated between the land and the building elements in proportion to the relative fair values of the leasehold interests in the land element and building element of the lease at the inception of a contract. If the allocation of the lease payments can be made reliably, each element is accounted for separately in accordance with its lease classification. When the lease payments cannot be allocated reliably between the land and building elements, the entire lease is generally classified as a finance lease unless it is clear that both elements are operating leases; in which case, the entire lease is classified as an operating lease.
b. The Group as lessee The Group recognizes right-of-use assets and lease liabilities for all leases at the commencement date of a lease, except for short-term leases and low-value asset leases accounted for applying a recognition exemption where lease payments are recognized as expenses on a straight-line basis over the lease terms. Right-of-use assets are initially measured at cost, which comprises the initial measurement of lease liabilities adjusted for lease payments made at or before the commencement date, plus any initial direct costs incurred and an estimate of costs needed to restore the underlying assets, and less any lease incentives received. Right-of-use assets are subsequently measured at cost less accumulated depreciation and impairment losses and adjusted for any remeasurement of the lease liabilities. Right-of-use assets are presented on a separate line in the consolidated balance sheets. Right-of-use assets are depreciated using the straight-line method from the commencement dates to the earlier of the end of the useful lives of the right-of-use assets or the end of the lease terms. Lease liabilities are initially measured at the present value of the lease payments, which comprise fixed payments and variable lease payments which depend on an index or a rate. The lease payments are discounted using the interest rate implicit in a lease, if that rate can be readily determined. If that rate cannot be readily determined, the Group uses the lessee’s incremental borrowing rate. Subsequently, lease liabilities are measured at amortized cost using the effective interest method, with interest expense recognized over the lease terms. When there is a change in a lease term or a change in future lease payments resulting from a change in an index or a rate used to determine those payments, the Group remeasures the lease liabilities with a corresponding adjustment to the right-of-use-assets. However, if the carrying amount of the right-of-use assets is reduced to zero, any remaining amount of the remeasurement is recognized in profit or loss. Lease liabilities are presented on a separate line in the consolidated balance sheets. Variable lease payments that do not depend on an index or a rate are recognized as expenses in the periods in which they are incurred.
2018 Leases are classified as finance leases whenever the terms of a lease transfer substantially all the risks and rewards of ownership to the lessee. All other leases are classified as operating leases. a. The Group as lessor
Amounts due from lessees under finance leases are recognized as receivables at the amount of the Group’s net investment in the leases. Finance lease income is allocated to accounting periods so as to reflect a constant periodic rate of return on the Group’s net investment outstanding in respect of the leases.

- 28 -
Rental income from operating leases is recognized on a straight-line basis over the term of the relevant lease. Initial direct costs incurred in negotiating and arranging an operating lease are added to the carrying amount of the leased asset and amortized on a straight-line basis over the lease term.
b. The Group as lessee Operating lease payments are recognized as expenses on a straight-line basis over the lease term.
c. Leasehold land for own use When a lease includes both land and building elements, the Group assesses the classification of each element separately as a finance or an operating lease based on the assessment as to whether substantially all the risks and rewards incidental to ownership of each element have been transferred to the lessee. The minimum lease payments are allocated between the land and the building elements in proportion to the relative fair values of the leasehold interests in the land element and building element of the lease at the inception of the lease. If the allocation of the lease payments can be made reliably, each element is accounted for separately in accordance with its lease classification. When the lease payments cannot be allocated reliably between the land and building elements, the entire lease is generally classified as a finance lease unless it is clear that both elements are operating leases; in which case, the entire lease is classified as an operating lease.
Government Grants Government grants are not recognized until there is reasonable assurance that the Group will comply with the conditions attaching to them and that the grants will be received. Government grants are recognized in profit or loss on a systematic basis over the periods in which the Group recognizes as expenses the related costs for which the grants are intended to compensate. Specifically, government grants whose primary condition is that the Group should purchase, construct or otherwise acquire non-current assets are recognized as deferred revenue transferred to profit or loss on a systematic and rational basis over the useful lives of the related assets. Government grants that are receivable as compensation for expenses or losses already incurred or for the purpose of giving immediate financial support to the Group with no future related costs are recognized in profit or loss in the period in which they become receivable. Employee Benefits a. Short-term employee benefits
Liabilities recognized in respect of short-term employee benefits are measured at the undiscounted amount of the benefits expected to be paid in exchange for the related services.
b. Retirement benefits
Payments to defined contribution retirement benefit plans are recognized as expenses when employees have rendered services entitling them to the contributions.
- 29 -
Defined benefit costs (including service cost, net interest and remeasurement) under defined benefit retirement benefit plans are determined using the projected unit credit method. Service cost (including current service cost, past service cost, as well as gains and losses on settlements) and net interest on the net defined benefit liabilities (assets) are recognized as employee benefits expense in the period in which they occur. Remeasurement, comprising actuarial gains and losses and the return on plan assets (excluding interest), is recognized in other comprehensive income in the period in which it occurs. Remeasurement recognized in other comprehensive income is reflected immediately in retained earnings and will not be reclassified to profit or loss. Net defined benefit liabilities (assets) represent the actual deficit (surplus) in the Group’s defined benefit plans. Any surplus resulting from this calculation is limited to the present value of any refunds from the plans or reductions in future contributions to the plans.
c. Termination benefits A liability for a termination benefit is recognized at the earlier of when the Group can no longer withdraw the offer of the termination benefit and when the Group recognizes any related restructuring costs.
Taxation Income tax expense represents the sum of the tax currently payable and deferred tax. a. Current tax
According to the Income Tax Law, an additional tax of unappropriated earnings is provided for as income tax in the year the shareholders approve to retain earnings. Adjustments of prior years’ tax liabilities are added to or deducted from the current year’s tax provision.
b. Deferred tax
Deferred tax is recognized on temporary differences between the carrying amounts of assets and liabilities in the consolidated financial statements and the corresponding tax bases used in the computation of taxable profit. Deferred tax liabilities are generally recognized for all taxable temporary differences. Deferred tax assets are generally recognized for all deductible temporary differences and unused loss carry forward to the extent that it is probable that taxable profits will be available against which those deductible temporary differences can be utilized. Deferred tax liabilities are recognized for taxable temporary differences associated with investments in subsidiaries and associates, and interests in joint ventures, except where the Group is able to control the reversal of the temporary difference and it is probable that the temporary difference will not reverse in the foreseeable future. Deferred tax assets arising from deductible temporary differences associated with such investments and interests are only recognized to the extent that it is probable that there will be sufficient taxable profits against which to utilize the benefits of the temporary differences and they are expected to reverse in the foreseeable future. The carrying amount of deferred tax assets is reviewed at the end of each reporting period and reduced to the extent that it is no longer probable that sufficient taxable profits will be available to allow all or part of the asset to be recovered. A previously unrecognized deferred tax asset is also reviewed at the end of each reporting period and recognized to the extent that it has become probable that future taxable profit will allow the deferred tax asset to be recovered.
- 30 -
Deferred tax assets and liabilities are measured at the tax rates that are expected to apply in the period in which the liability is settled or the asset realized, based on tax rates (and tax laws) that have been enacted or substantively enacted by the end of the reporting period. The measurement of deferred tax liabilities and assets reflects the tax consequences that would follow from the manner in which the Group expects, at the end of the reporting period, to recover or settle the carrying amount of its assets and liabilities. If investment properties measured using the fair value model are non-depreciable assets, or are held under a business model whose objective is not to consume substantially all of the economic benefits embodied in the assets over time, the carrying amounts of such assets are presumed to be recovered entirely through sale.
c. Current tax and deferred tax for the year Current tax and deferred tax are recognized in profit or loss, except when they relate to items that are recognized in other comprehensive income, in which case, the current tax and deferred tax are also recognized in other comprehensive income, respectively. Where current tax or deferred tax arises from the initial accounting for a business combination, the tax effect is included in the accounting for the business combination.
5. CRITICAL ACCOUNTING JUDGMENTS AND KEY SOURCES OF ESTIMATION
UNCERTAINTY In the application of the Group’s accounting policies, management is required to make judgments, estimations and assumptions about the carrying amounts of assets and liabilities that are not readily apparent from other sources. The estimates and associated assumptions are based on historical experience and other factors that are considered relevant. Actual results may differ from these estimates. The estimates and underlying assumptions are reviewed on an ongoing basis. Revisions to accounting estimates are recognized in the period in which the estimates are revised if the revisions affect only that period or in the period of the revisions and future periods if the revisions affect both current and future periods. Estimated Impairment of Trade Receivables The provision for impairment of trade receivables is based on assumptions about risk of default and expected loss rates. The Group uses judgment in making these assumptions and in selecting the inputs to the impairment calculation, based on the Group’s historical experience, existing market conditions as well as forward looking estimates as of the end of each reporting period. For details of the key assumptions and inputs used, see Note 10. Fair Value Measurements and Valuation Process If some of the Group’s assets and liabilities measured at fair value have no quoted prices in active markets, the Group determines whether to engage third party qualified appraisers for the application of appropriate valuation techniques for fair value measurements in accordance with related regulations or professional standards. Where Level 1 inputs are not available, the engaged appraisers would determine appropriate inputs by referring to the existing lease contracts and rentals of similar properties in the vicinity of the Group’s investment properties. If the actual changes of inputs in the future differ from expectation, fair value might vary accordingly. Information about the valuation techniques and inputs used in determining the fair value of various assets and liabilities is disclosed in Notes 18.

- 31 -
6. CASH AND CASH EQUIVALENTS December 31 2019 2018 Checking accounts and demand deposits $ 7,579,735 $ 6,003,398 Petty cash 4,070 3,706 Cash on hand 746 3,843 Cash equivalents (investments with original maturities of less than 3
months) Time deposits 15,689,128 8,745,170 Repurchase agreements collateralized by bonds 1,461,816 173,294
$ 24,735,495 $ 14,929,411 The market rate intervals of time deposits and repurchase agreements collateralized by bonds at the end of the reporting period were as follows: December 31 2019 2018 Time deposits 0.52%-5.50% 1.00%-4.80% Repurchase agreements collateralized by bonds 0.45%-2.36% 0.52%-2.52% As of December 31, 2019 and 2018, the Group’s bank deposits in the amounts of $419,742 thousand and $169,139 thousand, respectively, are restricted as collaterals for bank loans and classified as financial assets at amortized cost in the balance sheets. Time deposits with original maturities of more than 3 months in the amounts of $22,633,007 thousand and $14,168,377 thousand, respectively, are also classified as financial assets at amortized cost in the balance sheets as of December 31, 2019 and 2018. Refer to Note 9.
7. FINANCIAL INSTRUMENTS AT FAIR VALUE THROUGH PROFIT OR LOSS - CURRENT December 31 2019 2018 Financial assets at FVTPL Financial assets mandatorily classified as at FVTPL
Non-derivative financial assets Beneficiary certificates $ 1,253,617 $ 5,543,595 Listed shares 3,474,606 3,502,988
$ 4,728,223 $ 9,046,583
Financial liabilities at FVTPL Financial liabilities held for trading
Derivative financial liabilities (not under hedge accounting) Bond options (Note 26) $ 81,724 $ 223,501 Cross-currency swap contracts 30,346 44,717
$ 112,070 $ 268,218

- 32 -
The Group entered into cross-currency swap contracts to manage exposures to exchange rate fluctuations. The Group’s financial hedging strategy is to avoid most of the cash flow risk exposure. As of December 31, 2019 and 2018, outstanding cross-currency swap contracts not under hedge accounting were as follows:
Notional Amounts
(In Thousands) Maturity Date Range of Interest
Rates Paid Range of Interest Rates Received
US$215,000 2021.09.15 - 2.68%-2.80%
8. FINANCIAL ASSETS AT FAIR VALUE THROUGH OTHER COMPREHENSIVE INCOME
December 31
2019 2018 Current Non-current Current Non-current Domestic investments
Listed shares $ 3,765,869 $ 9,472,552 $ 3,648,586 $ 8,125,426 Unlisted shares - 1,614,601 - 1,537,291
3,765,869 11,087,153 3,648,586 9,662,717 Foreign investments
Listed shares 212,497 - 152,337 - Unlisted shares - 604,985 - 122,026
212,497 604,985 152,337 122,026 $ 3,978,366 $ 11,692,138 $ 3,800,923 $ 9,784,743 a. These investments in equity instruments are not held for trading. Instead, they are held for medium to
long-term strategic purposes. Accordingly, the management elected to designate these investments in equity instruments as at FVTOCI as they believe that recognizing short-term fluctuations in these investments’ fair value in profit or loss would not be consistent with the Group’s strategy of holding these investments for long-term purposes.
b. The board of directors of China Shanshui Cement Group Limited (CSCGL) announced on April 16,
2015 that the percentage of CSCGL’s securities held by the public fell below the prescribed minimum requirement of 25% according to the Main Board Listing Rules 8.08 of Hong Kong Exchanges and Clearing Limited (the “Exchange”). Therefore, the Exchange suspended the trading of CSCGL’s securities until the percentage of securities in public hands satisfies the minimum requirement. On October 30, 2018, CSCGL’s shareholders resolved to restore the minimum public float requirement of 25% by issuing new shares of 974,825,988 at HK$4.2 per share. Then CSCGL resumed its trading on the Exchange effective on October 31, 2018. The Group originally held 22.50% equity interest in CSCGL but the shareholding was reduced to 17.46% after the subscription mentioned above. However, Mrs. Wu Ling-Ling, the Corporation’s chief financial officer, was elected to be the executive director of CSCGL on May 23, 2018. As CSCGL already addressed the audit issues raised by the Exchange and confirmed the potential dilution of shareholding in the Group’s interests in CSCGL, the Group objectively demonstrated that it was able to exercise significant influence over CSCGL although the Group only held less than 20% of the voting power. Accordingly, the Group’s investment in CSCGL was reclassified from financial assets at fair value through other comprehensive income to investments accounted for using the equity method at the closing price of the Exchange on October 31, 2018. Refer to Note 15.

- 33 -
c. Asia Cement Pioneer Investment Ltd. (ACP) acquired the shares of Cementon Micronesia LLC for US$3,900 thousand in September 2010. As of December 31, 2019, 50% of the investment consideration was not paid and accounted for as accounts payable and accrued expenses - third parties. The consideration will be paid once the counterparty asks for payment.
d. Refer to Note 38 for information relating to financial assets at fair value through other comprehensive
income pledged as collaterals. 9. FINANCIAL ASSETS AT AMORTIZED COST
December 31 2019 2018 Time deposits with original maturities of more than 3 months $ 22,633,307 $ 14,168,377 Restricted assets 419,742 169,139 $ 23,053,049 $ 14,337,516 Current $ 23,016,985 $ 14,322,874 Non-current $ 36,064 $ 14,642 Based on the Group’s assessment, the credit risk of these financial assets is not expected to be high and has not increased since initial recognition. Refer to Note 38 for information relating to financial assets at amortized cost pledged as collaterals.
10. TRADE RECEIVABLES
2019 2018 At amortized cost Trade receivables - sales $ 11,145,513 $ 10,322,875 Finance lease receivable - current (Note 11) 723,487 672,230 Construction receivable 114,242 105,262 Operating lease receivable 23,119 12,438 Less: Allowance for impairment loss - sales (1,042,840) (884,685) Less: Allowance for impairment loss - construction (918) - $ 10,962,603 $ 10,228,120 Trade Receivables - Sales The average credit period of receivables from sales of goods was 30-90 days. Specific customers with good credit records were given longer credit period occasionally. The average credit period for customers of concrete products was 180-365 days after construction of building was finished. The Group reviews the recoverable amount of each individual trade debt at the end of the reporting period to ensure that adequate allowance is made for possible irrecoverable amounts. The Group obtains sufficient collateral, where appropriate, as a means of mitigating the risk of financial loss from defaults.
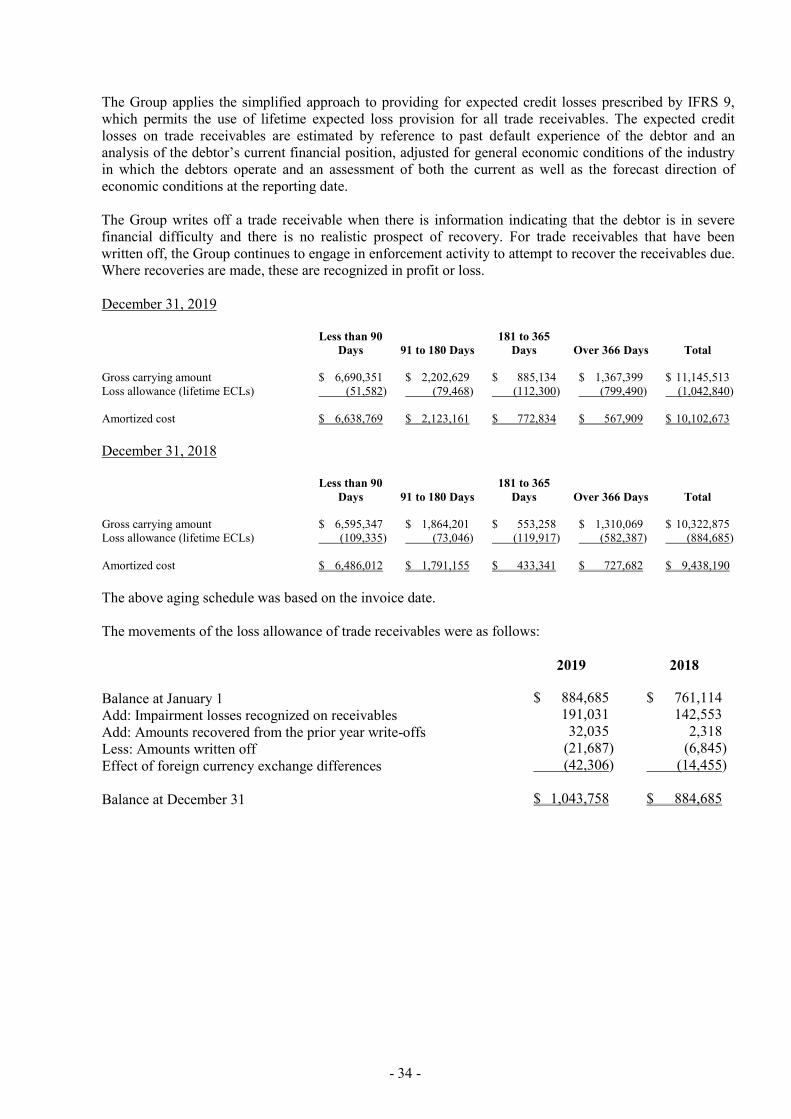
- 34 -
The Group applies the simplified approach to providing for expected credit losses prescribed by IFRS 9, which permits the use of lifetime expected loss provision for all trade receivables. The expected credit losses on trade receivables are estimated by reference to past default experience of the debtor and an analysis of the debtor’s current financial position, adjusted for general economic conditions of the industry in which the debtors operate and an assessment of both the current as well as the forecast direction of economic conditions at the reporting date. The Group writes off a trade receivable when there is information indicating that the debtor is in severe financial difficulty and there is no realistic prospect of recovery. For trade receivables that have been written off, the Group continues to engage in enforcement activity to attempt to recover the receivables due. Where recoveries are made, these are recognized in profit or loss. December 31, 2019
Less than 90
Days 91 to 180 Days 181 to 365
Days Over 366 Days Total Gross carrying amount $ 6,690,351 $ 2,202,629 $ 885,134 $ 1,367,399 $ 11,145,513 Loss allowance (lifetime ECLs) (51,582) (79,468) (112,300) (799,490) (1,042,840) Amortized cost $ 6,638,769 $ 2,123,161 $ 772,834 $ 567,909 $ 10,102,673 December 31, 2018
Less than 90
Days 91 to 180 Days 181 to 365
Days Over 366 Days Total Gross carrying amount $ 6,595,347 $ 1,864,201 $ 553,258 $ 1,310,069 $ 10,322,875 Loss allowance (lifetime ECLs) (109,335) (73,046) (119,917) (582,387) (884,685) Amortized cost $ 6,486,012 $ 1,791,155 $ 433,341 $ 727,682 $ 9,438,190 The above aging schedule was based on the invoice date. The movements of the loss allowance of trade receivables were as follows: 2019 2018 Balance at January 1 $ 884,685 $ 761,114 Add: Impairment losses recognized on receivables 191,031 142,553 Add: Amounts recovered from the prior year write-offs 32,035 2,318 Less: Amounts written off (21,687) (6,845) Effect of foreign currency exchange differences (42,306) (14,455) Balance at December 31 $ 1,043,758 $ 884,685

- 35 -
11. FINANCE LEASE RECEIVABLES 2019
December 31,
2019 Undiscounted lease payments Year 1 $ 1,401,682 Year 2 1,401,682 Year 3 1,401,682 Year 4 1,401,682 Year 5 1,401,682 Year 6 onwards 5,606,728 12,615,138 Less: Unearned finance income (3,720,784) Net investment in leases presented as finance lease receivables $ 8,894,354 Current $ 723,487 Non-current 8,170,867 $ 8,894,354 2018
December 31,
2018 Minimum lease payments Not later than 1 year $ 1,401,682 Later than 1 year and not later than 5 years 5,606,728 Later than 5 years 7,008,410 14,016,820 Less: Unearned finance income 4,450,235 Present value of minimum lease payments $ 9,566,585 Lease receivables Not later than 1 year $ 672,230 Later than 1 year and not later than 5 years 3,242,092 Later than 5 years 5,652,263 Present value of minimum lease payments $ 9,566,585 Current $ 672,230 Non-current 8,894,355 $ 9,566,585
- 36 -
Chiahui Power Corp. (CHP) entered into a 25-year purchase and sale agreement with Taiwan Power Company (TPC). According to the agreement, all electricity generated by CHP is sold to TPC. CHP started its operation on December 15, 2003. Because the nature of the agreement is considered as conveyance of rights to use asset, the agreement is regarded as finance lease. The Group measures the loss allowance for finance lease receivables at an amount equal to lifetime ECLs. As of December 31, 2019, no finance lease receivable was past due. The Group has not recognized a loss allowance for finance lease receivables after taking into consideration the historical default experience and the future prospects of the industries in which the lessees operate.
12. OTHER RECEIVABLES
Asia Cement (China) Holdings Corp. (ACCHC), Far Eastern Polytex (Holding) Limited (FEPHL) and FEDS Development (BVI) Ltd. (FEDSBVI) intend to invest in Yuan Ding Enterprise (Shanghai) Limited (YDES) and acquire 40%, 40% and 20% equity, respectively. Through this investment, ACCHC can join projects on land development and commercial building construction in the World Exposition district in Shanghai. YDES was initially established with registered capital of RMB500,000 thousand by Far Eastern New Century (China) Corporation (FENCC), a wholly owned subsidiary of FEPHL. When the completion of the construction process of the commercial building reaches 25%, ACCHC will subscribe to new shares issued by YDES, and ACCHC’s ultimate ownership is expected to be 40%. ACCHC has signed related investment contracts with FEPHL and FEDSBVI. YDES’s board of directors resolved to issue new shares for cash on February 18, 2019 and June 30, 2019, respectively. After the capital increase, YDES’s registered capital increased to RMB1,763,425 thousand. ACCHC subscribed for cash capital increase of YDES through Oriental Holdings Co., Ltd., its indirect subsidiary, for RMB714,190 thousand. The investment was accounted for using equity method. Refer to Note 15. As of December 31, 2018, ACCHC agreed to grant one-year interest-free credit loan to FENCC (a subsidiary of FENC) and YDES in the amount of RMB431,900 thousand and RMB230,000 thousand, respectively. The borrower can use the loan during the loan period. As of December 31, 2018, the loan amounts drawn by FENCC and YDES were RMB431,900 thousand and RMB114,699 thousand, respectively. The aforementioned amounts were accounted for as other receivables. The Group believes that potential benefit from the investment will exceed potential interest income if interest is charged on the loan. The Group did not consider the loan an independent transaction but took it as part of a more beneficial investment strategy. Accordingly, the borrowers were not required to pay any interest unless the development project failed to be implemented. In addition, FENC is FENCC’s and YDES’s ultimate parent company, so the Group believes that the borrowers have sufficient financial resources to repay the loan and thus did not take any collateral. As of December 31, 2019, the loans receivable have been fully recovered.
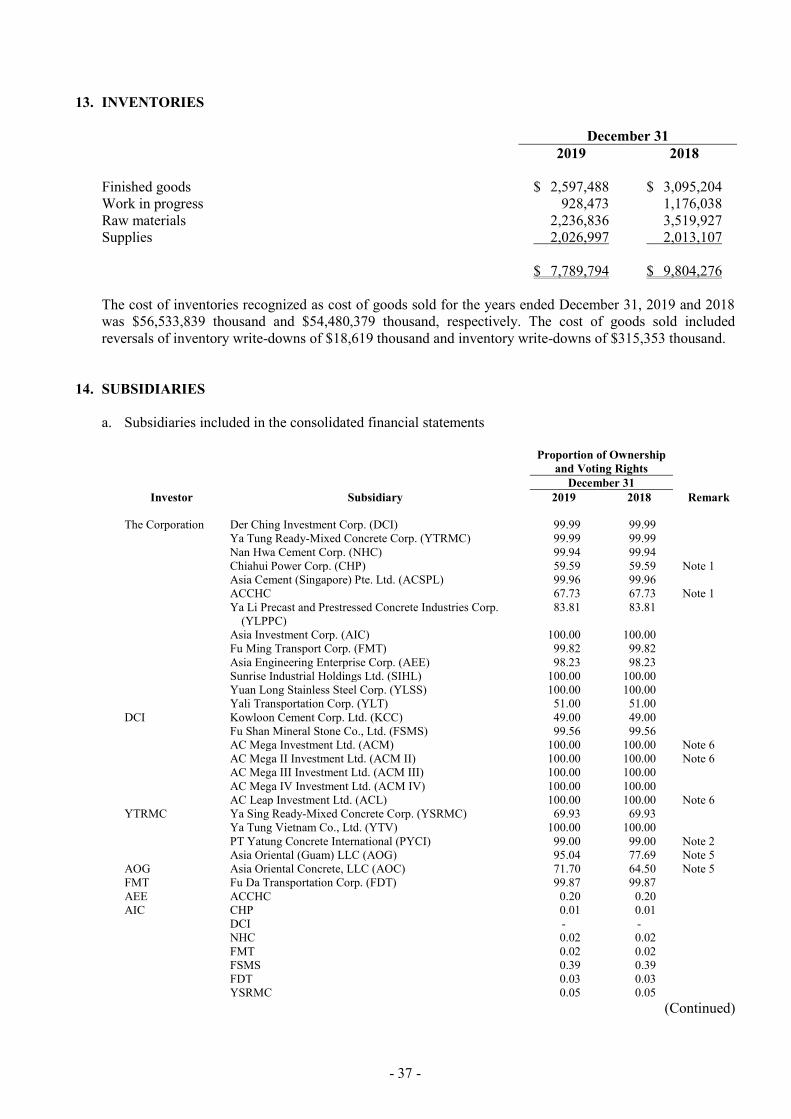
- 37 -
13. INVENTORIES December 31 2019 2018 Finished goods $ 2,597,488 $ 3,095,204 Work in progress 928,473 1,176,038 Raw materials 2,236,836 3,519,927 Supplies 2,026,997 2,013,107 $ 7,789,794 $ 9,804,276 The cost of inventories recognized as cost of goods sold for the years ended December 31, 2019 and 2018 was $56,533,839 thousand and $54,480,379 thousand, respectively. The cost of goods sold included reversals of inventory write-downs of $18,619 thousand and inventory write-downs of $315,353 thousand.
14. SUBSIDIARIES a. Subsidiaries included in the consolidated financial statements
Proportion of Ownership
and Voting Rights December 31
Investor Subsidiary 2019 2018 Remark The Corporation Der Ching Investment Corp. (DCI) 99.99 99.99 Ya Tung Ready-Mixed Concrete Corp. (YTRMC) 99.99 99.99 Nan Hwa Cement Corp. (NHC) 99.94 99.94 Chiahui Power Corp. (CHP) 59.59 59.59 Note 1 Asia Cement (Singapore) Pte. Ltd. (ACSPL) 99.96 99.96 ACCHC 67.73 67.73 Note 1 Ya Li Precast and Prestressed Concrete Industries Corp.
(YLPPC) 83.81 83.81
Asia Investment Corp. (AIC) 100.00 100.00 Fu Ming Transport Corp. (FMT) 99.82 99.82 Asia Engineering Enterprise Corp. (AEE) 98.23 98.23 Sunrise Industrial Holdings Ltd. (SIHL) 100.00 100.00 Yuan Long Stainless Steel Corp. (YLSS) 100.00 100.00 Yali Transportation Corp. (YLT) 51.00 51.00 DCI Kowloon Cement Corp. Ltd. (KCC) 49.00 49.00 Fu Shan Mineral Stone Co., Ltd. (FSMS) 99.56 99.56 AC Mega Investment Ltd. (ACM) 100.00 100.00 Note 6 AC Mega II Investment Ltd. (ACM II) 100.00 100.00 Note 6 AC Mega III Investment Ltd. (ACM III) 100.00 100.00 AC Mega IV Investment Ltd. (ACM IV) 100.00 100.00 AC Leap Investment Ltd. (ACL) 100.00 100.00 Note 6 YTRMC Ya Sing Ready-Mixed Concrete Corp. (YSRMC) 69.93 69.93 Ya Tung Vietnam Co., Ltd. (YTV) 100.00 100.00 PT Yatung Concrete International (PYCI) 99.00 99.00 Note 2 Asia Oriental (Guam) LLC (AOG) 95.04 77.69 Note 5 AOG Asia Oriental Concrete, LLC (AOC) 71.70 64.50 Note 5 FMT Fu Da Transportation Corp. (FDT) 99.87 99.87 AEE ACCHC 0.20 0.20 AIC CHP 0.01 0.01 DCI - - NHC 0.02 0.02 FMT 0.02 0.02 FSMS 0.39 0.39 FDT 0.03 0.03 YSRMC 0.05 0.05
(Continued)
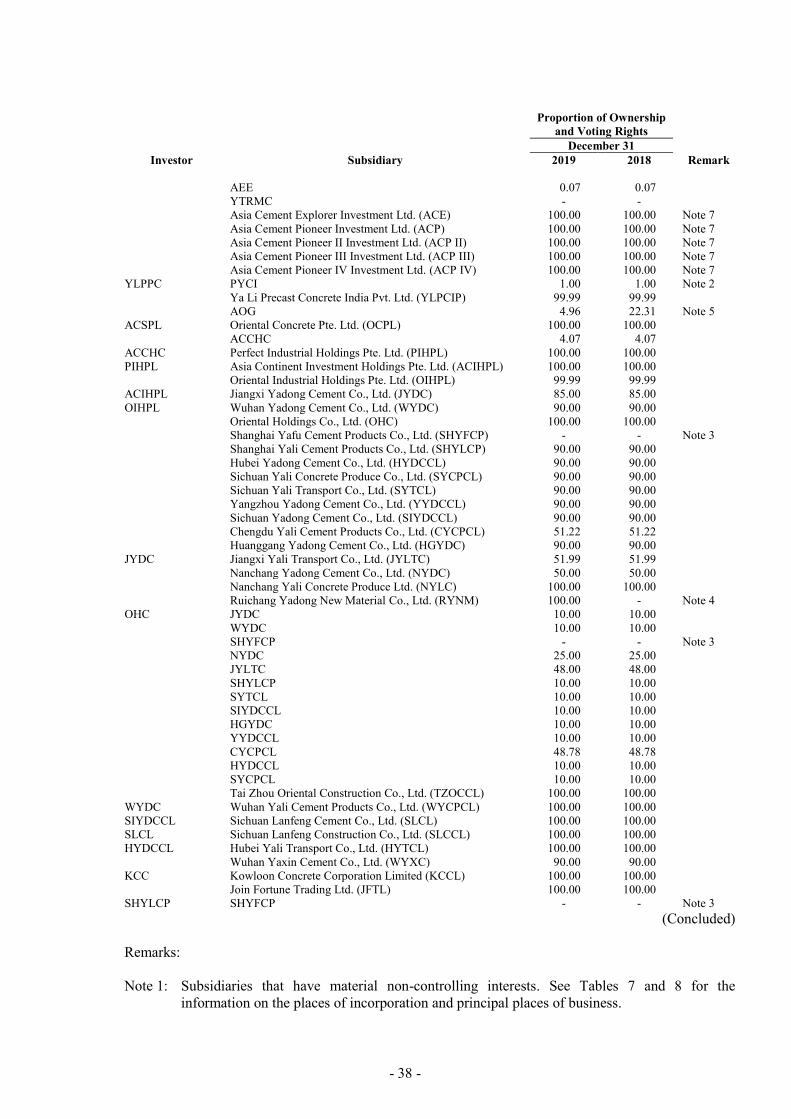
- 38 -
Proportion of Ownership
and Voting Rights December 31
Investor Subsidiary 2019 2018 Remark AEE 0.07 0.07 YTRMC - - Asia Cement Explorer Investment Ltd. (ACE) 100.00 100.00 Note 7 Asia Cement Pioneer Investment Ltd. (ACP) 100.00 100.00 Note 7 Asia Cement Pioneer II Investment Ltd. (ACP II) 100.00 100.00 Note 7 Asia Cement Pioneer III Investment Ltd. (ACP III) 100.00 100.00 Note 7 Asia Cement Pioneer IV Investment Ltd. (ACP IV) 100.00 100.00 Note 7 YLPPC PYCI 1.00 1.00 Note 2 Ya Li Precast Concrete India Pvt. Ltd. (YLPCIP) 99.99 99.99 AOG 4.96 22.31 Note 5 ACSPL Oriental Concrete Pte. Ltd. (OCPL) 100.00 100.00 ACCHC 4.07 4.07 ACCHC Perfect Industrial Holdings Pte. Ltd. (PIHPL) 100.00 100.00 PIHPL Asia Continent Investment Holdings Pte. Ltd. (ACIHPL) 100.00 100.00 Oriental Industrial Holdings Pte. Ltd. (OIHPL) 99.99 99.99 ACIHPL Jiangxi Yadong Cement Co., Ltd. (JYDC) 85.00 85.00 OIHPL Wuhan Yadong Cement Co., Ltd. (WYDC) 90.00 90.00 Oriental Holdings Co., Ltd. (OHC) 100.00 100.00 Shanghai Yafu Cement Products Co., Ltd. (SHYFCP) - - Note 3 Shanghai Yali Cement Products Co., Ltd. (SHYLCP) 90.00 90.00 Hubei Yadong Cement Co., Ltd. (HYDCCL) 90.00 90.00 Sichuan Yali Concrete Produce Co., Ltd. (SYCPCL) 90.00 90.00 Sichuan Yali Transport Co., Ltd. (SYTCL) 90.00 90.00 Yangzhou Yadong Cement Co., Ltd. (YYDCCL) 90.00 90.00 Sichuan Yadong Cement Co., Ltd. (SIYDCCL) 90.00 90.00 Chengdu Yali Cement Products Co., Ltd. (CYCPCL) 51.22 51.22 Huanggang Yadong Cement Co., Ltd. (HGYDC) 90.00 90.00 JYDC Jiangxi Yali Transport Co., Ltd. (JYLTC) 51.99 51.99 Nanchang Yadong Cement Co., Ltd. (NYDC) 50.00 50.00 Nanchang Yali Concrete Produce Ltd. (NYLC) 100.00 100.00 Ruichang Yadong New Material Co., Ltd. (RYNM) 100.00 - Note 4 OHC JYDC 10.00 10.00 WYDC 10.00 10.00 SHYFCP - - Note 3 NYDC 25.00 25.00 JYLTC 48.00 48.00 SHYLCP 10.00 10.00 SYTCL 10.00 10.00 SIYDCCL 10.00 10.00 HGYDC 10.00 10.00 YYDCCL 10.00 10.00 CYCPCL 48.78 48.78 HYDCCL 10.00 10.00 SYCPCL 10.00 10.00 Tai Zhou Oriental Construction Co., Ltd. (TZOCCL) 100.00 100.00 WYDC Wuhan Yali Cement Products Co., Ltd. (WYCPCL) 100.00 100.00 SIYDCCL Sichuan Lanfeng Cement Co., Ltd. (SLCL) 100.00 100.00 SLCL Sichuan Lanfeng Construction Co., Ltd. (SLCCL) 100.00 100.00 HYDCCL Hubei Yali Transport Co., Ltd. (HYTCL) 100.00 100.00 Wuhan Yaxin Cement Co., Ltd. (WYXC) 90.00 90.00 KCC Kowloon Concrete Corporation Limited (KCCL) 100.00 100.00 Join Fortune Trading Ltd. (JFTL) 100.00 100.00 SHYLCP SHYFCP - - Note 3
(Concluded) Remarks: Note 1: Subsidiaries that have material non-controlling interests. See Tables 7 and 8 for the
information on the places of incorporation and principal places of business.
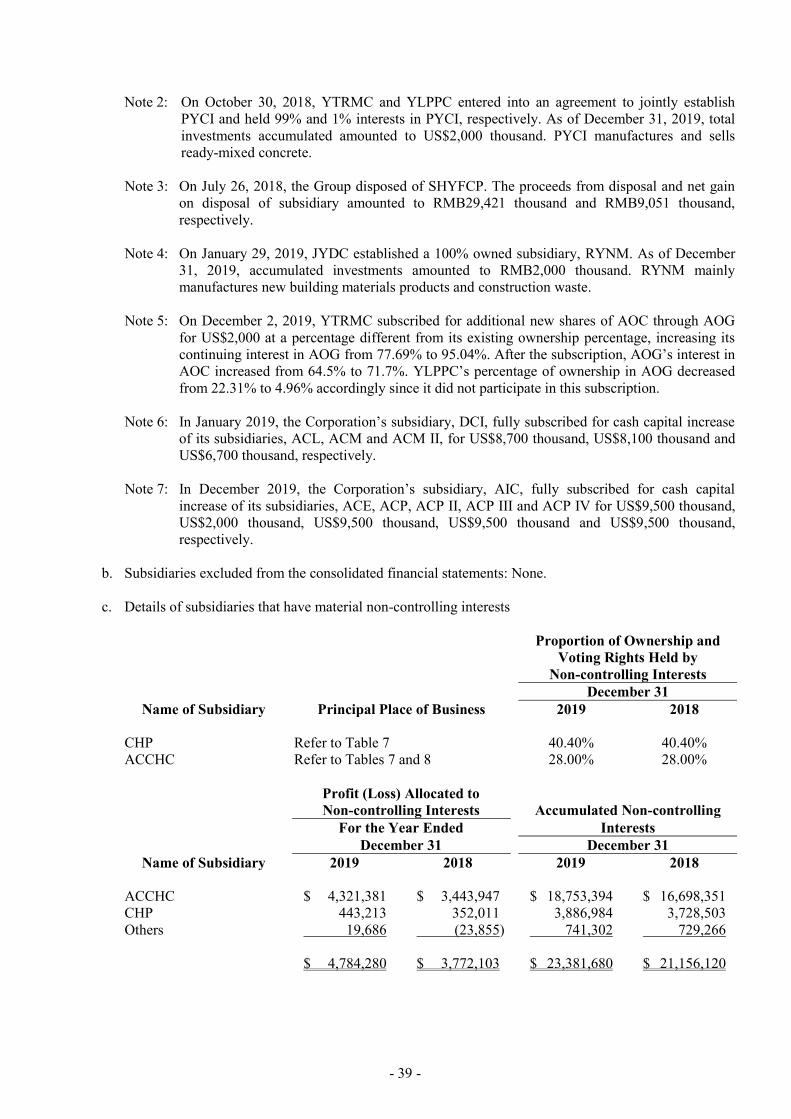
- 39 -
Note 2: On October 30, 2018, YTRMC and YLPPC entered into an agreement to jointly establish PYCI and held 99% and 1% interests in PYCI, respectively. As of December 31, 2019, total investments accumulated amounted to US$2,000 thousand. PYCI manufactures and sells ready-mixed concrete.
Note 3: On July 26, 2018, the Group disposed of SHYFCP. The proceeds from disposal and net gain
on disposal of subsidiary amounted to RMB29,421 thousand and RMB9,051 thousand, respectively.
Note 4: On January 29, 2019, JYDC established a 100% owned subsidiary, RYNM. As of December
31, 2019, accumulated investments amounted to RMB2,000 thousand. RYNM mainly manufactures new building materials products and construction waste.
Note 5: On December 2, 2019, YTRMC subscribed for additional new shares of AOC through AOG
for US$2,000 at a percentage different from its existing ownership percentage, increasing its continuing interest in AOG from 77.69% to 95.04%. After the subscription, AOG’s interest in AOC increased from 64.5% to 71.7%. YLPPC’s percentage of ownership in AOG decreased from 22.31% to 4.96% accordingly since it did not participate in this subscription.
Note 6: In January 2019, the Corporation’s subsidiary, DCI, fully subscribed for cash capital increase
of its subsidiaries, ACL, ACM and ACM II, for US$8,700 thousand, US$8,100 thousand and US$6,700 thousand, respectively.
Note 7: In December 2019, the Corporation’s subsidiary, AIC, fully subscribed for cash capital
increase of its subsidiaries, ACE, ACP, ACP II, ACP III and ACP IV for US$9,500 thousand, US$2,000 thousand, US$9,500 thousand, US$9,500 thousand and US$9,500 thousand, respectively.
b. Subsidiaries excluded from the consolidated financial statements: None. c. Details of subsidiaries that have material non-controlling interests
Proportion of Ownership and Voting Rights Held by
Non-controlling Interests December 31
Name of Subsidiary Principal Place of Business 2019 2018 CHP Refer to Table 7 40.40% 40.40% ACCHC Refer to Tables 7 and 8 28.00% 28.00%
Profit (Loss) Allocated to Non-controlling Interests Accumulated Non-controlling
For the Year Ended Interests December 31 December 31
Name of Subsidiary 2019 2018 2019 2018 ACCHC $ 4,321,381 $ 3,443,947 $ 18,753,394 $ 16,698,351 CHP 443,213 352,011 3,886,984 3,728,503 Others 19,686 (23,855) 741,302 729,266 $ 4,784,280 $ 3,772,103 $ 23,381,680 $ 21,156,120

- 40 -
Summarized financial information in respect of each of the Group’s subsidiaries that has material non-controlling interests is set out below. The summarized financial information below represents amounts before intragroup eliminations. CHP: December 31 2019 2018 Current assets $ 3,143,217 $ 1,981,089 Non-current assets 13,720,031 11,948,216 Current liabilities 3,506,027 3,843,336 Non-current liabilities 3,735,973 857,002 Equity $ 9,621,248 $ 9,228,967 Equity attributable to:
Owners of the Corporation $ 5,734,264 $ 5,500,464 Non-controlling interests of CHP 3,886,984 3,728,503
$ 9,621,248 $ 9,228,967
For the Year Ended December 31 2019 2018 Revenue $ 7,115,116 $ 6,682,384 Profit for the year $ 1,097,061 $ 871,315 Other comprehensive income (loss) for the year 220 (1,109) Total comprehensive income for the year $ 1,097,281 $ 870,206 Profit attributable to:
Owners of the Corporation $ 653,848 $ 519,304 Non-controlling interests of CHP 443,213 352,011
$ 1,097,061 $ 871,315 Total comprehensive income attributable to:
Owners of the Corporation $ 653,980 $ 518,643 Non-controlling interests of CHP 443,301 351,563
$ 1,097,281 $ 870,206 Dividends paid to non-controlling interest
CHP $ 284,820 $ 284,860
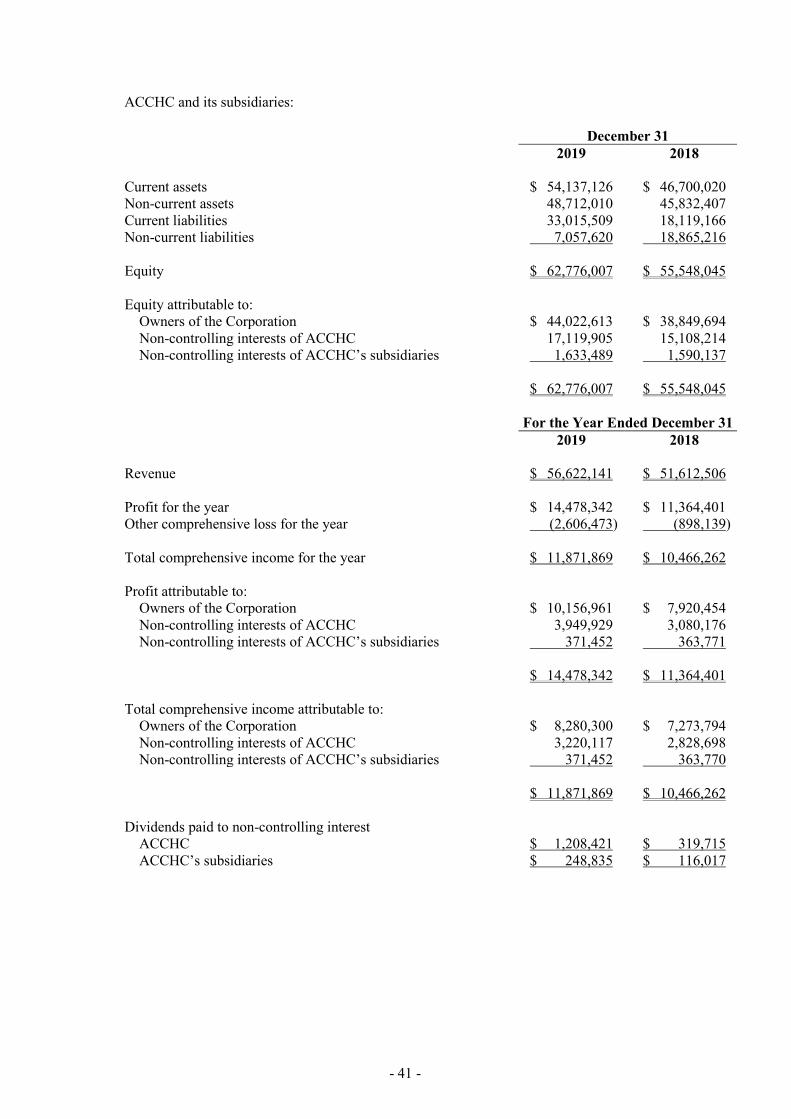
- 41 -
ACCHC and its subsidiaries: December 31 2019 2018 Current assets $ 54,137,126 $ 46,700,020 Non-current assets 48,712,010 45,832,407 Current liabilities 33,015,509 18,119,166 Non-current liabilities 7,057,620 18,865,216 Equity $ 62,776,007 $ 55,548,045 Equity attributable to:
Owners of the Corporation $ 44,022,613 $ 38,849,694 Non-controlling interests of ACCHC 17,119,905 15,108,214 Non-controlling interests of ACCHC’s subsidiaries 1,633,489 1,590,137
$ 62,776,007 $ 55,548,045
For the Year Ended December 31 2019 2018 Revenue $ 56,622,141 $ 51,612,506 Profit for the year $ 14,478,342 $ 11,364,401 Other comprehensive loss for the year (2,606,473) (898,139) Total comprehensive income for the year $ 11,871,869 $ 10,466,262 Profit attributable to:
Owners of the Corporation $ 10,156,961 $ 7,920,454 Non-controlling interests of ACCHC 3,949,929 3,080,176 Non-controlling interests of ACCHC’s subsidiaries 371,452 363,771
$ 14,478,342 $ 11,364,401 Total comprehensive income attributable to:
Owners of the Corporation $ 8,280,300 $ 7,273,794 Non-controlling interests of ACCHC 3,220,117 2,828,698 Non-controlling interests of ACCHC’s subsidiaries 371,452 363,770
$ 11,871,869 $ 10,466,262 Dividends paid to non-controlling interest
ACCHC $ 1,208,421 $ 319,715 ACCHC’s subsidiaries $ 248,835 $ 116,017
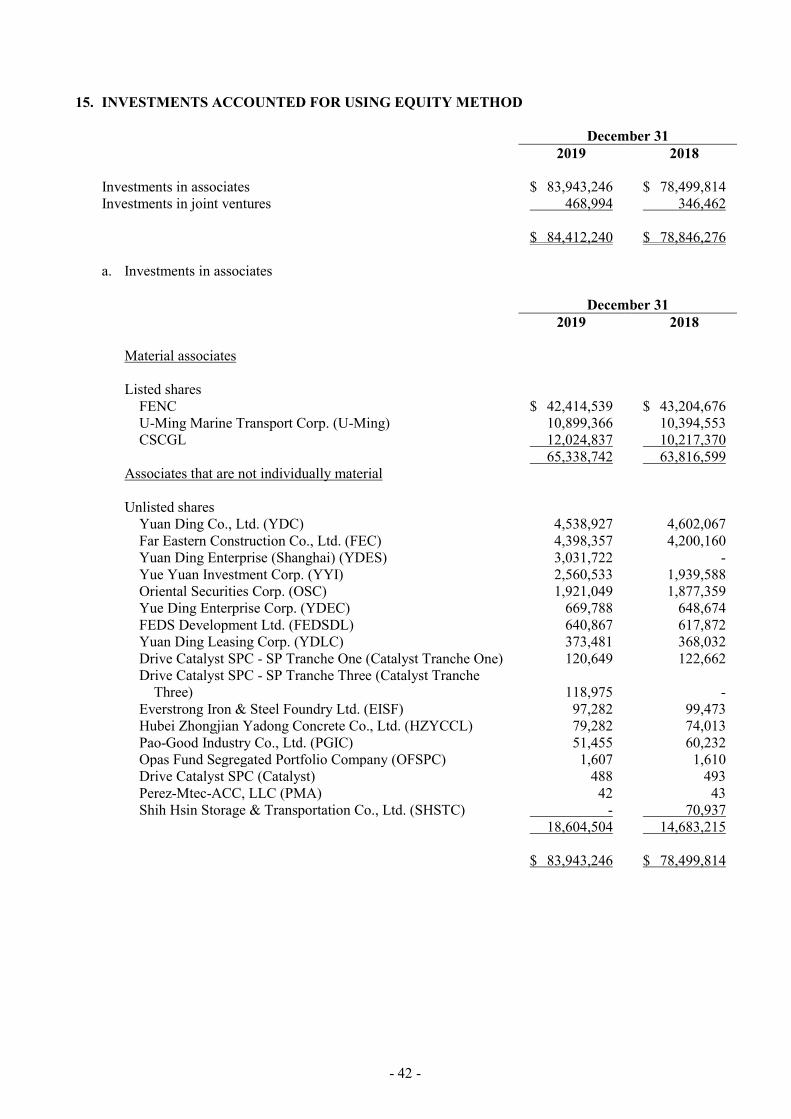
- 42 -
15. INVESTMENTS ACCOUNTED FOR USING EQUITY METHOD December 31 2019 2018 Investments in associates $ 83,943,246 $ 78,499,814 Investments in joint ventures 468,994 346,462 $ 84,412,240 $ 78,846,276 a. Investments in associates
December 31 2019 2018 Material associates Listed shares
FENC $ 42,414,539 $ 43,204,676 U-Ming Marine Transport Corp. (U-Ming) 10,899,366 10,394,553 CSCGL 12,024,837 10,217,370
65,338,742 63,816,599 Associates that are not individually material Unlisted shares
Yuan Ding Co., Ltd. (YDC) 4,538,927 4,602,067 Far Eastern Construction Co., Ltd. (FEC) 4,398,357 4,200,160 Yuan Ding Enterprise (Shanghai) (YDES) 3,031,722 - Yue Yuan Investment Corp. (YYI) 2,560,533 1,939,588 Oriental Securities Corp. (OSC) 1,921,049 1,877,359 Yue Ding Enterprise Corp. (YDEC) 669,788 648,674 FEDS Development Ltd. (FEDSDL) 640,867 617,872 Yuan Ding Leasing Corp. (YDLC) 373,481 368,032 Drive Catalyst SPC - SP Tranche One (Catalyst Tranche One) 120,649 122,662 Drive Catalyst SPC - SP Tranche Three (Catalyst Tranche
Three) 118,975 - Everstrong Iron & Steel Foundry Ltd. (EISF) 97,282 99,473 Hubei Zhongjian Yadong Concrete Co., Ltd. (HZYCCL) 79,282 74,013 Pao-Good Industry Co., Ltd. (PGIC) 51,455 60,232 Opas Fund Segregated Portfolio Company (OFSPC) 1,607 1,610 Drive Catalyst SPC (Catalyst) 488 493 Perez-Mtec-ACC, LLC (PMA) 42 43 Shih Hsin Storage & Transportation Co., Ltd. (SHSTC) - 70,937
18,604,504 14,683,215 $ 83,943,246 $ 78,499,814

- 43 -
At the end of the reporting period, the percentages of owners’ voting rights in associates held by the Group were as follows: December 31 Name of Associate 2019 2018 FENC 25.74% 25.74% U-Ming 41.41% 41.41% CSCGL 17.46% 17.46% YDC 49.99% 49.99% FEC 33.76% 33.76% YDES 40.00% - YYI 29.92% 29.92% OSC 18.93% 18.93% YDEC 30.84% 30.84% FEDSDL 25.00% 25.00% YDLC 43.60% 43.60% Catalyst Tranche One 25.00% 25.00% Catalyst Tranche Three 25.00% - EISF 48.73% 48.73% HZYCCL 40.00% 40.00% PGIC 31.00% 31.00% OFSPC 33.00% 33.00% Catalyst 33.00% 33.00% PMA 33.00% 33.33% SHSTC - 28.91% DCI, the Corporation’s subsidiary, subscribed for 4,000 shares of Catalyst Tranche One for US$4,000 thousand in December 2018. After the subscription, DCI owned 25% of the shares of Catalyst Tranche One. DCI, the Corporation’s subsidiary, subscribed for 4,000 shares of Catalyst Tranche Three for US$4,000 thousand in October 2019. After the subscription, DCI owned 25% of the shares of Catalyst Tranche Three. Due to the liquidation of SHSTC in 2019, DCI and NHC, the Corporation’s subsidiary, recovered its investments and recognized losses from disposal of $63,008 thousand and $5,761 thousand, respectively. As described in Note 12, ACCHC, the Corporation’s subsidiary, subscribed for YDES’s cash capital increase for RMB714,190 thousand YDES’s new shares through its subsidiary OHC; after the subscription, ACCHC’s percentage of ownership in YDES was 40%. As of December 31, 2019 and 2018, the information of associates was as follows: 1) Fair values (Level 1) of investments in associates with available published price quotation are
summarized as follows:
December 31 Name of Associate 2019 2018 FENC $ 41,124,212 $ 38,437,706 U-Ming $ 11,757,137 $ 11,284,752 CSCGL $ 8,855,602 $ 6,241,835

- 44 -
2) The summarized financial information in respect of the Group’s material associates is set out below:
FENC: December 31 2019 2018 Current assets $ 31,823,888 $ 31,423,092 Non-current assets 297,297,715 285,607,062 Current liabilities 24,007,226 23,339,671 Non-current liabilities 100,592,089 90,155,346 Equity 204,522,288 203,535,137 Proportion of the Group’s ownership 25.74% 25.74% Equity attributable to the Group 52,644,037 52,389,944 Cross shareholdings (10,229,498) (9,185,268) Carrying amount $ 42,414,539 $ 43,204,676 For the Year Ended December 31 2019 2018 Operating revenue $ 46,477,960 $ 54,063,801 Net profit for the year $ 10,732,669 $ 12,028,294 Other comprehensive (loss) income (186,100) 855,093 Total comprehensive income for the year $ 10,546,569 $ 12,883,387 Dividends received from FENC $ 2,479,866 $ 1,653,235 U-Ming: December 31 2019 2018 Current assets $ 2,225,116 $ 1,985,037 Non-current assets 49,594,962 50,008,362 Current liabilities 11,281,141 17,453,879 Non-current liabilities 13,694,378 8,913,985 Equity 26,844,559 25,625,535 Proportion of the Group’s ownership 41.41% 41.41% Equity attributable to the Group 11,116,333 10,611,534 Unrealized gain or loss with associates (87,524) (87,523) Other adjustments (129,443) (129,458) Carrying amount $ 10,899,366 $ 10,394,553

- 45 -
For the Year Ended December 31 2019 2018 Operating revenue $ 1,062,972 $ 1,080,444 Net profit for the year $ 1,621,695 $ 1,668,840 Other comprehensive income 1,118,819 2,007,257 Total comprehensive income for the year $ 2,740,514 $ 3,676,097 Dividends received from U-Ming $ 618,330 $ 419,898 CSCGL and its subsidiaries:
December 31 2019 2018 Current assets $ 26,673,504 $ 26,174,052 Non-current assets 88,426,257 90,319,977 Current liabilities 47,973,181 59,104,108 Non-current liabilities 13,066,715 14,557,750 Non-controlling interests 442,928 286,348 Equity attributable to CSCGL 53,616,937 42,545,823 Proportion of the Group’s ownership 17.46% 17.46% Equity attributable to the Group 9,416,541 7,427,489 Goodwill 1,856,015 1,856,015 Quarry Right 752,281 933,866 Carrying amount $ 12,024,837 $ 10,217,370
For the Year Ended December 31 2019 2018 Operating revenue $ 96,302,852 $ 80,162,793 Net profit for the year $ 13,578,105 $ 9,856,967 Other comprehensive income (loss) 8,286 (1,082,166) Total comprehensive income for the year $ 13,586,391 $ 8,774,801 As described in Note 8, the Group’s investments in CSCGL were reclassified from financial assets at fair value through other comprehensive income to investments accounted for using equity method in 2018.
3) Aggregate information of associates that are not individually material:
For the Year Ended December 31 2019 2018 The Group’s share of:
Profit for the year $ 687,961 $ 520,731 Other comprehensive income 365,142 220,999 Total comprehensive income for the year $ 1,053,103 $ 741,730
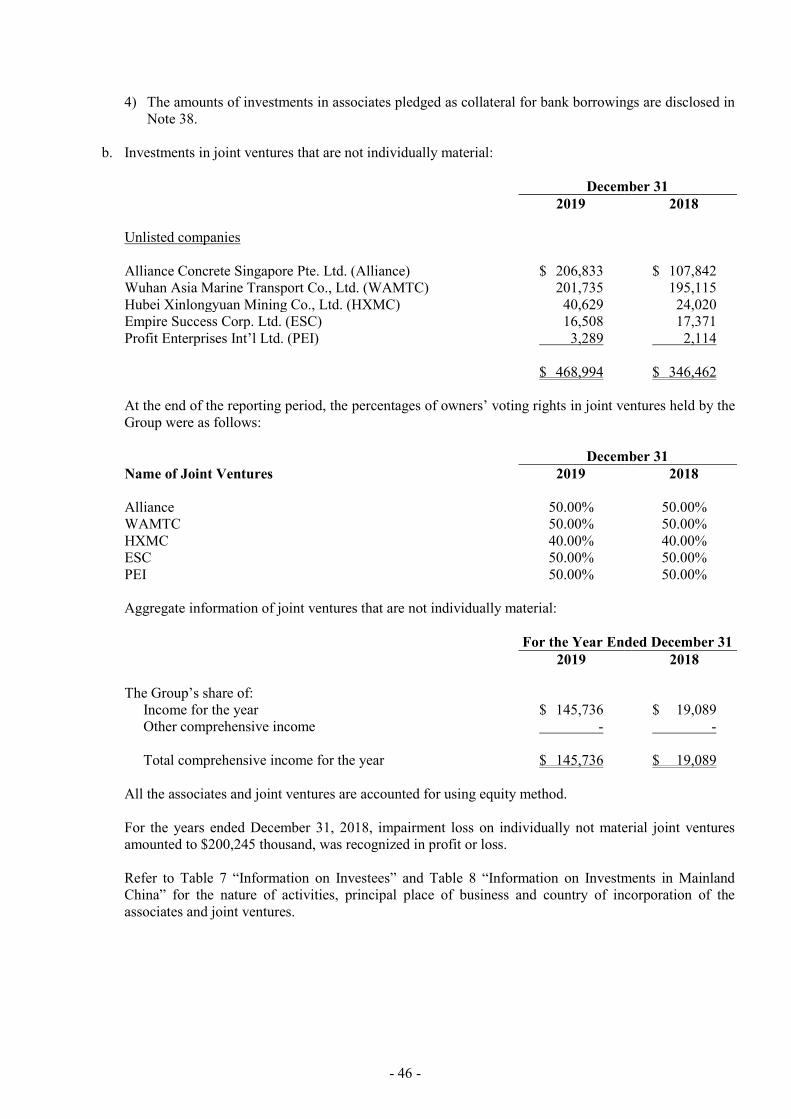
- 46 -
4) The amounts of investments in associates pledged as collateral for bank borrowings are disclosed in Note 38.
b. Investments in joint ventures that are not individually material:
December 31 2019 2018 Unlisted companies Alliance Concrete Singapore Pte. Ltd. (Alliance) $ 206,833 $ 107,842 Wuhan Asia Marine Transport Co., Ltd. (WAMTC) 201,735 195,115 Hubei Xinlongyuan Mining Co., Ltd. (HXMC) 40,629 24,020 Empire Success Corp. Ltd. (ESC) 16,508 17,371 Profit Enterprises Int’l Ltd. (PEI) 3,289 2,114 $ 468,994 $ 346,462 At the end of the reporting period, the percentages of owners’ voting rights in joint ventures held by the Group were as follows: December 31 Name of Joint Ventures 2019 2018 Alliance 50.00% 50.00% WAMTC 50.00% 50.00% HXMC 40.00% 40.00% ESC 50.00% 50.00% PEI 50.00% 50.00% Aggregate information of joint ventures that are not individually material: For the Year Ended December 31 2019 2018 The Group’s share of:
Income for the year $ 145,736 $ 19,089 Other comprehensive income - - Total comprehensive income for the year $ 145,736 $ 19,089
All the associates and joint ventures are accounted for using equity method. For the years ended December 31, 2018, impairment loss on individually not material joint ventures amounted to $200,245 thousand, was recognized in profit or loss. Refer to Table 7 “Information on Investees” and Table 8 “Information on Investments in Mainland China” for the nature of activities, principal place of business and country of incorporation of the associates and joint ventures.

- 47 -
16. PROPERTY, PLANT AND EQUIPMENT
a. Assets used by the Group - 2019
Land Buildings Equipment Other Equipment Property Under
Construction Total Cost Balance at January 1, 2019 $ 6,592,017 $ 24,647,228 $ 75,252,256 $ 12,233,576 $ 3,260,791 $ 121,985,868 Additions - 6,315 87,409 272,718 3,614,732 3,981,174 Disposals - (61,376 ) (468,773 ) (376,656 ) - (906,805 ) Transferred from supplies - - 16,141 56,531 - 72,672 Transferred to intangible
assets - - - - (2,363 ) (2,363 ) Transferred from completed
construction - 310,159 725,892 258,817 (1,294,868 ) - Transferred from
prepayments for leases - - - 27,626 - 27,626 Effect of foreign currency
exchange differences - (740,764 ) (2,125,141 ) (125,566 ) (8,920 ) (3,000,391 ) Balance at December 31,
2019 6,592,017 24,161,562 73,487,784 12,347,046 5,569,372 122,157,781 Accumulated depreciation and impairment Balance at January 1, 2019 12,595 9,710,242 49,670,369 10,043,321 - 69,436,527 Depreciation expense - 635,628 3,146,778 660,987 - 4,443,393 Disposals - (33,166 ) (431,123 ) (360,583 ) - (824,872 ) Transferred from supplies - - 16,141 - - 16,141 Effect of foreign currency
exchange differences - (217,059 ) (1,296,585 ) (81,045 ) - (1,594,689 ) Balance at December 31,
2019 12,595 10,095,645 51,105,580 10,262,680 - 71,476,500 Carrying amounts at
December 31, 2019 $ 6,579,422 $ 14,065,917 $ 22,382,204 $ 2,084,366 $ 5,569,372 $ 50,681,281
The above items of property, plant and equipment are depreciated on a fixed-percentage-on-declining- balance basis or on a straight-line basis over the estimated useful life of the asset taken apart into major component elements: Building
Main buildings 15-60 years Other facilities 2-15 years
Equipment 2-20 years Other equipment 2-20 years As of December 31, 2019, the titles of land with carrying value of $88,718 thousand were temporarily registered in the name of trustees who had either signed an agreement or had pledged the land to the Corporation or to the subsidiaries. Refer to Note 38 for the carrying amount of property, plant and equipment pledged by the Group as collaterals for borrowings.

- 48 -
b. 2018
Land Buildings Equipment Other Equipment Property Under
Construction Total Cost Balance at January 1, 2018 $ 6,591,954 $ 24,940,297 $ 76,074,327 $ 12,716,754 $ 191,440 $ 120,514,772 Additions 63 11,061 324,480 493,934 3,499,440 4,328,978 Disposals - (137,449 ) (360,313 ) (956,539 ) - (1,454,301 ) Disposal of subsidiary - (17,215 ) (45,449 ) (617 ) - (63,281 ) Transferred to supplies - - - (37,670 ) - (37,670 ) Transferred to intangible
assets - - - (577 ) (1,333 ) (1,910 ) Transferred to other assets - - - (15,622 ) - (15,622 ) Transferred from investment
properties to property, plant and equipment - 22,270 - - - 22,270
Transferred from completed construction - 153,845 131,726 138,943 (424,514 ) -
Reclassifications - - 57,159 (57,159 ) - - Others - - - - (156 ) (156 ) Effect of foreign currency
exchange differences - (325,581 ) (929,674 ) (47,871 ) (4,086 ) (1,307,212 ) Balance at December 31,
2018 6,592,017 24,647,228 75,252,256 12,233,576 3,260,791 121,985,868 Accumulated depreciation and impairment Balance at January 1, 2018 12,595 9,247,376 47,223,741 10,292,222 - 66,775,934 Depreciation expense - 640,439 3,308,785 700,337 - 4,649,561 Disposals - (97,604 ) (317,576 ) (915,271 ) - (1,330,451 ) Disposal of subsidiary - (14,074 ) (40,833 ) (555 ) - (55,462 ) Impairment loss recognized - 18,365 32,341 1,182 - 51,888 Transferred to intangible
assets - - - (577 ) - (577 ) Transferred to other assets - - - (15,622 ) - (15,622 ) Reclassifications - - (15,680 ) 15,680 - - Effect of foreign currency
exchange differences - (84,260 ) (520,409 ) (34,075 ) - (638,744 ) Balance at December 31,
2018 12,595 9,710,242 49,670,369 10,043,321 - 69,436,527 Carrying amounts at
December 31, 2018 $ 6,579,422 $ 14,936,986 $ 25,581,887 $ 2,190,255 $ 3,260,791 $ 52,549,341
The above items of property, plant and equipment are depreciated on a fixed-percentage-on-declining- balance basis or on a straight-line basis over the estimated useful life of the asset taken apart into major component elements: Building
Main buildings 15-60 years Other facilities 2-15 years
Equipment 2-20 years Other equipment 2-20 years As of December 31, 2018, the titles of land with carrying value of $88,655 thousand were temporarily registered in the name of trustees who had either signed an agreement or had pledged the land to the Corporation or to the subsidiaries. Refer to Note 38 for the carrying amount of property, plant and equipment pledged by the Group as collaterals for borrowings.
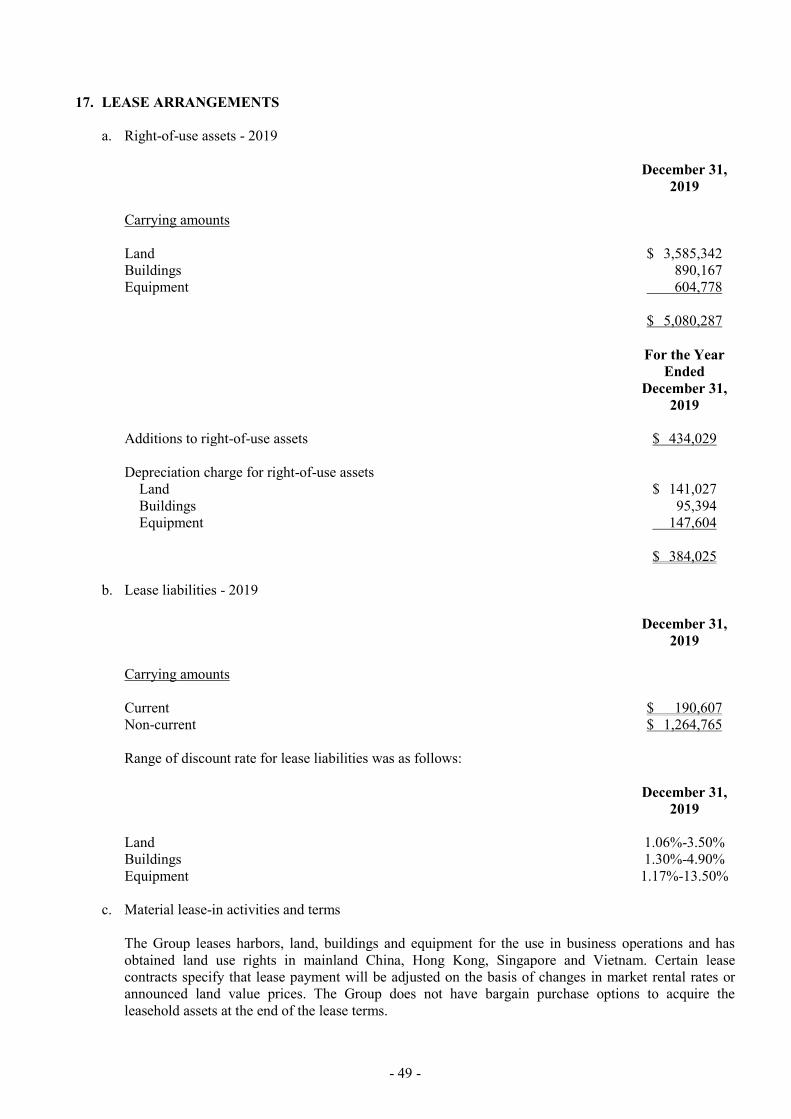
- 49 -
17. LEASE ARRANGEMENTS
a. Right-of-use assets - 2019
December 31,
2019 Carrying amounts Land $ 3,585,342 Buildings 890,167 Equipment 604,778
$ 5,080,287
For the Year Ended
December 31, 2019
Additions to right-of-use assets $ 434,029 Depreciation charge for right-of-use assets
Land $ 141,027 Buildings 95,394 Equipment 147,604 $ 384,025
b. Lease liabilities - 2019
December 31,
2019 Carrying amounts Current $ 190,607 Non-current $ 1,264,765 Range of discount rate for lease liabilities was as follows:
December 31,
2019 Land 1.06%-3.50% Buildings 1.30%-4.90% Equipment 1.17%-13.50%
c. Material lease-in activities and terms
The Group leases harbors, land, buildings and equipment for the use in business operations and has obtained land use rights in mainland China, Hong Kong, Singapore and Vietnam. Certain lease contracts specify that lease payment will be adjusted on the basis of changes in market rental rates or announced land value prices. The Group does not have bargain purchase options to acquire the leasehold assets at the end of the lease terms.
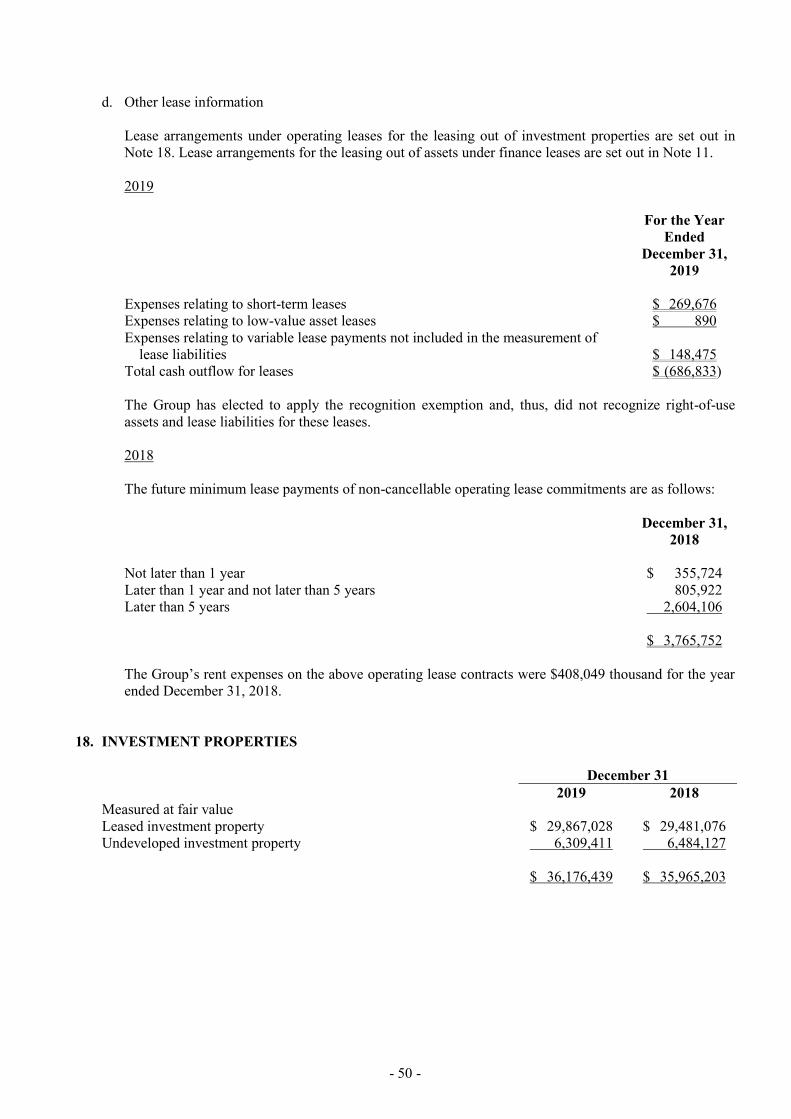
- 50 -
d. Other lease information Lease arrangements under operating leases for the leasing out of investment properties are set out in Note 18. Lease arrangements for the leasing out of assets under finance leases are set out in Note 11. 2019
For the Year Ended
December 31, 2019
Expenses relating to short-term leases $ 269,676 Expenses relating to low-value asset leases $ 890 Expenses relating to variable lease payments not included in the measurement of
lease liabilities $ 148,475 Total cash outflow for leases $ (686,833) The Group has elected to apply the recognition exemption and, thus, did not recognize right-of-use assets and lease liabilities for these leases. 2018 The future minimum lease payments of non-cancellable operating lease commitments are as follows:
December 31,
2018 Not later than 1 year $ 355,724 Later than 1 year and not later than 5 years 805,922 Later than 5 years 2,604,106 $ 3,765,752 The Group’s rent expenses on the above operating lease contracts were $408,049 thousand for the year ended December 31, 2018.
18. INVESTMENT PROPERTIES December 31 2019 2018 Measured at fair value Leased investment property $ 29,867,028 $ 29,481,076 Undeveloped investment property 6,309,411 6,484,127 $ 36,176,439 $ 35,965,203

- 51 -
Leased Investment Property
Undeveloped Investment Property Total
Balance at January 1, 2018 $ 29,352,403 $ 6,393,008 $ 35,745,411 Additions 1,269 - 1,269 Accounts receivable write-offs - 149,528 149,528 Transferred to property, plant and equipment - (22,270) (22,270) Changes in fair value of investment properties 128,575 (30,560) 98,015 Effect of foreign currency exchange difference (1,171) (5,579) (6,750) Balance at December 31, 2018 $ 29,481,076 $ 6,484,127 $ 35,965,203 Balance at January 1, 2019 $ 29,481,076 $ 6,484,127 $ 35,965,203 Additions 24,834 2,390 27,224 Changes in fair value of investment properties 363,361 (165,714) 197,647 Effect of foreign currency exchange difference (2,243) (11,392) (13,635) Balance at December 31, 2019 $ 29,867,028 $ 6,309,411 $ 36,176,439 The investment properties for lease were as follows: a. On January 1, 1998, the Corporation granted FEDSDL the right to construct a shopping center on a
parcel of land it owned with an area of 6,976 square meters located in Lin-Ya, Kaohsiung. As consideration for the right to construct and the continued use of the land for fifty years, FEDSDL shall pay the following: (a) land use rights in the amount of $1,073,000 thousand and (b) annual rental at 5% of the reference price of such land announced by the local government. The proceeds of the land use rights were recorded as long-term deferred revenue and recognized as rental revenue on a periodic basis.
b. The Corporation and Far Eastern Resources Development Co. (FERD) equally owned a parcel of land
located at Tun Hwa South Road, Taipei City. Under an agreement entered into with YDC, the Corporation and FERD had agreed on the following: (a) construction of a twin tower building (Taipei Metro) by YDC on the said land, (b) continued use of the land without additional compensation for 30 years starting from the date of the completion of the building, (c) transfer to each of the Corporation and FERD 12% of the usable area of the building, and (d) transfer to FERD and the Corporation the remaining usable area of the building after the end of 30 years in exchange for the carrying amount of the property. In view of the foregoing agreement, the Corporation recorded the 12% of the building construction cost or $1,402,753 thousand as building acquired and as long-term deferred revenue, and recognized as revenue on a periodic basis.
c. SYDCCL signed a contract with Mie Business Services Co., Ltd. (Mie Business). The contract fully
authorized Mie Business to manage and operate SYDCCL’s store located in area A of Guosetianxiang Second-Stage in Wenjiang District of Chengdu City, with an area of 932.49 square meters. The contract started from May 1, 2017 and will end on March 31, 2022.
d. The Corporation also has lease contract for Asia-Cement Building and Pao-Ching Building, as well as
land and building located in Chiayi City and Wuhan. These investment properties are leased out for 1 to 10 years with monthly lease payments.
The Group’s undeveloped investment properties included a parcel of land located in Lin-Ya, Kaohsiung, as well as stores, apartments, and office buildings acquired by SIYDCCL and HYDCCL as collaterals for overdue balances from customers.

- 52 -
The fair values of investment properties were valued by independent qualified professional appraisers. According to local requirements, entities are required to have independent appraisal for the investment properties with individual carrying amount of $300 million or higher. The fair values of investment properties as of December 31, 2019 and 2018 were determined by qualified professional appraisers, Mr. Chang from Savills (Taiwan) Limited and Mr. Tsai from DTZ real estate appraisers firm on March 4, 2020 and March 4, 2019, respectively. The fair value of investment properties was estimated using unobservable inputs (Level 3). The movements in the fair value were as follows:
Completed Investment Property
Investment Property under
Construction Total Balance at January 1, 2018 $ 29,352,403 $ 6,393,008 $ 35,745,411 Recognized in profit or loss (gain or loss from
changes in fair value of investment property) 128,575 (30,560) 98,015 Recognized in other comprehensive income
Exchange differences on translating the financial statements of foreign operations (1,171) (5,579) (6,750)
Purchases 1,269 - 1,269 Transfers into Level 3 - 149,528 149,528 Transfers out of Level 3 - (22,270) (22,270) Balance at December 31, 2018 $ 29,481,076 $ 6,484,127 $ 35,965,203 Balance at January 1, 2019 $ 29,481,076 $ 6,484,127 $ 35,965,203 Recognized in profit or loss (gain or loss from
changes in fair value of investment property) 363,361 (165,714) 197,647 Recognized in other comprehensive income
Exchange differences on translating the financial statements of foreign operations (2,243) (11,392) (13,635)
Purchases 24,834 2,390 27,224 Balance at December 31, 2019 $ 29,867,028 $ 6,309,411 $ 36,176,439 The fair value measurement of undeveloped land located in Lin-Ya, Kaohsiung, was measured by land development analysis. The increase in estimated total selling price, the increase in rate of return, or the decrease in overall capital interest rate would result in an increase in the fair value. The significant assumptions used were as follows: December 31 2019 2018 Estimated total selling price $ 19,379,643 $ 18,991,547 Rate of return 22% 22% Overall capital interest rate 5.99% 6.08% The total selling price is estimated on the basis of the most effective use of the land or property available for sale after development is completed, taking into account the related regulations, domestic macroeconomic prospects, local land use, and market rates.
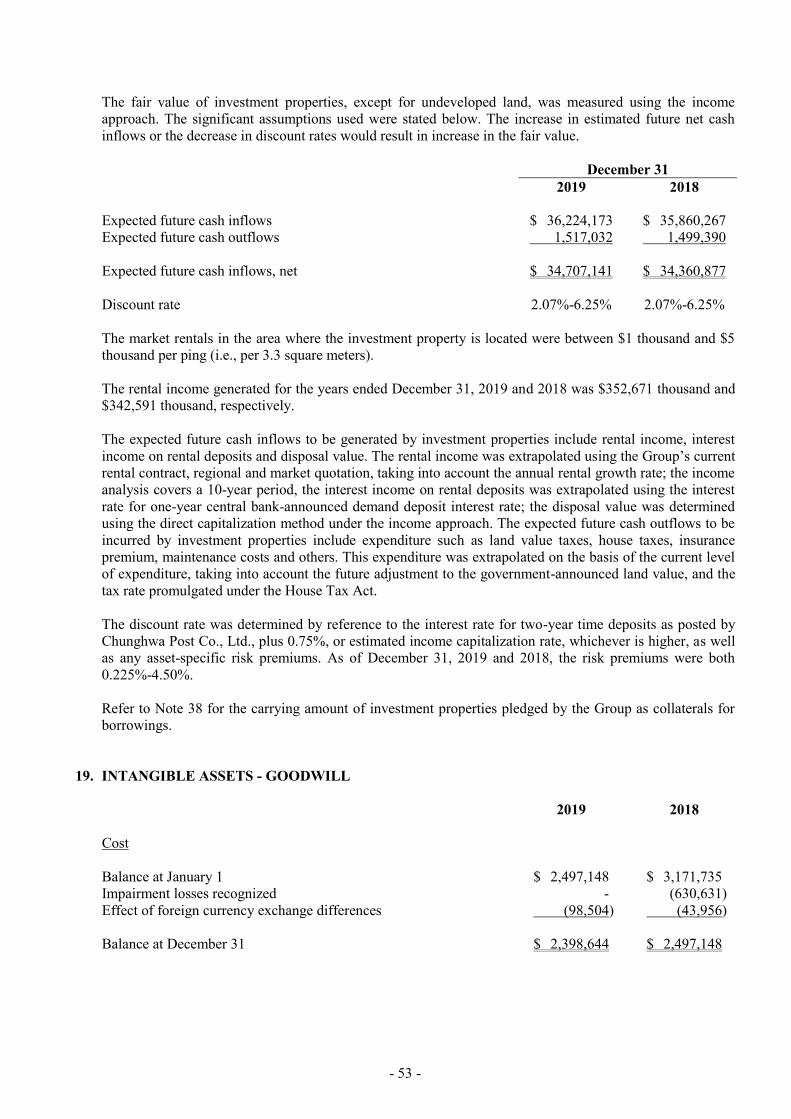
- 53 -
The fair value of investment properties, except for undeveloped land, was measured using the income approach. The significant assumptions used were stated below. The increase in estimated future net cash inflows or the decrease in discount rates would result in increase in the fair value.
December 31 2019 2018 Expected future cash inflows $ 36,224,173 $ 35,860,267 Expected future cash outflows 1,517,032 1,499,390 Expected future cash inflows, net $ 34,707,141 $ 34,360,877 Discount rate 2.07%-6.25% 2.07%-6.25% The market rentals in the area where the investment property is located were between $1 thousand and $5 thousand per ping (i.e., per 3.3 square meters). The rental income generated for the years ended December 31, 2019 and 2018 was $352,671 thousand and $342,591 thousand, respectively. The expected future cash inflows to be generated by investment properties include rental income, interest income on rental deposits and disposal value. The rental income was extrapolated using the Group’s current rental contract, regional and market quotation, taking into account the annual rental growth rate; the income analysis covers a 10-year period, the interest income on rental deposits was extrapolated using the interest rate for one-year central bank-announced demand deposit interest rate; the disposal value was determined using the direct capitalization method under the income approach. The expected future cash outflows to be incurred by investment properties include expenditure such as land value taxes, house taxes, insurance premium, maintenance costs and others. This expenditure was extrapolated on the basis of the current level of expenditure, taking into account the future adjustment to the government-announced land value, and the tax rate promulgated under the House Tax Act. The discount rate was determined by reference to the interest rate for two-year time deposits as posted by Chunghwa Post Co., Ltd., plus 0.75%, or estimated income capitalization rate, whichever is higher, as well as any asset-specific risk premiums. As of December 31, 2019 and 2018, the risk premiums were both 0.225%-4.50%. Refer to Note 38 for the carrying amount of investment properties pledged by the Group as collaterals for borrowings.
19. INTANGIBLE ASSETS - GOODWILL
2019 2018 Cost Balance at January 1 $ 2,497,148 $ 3,171,735 Impairment losses recognized - (630,631) Effect of foreign currency exchange differences (98,504) (43,956) Balance at December 31 $ 2,398,644 $ 2,497,148
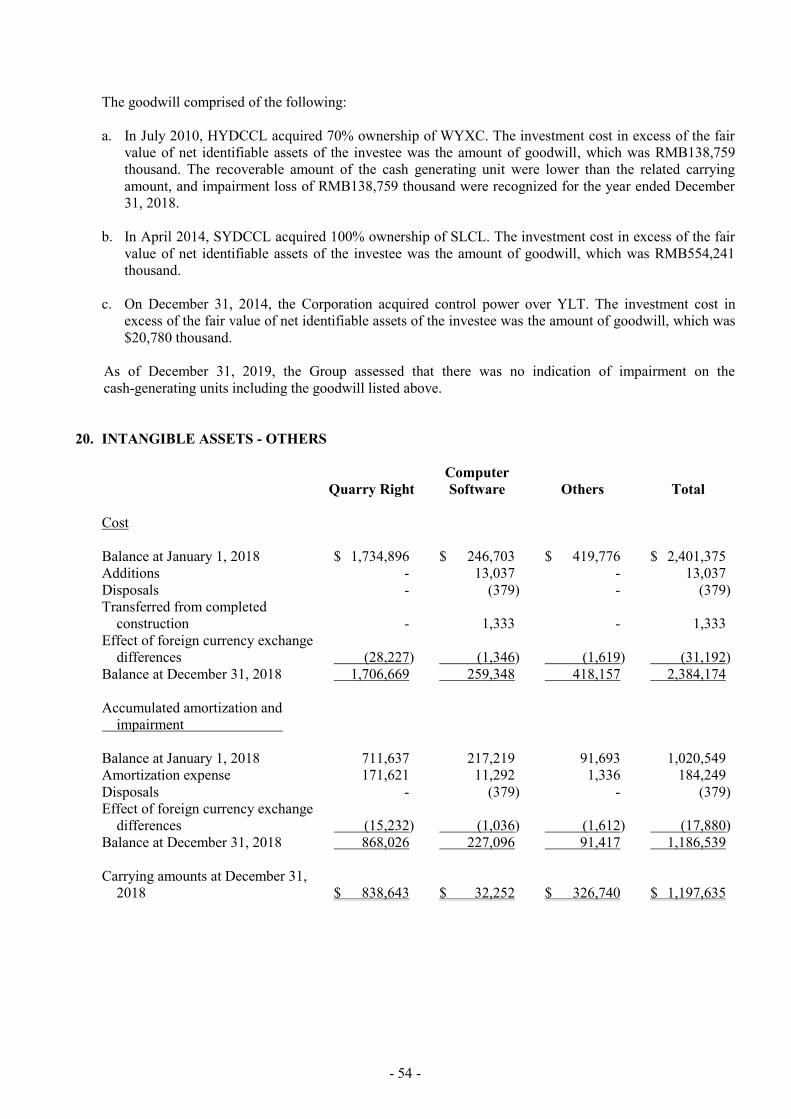
- 54 -
The goodwill comprised of the following: a. In July 2010, HYDCCL acquired 70% ownership of WYXC. The investment cost in excess of the fair
value of net identifiable assets of the investee was the amount of goodwill, which was RMB138,759 thousand. The recoverable amount of the cash generating unit were lower than the related carrying amount, and impairment loss of RMB138,759 thousand were recognized for the year ended December 31, 2018.
b. In April 2014, SYDCCL acquired 100% ownership of SLCL. The investment cost in excess of the fair
value of net identifiable assets of the investee was the amount of goodwill, which was RMB554,241 thousand.
c. On December 31, 2014, the Corporation acquired control power over YLT. The investment cost in
excess of the fair value of net identifiable assets of the investee was the amount of goodwill, which was $20,780 thousand.
As of December 31, 2019, the Group assessed that there was no indication of impairment on the cash-generating units including the goodwill listed above.
20. INTANGIBLE ASSETS - OTHERS
Quarry Right Computer Software Others Total
Cost Balance at January 1, 2018 $ 1,734,896 $ 246,703 $ 419,776 $ 2,401,375 Additions - 13,037 - 13,037 Disposals - (379) - (379) Transferred from completed
construction - 1,333 - 1,333 Effect of foreign currency exchange
differences (28,227) (1,346) (1,619) (31,192) Balance at December 31, 2018 1,706,669 259,348 418,157 2,384,174 Accumulated amortization and impairment Balance at January 1, 2018 711,637 217,219 91,693 1,020,549 Amortization expense 171,621 11,292 1,336 184,249 Disposals - (379) - (379) Effect of foreign currency exchange
differences (15,232) (1,036) (1,612) (17,880) Balance at December 31, 2018 868,026 227,096 91,417 1,186,539 Carrying amounts at December 31,
2018 $ 838,643 $ 32,252 $ 326,740 $ 1,197,635

- 55 -
Quarry Right Computer Software Others Total
Cost Balance at January 1, 2019 $ 1,706,669 $ 259,348 $ 418,157 $ 2,384,174 Additions 49,836 9,105 - 58,941 Disposals - (937) - (937) Accruals 4,820,027 - - 4,820,027 Transferred from completed
construction - 2,363 - 2,363 Effect of foreign currency exchange
differences (273,628) (3,174) (3,655) (280,457) Balance at December 31, 2019 6,302,904 266,705 414,502 6,984,111 Accumulated amortization and impairment Balance at January 1, 2019 868,026 227,096 91,417 1,186,539 Amortization expense 1,279,440 12,846 439 1,292,725 Disposals - (937) - (937) Effect of foreign currency exchange
differences (89,688) (2,546) (3,655) (95,889) Balance at December 31, 2019 2,057,778 236,459 88,201 2,382,438 Carrying amounts at December 31,
2019 $ 4,245,126 $ 30,246 $ 326,301 $ 4,601,673 The above items of other intangible assets with finite useful lives are amortized on a straight-line basis. Quarry rights are amortized over 40 to 47 years and the computer software and others are amortized over 2 to 6 years. The other items with indefinite useful lives will not be amortized until their useful lives are determined to be finite. Instead, they will be tested for impairment annually and whenever there is an indication that they may be impaired. According to the Plan for the Reform of the Mineral Resource Royalty System issued by the State Council of the People's Republic of China, proceeds from prospecting and mining rights shall be changed into proceeds from assignment of mining rights and shall be determined according to valuation and benchmark market prices under similar conditions, whichever is higher. The proceeds from the transfer of mining rights shall be determined at one time and paid in the form of monetary funds. The specific measures for payment shall be developed separately by the Ministry of Finance in conjunction with the Ministry of Land and Resources. In 2019, the Group finalized the independent valuer report in accordance with the aforementioned reform plans on the mine reserves and the estimated amount of the provision of mine reserve fund was RMB1,075,031 thousand, which was capitalized into the cost of quarry. In addition, the Group was required to accrue an amount of RMB275,076 thousand as cost of production of mine, which represented the amount of mine excavated times the agreed amount of unit cost for the current and past years, and such amount was charged to the cost of sales of the Group for the year ended December 31, 2019. As of the balance sheet date, the mine reserve fund of RMB1,075,031 thousand was accounted for as accounts payable and accrued expenses - third parties since the actual payment date and amounts have not yet been finalized with the local government.

- 56 -
21. PREPAYMENTS FOR LEASES
December 31,
2018 Current assets (included in prepayments line item) $ 142,246 Non-current assets 3,779,353 $ 3,921,599 The above prepayments for leases include land use rights in mainland China, Hong Kong, Singapore and Vietnam. The amortization expense is $85,382 thousand for the year ended December 31, 2018.
22. OTHER NON-CURRENT ASSETS
December 31 2019 2018 Prepaid investments $ 1,437,673 $ 2,042,722 Net defined benefit assets 2,536,388 1,898,029 Refundable deposits 328,403 914,114 Others 9,420 9,693 $ 4,311,884 $ 4,864,558 Refundable deposits
Current (accounted for as other current assets) $ 71,424 $ 82,493 Non-current $ 328,403 $ 914,114
The prepaid investments comprised of the following: a. On March 23, 2017, the Corporation acquired 155 thousand issued shares of China Shanshui
Investment Company Limited (CSI) in the amount of HK$577,662 thousand from six shareholders of CSI under a share purchase agreement. The Corporation already obtained the physical share certificates of the acquired CSI shares. Pursuant to the Articles of Association of CSI, the share ownership can only be recorded on the register of shareholders if the board of directors of CSI approves the share transfer. The Corporation submitted all necessary documents to CSI for registration of the share transfer. However, CSCGL and its subsidiaries obtained from the High Court of Hong Kong an injunction order by way of an ex-parte application on April 11, 2017. Pursuant to the injunction order, four out of the abovementioned six shareholders, Mi Jingtian, Zhao Liping, Li Maohuan and Yu Yuchuan, are prohibited from removing any of their assets in Hong Kong. Each of their assets’ value is up to RMB142 million (or its Hong Kong dollar equivalent), in particular, their shares in CSI and/or any proceeds from sales of any such CSI shares. The Corporation is neither a plaintiff nor a defendant in the aforesaid proceedings. But, for the purpose of securing and exercising the rights and interests of the acquired shares of CSI, the Corporation provided a bank guarantee of RMB142 million to the High Court of Hong Kong according to the High Court’s ruling on April 21, 2017. On the same day, the High Court of Hong Kong lifted the injunction order on the shares of CSI acquired by the Corporation. Since the payment liability event as agreed in the bank guarantee did not occur before due date and the bank guarantee expired on April 21, 2019, the Corporation’s obligations were terminated on the same day.

- 57 -
In addition, Chan Hongqing, a PRC individual, claimed that the CSI shares which the Corporation acquired from the abovementioned four shareholders were pledged as collaterals under a loan contract signed on August 17, 2015 with him and thus applied for arbitration with China International Economic and Trade Arbitration Commission in Beijing. Later, by an order of the High Court of Hong Kong on June 27, 2017, it requested the appointment of interim receivers in respect of the CSI shares held by the four shareholders until the end of the arbitral proceedings. On May 17, 2018, the High Court of Hong Kong set aside the order before the final award of the arbitration. The arbitral proceeding was therefore terminated on June 12, 2018. On October 2, 2018, Chan Hongqing applied to the High Court of Hong Kong for interlocutory relief in another proceedings against the Corporation to prohibit the Corporation and the abovementioned four CSI shareholders from transferring and registering their CSI shares. Then his application for interlocutory relief was dismissed by the High Court of Hong Kong. The Corporation engaged lawyers to proactively liaise with the board of directors of CSI in connection with the registration of the share transfer. As for the shares acquired from the other two CSI shareholders, Dong Chengtian and Wang Yongping, Chan Hongqing also claimed that the CSI shares held by the two shareholders were pledged as collaterals under the same loan contract mentioned above. As a result, the board of directors of CSI refused to approve the share transfer. Later, as the Corporation filed a lawsuit to the High Court of Hong Kong against CSI, the board of directors of CSI finally approved the share transfer. The registration of the CSI shares acquired from the two shareholders, Dong Chengtian and Wang Yongping, were completed and the prepaid investments in the balance sheets was therefore reclassified to financial assets at fair value through other comprehensive income - non-current. Refer to Note 8.
b. Chu Feng Power Corporation, Preparatory Office (Chu Feng), founded in October 2016, was created by DCI, the Corporation’s subsidiary, for the development of offshore wind power in Taiwan. As of December 31, 2019 and 2018, the accumulated prepaid investments were $142,768 thousand and $131,544 thousand, respectively. In March 2018, Chu Feng submitted an application to the Bureau of Energy, Ministry of Economic Affairs, ROC, for the offshore wind power project’s selection. However, Chu Feng did not pass the selection according to the announcement on April 30, 2018. In June 2018, Chu Feng joined the second stage auction and its bid failed again. Later, on March 25, 2020, DCI’s board of directors resolved to enter into a bidding contract (including the final version of the joint venture contract) with Innogy Renewables Beteiligungs GmbH Company. As of the balance sheet date, the Group recognized the amounts paid within the preparatory period as other receivables or prepaid investments. The Group also recognized full amounts of provisions based on the preparatory loss of Chu Feng. Refer to Note 28.
23. SHORT-TERM BORROWINGS
December 31 2019 2018 Unsecured $ 22,211,603 $ 23,099,239 Secured 1,600,000 1,706,000 $ 23,811,603 $ 24,805,239 Interest rate (%) 0.95-3.79 1.04-5.30 Final repayment date:
Unsecured 2020.12.24 2019.10.31 Secured 2020.2.19 2019.3.26

- 58 -
24. SHORT-TERM BILLS PAYABLE December 31 2019 2018 Commercial paper $ 18,938,500 $ 18,569,425 Less: Unamortized discounts on bills payable 6,206 4,956 $ 18,932,294 $ 18,564,469 Interest rate (%) 0.38%-1.3% 0.36%-1.26% Short-term bills payable were issued under guarantee obtained from financial institutions.
25. OTHER PAYABLES December 31 2019 2018 Payable on investment $ 312,069 $ 334,305 Payable on investment is the unpaid consideration for SIYDCCL’s acquisition of SLCL, which amounted to RMB72,738 thousand.
26. LONG-TERM LIABILITIES
December 31 2019 2018 Bank loans $ 30,972,304 $ 31,886,897 Long-term commercial paper - 5,000,000 Less: Unamortized discounts - 7,989 30,972,304 36,878,908 Bonds
Domestic bonds 1st unsecured bonds issued in 2014 - 4,000,000 1st unsecured bonds issued in 2016 6,000,000 6,000,000 1st unsecured bonds issued in 2019 6,500,000 - 2nd unsecured bonds issued in 2019 3,500,000 -
16,000,000 10,000,000 Overseas bonds
3rd Euro convertible bonds issued in 2018 - US$215,000 thousand 6,280,808 6,192,567
53,253,112 53,071,475 Less: Current portion 13,151,315 7,285,012
$ 40,101,797 $ 45,786,463 a. Bank loans are repayable in installments at varying amounts or in one lump-sum payment prior to April
3, 2039. The Group has signed long-term revolving credit facilities with banks. As of December 31, 2019 and 2018, interest rates were 0.89%-6.75% and 0.89%-5.58%, respectively.
b. Long-term commercial paper was issued by contract. As of December 31, 2018, interest rates were
0.83%-0.84%. The maturity date of the contract is December 19, 2020.
- 59 -
c. Domestic bonds are repayable in installments at varying amounts or in one lump-sum on maturity prior
to August 16, 2024. As of December 31, 2019 and 2018, interest rates were 0.79%-0.88% and 0.80%-1.36%, respectively.
d. In order to redeem bonds and pay interest expenses, on May 13, 2013, the Corporation issued 2nd
US$220,000 thousand (equivalent to NT$6,551,380 thousand) zero coupon Euro convertible bonds due 2018. The terms of the zero coupon Euro convertible bonds included the following: 1) Final redemption
Unless previously redeemed, repurchased and cancelled, or converted, the bonds will be redeemed on the maturity date at a redemption price equal to 100% of the unpaid principal amount thereof.
2) The bonds are convertible into the Corporation’s ordinary shares (“Shares”) at any time on or after
June 23, 2013 and prior to the close of business on April 13, 2018. The initial conversion price was NT$48 per Share, determined on the basis of a fixed exchange rate of NT$29.53=US$1.00.
3) Redemption at the option of the Corporation
At any time on or after May 13, 2016, the Corporation may redeem the bonds in whole, or from time to time in part, at the early redemption amount, if the closing price of the Shares, translated into U.S. dollars at the prevailing rate, during a period of 30 consecutive trading days, is at least 130% of the quotient of the early redemption amount divided by the number of Shares to be issued upon conversion of US$200,000 principal amount of bonds on the applicable trading day based on the conversion price then in effect, translated into U.S. dollars at a fixed exchange rate of NT$29.53=US$1.00. Notwithstanding the foregoing, at any time, the Corporation may redeem the bonds in whole, but not in part, at the early redemption amount in U.S. dollars if at least 90% in principal amount of the bonds has already been redeemed, repurchased and cancelled, or converted.
4) Redemption at the option of the bondholders
Unless previously redeemed, repurchased and cancelled or converted, each holder will have the right to require the Corporation to redeem in whole or in part of the bonds held by such holder on May 13, 2016 at a redemption price equal to 100% of the principal amount thereof. (Refer to item 6 below for information on the redemption of bonds.)
5) The conversion price shall be subject to adjustment when there is occurrence of, including (but not
limited to), the following: a) Declaration of dividend in Shares or free distribution or bonus issue of Shares. b) Subdivision, consolidation and reclassification of Shares. c) Rights issues to shareholders. d) Employee share bonus. e) Warrants issued to holders of Shares. f) Issues of rights or warrants for equity-related securities to holders of Shares. g) Capital distributions, other distributions to shareholders.
- 60 -
h) Issue of convertible or exchangeable securities other than to holders of Shares or on exercise of warrants.
i) Other issues of Shares. j) Issue of equity related securities. k) Capital reduction. l) Tender or exchange offer. m) Any other event or circumstance which would have an effect analogous to any of the events in
a) to l) above.
6) As bondholders exercised the put option, the Corporation had redeemed the principal amount of US$217,000 thousand on May 11, 2016. After the redemption, the bonds outstanding in the amount of US$3,000 thousand had been paid on May 10, 2018.
e. In order to repay the debt, save interest expenses, and strengthen the Corporation’s financial structure,
on September 21, 2018, the Corporation issued US$215,000 thousand (equivalent to NT$6,620,710 thousand), which is the third zero coupon Euro convertible bond due on 2023. The terms of the zero coupon Euro convertible bonds included the following: 1) Final redemption
Unless previously redeemed, repurchased and canceled, or converted, the Bonds will be redeemed on the maturity date at the settlement equivalent of 103.04% of the unpaid principal amount thereof.
2) The bonds are convertible into the Corporation’s ordinary shares (“Shares”) at any time on or after December 21, 2018 and prior to the close of business on August 22, 2023. The initial conversion price was NT$42.24 per Share, determined on the basis of a fixed exchange rate of NT$30.794=US$1.00.
3) Redemption at the option of the Corporation
At any time on or after September 21, 2021, the Corporation may redeem the bonds in whole, or from time to time in part, at the early redemption amount, if the closing price of the Shares, translated into U.S. dollars at the prevailing rate, during a period of 30 consecutive trading days, is at least 130% of the quotient of the early redemption amount divided by the number of Shares to be issued upon conversion of US$200,000 principal amount of the bonds on the applicable trading day based on the conversion price then in effect, translated into U.S. dollars at a fixed exchange rate of NT$30.794=US$1.00. Notwithstanding the foregoing, at any time, the Corporation may redeem the bonds in whole, but not in part, at the early redemption amount in U.S. dollars if at least 90% in principal amount of the bonds has already been redeemed, repurchased and cancelled, or converted.
4) Redemption at the option of the bondholders Unless previously redeemed, repurchased and cancelled or converted, each holder will have the right to require the Corporation to redeem in whole or in part of the bonds held by such holder on September 21, 2021 at a redemption price equal to the settlement equivalent of 101.81% of the principal amount in U.S. dollars. Any U.S. dollar denominated amount payable in respect of the bonds will be converted into NT dollars using a fixed exchange rate and then converted back to a U.S. dollar amount using the applicable prevailing rate at the time of redemption.
- 61 -
5) The conversion price shall be subject to adjustment when there is occurrence of, including (but not limited to), the following: a) Declaration of dividend in Shares or free distribution or bonus issue of Shares. b) Subdivision, consolidation and reclassification of Shares. c) Rights issues to shareholders. d) Employee share bonus. e) Warrants issued to holders of Shares. f) Issues of rights or warrants for equity-related securities to holders of Shares. g) Capital distributions, other distributions to shareholders. h) Issue of convertible or exchangeable securities other than to holders of Shares or on exercise of
warrants. i) Other issues of Shares. j) Issue of equity related securities. k) Capital reduction. l) Tender or exchange offer. m) Any other event or circumstance which would have an effect analogous to any of the events in
a) to l) above. The conversion price was NT$39.7 as of December 31, 2019.
f. As of December 31, 2019, CHP had used its credit lines as follows:
Loan Item Category Amount
(In Thousands)
Interest Rate Contract
Period
A Loan NT$ 2,850,000 1.797 20 years The financial commitment that should be maintained by CHP under the payment terms are as follows: 1) Debt ratio as of year-end (total debt divided by total equity);
a) Under 200% from 2019 to 2023. b) Under 150% from 2024 to 2039.
2) Interest coverage ratio should be at least 150% from 2019 to 2039.
The above financial ratios are based on audited financial statements. Debt ratio and interest coverage ratio should be reviewed at least on annual basis.

- 62 -
g. As of December 31, 2019, CHP had used its credit lines as follows:
Bank Amount
(In Thousands) Interest Rate/
Guarantee Fee Rate (%) Contract Period Mizuho NT$ 184,252 0.45 2019.09.18-2020.09.18 Mizuho NT$ 275,000 0.45 2019.09.18-2020.09.18 Mizuho US$ 4,470 0.45 2020.09.18-2020.09.18
27. DEFERRED REVENUE
December 31 2019 2018 Land use right $ 790,753 $ 858,838 Others 133,052 140,879 $ 923,805 $ 999,717 Current $ 75,912 $ 75,912 Non-current 847,893 923,805 $ 923,805 $ 999,717 a. The deferred revenue on land use rights in Lin-Ya, Kaohsiung granted to FEDSDL (Note 18) is
amortized to income over 50 years on a straight-line basis. b. The deferred revenue on land use rights of Taipei Metro granted to YDC (Note 18) is amortized to
income over 30 years on a straight-line basis. 28. OTHER LIABILITIES
December 31 2019 2018 Preparatory costs provisions (Note 22) $ 263,015 $ 222,729 Decommissioning of electric factory provisions 217,942 217,942 Accrued reward provisions 130,172 140,572 Compensation of traffic accident provisions 134,324 127,894 Other provisions (Note 39) 20,640 18,440 $ 766,093 $ 727,577 Current $ 50,661 $ 48,200 Non-current 715,432 679,377 $ 766,093 $ 727,577

- 63 -
29. RETIREMENT BENEFIT PLANS a. Defined contribution plans
The Corporation and the subsidiaries in the ROC adopted a pension plan under the Labor Pension Act (LPA), which is a state-managed defined contribution plan. Under the LPA, an entity makes monthly contributions to employees’ individual pension accounts at specific rate of monthly salaries and wages.
b. Defined benefit plans The defined benefit plan adopted by the Corporation and domestic subsidiaries in accordance with the Labor Standards Law is operated by the government of the ROC. Pension benefits are calculated on the basis of the length of service and average monthly salaries of the six months or last month before retirement. The Corporation and domestic subsidiaries contribute amounts equal to 2%-15% of total monthly salaries and wages to a pension fund administered by the pension fund monitoring committee. Pension contributions are deposited in the Bank of Taiwan in the committee’s name. Before the end of each year, the Group assesses the balance in the pension fund. If the amount of the balance in the pension fund is inadequate to pay retirement benefits for employees who conform to retirement requirements in the next year, the Group is required to fund the difference in one appropriation that should be made before the end of March of the next year. The pension fund is managed by the Bureau of Labor Funds, Ministry of Labor (the “Bureau”); the Group has no right to influence the investment policy and strategy. The amounts included in the consolidated balance sheets in respect of the Group’s defined benefit plans were as follows: December 31 2019 2018 Present value of defined benefit obligation $ 1,296,487 $ 1,322,473 Fair value of plan assets (3,668,667) (3,035,395) Deficit (surplus) (2,372,180) (1,712,922) Net defined benefit liabilities (asset) $ (2,372,180) $ (1,712,922) Movements in net defined benefit liabilities (assets) were as follows:
Present Value of the Defined
Benefit Obligation
Fair Value of the Plan Assets
Net Defined Benefit
Liability (Asset) Balance at January 1, 2018 $ 1,527,968 $ (2,860,286) $ (1,332,318) Service cost
Current service cost 19,607 - 19,607 Net interest expense (income) 17,492 (33,798) (16,306)
Recognized in profit or loss 37,099 (33,798) 3,301 Remeasurement
Return on plan assets (excluding amounts included in net interest) - (303,940) (303,940)
Actuarial loss - changes in demographic assumptions 259 - 259
(Continued)

- 64 -
Present Value of the Defined
Benefit Obligation
Fair Value of the Plan Assets
Net Defined Benefit
Liability (Asset)
Actuarial loss - changes in financial assumptions $ 20,848 $ - $ 20,848
Actuarial loss - experience adjustments (46,872) - (46,872) Recognized in other comprehensive income (25,765) (303,940) (329,705) Contributions from the employer - (25,085) (25,085) Benefits paid (216,873) 183,077 (33,796) Others 44 4,637 4,681 Balance at December 31, 2018 $ 1,322,473 $ (3,035,395) $ (1,712,922) Balance at January 1, 2019 $ 1,322,473 $ (3,035,395) $ (1,712,922) Service cost
Current service cost 15,773 - 15,773 Net interest expense (income) 13,951 (32,999) (19,048)
Recognized in profit or loss 29,724 (32,999) (3,275) Remeasurement
Return on plan assets (excluding amounts included in net interest) - (674,330) (674,330)
Actuarial loss - changes in demographic assumptions 125 - 125
Actuarial loss - changes in financial assumptions 17,531 - 17,531
Actuarial loss - experience adjustments 52,335 - 52,335 Recognized in other comprehensive income 69,991 (674,330) (604,339) Contributions from the employer - (18,447) (18,447) Benefits paid (125,701) 91,676 (34,025) Liabilities extinguished on settlement - 828 828 Balance at December 31, 2019 $ 1,296,487 $ (3,668,667) $ (2,372,180)
(Concluded) Through the defined benefit plans under the Labor Standards Law, the Group is exposed to the following risks: 1) Investment risk: The plan assets are invested in domestic and foreign equity and debt securities,
bank deposits, etc. The investment is conducted at the discretion of the Bureau or under the mandated management. However, in accordance with relevant regulations, the return generated by plan assets should not be below the interest rate for a 2-year time deposit with local banks.
2) Interest risk: A decrease in the corporate bond interest rate will increase the present value of the
defined benefit obligation; however, this will be partially offset by an increase in the return on the plan’s debt investments.
3) Salary risk: The present value of the defined benefit obligation is calculated by reference to the
future salaries of plan participants. As such, an increase in the salary of the plan participants will increase the present value of the defined benefit obligation.
- 65 -
The actuarial valuations of the present value of the defined benefit obligation were carried out by qualified actuaries. The significant assumptions used for the purposes of the actuarial valuations were as follows: December 31 2019 2018 Discount rate(s) 0.65%-1.15% 0.75%-1.40% Expected rate(s) of salary increase 2.00%-2.50% 2.00%-2.50% If possible reasonable change in each of the significant actuarial assumptions will occur and all other assumptions will remain constant, the present value of the defined benefit obligation would increase (decrease) as follows: December 31 2019 2018 Discount rate(s)
0.25% increase $ (27,702) $ (30,402) 0.25% decrease $ 28,636 $ 31,476
Expected rate(s) of salary increase 1% increase $ 126,052 $ 139,268 1% decrease $ (116,810) $ (128,585)
The major categories of plan assets at the end of the reporting period are disclosed based on the information announced by the Bureau: December 31 2019 2018 Equity instruments 82.07 84.40 Deposited in financial institutions 9.86 6.75 Others 8.07 8.85 100.00 100.00 The sensitivity analysis presented above may not be representative of the actual change in the present value of the defined benefit obligation as it is unlikely that the change in assumptions would occur in isolation of one another as some of the assumptions may be correlated. December 31 2019 2018 The expected contributions to the plan for the next year $ 10,954 $ 14,925 The average duration of the defined benefit obligation 6.6-11.5 years 7-12.5 years
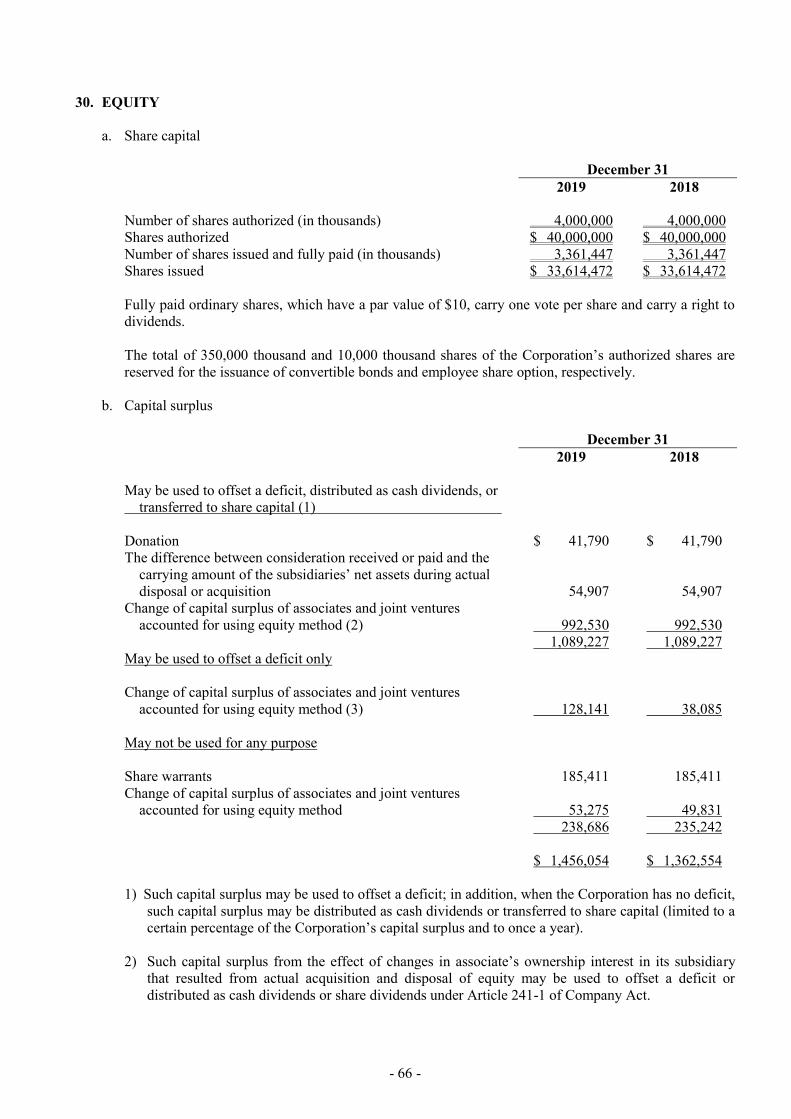
- 66 -
30. EQUITY a. Share capital
December 31 2019 2018 Number of shares authorized (in thousands) 4,000,000 4,000,000 Shares authorized $ 40,000,000 $ 40,000,000 Number of shares issued and fully paid (in thousands) 3,361,447 3,361,447 Shares issued $ 33,614,472 $ 33,614,472 Fully paid ordinary shares, which have a par value of $10, carry one vote per share and carry a right to dividends. The total of 350,000 thousand and 10,000 thousand shares of the Corporation’s authorized shares are reserved for the issuance of convertible bonds and employee share option, respectively.
b. Capital surplus December 31 2019 2018 May be used to offset a deficit, distributed as cash dividends, or transferred to share capital (1) Donation $ 41,790 $ 41,790 The difference between consideration received or paid and the
carrying amount of the subsidiaries’ net assets during actual disposal or acquisition 54,907 54,907
Change of capital surplus of associates and joint ventures accounted for using equity method (2) 992,530 992,530
1,089,227 1,089,227 May be used to offset a deficit only Change of capital surplus of associates and joint ventures
accounted for using equity method (3) 128,141 38,085 May not be used for any purpose Share warrants 185,411 185,411 Change of capital surplus of associates and joint ventures
accounted for using equity method 53,275 49,831 238,686 235,242 $ 1,456,054 $ 1,362,554 1) Such capital surplus may be used to offset a deficit; in addition, when the Corporation has no deficit,
such capital surplus may be distributed as cash dividends or transferred to share capital (limited to a certain percentage of the Corporation’s capital surplus and to once a year).
2) Such capital surplus from the effect of changes in associate’s ownership interest in its subsidiary
that resulted from actual acquisition and disposal of equity may be used to offset a deficit or distributed as cash dividends or share dividends under Article 241-1 of Company Act.

- 67 -
3) Such capital surplus from the effect of changes in associate’s ownership interest in its subsidiary that resulted from equity transactions other than actual acquisition and disposal may be used to offset a deficit under Article 239-1 of Company Act.
c. Retained earnings and dividends policy
Under the dividend policy, where the Corporation has a profit at the end of a fiscal year, the Corporation shall first pay business income taxes based on law and then offset losses of previous years, and if there is any remaining profit, 10% of the balance shall be appropriated as legal reserve. In addition, appropriation for special reserve shall be made based on provisions of law. Any remaining amount of profit together with the accumulated undistributed earnings of the previous year shall be allocated for distribution to shareholders. However, depending on the condition of the business, part of the profit may be retained. In case of an increase in the capital of the Corporation, the shareholders’ bonus for the new shares in the year of issue shall be decided in the shareholders’ meeting. For the policies on distribution of employees’ compensation and remuneration of directors, refer to employees’ compensation and remuneration of directors in Note 32 (f). The distribution of shareholders’ dividend shall take into consideration the changes in the outlook of the Corporation’s businesses, the lifespan of the various products or services that have an impact on future capital needs and taxation. Shareholders’ dividend shall be distributed with the aim of maintaining stable shareholders’ dividend distributions. Save for the purposes of improving the financial structure, reinvestments, production expansion or other capital expenditures in which capital is required, when distributing shareholders’ dividend, the dividend payout ratio each fiscal year shall be no less than 50% of the final surplus which is the sum of after-tax profit of the fiscal year to withhold previous loss, if any, legal reserve and special reserve as required by law; the cash dividend shall not be less than 10% of the total shareholders’ dividend distributed in the same year. These appropriations shall be resolved by the shareholders in the following year and given effect to in the financial statements of that year. The legal reserve may be used to offset deficits. If the Corporation has no deficit and the legal reserve has exceeded 25% of the Corporation’s paid-in capital, the excess may be transferred to capital or distributed in cash. The Corporation is required to appropriate to or reverse from special reserve amounts that pertains to items referred to under Rule No. 1010012865, Rule No. 1010047490 and Rule No. 1030006415 issued by the FSC and the directive titled “Questions and Answers for Special Reserves Appropriated Following Adoption of IFRSs”. The appropriation of earnings and dividends per share for 2018 and 2017 were approved in the shareholders’ meetings on June 24, 2019 and June 26, 2018, respectively, were as follows: Appropriation of Earnings For the Year Ended December 31 2018 2017 Legal reserve $ 1,111,709 $ 546,900 Special reserve $ 518,281 $ 943,188 Cash dividends $ 9,412,052 $ 4,033,737 Cash dividends per share (NT$) $ 2.8 $ 1.2

- 68 -
The appropriation of earnings for 2019 had been proposed by the Corporation’s board of directors on March 25, 2020. The proposed appropriation of earnings and dividend per share were as follows:
For the Year Ended
December 31, 2019
Legal reserve $ 1,745,967 Special reserve $ 804,347 Cash dividends $ 10,084,341 Cash dividends per share (NT$) $ 3.0 Assuming that the shares reciprocally held by associates were not treated as treasury shares and not deducted from weighted average number of shares outstanding, the basic EPS would be NT$5.19 for the year ended December 31, 2019. The appropriations of earnings for 2019 are subject to the resolution of the shareholders’ meeting to be held on June 23, 2020.
d. Special reserve recognized at the date of transition In the first-time adoption of IFRSs, the amounts of adjusted unrealized revaluation increments, cumulative translation adjustments and unappropriated earnings recognized from the investment properties of associates which used fair value as deemed cost were $10,715,430 thousand, $3,163,258 thousand and $52,494 thousand, respectively; the Corporation appropriated the amounts to special reserve. In addition, on the initial application of the fair value model to investment properties, the Corporation appropriated to special reserve the amount of the net increase in fair value of investment properties and transferred it to retained earnings. Additional special reserve should be appropriated for subsequent net increases in fair value. The amount appropriated may be reversed to the extent that the cumulative net increases in fair value decrease or on the disposal of investment properties. The Group and its associates used and disposed of some of the related assets; accordingly, special reserve reversed to unappropriated earnings amounted to $548,152 thousand as of December 31, 2019.
e. Other equity items
1) Exchange differences on translating the financial statements of foreign operations
For the Year Ended December 31 2019 2018 Balance at January 1 $ (2,641,364) $ (2,638,153) Exchange differences on translating the financial statements
of foreign operations (1,818,030) (627,348) Share of exchange difference of associates and joint ventures
accounted for using equity method (1,453,807) 624,137 Balance at December 31 $ (5,913,201) $ (2,641,364)

- 69 -
2) Unrealized gain (loss) on financial assets at FVTOCI
For the Year Ended December 31 2019 2018 Balance at January 1 $ 5,268,916 $ 516,962 Unrealized gain - equity instruments 1,190,260 926,188
Related income tax - (219,554) Share from associates and joint ventures accounted for using equity method
Equity instruments 1,502,271 634,103 Debt instruments 26,587 2,520
Cumulative unrealized loss of equity instruments transferred to retained earnings due to disposal (79,711) 3,408,697
Balance at December 31 $ 7,908,323 $ 5,268,916
3) Cash flow hedges
For the Year Ended December 31 2019 2018 Balance at January 1 $ 60,934 $ 58,485 Cash flow hedges - (2,434) Share from associates and joint ventures accounted for using
equity method (8,793) 4,883 Balance at December 31 $ 52,141 $ 60,934
4) Gains on property revaluation
For the Year Ended December 31 2019 2018 Balance at January 1 $ 307,728 $ 307,728 Share from associates and joint ventures accounted for using
equity method 77,486 - Balance at December 31 $ 385,214 $ 307,728
f. Non-controlling interests
For the Year Ended December 31 2019 2018 Balance at January 1 $ 21,156,120 $ 18,365,609 Effect of retrospective application (4) - Balance at January 1, 2019 as restated 21,156,116 18,365,609 Attributable to non-controlling interests:
Share of profit for the year 4,784,280 3,772,103 Other comprehensive income (loss) during the year
Exchange difference on translating the financial statements of foreign operations (817,599) (267,413)
Unrealized gain on financial assets at FVTOCI 3,032 1,497 Related income tax - (526)
(Continued)

- 70 -
For the Year Ended December 31 2019 2018
Remeasurement on defined benefit plans $ 736 $ (309) Related income tax (118) 3
Share of other comprehensive income of associates and joint ventures accounted for using equity method 3,782 8,662
Share of other changes in equity of associates and joint ventures accounted for using equity method (29) (2)
Cash dividends from subsidiaries (1,748,520) (723,504) Balance at December 31 $ 23,381,680 $ 21,156,120
(Concluded) 31. OPERATING REVENUE
a. Revenue from contracts with customers
For the Year Ended December 31
2019 2018 Operating revenue
Sales of goods $ 79,348,234 $ 73,071,313 Electric power revenue 6,385,664 5,905,306 Transportation revenue 1,751,490 1,803,059 Rental revenue 1,110,758 1,142,218 Engineering revenue 183,836 286,691 Income from investments
Sale of investments 5,969,730 3,135,587 Cost of investments sold 5,651,384 2,883,728 Gain on sale of investments, net 318,346 251,859 Dividends 310,015 335,416
Total income from investments 628,361 587,275 Less: Sales returns and discounts 60,706 54,858
Total operating revenue, net $ 89,347,637 $ 82,741,004
b. Contract balances
For the Year Ended December 31 2019 2018 Contract assets $ 68,412 $ 147,528 Contract liabilities $ 987,496 $ 731,015 The changes in the balance of contract assets and contract liabilities primarily result from the timing difference between the Group’s performance and the respective customer’s payment
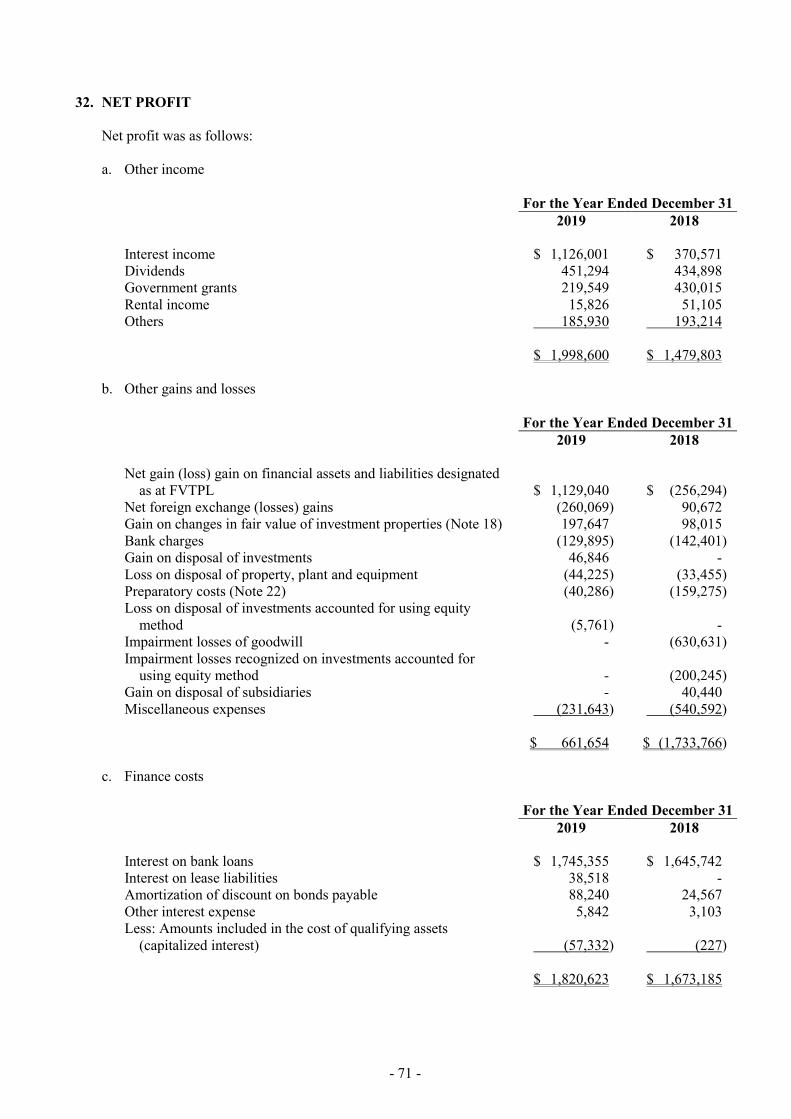
- 71 -
32. NET PROFIT Net profit was as follows: a. Other income
For the Year Ended December 31 2019 2018 Interest income $ 1,126,001 $ 370,571 Dividends 451,294 434,898 Government grants 219,549 430,015 Rental income 15,826 51,105 Others 185,930 193,214 $ 1,998,600 $ 1,479,803
b. Other gains and losses
For the Year Ended December 31 2019 2018 Net gain (loss) gain on financial assets and liabilities designated
as at FVTPL $ 1,129,040 $ (256,294) Net foreign exchange (losses) gains (260,069) 90,672 Gain on changes in fair value of investment properties (Note 18) 197,647 98,015 Bank charges (129,895) (142,401) Gain on disposal of investments 46,846 - Loss on disposal of property, plant and equipment (44,225) (33,455) Preparatory costs (Note 22) (40,286) (159,275) Loss on disposal of investments accounted for using equity
method (5,761) - Impairment losses of goodwill - (630,631) Impairment losses recognized on investments accounted for
using equity method - (200,245) Gain on disposal of subsidiaries - 40,440 Miscellaneous expenses (231,643) (540,592) $ 661,654 $ (1,733,766)
c. Finance costs For the Year Ended December 31 2019 2018 Interest on bank loans $ 1,745,355 $ 1,645,742 Interest on lease liabilities 38,518 - Amortization of discount on bonds payable 88,240 24,567 Other interest expense 5,842 3,103 Less: Amounts included in the cost of qualifying assets
(capitalized interest) (57,332) (227) $ 1,820,623 $ 1,673,185
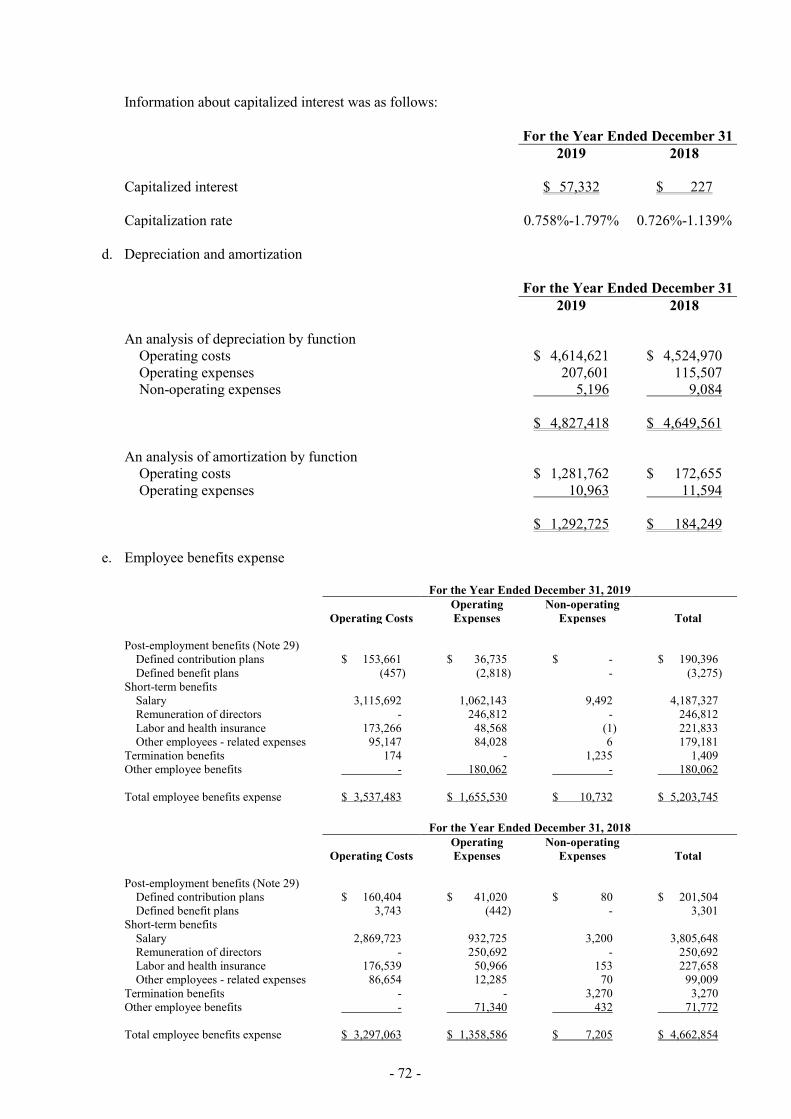
- 72 -
Information about capitalized interest was as follows: For the Year Ended December 31 2019 2018 Capitalized interest $ 57,332 $ 227 Capitalization rate 0.758%-1.797% 0.726%-1.139%
d. Depreciation and amortization
For the Year Ended December 31 2019 2018 An analysis of depreciation by function
Operating costs $ 4,614,621 $ 4,524,970 Operating expenses 207,601 115,507 Non-operating expenses 5,196 9,084
$ 4,827,418 $ 4,649,561 An analysis of amortization by function
Operating costs $ 1,281,762 $ 172,655 Operating expenses 10,963 11,594
$ 1,292,725 $ 184,249
e. Employee benefits expense
For the Year Ended December 31, 2019
Operating Costs Operating Expenses
Non-operating Expenses Total
Post-employment benefits (Note 29)
Defined contribution plans $ 153,661 $ 36,735 $ - $ 190,396 Defined benefit plans (457) (2,818) - (3,275)
Short-term benefits Salary 3,115,692 1,062,143 9,492 4,187,327 Remuneration of directors - 246,812 - 246,812 Labor and health insurance 173,266 48,568 (1) 221,833 Other employees - related expenses 95,147 84,028 6 179,181
Termination benefits 174 - 1,235 1,409 Other employee benefits - 180,062 - 180,062 Total employee benefits expense $ 3,537,483 $ 1,655,530 $ 10,732 $ 5,203,745 For the Year Ended December 31, 2018
Operating Costs Operating Expenses
Non-operating Expenses Total
Post-employment benefits (Note 29)
Defined contribution plans $ 160,404 $ 41,020 $ 80 $ 201,504 Defined benefit plans 3,743 (442) - 3,301
Short-term benefits Salary 2,869,723 932,725 3,200 3,805,648 Remuneration of directors - 250,692 - 250,692 Labor and health insurance 176,539 50,966 153 227,658 Other employees - related expenses 86,654 12,285 70 99,009
Termination benefits - - 3,270 3,270 Other employee benefits - 71,340 432 71,772 Total employee benefits expense $ 3,297,063 $ 1,358,586 $ 7,205 $ 4,662,854
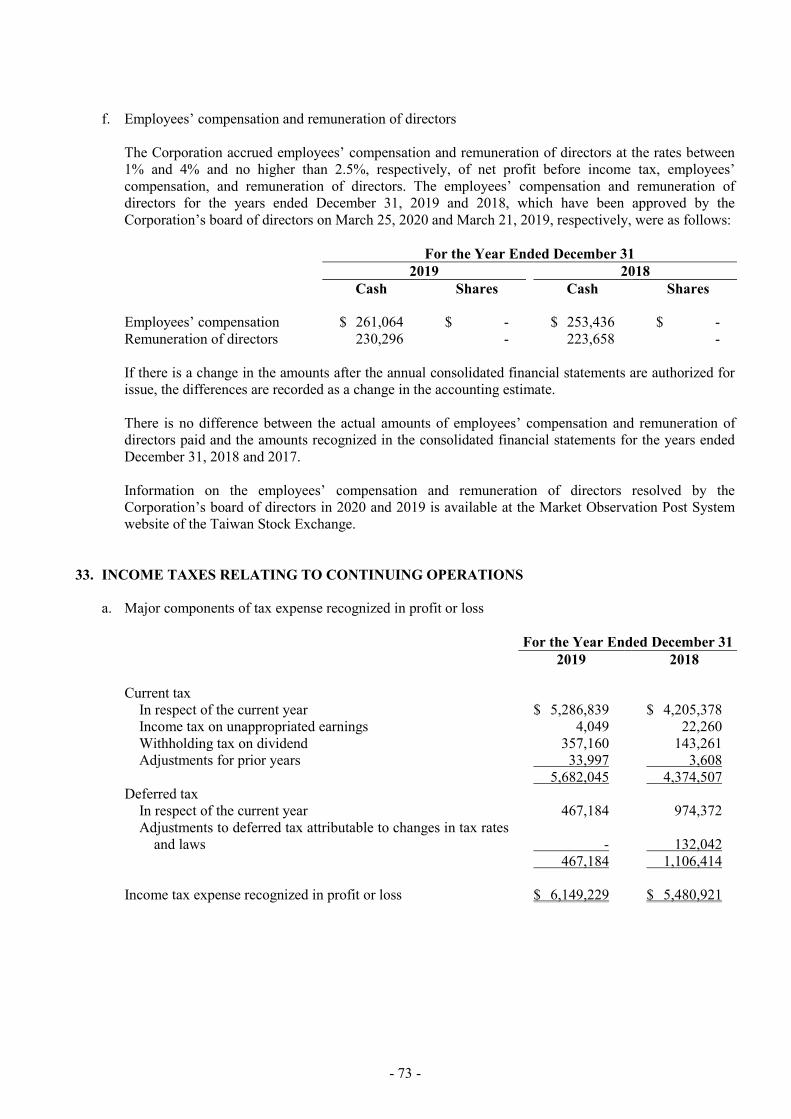
- 73 -
f. Employees’ compensation and remuneration of directors
The Corporation accrued employees’ compensation and remuneration of directors at the rates between 1% and 4% and no higher than 2.5%, respectively, of net profit before income tax, employees’ compensation, and remuneration of directors. The employees’ compensation and remuneration of directors for the years ended December 31, 2019 and 2018, which have been approved by the Corporation’s board of directors on March 25, 2020 and March 21, 2019, respectively, were as follows: For the Year Ended December 31 2019 2018 Cash Shares Cash Shares Employees’ compensation $ 261,064 $ - $ 253,436 $ - Remuneration of directors 230,296 - 223,658 - If there is a change in the amounts after the annual consolidated financial statements are authorized for issue, the differences are recorded as a change in the accounting estimate. There is no difference between the actual amounts of employees’ compensation and remuneration of directors paid and the amounts recognized in the consolidated financial statements for the years ended December 31, 2018 and 2017. Information on the employees’ compensation and remuneration of directors resolved by the Corporation’s board of directors in 2020 and 2019 is available at the Market Observation Post System website of the Taiwan Stock Exchange.
33. INCOME TAXES RELATING TO CONTINUING OPERATIONS
a. Major components of tax expense recognized in profit or loss
For the Year Ended December 31 2019 2018 Current tax
In respect of the current year $ 5,286,839 $ 4,205,378 Income tax on unappropriated earnings 4,049 22,260 Withholding tax on dividend 357,160 143,261 Adjustments for prior years 33,997 3,608
5,682,045 4,374,507 Deferred tax
In respect of the current year 467,184 974,372 Adjustments to deferred tax attributable to changes in tax rates
and laws - 132,042 467,184 1,106,414 Income tax expense recognized in profit or loss $ 6,149,229 $ 5,480,921
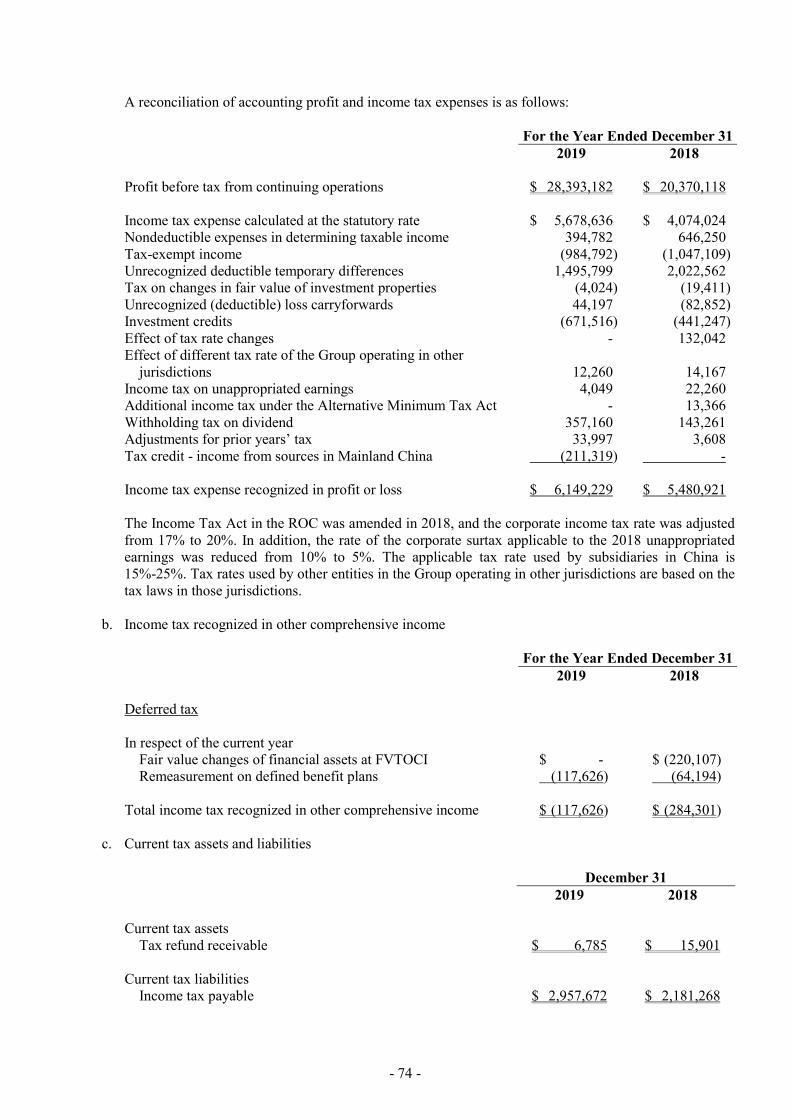
- 74 -
A reconciliation of accounting profit and income tax expenses is as follows: For the Year Ended December 31 2019 2018 Profit before tax from continuing operations $ 28,393,182 $ 20,370,118 Income tax expense calculated at the statutory rate $ 5,678,636 $ 4,074,024 Nondeductible expenses in determining taxable income 394,782 646,250 Tax-exempt income (984,792) (1,047,109) Unrecognized deductible temporary differences 1,495,799 2,022,562 Tax on changes in fair value of investment properties (4,024) (19,411) Unrecognized (deductible) loss carryforwards 44,197 (82,852) Investment credits (671,516) (441,247) Effect of tax rate changes - 132,042 Effect of different tax rate of the Group operating in other
jurisdictions 12,260 14,167 Income tax on unappropriated earnings 4,049 22,260 Additional income tax under the Alternative Minimum Tax Act - 13,366 Withholding tax on dividend 357,160 143,261 Adjustments for prior years’ tax 33,997 3,608 Tax credit - income from sources in Mainland China (211,319) - Income tax expense recognized in profit or loss $ 6,149,229 $ 5,480,921 The Income Tax Act in the ROC was amended in 2018, and the corporate income tax rate was adjusted from 17% to 20%. In addition, the rate of the corporate surtax applicable to the 2018 unappropriated earnings was reduced from 10% to 5%. The applicable tax rate used by subsidiaries in China is 15%-25%. Tax rates used by other entities in the Group operating in other jurisdictions are based on the tax laws in those jurisdictions.
b. Income tax recognized in other comprehensive income
For the Year Ended December 31 2019 2018 Deferred tax In respect of the current year
Fair value changes of financial assets at FVTOCI $ - $ (220,107) Remeasurement on defined benefit plans (117,626) (64,194)
Total income tax recognized in other comprehensive income $ (117,626) $ (284,301) c. Current tax assets and liabilities
December 31 2019 2018 Current tax assets
Tax refund receivable $ 6,785 $ 15,901 Current tax liabilities
Income tax payable $ 2,957,672 $ 2,181,268

- 75 -
d. Deferred tax assets and liabilities The movements of deferred tax assets and deferred tax liabilities were as follows: For the year ended December 31, 2019
Opening Balance
Recognized in Profit or Loss
Recognized in Other
Comprehensive Income
Exchange Differences Closing Balance
Deferred tax assets Temporary differences
Allowance for impairment loss $ 203,417 $ 58,283 $ - $ (10,605) $ 251,095
Defined benefit obligation 25,341 - 182 (7) 25,516 Other financial assets and
liabilities 8,943 3,804 - - 12,747 Investment properties 4,173 1,534 - (243) 5,464 Property, plant and
equipment 3,940 235 - 30 4,205 Others 127,364 (23,081) - (4,163) 100,120
373,178 40,775 182 (14,988) 399,147 Tax losses 63,060 12,853 - (131) 75,782 $ 436,238 $ 53,628 $ 182 $ (15,119) $ 474,929 Deferred tax liabilities Temporary differences
Land value increment tax $ 3,449,871 $ - $ - $ - $ 3,449,871 Investment properties 3,089,623 (2,490) - - 3,087,133 Unappropriated earnings
of subsidiaries and associates 1,763,029 541,424 - (10,330) 2,294,123
Finance leases 616,363 (17,337) - - 599,026 Defined benefit obligation 338,363 9,762 117,808 - 465,933 Associates 61,168 (3,219) - (2,297) 55,652 Property, plant and
equipment 32,877 6,807 - - 39,684 Unrealized foreign
exchange gain 11,372 (11,372) - - - Allowance for impairment
loss 296 (296) - - - Others 2,467 (2,467) - - - $ 9,365,429 $ 520,812 $ 117,808 $ (12,627) $ 9,991,422
For the year ended December 31, 2018
Opening Balance
Recognized in Profit or Loss
Recognized in Other
Comprehensive Income
Exchange Differences Closing Balance
Deferred tax assets Temporary differences
Allowance for impairment loss $ 167,788 $ 39,199 $ - $ (3,570) $ 203,417
Defined benefit obligation 23,027 - 2,314 - 25,341 Other financial assets and
liabilities - 8,943 - - 8,943 (Continued)

- 76 -
Opening Balance
Recognized in Profit or Loss
Recognized in Other
Comprehensive Income
Exchange Differences Closing Balance
Investment properties $ 4,124 $ 112 $ - $ (63) $ 4,173 Property, plant and
equipment 21,526 (17,647) - 61 3,940 FVTOCI financial assets 220,113 - (220,113) - - Others 75,217 53,746 - (1,599) 127,364
511,795 84,353 (217,799) (5,171) 373,178 Tax losses 52,390 10,839 - (169) 63,060 $ 564,185 $ 95,192 $ (217,799) $ (5,340) $ 436,238 Deferred tax liabilities Temporary differences
Land value increment tax $ 3,449,871 $ - $ - $ - $ 3,449,871 Investment properties 3,109,538 (19,915) - - 3,089,623 Unappropriated earnings
of subsidiaries 654,553 1,110,236 - (1,760) 1,763,029 Finance leases 547,736 68,627 - - 616,363 Defined benefit obligation 245,265 26,596 66,502 - 338,363 Associates 65,639 (3,390) - (1,081 ) 61,168 Property, plant and
equipment 22,033 10,844 - - 32,877 Other financial assets and
liabilities 4,671 6,701 - - 11,372 Allowance for impairment
loss 84 212 - - 296 Others 772 1,695 - - 2,467 $ 8,100,162 $ 1,201,606 $ 66,502 $ (2,841) $ 9,365,429
(Concluded) e. Unused loss carryforwards for which no deferred tax assets have been recognized in the consolidated
balance sheets
December 31 2019 2018 Loss carryforwards
Expire in 2018 $ - $ 1,635 Expire in 2019 - 561,999 Expire in 2020 65 - Expire in 2021 222,751 222,721 Expire in 2022 247,214 247,162 Expire in 2023 27,810 27,752 Expire in 2024 58,219 58,219 Expire in 2025 299,401 299,401 Expire in 2026 - 156,574 Expire in 2027 - 23,022 Expire in 2029 4,312 - No expiration 7,522 -
$ 867,294 $ 1,598,485

- 77 -
f. Information about unused loss carryforwards Loss carryforwards as of December 31, 2019 comprised the following: Unused Amount Expiry Year $ 65 2020 222,751 2021 247,214 2022 27,810 2023 58,219 2024 299,401 2025 229,335 2029 188,566 No expiration $ 1,273,361
g. The aggregate amount of temporary differences associated with investments for which deferred tax
liabilities have not been recognized As of December 31, 2019 and 2018, the taxable temporary differences associated with investments in subsidiaries for which no deferred tax liabilities have been recognized were $5,750,255 thousand and $5,104,939 thousand, respectively.
h. The latest years of income tax returns which had been examined and cleared by the tax authorities were as follows:
Company Year
The Corporation 2017 DCI 2017 YTRMC 2017 YSRMC 2017 FMT 2017 AEE 2017 AIC 2017 FDT 2017 YLPPC 2017 FSMS 2017 NHC 2017 CHP 2017 YLSS 2017 YLT 2017
34. EARNINGS PER SHARE
Unit: NT$ Per Share
For the Year Ended December 31 2019 2018 Basic earnings per share $ 5.56 $ 3.54 Diluted earnings per share $ 5.25 $ 3.49

- 78 -
The earnings and weighted average number of ordinary shares outstanding used for the earnings per share computation were as follows: Net Profit for the Year For the Year Ended December 31 2019 2018 Profit for the period attributable to owners of the Corporation $ 17,459,673 $ 11,117,094 Effect of potentially dilutive ordinary shares:
Convertible bonds (55,373) 26,638 Earnings used in the computation of diluted earnings per share $ 17,404,300 $ 11,143,732 Weighted average number of ordinary shares outstanding (in thousand shares): For the Year Ended December 31 2019 2018 Weighted average number of ordinary shares in computation of basic
earnings per share 3,138,664 3,139,152 Effect of potentially dilutive ordinary shares:
Employees’ compensation 6,888 8,585 Convertible bonds 166,769 44,656
Weighted average number of ordinary shares used in the computation of diluted earnings per share 3,312,321 3,192,393
The weighted average number of ordinary shares used in the computation of basic earnings per share is the weighted average outstanding shares after subtracting the shares of the Corporation held by the associates treated as treasury shares. When an entity pays employee compensation that may be settled in shares or cash at the entity’s option, the entity shall presume that the employee compensation will be settled in shares, and the resulting potential shares shall be included in diluted earnings per share if the effect is dilutive. The number of shares is estimated by dividing the entire amount of the compensation by the closing price of the shares at the balance sheet date. Such dilutive effect of the potential shares is included in the computation of diluted earnings per share until the number of shares to be distributed to employees is resolved in the following year.
35. CAPITAL MANAGEMENT The Group manages its capital to ensure that entities in the Group will be able to continue as going concerns while maximizing the return to shareholders through the optimization of the debt and equity balance. The capital structure of the Group consists of net debt (borrowings offset by cash and cash equivalents) and equity of the Group (comprising issued capital, reserves, retained earnings and other equity). The Group is not subject to any externally imposed capital requirements. Key management personnel of the Group review the capital structure on an annual basis. As part of this review, the key management personnel consider the cost of capital and the risks associated with each class of capital. Based on recommendations of the key management personnel, in order to balance the overall capital structure, the Group may adjust the amount of dividends paid to shareholders and the amount of new debt issued or existing debt redeemed.
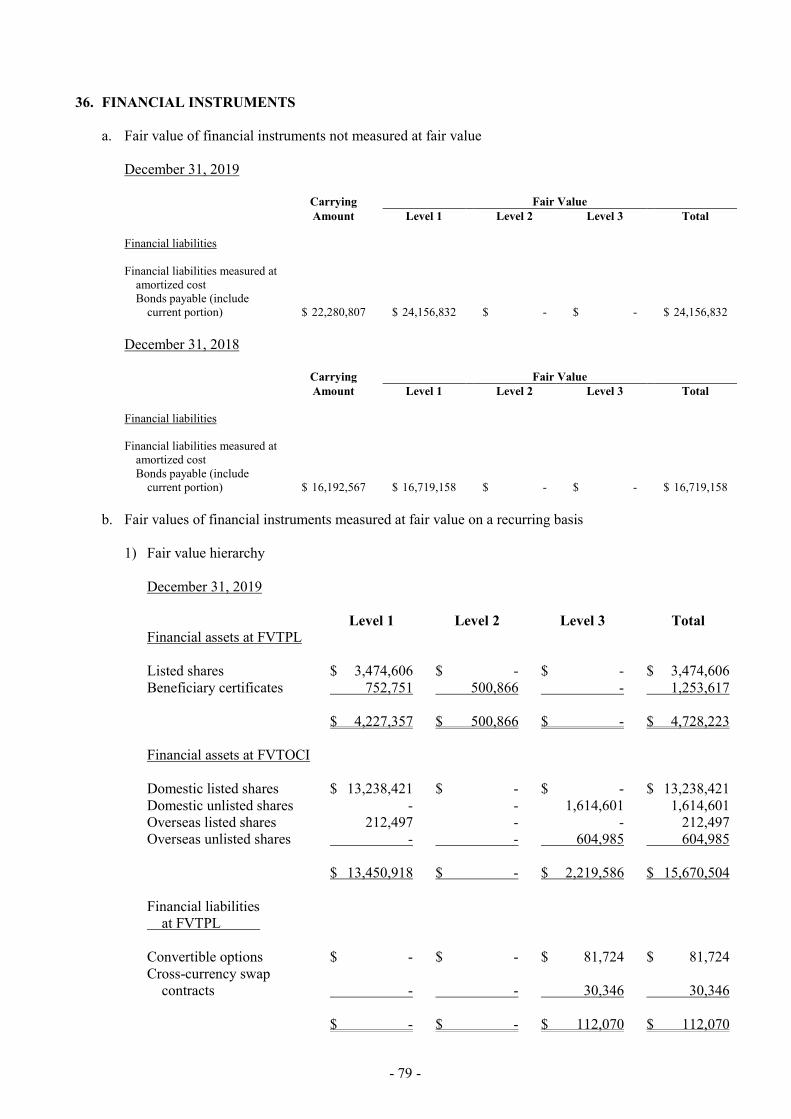
- 79 -
36. FINANCIAL INSTRUMENTS a. Fair value of financial instruments not measured at fair value
December 31, 2019 Carrying Fair Value Amount Level 1 Level 2 Level 3 Total Financial liabilities Financial liabilities measured at
amortized cost Bonds payable (include
current portion) $ 22,280,807 $ 24,156,832 $ - $ - $ 24,156,832 December 31, 2018 Carrying Fair Value Amount Level 1 Level 2 Level 3 Total Financial liabilities Financial liabilities measured at
amortized cost Bonds payable (include
current portion) $ 16,192,567 $ 16,719,158 $ - $ - $ 16,719,158 b. Fair values of financial instruments measured at fair value on a recurring basis
1) Fair value hierarchy
December 31, 2019 Level 1 Level 2 Level 3 Total Financial assets at FVTPL Listed shares $ 3,474,606 $ - $ - $ 3,474,606 Beneficiary certificates 752,751 500,866 - 1,253,617
$ 4,227,357 $ 500,866 $ - $ 4,728,223
Financial assets at FVTOCI Domestic listed shares $ 13,238,421 $ - $ - $ 13,238,421 Domestic unlisted shares - - 1,614,601 1,614,601 Overseas listed shares 212,497 - - 212,497 Overseas unlisted shares - - 604,985 604,985
$ 13,450,918 $ - $ 2,219,586 $ 15,670,504
Financial liabilities at FVTPL Convertible options $ - $ - $ 81,724 $ 81,724 Cross-currency swap
contracts - - 30,346 30,346
$ - $ - $ 112,070 $ 112,070

- 80 -
December 31, 2018 Level 1 Level 2 Level 3 Total Financial assets at FVTPL Listed shares $ 3,502,988 $ - $ - $ 3,502,988 Beneficiary certificates 1,390,765 4,152,830 - 5,543,595
$ 4,893,753 $ 4,152,830 $ - $ 9,046,583
Financial assets at FVTOCI Domestic listed shares $ 11,774,012 $ - $ - $ 11,774,012 Domestic unlisted shares - - 1,537,291 1,537,291 Overseas listed shares 152,337 - - 152,337 Overseas unlisted shares - - 122,026 122,026
$ 11,926,349 $ - $ 1,659,317 $ 13,585,666
Financial liabilities at FVTPL Convertible options $ - $ - $ 223,501 $ 223,501 Cross-currency swap
contracts - - 44,717 44,717
$ - $ - $ 268,218 $ 268,218
There were no transfers between Levels 1 and 2 for the years ended December 31, 2019 and 2018.
2) Reconciliation of Level 3 fair value measurements of financial instruments
Financial
Liabilities at Financial Assets
at FVTOCI FVTPL Equity Derivatives Instruments
Balance at January 1, 2019 $ (268,218) $ 1,659,317 Recognized in profit or loss
Net gain (loss) on financial liabilities at FVTPL 156,148 - Recognized in other comprehensive income
Unrealized gain (loss) on financial assets at FVTOCI - (173,946) Exchange differences on translation of foreign financial
statements - 1 Purchases - 118,055 Settlements - (113) Transfers into Level 3 - 616,272 Balance at December 31, 2019 $ (112,070) $ 2,219,586

- 81 -
Financial
Liabilities at Financial Assets
at FVTOCI FVTPL Equity Derivatives Instruments
Balance at January 1, 2018 $ - $ 10,090,195 Recognized in profit or loss
Net gain (loss) on financial liabilities at FVTPL (47,303) - Recognized in other comprehensive income
Unrealized gain (loss) on financial assets at FVTOCI - 1,361,674 Purchases (220,915) - Transfers out of Level 3 - (9,792,552) Balance at December 31, 2018 $ (268,218) $ 1,659,317
3) Valuation techniques and inputs applied for Level 2 fair value measurement
Financial Instruments Valuation Techniques and Inputs Mutual funds The Group uses net asset value as the basis to determine the fair value as
the Group has determined that the net asset value of the mutual fund represents fair value at the end of the reporting period.
4) Valuation techniques and inputs applied for Level 3 fair value measurement
a) The fair values of convertible bond options are determined using the information available from the counterparty for valuation based on the option pricing model. The option pricing model incorporates the present value techniques and reflects both the time value and the intrinsic value of options.
b) The fair value of cross currency swap contracts is determined using the information available
from the counterparty for valuation. The counterparty measures the fair value of a cross currency swap contracts using the discounted cash flows model. Future cash flows are estimated based on observable forward exchange rates at balance sheet dates and contract forward rates and discounted at rates that reflect the credit risk of various counterparties.
c) The fair value of equity securities suspended for trading and therefore without quoted price was
determined by using the weighted average of values calculated under market-based approach. In market-based approach, the fair value of the investee is measured by weighted average multiple value of (i) EV/sales, (ii) EV/EBITDA, and (iii) P/B of other comparable listed companies. Liquidity risk parameters need to be taken into account when using this approach. i. EV/Sales: Enterprise value ÷ Sales. ii. EV/EBITDA: Enterprise value ÷ Earnings before interest, taxes, depreciation and
amortization. iii. P/B: Price ÷ Book value.
d) The fair values of unlisted shares are determined by using the asset approach or the market
approach. In the asset approach, the fair values are estimated by using the net asset value measured at fair value based on the unlisted investees’ latest financial statements, while taking into account the liquidity discount and non-controlling interest discount. In the market approach, the fair values are estimated based on the market transaction prices of comparable companies with similar industrial and business characteristics and liquidity discount are considered.
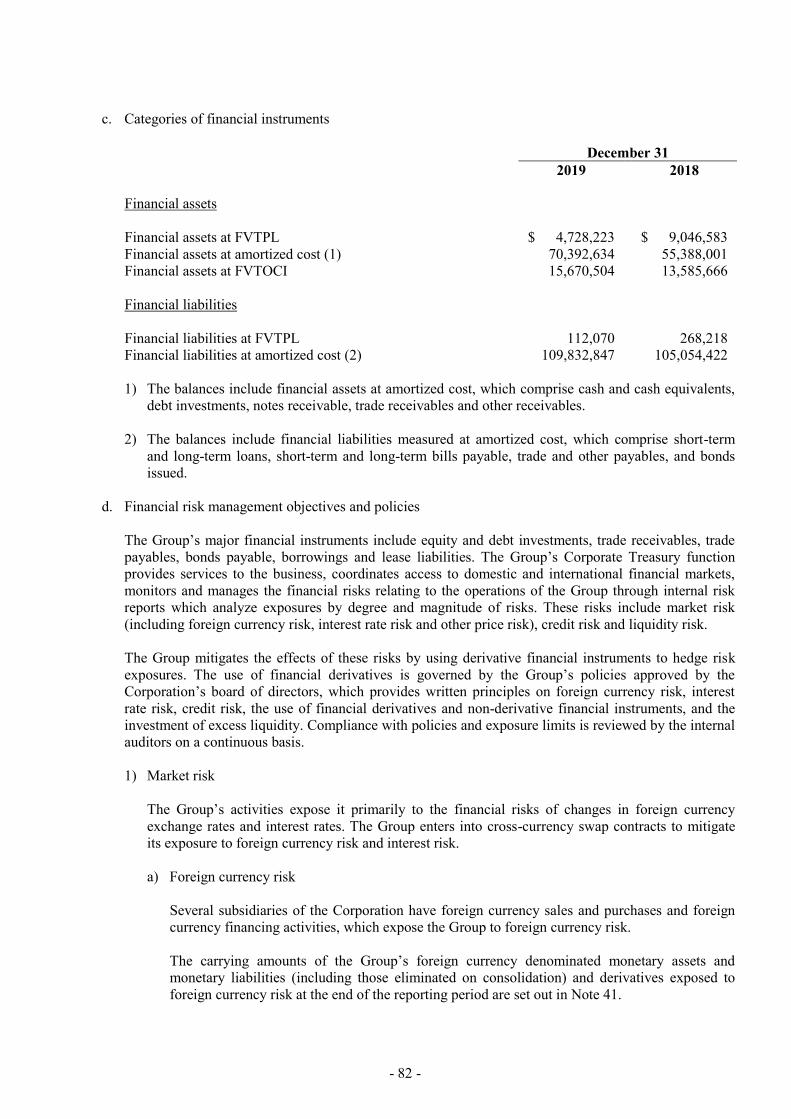
- 82 -
c. Categories of financial instruments
December 31 2019 2018 Financial assets Financial assets at FVTPL $ 4,728,223 $ 9,046,583 Financial assets at amortized cost (1) 70,392,634 55,388,001 Financial assets at FVTOCI 15,670,504 13,585,666 Financial liabilities Financial liabilities at FVTPL 112,070 268,218 Financial liabilities at amortized cost (2) 109,832,847 105,054,422 1) The balances include financial assets at amortized cost, which comprise cash and cash equivalents,
debt investments, notes receivable, trade receivables and other receivables. 2) The balances include financial liabilities measured at amortized cost, which comprise short-term
and long-term loans, short-term and long-term bills payable, trade and other payables, and bonds issued.
d. Financial risk management objectives and policies
The Group’s major financial instruments include equity and debt investments, trade receivables, trade payables, bonds payable, borrowings and lease liabilities. The Group’s Corporate Treasury function provides services to the business, coordinates access to domestic and international financial markets, monitors and manages the financial risks relating to the operations of the Group through internal risk reports which analyze exposures by degree and magnitude of risks. These risks include market risk (including foreign currency risk, interest rate risk and other price risk), credit risk and liquidity risk. The Group mitigates the effects of these risks by using derivative financial instruments to hedge risk exposures. The use of financial derivatives is governed by the Group’s policies approved by the Corporation’s board of directors, which provides written principles on foreign currency risk, interest rate risk, credit risk, the use of financial derivatives and non-derivative financial instruments, and the investment of excess liquidity. Compliance with policies and exposure limits is reviewed by the internal auditors on a continuous basis. 1) Market risk
The Group’s activities expose it primarily to the financial risks of changes in foreign currency exchange rates and interest rates. The Group enters into cross-currency swap contracts to mitigate its exposure to foreign currency risk and interest risk. a) Foreign currency risk
Several subsidiaries of the Corporation have foreign currency sales and purchases and foreign currency financing activities, which expose the Group to foreign currency risk. The carrying amounts of the Group’s foreign currency denominated monetary assets and monetary liabilities (including those eliminated on consolidation) and derivatives exposed to foreign currency risk at the end of the reporting period are set out in Note 41.

- 83 -
Sensitivity analysis The Group was mainly exposed to the RMB and USD. The following table details the Group’s sensitivity to a 5% increase and decrease in the functional currency against the relevant foreign currencies. The sensitivity rate of 5% is used when reporting foreign currency risk internally to key management personnel and represents management’s assessment of the reasonably possible change in foreign exchange rates. The sensitivity analysis included only outstanding foreign currency denominated monetary items less notional amounts of cross-currency swap. The analysis assumed a 5% change in foreign currency rates at the end of the reporting period. A positive number below indicates an increase in pre-tax profit assuming the New Taiwan dollars weakened by 5% against the relevant currency. For a 5% strengthening of New Taiwan dollars against the relevant currency, there would be an equal and opposite impact on pre-tax profit and the balances shown below would be negative. RMB Impact USD Impact
For the Year Ended
December 31 For the Year Ended
December 31 2019 2018 2019 2018 Increase (decrease) in
pre-tax profit $ 46,002 $ 69,060 $ 709,830 $ 145,181 b) Interest rate risk
The Group is exposed to interest rate risk because entities in the Group borrows funds at both fixed and floating interest rates. The risk is managed by the Group by maintaining an appropriate mix of fixed and floating rate borrowings and using cross currency swap contracts. The carrying amounts of the Group’s financial assets and financial liabilities with exposure to changes in interest rates at the end of the reporting period were as follows: December 31 2019 2018 Fair value interest rate risk
Financial assets $ 27,512,074 $ 17,727,715 Financial liabilities 71,427,610 45,872,001
Cash flow interest rate risk Financial assets 19,745,430 12,084,642 Financial liabilities 26,024,771 50,569,182
Sensitivity analysis The sensitivity analysis below is based on the Group’s exposure to changes in interest rates of non-derivative instruments at the end of the reporting period. If interest rates had been 0.01% higher/lower and all other variables were held constant, the Group’s pre-tax profit for the years ended December 31, 2019 and 2018 would have decreased/increased by $2,238 thousand and $3,698 thousand, respectively, mainly due to the Group’s exposure to changes in interest rates of its variable-rate bank borrowings and bank deposits.

- 84 -
c) Other price risk The Group is exposed to price risk through its investments in listed equity securities, corporate bonds and beneficiary certificates of funds. Sensitivity analysis The sensitivity analysis below is based on the exposure to investment position price risks at the end of the reporting period. If investment position prices had been 1% higher/lower, pre-tax profit for the years ended December 31, 2019 and 2018 would have increased/decreased by $47,282 thousand and $90,466 thousand, respectively, as a result of the changes in fair value of financial assets at fair value through profit or loss, and the pre-tax other comprehensive income for the years ended December 31, 2019 and 2018 would have increased/decreased by $134,509 thousand and $119,263 thousand, respectively, as a result of the changes in fair value of financial assets at fair value through other comprehensive income.
2) Credit risk Credit risk refers to the risk that counterparty will default on its contractual obligations resulting in financial loss to the Group. As at the end of the reporting period, the Group’s maximum exposure to credit risk which would cause a financial loss to the Group due to the failure of counterparties to discharge an obligation and financial guarantees provided by the Group is equal to the carrying amount of the financial assets as stated in the balance sheets. The Group adopted a policy of only dealing with creditworthy counterparties and obtaining sufficient collateral, where appropriate, as a means of mitigating the risk of financial loss from defaults. The Group only transacts with entities that are rated the equivalent of investment grade and above. The Group uses publicly available financial information and its own trading records to rate its major customers. The Group’s exposure and the credit ratings of its counterparties are continuously monitored. The counterparties in trade receivables consist of a large number of clients in different industries and regions. The Group evaluates clients’ financial condition continuously. Credit risk represents the potential negative impact on the financial assets of the Group if counterparties or third parties breach the contracts. The Group evaluates credit risk exposure on contracts with positive carrying value. The Group evaluated the credit risk exposure as immaterial because all counterparties are reputable financial institutions and companies with good credit ratings.
3) Liquidity risk
The Group manages liquidity risk by monitoring and maintaining a level of cash and cash equivalents deemed adequate to finance the Group’s operations and mitigate the effects of fluctuations in cash flows. In addition, management monitors the utilization of bank borrowings and ensures compliance with loan covenants. a) Liquidity and interest rate tables for non-derivative financial liabilities
The following tables detail the Group’s remaining contractual maturity for its non-derivative financial liabilities with agreed repayment periods. The tables had been drawn up based on the undiscounted cash flows of financial liabilities from the earliest date on which the Group can be required to pay. The tables included both interest and principal cash flows.

- 85 -
December 31, 2019
On Demand or Less than 1 Month 1-3 Months
3 Months to 1 Year 1-5 Years 5+ Years
Non-derivative financial liabilities Non-interest bearing $ 4,071,572 $ 6,763,068 $ 2,249,956 $ 662,325 $ 88,917 Lease liabilities 19,520 39,041 175,682 659,828 1,091,089 Variable interest rate liabilities 4,170,000 3,402,589 1,701,775 14,372,866 2,377,541 Fixed interest rate liabilities 5,110,435 38,322,937 3,187,476 23,351,390 - $ 13,371,527 $ 48,527,635 $ 7,314,889 $ 39,046,409 $ 3,557,547 Additional information about the maturity analysis for lease liabilities:
Less than 1
Year 1-5 Years 5-10 Years 10-15 Years 15-20 Years 20+ Years Lease liabilities $ 234,243 $ 659,828 $ 372,944 $ 207,887 $ 162,230 $ 348,028 December 31, 2018
On Demand or Less than 1 Month 1-3 Months
3 Months to 1 Year 1-5 Years 5+ Years
Non-derivative financial liabilities Non-interest bearing $ 4,323,700 $ 2,662,290 $ 866,745 $ 690,195 $ 70,309 Variable interest rate liabilities 6,735,000 6,725,614 8,508,552 28,600,016 - Fixed interest rate liabilities 17,746,801 6,213,450 4,725,303 17,186,447 - $ 28,805,501 $ 15,601,354 $ 14,100,600 $ 46,476,658 $ 70,309 The amounts above of variable interest rate non-derivative financial assets and liabilities are subject to change if actual variable interest rates differ from those estimates of interest rates at the end of the reporting period.
b) Liquidity and interest rate tables for derivative financial liabilities
The following table details the Group’s liquidity analysis of its derivative financial instruments. The table is based on the undiscounted contractual net cash inflows and outflows on derivative instruments that settle on a net basis. When the amount payable or receivable is not fixed, the amount disclosed is determined by reference to the projected interest rates as illustrated by the yield curves at the end of the reporting period. December 31, 2019
On Demand or Less than
1 Month 1-3 Months 3 Months to
1 Year 1-5 Years 5+ Years Net settled Cross-currency swap
contracts $ - $ (44,872) $ (135,109) $ (135,109) $
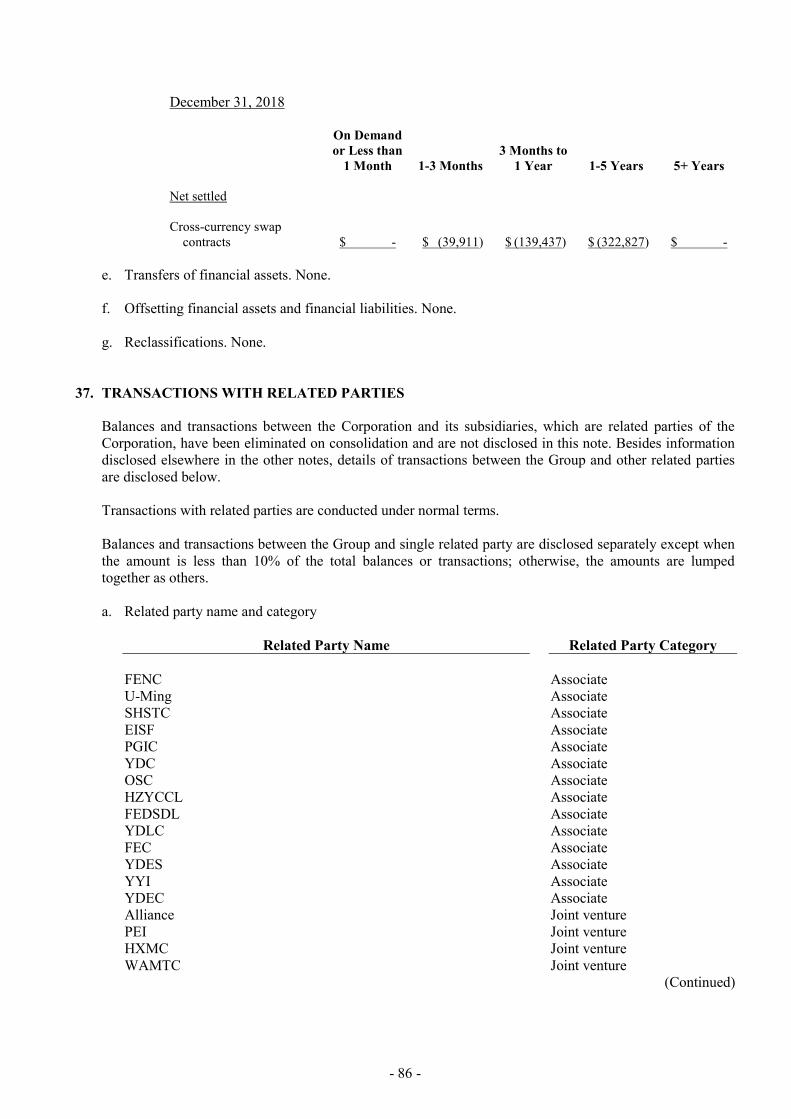
- 86 -
December 31, 2018
On Demand or Less than
1 Month 1-3 Months 3 Months to
1 Year 1-5 Years 5+ Years Net settled Cross-currency swap
contracts $ - $ (39,911) $ (139,437) $ (322,827) $ - e. Transfers of financial assets. None. f. Offsetting financial assets and financial liabilities. None. g. Reclassifications. None.
37. TRANSACTIONS WITH RELATED PARTIES
Balances and transactions between the Corporation and its subsidiaries, which are related parties of the Corporation, have been eliminated on consolidation and are not disclosed in this note. Besides information disclosed elsewhere in the other notes, details of transactions between the Group and other related parties are disclosed below. Transactions with related parties are conducted under normal terms. Balances and transactions between the Group and single related party are disclosed separately except when the amount is less than 10% of the total balances or transactions; otherwise, the amounts are lumped together as others. a. Related party name and category
Related Party Name Related Party Category
FENC Associate U-Ming Associate SHSTC Associate EISF Associate PGIC Associate YDC Associate OSC Associate HZYCCL Associate FEDSDL Associate YDLC Associate FEC Associate YDES Associate YYI Associate YDEC Associate Alliance Joint venture PEI Joint venture HXMC Joint venture WAMTC Joint venture
(Continued)

- 87 -
Related Party Name Related Party Category
Malaysia Garment Manufacturers Private Limited Other U-Ming Transport (Singapore) Private Limited Other CHC Resources Corporation Other Far Eastern Department Store Ltd. Other Chu Chiang Enterprise Corp. Ltd. Other Chu Feng Other Air Liquide Far Eastern Co. Other Oriental Petrochemical (Taiwan) Corporation Other Far Eastern Memorial Hospital Other Ya Tung Department Store Ltd. Other Yuan Ze University Other Oriental Resources Development Co., Ltd. Other Far Eastern Leasing Corporation Other Ho Hwei Enterprise Corp. Ltd. Other Far Eastern Apparel Co., Ltd. Other Oriental Union Chemical Corp. Other NanKung Enterprise Ltd. Other New Century InfoComm Tech Co., Ltd. Other Ding & Ding Management Consultants Co., Ltd. Other Far Eastern Fibertech Co., Ltd. Other Far Eastern Technical Consultants Co., Ltd. Other Far Eastern International Bank (FEIB) Other FENCC Other Far Eastern New Apparel (Vietnam) Ltd. Other Far Eastern Polytex (Vietnam) Ltd. Other FERD Other Far Eastern General Construction Inc. Other Far EasTone Telecommunications Co., Ltd. Other Far Eastern Property Insurance Agency Co., Ltd. Other Far Eastern International Leasing Corporation Other Lien Fang Enterprise Corp. Ltd. Other Chubei New Century Shopping Mall Co., Ltd. Other Far Eastern Electronic Toll Collection Co., Ltd. Other Mr. Xu Yuanzhi Memorial Foundation Other YDT Technology International Corporation Other J-Power Investment Netherlands Other Pan Asia Engineers & Constructors Corp. Other
(Concluded) Note: Other related party relationships mainly include associates’ subsidiaries, legal person in which
the chairman is the same as the Corporation’s chairman and the director is also the Corporation’s chairman.

- 88 -
b. Operating Transactions
For the Year Ended December 31 2019 2018 Operating revenue
Associates $ 702,196 $ 694,540 Others 1,723,085 1,766,679 Joint ventures 649,054 497,486 $ 3,074,335 $ 2,958,705
Operating cost
Associates $ 612,418 $ 601,236 Others 851,858 907,989 Joint ventures 784,217 653,781 $ 2,248,493 $ 2,163,006
Receivables from related parties (including notes receivable, trade receivables, other receivables and contract assets): December 31 2019 2018 Associates $ 127,197 $ 120,926 Others
FENCC - 1,929,748 Others 569,063 1,243,535 569,063 3,173,283
Joint ventures 182,808 268,741 $ 879,068 $ 3,562,950 Accounts payable and accrued expenses to related parties: December 31 2019 2018 Associates $ 114,231 $ 98,574 Others 95,151 83,694 Joint ventures 47,421 68,588 $ 256,803 $ 250,856 The outstanding trade payables and receivables from related parties are unsecured. For the years ended December 31, 2019 and 2018, no impairment losses were recognized for trade receivables from related parties.

- 89 -
Prepayments: December 31 2019 2018 Associates $ 15,000 $ 15,000 Others 834 77 Joint ventures 83,592 - $ 99,426 $ 15,077
c. Transactions with FEIB
December 31 2019 2018 Bank deposits (Note) $ 5,137,217 $ 3,361,915 Bank loans $ 1,400,000 $ 2,106,000 Cross-currency swap contracts $ (1,415) $ 2,358) As of December 31, 2019 and 2018, the notional principal of the above outstanding cross-currency swap contracts were both US$15,000 thousands. Note: The balances included amounts recognized as financial assets measured at amortized cost, and
other non-current assets (refundable deposits). d. Compensation of key management personnel
The amounts of the compensation of directors and other key management personnel for the years ended December 31, 2019 and 2018 were as follows:
For the Year Ended December 31 2019 2018 Short-term employee benefits $ 307,050 $ 282,998 Post-employment benefits 864 756 $ 307,914 $ 283,754 The remuneration of directors and key executives is determined by the remuneration committee based on the performance of individuals and market trends.
e. Other transactions with related parties
1) Operating expense - rental
For the Year Ended December 31 2019 2018 Associates $ 48,480 $ 50,433 Others 11,707 19,073 $ 60,187 $ 69,506

- 90 -
2) Acquisitions of property, plant and equipment
For the Year Ended December 31 2019 2018 Others $ - $ 34
3) Acquisitions of investment properties
For the Year Ended December 31 2019 2018 Others $ - $ 337
4) Lease agreement
Right-of-use Assets For the Year Ended December 31 2019 2018 Others $ 154,800 $ -
Lease Liabilities For the Year Ended December 31 2019 2018 Others $ 140,015 $ -
5) The nature of the Group’s transaction with OFSPC is acquisition or disposal of OPAS Fund
Segregated Portfolio’s overseas fund through OFSPC’s platform. The portfolio’s decision is made and managed by the investment committee which is composed of the Group and other investors. The Group’s investment activities through OFSPC’s platform for the years ended December 31, 2019 and 2018 included acquisition of $885,727 thousand and $4,065,473 thousand, respectively. For the year ended December 31, 2019, disposal and gain on disposal were $5,553,672 thousand and $263,631 thousand, respectively.
6) The Corporation’s subsidiary, DCI, subscribed shares of Catalyst Tranche Three for $123,960
thousand in 2019 and subscribed shares of Catalyst Tranche One for $123,120 thousand in 2018.
38. ASSETS PLEDGED AS COLLATERAL The following assets are provided as collaterals for short-term and long-term bank borrowings or for purchases from suppliers. December 31 2019 2018 Investment properties $ 13,855,572 $ 13,840,249 Investments accounted for using equity method 13,299,701 13,374,748 Property, plant and equipment 2,393,116 2,830,624 Financial assets at fair value through other comprehensive income 1,543,666 1,241,250 Financial assets at amortized cost 419,742 169,139 $ 31,511,797 $ 31,456,010

- 91 -
39. SIGNIFICANT CONTINGENT LIABILITIES AND UNRECOGNIZED COMMITMENTS
As of December 31, 2019, the Corporation and its subsidiaries had the following significant commitments and contingencies: a. Unused letters of credit of US$9,796 thousand and EUR9,177 thousand. b. Guarantee notes issued for related parties:
The Corporation
December 31,
2019 AIC $ 12,195,800 DCI 9,848,950 NHC 1,509,020 YTRMC 1,000,000 YLPPC 497,642 AEE 329,930 YSRMC 150,000 FSMS 30,000 $ 25,561,342 YLSS
YLSS $ 100,000 DCI
FSMS $ 50,000 YTRMC
AOC $ 14,965 AOG
AOC $ 14,965 c. CHP entered into agreements on the following transactions:
1) Purchase of natural gas from Chinese Petroleum Corporation. 2) Power Plant (base load unit) Purchase and Sale Contract, Power Plant (medium-load unit) Purchase
and Sale Contract and Electricity Purchase and Sale Contract for Gas Recirculation with Taiwan Power Company.
3) Contractual Service Agreement with General Electric Global Services GmbH. 4) Contract of Engineering, Procurement and Construction with General Electric Global Services
GmbH. and GE Global Parts & Products, GmbH. d. The estimated payments for construction of plants and acquisition of land use rights and equipment of
JYDC, SIYDCCL, and SLCL in the future amount to RMB36,138 thousand.

- 92 -
e. YSRMC supplied ready-mixed concrete to Da Cin Construction Co., Ltd. (“Da Cin”) during 2003. The owner of the project under construction demanded Da Cin to take responsibility to repair the construction flaws. Da Cin requested YSRMC to compensate the loss and damage on the construction. However, they did not reach an agreement from year 2006 to 2009. Da Cin filed an appeal and requested YSRMC to indemnify $22,881 thousand in April 2010. In July 2014, the local court concluded that YSRMC has to pay indemnity in the amount of $17,642 thousand. In years 2010 and 2014, YSRMC had estimated related compensation loss, accounted for as provisions, of $13,800 thousand and $3,840 thousand, respectively. YSRMC had also filed an appeal against the court’s decision in October 2014. Later, Da Cin requested additional compensation of $137,544 thousand in the second instance and the total damage compensation claimed was $160,425 thousand together with the amount in the first instance. As of the date the financial statements were authorized for issue, the case is in the process of examination by the Supreme Court so YSRMC cannot make reasonable estimate about the judgment. YSRMC did not recognize additional compensation loss up to the auditors’ report date.
f. On March 13, 2013, the No. 1114 Commissioners’ Meeting of Fair Trade Commission resolved that
independent power producers violated Article 14, Paragraph 1 of Fair Trade Act due to the rejection of power purchase rate adjustment with TPC and fined CHP $400,000 thousand. Accordingly, CHP recognized penalty expenses, which is included in other losses in the consolidated financial statements for the year ended December 31, 2013. The penalty is payable in 60 monthly installments and covered by a long-term note payable. CHP had filed an appeal on April 17, 2013. On September 12, 2013, the Petitions and Appeals Committee of the Executive Yuan rescinded the imposition of penalty (the “Penalty Disposition”) and advised the Fair Trade Commission to impose more appropriate disposition with refund of penalty paid by CHP. However, CHP’s appeal against the imposition of illegal concerted action among independent power producers (the “Act Disposition”) was dismissed. Regarding the Penalty Disposition, the Fair Trade Commission resolved a penalty of $370,000 thousand on November 13, 2013. CHP thus adjusted the penalty expenses in other gains and losses for the year ended December 31, 2013. The disposition was revoked again by the Petitions and Appeals Committee on May 9, 2014. Then the Fair Trade Commission imposed a penalty of $364,000 thousand on July 9, 2014. CHP recognized a reversal gain of $6,000 thousand in other income for the year ended December 31, 2014 and issued a long-term note payable in 60 installments for the penalty in accordance with the disposition. In addition, CHP also filed an appeal to defend its interest on August 11, 2014. On December 11, 2014, Letter from the Petitions and Appeals Committee indicates that the filing of appeal against the Penalty Disposition is suspended until the administrative court makes the final judgment on the Act Disposition. Regarding the Act Disposition, on November 7, 2013, CHP filed an administrative litigation at the Taipei High Administrative Court against the dispositions of the Fair Trade Commission. The Taipei High Administrative Court entered a final judgment in favor of CHP on October 29, 2014. Nevertheless, the Fair Trade Commission filed an appeal with the Supreme Administrative Court. The Supreme Administrative Court dismissed the judgment made by the Taipei High Administrative Court on July 2, 2015. The Taipei High Administrative Court remanded the judgement on May 25, 2017 and still revoked the administrative disciplinary action and the judgement of the appeal. The Fair Trade Commission filed an appeal with the Supreme Administrative Court and the Taipei High Administrative Court filed an appeal to the Supreme Administrative Court on September 27, 2018. This case is currently heard by the Taipei High Administrative Court.
- 93 -
g. On March 15, 2013, Letter No. 102035 from the Fair Trade Commission indicated concerted action among CHP and other independent power producers due to the rejection of power purchase rate adjustment with TPC. Accordingly, in August 2015, TPC filed at the Taipei District Court a civil mediation which requests CHP to compensate $2.35 billion plus interest from November 1, 2007 to the settlement date for the damage caused. Later, in September 2015, TPC filed at the Taipei District Court a civil litigation appeal which requests CHP to compensate $2.349 billion plus interest from November 1, 2007 to the settlement date as well as an apology published in major newspapers. TPC also filed at the Taipei High Administrative Court an administrative litigation which requests CHP to compensate the damage caused which amounted to $1.4 billion plus interest from November 1, 2007 to the settlement date with a 5% annual interest rate. CHP and TPC did not reach an agreement in the civil mediation council meeting held on October 7, 2015. Later, TPC included the damage compensation claimed in the civil mediation in the administrative litigation appeal and the total compensation claimed in the statement of the administrative litigation amounted to $3.75 billion plus interest from November 1, 2007 to the settlement date with a 5% annual interest rate. On November 27, 2015, the administrative court ruled that the litigation proceedings are suspended until the administrative court makes the final judgment on the Act Disposition. However, on July 12, 2016, Taipei High Administrative Court notified that the power purchase and sales contracts between independent power producers and TPC are subject to the performance of obligation under the Civil Code. Therefore, the abovementioned ruling for suspension was revoked and the administrative litigation for compensation would be transferred to the Taipei District Court. TPC filed counter appeal against the ruling; however, the appeal was dismissed by the Supreme Administrative Court on December 30, 2016. This case has been transferred to the Taipei District Court on January 25, 2017 and dismissed by Taipei District Court on April 12, 2019. In light of the civil proceedings, on March 1, 2016, TPC added posterior statement which requests the capital expenditure it paid to CHP from October 9, 2007 to November 30, 2012 according to the power purchase and sales contracts to be recalculated relying on CHP’s capital ratio. Accordingly, CHP would compensate at least $2.349 billion to TPC. The Taipei District Court dismissed the appeal on November 1, 2018, and CHP filed an appeal subsequently. This case is currently heard by the Taiwan High Court. CHP considered the payment of the indemnity is not possible unless TPC can provide proof that the damage was caused by CHP and their appeal is filed within the statute of limitation. As of the date the financial statements were authorized for issue, the amount of the compensation cannot be reasonably estimated. Therefore, CHP could not assess the possible impact on its financial position and did not recognize any contingent liabilities.
h. On December 4, 2015 and December 17, 2015, CSCGL, China Shanshui Cement Group (Hong Kong) Company Limited and China Pioneer Cement (Hong Kong) Company Limited (collectively referred as “Shanshui Cement Group”) commenced legal proceedings against former directors of CSCGL in respect of alleged dishonest breaches of fiduciary duty or alleged conspiracy to injure CSCGL during their tenures. The proceedings arose from disputes between CSCGL’s present and former board of directors over the changes in management and the takeover of the headquarters of CSCGL. On April 7, 2016, the Corporation was added as the 10th defendant. The Corporation engaged lawyers to take legal actions in connection with the unqualified claim to defend its reputation and interests. Up to the date of the auditors’ report, the trial was set to take place from April to June in 2021. The Corporation considered it premature to evaluate at this stage the likely outcome of the proceedings and therefore did not recognize any contingent liabilities.
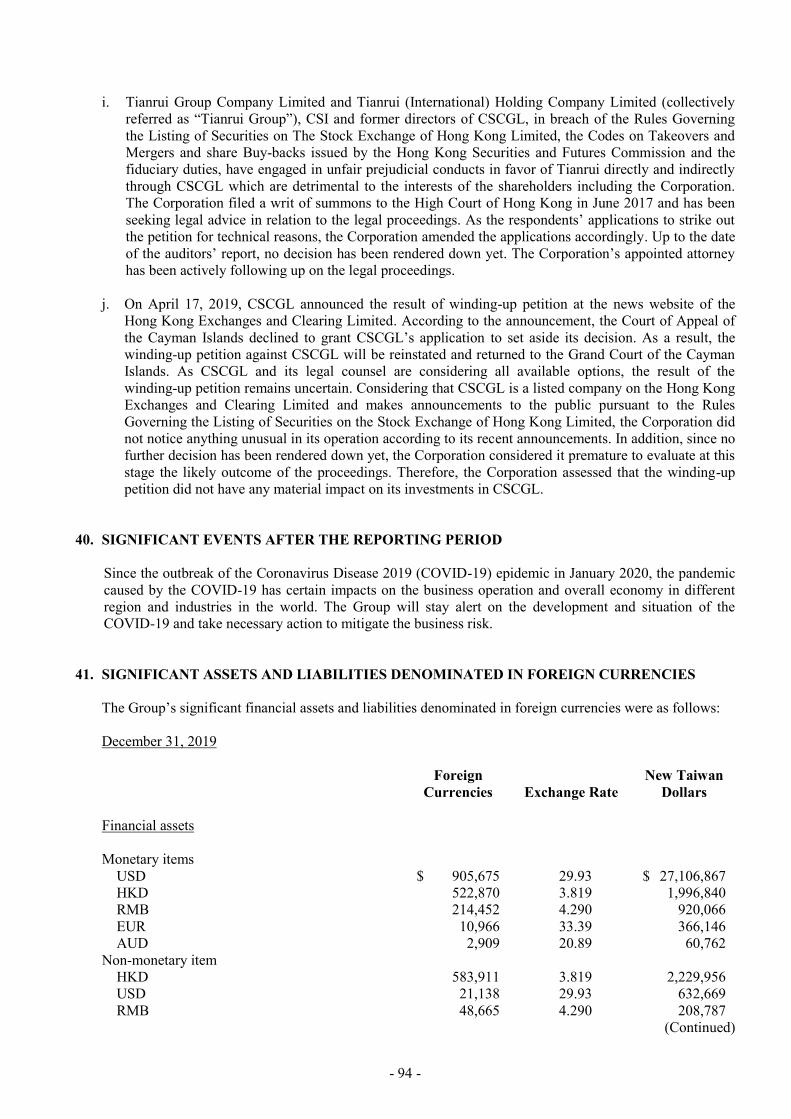
- 94 -
i. Tianrui Group Company Limited and Tianrui (International) Holding Company Limited (collectively referred as “Tianrui Group”), CSI and former directors of CSCGL, in breach of the Rules Governing the Listing of Securities on The Stock Exchange of Hong Kong Limited, the Codes on Takeovers and Mergers and share Buy-backs issued by the Hong Kong Securities and Futures Commission and the fiduciary duties, have engaged in unfair prejudicial conducts in favor of Tianrui directly and indirectly through CSCGL which are detrimental to the interests of the shareholders including the Corporation. The Corporation filed a writ of summons to the High Court of Hong Kong in June 2017 and has been seeking legal advice in relation to the legal proceedings. As the respondents’ applications to strike out the petition for technical reasons, the Corporation amended the applications accordingly. Up to the date of the auditors’ report, no decision has been rendered down yet. The Corporation’s appointed attorney has been actively following up on the legal proceedings.
j. On April 17, 2019, CSCGL announced the result of winding-up petition at the news website of the
Hong Kong Exchanges and Clearing Limited. According to the announcement, the Court of Appeal of the Cayman Islands declined to grant CSCGL’s application to set aside its decision. As a result, the winding-up petition against CSCGL will be reinstated and returned to the Grand Court of the Cayman Islands. As CSCGL and its legal counsel are considering all available options, the result of the winding-up petition remains uncertain. Considering that CSCGL is a listed company on the Hong Kong Exchanges and Clearing Limited and makes announcements to the public pursuant to the Rules Governing the Listing of Securities on the Stock Exchange of Hong Kong Limited, the Corporation did not notice anything unusual in its operation according to its recent announcements. In addition, since no further decision has been rendered down yet, the Corporation considered it premature to evaluate at this stage the likely outcome of the proceedings. Therefore, the Corporation assessed that the winding-up petition did not have any material impact on its investments in CSCGL.
40. SIGNIFICANT EVENTS AFTER THE REPORTING PERIOD
Since the outbreak of the Coronavirus Disease 2019 (COVID-19) epidemic in January 2020, the pandemic caused by the COVID-19 has certain impacts on the business operation and overall economy in different region and industries in the world. The Group will stay alert on the development and situation of the COVID-19 and take necessary action to mitigate the business risk.
41. SIGNIFICANT ASSETS AND LIABILITIES DENOMINATED IN FOREIGN CURRENCIES
The Group’s significant financial assets and liabilities denominated in foreign currencies were as follows: December 31, 2019
Foreign
Currencies Exchange Rate New Taiwan
Dollars Financial assets Monetary items
USD $ 905,675 29.93 $ 27,106,867 HKD 522,870 3.819 1,996,840 RMB 214,452 4.290 920,066 EUR 10,966 33.39 366,146 AUD 2,909 20.89 60,762
Non-monetary item HKD 583,911 3.819 2,229,956 USD 21,138 29.93 632,669 RMB 48,665 4.290 208,787
(Continued)
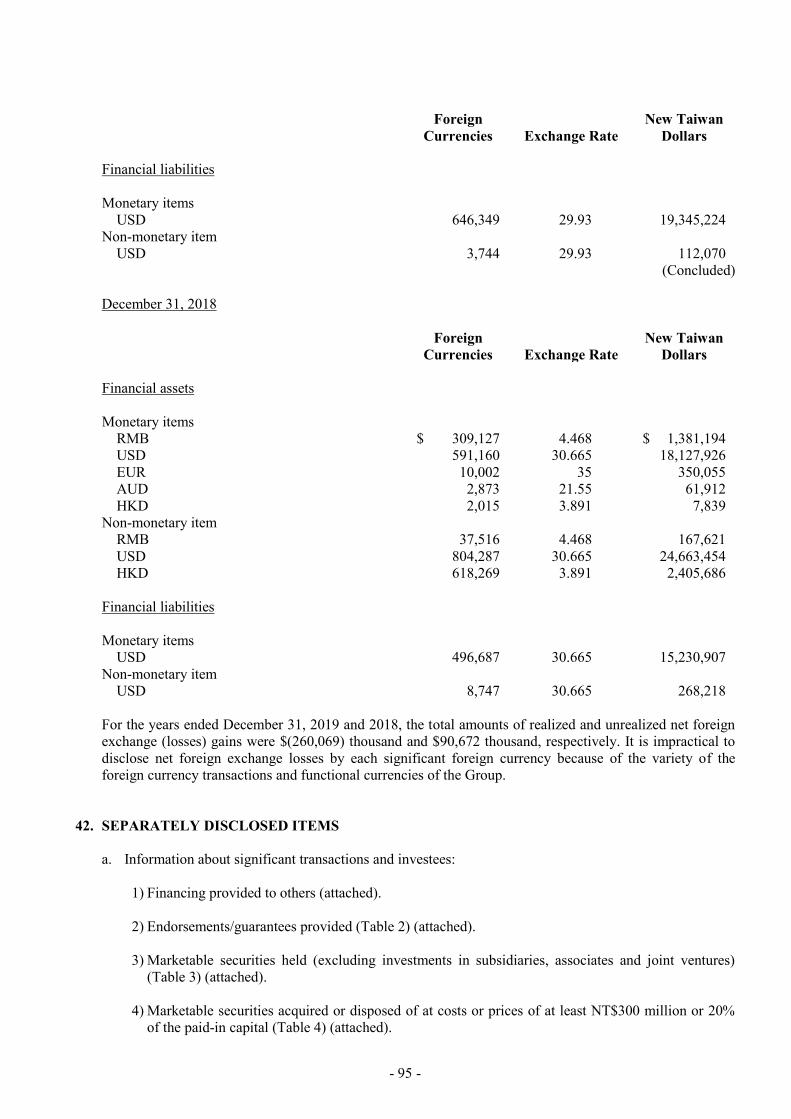
- 95 -
Foreign
Currencies Exchange Rate New Taiwan
Dollars Financial liabilities Monetary items
USD 646,349 29.93 19,345,224 Non-monetary item
USD 3,744 29.93 112,070 (Concluded)
December 31, 2018
Foreign
Currencies Exchange Rate New Taiwan
Dollars Financial assets Monetary items
RMB $ 309,127 4.468 $ 1,381,194 USD 591,160 30.665 18,127,926 EUR 10,002 35 350,055 AUD 2,873 21.55 61,912 HKD 2,015 3.891 7,839
Non-monetary item RMB 37,516 4.468 167,621 USD 804,287 30.665 24,663,454 HKD 618,269 3.891 2,405,686
Financial liabilities Monetary items
USD 496,687 30.665 15,230,907 Non-monetary item
USD 8,747 30.665 268,218 For the years ended December 31, 2019 and 2018, the total amounts of realized and unrealized net foreign exchange (losses) gains were $(260,069) thousand and $90,672 thousand, respectively. It is impractical to disclose net foreign exchange losses by each significant foreign currency because of the variety of the foreign currency transactions and functional currencies of the Group.
42. SEPARATELY DISCLOSED ITEMS
a. Information about significant transactions and investees:
1) Financing provided to others (attached). 2) Endorsements/guarantees provided (Table 2) (attached). 3) Marketable securities held (excluding investments in subsidiaries, associates and joint ventures)
(Table 3) (attached). 4) Marketable securities acquired or disposed of at costs or prices of at least NT$300 million or 20%
of the paid-in capital (Table 4) (attached).

- 96 -
5)Acquisition of individual real estate at costs of at least NT$300 million or 20% of the paid-in capital:
None. 6) Disposal of individual real estate at prices of at least NT$300 million or 20% of the paid-in capital:
None. 7) Total purchases from or sales to related parties amounting to at least NT$100 million or 20% of the
paid-in capital (Table 5) (attached). 8) Receivables from related parties amounting to at least NT$100 million or 20% of the paid-in capital
(Table 6) (attached). 9) Names, locations, and related information of investees on which the Corporation exercises
significant influence (excluding investee companies in Mainland China): Table 7 (attached). 10) Trading in derivative instruments: Note 7.
b. Information on investments in mainland China
1) Information on any investee company in mainland China, showing the name, principal business
activities, paid-in capital, method of investment, inward and outward remittance of funds, ownership percentage, net income of investees, investment income or loss, carrying amount of the investment at the end of the year, repatriations of investment income, and limit on the amount of investment in the mainland China area. (Table 8)
2) Any of the following significant transactions with investee companies in mainland China, either
directly or indirectly through a third party, and their prices, payment terms, and unrealized gains or losses: Table 8. a) The amount and percentage of purchases and the balance and percentage of the related payables
at the end of the year. b) The amount and percentage of sales and the balance and percentage of the related receivables at
the end of the year. c) The amount of property transactions and the amount of the resultant gains or losses. d) The balance of negotiable instrument endorsements or guarantees or pledges of collateral at the
end of the year and the purposes. e) The highest balance, the ending balance, the interest rate range, and total current period interest
with respect to the financing of funds. f) Other transactions that have a material effect on the profit or loss for the year or on the financial
position, such as the rendering or receipt of services.
c. Business relationships and significant intercompany transactions: Table 9 (attached).

- 97 -
43. SEGMENT INFORMATION Information reported to the chief operating decision maker for the purpose of resource allocation and assessment of segment performance focuses on the types of goods or services delivered or provided. The Group’s reportable segments were as follows: Cement, electric power, investment, engineering, transportation, stainless steel and leasing. a. Segment revenue and results
Segment Revenue Segment Profit
For the Year Ended
December 31 For the Year Ended
December 31 2019 2018 2019 2018 Cement $ 73,848,951 $ 67,339,927 $ 19,974,112 $ 15,951,898 Electric power 7,115,116 6,682,384 1,382,268 1,205,596 Investment 628,361 587,275 135,767 253,553 Engineering 183,836 286,691 14,266 55,836 Transportation 1,751,160 1,802,744 268,969 381,152 Stainless steel 5,438,907 5,676,843 84,752 119,963 Leasing 381,306 365,140 203,042 185,112 $ 89,347,637 $ 82,741,004 22,063,176 18,153,110 Non-operating income and
expenses 6,330,006 2,217,008 Profit before income tax $ 28,393,182 $ 20,370,118 Segment revenue reported above represents revenue generated from external customers.
b. Segment assets and liabilities, and other segment information The Group does not report segment assets and liabilities or other segment information to the chief operating decision maker. Therefore, no information is disclosed here.
c. Geographical information The Group operates principally in Taiwan and China. The Groups’ revenue from external customers and information about its non-current assets by geographical location are detailed below.
Revenue from External
Customers Non-current Assets For the Year Ended December 31 December 31 2019 2018 2019 2018 China $ 56,614,196 $ 51,366,180 $ 41,506,113 $ 45,206,253 Taiwan 29,479,025 27,647,571 53,160,799 50,299,590 Others 3,254,416 3,727,253 4,280,703 623,944 $ 89,347,637 $ 82,741,004 $ 98,947,615 $ 96,129,787 Revenue is categorized according to customers’ location. Non-current assets exclude those classified as financial instruments, deferred tax assets and post-employment benefit assets.
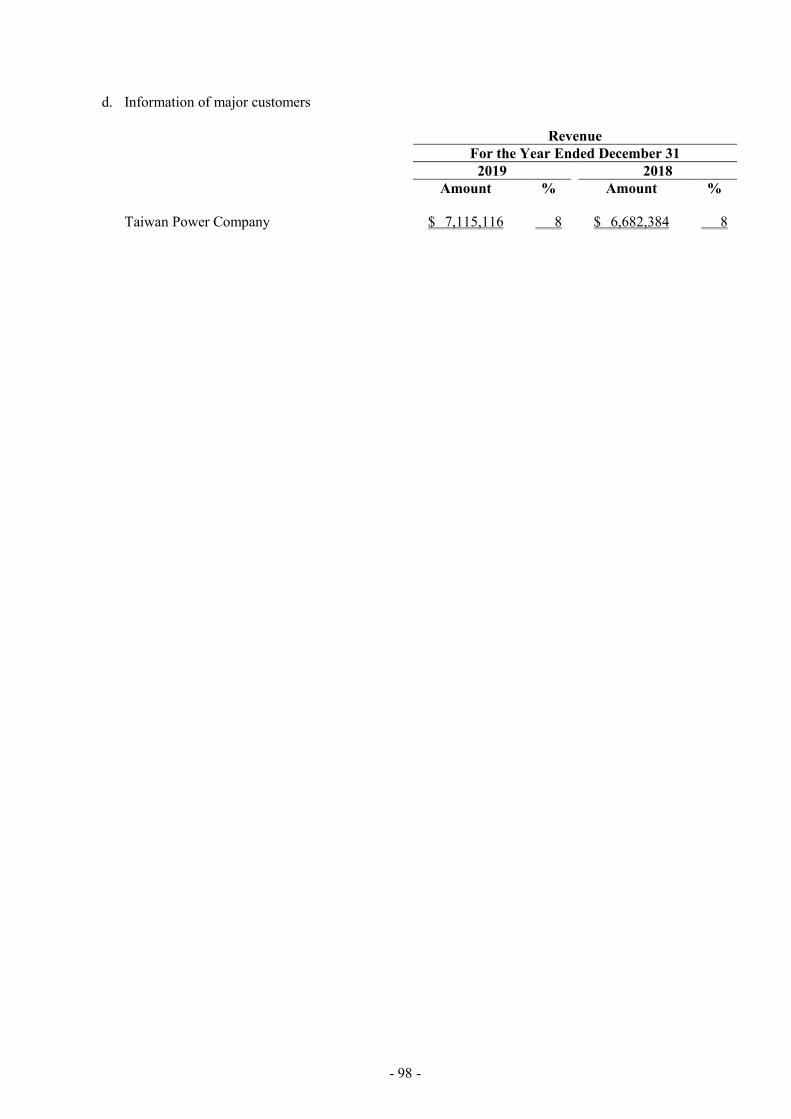
- 98 -
d. Information of major customers
Revenue For the Year Ended December 31 2019 2018 Amount % Amount % Taiwan Power Company $ 7,115,116 8 $ 6,682,384 8

- 99 -
TABLE 1 ASIA CEMENT CORPORATION AND SUBSIDIARIES FINANCING PROVIDED TO OTHERS YEAR ENDED DECEMBER 31, 2019 (In Thousands of New Taiwan Dollars, Unless Stated Otherwise)
No. Lender Borrower Financial Statement Account
Related Parties
Highest Balance for the Period
Ending Balance (Note 2)
Actual Borrowing Amount
Interest Rate (Note 3) Nature of Financing
Business Transaction
Amounts
Reasons for Short-term Financing
Allowance for Impairment Loss
Collateral Financing Limit for Each Borrower
(Note 1)
Aggregate Financing Limits (Note 1) Item Value
1 ACCHC FENCC Other receivables Y RMB431,900
thousand (equivalent to NT$1,852,987 thousand)
$ - $ - - Necessary for short-term financing
$ - Operating capital $ - - $ - 20% of net worth RMB2,852,760 thousand (equivalent to NT$12,239,242 thousand)
50% of net worth RMB7,131,901 thousand (equivalent to NT$30,598,109 thousand)
YDES Other receivables Y RMB230,000 thousand (equivalent to NT$986,773 thousand)
- - - Necessary for short-term financing
- Operating capital - - - Same as above Same as above
2 OIHPL ACCHC Other receivables Y RMB44,000 thousand
(equivalent to NT$188,774 thousand)
RMB44,000 thousand (equivalent to NT$188,774 thousand)
RMB44,000 thousand (equivalent to NT$188,774 thousand)
4.14% Necessary for short-term financing
- Operating capital - - - 20% of net worth RMB2,443,648 thousand (equivalent to NT$10,484,022 thousand)
50% of net worth RMB6,109,120 thousand (equivalent to NT$26,210,055 thousand)
3 OHC SIYDCCL
Other receivables Y RMB200,000
thousand (equivalent to NT$858,063 thousand)
RMB200,000 thousand (equivalent to NT$858,063 thousand)
- - Necessary for short-term financing
- Operating capital - - - 20% of net worth RMB577,182 thousand (equivalent to NT$2,476,293 thousand)
50% of net worth RMB1,442,955 thousand (equivalent to NT$6,190,733 thousand)
SLCL
Other receivables Y RMB350,000 thousand (equivalent to NT$1,501,611 thousand)
RMB350,000 thousand (equivalent to NT$1,501,611 thousand)
RMB190,000 thousand (equivalent to NT$815,160 thousand)
4.09% Necessary for short-term financing
- Operating capital - - - Same as above Same as above
4 JYDC YYDCCL
Other receivables Y RMB160,000
thousand (equivalent to NT$686,451 thousand)
RMB140,000 thousand (equivalent to NT$600,644 thousand)
- - Necessary for short-term financing
- Operating capital - - - 20% of net worth RMB1,202,402 thousand (equivalent to NT$5,158,685 thousand)
50% of net worth RMB3,006,005 thousand (equivalent to NT$12,896,711 thousand)
TZOCCL
Other receivables Y RMB145,000 thousand (equivalent to NT$622,096 thousand)
RMB140,000 thousand (equivalent to NT$600,644 thousand)
RMB70,000 thousand (equivalent to NT$300,322 thousand)
4.09% Necessary for short-term financing
- Operating capital - - - Same as above Same as above
SIYDCCL Other receivables Y RMB100,000 thousand (equivalent to NT$429,032 thousand)
RMB50,000 thousand (equivalent to NT$214,516 thousand)
- - Necessary for short-term financing
- Operating capital - - - Same as above Same as above
SLCL
Other receivables Y RMB400,000 thousand (equivalent to NT$1,716,126 thousand)
RMB200,000 thousand (equivalent to NT$858,063 thousand)
- - Necessary for short-term financing
- Operating capital - - - Same as above Same as above
SLCCL Other receivables Y RMB35,000 thousand (equivalent to NT$150,161 thousand)
- - - Necessary for short-term financing
- Operating capital - - - Same as above Same as above
(Continued)

- 100 -
No. Lender Borrower Financial Statement Account
Related Parties
Highest Balance for the Period
Ending Balance (Note 2)
Actual Borrowing Amount
Interest Rate (Note 3) Nature of Financing
Business Transaction
Amounts
Reasons for Short-term Financing
Allowance for Impairment Loss Collateral
Financing Limit for Each Borrower (Note 1)
Aggregate Financing Limits (Note 1) No.
4 JYDC SHYLCP Other receivables Y RMB100,000
thousand (equivalent to NT$429,032 thousand)
RMB90,000 thousand (equivalent to NT$386,128 thousand)
RMB45,000 thousand (equivalent to NT$193,064 thousand)
4.09% Necessary for short-term financing
$ - Operating capital $ - - $ - 20% of net worth RMB1,202,402 thousand (equivalent to NT$5,158,685 thousand)
50% of net worth RMB3,006,005 thousand (equivalent to NT$12,896,711 thousand)
ACCHC
Other receivables Y RMB700,000 thousand (equivalent to NT$3,003,221 thousand)
RMB700,000 thousand (equivalent to NT$3,003,221 thousand)
RMB700,000 thousand (equivalent to NT$3,003,221 thousand)
2.94% Necessary for short-term financing
- Operating capital - - - Same as above Same as above
5 NYDC
SIYDCCL
Other receivables Y RMB20,000 thousand (equivalent to NT$85,806 thousand)
RMB20,000 thousand (equivalent to NT$85,806 thousand)
- - Necessary for short-term financing
- Operating capital - - - 20% of net worth RMB33,924 thousand (equivalent to NT$145,545 thousand)
50% of net worth RMB84,811 thousand (equivalent to NT$363,866 thousand)
SLCL
Other receivables Y RMB30,000 thousand (equivalent to NT$128,709 thousand)
RMB30,000 thousand (equivalent to NT$128,709 thousand)
- - Necessary for short-term financing
- Operating capital - - - Same as above Same as above
6 HYDCCL WYXC
Other receivables Y RMB60,000 thousand
(equivalent to NT$257,419 thousand)
RMB20,000 thousand (equivalent to NT$85,806 thousand)
- - Necessary for short-term financing
- Operating capital - - - 20% of net worth RMB523,594 thousand (equivalent to NT$2,246,384 thousand)
50% of net worth RMB1,308,985 thousand (equivalent to NT$5,615,959 thousand)
HXMC Other receivables Y RMB40,000 thousand (equivalent to NT$171,613 thousand)
RMB24,500 thousand (equivalent to NT$105,113 thousand)
RMB10,000 thousand (equivalent to NT$42,903 thousand)
4.68% Necessary for short-term financing
- Operating capital - - - Same as above Same as above
WYCPCL Other receivables Y RMB35,000 thousand (equivalent to NT$150,161 thousand)
RMB20,000 thousand (equivalent to NT$85,806 thousand)
- - Necessary for short-term financing
- Operating capital - - - Same as above Same as above
SLCL
Other receivables Y RMB150,000 thousand (equivalent to NT$643,547 thousand)
RMB100,000 thousand (equivalent to NT$429,032 thousand)
- - Necessary for short-term financing
- Operating capital - - - Same as above Same as above
SYCPCL
Other receivables Y RMB50,000 thousand (equivalent to NT$214,516 thousand)
RMB20,000 thousand (equivalent to NT$85,806 thousand)
- - Necessary for short-term financing
- Operating capital - - - Same as above Same as above
SIYDCCL Other receivables Y RMB80,000 thousand (equivalent to NT$343,225 thousand)
- - - Necessary for short-term financing
- Operating capital - - - Same as above Same as above
ACCHC
Other receivables Y RMB400,000 thousand (equivalent to NT$1,716,126 thousand)
RMB400,000 thousand (equivalent to NT$1,716,126 thousand)
RMB400,000 thousand (equivalent to NT$1,716,126 thousand)
2.94% Necessary for short-term financing
- Operating capital - - - Same as above Same as above
7 WYDC
WYXC Other receivables Y RMB70,000 thousand
(equivalent to NT$300,322 thousand)
RMB70,000 thousand (equivalent to NT$300,322 thousand)
- - Necessary for short-term financing
- Operating capital - - - 20% of net worth RMB121,817 thousand (equivalent to NT$522,633 thousand)
50% of net worth RMB304,543 thousand (equivalent to NT$1,306,586 thousand)
WYCPCL
Other receivables Y RMB35,000 thousand (equivalent to NT$150,161 thousand)
RMB25,000 thousand (equivalent to NT$107,258 thousand)
- - Necessary for short-term financing
- Operating capital - - - Same as above Same as above
(Continued)

- 101 -
No. Lender Borrower Financial Statement Account
Related Parties
Highest Balance for the Period
Ending Balance (Note 2)
Actual Borrowing Amount
Interest Rate (Note 3) Nature of Financing
Business Transaction
Amounts
Reasons for Short-term Financing
Allowance for Impairment Loss
Collateral Financing Limit for Each Borrower
(Note 1)
Aggregate Financing Limits (Note 1) Item Value
SYCPCL
Other receivables Y RMB40,000 thousand
(equivalent to NT$171,613 thousand)
RMB40,000 thousand (equivalent to NT$171,613 thousand)
RMB40,000 thousand (equivalent to NT$171,613 thousand)
4.09% Necessary for short-term financing
$ - Operating capital $ - - $ - 20% of net worth RMB121,817 thousand (equivalent to NT$522,633 thousand)
50% of net worth RMB304,543 thousand (equivalent to NT$1,306,586 thousand)
SLCL
Other receivables Y RMB90,000 thousand (equivalent to NT$386,128 thousand)
RMB90,000 thousand (equivalent to NT$386,128 thousand)
- - Necessary for short-term financing
- Operating capital - - - Same as above Same as above
8 CYCPCL
SIYDCCL Other receivables Y RMB12,000 thousand
(equivalent to NT$51,484 thousand)
RMB12,000 thousand (equivalent to NT$51,484 thousand)
- - Necessary for short-term financing
- Operating capital - - - 20% of net worth RMB16,455 thousand (equivalent to NT$70,597 thousand)
50% of net worth RMB41,138 thousand (equivalent to NT$176,495 thousand)
SLCL
Other receivables Y RMB12,000 thousand (equivalent to NT$51,484 thousand)
RMB12,000 thousand (equivalent to NT$51,484 thousand)
- - Necessary for short-term financing
- Operating capital - - - Same as above Same as above
9 HGYDC
SIYDCCL
Other receivables Y RMB50,000 thousand (equivalent to NT$214,516 thousand)
RMB35,000 thousand (equivalent to NT$150,161 thousand)
- - Necessary for short-term financing
- Operating capital - - - 20% of net worth RMB254,209 thousand (equivalent to NT$1,090,637 thousand)
50% of net worth RMB635,524 thousand (equivalent to NT$2,726,599 thousand)
SLCL
Other receivables Y RMB70,000 thousand (equivalent to NT$300,322 thousand)
RMB70,000 thousand (equivalent to NT$300,322 thousand)
- - Necessary for short-term financing
- Operating capital - - - Same as above Same as above
10 NYLC
SIYDCCL
Other receivables Y RMB16,000 thousand (equivalent to NT$68,645 thousand)
- - - Necessary for short-term financing
- Operating capital - - - 20% of net worth RMB32,835 thousand (equivalent to NT$140,873 thousand)
50% of net worth RMB82,087 thousand (equivalent to NT$352,179 thousand)
SLCL
Other receivables Y RMB16,000 thousand (equivalent to NT$68,645 thousand)
- - - Necessary for short-term financing
- Operating capital - - - Same as above Same as above
11 SLCL
SLCCL
Other receivables Y RMB40,000 thousand (equivalent to NT$171,613 thousand)
RMB40,000 thousand (equivalent to NT$171,613 thousand)
RMB33,000 thousand (equivalent to NT$141,580 thousand)
4.09% Necessary for short-term financing
- Operating capital - - - 20% of net worth RMB300,846 thousand (equivalent to NT$1,290,724 thousand)
50% of net worth RMB752,116 thousand (equivalent to NT$3,226,815 thousand)
Note 1: The net value was calculated based on audited financial statements as of December 31, 2019. Note 2: The ending balance is the financing credit lines to the respective borrowers approved by the board of directors of lenders. Note 3: The interest rate was for the year ended December 31, 2019. Note 4: The foreign currency amounts are expressed in New Taiwan dollars at exchange rate as of December 31, 2019.
(Concluded)

- 102 -
TABLE 2 ASIA CEMENT CORPORATION AND SUBSIDIARIES ENDORSEMENTS/GUARANTEES PROVIDED YEAR ENDED DECEMBER 31, 2019 (In Thousands of New Taiwan Dollars, Unless Stated Otherwise)
No. Endorser/ Guarantor
Endorsee/Guarantee
Limits on Each Endorsement/
Guarantee Given on Behalf of Each Party
(Note 1)
Maximum Amount
Endorsed/ Guaranteed During the
Period
Outstanding Endorsement/ Guarantee at the End of the
Period
Actual Borrowing
Amount
Amount Endorsed/
Guaranteed by Collaterals
Ratio of Accumulated Endorsement/ Guarantee to Net Equity in
Latest Financial
Statements (%)
Aggregate Endorsement/
Guarantee Limit (Note 1)
Endorsement/ Guarantee Given by Parent on Behalf of
Subsidiaries
Endorsement/ Guarantee Given by
Subsidiaries on Behalf of
Parent
Endorsement/ Guarantee Given on Behalf of
Companies in Mainland
China
Name Relationship (Note 3)
0 The Corporation AIC b 50% of net worth
($73,033,679 thousand)
$ 12,227,000 $ 12,195,800 $ 6,890,000 None 8.35 100% of net worth ($146,067,358 thousand)
Y - -
DCI b Same as above 9,856,750 9,848,950 4,952,000 None 6.74 Same as above Y - - FSMS b Same as above 30,000 30,000 30,000 None 0.02 Same as above Y - - NHC b Same as above 1,516,300 1,509,020 420,000 None 1.03 Same as above Y - - AEE b Same as above 422,880 329,930 150,000 None 0.23 Same as above Y - - YLPPC b Same as above 497,642 497,642 137,757 None 0.34 Same as above Y - - YSRMC b Same as above 150,000 150,000 - None 0.10 Same as above Y - - YTRMC b Same as above 1,000,000 1,000,000 - None 0.68 Same as above Y - - 1 DCI FSMS b 50% of net worth
($6,828,783 thousand) 50,000 50,000 10,000 None 0.37 100% of net worth
($13,657,566 thousand)
Y - -
2 AOG AOC b 50% of net worth
(US$1,146 thousand) (equivalent to NT$34,305 thousand)
15,775 14,965 - None 21.81 100% of net worth (US$2,292 thousand) (equivalent to NT$68,610 thousand)
Y - -
3 YLSS YLSS - 50% of net worth
($902,155 thousand) 100,000 100,000 30,000 100,000 5.54 100% of net worth
($1,804,309 thousand) - - -
4 YTRMC AOC b 50% of net worth
($900,885 thousand) 15,775 14,965 - None 0.83 100% of net worth
($1,801,770 thousand) Y - -
Note 1: The net value was calculated based on audited financial statements as of December 31, 2019. Note 2: The foreign currency amounts are expressed in New Taiwan dollars at exchange rate as of December 31, 2019. Note 3: The relationship between guarantor and guarantee are as follows:
a. Firms that do business with the Corporation. b. Firms of which the Corporation holds, directly or indirectly, over 50% of the voting shares.

- 103 -
TABLE 3 ASIA CEMENT CORPORATION AND SUBSIDIARIES MARKETABLE SECURITIES HELD DECEMBER 31, 2019 (In Thousands of New Taiwan Dollars, Unless Stated Otherwise)
Holding Company Name Type and Name of Marketable Securities Relationship with the Holding Company Financial Statement Account December 31, 2019
Note Shares or Units Carrying Amount Percentage of Ownership (%) Fair Value
The Corporation Beneficiary certificates Deutsche Far Eastern DWS Taiwan Flagship Security
Investment Trust Fund - Financial assets at fair value through profit or
loss - current 10,000,000 $ 204,700 - $ 204,700
Ordinary shares China Conch Venture Holding - Financial assets at fair value through profit or
loss - current 11,443,000 1,485,828 0.63 1,485,828
Far EasTone The same chairman Financial assets at fair value through other comprehensive income - current
31,034,372 2,237,578 0.95 2,237,578 Note 4
Far Eastern Department Stores Ltd. The same chairman Financial assets at fair value through other comprehensive income - noncurrent
80,052,950 2,085,379 5.65 2,085,379
Oriental Union Chemical Corp. The same chairman Same as above 63,766,522 1,339,097 7.20 1,339,097 CHC Resources Corporation The Corporation is its director Same as above 22,801,185 1,146,900 9.17 1,146,900 Far Eastern International Bank The chairman of the Corporation is its vice-chairman Same as above 78,878,582 942,599 2.35 942,599 Kaohsiung Rapid Transit - Same as above 15,873,243 78,630 5.70 78,630 Taiwan Stock Exchange Corp. - Same as above 8,430,368 466,199 1.16 466,199 Ding Ding Hotel Corp. Related party in substance Same as above 555,638 5,340 0.53 5,340 L’ Hotel de Chine Hotel - Same as above 598,121 14,469 0.31 14,469 China Trade & Development Corp. - Same as above 250,003 3,902 0.38 3,902 Pan Asia Engineers & Constructors Corp. The Corporation is its director Same as above 1,551,395 17,919 1.36 17,919 Linkou Recreation Corporation - Same as above 5 - 0.50 - China Shanshui Investment Corp - Same as above 49,928 488,258 4.99 488,258 DCI Beneficiary certificates Polaris Taiwan Top 50 Tracker Fund - Financial assets at fair value through profit or
loss - current 400,000 38,780 - 38,780
Mega Target Return Strategy Fund of ETF Funds - Same as above 1,000,811 10,620 - 10,620 ChinaAMC CSI 300 Index ETF - Same as above 540,000 95,689 0.20 95,689 Opas Fund Segregated Portfolio Tranche A Related party in substance Same as above 8,000 273,741 - 273,741 Ordinary shares Industrial and Commercial Bank of China, A share - Financial assets at fair value through profit or
loss - current 2,000,000 50,454 - 50,454
China Mobile Communications Corporation - Same as above 210,000 52,530 - 52,530 Haitong Securities Co., Ltd. - Same as above 1,800,000 63,311 0.02 63,311 Taiwan Cement Co., Ltd. - Same as above 8,796,722 384,417 0.16 384,417 Hsing Ta Cement Co., Ltd. - Same as above 6,504,854 130,748 1.90 130,748 Chunghwa Picture Tubes, Ltd. - Same as above 275,223 - - - Innolux Corporation - Same as above 9,200,000 76,636 0.09 76,636 Pegatron Corporation - Same as above 1,242,000 84,953 0.05 84,953 Tong Yang Industry Co., Ltd - Same as above 1,732,000 80,798 0.29 80,798 E Ink Holdings corporation - Same as above 1,130,000 35,313 0.10 35,313 Hiwin Technologies Corporation - Same as above 60,000 16,860 0.02 16,860 Accton Technology Corporation - Same as above 150,000 25,200 0.03 25,200 Casetek Holdings Limited - Financial assets at fair value through other
comprehensive income - current 1,050,000 49,718 0.25 49,718
China Life Insurance Company Limited, H share - Same as above 607,000 50,188 - 50,188
(Continued)

- 104 -
Holding Company Name Type and Name of Marketable Securities Relationship with the Holding Company Financial Statement Account December 31, 2019
Note Shares or Units Carrying Amount Percentage of Ownership (%) Fair Value
Far Eastern International Bank The chairman of the Corporation’s major shareholder
is its vice-chairman Financial assets at fair value through other
comprehensive income - current 37,693,157 $ 450,433 1.12 $ 450,433
Oriental Union Chemical Corp. Same chairman with the major shareholder Same as above 41,246 866 - 866 Far EasTone Same chairman with the major shareholder Same as above 215,000 15,502 0.01 15,502 Mega Financial Holding Co., Ltd. - Same as above 9,958,000 304,715 0.07 304,715 Lite-On Technology Corporation - Same as above 299,000 14,756 0.01 14,756 Tripod Technology Corporation - Same as above 261,000 32,756 0.05 32,756 WPG Holdings Limited - Same as above 340,000 13,294 0.02 13,294 Far Eastern International Bank The chairman of the Corporation’s major shareholder
is its vice-chairman Financial assets at fair value through other
comprehensive income - noncurrent 97,439,707 1,164,404 2.90 1,164,404
Far Eastern Department Stores Ltd. The same chairman Same as above 13,630,966 355,087 0.96 355,087 Note 5 Oriental Union Chemical Corp. The same chairman Same as above 10,506,792 220,643 1.19 220,643 CHC Resources Corporation The Corporation is its director Same as above 4,812,514 242,069 1.94 242,069 Picvue Electronics Co., Ltd. - Same as above 161,700 - 0.06 - Ding Ding Hotel Corp. Same chairman with the major shareholder Same as above 213,442 2,051 0.21 2,051 Far Eastern International Leasing Corporation The Corporation is its director Same as above 45,258,938 602,813 10.14 602,813 NHC Ordinary shares Far EasTone Same chairman with the major shareholder Financial assets at fair value through profit or
loss - current 50,000 3,605 - 3,605
YTRMC Ordinary shares Far EasTone Same chairman with the major shareholder Financial assets at fair value through other
comprehensive income - current 230,000 16,583 - 16,583
FMT Ordinary shares Everest Textile Co., Ltd. The chairman of the Corporation is its chairman Financial assets at fair value through other
comprehensive income - current 13,279,219 121,372 2.60 121,372
Oriental Union Chemical Corp. The chairman of the Corporation is its director Financial assets at fair value through other comprehensive income - noncurrent
2,256,782 47,392 0.25 47,392
Far Eastern Department Store Ltd. Same chairman with the major shareholder Same as above 1,185,713 30,888 0.08 30,888 Yi Tong Fiber Co., Ltd. - Same as above 5,256,454 41,691 5.94 41,691 FDT Ordinary shares Far Eastern International Bank The chairman of the Corporation is its vice-chairman
by the ultimate parent company Financial assets at fair value through other
comprehensive income - current 296,017 3,537 0.01 3,537
Far Eastern Department Store Ltd. The chairman of the Corporation is its vice-chairman Financial assets at fair value through other comprehensive income - noncurrent
935,029 24,358 0.07 24,358
Oriental Union Chemical Corp. Same chairman with the ultimate parent company Same as above 3,254,125 68,337 0.37 68,337 Ding & Ding Management Consultants Co., Ltd. - Same as above 866,730 8,376 16.00 8,376 AEE Ordinary shares Far EasTone Same chairman with the major shareholder Financial assets at fair value through profit or
loss - current 120,000 8,652 - 8,652
Ding & Ding Management Consultants Co., Ltd. - Financial assets at fair value through other comprehensive income - noncurrent
273,024 900 5.04 900
YLPPC Ordinary shares Far EasTone The director of the Corporation is its chairman Financial assets at fair value through other
comprehensive income - current 105,000 7,571 - 7,571
Yamay International Development Corp. - Financial assets at fair value through other comprehensive income - noncurrent
15 - - -
AIC Beneficiary certificates Opas Fund Segregated Portfolio Tranche E Related party in substance Financial assets at fair value through profit or
loss - current 3,973 156,299 - 156,299
ChinaAMC CSI 300 Index ETF - Same as above 1,000,000 177,202 0.37 177,202
(Continued)

- 105 -
Holding Company Name Type and Name of Marketable Securities Relationship with the Holding Company Financial Statement Account December 31, 2019
Note Shares or Units Carrying Amount Percentage of Ownership (%) Fair Value
Ordinary shares Hsing Ta Cement Co., Ltd - Financial assets at fair value through profit or
loss - current 10,834,650 $ 217,776 3.17 $ 217,776
Foxconn Technology Co., Ltd - Same as above 2,043,000 135,247 0.14 135,247 Taiwan Cement Co., Ltd. - Same as above 389,519 17,022 0.01 17,022 Quanta Computer Inc. - Same as above 525,000 33,758 0.01 33,758 Pegatron Corporation - Same as above 825,000 56,430 0.03 56,430 Hon Hai Precision Industry Co., Ltd. - Same as above 1,720,000 156,176 0.01 156,176 China Construction Bank Corporation, A share - Same as above 2,500,000 77,548 - 77,548 China Life Insurance Company Limited, H share - Same as above 1,350,000 111,620 - 111,620 China Mobile Communications Corporation - Same as above 448,000 112,065 - 112,065 Hiwin Technologies Corporation - Same as above 38,000 10,678 0.01 10,678 Accton Technology Corporation - Same as above 150,000 25,200 0.03 25,200 Far EasTone Same chairman with the major shareholder Financial assets at fair value through other
comprehensive income - current 1,426,303 102,836 0.04 102,836
Casetek Holdings Limited - Same as above 1,000,000 47,350 0.24 47,350 Nan Ya Plastics Corporation - Same as above 3,286,000 239,221 0.04 239,221 Inventec Corporation - Same as above 2,882,000 65,854 0.08 65,854 China Life Insurance Company Limited, A share - Same as above 540,000 80,786 - 80,786 China Life Insurance Company Limited, H share - Same as above 986,000 81,524 - 81,524 Lite-On Technology Corporation - Same as above 136,000 6,712 0.01 6,712 Tripod Technology Corporation - Same as above 100,000 12,550 0.02 12,550 WPG Holdings Limited - Same as above 340,000 13,294 0.02 13,294 Far Eastern International Bank The chairman of the Corporation’s major shareholder
is its vice-chairman Financial assets at fair value through other
comprehensive income - noncurrent 135,149,123 1,615,032 4.03 1,615,032
Oriental Union Chemical Corp. Same chairman with the major shareholder Same as above 1,552,156 32,595 0.18 32,595 Far Eastern Department Store Ltd. Same chairman with the major shareholder Same as above 4,473,972 116,547 0.32 116,547 Note 6 Ding Shen Investment Co., Ltd. The Corporation is its director Same as above 39,600,000 372,240 18.00 372,240 Hsin Nsn Construction Co., Ltd. - Same as above 2,696 - - - Asia Cement Pioneer Investment Ltd. Ordinary shares Cementon Micronesia L.L.C. - Financial assets at fair value through other
comprehensive income - noncurrent (Note 1) 116,727 10.00 116,727
FSMS Ordinary shares Stone Industry Resource System Corp - Financial assets at fair value through other
comprehensive income - noncurrent 10,000 70 0.15 70
YLT Beneficiary certificates Polaris Taiwan Top 50 Tracker Fund - Financial assets at fair value through profit or
loss - current 350,000 33,933 - 33,933
Ordinary shares Far Eastern International Bank The chairman of the Corporation’s major shareholder
is its vice-chairman Financial assets at fair value through other
comprehensive income - noncurrent 3,020,872 36,099 0.09 36,099
Far EasTone Same chairman with the major shareholder Same as above 71,099 5,126 - 5,126 YLSS Ordinary shares Far EasTone Same chairman with the major shareholder Financial assets at fair value through other
comprehensive income - current 130,000 9,373 - 9,373
KCC Beneficiary certificates CSOP FTSE China A50 ETF - Financial assets at fair value through profit or
loss - current 300,000 17,438
- 17,438
KCCL Beneficiary certificates Allianz US High Yield Fund - Financial assets at fair value through profit or
loss - current 97,741 21,147
- 21,147
Opas Fund Segregated Portfolio Tranche C Related party in substance Same as above 1,606 70,827
- 70,827
(Continued)
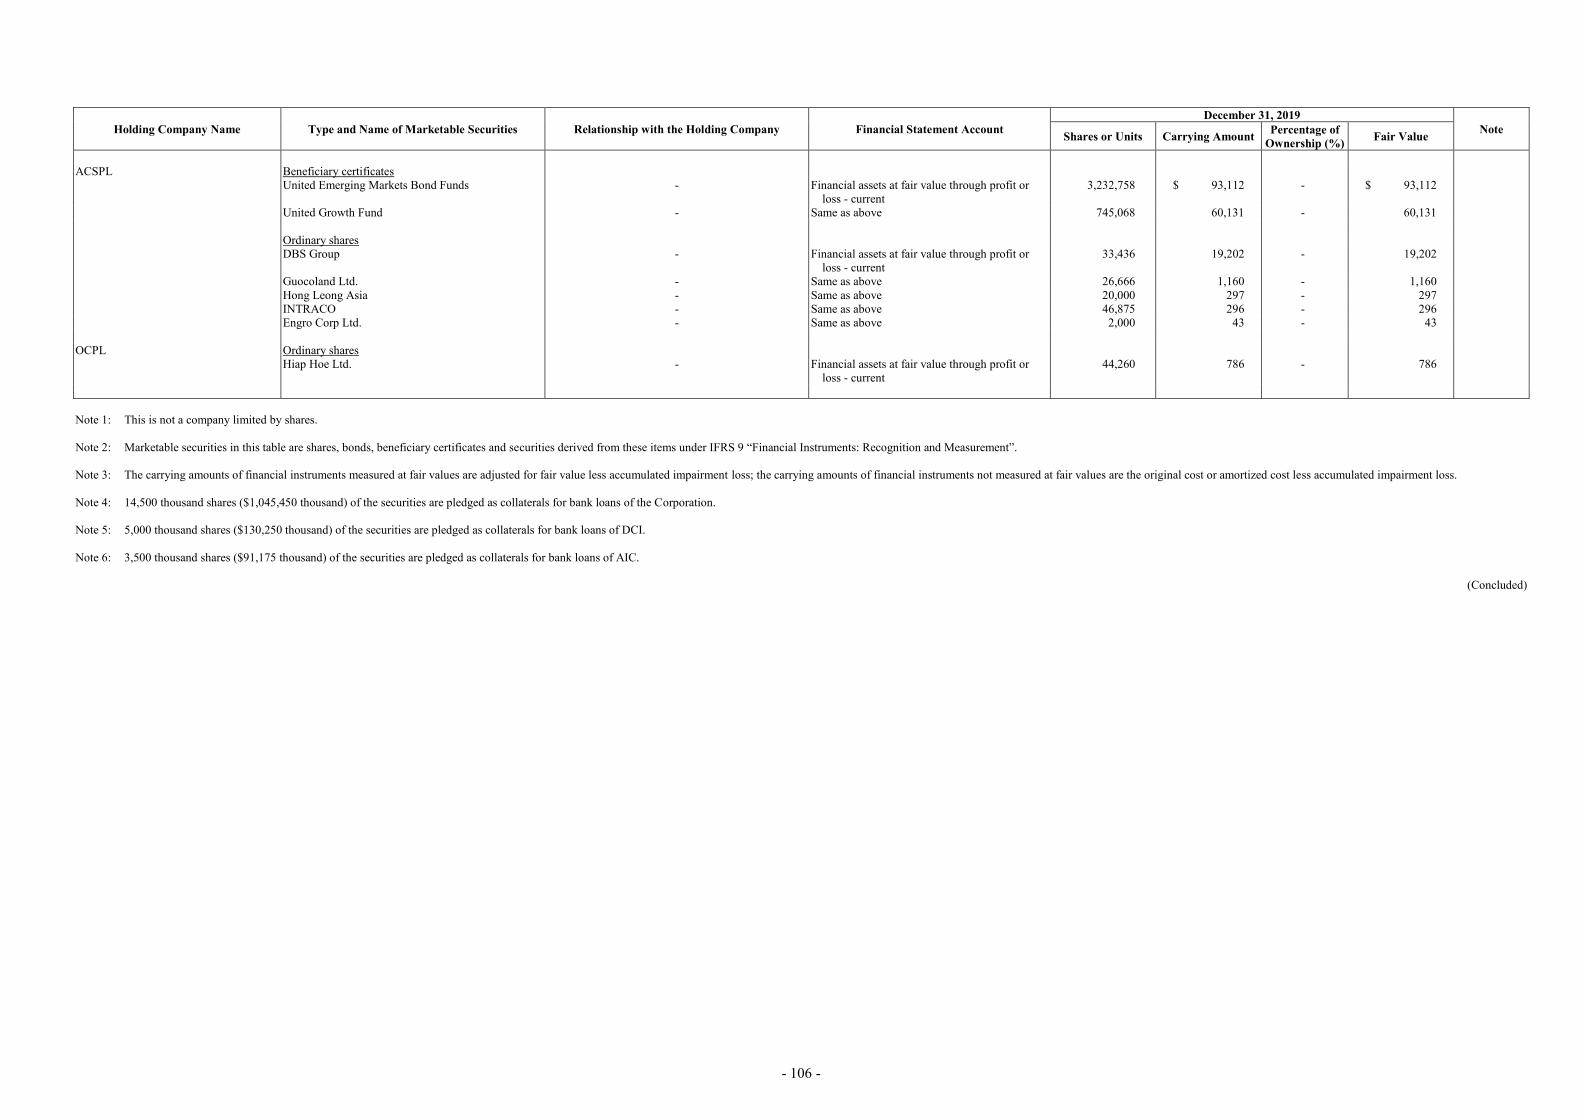
- 106 -
Holding Company Name Type and Name of Marketable Securities Relationship with the Holding Company Financial Statement Account December 31, 2019
Note Shares or Units Carrying Amount Percentage of Ownership (%) Fair Value
ACSPL Beneficiary certificates United Emerging Markets Bond Funds - Financial assets at fair value through profit or
loss - current 3,232,758 $ 93,112
- $ 93,112
United Growth Fund - Same as above 745,068 60,131 - 60,131 Ordinary shares DBS Group - Financial assets at fair value through profit or
loss - current 33,436 19,202
- 19,202
Guocoland Ltd. - Same as above 26,666 1,160 - 1,160 Hong Leong Asia - Same as above 20,000 297 - 297 INTRACO - Same as above 46,875 296 - 296 Engro Corp Ltd. - Same as above 2,000 43 - 43 OCPL Ordinary shares Hiap Hoe Ltd. - Financial assets at fair value through profit or
loss - current 44,260 786 - 786
Note 1: This is not a company limited by shares. Note 2: Marketable securities in this table are shares, bonds, beneficiary certificates and securities derived from these items under IFRS 9 “Financial Instruments: Recognition and Measurement”. Note 3: The carrying amounts of financial instruments measured at fair values are adjusted for fair value less accumulated impairment loss; the carrying amounts of financial instruments not measured at fair values are the original cost or amortized cost less accumulated impairment loss. Note 4: 14,500 thousand shares ($1,045,450 thousand) of the securities are pledged as collaterals for bank loans of the Corporation. Note 5: 5,000 thousand shares ($130,250 thousand) of the securities are pledged as collaterals for bank loans of DCI. Note 6: 3,500 thousand shares ($91,175 thousand) of the securities are pledged as collaterals for bank loans of AIC.
(Concluded)

- 107 -
TABLE 4 ASIA CEMENT CORPORATION AND SUBSIDIARIES MARKETABLE SECURITIES ACQUIRED AND DISPOSED OF AT COSTS OR PRICES OF AT LEAST NT$300 MILLION OR 20% OF THE PAID-IN CAPITAL YEAR ENDED DECEMBER 31, 2019 (In Thousands of New Taiwan Dollars, Unless Stated Otherwise)
Company Name Type and Name of Marketable
Securities (Note 1)
Financial Statement Account Counterparty (Note 2)
Relationship (Note 2)
Beginning Balance Acquisition (Note 3) Disposal (Note 3) Ending Balance
Shares/Units Amount Shares/Units Amount Shares/Units Amount Carrying Value Gain (Loss) on Disposal Shares/Units Amount
ACCHC Ordinary shares PIHPL Investments in subsidiaries Proceeds from
issuance of ordinary shares
Subsidiaries 9,379,303 US$ 2,165,969 thousand
340,232 US$ 73,781 thousand
- $ - $ - $ - 9,719,535 (Note 2)
US$ 2,484,649 thousand
PIHPL Ordinary shares OIH Investments in subsidiaries Proceeds from
issuance of ordinary shares
Subsidiaries 700,709,352 US$ 1,473,705 thousand
(Note 2) US$ 73,781 thousand
- - - - 700,709,352 (Note 2)
US$ 1,751,418 thousand
OIH Ordinary shares OHC Investments in subsidiaries Proceeds from
issuance of ordinary shares
Subsidiaries (Note 1) RMB 813,357 thousand
- RMB 500,000 thousand
- - - - (Note 1) RMB 2,885,909 thousand
OHC Ordinary shares YDES Investments accounted for using
the equity method Proceeds from
issuance of ordinary shares
Associates (Note 1) - - RMB 714,190 thousand
- - - - (Note 1) RMB 706,643 thousand
ACSPL Beneficiary certificates Opas Fund Segregated Portfolio
Tranche D Financial assets at fair value
through profit or loss - current
- - 19,000 580,194 - - 19,000 612,797 583,562 29,235 - -
DCI Beneficiary certificates Opas Fund Segregated Portfolio
Tranche D Financial assets at fair value
through profit or loss - current - - 56,000 1,716,669 94 2,869 56,094 1,805,004 1,716,469 88,536 - -
AIC Beneficiary certificates Opas Fund Segregated Portfolio
Tranche D Financial assets at fair value
through profit or loss - current - - 58,000 1,777,798 - - 58,000 1,863,752 1,774,800 88,952 - -
Mega Beneficiary certificates Opas Fund Segregated Portfolio
Tranche D Financial assets at fair value
through profit or loss - current - - - - 9,601 294,286 9,601 296,073 294,286 1,787 - -
Mega IV Beneficiary certificates Opas Fund Segregated Portfolio
Tranche D Financial assets at fair value
through profit or loss - current - - - - 9,601 294,286 9,601 296,073 294,286 1,787 - -
Leap Beneficiary certificates Opas Fund Segregated Portfolio
Tranche D Financial assets at fair value
through profit or loss - current - - - - 9,601 294,286 9,601 296,073 294,286 1,787 - -
Note 1: This is not a company limited by shares. Note 2: The cash capital increment was not registered yet.

- 108 -
TABLE 5 ASIA CEMENT CORPORATION AND SUBSIDIARIES TOTAL PURCHASE FROM OR SALE TO RELATED PARTIES AMOUNTING TO AT LEAST NT$100 MILLION OR 20% OF THE PAID-IN CAPITAL YEAR ENDED DECEMBER 31, 2019 (In Thousands of New Taiwan Dollars, Unless Stated Otherwise)
Purchasing or (Selling)
Company Name Related Party Relationship
Transaction Details Abnormal Transaction Notes/Accounts (Payable) or
Receivable Note Purchase (Sale) Amount % to
Total Payment Terms Unit Price Payment Terms Ending Balance % to Total
The Corporation YTRMC A subsidiary of the Corporation Sales $ (1,805,262) (20) Purchase 45 days after monthly closing $ - - $ 348,664 33 ACSPL A subsidiary of the Corporation Sales (522,223) (6) Average 30 days - - 38,621 4 YSRMC A subsidiary of the Corporation Sales (163,476) (2) Purchase 45 days after monthly closing - - 34,114 3 U-Ming An investee accounted for by equity method Sales freight expense 551,952 6 Average 60 days - - (66,176) (4) U-Ming Singapore A subsidiary of an investee accounted for by
equity method Sales freight expense 186,958 2 Average 10 days - - - -
YLT A subsidiary of the Corporation Sales freight expense 176,539 2 Average 30 days - - (31,883) (2) NHC A subsidiary of the Corporation Purchase 151,293 2 Purchase 45 days after monthly closing - - (28,431) (2) ACSPL Alliance Concrete Singapore Pte. Ltd. An investee accounted for by equity method Sales SGD (28,215)
thousand (78) Average 60 days - - SGD 6,247
thousand 83
The Corporation Parent company Purchase SGD 23,042 thousand
63 Average 30 days - - SGD (1,740) thousand
(28)
YTRMC Far Eastern General Construction Inc. Related party in substance Sales (430,434) (5) Average 90 days - - 213,416 6 Far Eastern Resources Development Co. Related party in substance Sales (104,551) (1) Average 90 days - - 76,481 2 The Corporation Parent company Purchase 1,805,262 21 Purchase 45 days after monthly closing - - (348,664) (24) CHC Resources Corporation Related party in substance Purchase 466,075 5 Purchase 45 days after monthly closing - - (64,488) (4) FMT Air Liquide Far Eastern Co. Related party in substance Sales (156,034) (14) Purchase 120 days after monthly closing - - 52,734 25 FENC An investee accounted for by equity method Sales (207,509) (19) Purchase 60 days after monthly closing - - 27,527 13 OUCC Related party in substance Sales (133,627) (12) Purchase 75 days after monthly closing - - 23,895 11 FDT Oriental Petrochemical (Taiwan) Co., Ltd. Related party in substance Sales (176,300) (20) 110 days - - 55,066 46 YSRMC Chubei New Century Shopping Mall Co.,
Ltd. Related party in substance Sales (104,908) (15) Average 60 days - - 19,648 8
The Corporation Parent company Purchase 163,476 25 Purchase 45 days after monthly closing - - (34,114) (30) YLPPC Far Eastern General Construction Inc. Related party in substance Sales (116,783) (66) Average 90 days - - 35,542 34 NHC The Corporation Parent company Sales (151,293) (40) Purchase 45 days after monthly closing - - 28,431 33 YLT The Corporation Parent company Sales (176,539) (98) 30 days - - 31,883 99 YTV Far Eastern Polytex Vietnam Ltd. A subsidiary of an investee accounted for by
equity method Sales VND (79,774,106)
thousand (82) Within 45 days - - VND 26,936,744
thousand 87
JYDC TZOCCL The same ultimate parent company Sales RMB (240,626)
thousand (5) Within 90 days - - RMB 34,873
thousand 4
WYDC The same ultimate parent company Sales RMB (212,481) thousand
(4) Average 30 days - - RMB 37,902 thousand
5
YYDCCL The same ultimate parent company Sales RMB (552,419) thousand
(11) Within 90 days - - RMB 31,765 thousand
4
NYDC A subsidiary of the Corporation Sales RMB (92,202) thousand
(2) Average 30 days - - RMB 16,285 thousand
2
(Continued)

- 109 -
Purchasing or (Selling)
Company Name Related Party Relationship
Transaction Details Abnormal Transaction Notes/Accounts (Payable) or Receivable Note
Purchase (Sale) Amount % to Total Payment Terms Unit Price Payment Terms Ending Balance % to
Total NYLC A subsidiary of the Corporation Sales RMB (33,435)
thousand (1) Average 30 days $ - - RMB 6,503
thousand 1
HYDCCL The same ultimate parent company Sales RMB (49,612) thousand
(1) Within 90 days - - RMB 12,304 thousand
1
RYNM A subsidiary of the Corporation Sales RMB (23,366) thousand
- Average 30 days - - RMB 3,856 thousand
-
JYLTC A subsidiary of the Corporation Sales freight expense RMB 52,041 thousand
2 Within 90 days - - RMB (14,608) thousand
(8)
WAMTC An investee accounted for by equity method Sales freight expense RMB 76,408 thousand
2 Within 90 days - - RMB (19,484) thousand
11
NYDC A subsidiary of the Corporation Purchase RMB 294,343 thousand
10 Average 30 days - - RMB (45,705) thousand
(25)
NYLC A subsidiary of the Corporation Purchase RMB 28,776 thousand
1 Average 30 days - - RMB (2,475) thousand
(1)
HGYDC The same ultimate parent company Purchase RMB 24,880 thousand
1 Average 30 days - - RMB (7,370) thousand
(4)
NYDC JYDC Parent company Sales RMB (294,343)
thousand (100) Average 30 days - - RMB 45,705
thousand 100
JYDC Parent company Purchase RMB 92,202 thousand
35 Average 30 days - - RMB (16,285) thousand
(58)
NYLC JYDC Parent company Sales RMB (28,776)
thousand (17) Average 30 days - - RMB 2,475
thousand 2
JYDC Parent company Purchase RMB 33,435 thousand
23 Average 30 days - - RMB (6,503) thousand
(31)
TZOCCL JYDC The same ultimate parent company Purchase RMB 240,626
thousand 85 Within 90 days - - RMB (34,873)
thousand (92)
YYDCCL The same ultimate parent company Purchase RMB 29,860 thousand
11 Within 90 days - - RMB (912) thousand
(2)
WYDC JYDC The same ultimate parent company Purchase RMB 212,481
thousand 63 Average 30 days - - RMB (37,902)
thousand (59)
HYDCCL The same ultimate parent company Purchase RMB 25,704 thousand
8 Within 90 days - - RMB (280) thousand
-
YYDCCL TZOCCL The same ultimate parent company Sales RMB (29,860)
thousand (3) Within 90 days - - RMB 912
thousand 1
JYDC The same ultimate parent company Purchase RMB 552,419 thousand
70 Within 90 days - - RMB (31,765) thousand
(64)
WAMTC An investee accounted for by equity method Sales freight expense RMB 25,879 thousand
3 Within 90 days - - RMB (2,885) thousand
(6)
HYDCCL WYDC The same ultimate parent company Sales RMB (25,704)
thousand (2) Within 90 days - - RMB 280
thousand -
WYCPCL The same ultimate parent company Sales RMB (44,639) thousand
(3) Within 90 days - - RMB 14,085 thousand
4
HZYCCL An investee accounted for by equity method Sales RMB (32,231) thousand
(2) Within 90 days - - RMB 14,906 thousand
4
JYDC The same ultimate parent company Purchase RMB 49,612 thousand
5 Within 90 days - - RMB (12,304) thousand
(14)
HGYDC The same ultimate parent company Purchase RMB 86,691 thousand
8 Within 90 days - - RMB (9,658) thousand
(11)
WAMTC An investee accounted for by equity method Sales freight expense RMB 33,759 thousand
3 Within 90 days - - - -
HXMC An investee accounted for by equity method Purchase RMB 22,650 thousand
2 Within 90 days - - RMB (1,856) thousand
(2)
(Continued)

- 110 -
Purchasing or (Selling)
Company Name Related Party Relationship
Transaction Details Abnormal Transaction Notes/Accounts (Payable) or Receivable Note
Purchase (Sale) Amount % to Total Payment Terms Unit Price Payment Terms Ending Balance % to
Total WYCPCL HYDCCL The same ultimate parent company Purchase RMB 44,639
thousand 30 Within 90 days $ - - RMB (14,085)
thousand (43)
SIYDCCL SLCL A subsidiary of the Corporation Sales RMB (81,058)
thousand (4) Within 90 days - - RMB 7,306
thousand 1
SYCPCL The same ultimate parent company Sales RMB (27,616) thousand
(1) Within 90 days - - RMB 8,710 thousand
1
HGYDC HYDCCL The same ultimate parent company Sales RMB (86,691)
thousand (10) Within 90 days - - RMB 9,658
thousand 18
JYDC The same ultimate parent company Sales RMB (24,880) thousand
(3) Average 30 days - - RMB 7,370 thousand
14
SLCL
SYCPCL The same ultimate parent company Sales RMB (23,395) thousand
(2) Within 90 days - - RMB 22,603 thousand
3
SIYDCCL
Parent company Purchase RMB 81,058 thousand
10 Within 90 days - - RMB (7,306) thousand
(15)
SYTCL The same ultimate parent company Purchase RMB 43,424 thousand
5 Within 90 days - - RMB (6,162) thousand
(12)
SYCPCL SLCL The same ultimate parent company Purchase RMB 23,395
thousand 9 Average 30 days - - RMB (22,603)
thousand (24)
SIYDCCL The same ultimate parent company Purchase RMB 27,616 thousand
11 Within 90 days - - RMB (8,710) thousand
(9)
JYLTC JYDC Parent company Sales RMB (52,041)
thousand (63) Within 90 days - - RMB 14,608
thousand 62
SYTCL SLCL The same ultimate parent company Sales RMB (43,424)
thousand (56) Within 90 days - - RMB 6,162
thousand 24
RYNM JYDC Parent company Purchase RMB 23,366
thousand 100 Average 30 days - - RMB (3,856)
thousand (99)
(Concluded)

- 111 -
TABLE 6 ASIA CEMENT CORPORATION AND SUBSIDIARIES RECEIVABLES FROM RELATED PARTIES AMOUNTING TO AT LEAST NT$100 MILLION OR 20% OF THE PAID-IN CAPITAL YEAR ENDED DECEMBER 31, 2019 (In Thousands of New Taiwan Dollars, Unless Stated Otherwise)
Company Name Related Party Relationship Ending Balance Turnover Rate
Overdue Amounts Received in Subsequent
Period
Allowance for Impairment Loss Amount Action Taken
The Corporation YTRMC A subsidiary of the Corporation $ 348,664 5.02 times $ - - $ 5,386 $ - ACSPL Alliance Concrete Singapore Pte. Ltd. An investee accounted for by equity method SGD 6,247
thousand 4.25 times - - SGD 6,247
thousand -
YTRMC Far Eastern General Construction Inc. Related party in substance 213,416 1.75 times - - 121,620 - JYDC TZDC The same ultimate parent company RMB 34,873
thousand 6.92 times - - RMB 30,032
thousand -
WYDC The same ultimate parent company RMB 37,902 thousand
6.71 times - - - -
YYDCCL The same ultimate parent company RMB 31,765 thousand
16.52 times - - RMB 23,692 thousand
-
ACCHC Parent company RMB 700,000 thousand
Note 1 - - - -
SHYLCP The same ultimate parent company RMB 45,000 thousand
Note 1 - - - -
TZOCCL The same ultimate parent company RMB 70,000 thousand
Note 1 - - - -
NYDC JYDC Parent company RMB 45,705
thousand 6.77 times - - RMB 45,705
thousand -
OIH ACCHC Parent company RMB 44,000
thousand Note 1 - - - -
OHC SLCL The same ultimate parent company RMB 190,000
thousand Note 1 - - RMB 90,000
thousand -
SLCL SLCCL A subsidiary of the Corporation RMB 33,000
thousand Note 1 - - - -
WYDC SYCPCL The same ultimate parent company RMB 40,000
thousand Note 1 - - - -
HYDCCL ACCHC Parent company RMB 400,000
thousand Note 1 - - - -
Note 1: The accounts receivable from financing.

- 112 -
TABLE 7 ASIA CEMENT CORPORATION AND SUBSIDIARIES NAMES, LOCATIONS, AND OTHER INFORMATION OF INVESTEES ON WHICH THE CORPORATION EXERCISES SIGNIFICANT INFLUENCE (EXCLUDING INVESTMENT IN MAINLAND CHINA) YEAR ENDED DECEMBER 31, 2019 (In Thousands of New Taiwan Dollars, Unless Stated Otherwise)
Investor Company Investee Company Location Main Businesses and Products Investment Amount Balance as of December 31, 2019 Net Income (Loss)
of the Investee Share of Profits
(Loss) Note December 31, 2019 December 31, 2018 Shares Percentage of Ownership Carrying Value
The Corporation ACCHC Cayman Investment $ 13,660,636 $ 13,660,636 1,061,209,202 67.73 $ 41,411,828 $ 14,106,889 $ 9,554,596 A subsidiary of the
Corporation FENC Taiwan Textile 3,459,787 3,459,787 1,272,277,085 23.77 39,074,139 10,732,669 1,637,898 U-Ming Taiwan Marine transportation 510,236 510,236 331,701,152 39.25 10,462,271 1,621,695 636,545 DCI Taiwan Investment 2,555,255 2,555,255 595,576,603 99.99 13,656,200 1,262,905 1,262,788 A subsidiary of the
Corporation CHP Taiwan Power plant 3,119,492 3,119,492 280,093,521 59.59 6,059,603 1,097,061 653,769 A subsidiary of the
Corporation YDC Taiwan Investment 2,232,220 2,232,220 178,707,648 35.50 3,218,379 214,541 67,561 YYI Taiwan Investment 911,058 911,058 155,000,803 29.92 2,560,533 811,808 242,893 ACSPL Singapore Cement 186,958 186,958 10,495,495 99.96 4,142,011 693,709 693,431 A subsidiary of the
Corporation OSC Taiwan Broker 154,207 154,207 135,092,154 18.93 1,921,049 250,003 47,326 AIC Taiwan Investment 1,212,679 1,212,679 222,039,596 100.00 3,256,199 977,016 977,016 A subsidiary of the
Corporation YTRMC Taiwan Ready-mixed concrete, cement -
related products 1,042,252 1,042,252 159,067,779 99.99 1,801,770 146,801 146,801 A subsidiary of the
Corporation YLSS Taiwan Stainless steel 2,661,240 2,661,240 200,000,000 100.00 1,969,817 1,347 (6,939) A subsidiary of the
Corporation FMT Taiwan Transportation 68,416 68,416 29,517,188 99.82 1,410,458 213,189 213,363 A subsidiary of the
Corporation FEDSDL Taiwan Retails 500,000 500,000 53,250,000 25.00 640,867 152,284 56,887 NHC Taiwan Cement, granulated blast-furnace slag 410,994 410,994 26,128,171 99.94 261,372 52,531 52,499 A subsidiary of the
Corporation YDLC Taiwan Leasing 309,049 309,049 34,640,189 43.60 373,481 12,144 5,295 YLT Taiwan Transportation 22,110 22,110 5,100,000 51.00 265,154 22,796 11,626 A subsidiary of the
Corporation AEE Taiwan Engineering 5,136 5,136 7,970,703 98.23 182,274 59,946 58,885 A subsidiary of the
Corporation EISF Taiwan Iron and steel 31,463 31,463 3,199,823 40.40 80,652 14,020 5,664 YLPPC Taiwan Cement - related products 144,961 144,961 16,241,083 83.81 75,594 1,040 871 A subsidiary of the
Corporation SIHL B.V.I. Investment 2,898 2,898 90,000 100.00 54,922 3,038 3,038 A subsidiary of the
Corporation CSCGL Cayman Investment 4,821,008 4,821,008 331,878,315 7.62 5,248,933 13,578,105 965,182 DCI YDC Taiwan Investment 289,982 289,982 72,989,090 14.50 1,320,548 214,541 Not applicable FEC Taiwan Construction 140,138 140,138 115,882,928 33.76 4,402,354 725,256 Not applicable FENC Taiwan Textile 1,263,385 1,263,385 82,812,887 1.55 2,509,521 10,732,669 Not applicable KCC Hong Kong Cement 36,024 36,024 1,127,000 49.00 446,154 40,881 Not applicable A subsidiary of the
Corporation SHSTC Taiwan Storage and transportation - 143,516 - - - - Not applicable FSMS Taiwan Mining excavation, mineral
processing and sales 112,096 112,096 1,294,270 99.56 133,735 (6,936) Not applicable A subsidiary of the
Corporation U-Ming Taiwan Marine transportation 27,619 27,619 468,486 0.06 30,967 1,621,695 Not applicable AC Mega Investment Ltd. B.V.I. Investment 828,313 579,926 27,700,000 100.00 774,004 86,138 Not applicable A subsidiary of the
Corporation AC Leap Investment Ltd. B.V.I. Investment 846,224 579,439 28,300,000 100.00 855,589 100,918 Not applicable A subsidiary of the
Corporation AC Mega II Investment Ltd. B.V.I. Investment 289,050 289,050 10,000,000 100.00 281,337 46,877 Not applicable A subsidiary of the
Corporation
(Continued)

- 113 -
Investor Company Investee Company Location Main Businesses and Products Investment Amount Balance as of December 31, 2019 Net Income (Loss)
of the Investee Share of Profits
(Loss) Note December 31, 2019 December 31, 2018 Shares Percentage of Ownership Carrying Value
AC Mega III Investment Ltd. B.V.I. Investment $ 289,050 $ 289,050 10,000,000 100.00 $ 319,223 $ 52,787 Not applicable A subsidiary of the
Corporation AC Mega IV Investment Ltd. B.V.I. Investment 780,510 780,510 26,100,000 100.00 888,698 106,605 Not applicable A subsidiary of the
Corporation Drive Catalyst SPC - SP Tranche One B.V.I. Investment 123,120 123,120 4,000 25.00 120,649 3,831 Not applicable Drive Catalyst SPC - SP Tranche Three B.V.I. Investment 123,960 - 4,000 25.00 118,975 (3,076) Not applicable CSCGL Cayman Investment 872,619 872,619 56,297,000 1.29 890,053 13,578,105 Not applicable NHC SHSTC Taiwan Storage and transportation - 333,309 - - - - Not applicable PGIC Taiwan Granulated blast-furnace slag 36,771 36,771 3,287,550 31.00 51,455 8,847 Not applicable FENC Taiwan Textile 15,240 15,240 1,739,978 0.03 40,356 10,732,669 Not applicable U-Ming Taiwan Marine transportation 1,027 1,027 64,143 0.01 941 1,621,695 Not applicable CSCGL Cayman Investment 282,957 282,957 9,250,000 0.21 145,992 13,578,105 Not applicable YTRMC YSRMC Taiwan Ready-mixed concrete 69,930 69,930 6,993,000 69.93 87,687 27,530 Not applicable A subsidiary of the
Corporation YTV Vietnam Ready-mixed concrete 201,823 201,823 (Note 1) 100.00 291,247 7,838 Not applicable A subsidiary of the
Corporation PYCI Indonesia Ready-mixed concrete 144,369 61,439 (Note 1) 99.00 68,599 (72,481) Not applicable A subsidiary of the
Corporation AOG Guam Investment 236,240 175,230 (Note 1) 95.04 65,207 (43,552) Not applicable A subsidiary of the
Corporation FMT FDT Taiwan Transportation 30,373 30,373 27,892,834 99.87 740,647 109,850 Not applicable A subsidiary of the
Corporation FENC Taiwan Textile 40,263 40,263 4,415,299 0.08 109,949 10,732,669 Not applicable Taiwan FDT YDEC Taiwan Retail 160,424 160,424 30,557,900 26.95 585,374 117,812 Not applicable U-Ming Taiwan Marine transportation 1,891 1,891 50,000 0.01 1,805 1,621,695 Not applicable FENC Taiwan Textile 31,322 31,322 1,020,000 0.02 31,091 10,732,669 Not applicable AEE ACCHC Cayman Investment 50,541 50,541 3,161,500 0.20 84,246 14,106,889 Not applicable A subsidiary of the
Corporation U-Ming Taiwan Marine transportation 38,931 38,931 3,485,997 0.41 35,455 1,621,695 Not applicable CSCGL Cayman Investment 266,942 266,942 8,368,000 0.19 132,075 13,578,105 Not applicable YLPPC YDEC Taiwan Retail 20,776 20,776 4,411,559 3.89 84,414 117,812 Not applicable PYCI Indonesia Ready-mixed concrete 1,448 621 (Note 1) 1.00 693 (72,481) Not applicable A subsidiary of the
Corporation YLPCIP India Tunnel lining segments 8,338 8,338 (Note 1) 99.99 1,915 (219) Not applicable A subsidiary of the
Corporation AOG Guam Investment 66,816 66,816 (Note 1) 4.96 3,403 (43,552) Not applicable A subsidiary of the
Corporation AIC FENC Taiwan Textile 405,473 405,473 15,430,293 0.29 649,483 10,732,669 Not applicable U-Ming Taiwan Marine transportation 77,446 77,446 7,796,914 0.92 72,456 1,621,695 Not applicable CHP Taiwan Power plant 376 376 37,574 0.01 850 1,097,061 Not applicable A subsidiary of the
Corporation Asia Cement Pioneer Investment Ltd. B.V.I. Investment 2,100,779 2,039,879 68,550,000 100.00 2,064,326 306,888 Not applicable A subsidiary of the
Corporation Asia Cement Pioneer II Investment Ltd. B.V.I. Investment 833,410 544,135 28,000,000 100.00 891,935 101,257 Not applicable A subsidiary of the
Corporation Asia Cement Pioneer III Investment Ltd. B.V.I. Investment 578,325 289,050 19,500,000 100.00 542,204 36,662 Not applicable A subsidiary of the
Corporation Asia Cement Pioneer IV Investment Ltd. B.V.I. Investment 575,538 286,263 19,010,000 100.00 588,459 48,009 Not applicable A subsidiary of the
Corporation Asia Cement Explorer Investment Ltd. B.V.I. Investment 623,340 334,065 20,915,000 100.00 442,420 14,774 Not applicable A subsidiary of the
Corporation DCI Taiwan Investment 76 76 5,401 - 76 1,262,905 Not applicable A subsidiary of the
Corporation
(Continued)

- 114 -
Investor Company Investee Company Location Main Businesses and Products Investment Amount Balance as of December 31, 2019 Net Income (Loss)
of the Investee Share of Profits
(Loss) Note December 31, 2019 December 31, 2018 Shares Percentage of Ownership Carrying Value
FMT Taiwan Transportation $ 176 $ 176 5,000 0.02 $ 272 $ 213,189 Not applicable A subsidiary of the
Corporation NHC Taiwan Cement, granulated blast-furnace slag 78 78 5,000 0.02 80 52,531 Not applicable A subsidiary of the
Corporation Taiwan AEE Taiwan Engineering 116 116 6,000 0.07 120 59,946 Not applicable A subsidiary of the
Corporation FSMS Taiwan Mining excavation, mineral
processing and sales 119 119 5,000 0.38 125 (6,936) Not applicable A subsidiary of the
Corporation FDT Taiwan Transportation 110 110 7,145 0.03 199 109,850 Not applicable A subsidiary of the
Corporation YSRMC Taiwan Ready-mixed concrete 37 37 5,000 0.05 44 27,530 Not applicable A subsidiary of the
Corporation EISF Taiwan Iron and steel 15,649 15,649 660,000 8.33 16,630 14,020 Not applicable YTRMC Taiwan Ready-mixed concrete, cement -
related products 53 53 5,782 - 53 146,801 Not applicable A subsidiary of the
Corporation CSCGL Cayman Investment 556,895 556,895 31,528,000 0.72 498,144 13,578,105 Not applicable YLT U-Ming Taiwan Marine transportation 58,840 58,840 6,348,103 0.75 308,774 1,621,695 Not applicable ACE CSCGL Cayman Investment 266,882 266,882 7,480,000 0.17 118,080 13,578,105 Not applicable Opas Fund Segregated Portfolio
Company Cayman Investment 1,531 1,531 33 33.00 1,607 113 Not applicable
Drive Catalyst SPC Cayman Investment 494 494 33 33.00 488 20 Not applicable ACP CSCGL Cayman Investment 1,959,250 1,959,250 107,536,000 2.47 1,700,893 13,578,105 Not applicable ACP II CSCGL Cayman Investment 544,689 544,689 36,865,000 0.85 583,507 13,578,105 Not applicable ACP III CSCGL Cayman Investment 290,967 290,967 14,790,000 0.34 233,970 13,578,105 Not applicable ACP IV CSCGL Cayman Investment 292,032 292,032 18,514,000 0.43 293,443 13,578,105 Not applicable Leap CSCGL Cayman Investment 567,556 567,556 35,569,000 0.82 562,979 13,578,105 Not applicable Mega CSCGL Cayman Investment 554,533 554,533 30,251,000 0.70 479,139 13,578,105 Not applicable Mega II CSCGL Cayman Investment 293,393 293,393 16,058,000 0.37 254,137 13,578,105 Not applicable Mega III CSCGL Cayman Investment 292,743 292,743 18,477,000 0.42 291,688 13,578,105 Not applicable Mega IV CSCGL Cayman Investment 504,078 504,078 37,410,000 0.86 591,806 13,578,105 Not applicable KCC KCCL Hong Kong Ready-mixed concrete 38
38
10,000 100.00 138,589
13,198
Not applicable A subsidiary of the Corporation
Join Fortune Trading Ltd. B.V.I. Investment 88,372
88,372
2,979,721 100.00 18,957
584
Not applicable A subsidiary of the Corporation
JFTL Empire Success Corp Ltd. Hong Kong Storage and transportation 65,076 65,076 17,040,000 50.00 16,508 (559) Not applicable Profit Enterprises Int'l Ltd. Hong Kong Barge transportation 23,296 23,296 6,100,000 50.00 3,289 1,253 Not applicable AOG Asia Oriental Concrete, LLC Guam Ready-mixed concrete 237,944 178,084 (Note 1) 71.70 22,269 (66,247) Not applicable A subsidiary of the
Corporation Perez-Mtec-ACC, L.L.C. Guam Ready-mixed concrete 8,979 8,979 (Note 1) 33.33 42 - Not applicable
(Continued)
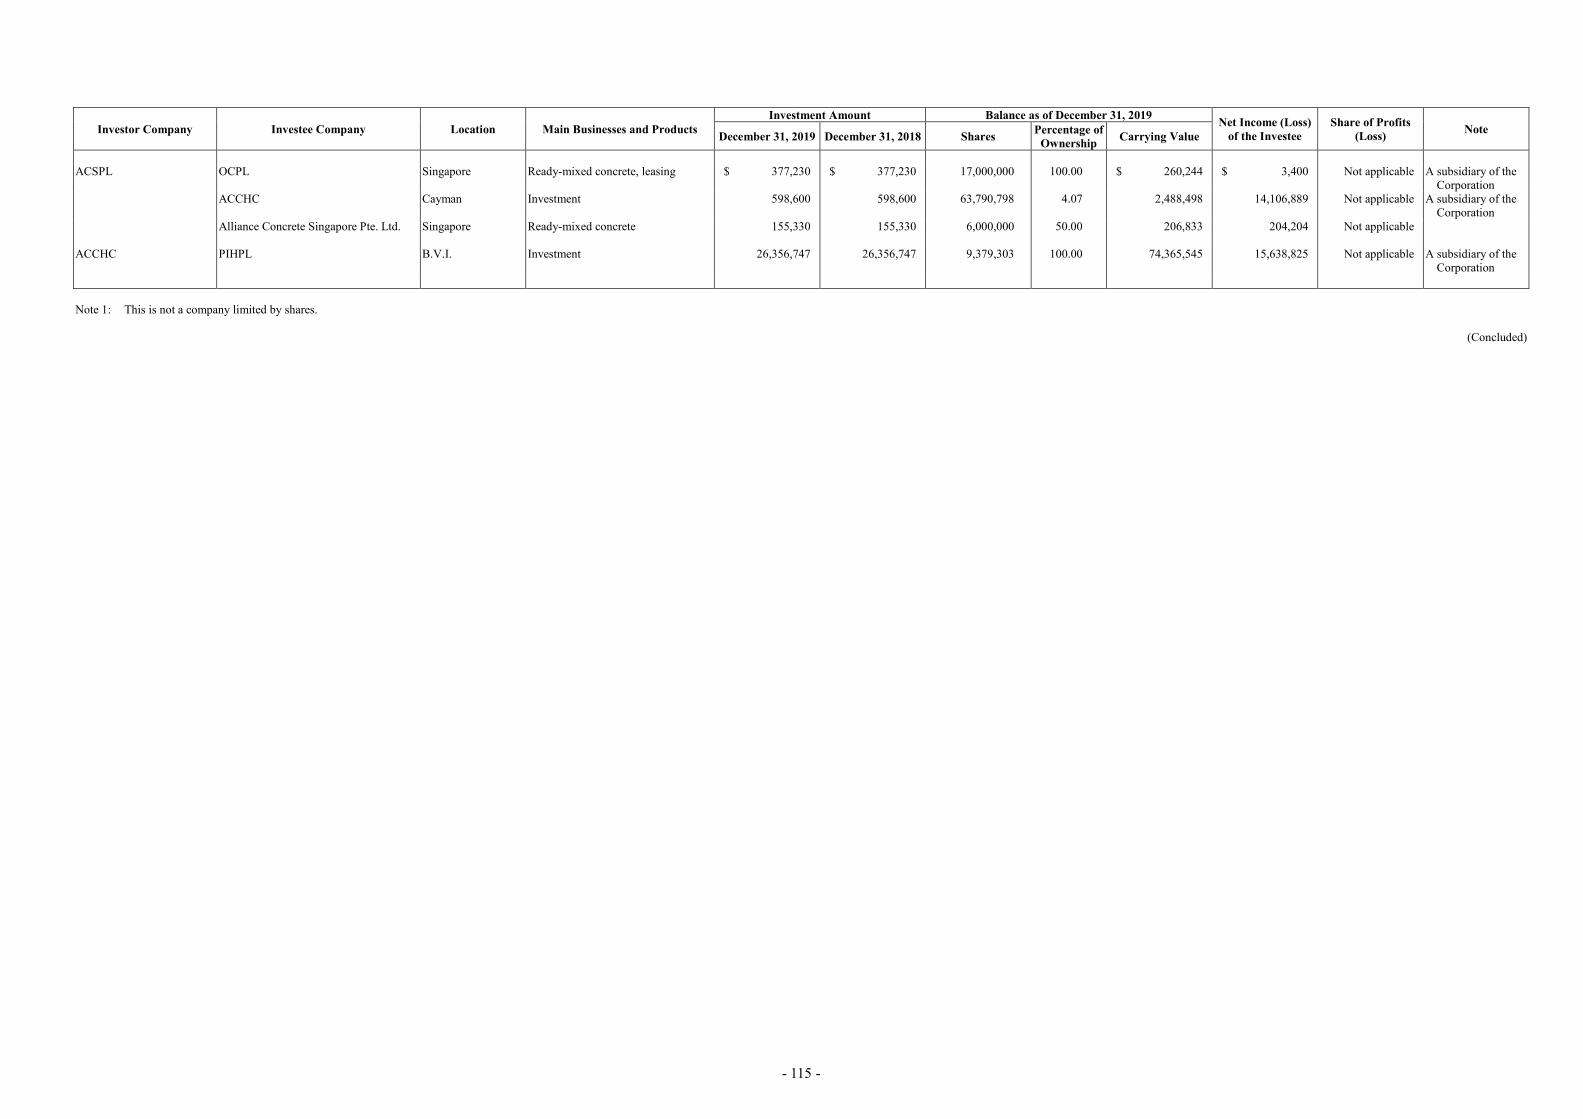
- 115 -
Investor Company Investee Company Location Main Businesses and Products Investment Amount Balance as of December 31, 2019 Net Income (Loss)
of the Investee Share of Profits
(Loss) Note December 31, 2019 December 31, 2018 Shares Percentage of Ownership Carrying Value
ACSPL OCPL Singapore Ready-mixed concrete, leasing $ 377,230
$ 377,230
17,000,000 100.00 $ 260,244
$ 3,400
Not applicable A subsidiary of the Corporation
ACCHC Cayman Investment 598,600
598,600
63,790,798 4.07 2,488,498
14,106,889 Not applicable A subsidiary of the Corporation
Alliance Concrete Singapore Pte. Ltd. Singapore Ready-mixed concrete 155,330 155,330 6,000,000 50.00 206,833 204,204 Not applicable ACCHC PIHPL B.V.I. Investment 26,356,747 26,356,747 9,379,303 100.00 74,365,545 15,638,825 Not applicable A subsidiary of the
Corporation Note 1: This is not a company limited by shares.
(Concluded)

- 116 -
TABLE 8 ASIA CEMENT CORPORATION AND SUBSIDIARIES INVESTMENT IN MAINLAND CHINA YEAR ENDED DECEMBER 31, 2019 (In Thousands of New Taiwan Dollars, Unless Stated Otherwise)
Investee Company Main Businesses and Products Paid-in Capital Method of Investment
(Note 2)
Accumulated Outward Remittance for
Investment from Taiwan as of
January 1, 2019
Remittance of Funds Accumulated Outward Remittance for
Investment from Taiwan as of
December 31, 2019
Net Income (Loss) of the Investee
% Ownership of Direct or
Indirect Investment
Investment Gain (Loss) (Note 1)
Carrying Amount as of December 31, 2019
Accumulated Repatriation of
Investment Income as of December 31, 2019
Outward Inward
SHYLCP It manufactures and sells ready-mixed
concrete and cement - related products US$15,000 (equivalent
to NT$448,950 thousand)
(2) US$11,200 (equivalent to NT$335,216 thousand)
$ - $ - US$11,200 (equivalent to NT$335,216 thousand)
RMB14,271 (equivalent to NT$63,986 thousand)
72.00 RMB10,275 (equivalent to NT$46,070 thousand)
RMB10,405 (equivalent to NT$44,643 thousand)
US$800 (equivalent to NT$23,944 thousand)
JYDC It manufactures and sells cement, clinker
and ready-mixed concrete (including cement - related products).
US$356,104 (equivalent to NT$10,658,193 thousand)
(2) US$93,035 (equivalent to NT$2,784,538 thousand)
RMB(126,758) (equivalent to NT$(543,832) thousand)
- RMB(380,367) (equivalent to NT$(1,631,895) thousand)
US$93,035 (equivalent to NT$2,784,538 thousand)
RMB(507,125) (equivalent to NT$(2,175,727) thousand)
RMB1,488,812 (equivalent to NT$6,675,264 thousand)
68.40 RMB1,018,348 (equivalent to NT$4,565,881 thousand)
RMB4,112,215 (equivalent to NT$17,642,702 thousand)
US$50,781 (equivalent to NT$1,519,875 thousand)
RMB507,125 (equivalent to NT$2,175,727 thousand)
WYDC It manufactures and sells cement, slag
powder and slag cement. US$36,140 (equivalent
to NT$1,081,670 thousand)
(2) US$22,081 (equivalent to NT$660,884 thousand)
RMB(3,533) (equivalent to NT$(15,158) thousand)
- - US$22,081 (equivalent to NT$660,884 thousand)
RMB(3,533) (equivalent to NT$(15,158) thousand)
RMB29,023 (equivalent to NT$130,126 thousand)
72.00 RMB20,896 (equivalent to NT$93,691 thousand)
RMB438,541 (equivalent to NT$1,881,481 thousand)
US$4,469 (equivalent to NT$133,757 thousand)
RMB3,533 (equivalent to NT$15,158 thousand)
SHYFCP It manufactures and sells ready-mixed
concrete and cement - related products - - US$1,270 (equivalent to
NT$38,011 thousand) - - US$1,270 (equivalent to
NT$38,011 thousand) - - - - -
OHC Investment US$130,407 (equivalent
to NT$3,903,082 thousand)
(2) US$54,191 (equivalent to NT$1,621,937 thousand)
- - US$54,191 (equivalent to NT$1,621,937 thousand)
RMB386,044 (equivalent to NT$1,730,872 thousand)
72.00 RMB277,951 (equivalent to NT$1,246,228 thousand)
RMB2,077,855 (equivalent to NT$8,914,653 thousand)
US$809 (equivalent to NT$24,213 thousand)
NYLC It manufactures and sells ready-mixed
concrete and cement - related products RMB60,000 (equivalent
to NT$257,419 thousand)
(2) - - - - RMB(6,553) (equivalent to NT$(29,379) thousand)
68.40 RMB(4,482) (equivalent to NT$(20,096) thousand)
RMB112,989 (equivalent to NT$484,760 thousand)
-
NYDC It manufactures and sells cement, slag
powder and slag cement. RMB90,000 (equivalent
to NT$386,128 thousand)
(2) - - - - RMB15,586 (equivalent to NT$69,883 thousand)
52.20 RMB8,136 (equivalent to NT$36,479 thousand)
RMB88,543 (equivalent to NT$379,876 thousand)
-
SIYDCCL Cement, clinker, slag powder and
ready-mixed concrete (including cement - related products)
US$368,340 (equivalent to NT$11,024,416 thousand)
(2) US$67,585 (equivalent to NT$2,022,819 thousand)
RMB(4,091) (equivalent to NT$(17,552) thousand)
- RMB(136,094) (equivalent to NT$(583,886) thousand)
US$67,585 (equivalent to NT$2,022,819 thousand)
RMB(140,185) (equivalent to NT$(601,438) thousand)
RMB1,264,886 (equivalent to NT$5,671,266 thousand)
72.00 RMB910,718 (equivalent to NT$4,083,312 thousand)
RMB3,773,937 (equivalent to NT$16,191,384 thousand)
US$27,009 (equivalent to NT$808,379 thousand)
RMB140,185 (equivalent to NT$601,438 thousand)
CYCPCL It manufactures and sells ready-mixed
concrete and cement - related products US$4,100 (equivalent to
NT$122,713 thousand)
(2) US$2,023 (equivalent to NT$60,548 thousand)
- - US$2,023 (equivalent to NT$60,548 thousand)
RMB14,136 (equivalent to NT$63,381 thousand)
72.00 RMB10,178 (equivalent to NT$45,634 thousand)
RMB59,238 (equivalent to NT$254,151 thousand)
US$77 (equivalent to NT$2,305 thousand)
JYLTC Transportation RMB12,500 (equivalent
to NT$53,629 thousand)
(2) - - - - RMB6,397 (equivalent to NT$28,680 thousand)
70.12 RMB4,485 (equivalent to NT$20,111 thousand)
RMB25,780 (equivalent to NT$110,602 thousand)
-
(Continued)
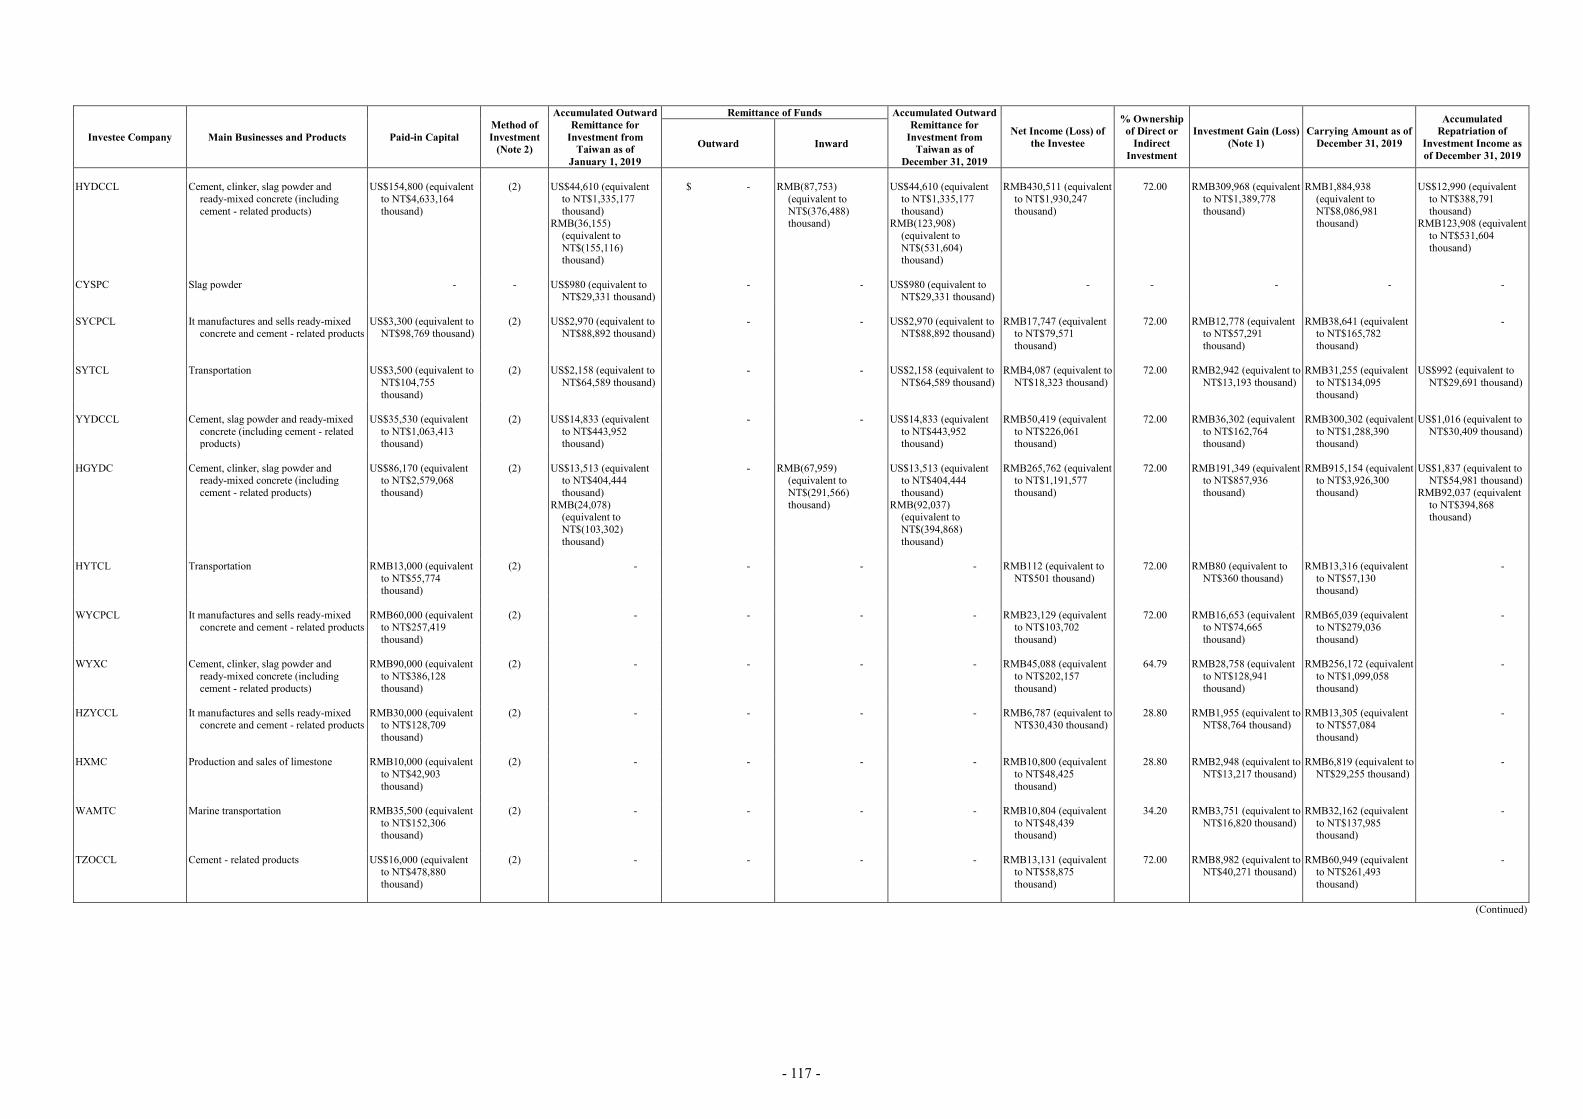
- 117 -
Investee Company Main Businesses and Products Paid-in Capital Method of Investment
(Note 2)
Accumulated Outward Remittance for
Investment from Taiwan as of
January 1, 2019
Remittance of Funds Accumulated Outward Remittance for
Investment from Taiwan as of
December 31, 2019
Net Income (Loss) of the Investee
% Ownership of Direct or
Indirect Investment
Investment Gain (Loss) (Note 1)
Carrying Amount as of December 31, 2019
Accumulated Repatriation of
Investment Income as of December 31, 2019
Outward Inward
HYDCCL Cement, clinker, slag powder and
ready-mixed concrete (including cement - related products)
US$154,800 (equivalent to NT$4,633,164 thousand)
(2) US$44,610 (equivalent to NT$1,335,177 thousand)
RMB(36,155) (equivalent to NT$(155,116) thousand)
$ - RMB(87,753) (equivalent to NT$(376,488) thousand)
US$44,610 (equivalent to NT$1,335,177 thousand)
RMB(123,908) (equivalent to NT$(531,604) thousand)
RMB430,511 (equivalent to NT$1,930,247 thousand)
72.00 RMB309,968 (equivalent to NT$1,389,778 thousand)
RMB1,884,938 (equivalent to NT$8,086,981 thousand)
US$12,990 (equivalent to NT$388,791 thousand)
RMB123,908 (equivalent to NT$531,604 thousand)
CYSPC Slag powder - - US$980 (equivalent to
NT$29,331 thousand) - - US$980 (equivalent to
NT$29,331 thousand) - - - - -
SYCPCL It manufactures and sells ready-mixed
concrete and cement - related products US$3,300 (equivalent to
NT$98,769 thousand) (2) US$2,970 (equivalent to
NT$88,892 thousand) - - US$2,970 (equivalent to
NT$88,892 thousand) RMB17,747 (equivalent
to NT$79,571 thousand)
72.00 RMB12,778 (equivalent to NT$57,291 thousand)
RMB38,641 (equivalent to NT$165,782 thousand)
-
SYTCL Transportation US$3,500 (equivalent to
NT$104,755 thousand)
(2) US$2,158 (equivalent to NT$64,589 thousand)
- - US$2,158 (equivalent to NT$64,589 thousand)
RMB4,087 (equivalent to NT$18,323 thousand)
72.00 RMB2,942 (equivalent to NT$13,193 thousand)
RMB31,255 (equivalent to NT$134,095 thousand)
US$992 (equivalent to NT$29,691 thousand)
YYDCCL Cement, slag powder and ready-mixed
concrete (including cement - related products)
US$35,530 (equivalent to NT$1,063,413 thousand)
(2) US$14,833 (equivalent to NT$443,952 thousand)
- - US$14,833 (equivalent to NT$443,952 thousand)
RMB50,419 (equivalent to NT$226,061 thousand)
72.00 RMB36,302 (equivalent to NT$162,764 thousand)
RMB300,302 (equivalent to NT$1,288,390 thousand)
US$1,016 (equivalent to NT$30,409 thousand)
HGYDC Cement, clinker, slag powder and
ready-mixed concrete (including cement - related products)
US$86,170 (equivalent to NT$2,579,068 thousand)
(2) US$13,513 (equivalent to NT$404,444 thousand)
RMB(24,078) (equivalent to NT$(103,302) thousand)
- RMB(67,959) (equivalent to NT$(291,566) thousand)
US$13,513 (equivalent to NT$404,444 thousand)
RMB(92,037) (equivalent to NT$(394,868) thousand)
RMB265,762 (equivalent to NT$1,191,577 thousand)
72.00 RMB191,349 (equivalent to NT$857,936 thousand)
RMB915,154 (equivalent to NT$3,926,300 thousand)
US$1,837 (equivalent to NT$54,981 thousand)
RMB92,037 (equivalent to NT$394,868 thousand)
HYTCL Transportation RMB13,000 (equivalent
to NT$55,774 thousand)
(2) - - - - RMB112 (equivalent to NT$501 thousand)
72.00 RMB80 (equivalent to NT$360 thousand)
RMB13,316 (equivalent to NT$57,130 thousand)
-
WYCPCL It manufactures and sells ready-mixed
concrete and cement - related products RMB60,000 (equivalent
to NT$257,419 thousand)
(2) - - - - RMB23,129 (equivalent to NT$103,702 thousand)
72.00 RMB16,653 (equivalent to NT$74,665 thousand)
RMB65,039 (equivalent to NT$279,036 thousand)
-
WYXC Cement, clinker, slag powder and
ready-mixed concrete (including cement - related products)
RMB90,000 (equivalent to NT$386,128 thousand)
(2) - - - - RMB45,088 (equivalent to NT$202,157 thousand)
64.79 RMB28,758 (equivalent to NT$128,941 thousand)
RMB256,172 (equivalent to NT$1,099,058 thousand)
-
HZYCCL It manufactures and sells ready-mixed
concrete and cement - related products RMB30,000 (equivalent
to NT$128,709 thousand)
(2) - - - - RMB6,787 (equivalent to NT$30,430 thousand)
28.80 RMB1,955 (equivalent to NT$8,764 thousand)
RMB13,305 (equivalent to NT$57,084 thousand)
-
HXMC Production and sales of limestone RMB10,000 (equivalent
to NT$42,903 thousand)
(2) - - - - RMB10,800 (equivalent to NT$48,425 thousand)
28.80 RMB2,948 (equivalent to NT$13,217 thousand)
RMB6,819 (equivalent to NT$29,255 thousand)
-
WAMTC Marine transportation RMB35,500 (equivalent
to NT$152,306 thousand)
(2) - - - - RMB10,804 (equivalent to NT$48,439 thousand)
34.20 RMB3,751 (equivalent to NT$16,820 thousand)
RMB32,162 (equivalent to NT$137,985 thousand)
-
TZOCCL Cement - related products US$16,000 (equivalent
to NT$478,880 thousand)
(2) - - - - RMB13,131 (equivalent to NT$58,875 thousand)
72.00 RMB8,982 (equivalent to NT$40,271 thousand)
RMB60,949 (equivalent to NT$261,493 thousand)
-
(Continued)
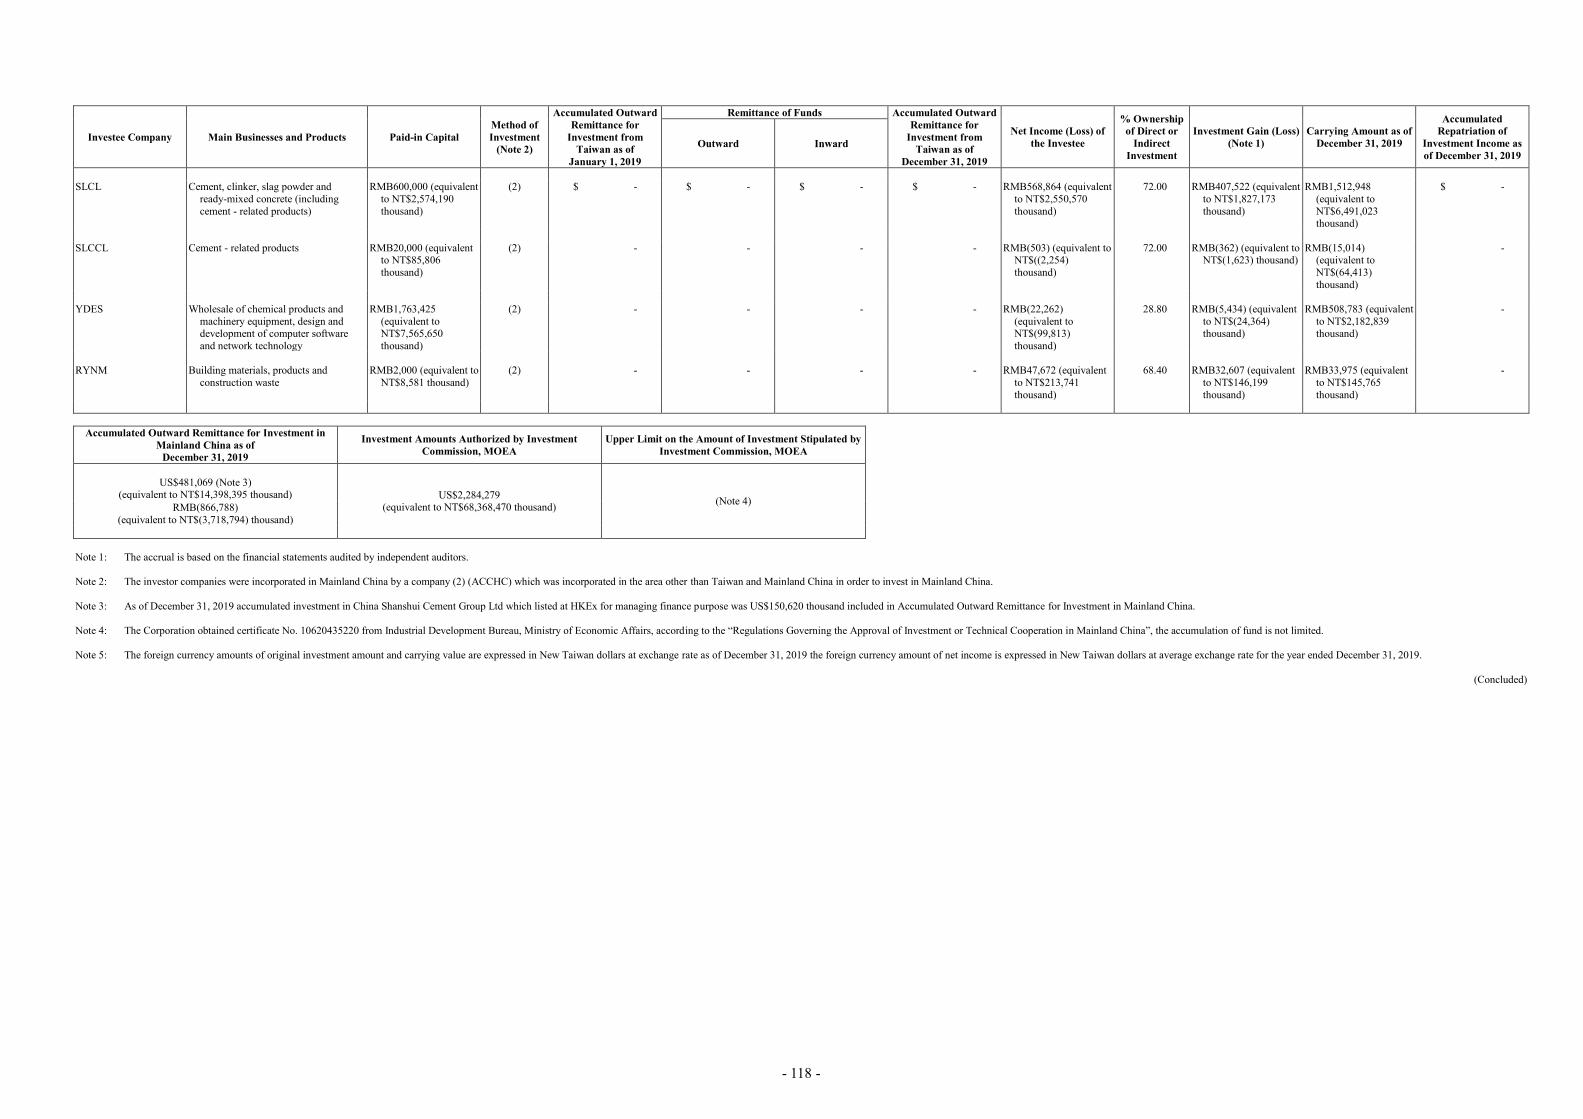
- 118 -
Investee Company Main Businesses and Products Paid-in Capital Method of Investment
(Note 2)
Accumulated Outward Remittance for
Investment from Taiwan as of
January 1, 2019
Remittance of Funds Accumulated Outward Remittance for
Investment from Taiwan as of
December 31, 2019
Net Income (Loss) of the Investee
% Ownership of Direct or
Indirect Investment
Investment Gain (Loss) (Note 1)
Carrying Amount as of December 31, 2019
Accumulated Repatriation of
Investment Income as of December 31, 2019
Outward Inward
SLCL Cement, clinker, slag powder and
ready-mixed concrete (including cement - related products)
RMB600,000 (equivalent to NT$2,574,190 thousand)
(2) $ - $ - $ - $ - RMB568,864 (equivalent to NT$2,550,570 thousand)
72.00 RMB407,522 (equivalent to NT$1,827,173 thousand)
RMB1,512,948 (equivalent to NT$6,491,023 thousand)
$ -
SLCCL Cement - related products RMB20,000 (equivalent
to NT$85,806 thousand)
(2) - - - - RMB(503) (equivalent to NT$((2,254) thousand)
72.00 RMB(362) (equivalent to NT$(1,623) thousand)
RMB(15,014) (equivalent to NT$(64,413) thousand)
-
YDES Wholesale of chemical products and
machinery equipment, design and development of computer software and network technology
RMB1,763,425 (equivalent to NT$7,565,650 thousand)
(2) - - - - RMB(22,262) (equivalent to NT$(99,813) thousand)
28.80 RMB(5,434) (equivalent to NT$(24,364) thousand)
RMB508,783 (equivalent to NT$2,182,839 thousand)
-
RYNM Building materials, products and
construction waste RMB2,000 (equivalent to
NT$8,581 thousand) (2) - - - - RMB47,672 (equivalent
to NT$213,741 thousand)
68.40 RMB32,607 (equivalent to NT$146,199 thousand)
RMB33,975 (equivalent to NT$145,765 thousand)
-
Accumulated Outward Remittance for Investment in Mainland China as of
December 31, 2019
Investment Amounts Authorized by Investment Commission, MOEA
Upper Limit on the Amount of Investment Stipulated by Investment Commission, MOEA
US$481,069 (Note 3)
(equivalent to NT$14,398,395 thousand) US$2,284,279 (equivalent to NT$68,368,470 thousand) (Note 4) RMB(866,788)
(equivalent to NT$(3,718,794) thousand)
Note 1: The accrual is based on the financial statements audited by independent auditors. Note 2: The investor companies were incorporated in Mainland China by a company (2) (ACCHC) which was incorporated in the area other than Taiwan and Mainland China in order to invest in Mainland China. Note 3: As of December 31, 2019 accumulated investment in China Shanshui Cement Group Ltd which listed at HKEx for managing finance purpose was US$150,620 thousand included in Accumulated Outward Remittance for Investment in Mainland China. Note 4: The Corporation obtained certificate No. 10620435220 from Industrial Development Bureau, Ministry of Economic Affairs, according to the “Regulations Governing the Approval of Investment or Technical Cooperation in Mainland China”, the accumulation of fund is not limited. Note 5: The foreign currency amounts of original investment amount and carrying value are expressed in New Taiwan dollars at exchange rate as of December 31, 2019 the foreign currency amount of net income is expressed in New Taiwan dollars at average exchange rate for the year ended December 31, 2019.
(Concluded)

- 119 -
TABLE 9
ASIA CEMENT CORPORATION AND SUBSIDIARIES BUSINESS RELATIONSHIP AND SIGNIFICANT INTERCOMPANY TRANSACTIONS FOR THE YEAR ENDED DECEMBER 31, 2019 (In Thousands of New Taiwan Dollars)
Number Company Name Counterparty Relationship (Note)
Transaction Details % to Total Revenue or Assets Financial Statement Account Amount Transaction Terms
0 The Corporation YTRMC 1 Accounts receivable $ 348,664 Based on regular terms - 1 Sales 1,805,262 Based on regular terms 2 1 Other revenue 12,423 Based on regular terms - ACSPL 1 Guarantee deposits 576,643 Based on regular terms - 1 Accounts receivable 38,621 Based on regular terms - 1 Sales 522,223 Based on regular terms - AIC 1 Other revenue 27,598 Based on regular terms - YSRMC 1 Accounts receivable 34,114 Based on regular terms - 1 Sales 163,476 Based on regular terms - DCI 1 Other revenue 18,189 Based on regular terms - 1 YTRMC YTV 1 Other receivables 33,288 Based on regular terms - 2 AEE The Corporation 2 Accounts receivable 11,087 Based on regular terms - 2 Sales 10,866 Based on regular terms - YLT 3 Sales 30,297 Based on regular terms - NHC 3 Sales 13,552 Based on regular terms - 3 NHC The Corporation 2 Accounts receivable 28,431 Based on regular terms - 2 Sales 151,293 Based on regular terms - 4 YLT The Corporation 2 Accounts receivable 31,883 Based on regular terms - 2 Sales 176,539 Based on regular terms - 5 FMT The Corporation 2 Accounts receivable 14,930 Based on regular terms - 2 Sales 86,230 Based on regular terms - YTRMC 3 Accounts receivable 10,483 Based on regular terms - 3 Sales 49,011 Based on regular terms - NHC 3 Sales 13,766 Based on regular terms - FDT 1 Sales 66,082 Based on regular terms - 1 Other revenue 18,786 Based on regular terms - 6 FDT FMT 2 Other receivables 10,027 Based on regular terms - 2 Sales 67,601 Based on regular terms - YLSS 3 Sales 19,486 Based on regular terms - 7 OC ACCHC 2 Other receivables 193,187 Based on regular terms -
(Continued)

- 120 -
Number Company Name Counterparty Relationship (Note)
Transaction Details % to Total Revenue or Assets Financial Statement Account Amount Transaction Terms
8 SHYLCP JYDC 3 Sales $ 40,950 Based on regular terms - 9 OHC SLCL 3 Other receivables 816,179 Based on regular terms - 3 Interest revenue 41,576 Based on regular terms -
10 SYTCL SYCPCL 3 Sales 20,344 Based on regular terms - SIYDCCL 3 Accounts receivable 11,646 Based on regular terms - 3 Sales 83,829 Based on regular terms - SLCL 3 Accounts receivable 26,438 Based on regular terms - 3 Sales 194,697 Based on regular terms -
11 SIYDCCL SYCPCL 3 Accounts receivable 37,367 Based on regular terms - 3 Sales 123,821 Based on regular terms - SLCL 1 Accounts receivable 31,346 Based on regular terms - 1 Sales 363,433 Based on regular terms - CYCPCL 3 Accounts receivable 16,925 Based on regular terms - 3 Sales 95,363 Based on regular terms -
12 SLCL SYCPCL 3 Accounts receivable 96,972 Based on regular terms - 3 Sales 104,895 Based on regular terms - SIYDCCL 2 Sales 29,403 Based on regular terms - SLCCL 2 Other receivables 171,827 Based on regular terms - 1 Other receivables 141,757 Based on regular terms -
13 CYCPCL SYCPCL 3 Accounts receivable 50,241 Based on regular terms - 3 Sales 62,680 Based on regular terms - SIYDCCL 3 Sales 12,150 Based on regular terms - SLCL 3 Sales 21,489 Based on regular terms -
14 JYLTC JYDC 2 Accounts receivable 62,673 Based on regular terms - 2 Sales 233,332 Based on regular terms - NYDC 3 Accounts receivable 30,867 Based on regular terms - 3 Sales 85,317 Based on regular terms - HGYDC 3 Sales 32,807 Based on regular terms -
15 JYDC The Corporation 2 Sales 67,211 Based on regular terms - SHYLCP 3 Other receivables 193,553 Based on regular terms - SIYDCCL 3 Other receivables 13,482 Based on regular terms - 3 Other revenue 23,793 Based on regular terms - SLCL 3 Other revenue 11,308 Based on regular terms - ACCHC 2 Other receivables 3,014,013 Based on regular terms 1 2 Interest revenue 11,278 Based on regular terms - WYDC 3 Accounts receivable 162,610 Based on regular terms - 3 Sales 952,682 Based on regular terms 1 NYLC 1 Accounts receivable 27,901 Based on regular terms - 1 Sales 149,911 Based on regular terms -
(Continued)

- 121 -
Number Company Name Counterparty Relationship (Note)
Transaction Details % to Total Revenue or Assets Financial Statement Account Amount Transaction Terms
NYDC 1 Accounts receivable $ 69,869 Based on regular terms - 1 Sales 413,400 Based on regular terms - TZOCCL 3 Accounts receivable 149,616 Based on regular terms - 3 Other receivables 301,665 Based on regular terms - 3 Sales 1,078,874 Based on regular terms 1 3 Interest revenue 15,618 Based on regular terms - YYDCCL 3 Accounts receivable 136,281 Based on regular terms - 3 Sales 2,476,837 Based on regular terms 3 HYDCCL 3 Accounts receivable 52,787 Based on regular terms - 3 Sales 222,443 Based on regular terms - RYNM 3 Sales 104,764 Based on regular terms -
16 WYCPCL HYDCCL 3 Sales 28,540 Based on regular terms -
17 WYDC SLCL 3 Interest revenue 12,408 Based on regular terms - SYCPCL 3 Other receivables 171,827 Based on regular terms -
18 WYXC WYDC 3 Accounts receivable 28,367 Based on regular terms - 3 Sales 39,374 Based on regular terms -
19 NYLC JYDC 2 Accounts receivable 10,616 Based on regular terms - 2 Sales 129,021 Based on regular terms -
20 NYDC JYDC 2 Accounts receivable 196,087 Based on regular terms - 2 Sales 1,319,721 Based on regular terms 1
21 YYDCCL TZOCCL 3 Sales 133,883 Based on regular terms -
22 HYTCL WYDC 3 Sales 14,271 Based on regular terms - HYDCCL 2 Accounts receivable 10,066 Based on regular terms - 2 Sales 53,369 Based on regular terms -
23 HYDCCL SIYDCCL 3 Accounts receivable 10,992 Based on regular terms - 3 Sales 61,346 Based on regular terms - SLCL 3 Accounts receivable 10,430 Based on regular terms - 3 Sales 64,074 Based on regular terms - 3 Interest revenue 11,324 Based on regular terms - JYDC 3 Sales 86,603 Based on regular terms - ACCHC 2 Other receivables 1,732,944 Based on regular terms - 2 Interest revenue 16,581 Based on regular terms - WYCPCL 3 Accounts receivable 60,428 Based on regular terms - 3 Sales 200,144 Based on regular terms - WYDC 3 Sales 115,249 Based on regular terms - 3 Other revenue 10,371 Based on regular terms - WYXC 1 Sales 20,284 Based on regular terms - HGYDC 3 Sales 12,487 Based on regular terms -
(Continued)

- 122 -
Number Company Name Counterparty Relationship (Note)
Transaction Details % to Total Revenue or Assets Financial Statement Account Amount Transaction Terms
24 HGYDC JYDC 3 Accounts receivable $ 31,619 Based on regular terms - 3 Sales 111,553 Based on regular terms - WYCPCL 3 Sales 21,367 Based on regular terms - WYXC 3 Sales 17,064 Based on regular terms - HYDCCL 3 Accounts receivable 41,434 Based on regular terms - 3 Sales 388,690 Based on regular terms - YYDCCL 3 Sales 42,056 Based on regular terms -
25 RYNM JYDC 2 Prepayment for purchases 73,317 Based on regular terms - YYDCCL 3 Accounts receivable 10,092 Based on regular terms - 3 Sales 23,773 Based on regular terms - HYDCCL 3 Accounts receivable 21,613 Based on regular terms - 3 Sales 22,584 Based on regular terms -
26 AOG AOC 1 Long-term lease receivable 10,118 Based on regular terms - 1 Accounts receivable 23,835 Based on regular terms -
Note: 1. Parent to subsidiary.
2. Subsidiary to parent. 3. Between subsidiaries.
(Concluded)

Asia Cement Corporation Financial Statements for the Years Ended December 31, 2019 and 2018 and Independent Auditors’ Report
- 1 -
INDEPENDENT AUDITORS’ REPORT The Board of Directors and Shareholders Asia Cement Corporation Opinion We have audited the accompanying financial statements of Asia Cement Corporation (the “Corporation”), which comprise the balance sheets as of December 31, 2019 and 2018, and the statements of comprehensive income, changes in equity and cash flows for the years then ended, and the notes to the financial statements, including a summary of significant accounting policies (collectively referred to as the “financial statements”). In our opinion, based on our audits and the reports of other auditors (refer to Other Matter section), the accompanying financial statements present fairly, in all material respects, the financial position of the Corporation as of December 31, 2019 and 2018, and its financial performance and its cash flows for the years then ended in accordance with the Regulations Governing the Preparation of Financial Reports by Securities Issuers. Basis for Opinion We conducted our audits in accordance with the Regulations Governing Auditing and Attestation of Financial Statements by Certified Public Accountants and auditing standards generally accepted in the Republic of China. Our responsibilities under those standards are further described in the Auditors’ Responsibilities for the Audit of the Financial Statements section of our report. We are independent of the Corporation in accordance with The Norm of Professional Ethics for Certified Public Accountant of the Republic of China, and we have fulfilled our other ethical responsibilities in accordance with these requirements. We believe that the audit evidence we have obtained is sufficient and appropriate to provide a basis for our opinion. Key Audit Matters Key audit matters are those matters that, in our professional judgment, were of most significance in our audit of the financial statements for the year ended December 31, 2019. These matters were addressed in the context of our audit of the financial statements as a whole, and in forming our opinion thereon, and we do not provide a separate opinion on these matters. The key audit matters identified in the Corporation’s financial statements for the year ended December 31, 2019 are stated as follows: Estimated Impairment of Trade Receivables of Subsidiaries The estimated provision for impairment of trade receivables is based on the assumptions of defaults and expected loss rates. The assumptions and selection of inputs for impairment calculation are based on the historical experience, existing market conditions as well as forward looking estimates of the Corporation’s subsidiaries. When the actual future cash flows are less than expected, a material impairment loss may arise. Because key assumptions and inputs used for measuring expected credit losses on trade receivables involve significant judgments and uncertainties, we considered the estimated impairment of trade receivables as one of the key audit matters.
- 2 -
The corresponding audit procedures that we performed for the estimated impairment of trade receivables of the subsidiaries are as follows: 1. We obtained an understanding of the internal control procedures with respect to management’s allowance
for impairment loss of trade receivables. 2. We evaluated the reasonableness of allowance for impairment loss by testing the aging of trade receivables
and by quantifying the potential risk of trade receivables that were overdue at the balance sheet date. 3. We tested the recoverability of the trade receivables by vouching cash receipts after the balance sheet date. 4. For the estimated impairment of accounts receivable, we evaluated the adequacy of management’s
provision for impairment based on customers’ past default experience, current financial position, any collateral pledged, existing market conditions as well as forward looking estimates.
Fair Value Measurement of Investment Properties The Corporation’s and its subsidiaries’ investment properties are subsequently measured using the fair value model and valued by an independent qualified professional appraiser, a member of the ROC certified real estate appraisers, refer to Notes 5 and 15 to the financial statements. Because the valuation of investment properties involves significant judgments and uncertainties, we considered the fair value measurement of investment properties as one of the key audit matters. The corresponding audit procedures that we performed for the fair value measurement of investment properties are as follows: 1. We assessed the professional competence and independence of the appraiser engaged by management and
we obtained an understanding of the appraiser’s scope of work and process of engagement to confirm that no circumstances affect the appraiser’s independence and limit the scope of his work.
2. We obtained an understanding of and assessed the reasonableness of management’s assumptions and
methods used in the valuation. 3. We sample-tested items from management’s supporting documents, which include the effective gross
income, expenses, and property rights of land and buildings to verify the valuation process used by management and recalculated the fair value of investment properties to assess the reasonableness of management’s calculation.
Other Matter The financial statements of China Shanshui Cement Group Limited (CSCGL), an associate accounted for using equity method, were audited by other auditors as of December 31, 2019 and 2018. Our opinion, insofar as it relates to the amounts included in the accompanying financial statements for CSCGL, is based solely on the reports of other auditors. As of December 31, 2019 and 2018, the aggregate carrying value of the equity-method investments in CSCGL was NT$12,022,105 thousand and NT$10,215,045 thousand, respectively, representing 6% and 5%, respectively, of the total assets. For the years ended December 31, 2019 and 2018, the share of profit or loss of CSCGL was NT$2,211,060 thousand and NT$376,472 thousand, respectively, representing 12% and 3%, respectively, of the profit before income tax Responsibilities of Management and Those Charged with Governance for the Financial Statements Management is responsible for the preparation and fair presentation of the financial statements in accordance with the Regulations Governing the Preparation of Financial Reports by Securities Issuers and for such internal control as management determines is necessary to enable the preparation of financial statements that are free from material misstatement, whether due to fraud or error.

- 3 -
In preparing the financial statements, management is responsible for assessing the Corporation’s ability to continue as a going concern, disclosing, as applicable, matters related to going concern and using the going concern basis of accounting unless management either intends to liquidate the Corporation or to cease operations, or has no realistic alternative but to do so. Those charged with governance, including the audit committee, are responsible for overseeing the Corporation’s financial reporting process. Auditors’ Responsibilities for the Audit of the Financial Statements Our objectives are to obtain reasonable assurance about whether the financial statements as a whole are free from material misstatement, whether due to fraud or error, and to issue an auditors’ report that includes our opinion. Reasonable assurance is a high level of assurance, but is not a guarantee that an audit conducted in accordance with the auditing standards generally accepted in the Republic of China will always detect a material misstatement when it exists. Misstatements can arise from fraud or error and are considered material if, individually or in the aggregate, they could reasonably be expected to influence the economic decisions of users taken on the basis of these financial statements. As part of an audit in accordance with the auditing standards generally accepted in the Republic of China, we exercise professional judgment and maintain professional skepticism throughout the audit. We also: 1. Identify and assess the risks of material misstatement of the financial statements, whether due to fraud or
error, design and perform audit procedures responsive to those risks, and obtain audit evidence that is sufficient and appropriate to provide a basis for our opinion. The risk of not detecting a material misstatement resulting from fraud is higher than for one resulting from error, as fraud may involve collusion, forgery, intentional omissions, misrepresentations, or the override of internal control.
2. Obtain an understanding of internal control relevant to the audit in order to design audit procedures that are
appropriate in the circumstances, but not for the purpose of expressing an opinion on the effectiveness of the Corporation’s internal control.
3. Evaluate the appropriateness of accounting policies used and the reasonableness of accounting estimates
and related disclosures made by management. 4. Conclude on the appropriateness of management’s use of the going concern basis of accounting and, based
on the audit evidence obtained, whether a material uncertainty exists related to events or conditions that may cast significant doubt on the Corporation’s ability to continue as a going concern. If we conclude that a material uncertainty exists, we are required to draw attention in our auditors’ report to the related disclosures in the financial statements or, if such disclosures are inadequate, to modify our opinion. Our conclusions are based on the audit evidence obtained up to the date of our auditors’ report. However, future events or conditions may cause the Corporation to cease to continue as a going concern.
5. Evaluate the overall presentation, structure and content of the financial statements, including the disclosures,
and whether the financial statements represent the underlying transactions and events in a manner that achieves fair presentation.
6. Obtain sufficient and appropriate audit evidence regarding the financial information of entities or business
activities within the Corporation to express an opinion on the financial statements. We are responsible for the direction, supervision, and performance of the company audit. We remain solely responsible for our audit opinion.
We communicate with those charged with governance regarding, among other matters, the planned scope and timing of the audit and significant audit findings, including any significant deficiencies in internal control that we identify during our audit.

- 4 -
We also provide those charged with governance with a statement that we have complied with relevant ethical requirements regarding independence, and to communicate with them all relationships and other matters that may reasonably be thought to bear on our independence, and where applicable, related safeguards. From the matters communicated with those charged with governance, we determine those matters that were of most significance in the audit of the financial statements for the year ended December 31, 2019 and are therefore the key audit matters. We describe these matters in our auditors’ report unless law or regulation precludes public disclosure about the matter or when, in extremely rare circumstances, we determine that a matter should not be communicated in our report because the adverse consequences of doing so would reasonably be expected to outweigh the public interest benefits of such communication. The engagement partners on the audit resulting in this independent auditors’ report are Tai, Xin Wei and Fan, Yu Wei. Deloitte & Touche Taipei, Taiwan Republic of China March 25, 2020
Notice to Readers The accompanying financial statements are intended only to present the financial position, financial performance and cash flows in accordance with accounting principles and practices generally accepted in the Republic of China and not those of any other jurisdictions. The standards, procedures and practices to audit such financial statements are those generally applied in the Republic of China. For the convenience of readers, the independent auditors’ report and the accompanying financial statements have been translated into English from the original Chinese version prepared and used in the Republic of China. If there is any conflict between the English version and the original Chinese version or any difference in the interpretation of the two versions, the Chinese-language independent auditors’ report and financial statements shall prevail.

- 5 -
ASIA CEMENT CORPORATION BALANCE SHEETS DECEMBER 31, 2019 AND 2018 (In Thousands of New Taiwan Dollars) 2019 2018 ASSETS Amount % Amount % CURRENT ASSETS
Cash and cash equivalents (Notes 6 and 30) $ 2,475,739 1 $ 3,165,795 2 Financial assets at fair value through profit or loss - current (Note 7) 1,690,528 1 1,172,826 1 Financial assets at fair value through other comprehensive income - current (Notes 8 and 31) 2,237,578 1 2,371,026 1 Financial assets at amortized cost (Notes 6, 11 and 30) 1,763,189 1 462,275 - Notes receivable
Third parties 80,634 - 95,212 - Trade receivables
Third parties (Note 10) 513,070 - 474,070 - Related parties (Notes 10 and 30) 447,234 - 520,982 -
Other receivables (Note 30) 75,865 - 29,495 - Current tax assets (Note 26) - - 9,022 - Inventories (Note 11) 1,545,309 1 1,663,395 1 Prepayments (Note 17) 45,581 - 188,456 - Other current assets 6,234 - 12,125 -
Total current assets 10,880,961 5 10,164,679 5
NON-CURRENT ASSETS
Investments accounted for using equity method (Notes 12 and 31) 135,143,849 67 125,632,890 65 Financial assets at fair value through other comprehensive income - non-current (Note 8) 6,588,692 3 5,386,142 3 Property, plant and equipment (Notes 13 and 31) 4,234,288 2 4,374,050 2 Right-of-use assets (Note 14) 441,661 - - - Investment properties (Notes 15, 30 and 31) 42,114,210 21 41,689,694 22 Intangible assets (Note 16) 4,957 - 8,344 - Deferred tax assets (Note 26) 16,463 - 12,603 - Long-term prepayments for leases (Note 17) - - 369,801 - Other non-current assets (Notes 18, 22 and 30) 4,515,418 2 5,192,895 3
Total non-current assets 193,059,538 95 182,666,419 95
TOTAL $ 203,940,499 100 $ 192,831,098 100 LIABILITIES AND EQUITY CURRENT LIABILITIES
Short-term bills payable (Note 19) $ 10,757,906 5 $ 11,437,104 6 Financial liabilities at fair value through profit or loss - current (Note 7) 112,070 - 268,218 - Contract liabilities - current (Note 24) 83,726 - 40,661 - Accounts payable and accrued expenses
Third parties 1,478,744 1 1,415,215 1 Related parties (Note 30) 201,804 - 188,104 -
Dividends and bonuses payable 224,335 - 214,593 - Current tax liabilities (Note 26) 298,368 - 8,477 - Lease liabilities - current (Note 14) 40,370 - - - Deferred revenue - current (Note 21) 75,912 - 75,912 - Current portion of long-term liabilities (Note 20) 3,000,000 2 4,000,000 2
Total current liabilities 16,273,235 8 17,648,284 9
NON-CURRENT LIABILITIES
Bonds payable (Note 20) 19,280,807 9 12,192,567 6 Long-term borrowings (Note 20) 11,795,000 6 15,025,011 8 Provisions - non-current (Note 23) 98,000 - 98,000 - Deferred tax liabilities (Note 26) 9,503,629 5 9,020,630 5 Lease liabilities - non-current (Note 14) 44,787 - - - Deferred revenue - non-current (Note 21) 847,893 - 923,805 - Other non-current liabilities 29,790 - 30,575 -
Total non-current liabilities 41,599,906 20 37,290,588 19
Total liabilities 57,873,141 28 54,938,872 28
EQUITY (Notes 23)
Ordinary shares 33,614,472 17 33,614,472 17 Capital surplus 1,456,054 1 1,362,554 1 Retained earnings
Legal reserve 16,727,089 8 15,615,380 8 Special reserve 64,463,426 32 63,945,145 33 Unappropriated earnings 27,373,840 13 20,358,461 11
Total retained earnings 108,564,355 53 99,918,986 52 Other equity 2,432,477 1 2,996,214 2
Total equity 146,067,358 72 137,892,226 72
TOTAL $ 203,940,499 100 $ 192,831,098 100 The accompanying notes are an integral part of the financial statements. (With Deloitte & Touche auditors’ report dated March 25, 2020)
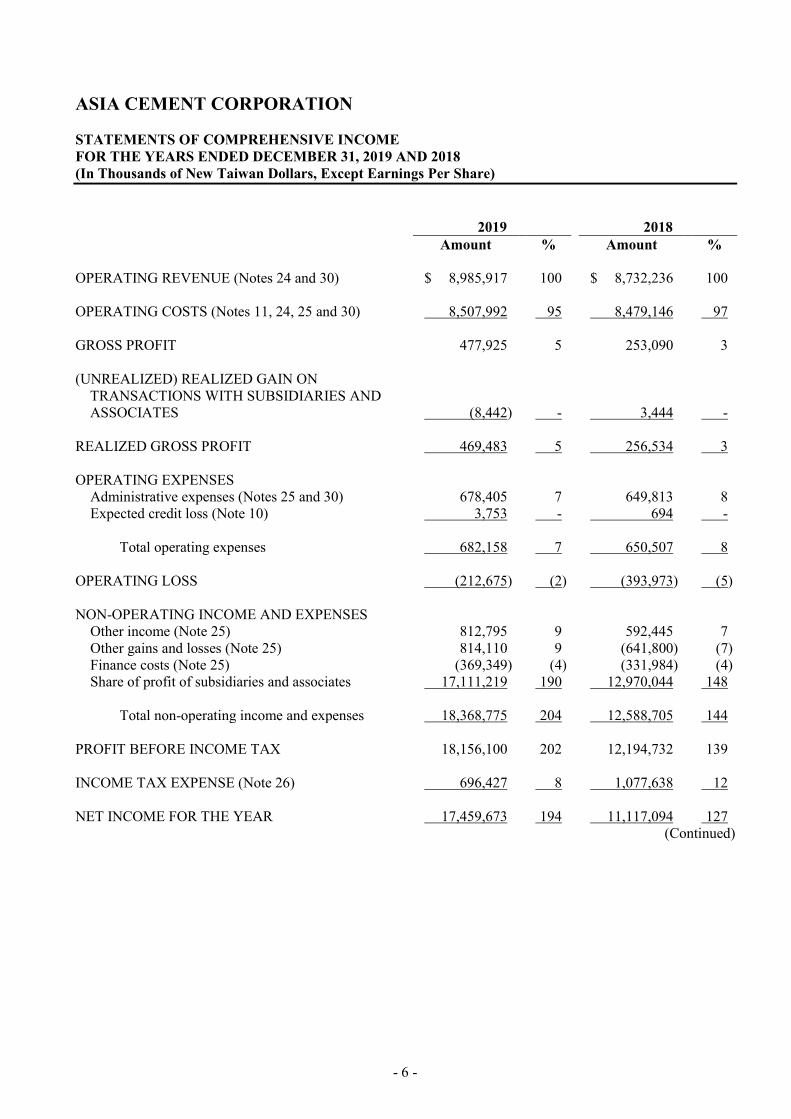
- 6 -
ASIA CEMENT CORPORATION STATEMENTS OF COMPREHENSIVE INCOME FOR THE YEARS ENDED DECEMBER 31, 2019 AND 2018 (In Thousands of New Taiwan Dollars, Except Earnings Per Share) 2019 2018 Amount % Amount % OPERATING REVENUE (Notes 24 and 30) $ 8,985,917 100 $ 8,732,236 100 OPERATING COSTS (Notes 11, 24, 25 and 30) 8,507,992 95 8,479,146 97 GROSS PROFIT 477,925 5 253,090 3 (UNREALIZED) REALIZED GAIN ON
TRANSACTIONS WITH SUBSIDIARIES AND ASSOCIATES (8,442) - 3,444 -
REALIZED GROSS PROFIT 469,483 5 256,534 3 OPERATING EXPENSES
Administrative expenses (Notes 25 and 30) 678,405 7 649,813 8 Expected credit loss (Note 10) 3,753 - 694 -
Total operating expenses 682,158 7 650,507 8
OPERATING LOSS (212,675) (2) (393,973) (5) NON-OPERATING INCOME AND EXPENSES
Other income (Note 25) 812,795 9 592,445 7 Other gains and losses (Note 25) 814,110 9 (641,800) (7) Finance costs (Note 25) (369,349) (4) (331,984) (4) Share of profit of subsidiaries and associates 17,111,219 190 12,970,044 148
Total non-operating income and expenses 18,368,775 204 12,588,705 144
PROFIT BEFORE INCOME TAX 18,156,100 202 12,194,732 139 INCOME TAX EXPENSE (Note 26) 696,427 8 1,077,638 12 NET INCOME FOR THE YEAR 17,459,673 194 11,117,094 127
(Continued)

- 7 -
ASIA CEMENT CORPORATION STATEMENTS OF COMPREHENSIVE INCOME FOR THE YEARS ENDED DECEMBER 31, 2019 AND 2018 (In Thousands of New Taiwan Dollars, Except Earnings Per Share) 2019 2018 Amount % Amount % OTHER COMPREHENSIVE INCOME, NET
Items that will not be reclassified subsequently to profit or loss: Unrealized gain (loss) on investments in equity
instruments at fair value through other comprehensive income $ 329,435 4 $ (9) -
Remeasurement of defined benefit plans 467,246 5 265,965 3 Share of other comprehensive (loss) income of
subsidiaries and associates 2,650,225 29 1,426,545 17 3,446,906 38 1,692,501 20
Items that may be reclassified subsequently to profit or loss: Share of other comprehensive (loss) income of
subsidiaries and associates (3,254,043) (36) 1,758 -
Other comprehensive income for the year, net of income tax 192,863 2 1,694,259 20
TOTAL COMPREHENSIVE INCOME FOR THE
YEAR $ 17,652,536 196 $ 12,811,353 147 EARNINGS PER SHARE (Note 27)
Basic $ 5.56 $ 3.54 Diluted $ 5.25 $ 3.49
The accompanying notes are an integral part of the financial statements. (With Deloitte & Touche auditors’ report dated March 25, 2020) (Concluded)

- 8 -
ASIA CEMENT CORPORATION STATEMENTS OF CHANGES IN EQUITY FOR THE YEARS ENDED DECEMBER 31, 2019 AND 2018 (In Thousands of New Taiwan Dollars)
Other Equity
Exchange Differences on Translating the
Unrealized Gain (Loss) on
Financial Assets Financial at Fair Value Retained Earnings Statements of Through Other Gains on Share Capital Issued Unappropriated Foreign Comprehensive Property Cash Flow Shares Amount Capital Surplus Legal Reserve Special Reserve Earnings Operations Income Revaluation Hedge Total Total Equity
BALANCE AT JANUARY 1, 2018 3,361,447 $ 33,614,472 $ 1,168,692 $ 15,068,480 $ 63,001,957 $ 17,839,296 $ (2,638,153 ) $ 516,962 $ 307,728 $ 58,485 $ (1,754,978 ) $ 128,937,919 Appropriation of 2017 earnings
Legal reserve - - - 546,900 - (546,900 ) - - - - - - Special reserve - - - - 943,188 (943,188 ) - - - - - - Cash dividends - $1.2 per share - - - - - (4,033,736 ) - - - - - (4,033,736 )
Equity component of convertible bonds issued by the Corporation - - 185,411 - - - - - - - - 185,411 Changes in capital surplus from investments in subsidiaries and associates
accounted for using equity method - - 8,451 - - - - - - - - 8,451 Net profit for the year ended December 31, 2018 - - - - - 11,117,094 - - - - - 11,117,094 Other comprehensive income (loss) for the year ended December 31, 2018,
net of income tax - - - - - 351,764 (3,211 ) 1,343,257 - 2,449 1,342,495 1,694,259 Disposal of investments in equity instruments designated as at fair value
through other comprehensive income - - - - - (3,408,697 ) - 3,408,697 - - 3,408,697 - Other changes in equity from investments in subsidiaries and associates
accounted for using equity method - - - - - (17,172 ) - - - - - (17,172 ) BALANCE AT DECEMBER 31, 2018 3,361,447 33,614,472 1,362,554 15,615,380 63,945,145 20,358,461 (2,641,364 ) 5,268,916 307,728 60,934 2,996,214 137,892,226 Effect of retrospective application and retrospective restatement - - - - - (143,100 ) - - - - - (143,100 ) BALANCE AT JANUARY 1, 2019 AS RESTATED 3,361,447 33,614,472 1,362,554 15,615,380 63,945,145 20,215,361 (2,641,364 ) 5,268,916 307,728 60,934 2,996,214 137,749,126 Appropriation of 2018 earnings
Legal reserve - - - 1,111,709 - (1,111,709 ) - - - - - - Special reserve - - - - 518,281 (518,281 ) - - - - - - Cash dividends - $2.8 per share - - - - - (9,412,052 ) - - - - - (9,412,052 )
Changes in capital surplus from investments in subsidiaries and associates
accounted for using equity method - - 93,500 - - - - - - - - 93,500 Net profit for the year ended December 31, 2019 - - - - - 17,459,673 - - - - - 17,459,673 Other comprehensive income (loss) for the year ended December 31, 2019,
net of income tax - - - - - 676,889 (3,271,837 ) 2,719,118 77,486 (8,793 ) (484,026 ) 192,863 Disposal of investments in equity instruments designated as at fair value
through other comprehensive income by associates - - - - - 79,711 - (79,711 ) - - (79,711 ) - Other changes in equity from investments in subsidiaries and associates
accounted for using equity method - - - - - (15,752 ) - - - - - (15,752 ) BALANCE AT DECEMBER 31, 2019 3,361,447 $ 33,614,472 $ 1,456,054 $ 16,727,089 $ 64,463,426 $ 27,373,840 $ (5,913,201 ) $ 7,908,323 $ 385,214 $ 52,141 $ 2,432,477 $ 146,067,358 The accompanying notes are an integral part of the financial statements. (With Deloitte & Touche auditors’ report dated March 25, 2020)

- 9 -
ASIA CEMENT CORPORATION STATEMENTS OF CASH FLOWS FOR THE YEARS ENDED DECEMBER 31, 2019 AND 2018 (In Thousands of New Taiwan Dollars) 2019 2018 CASH FLOWS FROM OPERATING ACTIVITIES
Income before income tax $ 18,156,100 $ 12,194,732 Adjustments for:
Share of profit of subsidiaries and associates (17,111,219) (12,970,044) Net gain on fair value changes of financial assets and liabilities
designated as at fair value through profit or loss (673,850) (171,737) Depreciation expenses 523,626 464,781 Dividend income (422,860) (405,773) (Gain) loss on changes in fair value of investment properties (399,682) 331,211 Finance costs 369,349 331,984 Interest income (299,327) (114,003) Unrealized loss on foreign exchange 143,442 44,425 Unrealized (realized) gain on transactions with subsidiaries and
associates 8,442 (3,444) Expected credit loss recognized on trade receivables 3,753 694 Amortization expenses 3,589 3,297 Gain on disposal of property, plant and equipment (40) (4,053) Write-downs of inventories - 52,791 Effect of changes in exchange rate of bonds payable - 300
Changes in operating assets and liabilities: Notes receivable 14,578 7,091 Trade receivables 27,930 (238,962) Other receivables (35,221) 1,322 Inventories 67,546 (396,116) Prepayments 107,544 (52,997) Other current assets 5,891 (3,798) Net defined benefit assets (48,810) (37,657) Contract liabilities 43,065 (9,040) Accounts payable and accrued expenses 57,642 189,552 Provisions - 48,000 Deferred revenue (75,912) (68,085)
Cash generated from (used in) operations 465,576 (805,529) Interest received 288,178 112,952 Dividend received 7,345,508 4,296,112 Interest paid (257,528) (336,387) Income tax paid (35,186) (11,234)
Net cash generated from operating activities 7,806,548 3,255,914
CASH FLOWS FROM INVESTING ACTIVITIES
Purchase of financial assets at amortized cost (1,365,160) - Increase (decrease) in refundable deposits 679,526 (33,377) Payments for property, plant and equipment (183,122) (194,754) Purchase of financial assets at fair value through other comprehensive
income (123,395) - (Continued)
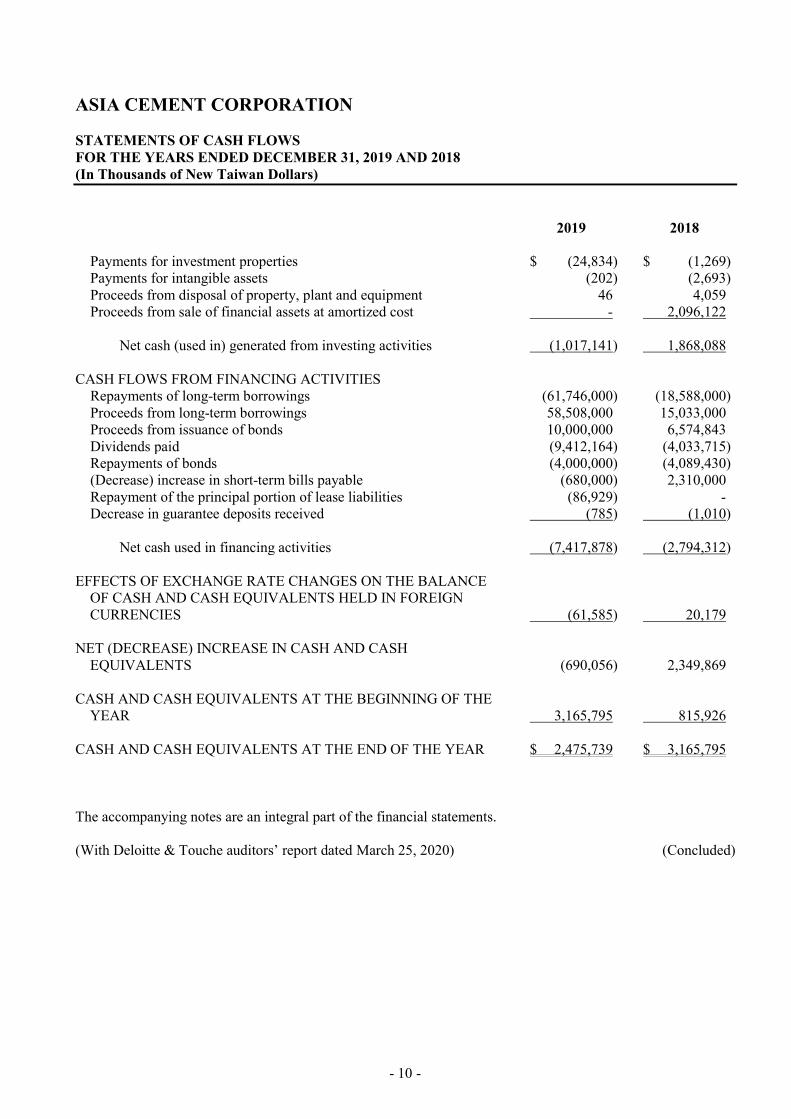
- 10 -
ASIA CEMENT CORPORATION STATEMENTS OF CASH FLOWS FOR THE YEARS ENDED DECEMBER 31, 2019 AND 2018 (In Thousands of New Taiwan Dollars) 2019 2018
Payments for investment properties $ (24,834) $ (1,269) Payments for intangible assets (202) (2,693) Proceeds from disposal of property, plant and equipment 46 4,059 Proceeds from sale of financial assets at amortized cost - 2,096,122
Net cash (used in) generated from investing activities (1,017,141) 1,868,088
CASH FLOWS FROM FINANCING ACTIVITIES
Repayments of long-term borrowings (61,746,000) (18,588,000) Proceeds from long-term borrowings 58,508,000 15,033,000 Proceeds from issuance of bonds 10,000,000 6,574,843 Dividends paid (9,412,164) (4,033,715) Repayments of bonds (4,000,000) (4,089,430) (Decrease) increase in short-term bills payable (680,000) 2,310,000 Repayment of the principal portion of lease liabilities (86,929) - Decrease in guarantee deposits received (785) (1,010)
Net cash used in financing activities (7,417,878) (2,794,312)
EFFECTS OF EXCHANGE RATE CHANGES ON THE BALANCE
OF CASH AND CASH EQUIVALENTS HELD IN FOREIGN CURRENCIES (61,585) 20,179
NET (DECREASE) INCREASE IN CASH AND CASH
EQUIVALENTS (690,056) 2,349,869 CASH AND CASH EQUIVALENTS AT THE BEGINNING OF THE
YEAR 3,165,795 815,926 CASH AND CASH EQUIVALENTS AT THE END OF THE YEAR $ 2,475,739 $ 3,165,795 The accompanying notes are an integral part of the financial statements. (With Deloitte & Touche auditors’ report dated March 25, 2020) (Concluded)

- 11 -
ASIA CEMENT CORPORATION NOTES TO FINANCIAL STATEMENTS FOR THE YEARS ENDED DECEMBER 31, 2019 AND 2018 (In Thousands of New Taiwan Dollars, Unless Stated Otherwise) 1. ORGANIZATION AND OPERATIONS
Asia Cement Corporation (the “Corporation”) was incorporated in March 1957. It manufactures and sells cement, clinker, cement-related products and ready-mixed concrete, and engages in leasing activities. The Corporation is also required to undertake reforestation activities in designated areas. The Corporation’s stock have been listed on the Taiwan Stock Exchange since June 1962. In June 1992 and September 1996, certain shares of the Corporation were sold by Far Eastern New Century Corporation (FENC) in the form of global depositary shares (GDSs). Such GDSs have been quoted through the SEAQ system of the London Stock Exchange and traded through the portal system of the National Association of Securities Dealers, Inc. As of December 31, 2019, the issued and outstanding GDSs aggregated 17,049 units, representing 170,487 shares of the Corporation. The financial statements are presented in the Corporation’s functional currency, New Taiwan dollar.
2. APPROVAL OF FINANCIAL STATEMENTS The financial statements were approved by the Corporation’s board of directors and authorized for issue on March 25, 2020.
3. APPLICATION OF NEW, AMENDED AND REVISED STANDARDS AND INTERPRETATIONS a. Initial application of the amendments to the Regulations Governing the Preparation of Financial Reports
by Securities Issuers and the International Financial Reporting Standards (IFRS), International Accounting Standards (IAS), IFRIC Interpretations (IFRIC), and SIC Interpretations (SIC) (collectively, the “IFRSs”) endorsed and issued into effect by the Financial Supervisory Commission (FSC) Except for the following, the initial application of the amendments to the Regulations Governing the Preparation of Financial Reports by Securities Issuers and the IFRSs endorsed and issued into effect by the FSC did not have any material impact on the Corporation’s accounting policies: IFRS 16 “Leases”
IFRS 16 provides a comprehensive model for the identification of lease arrangements and their treatment in the financial statements of both lessee and lessor. It supersedes IAS 17 “Leases”, IFRIC 4 “Determining whether an Arrangement contains a Lease”, and a number of related interpretations. Refer to Note 4 for information relating to the relevant accounting policies. Definition of a lease The Corporation elects to apply the guidance of IFRS 16 in determining whether contracts are, or contain, a lease only to contracts entered into (or changed) on or after January 1, 2019. Contracts identified as containing a lease under IAS 17 and IFRIC 4 are not reassessed and are accounted for in accordance with the transitional provisions under IFRS 16.

- 12 -
The Corporation as lessee The Corporation recognizes right-of-use assets and lease liabilities for all leases on the balance sheets except for those whose payments under low-value asset and short-term leases are recognized as expenses on a straight-line basis. On the statements of comprehensive income, the Corporation presents the depreciation expense charged on right-of-use assets separately from the interest expense accrued on lease liabilities; interest is computed using the effective interest method. On the statements of cash flows, cash payments for the principal portion of lease liabilities are classified within financing activities; cash payments for the interest portion are classified within operating activities. Prior to the application of IFRS 16, payments under operating lease contracts were recognized as expenses on a straight-line basis. Cash flows for operating leases were classified within operating activities on the statements of cash flows. The Corporation elects to apply IFRS 16 retrospectively with the cumulative effect of the initial application of this standard recognized in retained earnings on January 1, 2019. Comparative information is not restated. Lease liabilities were recognized on January 1, 2019 for leases previously classified as operating leases under IAS 17. Lease liabilities were measured at the present value of the remaining lease payments, discounted using the lessee’s incremental borrowing rate on January 1, 2019. Right-of-use assets are measured at an amount equal to the lease liabilities, adjusted by the amount of any prepaid or accrued lease payments. The Corporation applies IAS 36 to all right-of-use assets. The Corporation also applies the following practical expedients: 1) The Corporation applies a single discount rate to a portfolio of leases with reasonably similar
characteristics to measure lease liabilities. 2) The Corporation accounts for those leases for which the lease term ends on or before
December 31, 2019 as short-term leases. 3) The Corporation uses hindsight, such as in determining lease terms, to measure lease liabilities. For leases previously classified as finance leases under IAS 17, the carrying amounts of right-of-use assets and lease liabilities on January 1, 2019 are determined as at the carrying amounts of the respective leased assets and finance lease payables on December 31, 2018. The lessee’s weighted average incremental borrowing rate applied to lease liabilities recognized on January 1, 2019 is 1.3%. The difference between the lease liabilities recognized and operating lease commitments disclosed under IAS 17 on December 31, 2018 is explained as follows: The future minimum lease payments of non-cancellable operating lease
commitments on December 31, 2018 $ 270,318 Less: Recognition exemption for short-term leases and low-value asset leases (89,632) Undiscounted amounts on January 1, 2019 $ 180,686 Lease liabilities recognized on January 1, 2019 $ 176,204 The Corporation as lessor The Corporation does not make any adjustments for leases in which it is a lessor, and it accounts for those leases with the application of IFRS 16 starting from January 1, 2019.
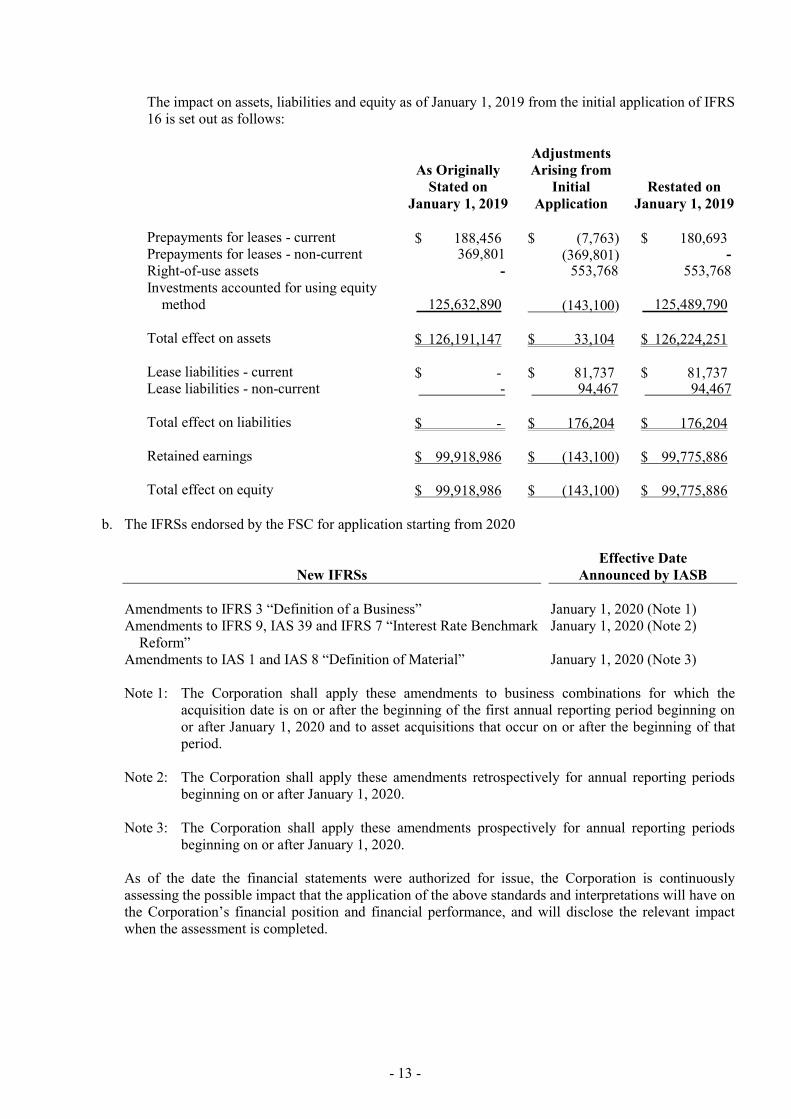
- 13 -
The impact on assets, liabilities and equity as of January 1, 2019 from the initial application of IFRS 16 is set out as follows:
As Originally Stated on
January 1, 2019
Adjustments Arising from
Initial Application
Restated on January 1, 2019
Prepayments for leases - current $ 188,456 $ (7,763) $ 180,693 Prepayments for leases - non-current 369,801 (369,801) - Right-of-use assets - 553,768 553,768 Investments accounted for using equity
method 125,632,890 (143,100) 125,489,790 Total effect on assets $ 126,191,147 $ 33,104 $ 126,224,251 Lease liabilities - current $ - $ 81,737 $ 81,737 Lease liabilities - non-current - 94,467 94,467 Total effect on liabilities $ - $ 176,204 $ 176,204 Retained earnings $ 99,918,986 $ (143,100) $ 99,775,886 Total effect on equity $ 99,918,986 $ (143,100) $ 99,775,886
b. The IFRSs endorsed by the FSC for application starting from 2020
New IFRSs Effective Date
Announced by IASB Amendments to IFRS 3 “Definition of a Business” January 1, 2020 (Note 1) Amendments to IFRS 9, IAS 39 and IFRS 7 “Interest Rate Benchmark
Reform” January 1, 2020 (Note 2)
Amendments to IAS 1 and IAS 8 “Definition of Material” January 1, 2020 (Note 3) Note 1: The Corporation shall apply these amendments to business combinations for which the
acquisition date is on or after the beginning of the first annual reporting period beginning on or after January 1, 2020 and to asset acquisitions that occur on or after the beginning of that period.
Note 2: The Corporation shall apply these amendments retrospectively for annual reporting periods
beginning on or after January 1, 2020. Note 3: The Corporation shall apply these amendments prospectively for annual reporting periods
beginning on or after January 1, 2020. As of the date the financial statements were authorized for issue, the Corporation is continuously assessing the possible impact that the application of the above standards and interpretations will have on the Corporation’s financial position and financial performance, and will disclose the relevant impact when the assessment is completed.
- 14 -
c. New IFRSs in issue but not yet endorsed and issued into effect by the FSC
New IFRSs Effective Date
Announced by IASB (Note) Amendments to IFRS 10 and IAS 28 “Sale or Contribution of Assets
between an Investor and its Associate or Joint Venture” To be determined by IASB
IFRS 17 “Insurance Contracts” January 1, 2021 Amendments to IAS 1 “Classification of Liabilities as Current or
Non-current” January 1, 2022
Note: Unless stated otherwise, the above New IFRSs are effective for annual reporting periods
beginning on or after their respective effective dates.
As of the date the financial statements were authorized for issue, the Corporation is continuously assessing the possible impact that the application of above standards and interpretations will have on the Corporation’s financial position and financial performance, and will disclose the relevant impact when the assessment is completed.
4. SUMMARY OF SIGNIFICANT ACCOUNTING POLICIES
a. Statement of compliance
The parent company only financial statements have been prepared in accordance with the Regulations Governing the Preparation of Financial Reports by Securities Issuers.
b. Basis of preparation
The parent company only financial statements have been prepared on the historical cost basis except for financial instruments, investment properties which are measured at fair value and net defined benefit assets which are measured at the present value of the defined benefit obligation less the fair value of plan assets. The fair value measurements, which are grouped into Levels 1 to 3 based on the degree to which the fair value measurement inputs are observable and based on the significance of the inputs to the fair value measurement in its entirety, are described as follows: 1) Level 1 inputs are quoted prices (unadjusted) in active markets for identical assets or liabilities; 2) Level 2 inputs are inputs other than quoted prices included within Level 1 that are observable for an
asset or liability, either directly (i.e., as prices) or indirectly (i.e., derived from prices); and 3) Level 3 inputs are unobservable inputs for an asset or liability. When preparing its parent company only financial statements, the Corporation used equity method to account for its investment in subsidiaries and associates. In order for the amounts of the net profit for the year, other comprehensive income for the year and total equity in the parent company only financial statements to be the same with the amounts attributable to the owner of the Corporation in its consolidated financial statements, adjustments arising from the differences in accounting treatment between parent company only basis and consolidated basis were made to investments accounted for using equity method, share of profit or loss of subsidiaries and associates, share of other comprehensive income or loss of subsidiaries and associates and related equity items, as appropriate, in the parent company only financial statements.
- 15 -
The properties were leased out to subsidiaries for their operation, and are classified as property plant and equipment in consolidated financial statements. Under IFRSs, these properties are classified as investment properties in parent company only financial statements. In 2014, the subsequent measurement of investment properties were changed from cost less accumulated depreciation model to fair value model. In order for the amounts of the net profit for the year and total equity in the parent company only financial statements to be the same with the amounts attributable to the owners of the Corporation in its consolidated financial statements, the investment properties leased out to entities were measured at fair value model with the decrease in total equity and net profit for the year recorded in “investments accounted for using equity method” and “share of profit or loss of subsidiaries and associates”.
Classification of Current and Non-current Assets and Liabilities Current assets include: a. Assets held primarily for the purpose of trading; b. Assets expected to be realized within twelve months after the reporting period; and c. Cash and cash equivalents unless the asset is restricted from being exchanged or used to settle a liability
for at least twelve months after the reporting period. Current liabilities include: a. Liabilities held primarily for the purpose of trading; b. Liabilities due to be settled within 12 months after the reporting period, even if an agreement to
refinance, or to reschedule payments, on a long-term basis is completed after the reporting period and before the parent company only financial statements are authorized for issue; and
c. Liabilities for which the Corporation does not have an unconditional right to defer settlement for at least
12 months after the reporting period. Terms of a liability that could, at the option of the counterparty, result in its settlement by the issue of equity instruments do not affect its classification.
Assets and liabilities that are not classified as current are classified as non-current. Foreign Currencies In preparing the parent company only financial statements, transactions in currencies other than the Corporation’s functional currency (i.e., foreign currencies) are recognized at the rates of exchange prevailing at the dates of the transactions. At the end of each reporting period, monetary items denominated in foreign currencies are retranslated at the rates prevailing at that date. Exchange differences on monetary items arising from settlement or translation are recognized in profit or loss in the period in which they arise. Non-monetary items measured at fair value that are denominated in foreign currencies are retranslated at the rates prevailing at the date when the fair value was determined. Exchange differences arising from the retranslation of non-monetary items are included in profit or loss for the period except for exchange differences arising from the retranslation of non-monetary items in respect of which gains and losses are recognized directly in other comprehensive income, in which cases, the exchange differences are also recognized directly in other comprehensive income. Non-monetary items that are measured at historical cost in a foreign currency are translated using the exchange rate at the date of the transaction.

- 16 -
For the purpose of presenting parent company only financial statements, the assets and liabilities of the Corporation’s foreign operations (including subsidiaries and associates in other countries that use currencies which are different from the currency of the Corporation) are translated into the presentation currency, the New Taiwan dollar, as follows: Assets and liabilities are translated at the exchange rates prevailing at the end of the reporting period; and income and expense items are translated at the average exchange rates for the period. The resulting currency translation differences are recognized in other comprehensive income. Inventories Inventories consist of raw materials, supplies, finished goods and work-in-process and are stated at the lower of cost or net realizable value. Inventory write-downs are made by item, except where it may be appropriate to group similar or related items. The net realizable value is the estimated selling price of inventories less all estimated costs of completion and costs necessary to make the sale. Inventories are recorded at weighted-average cost on the balance sheet date. Investment in Subsidiaries The Corporation uses the equity method to account for its investments in subsidiaries. A subsidiary is an entity that is controlled by the Corporation. Under the equity method, an investment in a subsidiary is initially recognized at cost and adjusted thereafter to recognize the Corporation’s share of profit or loss and other comprehensive income (loss) of the subsidiary. The Corporation also recognizes the changes in the Corporation’s share of equity of subsidiaries. Changes in the Corporation’s ownership interest in a subsidiary that do not result in the Corporation losing control of the subsidiary are equity transactions. The Corporation recognizes directly in equity any difference between the carrying amount of the investment and the fair value of the consideration paid or received. Any excess of the cost of acquisition over the Corporation’s share of net fair value of the identifiable assets and liabilities of a subsidiary at the date of acquisition is recognized as goodwill, which is included within the carrying amount of the investment and is not amortized. Any excess of the Corporation’s share of net fair value of the identifiable assets and liabilities over the cost of acquisition is recognized immediately in profit or loss. The Corporation assesses its investment for any impairment by comparing the carrying amount with the estimated recoverable amount as assessed based on the entire financial statements of the invested company. Impairment loss is recognized when the carrying amount exceeds the recoverable amount. If the recoverable amount of the investment subsequently increases, the Corporation recognizes the reversal of the impairment loss; the adjusted post-reversal carrying amount should not exceed the carrying amount that would have been recognized (net of amortization or depreciation) had no impairment loss been recognized in prior years. An impairment loss recognized on goodwill cannot be reversed in a subsequent period. When the Corporation loses control of a subsidiary, it recognizes the investment retained in the former subsidiary at its fair value at the date when control is lost. The difference between the fair value of the retained investment plus any consideration received and the carrying amount of the previous investment at the date when control is lost is recognized as a gain or loss in profit or loss. Besides, the Corporation accounts for all amounts previously recognized in other comprehensive income in relation to that subsidiary on the same basis as would be required if the Corporation had directly disposed of the related assets or liabilities.
- 17 -
Profits or losses resulting from downstream transactions are eliminated in full only in the parent company only financial statements. Profits and losses resulting from upstream transactions and transactions between subsidiaries are recognized only in the parent company only financial statements only to the extent of interests in the subsidiaries that are not related to the Corporation. Investment in Associates An associate is an entity over which the Corporation has significant influence and which is neither a subsidiary nor an interest in a joint venture. The Corporation uses the equity method to account for its investments in associates. Under the equity method, investments in an associate are initially recognized at cost and adjusted thereafter to recognize the Corporation’s share of profit or loss and other comprehensive income of the associate. The Corporation also recognizes the changes in the Corporation’s share of equity of associates. Any excess of the cost of acquisition over the Corporation’s share of net fair value of the identifiable assets and liabilities of an associate at the date of acquisition is recognized as goodwill, which is included within the carrying amount of the investment and is not amortized. Any excess of the Corporation’s share of net fair value of the identifiable assets and liabilities over the cost of acquisition, after reassessment, is recognized immediately in profit or loss. When the Corporation subscribes for additional new shares of an associate at a percentage different from its existing ownership percentage, the resulting carrying amount of the investment differs from the amount of the Corporation’s proportionate interest in the associate. The Corporation records such a difference as an adjustment to investments with the corresponding amount charged or credited to capital surplus - changes in capital surplus from investments in associates accounted for using equity method. If the Corporation’s ownership interest is reduced due to its additional subscription of the new shares of the associate, the proportionate amount of the gains or losses previously recognized in other comprehensive income in relation to that associate is reclassified to profit or loss on the same basis as would be required if the investee had directly disposed of the related assets or liabilities. When the adjustment should be debited to capital surplus, but the capital surplus recognized from investments accounted for using equity method is insufficient, the shortage is debited to retained earnings. The entire carrying amount of an investment (including goodwill) is tested for impairment as a single asset by comparing its recoverable amount with its carrying amount. Any impairment loss recognized is deducted from the carrying amount of the investment. Any reversal of that impairment loss is recognized to the extent that the recoverable amount of the investment subsequently increases. When the Corporation transacts with its associate, profits and losses resulting from the transactions with the associate are recognized in the parent company only financial statements only to the extent of unrelated parties’ interests in the associate. The Corporation’s share of comprehensive income of associates is recognized using the treasury stock method if there are reciprocal holdings between investors and investees. The reciprocally held shares of the Corporation are treated as treasury stocks and are deducted from the outstanding shares in computing basic earnings per share. Property, Plant and Equipment Property, plant and equipment are stated at cost, less accumulated depreciation and accumulated impairment loss. Major renewals and betterments are capitalized, while maintenance and repairs are expensed currently.
- 18 -
Properties in the course of construction are depreciated and classified to the appropriate categories of property, plant and equipment when completed and ready for intended use. Depreciation is recognized using the fixed-percentage-on-declining-balance method or the straight-line method. Each significant part is depreciated separately. The estimated useful lives, residual values and depreciation methods are reviewed at the end of each reporting period, with the effect of any changes in estimate accounted for on a prospective basis. On derecognition of an item of property, plant and equipment, the difference between the sales proceeds and the carrying amount of the asset is recognized in profit or loss. Investment Properties Investment properties are properties held to earn rentals and/or for capital appreciation. Investment properties also include land held for a currently undetermined future use. Freehold investment properties are initially measured at cost, including transaction costs, and are subsequently measured using the fair value model. Changes in the fair value of investment properties are included in profit or loss for the period in which they arise. For a transfer from property, plant and equipment to investment property at the end of owner-occupation, any difference between the fair value and the carrying amount of the property at the date of transfer is recognized in other comprehensive income. On derecognition of an investment property, the difference between the net disposal proceeds and the carrying amount of the asset is included in profit or loss. Intangible Assets Intangible assets with finite useful lives that are acquired separately are initially measured at cost and subsequently measured at cost less accumulated amortization and accumulated impairment loss. Amortization is recognized on a straight-line basis. The estimated useful life, residual value, and amortization method are reviewed at the end of each reporting period, with the effect of any changes in estimate accounted for on a prospective basis. On derecognition of an intangible asset, the difference between the net disposal proceeds and the carrying amount of the asset is recognized in profit or loss. Impairment of Tangible and Intangible Assets At the end of each reporting period, the Corporation reviews the carrying amounts of its tangible and intangible assets to determine whether there is any indication that those assets have suffered any impairment loss. If any such indication exists, the recoverable amount of the asset is estimated in order to determine the extent of the impairment loss. When it is not possible to estimate the recoverable amount of an individual asset, the Corporation estimates the recoverable amount of the cash-generating unit to which the asset belongs. Corporate assets are allocated to the smallest group of cash-generating units on a reasonable and consistent basis of allocation. The recoverable amount is the higher of fair value less costs to sell and value in use. If the recoverable amount of an asset or cash-generating unit is estimated to be less than its carrying amount, the carrying amount of the asset or cash-generating unit is reduced to its recoverable amount, with the resulting impairment loss recognized in profit or loss.

- 19 -
When an impairment loss is subsequently reversed, the carrying amount of the corresponding asset or cash-generating unit is increased to the revised estimate of its recoverable amount, but only to the extent of the carrying amount that would have been determined had no impairment loss been recognized on the asset or cash-generating unit in prior years. A reversal of an impairment loss is recognized in profit or loss. Financial Instruments Financial assets and financial liabilities are recognized when the Corporation becomes a party to the contractual provisions of the instruments. Financial assets and financial liabilities are initially measured at fair value. Transaction costs that are directly attributable to an acquisition or issuance of financial assets and financial liabilities (other than financial assets and financial liabilities at fair value through profit or loss) are added to or deducted from the fair value of the financial assets or financial liabilities, as appropriate, on initial recognition. Transaction costs directly attributable to the acquisition of financial assets or financial liabilities at fair value through profit or loss are recognized immediately in profit or loss. Financial assets All regular way purchases or sales of financial assets are recognized and derecognized on a trade date basis. a. Measurement category
Financial assets are classified into the following categories: Financial assets at FVTPL, financial assets at amortized cost, and investments in equity instruments at FVTOCI. 1) Financial assets at FVTPL
Financial asset is classified as at FVTPL when the financial asset is mandatorily classified as at FVTPL. Financial assets mandatorily classified as at FVTPL include investments in equity instruments which are not designated as at FVTOCI and debt instruments that do not meet the amortized cost criteria or the FVTOCI criteria. Financial assets at FVTPL are subsequently measured at fair value, with any gains or losses arising on remeasurement recognized in profit or loss. The net gain or loss recognized in profit or loss does not incorporate any dividend or interest earned on the financial asset. Fair value is determined in the manner described in Note 29.
2) Financial assets at amortized cost Financial assets that meet the following conditions are subsequently measured at amortized cost: a) The financial asset is held within a business model whose objective is to hold financial asset in
order to collect contractual cash flows; and b) The contractual terms of the financial asset give rise on specified dates to cash flows that are
solely payments of principal and interest on the principal amount outstanding. Subsequent to initial recognition, financial assets at amortized cost, including cash and cash equivalents, trade receivables, other receivables and debt instruments at amortized cost, are measured at amortized cost, which is the gross carrying amount determined by the effective interest method less any impairment loss. Exchange differences are recognized in profit or loss. Interest income is calculated by applying the effective interest rate to the gross carrying amount of the financial asset.
- 20 -
Cash equivalents include time deposits, bonds sold under repurchase agreements and commercial papers with original maturities within 3 months from the date of acquisition, which are highly liquid, readily convertible to a known amount of cash and are subject to an insignificant risk of changes in value. These cash equivalents are held for the purpose of meeting short-term cash commitments.
3) Investments in equity instruments at FVTOCI
On initial recognition, the Corporation may make an irrevocable election to designate investments in equity instruments as at FVTOCI. Designation at FVTOCI is not permitted if the equity investment is held for trading or if it is contingent consideration recognized by an acquirer in a business combination. Investments in equity instruments at FVTOCI are subsequently measured at fair value with gains and losses arising from changes in fair value recognized in other comprehensive income and accumulated in other equity. The cumulative gain or loss will not be reclassified to profit or loss on disposal of the equity investments, instead, they will be transferred to retained earnings. Dividends on these investments in equity instruments are recognized in profit or loss when the Corporation’s right to receive the dividends is established, unless the dividends clearly represent a recovery of part of the cost of the investment.
b. Impairment of financial assets The Corporation recognizes a loss allowance for expected credit losses (ECLs) on financial assets at amortized cost (including trade receivables) as well as finance lease receivables at the end of each reporting period. The Corporation always recognizes lifetime ECLs for trade receivables. For all other financial instruments and finance lease receivables, the Corporation recognizes lifetime ECLs when there has been a significant increase in credit risk since initial recognition. If, on the other hand, the credit risk on the financial instrument has not increased significantly since initial recognition, the Corporation measures the loss allowance for that financial instrument at an amount equal to 12-month ECLs. ECLs reflect the weighted average of credit losses with the respective risks of default occurring as the weights. Lifetime ECLs represent the expected credit losses that will result from all possible default events over the expected life of a financial instrument. In contrast, 12-month ECLs represent the portion of lifetime ECLs that is expected to result from default events on a financial instrument that are possible within 12 months after the reporting date. Impairment loss on all financial instruments is recognized with a corresponding adjustment to their carrying amount through a loss allowance account.
c. Derecognition of financial assets The Corporation derecognizes a financial asset only when the contractual rights to the cash flows from the asset expire, or when it transfers the financial asset and substantially all the risks and rewards of ownership of the asset to another party. On derecognition of a financial asset at amortized cost in its entirety, the difference between the asset’s carrying amount and the sum of the consideration received and receivable is recognized in profit or loss. On derecognition of an investment in an equity instrument at FVTOCI, the cumulative gain or loss which had been recognized in other comprehensive income is transferred directly to retained earnings, without recycling through profit or loss.

- 21 -
Financial liabilities a. Subsequent measurement
Except the following situation, all financial liabilities are measured at amortized cost using the effective interest method: Financial liabilities are held for trading and are stated at fair value, with any gain or loss arising on remeasurement recognized in profit or loss and any interest paid on such liabilities is recognized in finance costs. The net gain or loss recognized in profit or loss does not incorporate any interest or dividends paid on the financial liability. Fair value is determined in the manner described in Note 29.
b. Derecognition of financial liabilities The difference between the carrying amount of the financial liability derecognized and the consideration paid, including any non-cash assets transferred or liabilities assumed, is recognized in profit or loss.
Convertible bonds The component parts of convertible bonds issued by the Corporation are classified separately as financial liabilities and equity in accordance with the substance of the contractual arrangements and the definitions of a financial liability and an equity instrument. On initial recognition, the fair value of the liability component is estimated using the prevailing market interest rate for similar non-convertible instruments. This amount is recorded as a liability on an amortized cost basis using the effective interest method until extinguished upon conversion or upon the instrument’s maturity date. Any embedded derivative liability is measured at fair value. The conversion option classified as equity is determined by deducting the amount of the liability component from the fair value of the compound instrument as a whole. This is recognized and included in equity, net of income tax effects, and is not subsequently remeasured. In addition, the conversion option classified as equity will remain in equity until the conversion option is exercised; in which case, the balance recognized in equity will be transferred to capital surplus - share premiums. When the conversion option remains unexercised at maturity, the balance recognized in equity will be transferred to capital surplus - share premiums. Transaction costs that relate to the issuance of the convertible notes are allocated to the liability and equity components in proportion to the allocation of the gross proceeds. Transaction costs relating to the liability component are included in the carrying amount of the liability component. Transaction costs relating to the equity component are recognized directly in equity. Derivative financial instruments The Corporation enters into cross-currency swap contracts to manage its exposure to interest rate and foreign exchange rate risks. Derivatives are initially recognized at fair value at the date the derivative contracts are entered into and are subsequently remeasured to their fair value at the end of each reporting period. The resulting gain or loss is recognized in profit or loss immediately. When the fair value of a derivative financial instrument is positive, the derivative is recognized as a financial asset; when the fair value of a derivative financial instrument is negative, the derivative is recognized as a financial liability.

- 22 -
Derivatives embedded in hybrid contracts that contain financial asset hosts that is within the scope of IFRS 9 are not separated; instead, the classification is determined in accordance with the entire hybrid contract. Derivatives embedded in non-derivative host contracts that are not financial assets that is within the scope of IFRS 9 (e.g. financial liabilities) are treated as separate derivatives when they meet the definition of a derivative; their risks and characteristics are not closely related to those of the host contracts; and the mixed contracts are not measured at FVTPL. Provisions Provisions are measured at the best estimate of the consideration required to settle the present obligation at the end of the reporting period, taking into account the risks and uncertainties surrounding the obligation. When a provision is measured using the cash flows estimated to settle the present obligation, its carrying amount is the present value of those cash flows Revenue Recognition The Corporation identifies the contract with the customers, identifies the performance obligations in the contract, allocates the transaction price to the performance obligations, and recognizes revenue when performance obligations are satisfied. When another party is involved in providing goods or services to a customer, the Corporation is a principal if it controls the specified good or service before that good or service is transferred to a customer; otherwise, the Corporation is acting as an agent. The principal recognizes revenues and costs associated with providing the goods or services at the gross amount, while an agent recognizes revenue at the net amount. When a specified good or service is a distinct good or service, the Corporation determines whether it is a principal or an agent for each specified good or service. The Corporation is a principal if it obtains control of any one of the following: a. Before the good or another asset transfers to the customer, the Corporation acquire the good or the
control of asset from another party. b. The right to a service to be performed by another party which gives the Corporation the ability to direct
that party to provide the service to the customer on its behalf. c. A good or service from another party that it then combines with other goods or services in providing a
specified good or service to the customer. Indicators to support the Corporation’s assessment of whether it controls a specified good or service include, but are not limited to, the following: a. The Corporation is primarily responsible for fulfilling the promise to provide the specified good or
service. b. The Corporation has inventory risk before or after the specified good or service is transferred to the
customer. c. The Corporation has discretion in establishing the price of the specified good or service. Leases 2019 At the inception of a contract, the Corporation assesses whether the contract is, or contains, a lease.
- 23 -
For a contract that contains a lease component and non-lease components, the Corporation allocates the consideration in the contract to each component on the basis of the relative stand-alone price and accounts for each component separately. a. The Corporation as lessor
Leases are classified as finance leases whenever the terms of a lease transfer substantially all the risks and rewards of ownership to the lessee. All other leases are classified as operating leases. Under finance leases, the lease payments comprise fixed payments, variable lease payments which depend on an index or a rate, and residual value guarantees. The net investment in a lease is measured at (a) the present value of the sum of the lease payments receivable by a lessor and any unguaranteed residual value accrued to the lessor plus (b) initial direct costs and is presented as a finance lease receivable. Finance lease income is allocated to the relevant accounting periods so as to reflect a constant, periodic rate of return on the Corporation’s net investment outstanding in respect of leases. Lease payments from operating leases are recognized as income on a straight-line basis over the terms of the relevant leases. Initial direct costs incurred in obtaining operating leases are added to the carrying amounts of the underlying assets and recognized as expenses on a straight-line basis over the lease terms. Variable lease payments that do not depend on an index or a rate are recognized as income in the periods in which they are incurred. When a lease includes both land and building elements, the Corporation assesses the classification of each element separately as a finance or an operating lease based on the assessment as to whether substantially all the risks and rewards incidental to ownership of each element have been transferred to the lessee. The lease payments are allocated between the land and the building elements in proportion to the relative fair values of the leasehold interests in the land element and building element of the lease at the inception of a contract. If the allocation of the lease payments can be made reliably, each element is accounted for separately in accordance with its lease classification. When the lease payments cannot be allocated reliably between the land and building elements, the entire lease is generally classified as a finance lease unless it is clear that both elements are operating leases; in which case, the entire lease is classified as an operating lease.
b. The Corporation as lessee
The Corporation recognizes right-of-use assets and lease liabilities for all leases at the commencement date of a lease, except for short-term leases and low-value asset leases accounted for applying a recognition exemption where lease payments are recognized as expenses on a straight-line basis over the lease terms. Right-of-use assets are initially measured at cost, which comprises the initial measurement of lease liabilities adjusted for lease payments made at or before the commencement date, plus any initial direct costs incurred and an estimate of costs needed to restore the underlying assets, and less any lease incentives received. Right-of-use assets are subsequently measured at cost less accumulated depreciation and impairment losses and adjusted for any remeasurement of the lease liabilities. Right-of-use assets are presented on a separate line in the balance sheets. Right-of-use assets are depreciated using the straight-line method from the commencement dates to the earlier of the end of the useful lives of the right-of-use assets or the end of the lease terms. Lease liabilities are initially measured at the present value of the lease payments, which comprise fixed payments and variable lease payments which depend on an index or a rate. The lease payments are discounted using the interest rate implicit in a lease, if that rate can be readily determined. If that rate cannot be readily determined, the Corporation uses the lessee’s incremental borrowing rate.

- 24 -
Subsequently, lease liabilities are measured at amortized cost using the effective interest method, with interest expense recognized over the lease terms. When there is a change in a lease term or a change in future lease payments resulting from a change in an index or a rate used to determine those payments, the Corporation remeasures the lease liabilities with a corresponding adjustment to the right-of-use-assets. However, if the carrying amount of the right-of-use assets is reduced to zero, any remaining amount of the remeasurement is recognized in profit or loss. Lease liabilities are presented on a separate line in the balance sheets. Variable lease payments that do not depend on an index or a rate are recognized as expenses in the periods in which they are incurred.
2018 Leases are classified as finance leases whenever the terms of a lease transfer substantially all the risks and rewards of ownership to the lessee. All other leases are classified as operating leases. a. The Corporation as lessor
Rental income from operating leases is recognized on a straight-line basis over the term of the relevant lease. Initial direct costs incurred in negotiating and arranging an operating lease are added to the carrying amount of the leased asset and amortized on a straight-line basis over the lease term.
b. The Corporation as lessee
Operating lease payments are recognized as expenses on a straight-line basis over the lease term. c. Leasehold land for own use
When a lease includes both land and building elements, the Corporation assesses the classification of each element separately as a finance or an operating lease based on the assessment as to whether substantially all the risks and rewards incidental to ownership of each element have been transferred to the lessee. The minimum lease payments are allocated between the land and the building elements in proportion to the relative fair values of the leasehold interests in the land element and building element of the lease at the inception of the lease. If the allocation of the lease payments can be made reliably, each element is accounted for separately in accordance with its lease classification. When the lease payments cannot be allocated reliably between the land and building elements, the entire lease is generally classified as a finance lease unless it is clear that both elements are operating leases; in which case, the entire lease is classified as an operating lease.
Employee Benefits a. Short-term employee benefits
Liabilities recognized in respect of short-term employee benefits are measured at the undiscounted amount of the benefits expected to be paid in exchange for the related services.
b. Retirement benefits Payments to defined contribution retirement benefit plans are recognized as expenses when employees have rendered services entitling them to the contributions.
- 25 -
Defined benefit costs (including service cost, net interest and remeasurement) under defined benefit retirement benefit plans are determined using the projected unit credit method. Service cost (including current service cost, past service cost, as well as gains and losses on settlements) and net interest on the net defined benefit liabilities (assets) are recognized as employee benefits expense in the period in which they occur. Remeasurement, comprising actuarial gains and losses and the return on plan assets (excluding interest), is recognized in other comprehensive income in the period in which it occurs. Remeasurement recognized in other comprehensive income is reflected immediately in retained earnings and will not be reclassified to profit or loss. Net defined benefit liabilities (assets) represent the actual deficit (surplus) in the Corporation’s defined benefit plans. Any surplus resulting from this calculation is limited to the present value of any refunds from the plans or reductions in future contributions to the plans.
c. Termination benefits A liability for a termination benefit is recognized at the earlier of when the Corporation can no longer withdraw the offer of the termination benefit and when the Corporation recognizes any related restructuring costs.
Taxation Income tax expense represents the sum of the tax currently payable and deferred tax. a. Current tax
According to the Income Tax Law, an additional tax of unappropriated earnings is provided for as income tax in the year the shareholders approve to retain earnings. Adjustments of prior years’ tax liabilities are added to or deducted from the current year’s tax provision.
b. Deferred tax Deferred tax is recognized on temporary differences between the carrying amounts of assets and liabilities in the parent company only financial statements and the corresponding tax bases used in the computation of taxable profit. Deferred tax liabilities are generally recognized for all taxable temporary differences. Deferred tax assets are generally recognized for all deductible temporary differences to the extent that it is probable that taxable profits will be available against which those deductible temporary differences can be utilized. Deferred tax liabilities are recognized for taxable temporary differences associated with investments in subsidiaries and associates, except where the Corporation is able to control the reversal of the temporary difference and it is probable that the temporary difference will not reverse in the foreseeable future. Deferred tax assets arising from deductible temporary differences associated with such investments and interests are only recognized to the extent that it is probable that there will be sufficient taxable profits against which to utilize the benefits of the temporary differences and they are expected to reverse in the foreseeable future. The carrying amount of deferred tax assets is reviewed at the end of each reporting period and reduced to the extent that it is no longer probable that sufficient taxable profits will be available to allow all or part of the asset to be recovered. A previously unrecognized deferred tax asset is also reviewed at the end of each reporting period and recognized to the extent that it has become probable that future taxable profit will allow the deferred tax asset to be recovered.
- 26 -
Deferred tax assets and liabilities are measured at the tax rates that are expected to apply in the period in which the liability is settled or the asset realized, based on tax rates (and tax laws) that have been enacted or substantively enacted by the end of the reporting period. The measurement of deferred tax liabilities and assets reflects the tax consequences that would follow from the manner in which the Corporation expects, at the end of the reporting period, to recover or settle the carrying amount of its assets and liabilities. If investment properties measured using the fair value model are non-depreciable assets, or are held under a business model whose objective is not to consume substantially all of the economic benefits embodied in the assets over time, the carrying amounts of such assets are presumed to be recovered entirely through sale.
c. Current tax and deferred tax for the year
Current tax and deferred tax are recognized in profit or loss, except when they relate to items that are recognized in other comprehensive income, in which case, the current tax and deferred tax are also recognized in other comprehensive income, respectively.
5. CRITICAL ACCOUNTING JUDGMENTS AND KEY SOURCES OF ESTIMATION
UNCERTAINTY In the application of the Corporation’s accounting policies, management is required to make judgments, estimations and assumptions about the carrying amounts of assets and liabilities that are not readily apparent from other sources. The estimates and associated assumptions are based on historical experience and other factors that are considered relevant. Actual results may differ from these estimates. The estimates and underlying assumptions are reviewed on an ongoing basis. Revisions to accounting estimates are recognized in the period in which the estimates are revised if the revisions affect only that period or in the period of the revisions and future periods if the revisions affect both current and future periods. Fair Value Measurements and Valuation Process If some of the Corporation’s assets and liabilities measured at fair value have no quoted prices in active markets, the Corporation determines whether to engage third party qualified appraisers for the application of appropriate valuation techniques for fair value measurements in accordance with related regulations or professional standards. Where Level 1 inputs are not available, the engaged appraisers would determine appropriate inputs by referring to the existing lease contracts and rentals of similar properties in the vicinity of the Corporation’s investment properties. If the actual changes of inputs in the future differ from expectation, fair value might vary accordingly. Information about the valuation techniques and inputs used in determining the fair value of various assets and liabilities is disclosed in Note 15.

- 27 -
6. CASH AND CASH EQUIVALENTS
December 31 2019 2018 Checking accounts and demand deposits $ 778,468 $ 848,592 Petty cash 815 915 Cash on hand 345 355 Cash equivalents (investments with original maturities of less than 3
months) Time deposits 1,346,850 2,162,608 Repurchase agreements collateralized by bonds 349,261 153,325 $ 2,475,739 $ 3,165,795
The market rate intervals of time deposits and repurchase agreements collateralized by bonds at the end of the reporting period were as follows: December 31 2019 2018 Time deposits 2.33%-2.40% 2.80%-3.35% Repurchase agreements collateralized by bonds 0.53%-2.36% 2.52% Time deposits with original maturities of more than 3 months in the amounts of $1,763,189 thousand and $462,275 thousand as of December 31, 2019 and 2018, respectively, are classified as financial assets at amortized cost in the balance sheets. Refer to Note 9.
7. FINANCIAL INSTRUMENTS AT FAIR VALUE THROUGH PROFIT OR LOSS - CURRENT
December 31 2019 2018 Financial assets at FVTPL Financial assets mandatorily classified as at FVTPL
Non-derivative financial assets Beneficiary certificates $ 204,700 $ 135,400 Listed stocks 1,485,828 1,037,426
$ 1,690,528 $ 1,172,826
Financial liabilities at FVTPL Financial liabilities held for trading
Derivative financial liabilities (not under hedge accounting) Bond options (Note 20) $ 81,724 $ 223,501 Cross-currency swap contracts 30,346 44,717 $ 112,070 $ 268,218
- 28 -
The Corporation entered into cross-currency swap contracts to manage exposures to exchange rate fluctuations. The Corporation’s financial hedging strategy is to avoid most of the cash flow risk exposure. As of December 31, 2019 and 2018, outstanding cross-currency swap contracts not under hedge accounting were as follows:
Notional Amounts
(In Thousands) Maturity Date Range of Interest Rates Paid Range of Interest Rates Received
US$215,000 2021.9.15 - 2.68%-2.80%
8. FINANCIAL ASSETS AT FAIR VALUE THROUGH OTHER COMPREHENSIVE INCOME
December 31 2019 2018 Current Non-current Current Non-current Domestic investments
Listed stocks $ 2,237,578 $ 5,513,975 $ 2,371,026 $ 4,812,769 Unlisted stocks - 586,459 - 573,373
2,237,578 6,100,434 2,371,026 5,386,142 Foreign investments
Unlisted stocks - 488,258 - - $ 2,237,578 $ 6,588,692 $ 2,371,026 $ 5,386,142
These investments in equity instruments are not held for trading. Instead, they are held for medium to long-term strategic purposes. Accordingly, the management elected to designate these investments in equity instruments as at FVTOCI as they believe that recognizing short-term fluctuations in these investments’ fair value in profit or loss would not be consistent with the Corporation’s strategy of holding these investments for long-term purposes. The board of directors of China Shanshui Cement Group Limited (CSCGL) announced on April 16, 2015 that the percentage of CSCGL’s securities held by the public fell below the prescribed minimum requirement of 25% according to the Main Board Listing Rules 8.08 of Hong Kong Exchanges and Clearing Limited (the “Exchange”). Therefore, the Exchange suspended the trading of CSCGL’s securities until the percentage of securities in public hands satisfies the minimum requirement. On October 30, 2018, CSCGL’s shareholders resolved to restore the minimum public float requirement of 25% by issuing new shares of 974,825,988 at HK$4.2 per share. Then CSCGL resumed its trading on the Exchange effective on October 31, 2018. The Corporation and its subsidiaries originally held 22.50% equity interest in CSCGL but the shareholding was reduced to 17.46% after the subscription mentioned above. However, Mrs. Wu Ling-Ling, the Corporation’s chief financial officer, was elected to be the executive director of CSCGL on May 23, 2018. As CSCGL already addressed the audit issues raised by the Exchange and the confirmed the potential dilution of shareholding in the Corporation’s interests in CSCGL, the Corporation objectively demonstrated that it was able to exercise significant influence over CSCGL although the Corporation only held less than 20% of the voting power. Accordingly, the Corporation’s investment in CSCGL was reclassified from financial assets at fair value through other comprehensive income to investments accounted for using the equity method at the closing price of the Exchange on October 31, 2018. Refer to Note 12. Refer to Note 31 for information relating to financial assets at fair value through other comprehensive income pledged as collaterals.
- 29 -
9. FINANCIAL ASSETS AT AMORTIZED COST
December 31 2019 2018 Time deposits with original maturities of more than 3 months $ 1,763,189 $ 462,275 Based on the Corporation’s assessment, the credit risk of these financial assets is not expected to be high and has not increased since initial recognition.
10. TRADE RECEIVABLES
December 31 2019 2018 Trade receivables - sales $ 947,444 $ 983,780 Operating lease receivable 23,119 17,778 Less: Allowance for impairment loss - sales (10,259) (6,506) $ 960,304 $ 995,052 Trade Receivables - Sales The average credit period of receivables from sales of goods was 30-150 days. The Corporation reviews the recoverable amount of each individual trade debt at the end of the reporting period to ensure that adequate allowance is made for possible irrecoverable amounts. The Corporation obtains sufficient collateral, where appropriate, as a means of mitigating the risk of financial loss from defaults. The Corporation applies the simplified approach to providing for expected credit losses prescribed by IFRS 9, which permits the use of lifetime expected loss provision for all trade receivables. The expected credit losses on trade receivables are estimated by reference to past default experience of the debtor and an analysis of the debtor’s current financial position, adjusted for general economic conditions of the industry in which the debtors operate and an assessment of both the current as well as the forecast direction of economic conditions at the reporting date. The Corporation writes off a trade receivable when there is information indicating that the debtor is in severe financial difficulty and there is no realistic prospect of recovery. For trade receivables that have been written off, the Corporation continues to engage in enforcement activity to attempt to recover the receivables due. Where recoveries are made, these are recognized in profit or loss. December 31, 2019
Less than 90 Days
91 to 180 Days
181 to 365 Days
Over 366 Days Total
Gross carrying amount $ 887,685 $ 26,783 $ 29,518 $ 3,458 $ 947,444 Loss allowance (lifetime ECLs) - (10,259) - - (10,259) Amortized cost $ 887,685 $ 16,524 $ 29,518 $ 3,458 $ 937,185
- 30 -
December 31, 2018
Less than 90 Days
91 to 180 Days
181 to 365 Days
Over 366 Days Total
Gross carrying amount $ 960,363 $ 23,417 $ - $ - $ 983,780 Loss allowance (lifetime ECLs) - (6,506) - - (6,506) Amortized cost $ 960,363 $ 16,911 $ - $ - $ 977,274 The above aging schedule was based on the invoice date. The movements of the loss allowance of trade receivables were as follows: 2019 2018 Balance at January 1 $ 6,506 $ 5,812 Add: Impairment losses recognized on receivables 3,753 694 Balance at December 31 $ 10,259 $ 6,506
11. INVENTORIES
December 31 2019 2018 Finished goods $ 167,759 $ 248,752 Work in progress 421,293 471,871 Raw materials 644,380 757,790 Supplies 311,877 184,982 $ 1,545,309 $ 1,663,395 The cost of inventories recognized as cost of goods sold for the years ended December 31, 2019 and 2018 were $8,339,743 thousand and $8,309,912 thousand, respectively. The cost of goods sold included inventory write-downs of $52,791 thousand for the year ended December 31, 2018.
12. INVESTMENTS ACCOUNTED FOR USING EQUITY METHOD
December 31 2019 2018 Investments in subsidiaries $ 74,533,619 $ 66,031,029 Investments in associates 63,580,304 62,396,158 138,113,923 128,427,187 Less: Effect of investment properties at fair value method 2,970,074 2,794,297 $ 135,143,849 $ 125,632,890
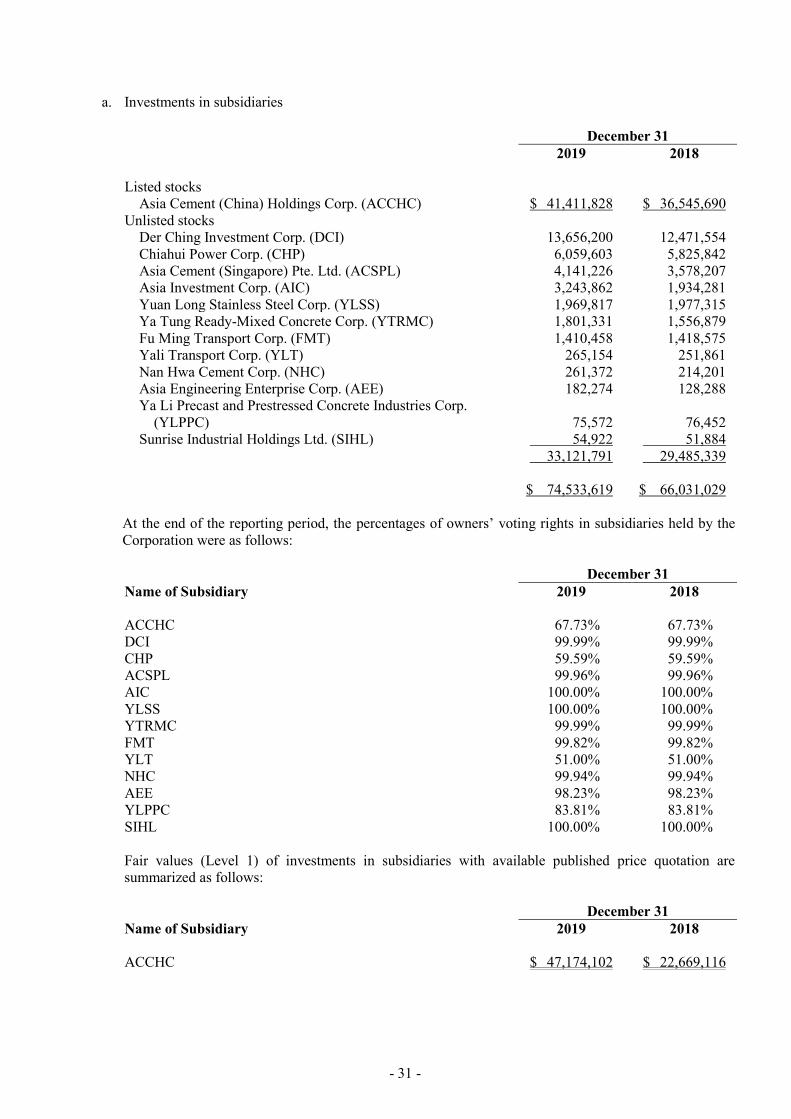
- 31 -
a. Investments in subsidiaries
December 31 2019 2018 Listed stocks
Asia Cement (China) Holdings Corp. (ACCHC) $ 41,411,828 $ 36,545,690 Unlisted stocks
Der Ching Investment Corp. (DCI) 13,656,200 12,471,554 Chiahui Power Corp. (CHP) 6,059,603 5,825,842 Asia Cement (Singapore) Pte. Ltd. (ACSPL) 4,141,226 3,578,207 Asia Investment Corp. (AIC) 3,243,862 1,934,281 Yuan Long Stainless Steel Corp. (YLSS) 1,969,817 1,977,315 Ya Tung Ready-Mixed Concrete Corp. (YTRMC) 1,801,331 1,556,879 Fu Ming Transport Corp. (FMT) 1,410,458 1,418,575 Yali Transport Corp. (YLT) 265,154 251,861 Nan Hwa Cement Corp. (NHC) 261,372 214,201 Asia Engineering Enterprise Corp. (AEE) 182,274 128,288 Ya Li Precast and Prestressed Concrete Industries Corp.
(YLPPC) 75,572 76,452 Sunrise Industrial Holdings Ltd. (SIHL) 54,922 51,884 33,121,791 29,485,339 $ 74,533,619 $ 66,031,029
At the end of the reporting period, the percentages of owners’ voting rights in subsidiaries held by the Corporation were as follows: December 31 Name of Subsidiary 2019 2018 ACCHC 67.73% 67.73% DCI 99.99% 99.99% CHP 59.59% 59.59% ACSPL 99.96% 99.96% AIC 100.00% 100.00% YLSS 100.00% 100.00% YTRMC 99.99% 99.99% FMT 99.82% 99.82% YLT 51.00% 51.00% NHC 99.94% 99.94% AEE 98.23% 98.23% YLPPC 83.81% 83.81% SIHL 100.00% 100.00% Fair values (Level 1) of investments in subsidiaries with available published price quotation are summarized as follows: December 31 Name of Subsidiary 2019 2018 ACCHC $ 47,174,102 $ 22,669,116
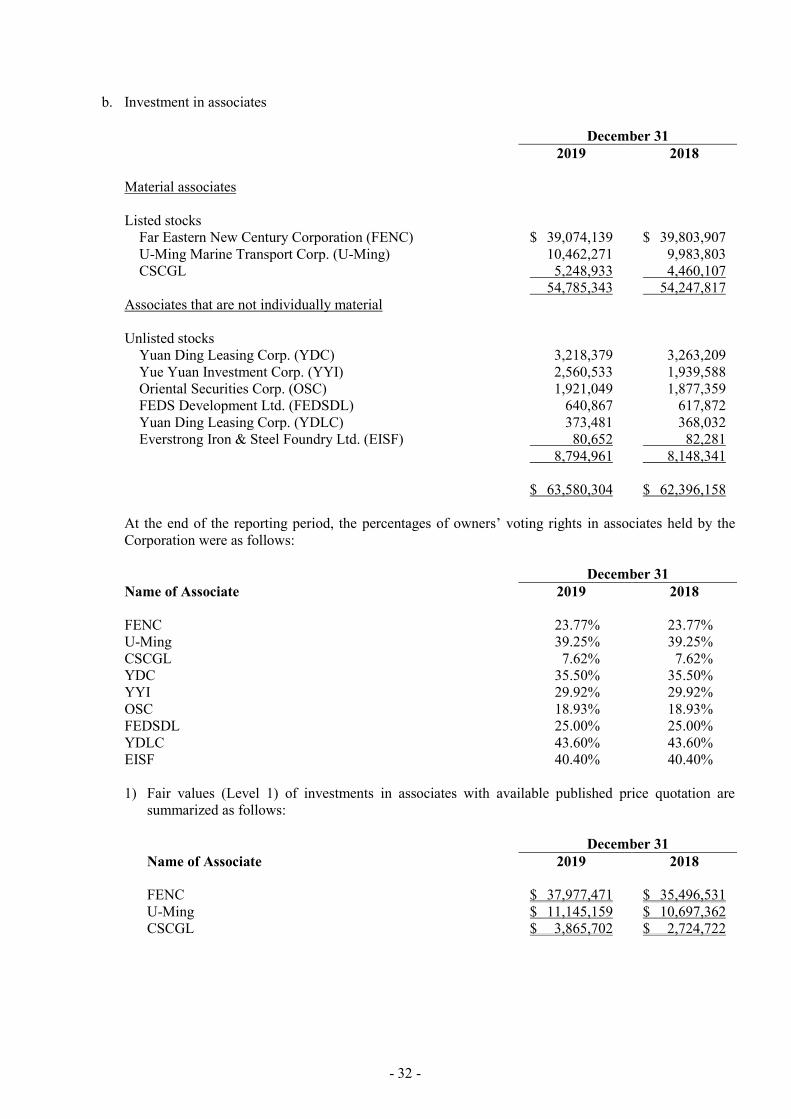
- 32 -
b. Investment in associates
December 31 2019 2018 Material associates Listed stocks
Far Eastern New Century Corporation (FENC) $ 39,074,139 $ 39,803,907 U-Ming Marine Transport Corp. (U-Ming) 10,462,271 9,983,803 CSCGL 5,248,933 4,460,107
54,785,343 54,247,817 Associates that are not individually material Unlisted stocks
Yuan Ding Leasing Corp. (YDC) 3,218,379 3,263,209 Yue Yuan Investment Corp. (YYI) 2,560,533 1,939,588 Oriental Securities Corp. (OSC) 1,921,049 1,877,359 FEDS Development Ltd. (FEDSDL) 640,867 617,872 Yuan Ding Leasing Corp. (YDLC) 373,481 368,032 Everstrong Iron & Steel Foundry Ltd. (EISF) 80,652 82,281
8,794,961 8,148,341
$ 63,580,304 $ 62,396,158
At the end of the reporting period, the percentages of owners’ voting rights in associates held by the Corporation were as follows: December 31 Name of Associate 2019 2018 FENC 23.77% 23.77% U-Ming 39.25% 39.25% CSCGL 7.62% 7.62% YDC 35.50% 35.50% YYI 29.92% 29.92% OSC 18.93% 18.93% FEDSDL 25.00% 25.00% YDLC 43.60% 43.60% EISF 40.40% 40.40% 1) Fair values (Level 1) of investments in associates with available published price quotation are
summarized as follows:
December 31 Name of Associate 2019 2018 FENC $ 37,977,471 $ 35,496,531 U-Ming $ 11,145,159 $ 10,697,362 CSCGL $ 3,865,702 $ 2,724,722
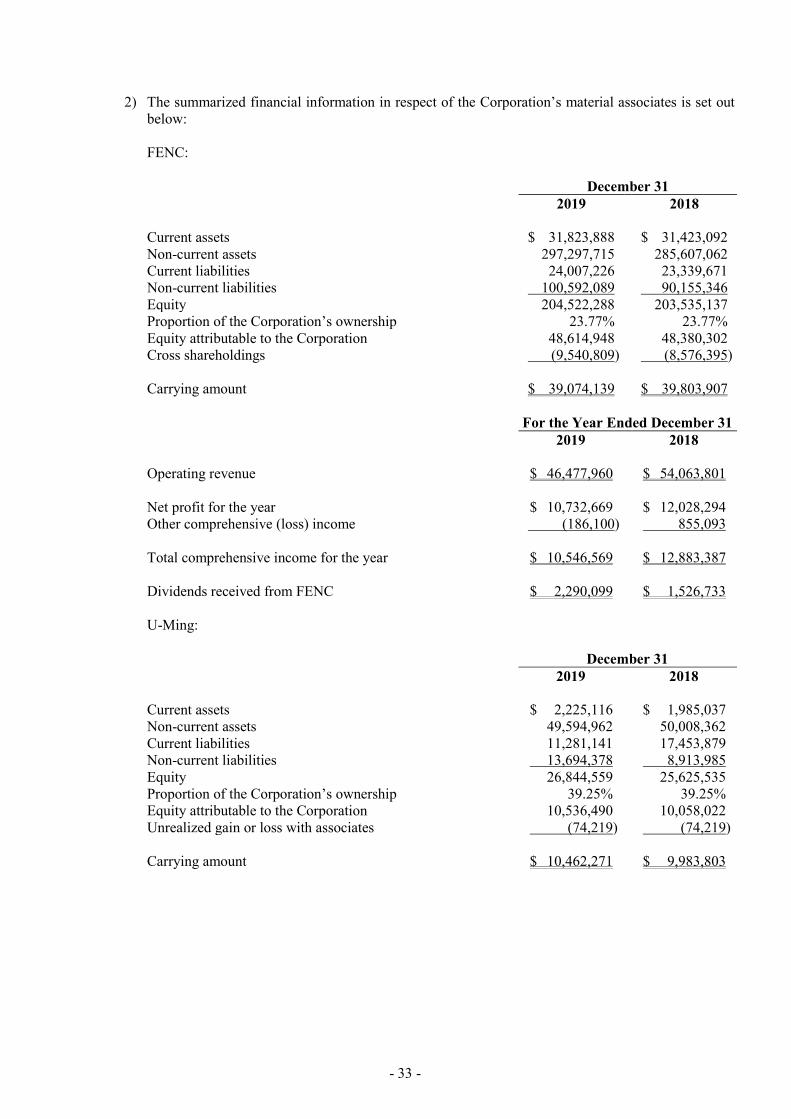
- 33 -
2) The summarized financial information in respect of the Corporation’s material associates is set out below: FENC: December 31 2019 2018 Current assets $ 31,823,888 $ 31,423,092 Non-current assets 297,297,715 285,607,062 Current liabilities 24,007,226 23,339,671 Non-current liabilities 100,592,089 90,155,346 Equity 204,522,288 203,535,137 Proportion of the Corporation’s ownership 23.77% 23.77% Equity attributable to the Corporation 48,614,948 48,380,302 Cross shareholdings (9,540,809) (8,576,395) Carrying amount $ 39,074,139 $ 39,803,907
For the Year Ended December 31 2019 2018 Operating revenue $ 46,477,960 $ 54,063,801 Net profit for the year $ 10,732,669 $ 12,028,294 Other comprehensive (loss) income (186,100) 855,093 Total comprehensive income for the year $ 10,546,569 $ 12,883,387 Dividends received from FENC $ 2,290,099 $ 1,526,733 U-Ming: December 31 2019 2018 Current assets $ 2,225,116 $ 1,985,037 Non-current assets 49,594,962 50,008,362 Current liabilities 11,281,141 17,453,879 Non-current liabilities 13,694,378 8,913,985 Equity 26,844,559 25,625,535 Proportion of the Corporation’s ownership 39.25% 39.25% Equity attributable to the Corporation 10,536,490 10,058,022 Unrealized gain or loss with associates (74,219) (74,219) Carrying amount $ 10,462,271 $ 9,983,803
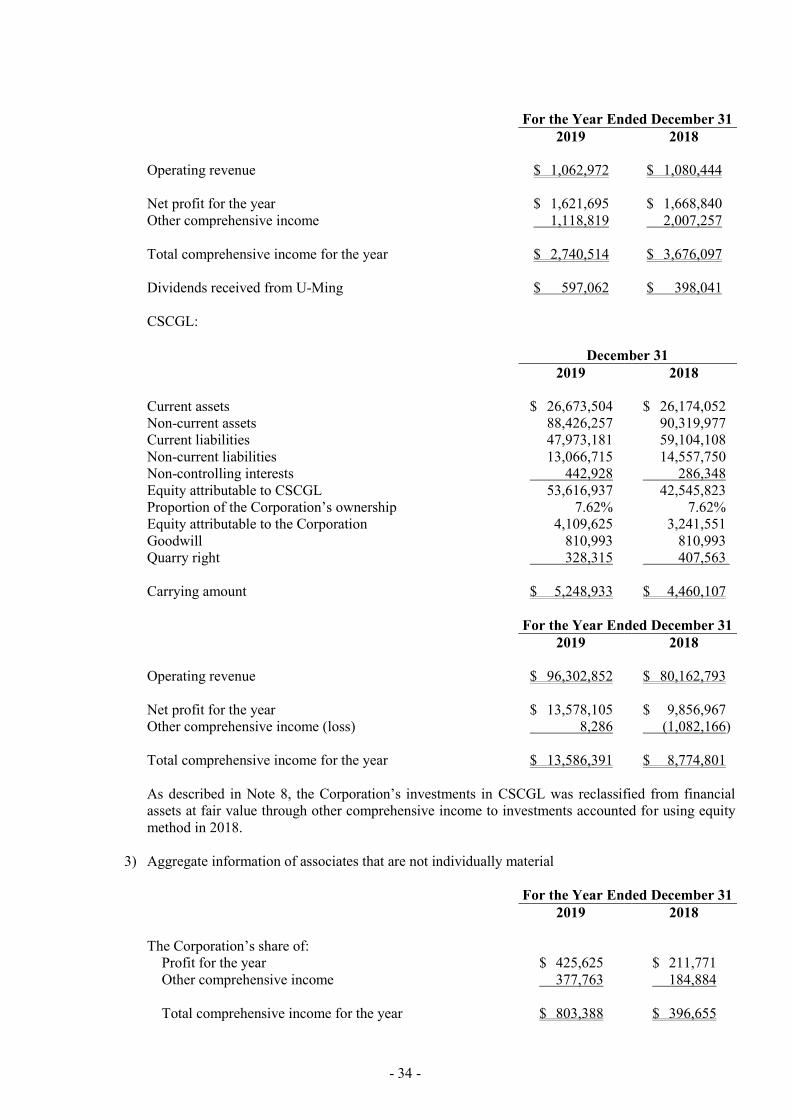
- 34 -
For the Year Ended December 31
2019 2018 Operating revenue $ 1,062,972 $ 1,080,444 Net profit for the year $ 1,621,695 $ 1,668,840 Other comprehensive income 1,118,819 2,007,257 Total comprehensive income for the year $ 2,740,514 $ 3,676,097 Dividends received from U-Ming $ 597,062 $ 398,041 CSCGL: December 31 2019 2018 Current assets $ 26,673,504 $ 26,174,052 Non-current assets 88,426,257 90,319,977 Current liabilities 47,973,181 59,104,108 Non-current liabilities 13,066,715 14,557,750 Non-controlling interests 442,928 286,348 Equity attributable to CSCGL 53,616,937 42,545,823 Proportion of the Corporation’s ownership 7.62% 7.62% Equity attributable to the Corporation 4,109,625 3,241,551 Goodwill 810,993 810,993 Quarry right 328,315 407,563 Carrying amount $ 5,248,933 $ 4,460,107
For the Year Ended December 31 2019 2018 Operating revenue $ 96,302,852 $ 80,162,793 Net profit for the year $ 13,578,105 $ 9,856,967 Other comprehensive income (loss) 8,286 (1,082,166) Total comprehensive income for the year $ 13,586,391 $ 8,774,801 As described in Note 8, the Corporation’s investments in CSCGL was reclassified from financial assets at fair value through other comprehensive income to investments accounted for using equity method in 2018.
3) Aggregate information of associates that are not individually material
For the Year Ended December 31 2019 2018 The Corporation’s share of:
Profit for the year $ 425,625 $ 211,771 Other comprehensive income 377,763 184,884
Total comprehensive income for the year $ 803,388 $ 396,655
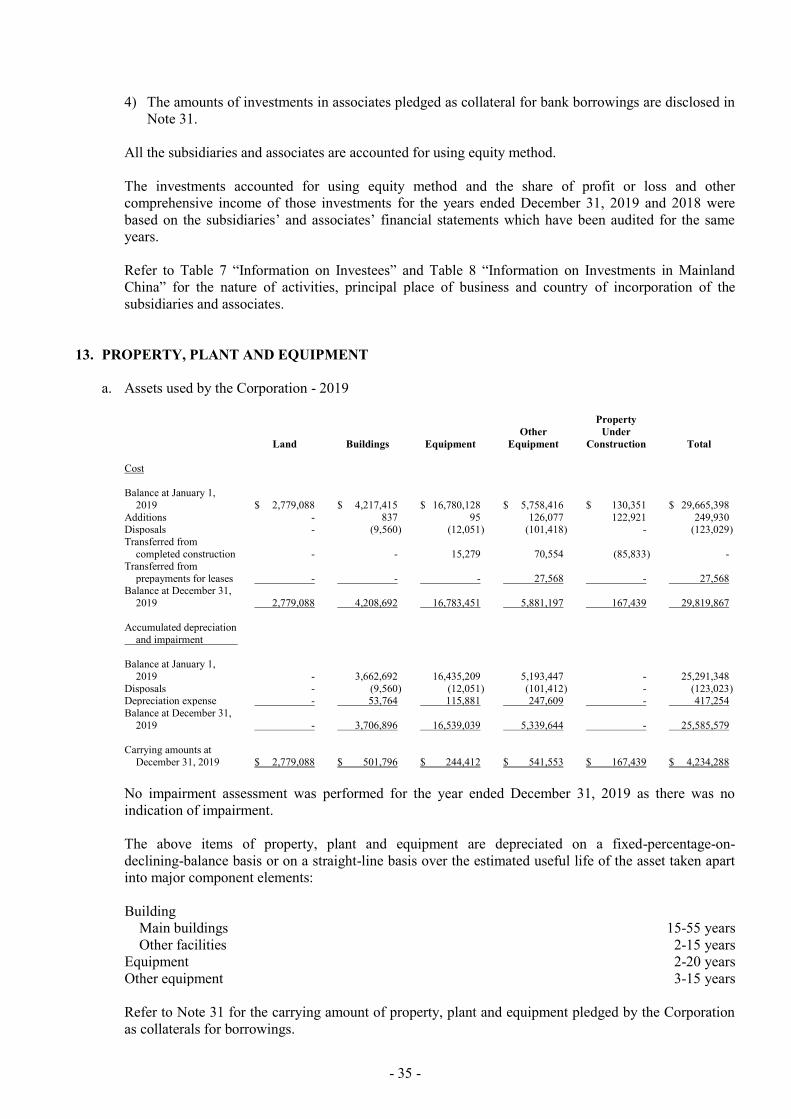
- 35 -
4) The amounts of investments in associates pledged as collateral for bank borrowings are disclosed in Note 31.
All the subsidiaries and associates are accounted for using equity method. The investments accounted for using equity method and the share of profit or loss and other comprehensive income of those investments for the years ended December 31, 2019 and 2018 were based on the subsidiaries’ and associates’ financial statements which have been audited for the same years. Refer to Table 7 “Information on Investees” and Table 8 “Information on Investments in Mainland China” for the nature of activities, principal place of business and country of incorporation of the subsidiaries and associates.
13. PROPERTY, PLANT AND EQUIPMENT
a. Assets used by the Corporation - 2019
Land Buildings Equipment Other
Equipment
Property Under
Construction Total Cost Balance at January 1,
2019 $ 2,779,088 $ 4,217,415 $ 16,780,128 $ 5,758,416 $ 130,351 $ 29,665,398 Additions - 837 95 126,077 122,921 249,930 Disposals - (9,560 ) (12,051 ) (101,418 ) - (123,029 ) Transferred from
completed construction - - 15,279 70,554 (85,833 ) - Transferred from
prepayments for leases - - - 27,568 - 27,568 Balance at December 31,
2019 2,779,088 4,208,692 16,783,451 5,881,197 167,439 29,819,867 Accumulated depreciation and impairment
Balance at January 1,
2019 - 3,662,692 16,435,209 5,193,447 - 25,291,348 Disposals - (9,560 ) (12,051 ) (101,412 ) - (123,023 ) Depreciation expense - 53,764 115,881 247,609 - 417,254 Balance at December 31,
2019 - 3,706,896 16,539,039 5,339,644 - 25,585,579 Carrying amounts at
December 31, 2019 $ 2,779,088 $ 501,796 $ 244,412 $ 541,553 $ 167,439 $ 4,234,288
No impairment assessment was performed for the year ended December 31, 2019 as there was no indication of impairment. The above items of property, plant and equipment are depreciated on a fixed-percentage-on- declining-balance basis or on a straight-line basis over the estimated useful life of the asset taken apart into major component elements: Building
Main buildings 15-55 years Other facilities 2-15 years
Equipment 2-20 years Other equipment 3-15 years
Refer to Note 31 for the carrying amount of property, plant and equipment pledged by the Corporation as collaterals for borrowings.
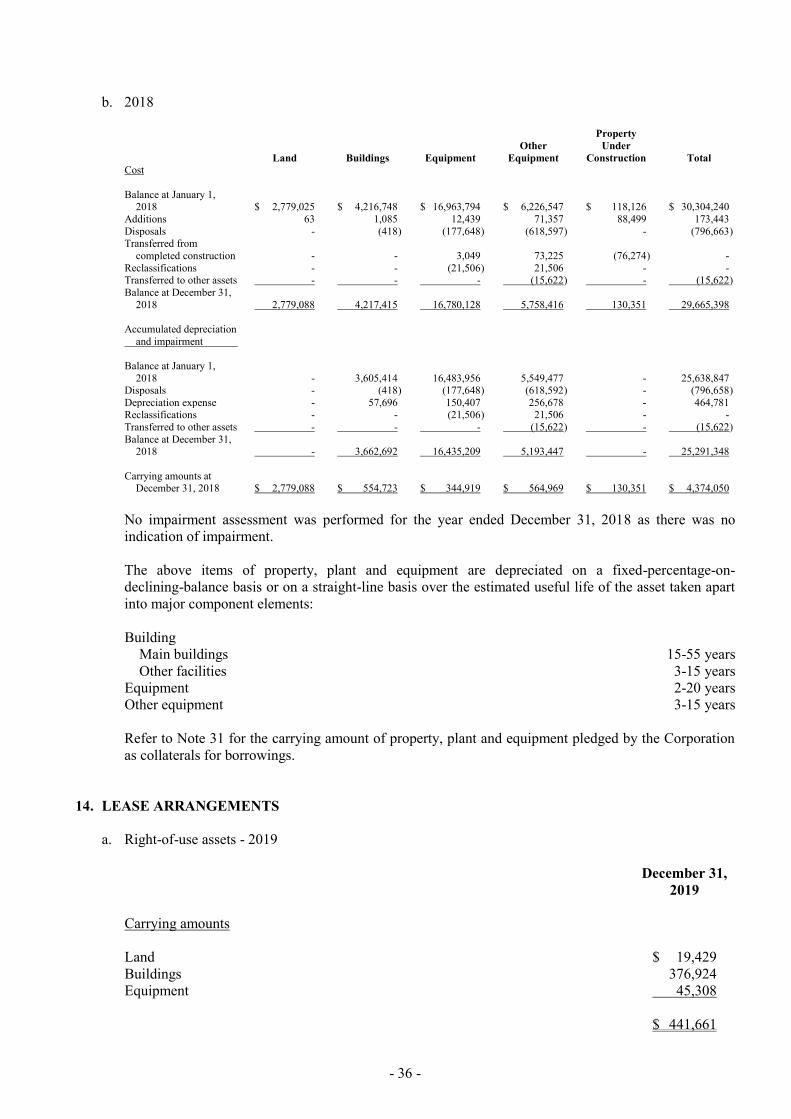
- 36 -
b. 2018
Land Buildings Equipment Other
Equipment
Property Under
Construction Total Cost Balance at January 1,
2018 $ 2,779,025 $ 4,216,748 $ 16,963,794 $ 6,226,547 $ 118,126 $ 30,304,240 Additions 63 1,085 12,439 71,357 88,499 173,443 Disposals - (418 ) (177,648 ) (618,597 ) - (796,663 ) Transferred from
completed construction - - 3,049 73,225 (76,274 ) - Reclassifications - - - (21,506 ) - 21,506 - - - Transferred to other assets - - - (15,622 ) - (15,622 ) Balance at December 31,
2018 2,779,088 4,217,415 16,780,128 5,758,416 130,351 29,665,398 Accumulated depreciation and impairment
Balance at January 1,
2018 - 3,605,414 16,483,956 5,549,477 - 25,638,847 Disposals - (418 ) (177,648 ) (618,592 ) - (796,658 ) Depreciation expense - 57,696 150,407 256,678 - 464,781 Reclassifications - - - (21,506 ) 21,506 - - Transferred to other assets - - - (15,622 ) - (15,622 ) Balance at December 31,
2018 - 3,662,692 16,435,209 5,193,447 - 25,291,348 Carrying amounts at
December 31, 2018 $ 2,779,088 $ 554,723 $ 344,919 $ 564,969 $ 130,351 $ 4,374,050
No impairment assessment was performed for the year ended December 31, 2018 as there was no indication of impairment. The above items of property, plant and equipment are depreciated on a fixed-percentage-on- declining-balance basis or on a straight-line basis over the estimated useful life of the asset taken apart into major component elements: Building
Main buildings 15-55 years Other facilities 3-15 years
Equipment 2-20 years Other equipment 3-15 years Refer to Note 31 for the carrying amount of property, plant and equipment pledged by the Corporation as collaterals for borrowings.
14. LEASE ARRANGEMENTS
a. Right-of-use assets - 2019
December 31,
2019 Carrying amounts Land $ 19,429 Buildings 376,924 Equipment 45,308 $ 441,661
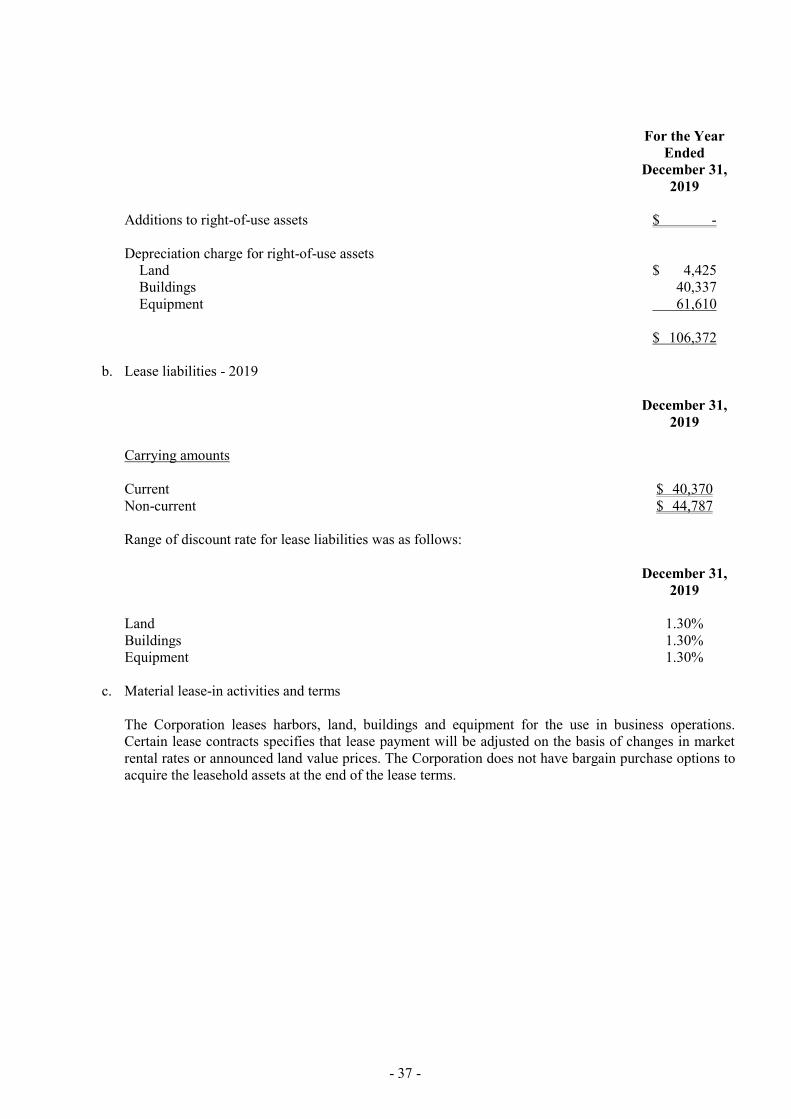
- 37 -
For the Year Ended
December 31, 2019
Additions to right-of-use assets $ - Depreciation charge for right-of-use assets
Land $ 4,425 Buildings 40,337 Equipment 61,610 $ 106,372
b. Lease liabilities - 2019
December 31,
2019 Carrying amounts Current $ 40,370 Non-current $ 44,787 Range of discount rate for lease liabilities was as follows:
December 31,
2019 Land 1.30% Buildings 1.30% Equipment 1.30%
c. Material lease-in activities and terms
The Corporation leases harbors, land, buildings and equipment for the use in business operations. Certain lease contracts specifies that lease payment will be adjusted on the basis of changes in market rental rates or announced land value prices. The Corporation does not have bargain purchase options to acquire the leasehold assets at the end of the lease terms.
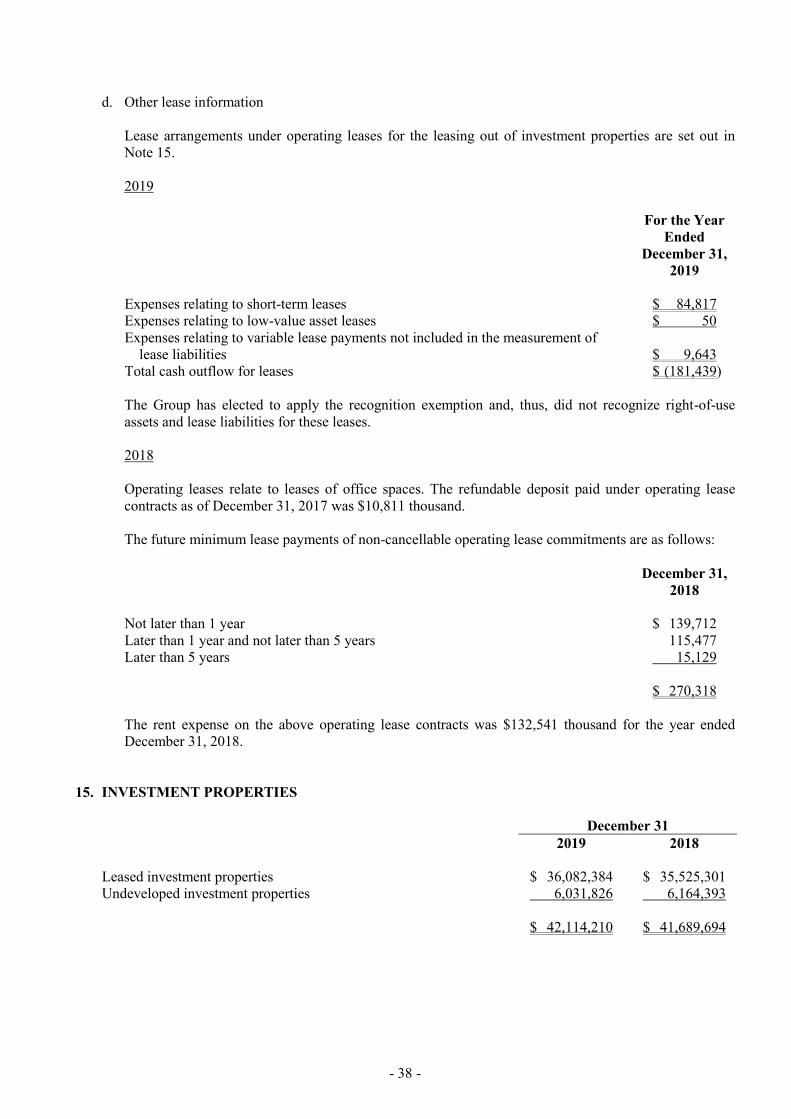
- 38 -
d. Other lease information
Lease arrangements under operating leases for the leasing out of investment properties are set out in Note 15.
2019
For the Year Ended
December 31, 2019
Expenses relating to short-term leases $ 84,817 Expenses relating to low-value asset leases $ 50 Expenses relating to variable lease payments not included in the measurement of
lease liabilities $ 9,643 Total cash outflow for leases $ (181,439) The Group has elected to apply the recognition exemption and, thus, did not recognize right-of-use assets and lease liabilities for these leases. 2018 Operating leases relate to leases of office spaces. The refundable deposit paid under operating lease contracts as of December 31, 2017 was $10,811 thousand. The future minimum lease payments of non-cancellable operating lease commitments are as follows:
December 31,
2018 Not later than 1 year $ 139,712 Later than 1 year and not later than 5 years 115,477 Later than 5 years 15,129 $ 270,318 The rent expense on the above operating lease contracts was $132,541 thousand for the year ended December 31, 2018.
15. INVESTMENT PROPERTIES
December 31 2019 2018 Leased investment properties $ 36,082,384 $ 35,525,301 Undeveloped investment properties 6,031,826 6,164,393 $ 42,114,210 $ 41,689,694

- 39 -
The movements of investment property were as follows:
Leased Investment Property
Undeveloped Investment Property Total
Balance at January 1, 2018 $ 35,822,102 $ 6,197,535 $ 42,019,637 Changes in fair value of investment properties (298,069) (33,142) (331,211) Additions 1,269 - 1,269 Disposals (1) - (1) Balance at December 31, 2018 $ 35,525,301 $ 6,164,393 $ 41,689,694 Balance at January 1, 2019 $ 35,525,301 $ 6,164,393 $ 41,689,694 Changes in fair value of investment properties 532,249 (132,567) 399,682 Additions 24,834 - 24,834 Balance at December 31, 2019 $ 36,082,384 $ 6,031,826 $ 42,114,210 The investment properties for lease were as follows: a. On January 1, 1998, the Corporation granted FEDSDL the right to construct a shopping center on a
parcel of land it owned with an area of 6,976 square meters located in Lin-Ya, Kaohsiung. As consideration for the right to construct and the continued use of the land for fifty years, FEDSDL shall pay the following: (a) land use right in the amount of $1,073,000 thousand and (b) annual rental at 5% of the reference price of such land announced by the local government. The proceeds of the land use rights were recorded as long-term deferred revenue, and recognized as rental revenue on a periodic basis.
b. The Corporation and Far Eastern Resources Development Co. (FERD) equally owned a parcel of land
located at Tun Hwa South Road, Taipei City. Under an agreement entered into with YDC, the Corporation and FERD had agreed on the following: (a) construction of a twin tower building (Taipei Metro) by YDC on the said land, (b) continued use of the land without additional compensation for 30 years starting from the date of the completion of the building, (c) transfer to each of the Corporation and FERD 12% of the usable area of the building, and (d) transfer to FERD and the Corporation the remaining usable area of the building after the end of 30 years in exchange for the carrying amount of the property. In view of the foregoing agreement, the Corporation recorded the 12% of the building construction cost or $1,402,753 thousand as building acquired and as long-term deferred revenue, and recognized as revenue on a periodic basis.
c. Others mainly included the following:
1) Land in Shu-Lin - leased to YLPPC; 2) Land in Taichung Guan-Lien Industrial Zone - leased to NHC; 3) Land and buildings in Lin-Ko, Taichung and Hsi-Chih - leased to YTRMC; 4) Asia-Cement Building - leased to FEDS; 5) Pao-Ching Building - leased to Sofiva Genomics; 6) Land and building in Chayi City; and 7) Land and building in Hwalien - leased to YLT;
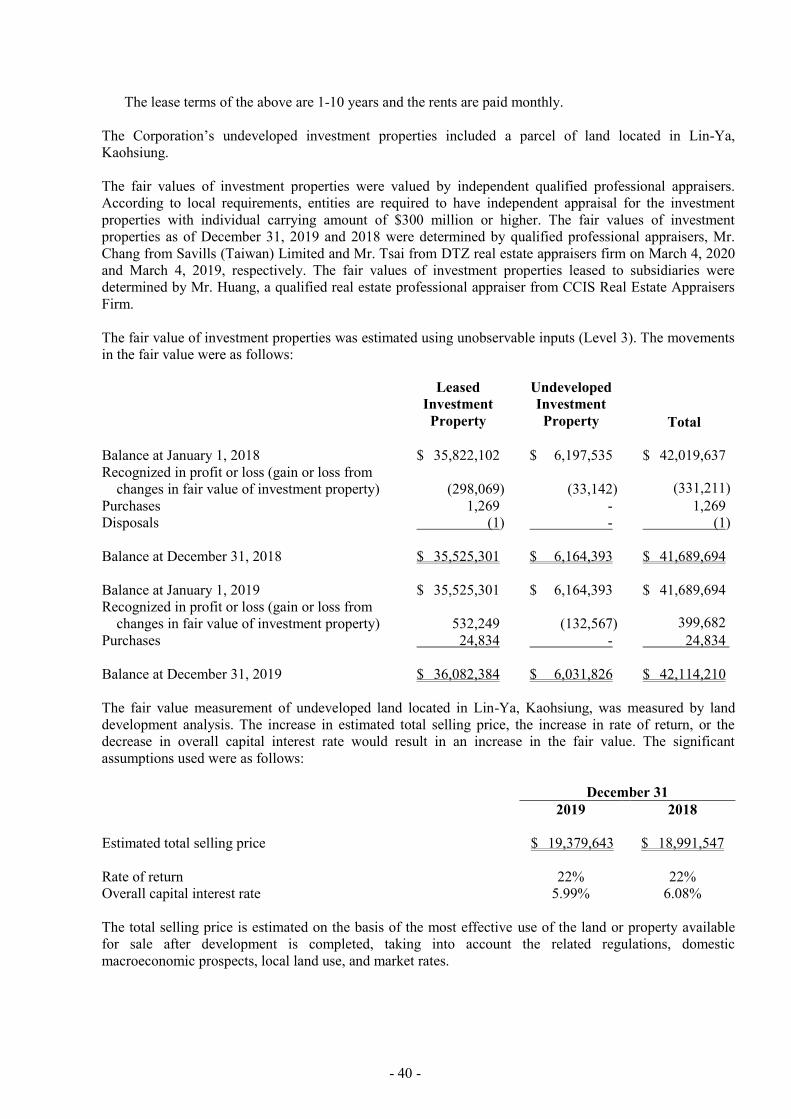
- 40 -
The lease terms of the above are 1-10 years and the rents are paid monthly. The Corporation’s undeveloped investment properties included a parcel of land located in Lin-Ya, Kaohsiung. The fair values of investment properties were valued by independent qualified professional appraisers. According to local requirements, entities are required to have independent appraisal for the investment properties with individual carrying amount of $300 million or higher. The fair values of investment properties as of December 31, 2019 and 2018 were determined by qualified professional appraisers, Mr. Chang from Savills (Taiwan) Limited and Mr. Tsai from DTZ real estate appraisers firm on March 4, 2020 and March 4, 2019, respectively. The fair values of investment properties leased to subsidiaries were determined by Mr. Huang, a qualified real estate professional appraiser from CCIS Real Estate Appraisers Firm. The fair value of investment properties was estimated using unobservable inputs (Level 3). The movements in the fair value were as follows:
Leased Investment Property
Undeveloped Investment Property Total
Balance at January 1, 2018 $ 35,822,102 $ 6,197,535 $ 42,019,637 Recognized in profit or loss (gain or loss from
changes in fair value of investment property) (298,069) (33,142) (331,211) Purchases 1,269 - 1,269 Disposals (1) - (1) Balance at December 31, 2018 $ 35,525,301 $ 6,164,393 $ 41,689,694 Balance at January 1, 2019 $ 35,525,301 $ 6,164,393 $ 41,689,694 Recognized in profit or loss (gain or loss from
changes in fair value of investment property) 532,249 (132,567) 399,682 Purchases 24,834 - 24,834 Balance at December 31, 2019 $ 36,082,384 $ 6,031,826 $ 42,114,210 The fair value measurement of undeveloped land located in Lin-Ya, Kaohsiung, was measured by land development analysis. The increase in estimated total selling price, the increase in rate of return, or the decrease in overall capital interest rate would result in an increase in the fair value. The significant assumptions used were as follows: December 31 2019 2018 Estimated total selling price $ 19,379,643 $ 18,991,547 Rate of return 22% 22% Overall capital interest rate 5.99% 6.08% The total selling price is estimated on the basis of the most effective use of the land or property available for sale after development is completed, taking into account the related regulations, domestic macroeconomic prospects, local land use, and market rates.

- 41 -
The fair value of investment properties, except for undeveloped land, was measured using the income approach. The significant assumptions used were stated below. The increase in estimated future net cash inflows, or the decrease in discount rates would result in increase in the fair value. December 31 2019 2018 Expected future cash inflows $ 45,637,919 $ 44,926,855 Expected future cash outflows 1,936,955 1,986,947 Expected future cash inflows, net $ 43,700,964 $ 42,939,908 Discount rate 2.07%-4.50% 2.07%-4.50% The market rentals in the area where the investment property is located were between $1 thousand and $5 thousand per ping (i.e., per 3.3 square meters). The rental income generated for the years ended December 31, 2019 and 2018 was $371,120 thousand and $356,365 thousand, respectively.
The expected future cash inflows to be generated by investment properties include rental income, interest income on rental deposits and disposal value. The rental income was extrapolated using the Corporation’s current rental contract, regional and market quotation, taking into account the annual rental growth rate; the income analysis covers a 10-year period, the interest income on rental deposits was extrapolated using the interest rate for one-year central bank-announced demand deposit interest rate; the disposal value was determined using the direct capitalization method under the income approach. The expected future cash outflows to be incurred by investment properties include expenditure such as land value taxes, house taxes, insurance premium, maintenance costs and others. This expenditure was extrapolated on the basis of the current level of expenditure, taking into account the future adjustment to the government-announced land value, and the tax rate promulgated under the House Tax Act. The discount rate was determined by reference to the interest rate for two-year time deposits as posted by Chunghwa Post Co., Ltd., plus 0.75%, or estimated income capitalization rate, whichever is higher, as well as any asset-specific risk premiums. As of December 31, 2019 and 2018, the risk premiums were both 0.23%-2.66%, respectively. Refer to Note 31 for the carrying amount of investment properties pledged by the Corporation as collaterals for borrowings.
16. INTANGIBLE ASSETS
Computer Software
Cost Balance at January 1, 2018 $ 159,611 Additions 2,693 Balance at December 31, 2018 162,304
(Continued)
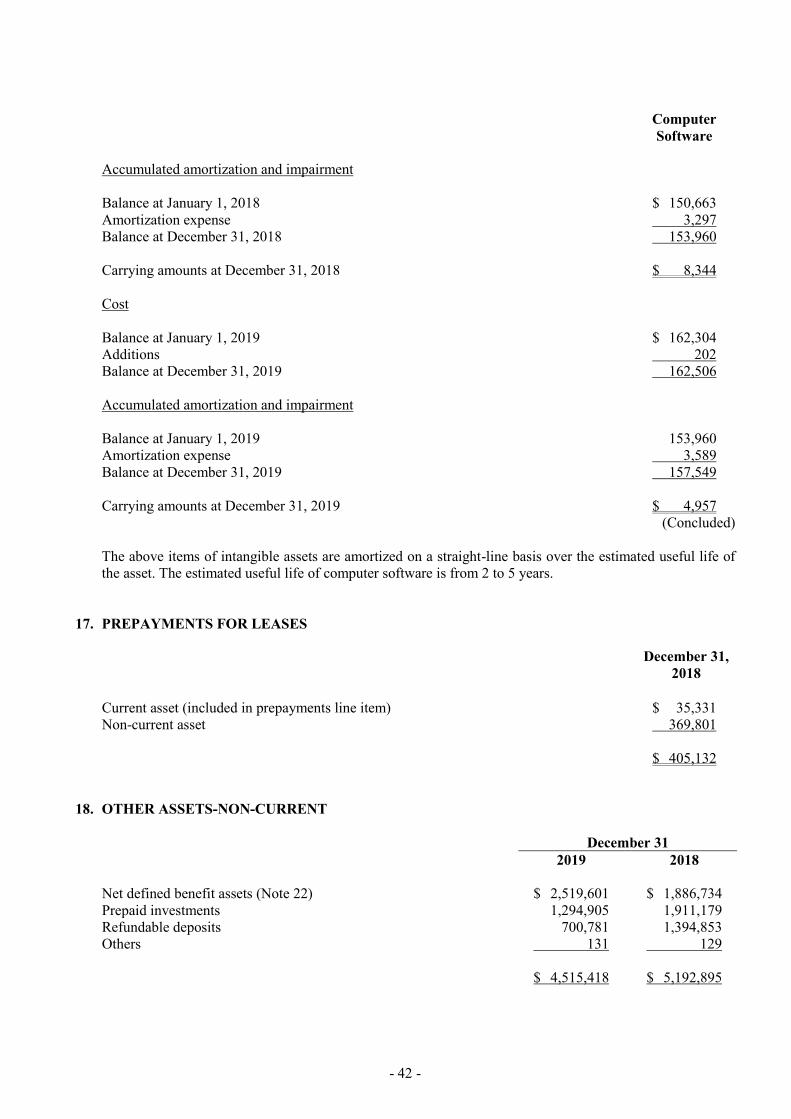
- 42 -
Computer Software
Accumulated amortization and impairment Balance at January 1, 2018 $ 150,663 Amortization expense 3,297 Balance at December 31, 2018 153,960 Carrying amounts at December 31, 2018 $ 8,344 Cost Balance at January 1, 2019 $ 162,304 Additions 202 Balance at December 31, 2019 162,506 Accumulated amortization and impairment Balance at January 1, 2019 153,960 Amortization expense 3,589 Balance at December 31, 2019 157,549 Carrying amounts at December 31, 2019 $ 4,957
(Concluded) The above items of intangible assets are amortized on a straight-line basis over the estimated useful life of the asset. The estimated useful life of computer software is from 2 to 5 years.
17. PREPAYMENTS FOR LEASES
December 31,
2018 Current asset (included in prepayments line item) $ 35,331 Non-current asset 369,801 $ 405,132
18. OTHER ASSETS-NON-CURRENT
December 31 2019 2018 Net defined benefit assets (Note 22) $ 2,519,601 $ 1,886,734 Prepaid investments 1,294,905 1,911,179 Refundable deposits 700,781 1,394,853 Others 131 129 $ 4,515,418 $ 5,192,895

- 43 -
On March 23, 2017, the Corporation acquired 155 thousand issued shares of China Shanshui Investment Company Limited (CSI) in the amount of HK$577,662 thousand from six shareholders of CSI under a share purchase agreement. The Corporation already obtained the physical share certificates of the acquired CSI shares. Pursuant to the Articles of Association of CSI, the share ownership can only be recorded on the register of shareholders if the board of directors of CSI approves the share transfer. The Corporation submitted all necessary documents to CSI for registration of the share transfer. However, CSCGL and its subsidiaries obtained from the High Court of Hong Kong an injunction order by way of an ex-parte application on April 11, 2017. Pursuant to the injunction order, four out of the abovementioned six shareholders, Mi Jingtian, Zhao Liping, Li Maohuan and Yu Yuchuan, are prohibited from removing any of their assets in Hong Kong. Each of their assets’ value is up to RMB142 million (or its Hong Kong dollar equivalent), in particular, their shares in CSI and/or any proceeds from sales of any such CSI shares. The Corporation is neither a plaintiff nor a defendant in the aforesaid proceedings. But, for the purpose of securing and exercising the rights and interests of the acquired shares of CSI, the Corporation provided a bank guarantee of RMB142 million to the High Court of Hong Kong according to the High Court’s ruling on April 21, 2017. On the same day, the High Court of Hong Kong lifted the injunction order on the shares of CSI acquired by the Corporation. Since the payment liability event as agreed in the bank guarantee did not occur before due date and the bank guarantee expired on April 21, 2019, the Corporation’s obligations were terminated on the same day. In addition, Chan Hongqing, a PRC individual, claimed that the CSI shares which the Corporation acquired from the abovementioned four shareholders were pledged as collaterals under a loan contract signed on August 17, 2015 with him and thus applied for arbitration with China International Economic and Trade Arbitration Commission in Beijing. Later, by an order of the High Court of Hong Kong on June 27, 2017, it requested the appointment of interim receivers in respect of the CSI shares held by the four shareholders until the end of the arbitral proceedings. On May 17, 2018, the High Court of Hong Kong set aside the order before the final award of the arbitration. The arbitral proceeding was therefore terminated on June 12, 2018. On October 2, 2018, Chan Hongqing applied to the High Court of Hong Kong for interlocutory relief in another proceedings against the Corporation to prohibit the Corporation and the abovementioned four CSI shareholders from transferring and registering their CSI shares. Then his application for interlocutory relief was dismissed by the High Court of Hong Kong. The Corporation engaged lawyers to proactively liaise with the board of directors of CSI in connection with the registration of the share transfer. As for the shares acquired from the other two CSI shareholders, Dong Chengtian and Wang Yongping, Chan Hongqing also claimed that the CSI shares held by the two shareholders were pledged as collaterals under the same loan contract mentioned above. As a result, the board of directors of CSI refused to approve the share transfer. Later, as the Corporation filed a lawsuit to the High Court of Hong Kong against CSI, the board of directors of CSI finally approved the share transfer. The registration of the CSI shares acquired from the two shareholders, Dong Chengtian and Wang Yongping, were completed and the prepaid investments in the balance sheets was therefore reclassified to financial assets at fair value through other comprehensive income - non-current. Refer to Note 8.
19. SHORT-TERM BILLS PAYABLE
December 31 2019 2018 Commercial paper $ 10,760,000 $ 11,440,000 Less: Unamortized discounts on bills payable 2,094 2,896 $ 10,757,906 $ 11,437,104 Interest rate (%) 0.38%-0.68% 0.36%-0.80%
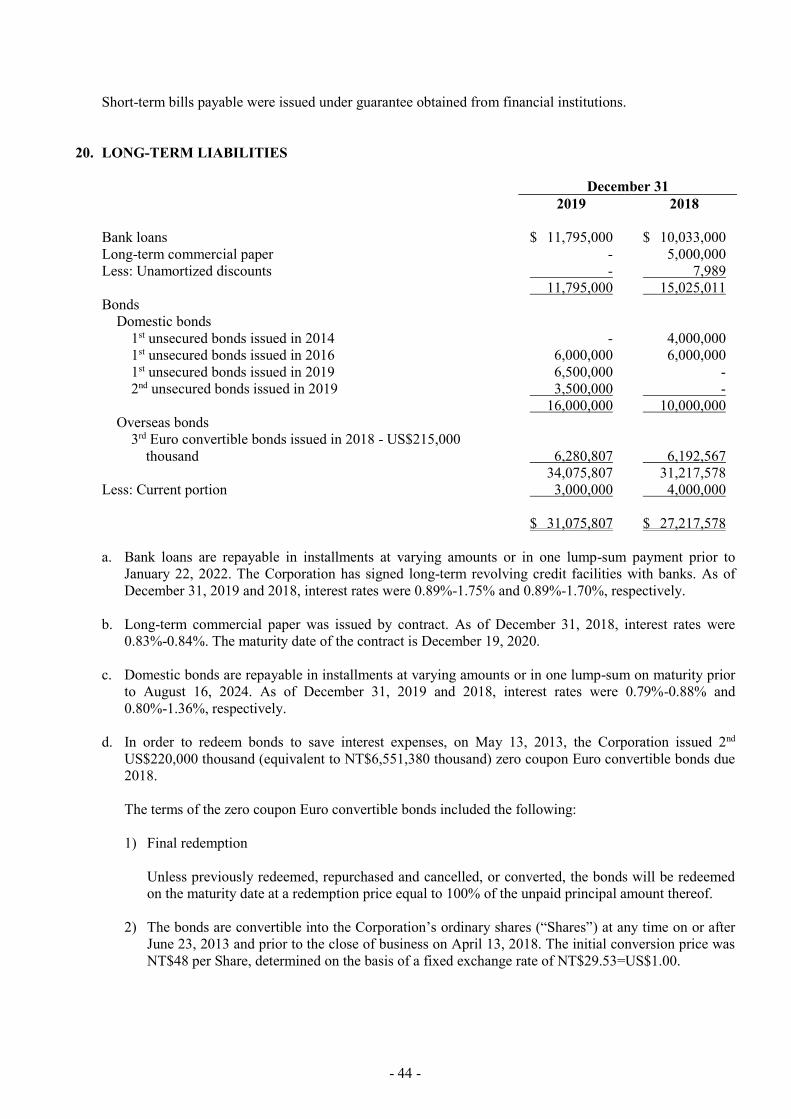
- 44 -
Short-term bills payable were issued under guarantee obtained from financial institutions. 20. LONG-TERM LIABILITIES
December 31 2019 2018 Bank loans $ 11,795,000 $ 10,033,000 Long-term commercial paper - 5,000,000 Less: Unamortized discounts - 7,989 11,795,000 15,025,011 Bonds
Domestic bonds 1st unsecured bonds issued in 2014 - 4,000,000 1st unsecured bonds issued in 2016 6,000,000 6,000,000 1st unsecured bonds issued in 2019 6,500,000 - 2nd unsecured bonds issued in 2019 3,500,000 -
16,000,000 10,000,000 Overseas bonds
3rd Euro convertible bonds issued in 2018 - US$215,000 thousand 6,280,807 6,192,567
34,075,807 31,217,578 Less: Current portion 3,000,000 4,000,000 $ 31,075,807 $ 27,217,578 a. Bank loans are repayable in installments at varying amounts or in one lump-sum payment prior to
January 22, 2022. The Corporation has signed long-term revolving credit facilities with banks. As of December 31, 2019 and 2018, interest rates were 0.89%-1.75% and 0.89%-1.70%, respectively.
b. Long-term commercial paper was issued by contract. As of December 31, 2018, interest rates were
0.83%-0.84%. The maturity date of the contract is December 19, 2020. c. Domestic bonds are repayable in installments at varying amounts or in one lump-sum on maturity prior
to August 16, 2024. As of December 31, 2019 and 2018, interest rates were 0.79%-0.88% and 0.80%-1.36%, respectively.
d. In order to redeem bonds to save interest expenses, on May 13, 2013, the Corporation issued 2nd
US$220,000 thousand (equivalent to NT$6,551,380 thousand) zero coupon Euro convertible bonds due 2018. The terms of the zero coupon Euro convertible bonds included the following: 1) Final redemption
Unless previously redeemed, repurchased and cancelled, or converted, the bonds will be redeemed on the maturity date at a redemption price equal to 100% of the unpaid principal amount thereof.
2) The bonds are convertible into the Corporation’s ordinary shares (“Shares”) at any time on or after June 23, 2013 and prior to the close of business on April 13, 2018. The initial conversion price was NT$48 per Share, determined on the basis of a fixed exchange rate of NT$29.53=US$1.00.
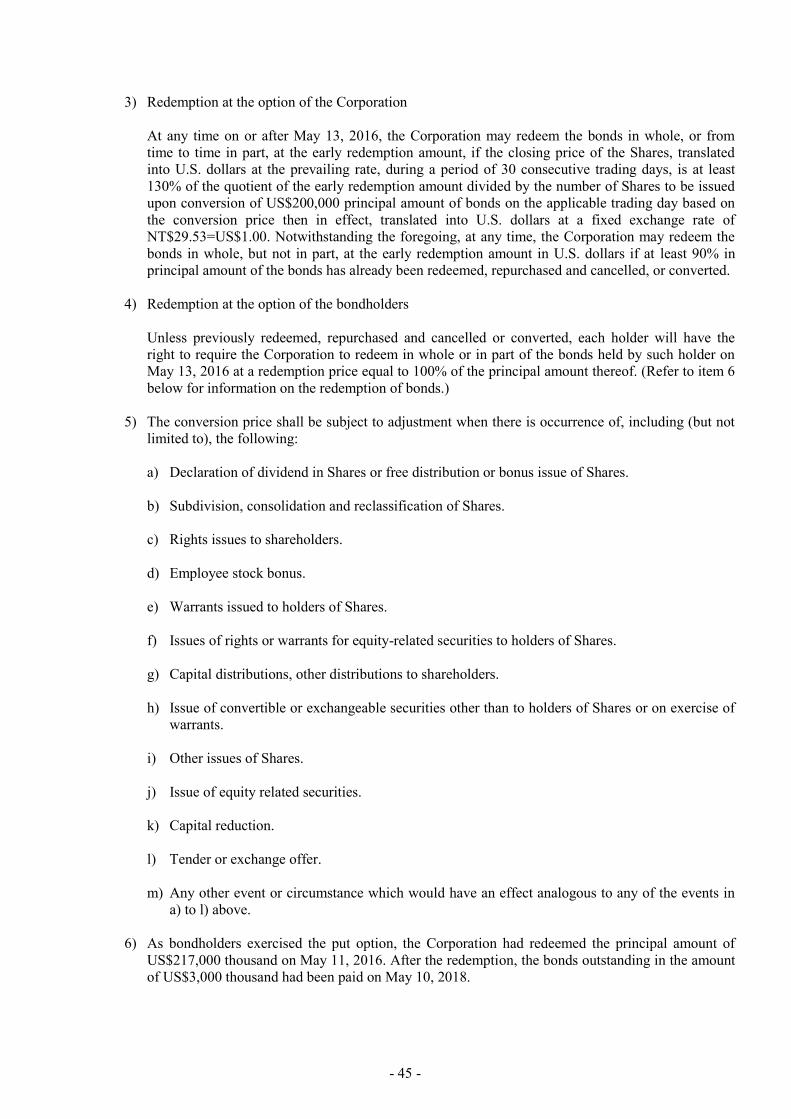
- 45 -
3) Redemption at the option of the Corporation At any time on or after May 13, 2016, the Corporation may redeem the bonds in whole, or from time to time in part, at the early redemption amount, if the closing price of the Shares, translated into U.S. dollars at the prevailing rate, during a period of 30 consecutive trading days, is at least 130% of the quotient of the early redemption amount divided by the number of Shares to be issued upon conversion of US$200,000 principal amount of bonds on the applicable trading day based on the conversion price then in effect, translated into U.S. dollars at a fixed exchange rate of NT$29.53=US$1.00. Notwithstanding the foregoing, at any time, the Corporation may redeem the bonds in whole, but not in part, at the early redemption amount in U.S. dollars if at least 90% in principal amount of the bonds has already been redeemed, repurchased and cancelled, or converted.
4) Redemption at the option of the bondholders Unless previously redeemed, repurchased and cancelled or converted, each holder will have the right to require the Corporation to redeem in whole or in part of the bonds held by such holder on May 13, 2016 at a redemption price equal to 100% of the principal amount thereof. (Refer to item 6 below for information on the redemption of bonds.)
5) The conversion price shall be subject to adjustment when there is occurrence of, including (but not limited to), the following: a) Declaration of dividend in Shares or free distribution or bonus issue of Shares. b) Subdivision, consolidation and reclassification of Shares. c) Rights issues to shareholders. d) Employee stock bonus. e) Warrants issued to holders of Shares. f) Issues of rights or warrants for equity-related securities to holders of Shares. g) Capital distributions, other distributions to shareholders. h) Issue of convertible or exchangeable securities other than to holders of Shares or on exercise of
warrants. i) Other issues of Shares. j) Issue of equity related securities. k) Capital reduction. l) Tender or exchange offer. m) Any other event or circumstance which would have an effect analogous to any of the events in
a) to l) above.
6) As bondholders exercised the put option, the Corporation had redeemed the principal amount of US$217,000 thousand on May 11, 2016. After the redemption, the bonds outstanding in the amount of US$3,000 thousand had been paid on May 10, 2018.
- 46 -
e. In order to repay debt, save interest expenses, and strengthen the Corporation’s financial structure, on September 21, 2018, the Corporation issued 3rd US$215,000 thousand (equivalent to NT$6,620,710 thousand) zero coupon Euro convertible bonds due 2023. The terms of the zero coupon Euro convertible bonds included the following: 1) Final redemption
Unless previously redeemed, repurchased and canceled, or converted, the Bonds will be redeemed on the maturity date at the settlement equivalent of 103.04% of the unpaid principal amount thereof.
2) The bonds are convertible into the Corporation’s common shares (“Shares”) at any time on or after December 21, 2018 and prior to the close of business on August 22, 2023. The initial conversion price was NT$42.24 per Share, determined on the basis of a fixed exchange rate of NT$30.794=US$1.00.
3) Redemption at the option of the Corporation
At any time on or after September 21, 2021, the Corporation may redeem the bonds in whole, or from time to time in part, at the early redemption amount, if the closing price of the Shares, translated into U.S. dollars at the prevailing rate, during a period of 30 consecutive trading days, is at least 130% of the quotient of the early redemption amount divided by the number of Shares to be issued upon conversion of US$200,000 principal amount of the bonds on the applicable trading day based on the conversion price then in effect, translated into U.S. dollars at a fixed exchange rate of NT$30.794=US$1.00. Notwithstanding the foregoing, at any time, the Corporation may redeem the bonds in whole, but not in part, at the early redemption amount in U.S. dollars if at least 90% in principal amount of the bonds has already been redeemed, repurchased and cancelled, or converted.
4) Redemption at the option of the bondholders Unless previously redeemed, repurchased and cancelled or converted, each holder will have the right to require the Corporation to redeem in whole or in part of the bonds held by such holder on September 21, 2021 at a redemption price equal to the settlement equivalent of 101.81% of the principal amount in U.S. dollars. Any U.S. dollar denominated amount payable in respect of the bonds will be converted into NT dollars using a fixed exchange rate and then converted back to a U.S. dollar amount using the applicable prevailing rate at the time of redemption.
5) The conversion price shall be subject to adjustment when there is occurrence of, including (but not limited to), the following: a) Declaration of dividend in Shares or free distribution or bonus issue of Shares. b) Subdivision, consolidation and reclassification of Shares. c) Rights issues to shareholders. d) Employee stock bonus. e) Warrants issued to holders of Shares. f) Issues of rights or warrants for equity-related securities to holders of Shares. g) Capital distributions, other distributions to shareholders. h) Issue of convertible or exchangeable securities other than to holders of Shares or on exercise of
warrants.

- 47 -
i) Other issues of Shares. j) Issue of equity related securities. k) Capital reduction. l) Tender or exchange offer. m) Any other event or circumstance which would have an effect analogous to any of the events in
a) to l) above. The conversion price was NT$39.7 as of December 31, 2019. 21. DEFERRED REVENUE
December 31 2019 2018 Land use right $ 790,753 $ 858,838 Others 133,052 140,879 $ 923,805 $ 999,717 Current $ 75,912 $ 75,912 Non-current $ 847,893 $ 923,805 a. The deferred revenue on land use rights in Lin-Ya, Kaohsiung granted to FEDSDL (Note 15) is
amortized to income over 50 years on a straight-line basis. b. The deferred revenue on land use rights of Taipei Metro granted to YDC (Note 15) is amortized to
income over 30 years on a straight-line basis. 22. RETIREMENT BENEFIT PLANS
a. Defined contribution plans
The Corporation adopted a pension plan under the Labor Pension Act (LPA), which is a state-managed defined contribution plan. Under the LPA, an entity makes monthly contributions to employees’ individual pension accounts at specified percentage of monthly salaries and wages.
b. Defined benefit plans
The defined benefit plan adopted by the Corporation in accordance with the Labor Standards Law is operated by the government. Pension benefits are calculated on the basis of the length of service and average monthly salaries of the six months before retirement. The Corporation contributes amounts equal to 8% of total monthly salaries and wages to a pension fund administered by the pension fund monitoring committee. Pension contributions are deposited in the Bank of Taiwan in the committee’s name. Before the end of each year, the Corporation assesses the balance in the pension fund. If the amount of the balance in the pension fund is inadequate to pay retirement benefits for employees who conform to retirement requirements in the next year, the Corporation is required to fund the difference in one appropriation that should be made before the end of March of the next year. The pension fund is managed by the Bureau of Labor Funds, Ministry of Labor (the “Bureau”); the Corporation has no right to influence the investment policy and strategy.
- 48 -
The amounts included in the balance sheets in respect of the Corporation’s defined benefit plans were as follows: December 31 2019 2018 Present value of defined benefit obligation $ 803,450 $ 804,119 Fair value of plan assets (3,323,051) (2,690,853) Surplus (2,519,601) (1,886,734) Net defined benefit asset $ (2,519,601) $ (1,886,734) Movements in net defined benefit assets were as follows:
Present Value of the Defined
Benefit Obligation
Fair Value of the Plan Assets
Net Defined Benefit
Liability (Asset) Balance at January 1, 2018 $ 1,006,401 $ (2,523,022) $ (1,516,621) Service cost
Current service cost 9,207 - 9,207 Net interest expense (income) 12,077 (30,276) (18,199)
Recognized in profit or loss 21,284 (30,276) (8,992) Remeasurement
Return on plan assets (excluding amounts included in net interest) - (293,637) (293,637)
Actuarial loss - changes in financial assumptions 6,943 - 6,943
Actuarial loss - experience adjustments (45,762) - (45,762) Recognized in other comprehensive income (38,819) (293,637) (332,456) Benefits paid (184,747) 156,082 (28,665) Balance at December 31, 2018 $ 804,119 $ (2,690,853) $ (1,886,734) Balance at January 1, 2019 $ 804,119 $ (2,690,853) $ (1,886,734) Service cost
Current service cost 5,970 - 5,970 Net interest expense (income) 8,845 (29,599) (20,754)
Recognized in profit or loss 14,815 (29,599) (14,784) Remeasurement
Return on plan assets (excluding amounts included in net interest) - (661,669) (661,669)
Actuarial loss - changes in financial assumptions 6,530 - 6,530
Actuarial loss - experience adjustments 71,081 - 71,081 Recognized in other comprehensive income 77,611 (661,669) (584,058) Benefits paid (93,095) 59,070 (34,025) Balance at December 31, 2019 $ 803,450 $ (3,323,051) $ (2,519,601)
- 49 -
Through the defined benefit plans under the Labor Standards Law, the Corporation is exposed to the following risks: 1) Investment risk: The plan assets are invested in domestic and foreign equity and debt securities,
bank deposits, etc. The investment is conducted at the discretion of the Bureau or under the mandated management. However, in accordance with relevant regulations, the return generated by plan assets should not be below the interest rate for a 2-year time deposit with local banks.
2) Interest risk: A decrease in the corporate bond interest rate will increase the present value of the
defined benefit obligation; however, this will be partially offset by an increase in the return on the plan’s debt investments.
3) Salary risk: The present value of the defined benefit obligation is calculated by reference to the
future salaries of plan participants. As such, an increase in the salary of the plan participants will increase the present value of the defined benefit obligation.
The actuarial valuations of the present value of the defined benefit obligation were carried out by qualified actuaries. The significant assumptions used for the purposes of the actuarial valuations were as follows: December 31 2019 2018 Discount rate(s) 1.00% 1.10% Expected rate(s) of salary increase 2.00% 2.00% If possible reasonable change in each of the significant actuarial assumptions will occur and all other assumptions will remain constant, the present value of the defined benefit obligation would increase (decrease) as follows: December 31 2019 2018 Discount rate(s)
0.25% increase $ (16,169) $ (17,187) 0.25% decrease $ 16,697 $ 17,768
Expected rate(s) of salary increase 1% increase $ 68,726 $ 73,337 1% decrease $ (61,703) $ (65,545)
The major categories of plan assets at the end of the reporting period are disclosed based on the information announced by the Bureau: December 31 2019 2018 Equity instruments 86.82 88.73 Deposited in financial institutions 8.26 5.85 Others 4.92 5.42 100.00 100.00

- 50 -
The sensitivity analysis presented above may not be representative of the actual change in the present value of the defined benefit obligation as it is unlikely that the change in assumptions would occur in isolation of one another as some of the assumptions may be correlated. December 31 2019 2018 The expected contributions to the plan for the next year $ - $ - The average duration of the defined benefit obligation 9.3 years 10 years
23. EQUITY
a. Share capital
December 31 2019 2018 Number of shares authorized (in thousands) 4,000,000 4,000,000 Shares authorized $ 40,000,000 $ 40,000,000 Number of shares issued and fully paid (in thousands) 3,361,447 3,361,447 Shares issued $ 33,614,472 $ 33,614,472 Fully paid ordinary shares, which have a par value of $10, carry one vote per share and carry a right to dividends. The total of 350,000 thousand and 10,000 thousand shares of the Corporation’s authorized shares are reserved for the issuance of convertible bonds and employee share option, respectively.
b. Capital surplus
December 31 2019 2018 May be used to offset a deficit, distributed as cash dividends, or transferred to share capital (1) Donation $ 41,790 $ 41,790 The difference between consideration received or paid and the
carrying amount of the subsidiaries’ net assets during actual acquisition or disposal 54,907 54,907
Change of capital surplus of subsidiaries and associates accounted for using equity method (2) 992,530 992,530
1,089,227 1,089,227 May be used to offset a deficit only Change of capital surplus of subsidiaries and associates
accounted for using equity method (3) 128,141 38,085 May not be used for any purpose Share warrants 185,411 185,411 Change of capital surplus of subsidiaries and associates
accounted for using equity method 53,275 49,831 238,686 235,242 $ 1,465,054 $ 1,362,554
- 51 -
1) Such capital surplus may be used to offset a deficit; in addition, when the Corporation has no
deficit, such capital surplus may be distributed as cash dividends or transferred to share capital (limited to a certain percentage of the Corporation’s capital surplus and to once a year).
2) Such capital surplus from the effect of changes in associate’s ownership interest in its subsidiary
that resulted from actual acquisition and disposal of equity may be used to offset a deficit or distributed as cash dividends or share dividends under Article 241-1 of Company Act.
3) Such capital surplus from the effect of changes in associate’s ownership interest in its subsidiary
that resulted from equity transactions other than actual acquisition and disposal may be used to offset a deficit under Article 239-1 of Company Act.
c. Retained earnings and dividends policy
Under the Corporation’s dividends policy, where the Corporation has a profit at the end of a fiscal year, the Corporation shall first pay business income taxes based on law and then offset losses of previous years, and if there is any remaining profit, 10% of the balance shall be appropriated as legal reserve. In addition, appropriation for special reserve shall be made based on provisions of law. Any remaining amount of profit together with the accumulated undistributed earnings of the previous year shall be allocated for distribution to shareholders. However, depending on the condition of the business, part of the profit may be retained. In case of an increase in the capital of the Corporation, the shareholders’ bonus for the new shares in the year of issue shall be decided in the shareholders’ meeting. For the policies on distribution of employees’ compensation and remuneration of directors, refer to employees’ compensation and remuneration of directors in Note 25(f). The distribution of shareholders’ dividend shall take into consideration the changes in the outlook of the Corporation’s businesses, the lifespan of the various products or services that have an impact on future capital needs and taxation. Shareholders’ dividend shall be distributed with the aim of maintaining stable shareholders’ dividend distributions. Save for the purposes of improving the financial structure, reinvestments, production expansion or other capital expenditures in which capital is required, when distributing shareholders’ dividend, the dividend payout ratio each fiscal year shall be no less than 50% of the final surplus which is the sum of after-tax profit of the fiscal year to withhold previous loss, if any, legal reserve and special reserve as required by law; the cash dividend shall not be less than 10% of the total shareholders’ dividend distributed in the same year. These appropriations shall be resolved by the shareholders in the following year and given effect to in the financial statements of that year. The legal reserve may be used to offset deficits. If the Corporation has no deficit and the legal reserve has exceeded 25% of the Corporation’s paid-in capital, the excess may be transferred to capital or distributed in cash. The Corporation is required to appropriate to or reverse from special reserve amounts that pertains to items referred to under Rule No. 1010012865, Rule No. 1010047490 and Rule No. 1030006415 issued by the FSC and the directive titled “Questions and Answers for Special Reserves Appropriated Following Adoption of IFRSs”.
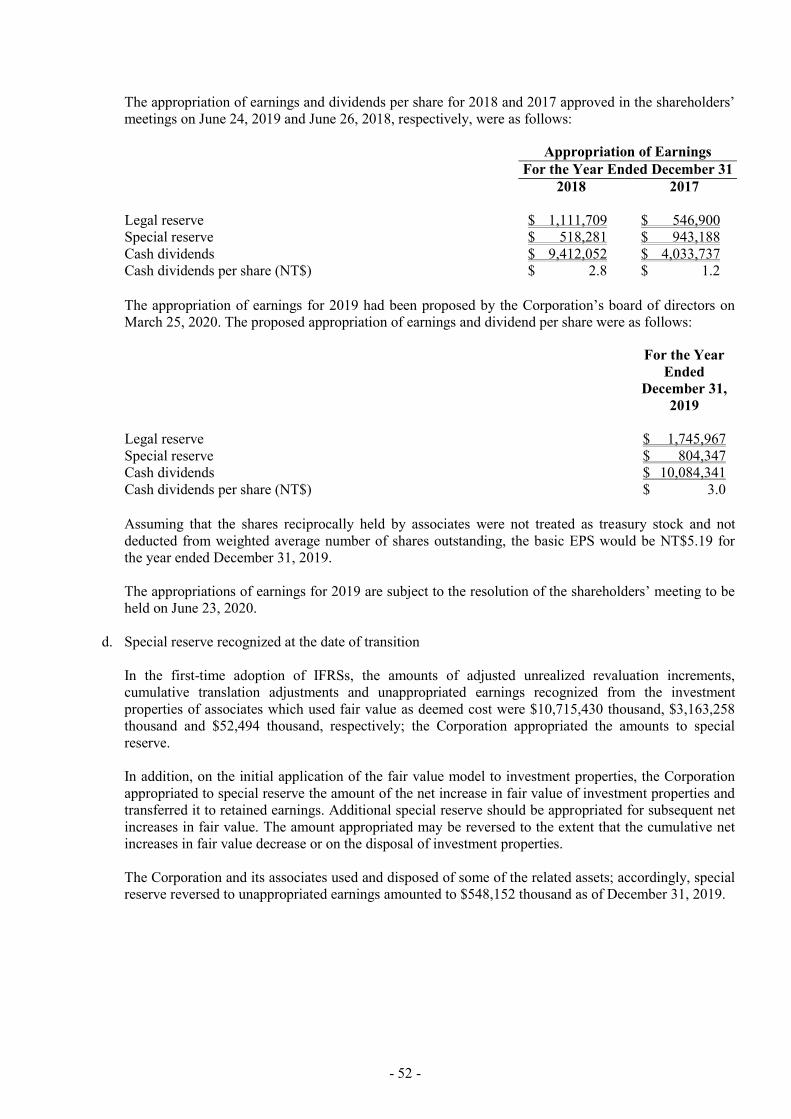
- 52 -
The appropriation of earnings and dividends per share for 2018 and 2017 approved in the shareholders’ meetings on June 24, 2019 and June 26, 2018, respectively, were as follows: Appropriation of Earnings For the Year Ended December 31 2018 2017 Legal reserve $ 1,111,709 $ 546,900 Special reserve $ 518,281 $ 943,188 Cash dividends $ 9,412,052 $ 4,033,737 Cash dividends per share (NT$) $ 2.8 $ 1.2
The appropriation of earnings for 2019 had been proposed by the Corporation’s board of directors on March 25, 2020. The proposed appropriation of earnings and dividend per share were as follows:
For the Year Ended
December 31, 2019
Legal reserve $ 1,745,967 Special reserve $ 804,347 Cash dividends $ 10,084,341 Cash dividends per share (NT$) $ 3.0
Assuming that the shares reciprocally held by associates were not treated as treasury stock and not deducted from weighted average number of shares outstanding, the basic EPS would be NT$5.19 for the year ended December 31, 2019. The appropriations of earnings for 2019 are subject to the resolution of the shareholders’ meeting to be held on June 23, 2020.
d. Special reserve recognized at the date of transition In the first-time adoption of IFRSs, the amounts of adjusted unrealized revaluation increments, cumulative translation adjustments and unappropriated earnings recognized from the investment properties of associates which used fair value as deemed cost were $10,715,430 thousand, $3,163,258 thousand and $52,494 thousand, respectively; the Corporation appropriated the amounts to special reserve. In addition, on the initial application of the fair value model to investment properties, the Corporation appropriated to special reserve the amount of the net increase in fair value of investment properties and transferred it to retained earnings. Additional special reserve should be appropriated for subsequent net increases in fair value. The amount appropriated may be reversed to the extent that the cumulative net increases in fair value decrease or on the disposal of investment properties. The Corporation and its associates used and disposed of some of the related assets; accordingly, special reserve reversed to unappropriated earnings amounted to $548,152 thousand as of December 31, 2019.
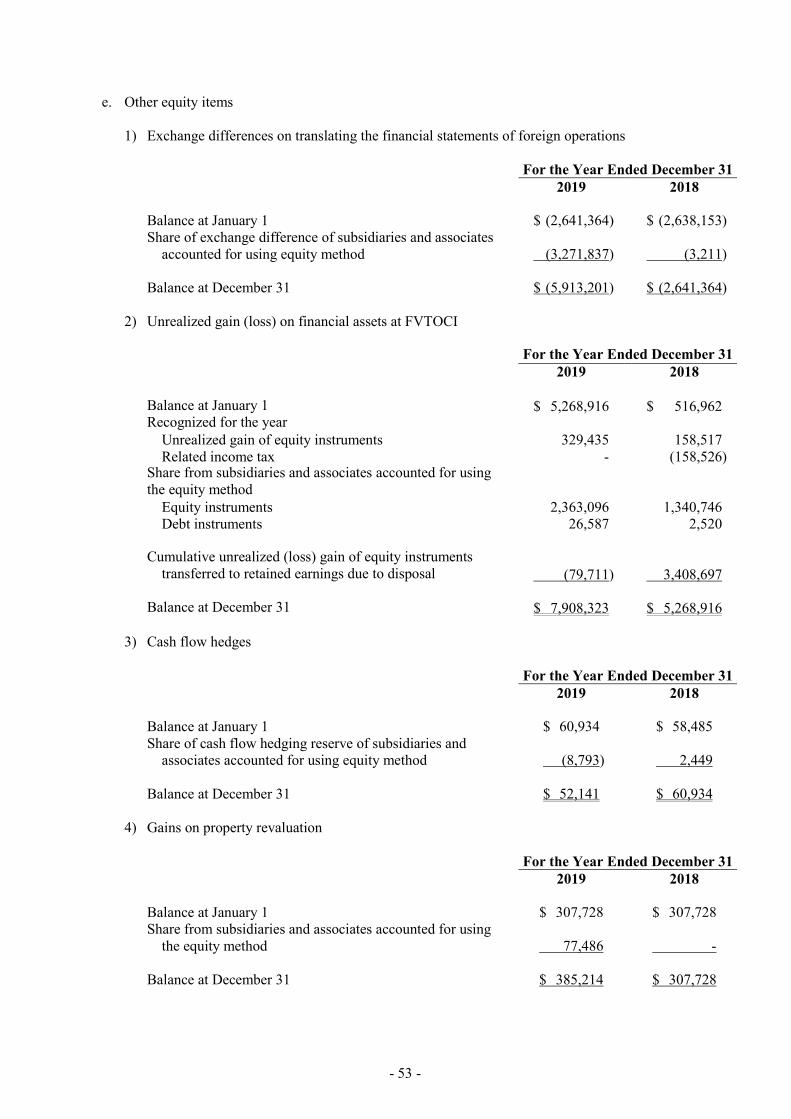
- 53 -
e. Other equity items 1) Exchange differences on translating the financial statements of foreign operations
For the Year Ended December 31 2019 2018 Balance at January 1 $ (2,641,364) $ (2,638,153) Share of exchange difference of subsidiaries and associates
accounted for using equity method (3,271,837) (3,211) Balance at December 31 $ (5,913,201) $ (2,641,364)
2) Unrealized gain (loss) on financial assets at FVTOCI
For the Year Ended December 31 2019 2018 Balance at January 1 $ 5,268,916 $ 516,962 Recognized for the year
Unrealized gain of equity instruments 329,435 158,517 Related income tax - (158,526)
Share from subsidiaries and associates accounted for using the equity method
Equity instruments 2,363,096 1,340,746 Debt instruments 26,587 2,520
Cumulative unrealized (loss) gain of equity instruments transferred to retained earnings due to disposal (79,711)
3,408,697
Balance at December 31 $ 7,908,323 $ 5,268,916
3) Cash flow hedges
For the Year Ended December 31 2019 2018 Balance at January 1 $ 60,934 $ 58,485 Share of cash flow hedging reserve of subsidiaries and
associates accounted for using equity method (8,793) 2,449 Balance at December 31 $ 52,141 $ 60,934
4) Gains on property revaluation
For the Year Ended December 31 2019 2018 Balance at January 1 $ 307,728 $ 307,728 Share from subsidiaries and associates accounted for using
the equity method 77,486 - Balance at December 31 $ 385,214 $ 307,728
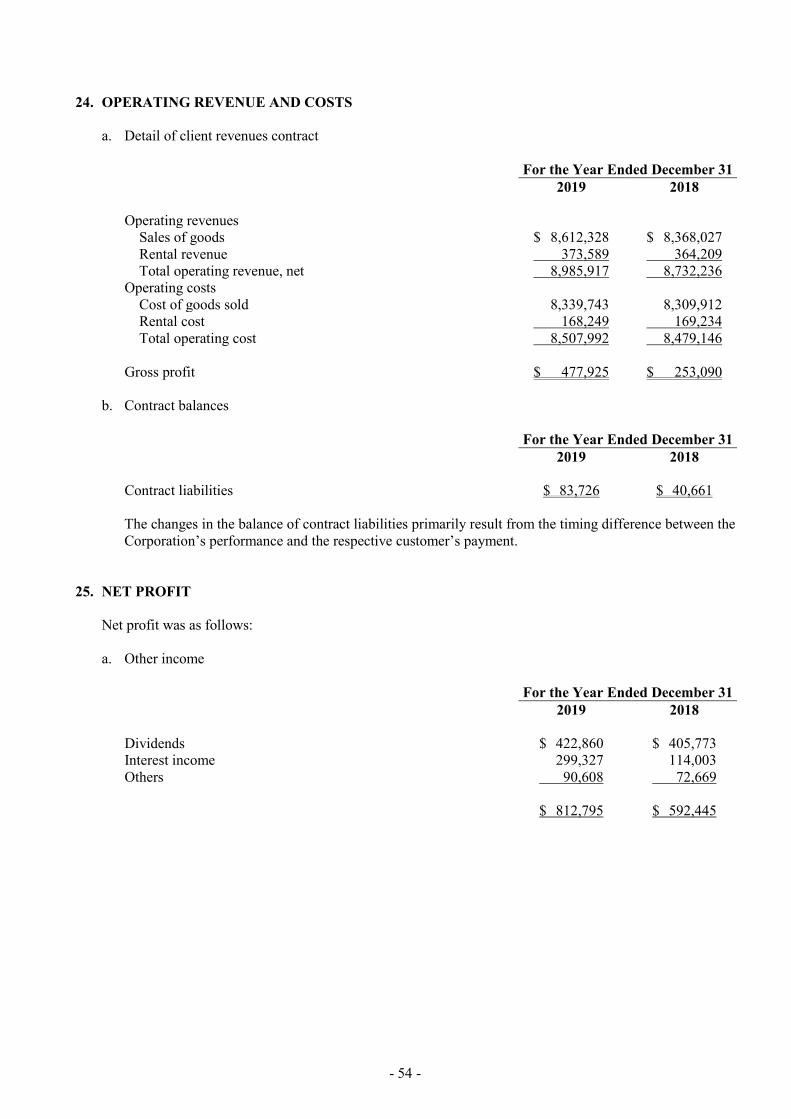
- 54 -
24. OPERATING REVENUE AND COSTS a. Detail of client revenues contract
For the Year Ended December 31 2019 2018 Operating revenues
Sales of goods $ 8,612,328 $ 8,368,027 Rental revenue 373,589 364,209 Total operating revenue, net 8,985,917 8,732,236
Operating costs Cost of goods sold 8,339,743 8,309,912 Rental cost 168,249 169,234 Total operating cost 8,507,992 8,479,146
Gross profit $ 477,925 $ 253,090
b. Contract balances
For the Year Ended December 31 2019 2018 Contract liabilities $ 83,726 $ 40,661 The changes in the balance of contract liabilities primarily result from the timing difference between the Corporation’s performance and the respective customer’s payment.
25. NET PROFIT Net profit was as follows: a. Other income
For the Year Ended December 31 2019 2018 Dividends $ 422,860 $ 405,773 Interest income 299,327 114,003 Others 90,608 72,669 $ 812,795 $ 592,445

- 55 -
b. Other gains and losses
For the Year Ended December 31 2019 2018 Net gain on fair value changes of financial assets and liabilities
designated as at fair value through profit or loss $ 673,850 $ 171,737 Gain (Loss) on changes in fair value of investment properties 399,682 (331,211) Net foreign exchange (losses) gains (69,940) 36,987 Bank charges (56,435) (61,313) Gain on disposal of property, plant and equipment 40 4,053 Miscellaneous expenses (133,087) (462,053) $ 814,110 $ (641,800)
c. Finance costs
For the Year Ended December 31 2019 2018 Interest on bank loans $ 367,573 $ 332,211 Interest on lease liabilities 1,618 - Other interest expenses 388 - Less: Amounts included in the cost of qualifying assets
(capitalized interest) (230) (227) $ 369,349 $ 331,984 Information about capitalized interest was as follows: For the Year Ended December 31 2019 2018 Capitalized interest $ 230 $ 227 Capitalization rate 0.758%-0.988% 0.726%-1.139%
d. Depreciation and amortization
For the Year Ended December 31 2019 2018 An analysis of depreciation by function
Operating costs $ 521,270 $ 462,524 Operating expenses 1,380 1,783 Non-operating expenses 976 474
$ 523,626 $ 464,781 An analysis of amortization by function
Operating expenses $ 3,589 $ 3,297

- 56 -
e. Employee benefits expense
For the Year Ended December 31, 2019
Operating
Costs Operating Expenses
Non-operating Expenses Total
Post-employment benefits (Note 22)
Defined contribution plans $ 10,018 $ 3,987 $ - $ 14,005 Defined benefit plans (8,885) (5,899) - (14,784)
Short-term benefits Salary 391,835 232,757 9,492 634,084 Remuneration of directors - 231,712 - 231,712 Labor and health insurance 31,264 11,290 (1) 42,553 Other employees-related expenses 9,946 4,350 6 14,302
Total employee benefits expense $ 434,178 $ 478,197 $ 9,497 $ 921,872
For the Year Ended December 31, 2018
Operating
Costs Operating Expenses
Non-operating Expenses Total
Post-employment benefits (Note 22)
Defined contribution plans $ 10,268 $ 4,450 $ 80 $ 14,798 Defined benefit plans (5,211) (3,781) - (8,992)
Short-term benefits Salary 495,567 142,661 3,200 641,428 Remuneration of directors - 225,074 - 225,074 Labor and health insurance 31,453 11,001 153 42,607 Other employees-related expenses 12,551 4,564 70 17,185
Total employee benefits expense $ 544,628 $ 383,969 $ 3,503 $ 932,100 For the year of 2019 and 2018, the Corporation had average 495 and 529 employees, respectively, which included both 12 non-employee directors for both years. The Corporation’s average labor cost were $1,429 thousand and $1,368 thousand, respectively, for the years ended 2019 and 2018. Average salary and bonus were $1,313 thousand and $1,241 thousand, respectively, for the years ended 2019 and 2018. The Corporation’s average salary and bonus increased by 5.80% year over year.
f. Employees’ compensation and remuneration of directors
The Corporation accrued employees’ compensation and remuneration of directors at the rates between 1% and 4% and no higher than 2.5%, respectively, of net profit before income tax, employees’ compensation, and remuneration of directors. The employees’ compensation and remuneration of directors for the years ended December 31, 2019 and 2018 which have been approved by the Corporation’s board of directors on March 25, 2020 and March 21, 2019, respectively, were as follows: For the Year Ended December 31 2019 2018 Cash Share Cash Share Employees’ compensation $ 261,064 $ - $ 253,436 $ - Remuneration of directors 230,296 - 223,658 - If there is a change in the amounts after the annual financial statements are authorized for issue, the differences are recorded as a change in the accounting estimate.
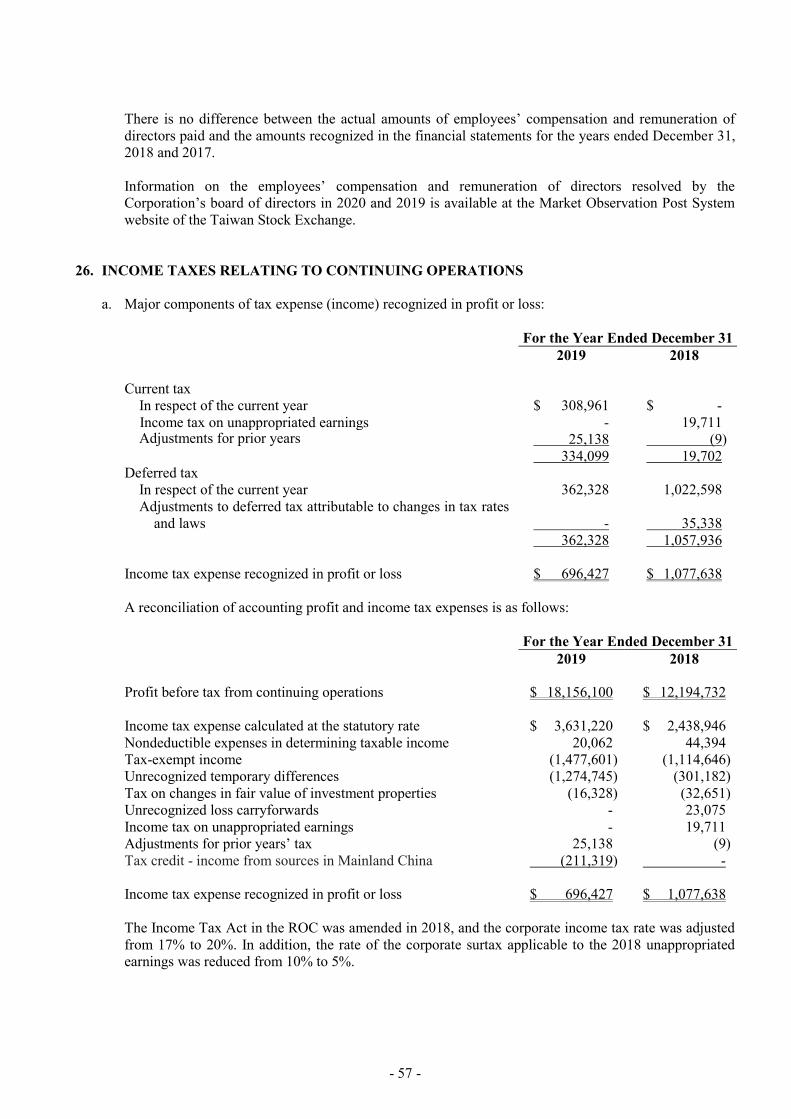
- 57 -
There is no difference between the actual amounts of employees’ compensation and remuneration of directors paid and the amounts recognized in the financial statements for the years ended December 31, 2018 and 2017. Information on the employees’ compensation and remuneration of directors resolved by the Corporation’s board of directors in 2020 and 2019 is available at the Market Observation Post System website of the Taiwan Stock Exchange.
26. INCOME TAXES RELATING TO CONTINUING OPERATIONS a. Major components of tax expense (income) recognized in profit or loss:
For the Year Ended December 31 2019 2018 Current tax
In respect of the current year $ 308,961 $ - Income tax on unappropriated earnings - 19,711 Adjustments for prior years 25,138 (9) 334,099 19,702
Deferred tax In respect of the current year 362,328 1,022,598 Adjustments to deferred tax attributable to changes in tax rates
and laws - 35,338 362,328 1,057,936
Income tax expense recognized in profit or loss $ 696,427 $ 1,077,638 A reconciliation of accounting profit and income tax expenses is as follows: For the Year Ended December 31 2019 2018 Profit before tax from continuing operations $ 18,156,100 $ 12,194,732 Income tax expense calculated at the statutory rate $ 3,631,220 $ 2,438,946 Nondeductible expenses in determining taxable income 20,062 44,394 Tax-exempt income (1,477,601) (1,114,646) Unrecognized temporary differences (1,274,745) (301,182) Tax on changes in fair value of investment properties (16,328) (32,651) Unrecognized loss carryforwards - 23,075 Income tax on unappropriated earnings - 19,711 Adjustments for prior years’ tax 25,138 (9) Tax credit - income from sources in Mainland China (211,319) - Income tax expense recognized in profit or loss $ 696,427 $ 1,077,638 The Income Tax Act in the ROC was amended in 2018, and the corporate income tax rate was adjusted from 17% to 20%. In addition, the rate of the corporate surtax applicable to the 2018 unappropriated earnings was reduced from 10% to 5%.
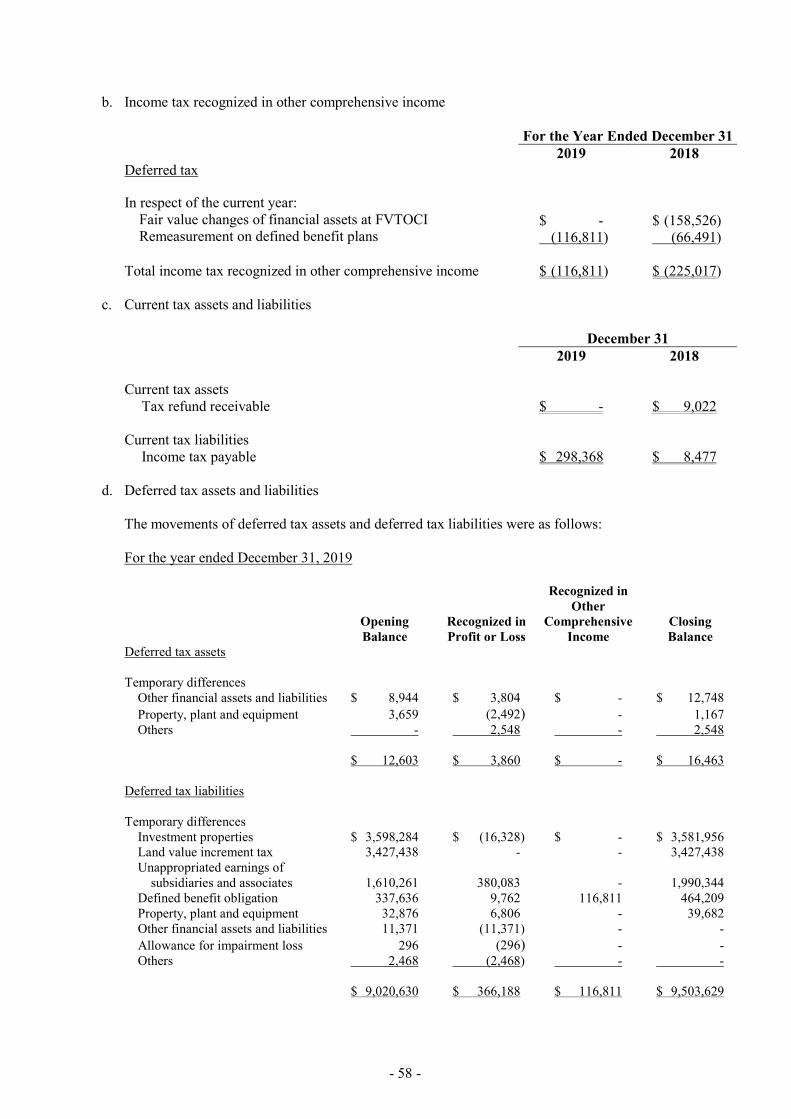
- 58 -
b. Income tax recognized in other comprehensive income
For the Year Ended December 31 2019 2018 Deferred tax In respect of the current year:
Fair value changes of financial assets at FVTOCI $ - $ (158,526) Remeasurement on defined benefit plans (116,811) (66,491)
Total income tax recognized in other comprehensive income $ (116,811) $ (225,017)
c. Current tax assets and liabilities
December 31 2019 2018 Current tax assets
Tax refund receivable $ - $ 9,022 Current tax liabilities
Income tax payable $ 298,368 $ 8,477 d. Deferred tax assets and liabilities
The movements of deferred tax assets and deferred tax liabilities were as follows: For the year ended December 31, 2019
Opening Balance
Recognized in Profit or Loss
Recognized in Other
Comprehensive Income
Closing Balance
Deferred tax assets Temporary differences
Other financial assets and liabilities $ 8,944 $ 3,804 $ - $ 12,748 Property, plant and equipment 3,659 (2,492) - 1,167 Others - 2,548 - 2,548
$ 12,603 $ 3,860 $ - $ 16,463 Deferred tax liabilities Temporary differences
Investment properties $ 3,598,284 $ (16,328) $ - $ 3,581,956 Land value increment tax 3,427,438 - - 3,427,438 Unappropriated earnings of
subsidiaries and associates 1,610,261 380,083 - 1,990,344 Defined benefit obligation 337,636 9,762 116,811 464,209 Property, plant and equipment 32,876 6,806 - 39,682 Other financial assets and liabilities 11,371 (11,371) - - Allowance for impairment loss 296 (296) - - Others 2,468 (2,468) - -
$ 9,020,630 $ 366,188 $ 116,811 $ 9,503,629

- 59 -
For the year ended December 31, 2018
Opening Balance
Recognized in Profit or Loss
Recognized in Other
Comprehensive Income
Closing Balance
Deferred tax assets Temporary differences
FVTOCI financial assets $ 158,526 $ - $ (158,526) $ - FVTPL financial assets and
liabilities - 8,944 - 8,944 Property, plant and equipment 10,460 (6,801) - 3,659
$ 168,986 $ 2,143 $ (158,526) $ 12,603 Deferred tax liabilities Temporary differences
Investment properties $ 3,630,935 $ (32,651) $ - $ 3,598,284 Land value increment tax 3,427,438 - - 3,427,438 Unappropriated earnings of
subsidiaries 563,866 1,046,395 - 1,610,261 Defined benefit obligation 244,549 26,596 66,491 337,636 Property, plant and equipment 21,746 11,130 - 32,876 Other financial assets and liabilities 4,670 6,701 - 11,371 Allowance for impairment loss 84 212 - 296 Others 772 1,696 - 2,468
$ 7,894,060 $ 1,060,079 $ 66,491 $ 9,020,630
e. The aggregate amount of temporary differences associated with investments for which deferred tax liabilities have not been recognized: As of December 31, 2019 and 2018, the taxable temporary differences associated with investments in subsidiaries for which no deferred tax liabilities have been recognized were $5,750,255 thousand and $5,104,939 thousand, respectively.
f. The income tax returns through 2017, have been assessed by the tax authorities. 27. EARNINGS PER SHARE
Unit: NT$ Per Share
For the Year Ended December 31 2019 2018 Basic earnings per share $ 5.56 $ 3.54 Diluted earnings per share $ 5.25 $ 3.49

- 60 -
The earnings and weighted average number of ordinary shares outstanding used for the earnings per share computation were as follows: Net Profit for the Year For the Year Ended December 31 2019 2018 Profit for the period attributable to owners of the Corporation $ 17,459,673 $ 11,117,094 Effect of potentially dilutive ordinary shares:
Convertible bonds (55,373) 26,638 Earnings used in the computation of diluted earnings per share $ 17,404,300 $ 11,143,732 Weighted average number of ordinary shares outstanding (in thousand shares): For the Year Ended December 31 2019 2018 Weighted average number of ordinary shares in computation of basic
earnings per share 3,138,664 3,139,152 Effect of potentially dilutive ordinary shares:
Employees’ compensation 6,888 8,585 Convertible bonds 166,769 44,656
Weighted average number of ordinary shares used in the
computation of diluted earnings per share 3,312,321 3,192,393 The weighted average number of ordinary shares used in the computation of basic earnings per share is the weighted average outstanding shares after subtracting the shares of the Corporation held by the associates treated as treasury stock. When an entity pays employee compensation that may be settled in shares or cash at the entity’s option, the entity shall presume that the employee compensation will be settled in shares, and the resulting potential shares shall be included in diluted earnings per share if the effect is dilutive. The number of shares is estimated by dividing the entire amount of the compensation by the closing price of the shares at the balance sheet date. Such dilutive effect of the potential shares is included in the computation of diluted earnings per share until the number of shares to be distributed to employees is resolved in the following year.
28. CAPITAL MANAGEMENT
The Corporation manages its capital to ensure that it will be able to continue as a going concern while maximizing the return to stakeholders through the optimization of the debt and equity balance. The capital structure of the Corporation consists of net debt (borrowings offset by cash and cash equivalents) and equity of the Corporation (comprising issued capital, reserves, retained earnings, other equity). The Corporation is not subject to any externally imposed capital requirements.
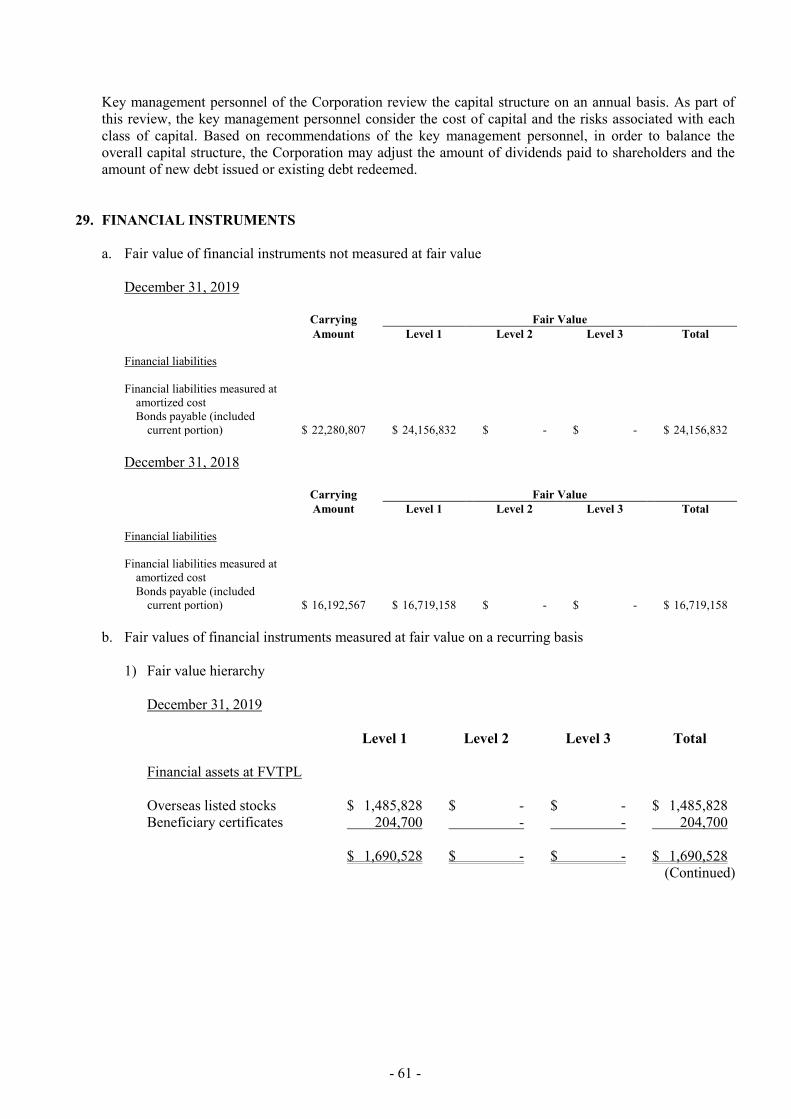
- 61 -
Key management personnel of the Corporation review the capital structure on an annual basis. As part of this review, the key management personnel consider the cost of capital and the risks associated with each class of capital. Based on recommendations of the key management personnel, in order to balance the overall capital structure, the Corporation may adjust the amount of dividends paid to shareholders and the amount of new debt issued or existing debt redeemed.
29. FINANCIAL INSTRUMENTS
a. Fair value of financial instruments not measured at fair value
December 31, 2019 Carrying Fair Value Amount Level 1 Level 2 Level 3 Total Financial liabilities Financial liabilities measured at
amortized cost Bonds payable (included
current portion) $ 22,280,807 $ 24,156,832 $ - $ - $ 24,156,832 December 31, 2018 Carrying Fair Value Amount Level 1 Level 2 Level 3 Total Financial liabilities Financial liabilities measured at
amortized cost Bonds payable (included
current portion) $ 16,192,567 $ 16,719,158 $ - $ - $ 16,719,158 b. Fair values of financial instruments measured at fair value on a recurring basis
1) Fair value hierarchy
December 31, 2019 Level 1 Level 2 Level 3 Total Financial assets at FVTPL Overseas listed stocks $ 1,485,828 $ - $ - $ 1,485,828 Beneficiary certificates 204,700 - - 204,700 $ 1,690,528 $ - $ - $ 1,690,528
(Continued)

- 62 -
Level 1 Level 2 Level 3 Total Financial assets at FVTOCI Investments in equity
instruments at FVTOCI Domestic listed stocks $ 7,751,553 $ - $ - $ 7,751,553 Domestic unlisted stocks - - 586,459 586,459 Overseas unlisted shares - - 488,258 488,258
$ 7,751,553 $ - $ 1,074,717 $ 8,826,270 Bond options $ - $ - $ 81,724 $ 81,724 Cross-currency swap contracts - - 30,346 30,346 $ - $ - $ 112,070 $ 112,070
(Concluded) December 31, 2018 Level 1 Level 2 Level 3 Total Financial assets at FVTPL Overseas listed stocks $ 1,037,426 $ - $ - $ 1,037,426 Beneficiary certificates 135,400 - - 135,400 $ 1,172,826 $ - $ - $ 1,172,826 Financial assets at FVTOCI Investments in equity
instruments at FVTOCI Domestic listed stocks $ 7,183,796 $ - $ - $ 7,183,796 Domestic unlisted stocks - - 573,372 573,372
$ 7,183,796 $ - $ 573,372 $ 7,757,168 Financial liabilities at FVTPL Cross-currency swap contracts $ - $ - $ 44,717 $ 44,717 Bond options - - 223,501 223,501 $ - $ - $ 268,218 $ 268,218 There were no transfers between Levels 1 and 2 for the years ended December 31, 2019 and 2018.
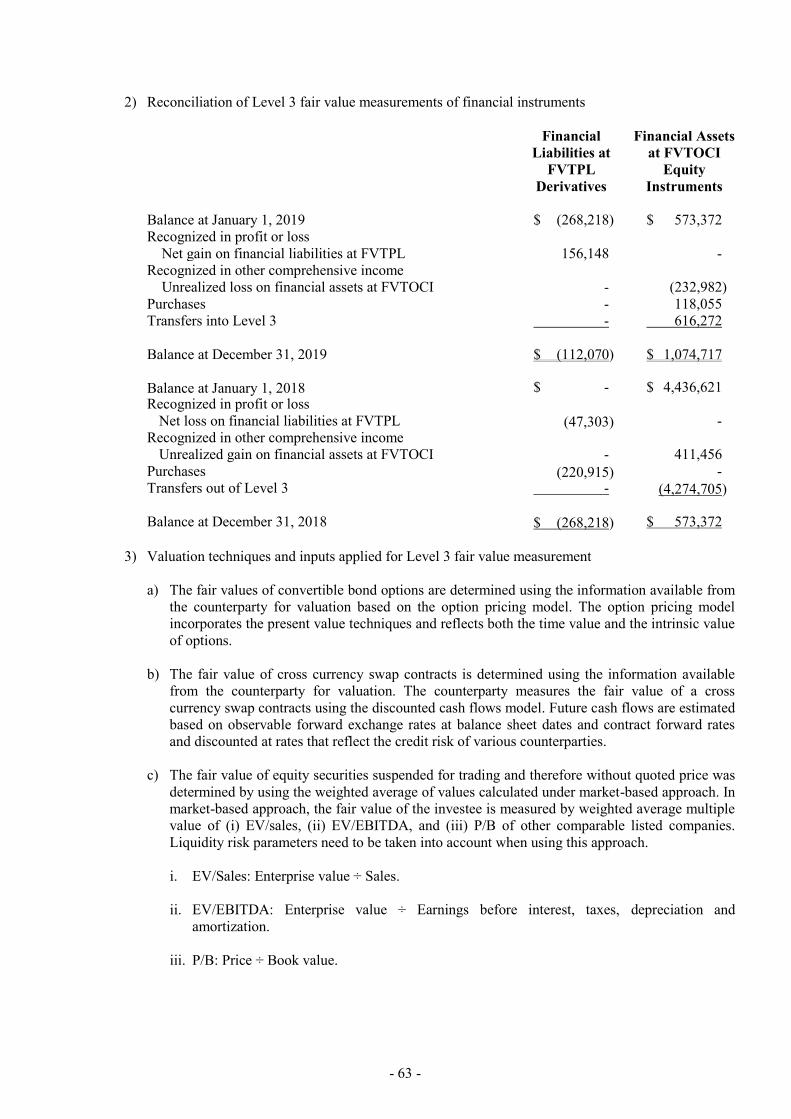
- 63 -
2) Reconciliation of Level 3 fair value measurements of financial instruments
Financial
Liabilities at Financial Assets
at FVTOCI FVTPL Equity Derivatives Instruments
Balance at January 1, 2019 $ (268,218) $ 573,372 Recognized in profit or loss
Net gain on financial liabilities at FVTPL 156,148 - Recognized in other comprehensive income
Unrealized loss on financial assets at FVTOCI - (232,982) Purchases - 118,055 Transfers into Level 3 - 616,272 Balance at December 31, 2019 $ (112,070) $ 1,074,717 Balance at January 1, 2018 $ - $ 4,436,621 Recognized in profit or loss
Net loss on financial liabilities at FVTPL (47,303) - Recognized in other comprehensive income
Unrealized gain on financial assets at FVTOCI - 411,456 Purchases (220,915) - Transfers out of Level 3 - (4,274,705) Balance at December 31, 2018 $ (268,218) $ 573,372
3) Valuation techniques and inputs applied for Level 3 fair value measurement a) The fair values of convertible bond options are determined using the information available from
the counterparty for valuation based on the option pricing model. The option pricing model incorporates the present value techniques and reflects both the time value and the intrinsic value of options.
b) The fair value of cross currency swap contracts is determined using the information available
from the counterparty for valuation. The counterparty measures the fair value of a cross currency swap contracts using the discounted cash flows model. Future cash flows are estimated based on observable forward exchange rates at balance sheet dates and contract forward rates and discounted at rates that reflect the credit risk of various counterparties.
c) The fair value of equity securities suspended for trading and therefore without quoted price was
determined by using the weighted average of values calculated under market-based approach. In market-based approach, the fair value of the investee is measured by weighted average multiple value of (i) EV/sales, (ii) EV/EBITDA, and (iii) P/B of other comparable listed companies. Liquidity risk parameters need to be taken into account when using this approach. i. EV/Sales: Enterprise value ÷ Sales. ii. EV/EBITDA: Enterprise value ÷ Earnings before interest, taxes, depreciation and
amortization. iii. P/B: Price ÷ Book value.
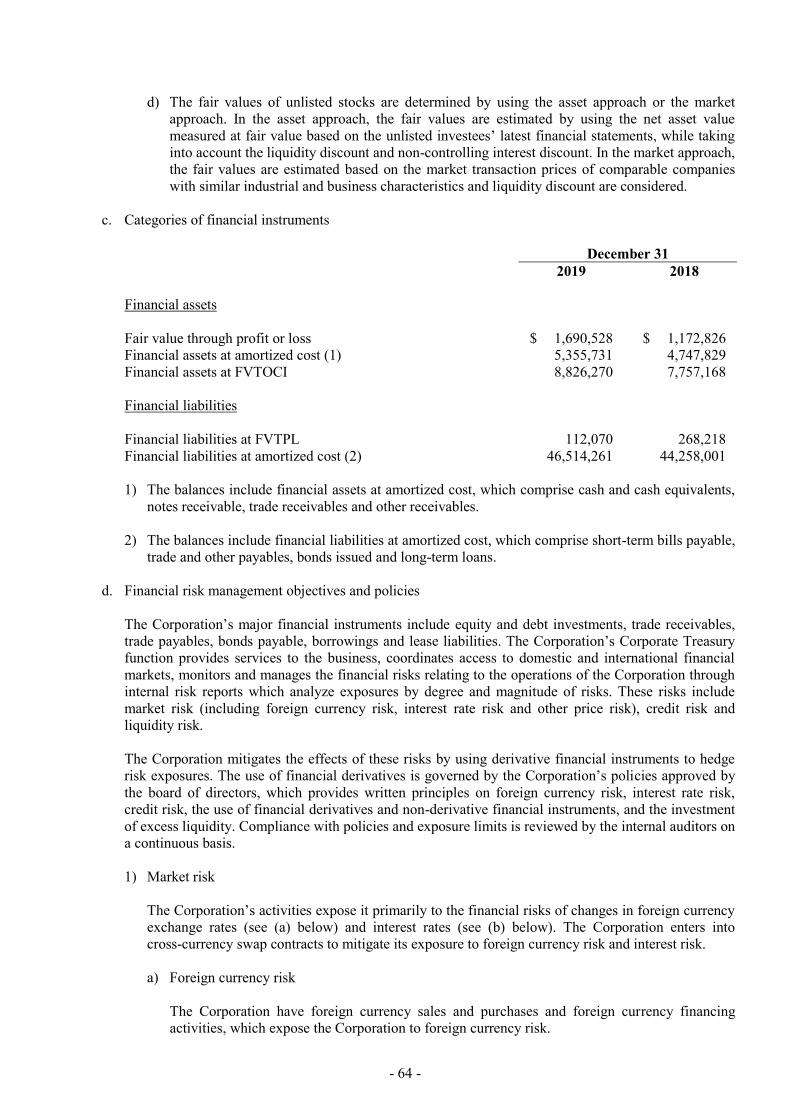
- 64 -
d) The fair values of unlisted stocks are determined by using the asset approach or the market approach. In the asset approach, the fair values are estimated by using the net asset value measured at fair value based on the unlisted investees’ latest financial statements, while taking into account the liquidity discount and non-controlling interest discount. In the market approach, the fair values are estimated based on the market transaction prices of comparable companies with similar industrial and business characteristics and liquidity discount are considered.
c. Categories of financial instruments
December 31 2019 2018 Financial assets Fair value through profit or loss $ 1,690,528 $ 1,172,826 Financial assets at amortized cost (1) 5,355,731 4,747,829 Financial assets at FVTOCI 8,826,270 7,757,168 Financial liabilities Financial liabilities at FVTPL 112,070 268,218 Financial liabilities at amortized cost (2) 46,514,261 44,258,001 1) The balances include financial assets at amortized cost, which comprise cash and cash equivalents,
notes receivable, trade receivables and other receivables. 2) The balances include financial liabilities at amortized cost, which comprise short-term bills payable,
trade and other payables, bonds issued and long-term loans. d. Financial risk management objectives and policies
The Corporation’s major financial instruments include equity and debt investments, trade receivables, trade payables, bonds payable, borrowings and lease liabilities. The Corporation’s Corporate Treasury function provides services to the business, coordinates access to domestic and international financial markets, monitors and manages the financial risks relating to the operations of the Corporation through internal risk reports which analyze exposures by degree and magnitude of risks. These risks include market risk (including foreign currency risk, interest rate risk and other price risk), credit risk and liquidity risk. The Corporation mitigates the effects of these risks by using derivative financial instruments to hedge risk exposures. The use of financial derivatives is governed by the Corporation’s policies approved by the board of directors, which provides written principles on foreign currency risk, interest rate risk, credit risk, the use of financial derivatives and non-derivative financial instruments, and the investment of excess liquidity. Compliance with policies and exposure limits is reviewed by the internal auditors on a continuous basis. 1) Market risk
The Corporation’s activities expose it primarily to the financial risks of changes in foreign currency exchange rates (see (a) below) and interest rates (see (b) below). The Corporation enters into cross-currency swap contracts to mitigate its exposure to foreign currency risk and interest risk. a) Foreign currency risk
The Corporation have foreign currency sales and purchases and foreign currency financing activities, which expose the Corporation to foreign currency risk.
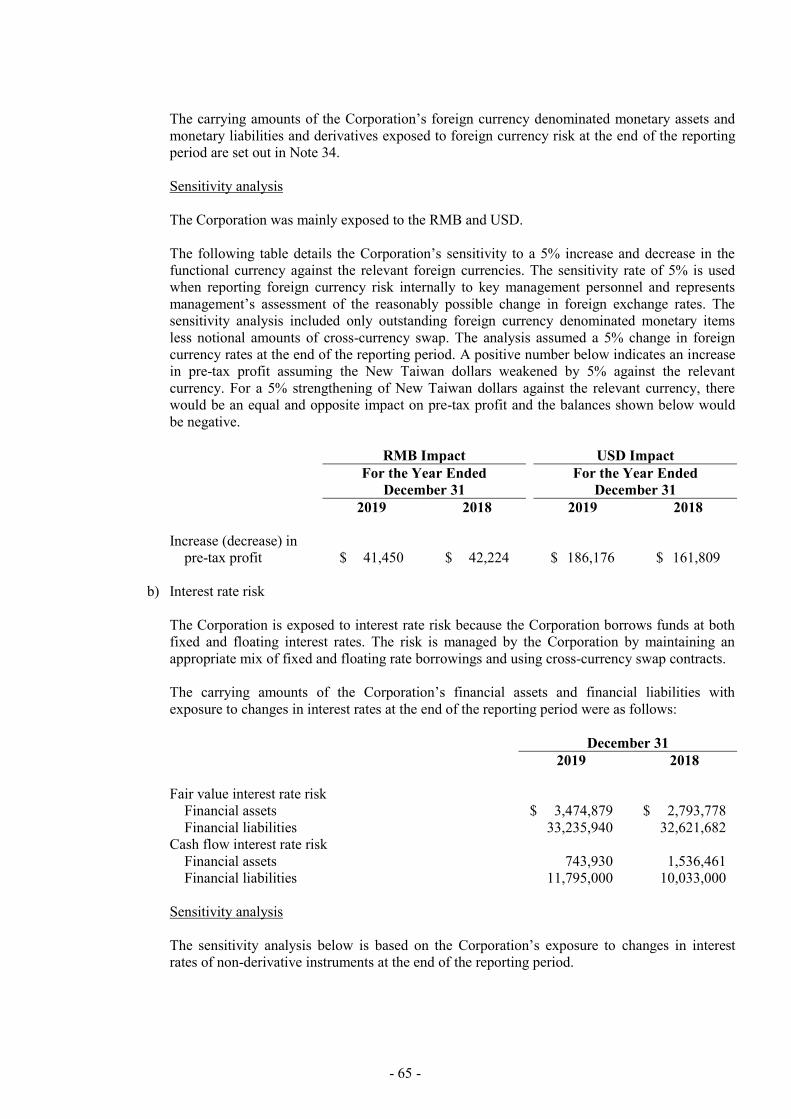
- 65 -
The carrying amounts of the Corporation’s foreign currency denominated monetary assets and monetary liabilities and derivatives exposed to foreign currency risk at the end of the reporting period are set out in Note 34. Sensitivity analysis The Corporation was mainly exposed to the RMB and USD. The following table details the Corporation’s sensitivity to a 5% increase and decrease in the functional currency against the relevant foreign currencies. The sensitivity rate of 5% is used when reporting foreign currency risk internally to key management personnel and represents management’s assessment of the reasonably possible change in foreign exchange rates. The sensitivity analysis included only outstanding foreign currency denominated monetary items less notional amounts of cross-currency swap. The analysis assumed a 5% change in foreign currency rates at the end of the reporting period. A positive number below indicates an increase in pre-tax profit assuming the New Taiwan dollars weakened by 5% against the relevant currency. For a 5% strengthening of New Taiwan dollars against the relevant currency, there would be an equal and opposite impact on pre-tax profit and the balances shown below would be negative. RMB Impact USD Impact
For the Year Ended
December 31 For the Year Ended
December 31 2019 2018 2019 2018 Increase (decrease) in
pre-tax profit $ 41,450 $ 42,224 $ 186,176 $ 161,809 b) Interest rate risk
The Corporation is exposed to interest rate risk because the Corporation borrows funds at both fixed and floating interest rates. The risk is managed by the Corporation by maintaining an appropriate mix of fixed and floating rate borrowings and using cross-currency swap contracts. The carrying amounts of the Corporation’s financial assets and financial liabilities with exposure to changes in interest rates at the end of the reporting period were as follows: December 31 2019 2018 Fair value interest rate risk
Financial assets $ 3,474,879 $ 2,793,778 Financial liabilities 33,235,940 32,621,682
Cash flow interest rate risk Financial assets 743,930 1,536,461 Financial liabilities 11,795,000 10,033,000
Sensitivity analysis The sensitivity analysis below is based on the Corporation’s exposure to changes in interest rates of non-derivative instruments at the end of the reporting period.

- 66 -
If interest rates had been 0.01% higher/lower and all other variables were held constant, the Corporation’s pre-tax profit for the years ended December 31, 2019 and 2018 would have decreased/increased by $977 thousand and $1,049 thousand, respectively, mainly due to the Corporation’s exposure to changes in interest rates of its variable-rate bank borrowings and bank deposits.
c) Other price risk The Corporation is exposed to price risk through its investments in listed equity securities and beneficiary certificates of funds. Sensitivity analysis The sensitivity analysis below is based on the exposure to investment position price risks at the end of the reporting period. If investment position prices had been 1% higher/lower, pre-tax profit for the year ended December 31, 2019 and 2018 would have increased/decreased by $16,905 thousand and $11,728 thousand, respectively, as a result of the changes in fair value of financial assets at fair value through profit or loss, and the pre-tax other comprehensive income for the year ended December 31, 2019 and 2018 would have increased/decreased by $77,516 thousand and $71,838 thousand, respectively, as a result of the changes in fair value of financial assets at fair value through other comprehensive income.
2) Credit risk Credit risk refers to the risk that counterparty will default on its contractual obligations resulting in financial loss to the Corporation. As at the end of the reporting period, the Corporation’s maximum exposure to credit risk which would cause a financial loss to the Corporation due to the failure of counterparties to discharge an obligation and financial guarantees provided by the Corporation is equal to the carrying amount of the financial assets as stated in the balance sheets. The Corporation adopted a policy of only dealing with creditworthy counterparties and obtaining sufficient collateral, where appropriate, as a means of mitigating the risk of financial loss from defaults. The Corporation only transacts with entities that are rated the equivalent of investment grade and above. The Corporation uses publicly available financial information and its own trading records to rate its major customers. The Corporation’s exposure and the credit ratings of its counterparties are continuously monitored. The counterparties in trade receivables consist of a large number of clients in different industries and regions. The Corporation evaluates clients’ financial condition continuously. Credit risk represents the potential negative impact on the financial assets of the Corporation if counterparties or third parties breach the contracts. The Corporation evaluates credit risk exposure on contracts with positive carrying value. The Corporation evaluated the credit risk exposure as immaterial because all counterparties are reputable financial institutions and companies with good credit ratings.
3) Liquidity risk The Corporation manages liquidity risk by monitoring and maintaining a level of cash and cash equivalents deemed adequate to finance the Corporation’s operations and mitigate the effects of fluctuations in cash flows. In addition, management monitors the utilization of bank borrowings and ensures compliance with loan covenants.
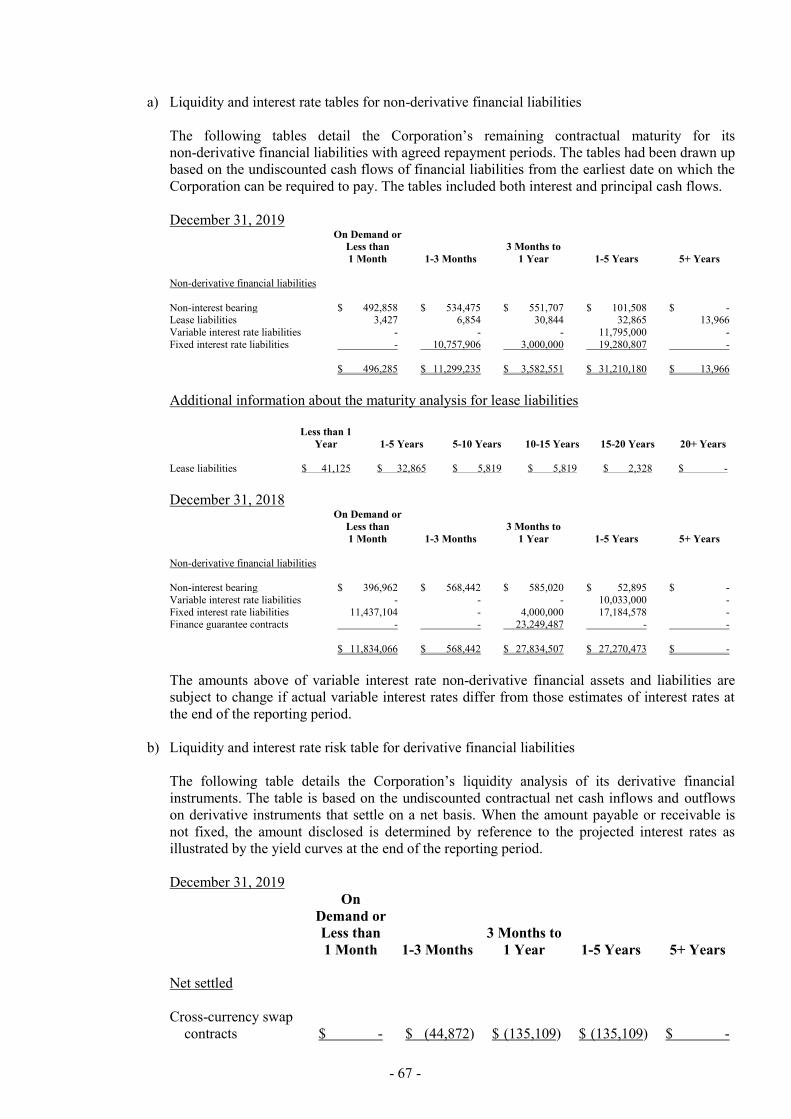
- 67 -
a) Liquidity and interest rate tables for non-derivative financial liabilities
The following tables detail the Corporation’s remaining contractual maturity for its non-derivative financial liabilities with agreed repayment periods. The tables had been drawn up based on the undiscounted cash flows of financial liabilities from the earliest date on which the Corporation can be required to pay. The tables included both interest and principal cash flows. December 31, 2019
On Demand or Less than 1 Month 1-3 Months
3 Months to 1 Year 1-5 Years 5+ Years
Non-derivative financial liabilities Non-interest bearing $ 492,858 $ 534,475 $ 551,707 $ 101,508 $ - Lease liabilities 3,427 6,854 30,844 32,865 13,966 Variable interest rate liabilities - - - 11,795,000 - Fixed interest rate liabilities - 10,757,906 3,000,000 19,280,807 - $ 496,285 $ 11,299,235 $ 3,582,551 $ 31,210,180 $ 13,966 Additional information about the maturity analysis for lease liabilities
Less than 1
Year 1-5 Years 5-10 Years 10-15 Years 15-20 Years 20+ Years Lease liabilities $ 41,125 $ 32,865 $ 5,819 $ 5,819 $ 2,328 $ - December 31, 2018
On Demand or Less than 1 Month 1-3 Months
3 Months to 1 Year 1-5 Years 5+ Years
Non-derivative financial liabilities Non-interest bearing $ 396,962 $ 568,442 $ 585,020 $ 52,895 $ - Variable interest rate liabilities - - - 10,033,000 - Fixed interest rate liabilities 11,437,104 - 4,000,000 17,184,578 - Finance guarantee contracts - - 23,249,487 - - $ 11,834,066 $ 568,442 $ 27,834,507 $ 27,270,473 $ - The amounts above of variable interest rate non-derivative financial assets and liabilities are subject to change if actual variable interest rates differ from those estimates of interest rates at the end of the reporting period.
b) Liquidity and interest rate risk table for derivative financial liabilities The following table details the Corporation’s liquidity analysis of its derivative financial instruments. The table is based on the undiscounted contractual net cash inflows and outflows on derivative instruments that settle on a net basis. When the amount payable or receivable is not fixed, the amount disclosed is determined by reference to the projected interest rates as illustrated by the yield curves at the end of the reporting period. December 31, 2019
On Demand or Less than 1 Month 1-3 Months
3 Months to 1 Year 1-5 Years 5+ Years
Net settled Cross-currency swap
contracts $ - $ (44,872) $ (135,109) $ (135,109) $ -

- 68 -
December 31, 2018
On Demand or Less than 1 Month 1-3 Months
3 Months to 1 Year 1-5 Years 5+ Years
Net settled Cross-currency swap
contracts $ - $ (39,911) $ (139,437) $ (322,827) $ -
e. Transfers of financial assets. None. f. Offsetting financial assets and financial liabilities. None. g. Reclassifications. None.
30. TRANSACTIONS WITH RELATED PARTIES Details of transactions between the Corporation and other related parties are disclosed below. Transactions with related parties are conducted under normal terms. Balances and transactions between the Corporation and single related party are disclosed separately except when the amount is less than 10% of the total balances or transactions; otherwise, the amounts are lumped together as others. a. Related party name and category
Related Party Name Related Party Category FMT Subsidiary DCI Subsidiary YLPPC Subsidiary ACSPL Subsidiary NHC Subsidiary AEE Subsidiary AIC Subsidiary YTRMC Subsidiary ACCHC Subsidiary YLT Subsidiary Ya Sing Ready-Mixed Concrete Corp. (YSRMC) Sub-subsidiary Fu Shan Mineral Stone Co., Ltd. (FSMS) Sub-subsidiary Fu Da Transportation Corp. (FDT) Sub-subsidiary Jiangxi Yadong Cement Co., Ltd. (JYDC) Sub-subsidiary Kowloon Cement Corp. Ltd. (KCC) Sub-subsidiary Asia Oriental Concrete, LLC (AOC) Sub-subsidiary FENC Associate U-Ming Associate YDC Associate OSC Associate FEDSDL Associate EISF Associate
(Continued)
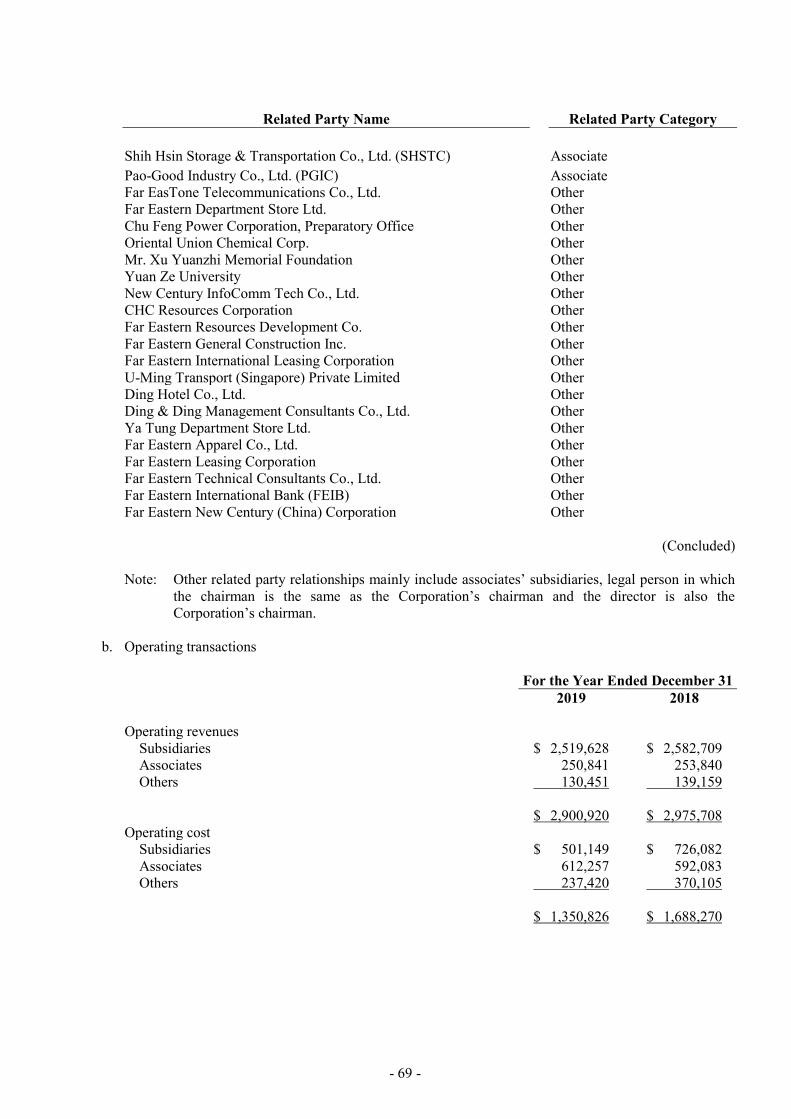
- 69 -
Related Party Name Related Party Category
Shih Hsin Storage & Transportation Co., Ltd. (SHSTC) Associate Pao-Good Industry Co., Ltd. (PGIC) Associate Far EasTone Telecommunications Co., Ltd. Other Far Eastern Department Store Ltd. Other Chu Feng Power Corporation, Preparatory Office Other Oriental Union Chemical Corp. Other Mr. Xu Yuanzhi Memorial Foundation Other Yuan Ze University Other New Century InfoComm Tech Co., Ltd. Other CHC Resources Corporation Other Far Eastern Resources Development Co. Other Far Eastern General Construction Inc. Other Far Eastern International Leasing Corporation Other U-Ming Transport (Singapore) Private Limited Other Ding Hotel Co., Ltd. Other Ding & Ding Management Consultants Co., Ltd. Other Ya Tung Department Store Ltd. Other Far Eastern Apparel Co., Ltd. Other Far Eastern Leasing Corporation Other Far Eastern Technical Consultants Co., Ltd. Other Far Eastern International Bank (FEIB) Other Far Eastern New Century (China) Corporation Other
(Concluded) Note: Other related party relationships mainly include associates’ subsidiaries, legal person in which
the chairman is the same as the Corporation’s chairman and the director is also the Corporation’s chairman.
b. Operating transactions
For the Year Ended December 31 2019 2018 Operating revenues
Subsidiaries $ 2,519,628 $ 2,582,709 Associates 250,841 253,840 Others 130,451 139,159
$ 2,900,920 $ 2,975,708 Operating cost
Subsidiaries $ 501,149 $ 726,082 Associates 612,257 592,083 Others 237,420 370,105 $ 1,350,826 $ 1,688,270

- 70 -
Receivables from related parties (including notes receivable, trade receivables and other receivables): December 31 2019 2018 Subsidiaries
YTRMC $ 348,763 $ 370,183 Others 93,564 152,353 442,327 522,536
Associates 12,012 11,772 Others 9,485 6,692 $ 463,824 $ 541,000 Accounts payable and accrued expenses to related parties: December 31 2019 2018 Subsidiaries $ 82,820 $ 84,014 Associates 113,621 97,764 Others 5,363 6,326 $ 201,804 $ 188,104 The outstanding trade payables and receivables from related parties are unsecured. For the years ended December 31, 2019 and 2018, no impairment losses were recognized for trade receivables from related parties. Prepayments: December 31 2019 2018 Associates $ 15,000 $ 15,000
c. Transactions with FEIB December 31 2019 2018 Bank deposits (Note) $ 930,024 $ 1,167,742 Bank Loans $ - $ 400,000 Cross-currency swap contracts $ (1,415) $ (2,358) As of December 31, 2019 and 2018, the notional principal of the above outstanding cross-currency swap contracts were both US$15,000 thousands. Note: The balances included amounts recognized as financial assets measured at amortized cost, and
other non-current assets (refundable deposits).
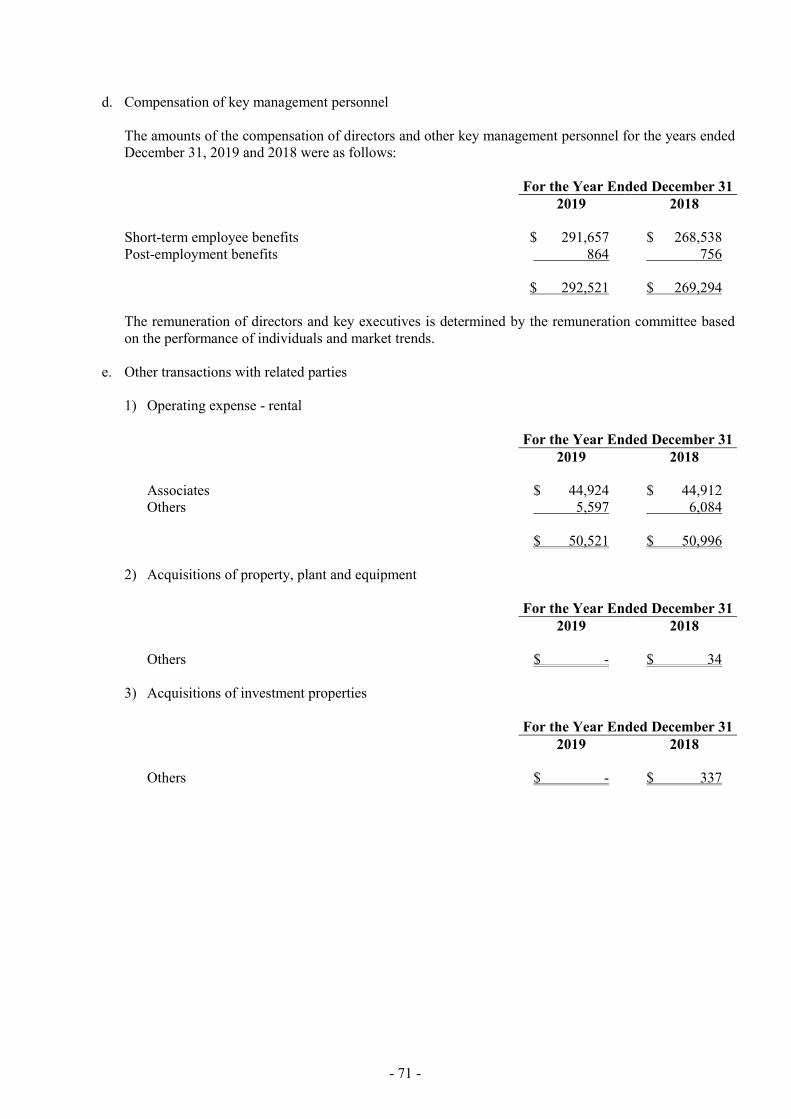
- 71 -
d. Compensation of key management personnel The amounts of the compensation of directors and other key management personnel for the years ended December 31, 2019 and 2018 were as follows: For the Year Ended December 31 2019 2018 Short-term employee benefits $ 291,657 $ 268,538 Post-employment benefits 864 756 $ 292,521 $ 269,294 The remuneration of directors and key executives is determined by the remuneration committee based on the performance of individuals and market trends.
e. Other transactions with related parties 1) Operating expense - rental
For the Year Ended December 31 2019 2018 Associates $ 44,924 $ 44,912 Others 5,597 6,084 $ 50,521 $ 50,996
2) Acquisitions of property, plant and equipment
For the Year Ended December 31 2019 2018 Others $ - $ 34
3) Acquisitions of investment properties
For the Year Ended December 31 2019 2018 Others $ - $ 337

- 72 -
31. ASSETS PLEDGED AS COLLATERAL The following assets are provided as collaterals for short-term and long-term bank borrowings: December 31 2019 2018 Investment properties $ 13,855,572 $ 13,840,249 Investments accounted for using equity method 11,287,882 11,388,997 Financial assets at fair value through other comprehensive income -
current 1,045,450 1,107,800 Property, plant and equipment, net 857,003 886,829 $ 27,045,907 $ 27,223,875
32. SIGNIFICANT CONTINGENT LIABILITIES AND UNRECOGNIZED COMMITMENTS
As of December 31, 2019, the Corporation had the following significant commitments and contingencies: a. Unused letters of credit of EUR145 thousand. b. Guarantee notes issued for related parties:
The Corporation AIC $ 12,195,800 DCI 9,848,950 NHC 1,509,020 YTRMC 1,000,000 YLPPC 497,642 AEE 329,930 YSRMC 150,000 FSMS 30,000
$ 25,561,342
c. On December 4, 2015 and December 17, 2015, CSCGL, China Shanshui Cement Group (Hong Kong)
Company Limited and China Pioneer Cement (Hong Kong) Company Limited (collectively referred as “Shanshui Cement Group”) commenced legal proceedings against former directors of CSCGL in respect of alleged dishonest breaches of fiduciary duty or alleged conspiracy to injure CSCGL during their tenures. The proceedings arose from disputes between CSCGL’s present and former board of directors over the changes in management and the takeover of the headquarters of CSCGL. On April 7, 2016, the Corporation was added as the 10th defendant. The Corporation engaged lawyers to take legal actions in connection with the unqualified claim to defend its reputation and interests. Up to the date of the auditors’ report, the trial was set to take place from April to June in 2021. The Corporation considered it premature to evaluate at this stage the likely outcome of the proceedings and therefore did not recognize any contingent liabilities.
d. Tianrui Group Company Limited and Tianrui (International) Holding Company Limited (collectively
referred as “Tianrui Group”), CSI and former directors of CSCGL, in breach of the Rules Governing the Listing of Securities on The Stock Exchange of Hong Kong Limited, the Codes on Takeovers and Mergers and share Buy-backs issued by the Hong Kong Securities and Futures Commission and the fiduciary duties, have engaged in unfair prejudicial conducts in favor of Tianrui directly and indirectly through CSCGL which are detrimental to the interests of the shareholders including the Corporation. The Corporation filed a writ of summons to the High Court of Hong Kong in June 2017 and has been seeking legal advice in relation to the legal proceedings. As the respondents’ applications to strike out the petition for technical reasons, the Corporation amended the applications accordingly. Up to the date
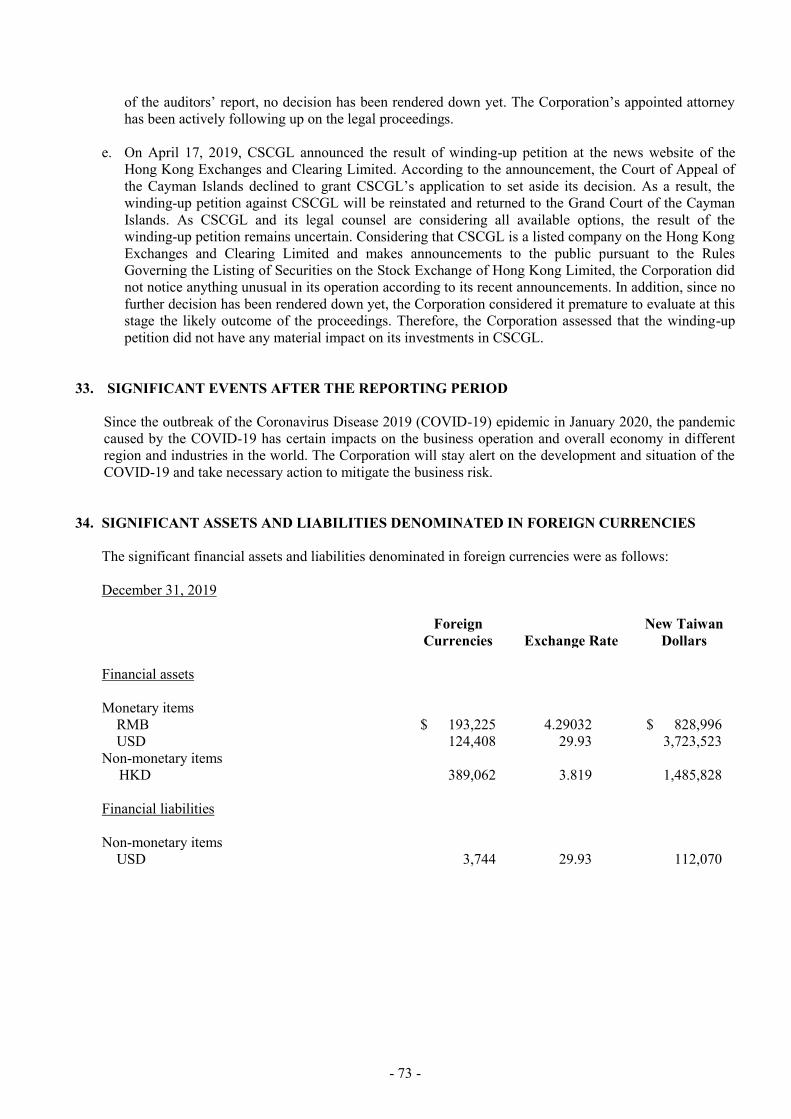
- 73 -
of the auditors’ report, no decision has been rendered down yet. The Corporation’s appointed attorney has been actively following up on the legal proceedings.
e. On April 17, 2019, CSCGL announced the result of winding-up petition at the news website of the
Hong Kong Exchanges and Clearing Limited. According to the announcement, the Court of Appeal of the Cayman Islands declined to grant CSCGL’s application to set aside its decision. As a result, the winding-up petition against CSCGL will be reinstated and returned to the Grand Court of the Cayman Islands. As CSCGL and its legal counsel are considering all available options, the result of the winding-up petition remains uncertain. Considering that CSCGL is a listed company on the Hong Kong Exchanges and Clearing Limited and makes announcements to the public pursuant to the Rules Governing the Listing of Securities on the Stock Exchange of Hong Kong Limited, the Corporation did not notice anything unusual in its operation according to its recent announcements. In addition, since no further decision has been rendered down yet, the Corporation considered it premature to evaluate at this stage the likely outcome of the proceedings. Therefore, the Corporation assessed that the winding-up petition did not have any material impact on its investments in CSCGL.
33. SIGNIFICANT EVENTS AFTER THE REPORTING PERIOD
Since the outbreak of the Coronavirus Disease 2019 (COVID-19) epidemic in January 2020, the pandemic caused by the COVID-19 has certain impacts on the business operation and overall economy in different region and industries in the world. The Corporation will stay alert on the development and situation of the COVID-19 and take necessary action to mitigate the business risk.
34. SIGNIFICANT ASSETS AND LIABILITIES DENOMINATED IN FOREIGN CURRENCIES
The significant financial assets and liabilities denominated in foreign currencies were as follows: December 31, 2019
Foreign
Currencies Exchange Rate New Taiwan
Dollars Financial assets Monetary items
RMB $ 193,225 4.29032 $ 828,996 USD 124,408 29.93 3,723,523
Non-monetary items HKD 389,062 3.819 1,485,828
Financial liabilities Non-monetary items
USD 3,744 29.93 112,070
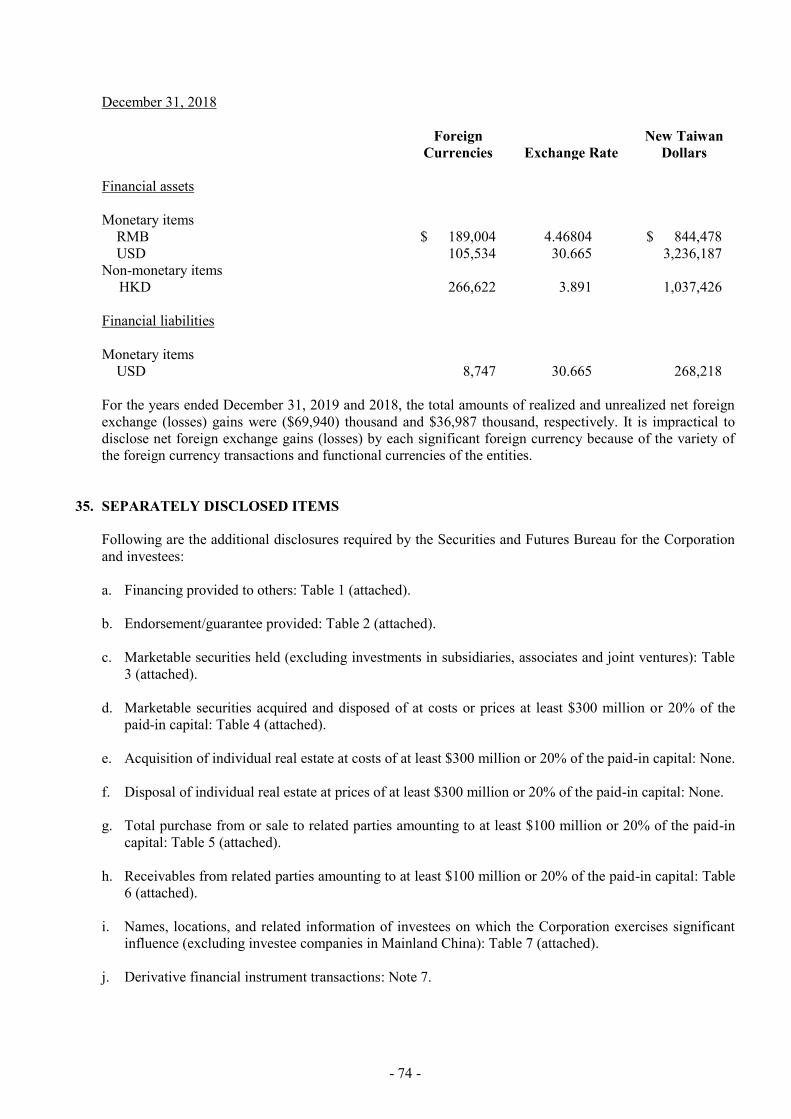
- 74 -
December 31, 2018
Foreign
Currencies Exchange Rate New Taiwan
Dollars Financial assets Monetary items
RMB $ 189,004 4.46804 $ 844,478 USD 105,534 30.665 3,236,187
Non-monetary items HKD 266,622 3.891 1,037,426
Financial liabilities Monetary items
USD 8,747 30.665 268,218 For the years ended December 31, 2019 and 2018, the total amounts of realized and unrealized net foreign exchange (losses) gains were ($69,940) thousand and $36,987 thousand, respectively. It is impractical to disclose net foreign exchange gains (losses) by each significant foreign currency because of the variety of the foreign currency transactions and functional currencies of the entities.
35. SEPARATELY DISCLOSED ITEMS Following are the additional disclosures required by the Securities and Futures Bureau for the Corporation and investees: a. Financing provided to others: Table 1 (attached). b. Endorsement/guarantee provided: Table 2 (attached). c. Marketable securities held (excluding investments in subsidiaries, associates and joint ventures): Table
3 (attached). d. Marketable securities acquired and disposed of at costs or prices at least $300 million or 20% of the
paid-in capital: Table 4 (attached). e. Acquisition of individual real estate at costs of at least $300 million or 20% of the paid-in capital: None. f. Disposal of individual real estate at prices of at least $300 million or 20% of the paid-in capital: None. g. Total purchase from or sale to related parties amounting to at least $100 million or 20% of the paid-in
capital: Table 5 (attached). h. Receivables from related parties amounting to at least $100 million or 20% of the paid-in capital: Table
6 (attached). i. Names, locations, and related information of investees on which the Corporation exercises significant
influence (excluding investee companies in Mainland China): Table 7 (attached). j. Derivative financial instrument transactions: Note 7.
- 75 -
k. Information on investments in Mainland China
1) Information on any investee company in mainland China, showing the name, principal business activities, paid-in capital, method of investment, inward and outward remittance of funds, ownership percentage, net income of investees, investment income or loss, carrying amount of the investment at the end of the period, repatriations of investment income, and limit on the amount of investment in the mainland China area. (Table 8)
2) Any of the following significant transactions with investee companies in mainland China, either
directly or indirectly through a third party, and their prices, payment terms, and unrealized gains or losses: Table 8. a) The amount and percentage of purchases and the balance and percentage of the related payables
at the end of the period. b) The amount and percentage of sales and the balance and percentage of the related receivables at
the end of the period. c) The amount of property transactions and the amount of the resultant gains or losses. d) The balance of negotiable instrument endorsements or guarantees or pledges of collateral at the
end of the period and the purposes. e) The highest balance, the end of period balance, the interest rate range, and total current period
interest with respect to financing of funds. f) Other transactions that have a material effect on the profit or loss for the period or on the
financial position, such as the rendering or receiving of services.

- 76 -
TABLE 1 ASIA CEMENT CORPORATION FINANCING PROVIDED TO OTHERS YEAR ENDED DECEMBER 31, 2019 (In Thousands of New Taiwan Dollars, Unless Stated Otherwise)
No. Lender Borrower Financial Statement Account
Related Parties
Highest Balance for the Period
Ending Balance (Note 2)
Actual Borrowing Amount
Interest Rate (Note 3) Nature of Financing
Business Transaction
Amounts
Reasons for Short-term Financing
Allowance for Impairment Loss
Collateral Financing Limit for Each Borrower
(Note 1)
Aggregate Financing Limits (Note 1) Item Value
1 ACCHC FENCC Other receivables Y RMB431,900
thousand (equivalent to NT$1,852,987 thousand)
- - - Necessary for short-term financing
$ - Operating capital $ - - $ - 20% of net worth RMB2,852,760 thousand (equivalent to NT$12,239,242 thousand)
50% of net worth RMB7,131,901 thousand (equivalent to NT$30,598,109 thousand)
YDES Other receivables Y RMB230,000 thousand (equivalent to NT$986,773 thousand)
- - - Necessary for short-term financing
- Operating capital - - - Same as above Same as above
2 OIHPL ACCHC Other receivables Y RMB44,000
thousand (equivalent to NT$188,774 thousand)
RMB44,000 thousand (equivalent to NT$188,774 thousand)
RMB44,000 thousand (equivalent to NT$188,774 thousand)
4.14% Necessary for short-term financing
- Operating capital - - - 20% of net worth RMB2,443,648 thousand (equivalent to NT$10,484,022 thousand)
50% of net worth RMB6,109,120 thousand (equivalent to NT$26,210,055 thousand)
3 OHC SIYDCCL
Other receivables Y RMB200,000
thousand (equivalent to NT$858,063 thousand)
RMB200,000 thousand (equivalent to NT$858,063 thousand)
- - Necessary for short-term financing
- Operating capital - - - 20% of net worth RMB577,182 thousand (equivalent to NT$2,476,293 thousand)
50% of net worth RMB1,442,955 thousand (equivalent to NT$6,190,733 thousand)
SLCL
Other receivables Y RMB350,000 thousand (equivalent to NT$1,501,611 thousand)
RMB350,000 thousand (equivalent to NT$1,501,611 thousand)
RMB190,000 thousand (equivalent to NT$815,160 thousand)
4.09% Necessary for short-term financing
- Operating capital - - - Same as above Same as above
4 JYDC YYDCCL
Other receivables Y RMB160,000
thousand (equivalent to NT$686,451 thousand)
RMB140,000 thousand (equivalent to NT$600,644 thousand)
- - Necessary for short-term financing
- Operating capital - - - 20% of net worth RMB1,202,402 thousand (equivalent to NT$5,158,685 thousand)
50% of net worth RMB3,006,005 thousand (equivalent to NT$12,896,711 thousand)
TZOCCL
Other receivables Y RMB145,000 thousand (equivalent to NT$622,096 thousand)
RMB140,000 thousand (equivalent to NT$600,644 thousand)
RMB70,000 thousand (equivalent to NT$300,322 thousand)
4.09% Necessary for short-term financing
- Operating capital - - - Same as above Same as above
SIYDCCL Other receivables Y RMB100,000 thousand (equivalent to NT$429,032 thousand)
RMB50,000 thousand (equivalent to NT$214,516 thousand)
- - Necessary for short-term financing
- Operating capital - - - Same as above Same as above
SLCL
Other receivables Y RMB400,000 thousand (equivalent to NT$1,716,126 thousand)
RMB200,000 thousand (equivalent to NT$858,063 thousand)
- - Necessary for short-term financing
- Operating capital - - - Same as above Same as above
SLCCL Other receivables Y RMB35,000 thousand (equivalent to NT$150,161 thousand)
- - - Necessary for short-term financing
- Operating capital - - - Same as above Same as above
(Continued)

- 77 -
No. Lender Borrower Financial Statement Account
Related Parties
Highest Balance for the Period
Ending Balance (Note 2)
Actual Borrowing Amount
Interest Rate (Note 3) Nature of Financing
Business Transaction
Amounts
Reasons for Short-term Financing
Allowance for Impairment Loss Collateral
Financing Limit for Each Borrower (Note 1)
Aggregate Financing Limits (Note 1) No.
SHYLCP Other receivables Y RMB100,000
thousand (equivalent to NT$429,032 thousand)
RMB90,000 thousand (equivalent to NT$386,128 thousand)
RMB45,000 thousand (equivalent to NT$193,064 thousand)
4.09% Necessary for short-term financing
$ - Operating capital $ - - $ - 20% of net worth RMB1,202,402 thousand (equivalent to NT$5,158,685 thousand)
50% of net worth RMB3,006,005 thousand (equivalent to NT$12,896,711 thousand)
ACCHC
Other receivables Y RMB700,000 thousand (equivalent to NT$3,003,221 thousand)
RMB700,000 thousand (equivalent to NT$3,003,221 thousand)
RMB700,000 thousand (equivalent to NT$3,003,221 thousand)
2.94% Necessary for short-term financing
- Operating capital - - - Same as above Same as above
5 NYDC
SIYDCCL
Other receivables Y RMB20,000 thousand (equivalent to NT$85,806 thousand)
RMB20,000 thousand (equivalent to NT$85,806 thousand)
- - Necessary for short-term financing
- Operating capital - - - 20% of net worth RMB33,924 thousand (equivalent to NT$145,545 thousand)
50% of net worth RMB84,811 thousand (equivalent to NT$363,866 thousand)
SLCL
Other receivables Y RMB30,000thousand (equivalent to NT$128,709 thousand)
RMB30,000thousand (equivalent to NT$128,709 thousand)
- - Necessary for short-term financing
- Operating capital - - - Same as above Same as above
6 HYDCCL WYXC
Other receivables Y RMB60,000 thousand
(equivalent to NT$257,419 thousand)
RMB20,000 thousand (equivalent to NT$85,806 thousand)
- - Necessary for short-term financing
- Operating capital - - - 20% of net worth RMB523,594 thousand (equivalent to NT$2,246,384 thousand)
50% of net worth RMB1,308,985 thousand (equivalent to NT$5,615,959 thousand)
HXMC Other receivables Y RMB40,000 thousand (equivalent to NT$171,613 thousand)
RMB24,500 thousand (equivalent to NT$105,113 thousand)
RMB10,000 thousand (equivalent to NT$42,903 thousand)
4.68% Necessary for short-term financing
- Operating capital - - - Same as above Same as above
WYCPCL Other receivables Y RMB35,000 thousand (equivalent to NT$150,161 thousand)
RMB20,000 thousand (equivalent to NT$85,806 thousand)
- - Necessary for short-term financing
- Operating capital - - - Same as above Same as above
SLCL
Other receivables Y RMB150,000 thousand (equivalent to NT$643,547 thousand)
RMB100,000 thousand (equivalent to NT$429,032 thousand)
- - Necessary for short-term financing
- Operating capital - - - Same as above Same as above
SYCPCL
Other receivables Y RMB50,000 thousand (equivalent to NT$214,516 thousand)
RMB20,000 thousand (equivalent to NT$85,806 thousand)
- - Necessary for short-term financing
- Operating capital - - - Same as above Same as above
SIYDCCL Other receivables Y RMB80,000 thousand (equivalent to NT$343,225 thousand)
- - - Necessary for short-term financing
- Operating capital - - - Same as above Same as above
ACCHC
Other receivables Y RMB400,000 thousand (equivalent to NT$1,716,126 thousand)
RMB400,000 thousand (equivalent to NT$1,716,126 thousand)
RMB400,000 thousand (equivalent to NT$1,716,126 thousand)
2.94% Necessary for short-term financing
- Operating capital - - - Same as above Same as above
7 WYDC
WYXC Other receivables Y RMB70,000 thousand
(equivalent to NT$300,322 thousand)
RMB70,000 thousand (equivalent to NT$300,322 thousand)
- - Necessary for short-term financing
- Operating capital - - - 20% of net worth RMB121,817 thousand (equivalent to NT$522,633 thousand)
50% of net worth RMB304,543 thousand (equivalent to NT$1,306,586 thousand)
WYCPCL
Other receivables Y RMB35,000 thousand (equivalent to NT$150,161 thousand)
RMB25,000 thousand (equivalent to NT$107,258 thousand)
- - Necessary for short-term financing
- Operating capital - - - Same as above Same as above
(Continued)
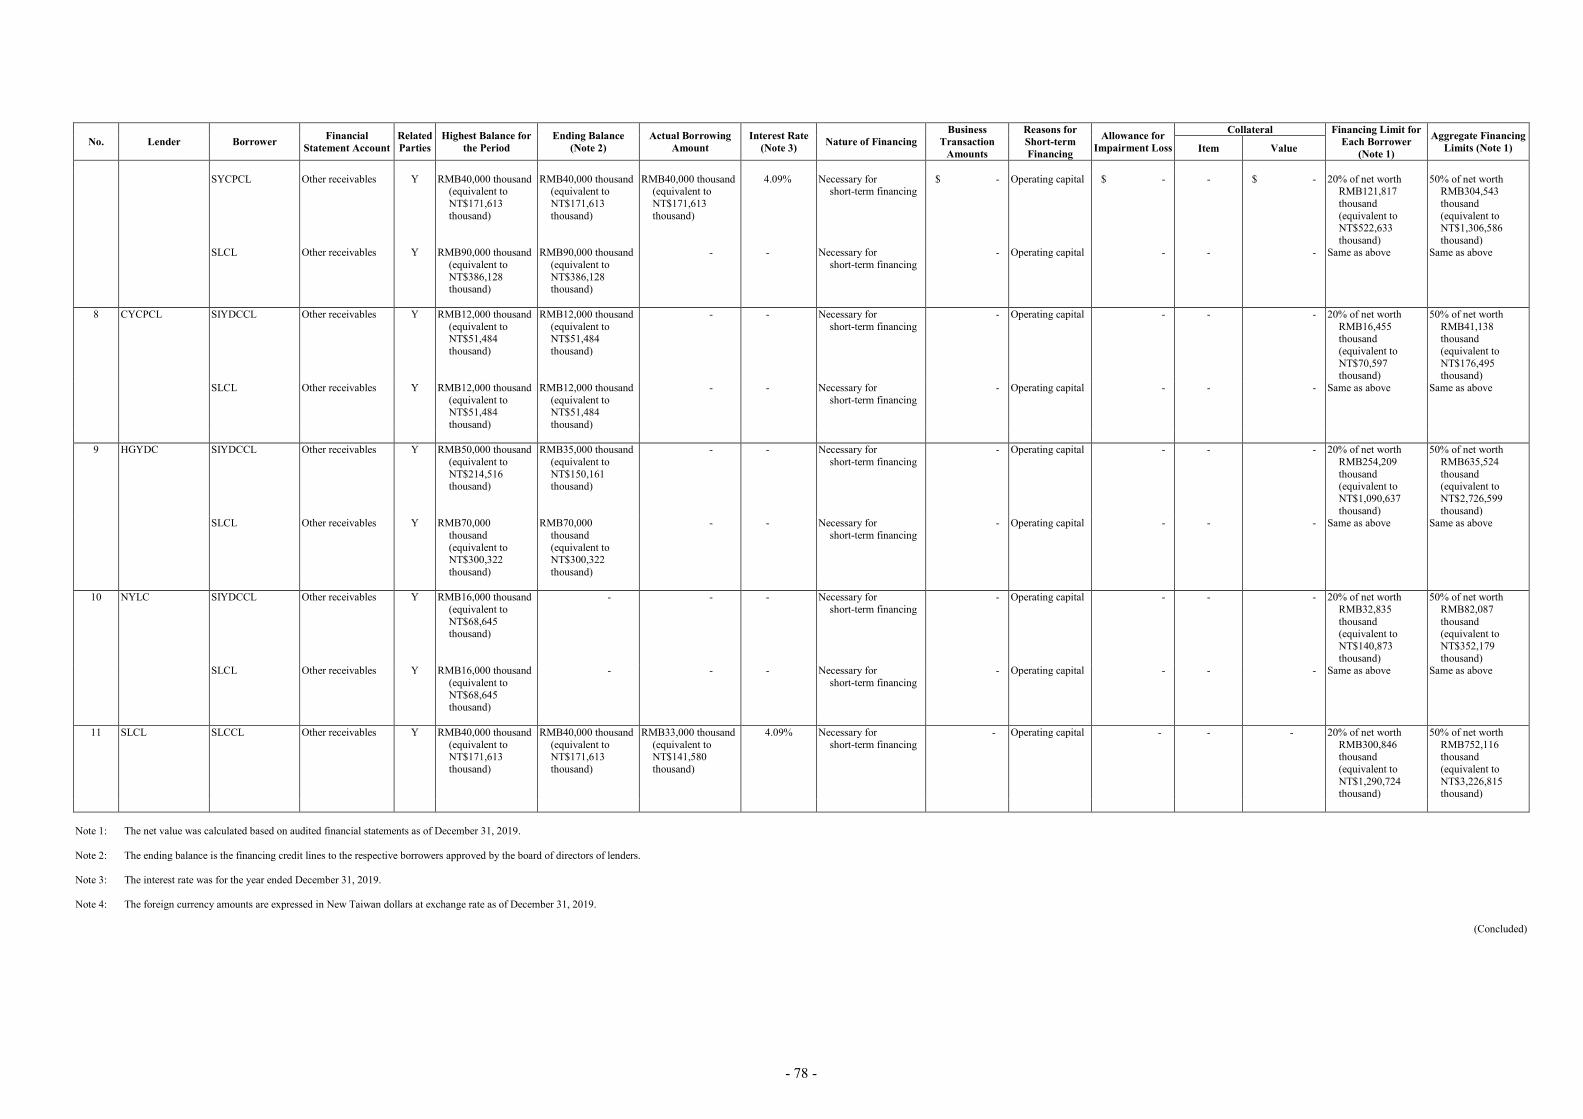
- 78 -
No. Lender Borrower Financial Statement Account
Related Parties
Highest Balance for the Period
Ending Balance (Note 2)
Actual Borrowing Amount
Interest Rate (Note 3) Nature of Financing
Business Transaction
Amounts
Reasons for Short-term Financing
Allowance for Impairment Loss
Collateral Financing Limit for Each Borrower
(Note 1)
Aggregate Financing Limits (Note 1) Item Value
SYCPCL
Other receivables Y RMB40,000 thousand
(equivalent to NT$171,613 thousand)
RMB40,000 thousand (equivalent to NT$171,613 thousand)
RMB40,000 thousand (equivalent to NT$171,613 thousand)
4.09% Necessary for short-term financing
$ - Operating capital $ - - $ - 20% of net worth RMB121,817 thousand (equivalent to NT$522,633 thousand)
50% of net worth RMB304,543 thousand (equivalent to NT$1,306,586 thousand)
SLCL
Other receivables Y RMB90,000 thousand (equivalent to NT$386,128 thousand)
RMB90,000 thousand (equivalent to NT$386,128 thousand)
- - Necessary for short-term financing
- Operating capital - - - Same as above Same as above
8 CYCPCL
SIYDCCL Other receivables Y RMB12,000 thousand
(equivalent to NT$51,484 thousand)
RMB12,000 thousand (equivalent to NT$51,484 thousand)
- - Necessary for short-term financing
- Operating capital - - - 20% of net worth RMB16,455 thousand (equivalent to NT$70,597 thousand)
50% of net worth RMB41,138 thousand (equivalent to NT$176,495 thousand)
SLCL
Other receivables Y RMB12,000 thousand (equivalent to NT$51,484 thousand)
RMB12,000 thousand (equivalent to NT$51,484 thousand)
- - Necessary for short-term financing
- Operating capital - - - Same as above Same as above
9 HGYDC
SIYDCCL
Other receivables Y RMB50,000 thousand (equivalent to NT$214,516 thousand)
RMB35,000 thousand (equivalent to NT$150,161 thousand)
- - Necessary for short-term financing
- Operating capital - - - 20% of net worth RMB254,209 thousand (equivalent to NT$1,090,637 thousand)
50% of net worth RMB635,524 thousand (equivalent to NT$2,726,599 thousand)
SLCL
Other receivables Y RMB70,000 thousand (equivalent to NT$300,322 thousand)
RMB70,000 thousand (equivalent to NT$300,322 thousand)
- - Necessary for short-term financing
- Operating capital - - - Same as above Same as above
10 NYLC
SIYDCCL
Other receivables Y RMB16,000 thousand (equivalent to NT$68,645 thousand)
- - - Necessary for short-term financing
- Operating capital - - - 20% of net worth RMB32,835 thousand (equivalent to NT$140,873 thousand)
50% of net worth RMB82,087 thousand (equivalent to NT$352,179 thousand)
SLCL
Other receivables Y RMB16,000 thousand (equivalent to NT$68,645 thousand)
- - - Necessary for short-term financing
- Operating capital - - - Same as above Same as above
11 SLCL
SLCCL
Other receivables Y RMB40,000 thousand (equivalent to NT$171,613 thousand)
RMB40,000 thousand (equivalent to NT$171,613 thousand)
RMB33,000 thousand (equivalent to NT$141,580 thousand)
4.09% Necessary for short-term financing
- Operating capital - - - 20% of net worth RMB300,846 thousand (equivalent to NT$1,290,724 thousand)
50% of net worth RMB752,116 thousand (equivalent to NT$3,226,815 thousand)
Note 1: The net value was calculated based on audited financial statements as of December 31, 2019. Note 2: The ending balance is the financing credit lines to the respective borrowers approved by the board of directors of lenders. Note 3: The interest rate was for the year ended December 31, 2019. Note 4: The foreign currency amounts are expressed in New Taiwan dollars at exchange rate as of December 31, 2019.
(Concluded)

- 79 -
TABLE 2 ASIA CEMENT CORPORATION ENDORSEMENTS/GUARANTEES PROVIDED YEAR ENDED DECEMBER 31, 2019 (In Thousands of New Taiwan Dollars, Unless Stated Otherwise)
No. Endorser/ Guarantor
Endorsee/Guarantee
Limits on Each Endorsement/
Guarantee Given on Behalf of Each Party
(Note 1)
Maximum Amount
Endorsed/ Guaranteed During the
Period
Outstanding Endorsement/ Guarantee at the End of the
Period
Actual Borrowing
Amount
Amount Endorsed/
Guaranteed by Collaterals
Ratio of Accumulated Endorsement/ Guarantee to Net Equity in
Latest Financial
Statements (%)
Aggregate Endorsement/
Guarantee Limit (Note 1)
Endorsement/ Guarantee Given by Parent on Behalf of
Subsidiaries
Endorsement/ Guarantee Given by
Subsidiaries on Behalf of
Parent
Endorsement/ Guarantee Given on Behalf of
Companies in Mainland
China
Name Relationship (Note 3)
0 The Corporation AIC b 50% of net worth
($73,033,679 thousand)
$ 12,227,000 $ 12,195,800 $ 6,890,000 None 8.35 100% of net worth ($146,067,358 thousand)
Y - -
DCI b Same as above 9,856,750 9,848,950 4,952,000 None 6.74 Same as above Y - - FSMS b Same as above 30,000 30,000 30,000 None 0.02 Same as above Y - - NHC b Same as above 1,516,300 1,509,020 420,000 None 1.03 Same as above Y - - AEE b Same as above 422,880 329,930 150,000 None 0.23 Same as above Y - - YLPPC b Same as above 497,642 497,642 137,757 None 0.34 Same as above Y - - YSRMC b Same as above 150,000 150,000 - None 0.10 Same as above Y - - YTRMC b Same as above 1,000,000 1,000,000 - None 0.68 Same as above Y - - 1 DCI FSMS b 50% of net worth
($6,828,783 thousand) 50,000 50,000 10,000 None 0.37 100% of net worth
($13,657,566 thousand)
Y - -
2 AOG AOC b 50% of net worth
(US$1,146 thousand) (equivalent to NT$34,305 thousand)
15,775 14,965 - None 21.81 100% of net worth (US$2,292 thousand) (equivalent to NT$68,610 thousand)
Y - -
3 YLSS YLSS - 50% of net worth
($902,155 thousand) 100,000 100,000 30,000 100,000 5.54 100% of net worth
($1,804,309 thousand) - - -
4 YTRMC AOC b 50% of net worth
($900,885 thousand) 15,775 14,965 - None 0.83 100% of net worth
($1,801,770 thousand) Y - -
Note 1: The net value was calculated based on audited financial statements as of December 31, 2019. Note 2: The foreign currency amounts are expressed in New Taiwan dollars at exchange rate as of December 31, 2019. Note 3: The relationship between guarantor and guarantee are as follows:
a. Firms that do business with the Corporation. b. Firms of which the Corporation holds, directly or indirectly, over 50% of the voting shares.

- 80 -
TABLE 3 ASIA CEMENT CORPORATION MARKETABLE SECURITIES HELD DECEMBER 31, 2019 (In Thousands of New Taiwan Dollars, Unless Stated Otherwise)
Holding Company Name Type and Name of Marketable Securities Relationship with the Holding Company Financial Statement Account December 31, 2019
Note Shares or Units Carrying Amount Percentage of Ownership (%) Fair Value
The Corporation Beneficiary certificates Deutsche Far Eastern DWS Taiwan Flagship Security
Investment Trust Fund - Financial assets at fair value through profit or
loss - current 10,000,000 $ 204,700 - $ 204,700
Ordinary shares China Conch Venture Holding - Financial assets at fair value through profit or
loss - current 11,443,000 1,485,828 0.63 1,485,828
Far EasTone The same chairman Financial assets at fair value through other comprehensive income - current
31,034,372 2,237,578 0.95 2,237,578 Note 4
Far Eastern Department Stores Ltd. The same chairman Financial assets at fair value through other comprehensive income - noncurrent
80,052,950 2,085,379 5.65 2,085,379
Oriental Union Chemical Corp. The same chairman Same as above 63,766,522 1,339,097 7.20 1,339,097 CHC Resources Corporation The Corporation is its director Same as above 22,801,185 1,146,900 9.17 1,146,900 Far Eastern International Bank The chairman of the Corporation is its vice-chairman Same as above 78,878,582 942,599 2.35 942,599 Kaohsiung Rapid Transit - Same as above 15,873,243 78,630 5.70 78,630 Taiwan Stock Exchange Corp. - Same as above 8,430,368 466,199 1.16 466,199 Ding Ding Hotel Corp. Related party in substance Same as above 555,638 5,340 0.53 5,340 L’ Hotel de Chine Hotel - Same as above 598,121 14,469 0.31 14,469 China Trade & Development Corp. - Same as above 250,003 3,902 0.38 3,902 Pan Asia Engineers & Constructors Corp. The Corporation is its director Same as above 1,551,395 17,919 1.36 17,919 Linkou Recreation Corporation - Same as above 5 - 0.50 - China Shanshui Investment Corp - Same as above 49,928 488,258 4.99 488,258 DCI Beneficiary certificates Polaris Taiwan Top 50 Tracker Fund - Financial assets at fair value through profit or
loss - current 400,000 38,780 - 38,780
Mega Target Return Strategy Fund of ETF Funds - Same as above 1,000,811 10,620 - 10,620 ChinaAMC CSI 300 Index ETF - Same as above 540,000 95,689 0.20 95,689 Opas Fund Segregated Portfolio Tranche A Related party in substance Same as above 8,000 273,741 - 273,741 Ordinary shares Industrial and Commercial Bank of China, A share - Financial assets at fair value through profit or
loss - current 2,000,000 50,454 - 50,454
China Mobile Communications Corporation - Same as above 210,000 52,530 - 52,530 Haitong Securities Co., Ltd. - Same as above 1,800,000 63,311 0.02 63,311 Taiwan Cement Co., Ltd. - Same as above 8,796,722 384,417 0.16 384,417 Hsing Ta Cement Co., Ltd. - Same as above 6,504,854 130,748 1.90 130,748 Chunghwa Picture Tubes, Ltd. - Same as above 275,223 - - - Innolux Corporation - Same as above 9,200,000 76,636 0.09 76,636 Pegatron Corporation - Same as above 1,242,000 84,953 0.05 84,953 Tong Yang Industry Co., Ltd - Same as above 1,732,000 80,798 0.29 80,798 E Ink Holdings corporation - Same as above 1,130,000 35,313 0.10 35,313 Hiwin Technologies Corporation - Same as above 60,000 16,860 0.02 16,860 Accton Technology Corporation - Same as above 150,000 25,200 0.03 25,200 Casetek Holdings Limited - Financial assets at fair value through other
comprehensive income - current 1,050,000 49,718 0.25 49,718
China Life Insurance Company Limited, H share - Same as above 607,000 50,188 - 50,188
(Continued)

- 81 -
Holding Company Name Type and Name of Marketable Securities Relationship with the Holding Company Financial Statement Account December 31, 2019
Note Shares or Units Carrying Amount Percentage of Ownership (%) Fair Value
Far Eastern International Bank The chairman of the Corporation’s major shareholder
is its vice-chairman Financial assets at fair value through other
comprehensive income - current 37,693,157 $ 450,433 1.12 $ 450,433
Oriental Union Chemical Corp. Same chairman with the major shareholder Same as above 41,246 866 - 866 Far EasTone Same chairman with the major shareholder Same as above 215,000 15,502 0.01 15,502 Mega Financial Holding Co., Ltd. - Same as above 9,958,000 304,715 0.07 304,715 Lite-On Technology Corporation - Same as above 299,000 14,756 0.01 14,756 Tripod Technology Corporation - Same as above 261,000 32,756 0.05 32,756 WPG Holdings Limited - Same as above 340,000 13,294 0.02 13,294 Far Eastern International Bank The chairman of the Corporation’s major shareholder
is its vice-chairman Financial assets at fair value through other
comprehensive income - noncurrent 97,439,707 1,164,404 2.90 1,164,404
Far Eastern Department Stores Ltd. The same chairman Same as above 13,630,966 355,087 0.96 355,087 Note 5 Oriental Union Chemical Corp. The same chairman Same as above 10,506,792 220,643 1.19 220,643 CHC Resources Corporation The Corporation is its director Same as above 4,812,514 242,069 1.94 242,069 Picvue Electronics Co., Ltd. - Same as above 161,700 - 0.06 - Ding Ding Hotel Corp. Same chairman with the major shareholder Same as above 213,442 2,051 0.21 2,051 Far Eastern International Leasing Corporation The Corporation is its director Same as above 45,258,938 602,813 10.14 602,813 NHC Ordinary shares Far EasTone Same chairman with the major shareholder Financial assets at fair value through profit or
loss - current 50,000 3,605 - 3,605
YTRMC Ordinary shares Far EasTone Same chairman with the major shareholder Financial assets at fair value through other
comprehensive income - current 230,000 16,583 - 16,583
FMT Ordinary shares Everest Textile Co., Ltd. The chairman of the Corporation is its chairman Financial assets at fair value through other
comprehensive income - current 13,279,219 121,372 2.60 121,372
Oriental Union Chemical Corp. The chairman of the Corporation is its director Financial assets at fair value through other comprehensive income - noncurrent
2,256,782 47,392 0.25 47,392
Far Eastern Department Store Ltd. Same chairman with the major shareholder Same as above 1,185,713 30,888 0.08 30,888 Yi Tong Fiber Co., Ltd. - Same as above 5,256,454 41,691 5.94 41,691 FDT Ordinary shares Far Eastern International Bank The chairman of the Corporation is its vice-chairman
by the ultimate parent company Financial assets at fair value through other
comprehensive income - current 296,017 3,537 0.01 3,537
Far Eastern Department Store Ltd. The chairman of the Corporation is its vice-chairman Financial assets at fair value through other comprehensive income - noncurrent
935,029 24,358 0.07 24,358
Oriental Union Chemical Corp. Same chairman with the ultimate parent company Same as above 3,254,125 68,337 0.37 68,337 Ding & Ding Management Consultants Co., Ltd. - Same as above 866,730 8,376 16.00 8,376 AEE Ordinary shares Far EasTone Same chairman with the major shareholder Financial assets at fair value through profit or
loss - current 120,000 8,652 - 8,652
Ding & Ding Management Consultants Co., Ltd. - Financial assets at fair value through other comprehensive income - noncurrent
273,024 900 5.04 900
YLPPC Ordinary shares Far EasTone The director of the Corporation is its chairman Financial assets at fair value through other
comprehensive income - current 105,000 7,571 - 7,571
Yamay International Development Corp. - Financial assets at fair value through other comprehensive income - noncurrent
15 - - -
AIC Beneficiary certificates Opas Fund Segregated Portfolio Tranche E Related party in substance Financial assets at fair value through profit or
loss - current 3,973 156,299 - 156,299
ChinaAMC CSI 300 Index ETF - Same as above 1,000,000 177,202 0.37 177,202
(Continued)
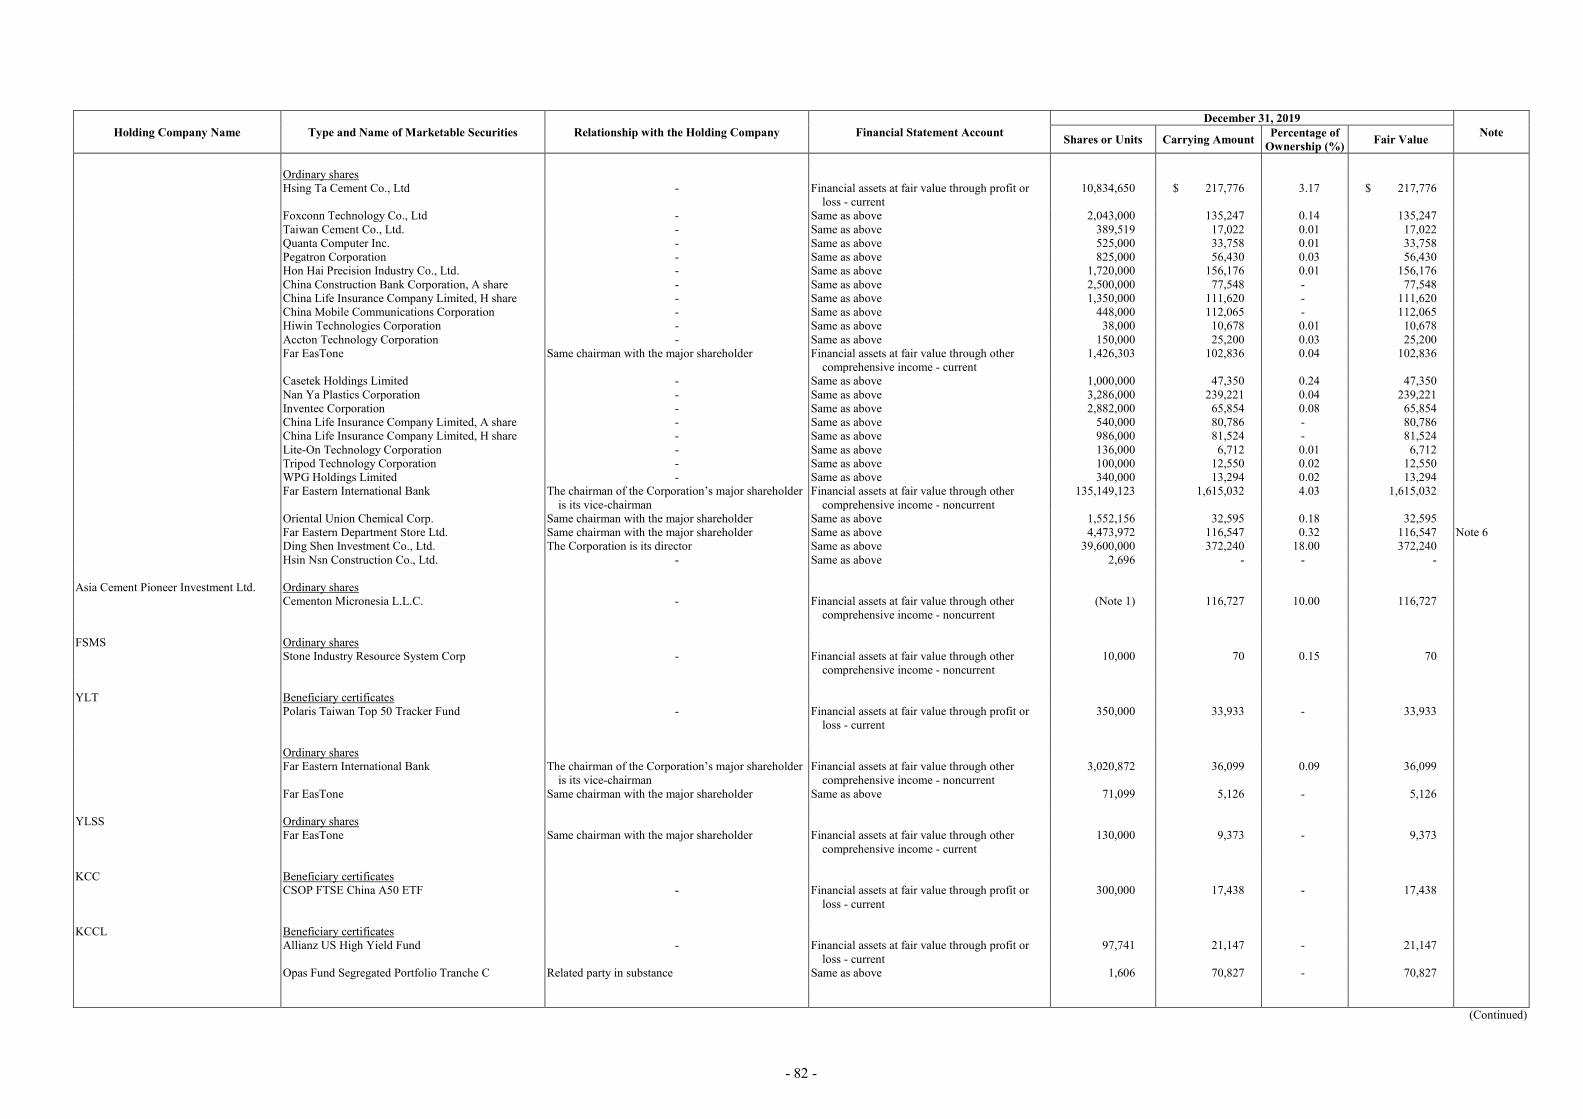
- 82 -
Holding Company Name Type and Name of Marketable Securities Relationship with the Holding Company Financial Statement Account December 31, 2019
Note Shares or Units Carrying Amount Percentage of Ownership (%) Fair Value
Ordinary shares Hsing Ta Cement Co., Ltd - Financial assets at fair value through profit or
loss - current 10,834,650 $ 217,776 3.17 $ 217,776
Foxconn Technology Co., Ltd - Same as above 2,043,000 135,247 0.14 135,247 Taiwan Cement Co., Ltd. - Same as above 389,519 17,022 0.01 17,022 Quanta Computer Inc. - Same as above 525,000 33,758 0.01 33,758 Pegatron Corporation - Same as above 825,000 56,430 0.03 56,430 Hon Hai Precision Industry Co., Ltd. - Same as above 1,720,000 156,176 0.01 156,176 China Construction Bank Corporation, A share - Same as above 2,500,000 77,548 - 77,548 China Life Insurance Company Limited, H share - Same as above 1,350,000 111,620 - 111,620 China Mobile Communications Corporation - Same as above 448,000 112,065 - 112,065 Hiwin Technologies Corporation - Same as above 38,000 10,678 0.01 10,678 Accton Technology Corporation - Same as above 150,000 25,200 0.03 25,200 Far EasTone Same chairman with the major shareholder Financial assets at fair value through other
comprehensive income - current 1,426,303 102,836 0.04 102,836
Casetek Holdings Limited - Same as above 1,000,000 47,350 0.24 47,350 Nan Ya Plastics Corporation - Same as above 3,286,000 239,221 0.04 239,221 Inventec Corporation - Same as above 2,882,000 65,854 0.08 65,854 China Life Insurance Company Limited, A share - Same as above 540,000 80,786 - 80,786 China Life Insurance Company Limited, H share - Same as above 986,000 81,524 - 81,524 Lite-On Technology Corporation - Same as above 136,000 6,712 0.01 6,712 Tripod Technology Corporation - Same as above 100,000 12,550 0.02 12,550 WPG Holdings Limited - Same as above 340,000 13,294 0.02 13,294 Far Eastern International Bank The chairman of the Corporation’s major shareholder
is its vice-chairman Financial assets at fair value through other
comprehensive income - noncurrent 135,149,123 1,615,032 4.03 1,615,032
Oriental Union Chemical Corp. Same chairman with the major shareholder Same as above 1,552,156 32,595 0.18 32,595 Far Eastern Department Store Ltd. Same chairman with the major shareholder Same as above 4,473,972 116,547 0.32 116,547 Note 6 Ding Shen Investment Co., Ltd. The Corporation is its director Same as above 39,600,000 372,240 18.00 372,240 Hsin Nsn Construction Co., Ltd. - Same as above 2,696 - - - Asia Cement Pioneer Investment Ltd. Ordinary shares Cementon Micronesia L.L.C. - Financial assets at fair value through other
comprehensive income - noncurrent (Note 1) 116,727 10.00 116,727
FSMS Ordinary shares Stone Industry Resource System Corp - Financial assets at fair value through other
comprehensive income - noncurrent 10,000 70 0.15 70
YLT Beneficiary certificates Polaris Taiwan Top 50 Tracker Fund - Financial assets at fair value through profit or
loss - current 350,000 33,933 - 33,933
Ordinary shares Far Eastern International Bank The chairman of the Corporation’s major shareholder
is its vice-chairman Financial assets at fair value through other
comprehensive income - noncurrent 3,020,872 36,099 0.09 36,099
Far EasTone Same chairman with the major shareholder Same as above 71,099 5,126 - 5,126 YLSS Ordinary shares Far EasTone Same chairman with the major shareholder Financial assets at fair value through other
comprehensive income - current 130,000 9,373 - 9,373
KCC Beneficiary certificates CSOP FTSE China A50 ETF - Financial assets at fair value through profit or
loss - current 300,000 17,438
- 17,438
KCCL Beneficiary certificates Allianz US High Yield Fund - Financial assets at fair value through profit or
loss - current 97,741 21,147
- 21,147
Opas Fund Segregated Portfolio Tranche C Related party in substance Same as above 1,606 70,827
- 70,827
(Continued)

- 83 -
Holding Company Name Type and Name of Marketable Securities Relationship with the Holding Company Financial Statement Account December 31, 2019
Note Shares or Units Carrying Amount Percentage of Ownership (%) Fair Value
ACSPL Beneficiary certificates United Emerging Markets Bond Funds - Financial assets at fair value through profit or
loss - current 3,232,758 $ 93,112
- $ 93,112
United Growth Fund - Same as above 745,068 60,131 - 60,131 Ordinary shares DBS Group - Financial assets at fair value through profit or
loss - current 33,436 19,202
- 19,202
Guocoland Ltd. - Same as above 26,666 1,160 - 1,160 Hong Leong Asia - Same as above 20,000 297 - 297 INTRACO - Same as above 46,875 296 - 296 Engro Corp Ltd. - Same as above 2,000 43 - 43 OCPL Ordinary shares Hiap Hoe Ltd. - Financial assets at fair value through profit or
loss - current 44,260 786 - 786
Note 1: This is not a company limited by shares. Note 2: Marketable securities in this table are shares, bonds, beneficiary certificates and securities derived from these items under IFRS 9 “Financial Instruments: Recognition and Measurement”. Note 3: The carrying amounts of financial instruments measured at fair values are adjusted for fair value less accumulated impairment loss; the carrying amounts of financial instruments not measured at fair values are the original cost or amortized cost less accumulated impairment loss. Note 4: 14,500 thousand shares ($1,045,450 thousand) of the securities are pledged as collaterals for bank loans of the Corporation. Note 5: 5,000 thousand shares ($130,250 thousand) of the securities are pledged as collaterals for bank loans of DCI. Note 6: 3,500 thousand shares ($91,175 thousand) of the securities are pledged as collaterals for bank loans of AIC.
(Concluded)
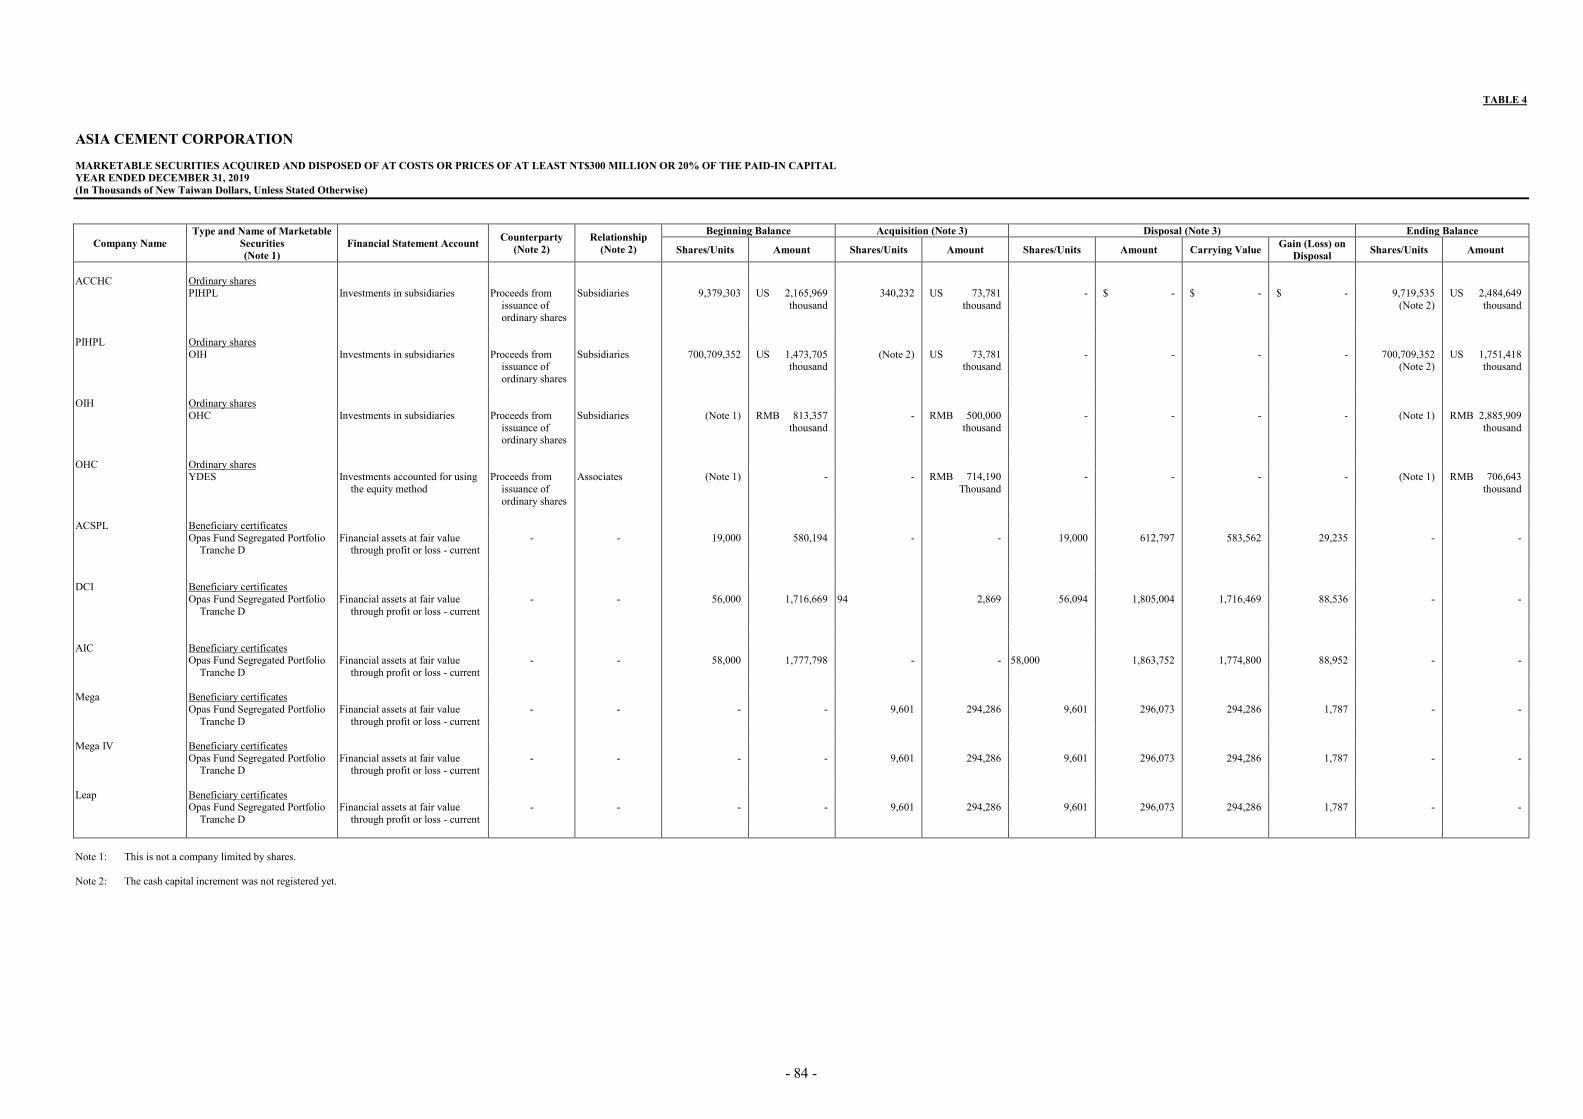
- 84 -
TABLE 4 ASIA CEMENT CORPORATION MARKETABLE SECURITIES ACQUIRED AND DISPOSED OF AT COSTS OR PRICES OF AT LEAST NT$300 MILLION OR 20% OF THE PAID-IN CAPITAL YEAR ENDED DECEMBER 31, 2019 (In Thousands of New Taiwan Dollars, Unless Stated Otherwise)
Company Name Type and Name of Marketable
Securities (Note 1)
Financial Statement Account Counterparty (Note 2)
Relationship (Note 2)
Beginning Balance Acquisition (Note 3) Disposal (Note 3) Ending Balance
Shares/Units Amount Shares/Units Amount Shares/Units Amount Carrying Value Gain (Loss) on Disposal Shares/Units Amount
ACCHC Ordinary shares PIHPL Investments in subsidiaries Proceeds from
issuance of ordinary shares
Subsidiaries 9,379,303 US 2,165,969 thousand
340,232 US 73,781 thousand
- $ - $ - $ - 9,719,535 (Note 2)
US 2,484,649 thousand
PIHPL Ordinary shares OIH Investments in subsidiaries Proceeds from
issuance of ordinary shares
Subsidiaries 700,709,352 US 1,473,705 thousand
(Note 2) US 73,781 thousand
- - - - 700,709,352 (Note 2)
US 1,751,418 thousand
OIH Ordinary shares OHC Investments in subsidiaries Proceeds from
issuance of ordinary shares
Subsidiaries (Note 1) RMB 813,357 thousand
- RMB 500,000 thousand
- - - - (Note 1) RMB 2,885,909 thousand
OHC Ordinary shares YDES Investments accounted for using
the equity method Proceeds from
issuance of ordinary shares
Associates (Note 1) - - RMB 714,190 Thousand
- - - - (Note 1) RMB 706,643 thousand
ACSPL Beneficiary certificates Opas Fund Segregated Portfolio
Tranche D Financial assets at fair value
through profit or loss - current
- - 19,000 580,194 - - 19,000 612,797 583,562 29,235 - -
DCI Beneficiary certificates Opas Fund Segregated Portfolio
Tranche D Financial assets at fair value
through profit or loss - current
- - 56,000 1,716,669 94 2,869 56,094 1,805,004 1,716,469 88,536 - -
AIC Beneficiary certificates Opas Fund Segregated Portfolio
Tranche D Financial assets at fair value
through profit or loss - current - - 58,000 1,777,798 - - 58,000 1,863,752 1,774,800 88,952 - -
Mega Beneficiary certificates Opas Fund Segregated Portfolio
Tranche D Financial assets at fair value
through profit or loss - current - - - - 9,601 294,286 9,601 296,073 294,286 1,787 - -
Mega IV Beneficiary certificates Opas Fund Segregated Portfolio
Tranche D Financial assets at fair value
through profit or loss - current - - - - 9,601 294,286 9,601 296,073 294,286 1,787 - -
Leap Beneficiary certificates Opas Fund Segregated Portfolio
Tranche D Financial assets at fair value
through profit or loss - current - - - - 9,601 294,286 9,601 296,073 294,286 1,787 - -
Note 1: This is not a company limited by shares. Note 2: The cash capital increment was not registered yet.

- 85 -
TABLE 5 ASIA CEMENT CORPORATION TOTAL PURCHASE FROM OR SALE TO RELATED PARTIES AMOUNTING TO AT LEAST NT$100 MILLION OR 20% OF THE PAID-IN CAPITAL YEAR ENDED DECEMBER 31, 2019 (In Thousands of New Taiwan Dollars, Unless Stated Otherwise)
Purchasing or (Selling)
Company Name Related Party Relationship
Transaction Details Abnormal Transaction Notes/Accounts (Payable) or Receivable Note
Purchase (Sale) Amount % to Total Payment Terms Unit Price Payment Terms Ending Balance % to
Total The Corporation YTRMC A subsidiary of the Corporation Sales $ (1,805,262) (20) Purchase 45 days after monthly closing $ - - $ 348,664 33 ACSPL A subsidiary of the Corporation Sales (522,223) (6) Average 30 days - - 38,621 4 YSRMC A subsidiary of the Corporation Sales (163,476) (2) Purchase 45 days after monthly closing - - 34,114 3 U-Ming An investee accounted for by equity method Sales freight expense 551,952 6 Average 60 days - - (66,176) (4) U-Ming Singapore A subsidiary of an investee accounted for by
equity method Sales freight expense 186,958 2 Average 10 days - - - -
YLT A subsidiary of the Corporation Sales freight expense 176,539 2 Average 30 days - - (31,883) (2) NHC A subsidiary of the Corporation Purchase 151,293 2 Purchase 45 days after monthly closing - - (28,431) (2) ACSPL Alliance Concrete Singapore Pte. Ltd. An investee accounted for by equity method Sales SGD (28,215)
thousand (78) Average 60 days - - SGD 6,247
thousand 83
The Corporation Parent company Purchase SGD 23,042 thousand
63 Average 30 days - - SGD (1,740) thousand
(28)
YTRMC Far Eastern General Construction Inc. Related party in substance Sales (430,434) (5) Average 90 days - - 213,416 6 Far Eastern Resources Development Co. Related party in substance Sales (104,551) (1) Average 90 days - - 76,481 2 The Corporation Parent company Purchase 1,805,262 21 Purchase 45 days after monthly closing - - (348,664) (24) CHC Resources Corporation Related party in substance Purchase 466,075 5 Purchase 45 days after monthly closing - - (64,488) (4) FMT Air Liquide Far Eastern Co. Related party in substance Sales (156,034) (14) Purchase 120 days after monthly closing - - 52,734 25 FENC An investee accounted for by equity method Sales (207,509) (19) Purchase 60 days after monthly closing - - 27,527 13 OUCC Related party in substance Sales (133,627) (12) Purchase 75 days after monthly closing - - 23,895 11 FDT Oriental Petrochemical (Taiwan) Co., Ltd. Related party in substance Sales (176,300) (20) 110 days - - 55,066 46 YSRMC Chubei New Century Shopping Mall Co.,
Ltd. Related party in substance Sales (104,908) (15) Average 60 days - - 19,648 8
The Corporation Parent company Purchase 163,476 25 Purchase 45 days after monthly closing - - (34,114) (30) YLPPC Far Eastern General Construction Inc. Related party in substance Sales (116,783) (66) Average 90 days - - 35,542 34 NHC The Corporation Parent company Sales (151,293) (40) Purchase 45 days after monthly closing - - 28,431 33 YLT The Corporation Parent company Sales (176,539) (98) 30 days - - 31,883 99 YTV Far Eastern Polytex Vietnam Ltd. A subsidiary of an investee accounted for by
equity method Sales VND (79,774,106)
thousand (82) Within 45 days - - VND 26,936,744
thousand 87
JYDC TZOCCL The same ultimate parent company Sales RMB (240,626)
thousand (5) Within 90 days - - RMB 34,873
thousand 4
WYDC The same ultimate parent company Sales RMB (212,481) thousand
(4) Average 30 days - - RMB 37,902 thousand
5
YYDCCL The same ultimate parent company Sales RMB (552,419) thousand
(11) Within 90 days - - RMB 31,765 thousand
4
NYDC A subsidiary of the Corporation Sales RMB (92,202) thousand
(2) Average 30 days - - RMB 16,285 thousand
2
(Continued)
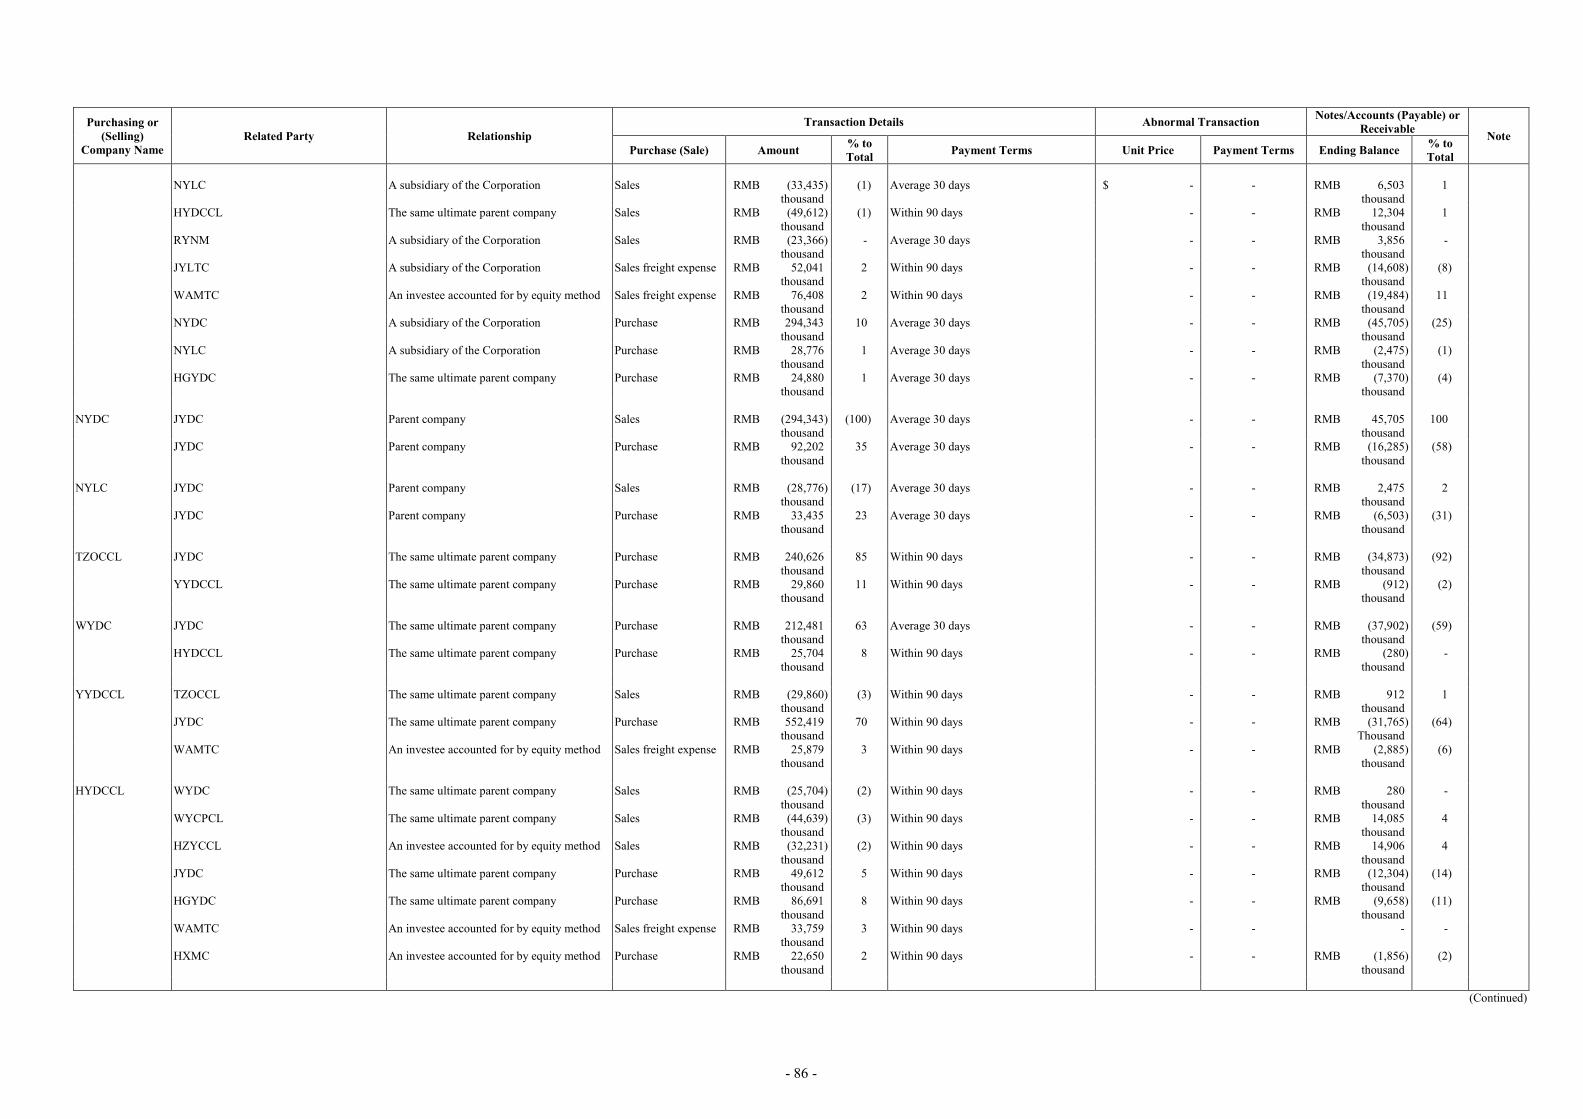
- 86 -
Purchasing or (Selling)
Company Name Related Party Relationship
Transaction Details Abnormal Transaction Notes/Accounts (Payable) or Receivable Note
Purchase (Sale) Amount % to Total Payment Terms Unit Price Payment Terms Ending Balance % to
Total NYLC A subsidiary of the Corporation Sales RMB (33,435)
thousand (1) Average 30 days $ - - RMB 6,503
thousand 1
HYDCCL The same ultimate parent company Sales RMB (49,612) thousand
(1) Within 90 days - - RMB 12,304 thousand
1
RYNM A subsidiary of the Corporation Sales RMB (23,366) thousand
- Average 30 days - - RMB 3,856 thousand
-
JYLTC A subsidiary of the Corporation Sales freight expense RMB 52,041 thousand
2 Within 90 days - - RMB (14,608) thousand
(8)
WAMTC An investee accounted for by equity method Sales freight expense RMB 76,408 thousand
2 Within 90 days - - RMB (19,484) thousand
11
NYDC A subsidiary of the Corporation Purchase RMB 294,343 thousand
10 Average 30 days - - RMB (45,705) thousand
(25)
NYLC A subsidiary of the Corporation Purchase RMB 28,776 thousand
1 Average 30 days - - RMB (2,475) thousand
(1)
HGYDC The same ultimate parent company Purchase RMB 24,880 thousand
1 Average 30 days - - RMB (7,370) thousand
(4)
NYDC JYDC Parent company Sales RMB (294,343)
thousand (100) Average 30 days - - RMB 45,705
thousand 100
JYDC Parent company Purchase RMB 92,202 thousand
35 Average 30 days - - RMB (16,285) thousand
(58)
NYLC JYDC Parent company Sales RMB (28,776)
thousand (17) Average 30 days - - RMB 2,475
thousand 2
JYDC Parent company Purchase RMB 33,435 thousand
23 Average 30 days - - RMB (6,503) thousand
(31)
TZOCCL JYDC The same ultimate parent company Purchase RMB 240,626
thousand 85 Within 90 days - - RMB (34,873)
thousand (92)
YYDCCL The same ultimate parent company Purchase RMB 29,860 thousand
11 Within 90 days - - RMB (912) thousand
(2)
WYDC JYDC The same ultimate parent company Purchase RMB 212,481
thousand 63 Average 30 days - - RMB (37,902)
thousand (59)
HYDCCL The same ultimate parent company Purchase RMB 25,704 thousand
8 Within 90 days - - RMB (280) thousand
-
YYDCCL TZOCCL The same ultimate parent company Sales RMB (29,860)
thousand (3) Within 90 days - - RMB 912
thousand 1
JYDC The same ultimate parent company Purchase RMB 552,419 thousand
70 Within 90 days - - RMB (31,765) Thousand
(64)
WAMTC An investee accounted for by equity method Sales freight expense RMB 25,879 thousand
3 Within 90 days - - RMB (2,885) thousand
(6)
HYDCCL WYDC The same ultimate parent company Sales RMB (25,704)
thousand (2) Within 90 days - - RMB 280
thousand -
WYCPCL The same ultimate parent company Sales RMB (44,639) thousand
(3) Within 90 days - - RMB 14,085 thousand
4
HZYCCL An investee accounted for by equity method Sales RMB (32,231) thousand
(2) Within 90 days - - RMB 14,906 thousand
4
JYDC The same ultimate parent company Purchase RMB 49,612 thousand
5 Within 90 days - - RMB (12,304) thousand
(14)
HGYDC The same ultimate parent company Purchase RMB 86,691 thousand
8 Within 90 days - - RMB (9,658) thousand
(11)
WAMTC An investee accounted for by equity method Sales freight expense RMB 33,759 thousand
3 Within 90 days - - - -
HXMC An investee accounted for by equity method Purchase RMB 22,650 thousand
2 Within 90 days - - RMB (1,856) thousand
(2)
(Continued)
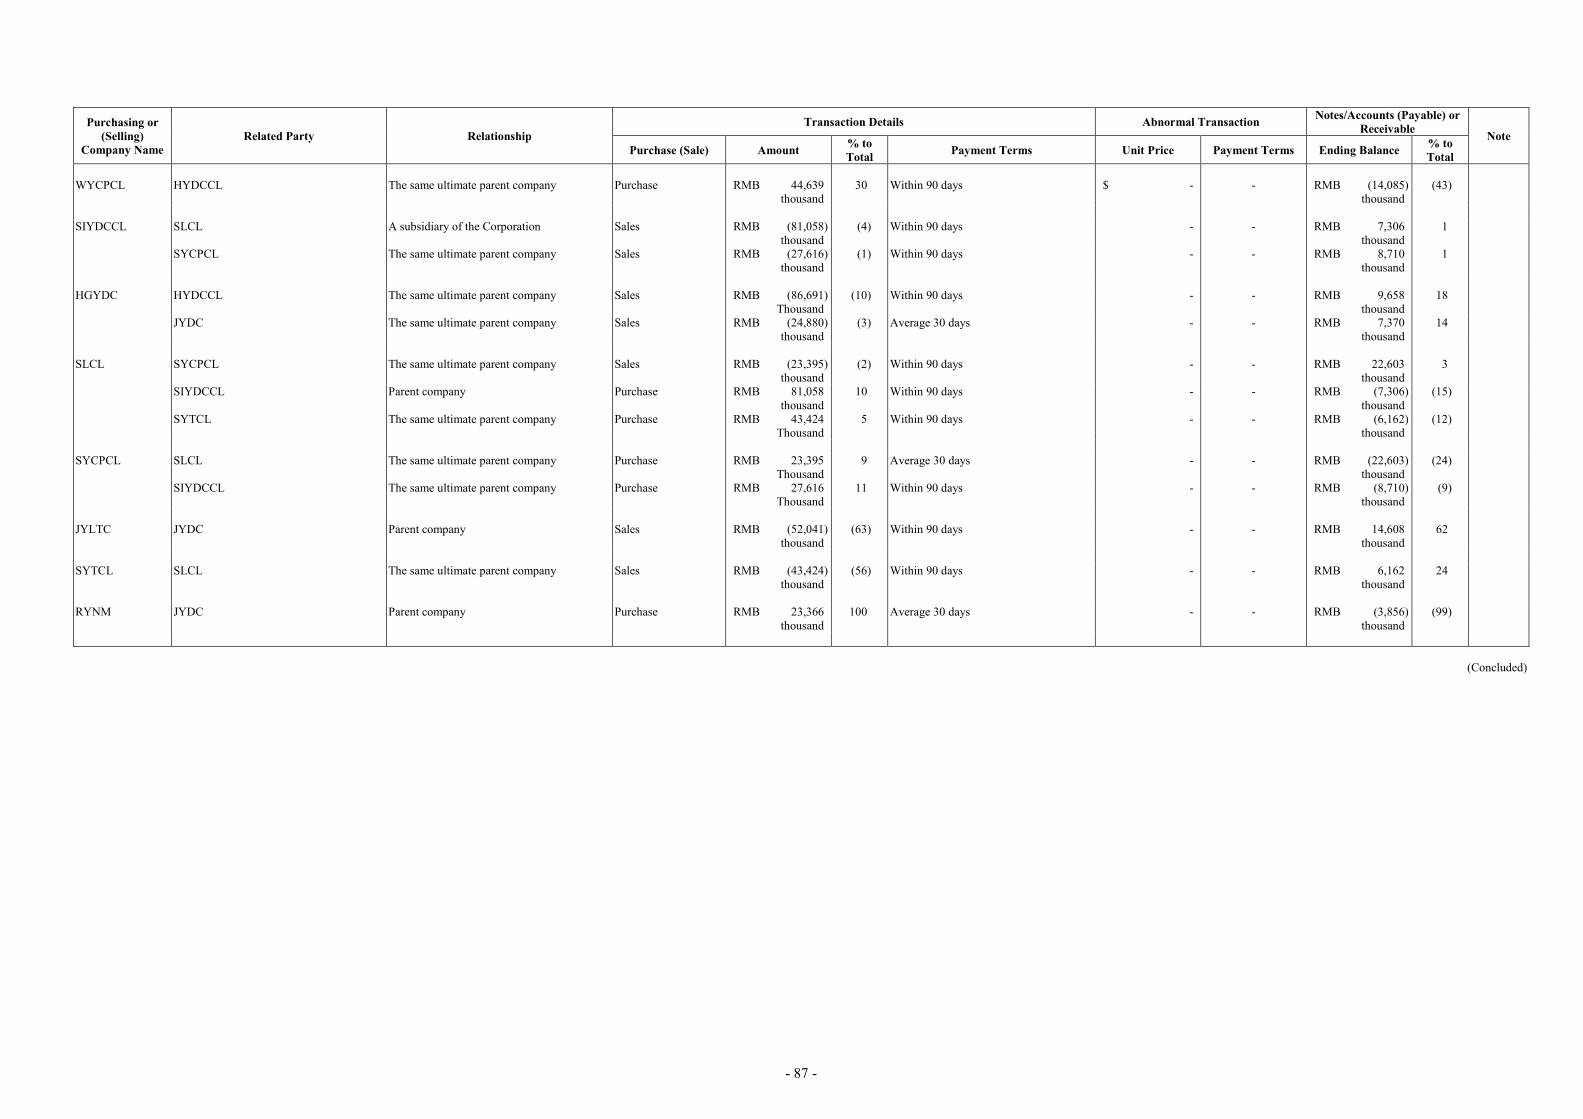
- 87 -
Purchasing or (Selling)
Company Name Related Party Relationship
Transaction Details Abnormal Transaction Notes/Accounts (Payable) or Receivable Note
Purchase (Sale) Amount % to Total Payment Terms Unit Price Payment Terms Ending Balance % to
Total WYCPCL HYDCCL The same ultimate parent company Purchase RMB 44,639
thousand 30 Within 90 days $ - - RMB (14,085)
thousand (43)
SIYDCCL SLCL A subsidiary of the Corporation Sales RMB (81,058)
thousand (4) Within 90 days - - RMB 7,306
thousand 1
SYCPCL The same ultimate parent company Sales RMB (27,616) thousand
(1) Within 90 days - - RMB 8,710 thousand
1
HGYDC HYDCCL The same ultimate parent company Sales RMB (86,691)
Thousand (10) Within 90 days - - RMB 9,658
thousand 18
JYDC The same ultimate parent company Sales RMB (24,880) thousand
(3) Average 30 days - - RMB 7,370 thousand
14
SLCL
SYCPCL The same ultimate parent company Sales RMB (23,395) thousand
(2) Within 90 days - - RMB 22,603 thousand
3
SIYDCCL
Parent company Purchase RMB 81,058 thousand
10 Within 90 days - - RMB (7,306) thousand
(15)
SYTCL The same ultimate parent company Purchase RMB 43,424 Thousand
5 Within 90 days - - RMB (6,162) thousand
(12)
SYCPCL SLCL The same ultimate parent company Purchase RMB 23,395
Thousand 9 Average 30 days - - RMB (22,603)
thousand (24)
SIYDCCL The same ultimate parent company Purchase RMB 27,616 Thousand
11 Within 90 days - - RMB (8,710) thousand
(9)
JYLTC JYDC Parent company Sales RMB (52,041)
thousand (63) Within 90 days - - RMB 14,608
thousand 62
SYTCL SLCL The same ultimate parent company Sales RMB (43,424)
thousand (56) Within 90 days - - RMB 6,162
thousand 24
RYNM JYDC Parent company Purchase RMB 23,366
thousand 100 Average 30 days - - RMB (3,856)
thousand (99)
(Concluded)
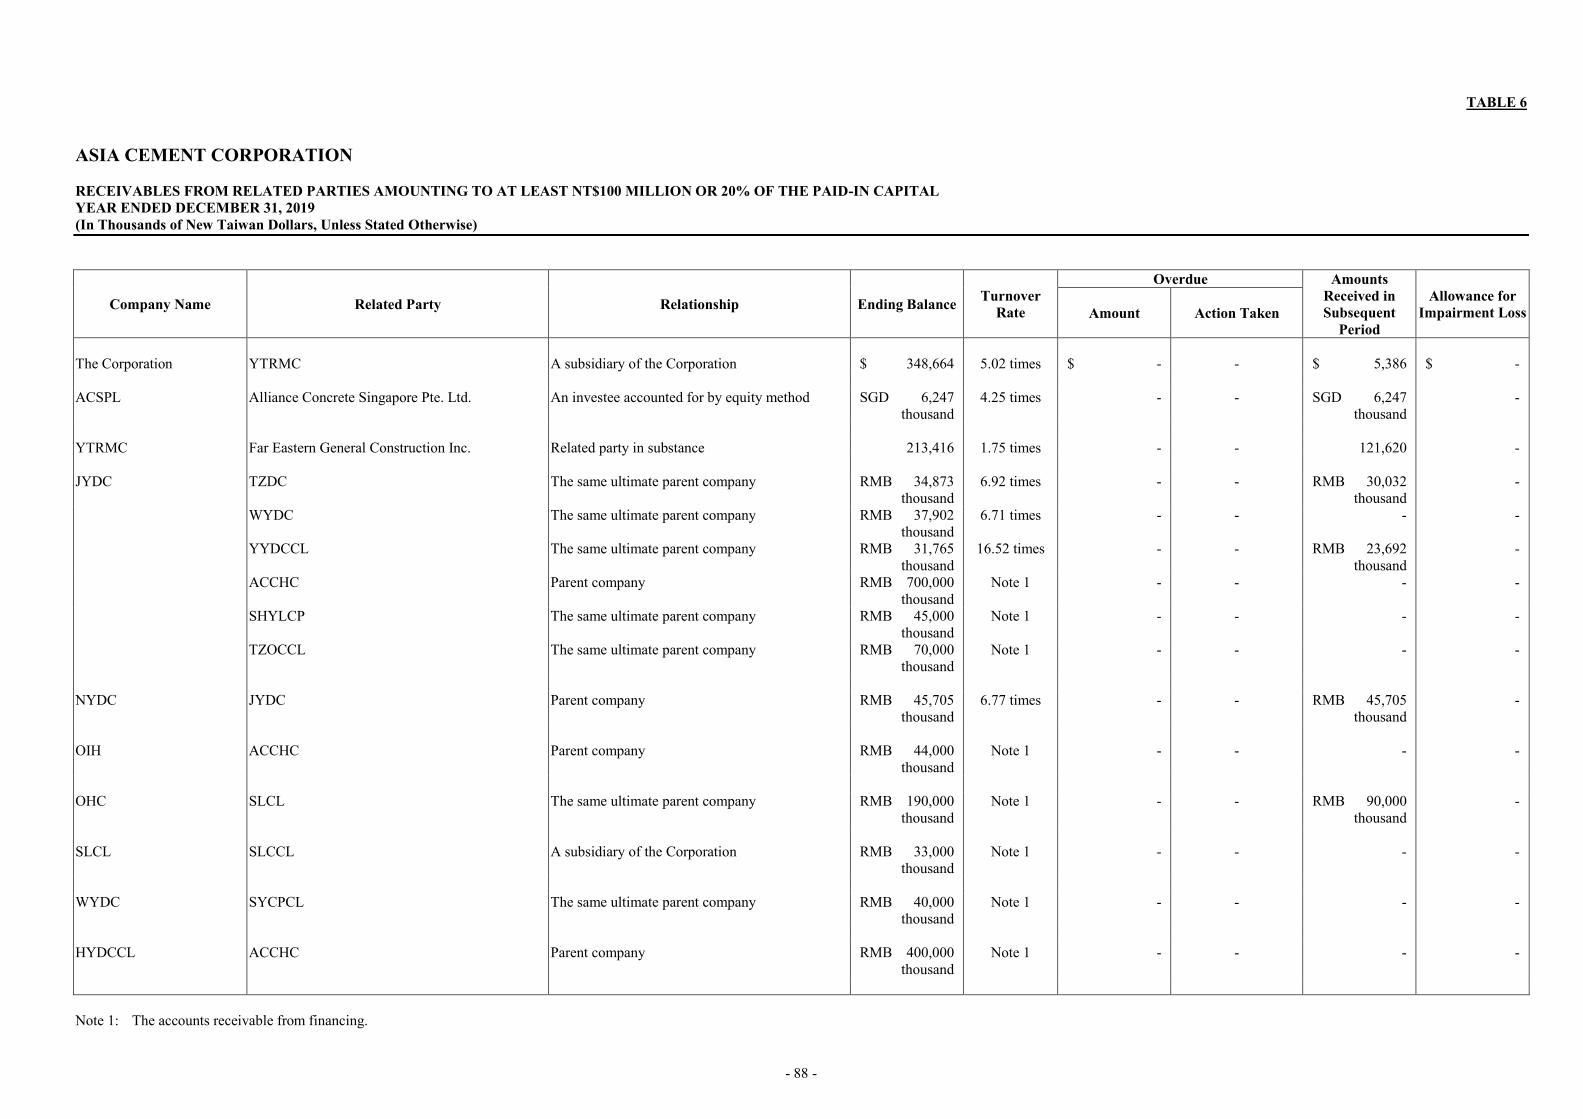
- 88 -
TABLE 6 ASIA CEMENT CORPORATION RECEIVABLES FROM RELATED PARTIES AMOUNTING TO AT LEAST NT$100 MILLION OR 20% OF THE PAID-IN CAPITAL YEAR ENDED DECEMBER 31, 2019 (In Thousands of New Taiwan Dollars, Unless Stated Otherwise)
Company Name Related Party Relationship Ending Balance Turnover Rate
Overdue Amounts Received in Subsequent
Period
Allowance for Impairment Loss Amount Action Taken
The Corporation YTRMC A subsidiary of the Corporation $ 348,664 5.02 times $ - - $ 5,386 $ - ACSPL Alliance Concrete Singapore Pte. Ltd. An investee accounted for by equity method SGD 6,247
thousand 4.25 times - - SGD 6,247
thousand -
YTRMC Far Eastern General Construction Inc. Related party in substance 213,416 1.75 times - - 121,620 - JYDC TZDC The same ultimate parent company RMB 34,873
thousand 6.92 times - - RMB 30,032
thousand -
WYDC The same ultimate parent company RMB 37,902 thousand
6.71 times - - - -
YYDCCL The same ultimate parent company RMB 31,765 thousand
16.52 times - - RMB 23,692 thousand
-
ACCHC Parent company RMB 700,000 thousand
Note 1 - - - -
SHYLCP The same ultimate parent company RMB 45,000 thousand
Note 1 - - - -
TZOCCL The same ultimate parent company RMB 70,000 thousand
Note 1 - - - -
NYDC JYDC Parent company RMB 45,705
thousand 6.77 times - - RMB 45,705
thousand -
OIH ACCHC Parent company RMB 44,000
thousand Note 1 - - - -
OHC SLCL The same ultimate parent company RMB 190,000
thousand Note 1 - - RMB 90,000
thousand -
SLCL SLCCL A subsidiary of the Corporation RMB 33,000
thousand Note 1 - - - -
WYDC SYCPCL The same ultimate parent company RMB 40,000
thousand Note 1 - - - -
HYDCCL ACCHC Parent company RMB 400,000
thousand Note 1 - - - -
Note 1: The accounts receivable from financing.
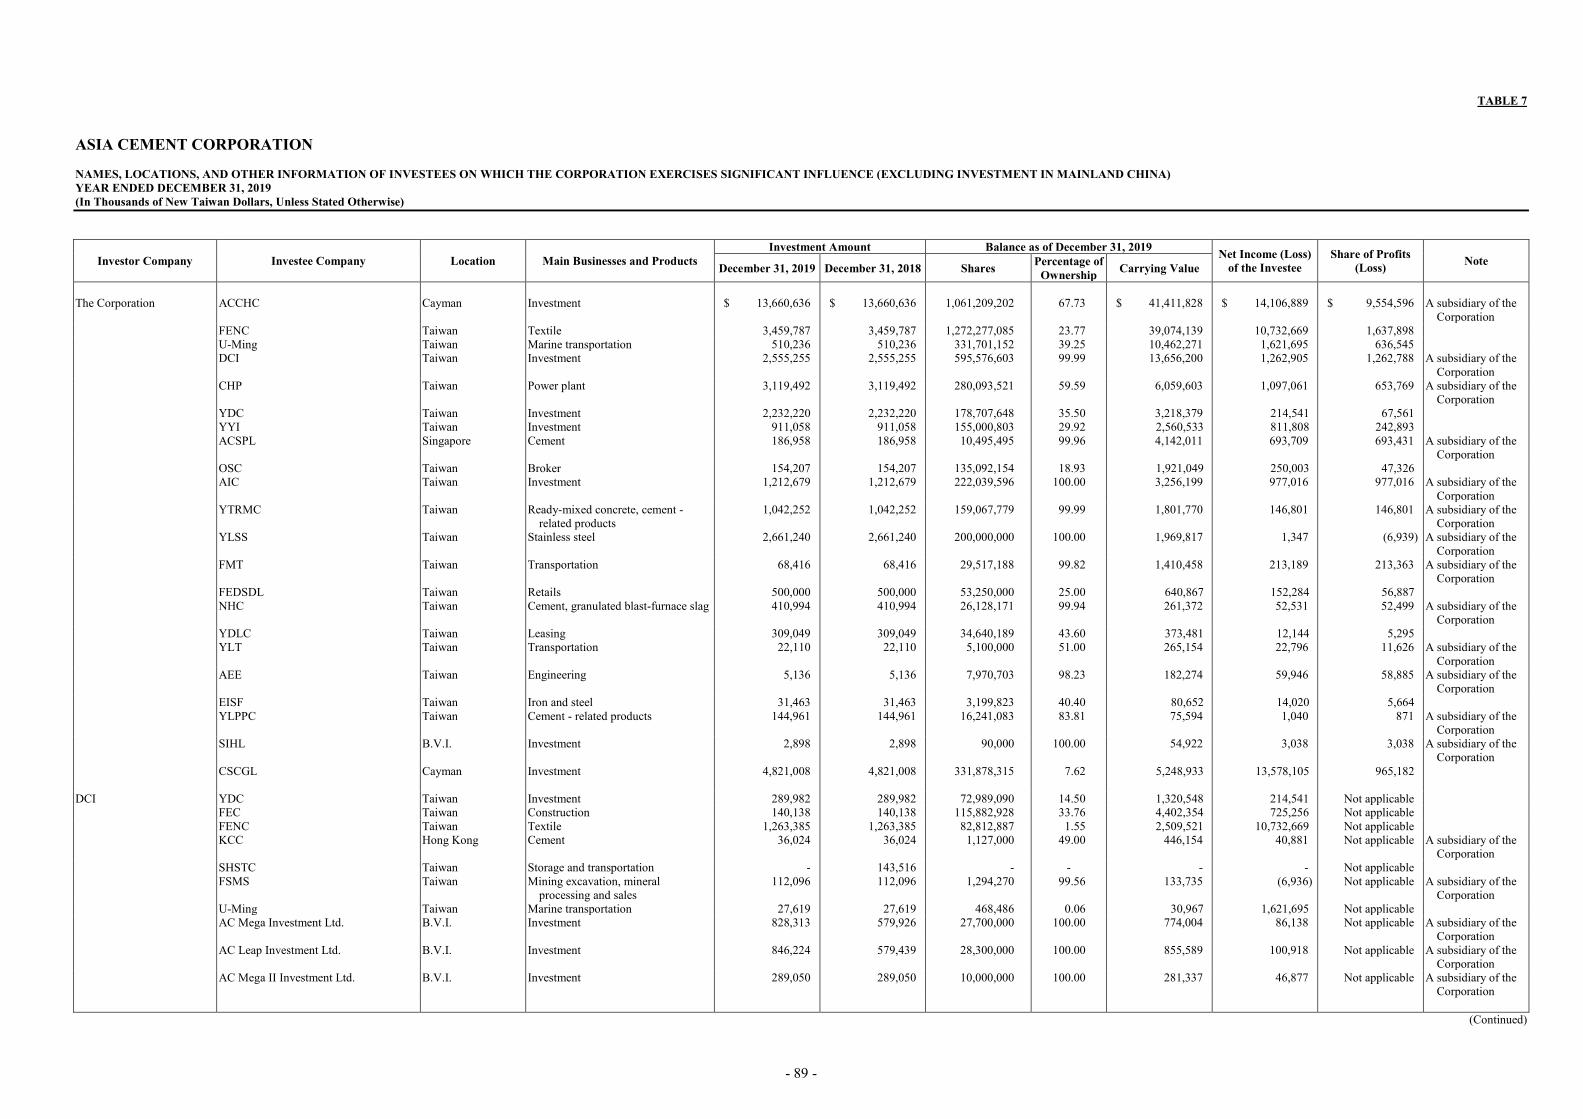
- 89 -
TABLE 7 ASIA CEMENT CORPORATION NAMES, LOCATIONS, AND OTHER INFORMATION OF INVESTEES ON WHICH THE CORPORATION EXERCISES SIGNIFICANT INFLUENCE (EXCLUDING INVESTMENT IN MAINLAND CHINA) YEAR ENDED DECEMBER 31, 2019 (In Thousands of New Taiwan Dollars, Unless Stated Otherwise)
Investor Company Investee Company Location Main Businesses and Products Investment Amount Balance as of December 31, 2019 Net Income (Loss)
of the Investee Share of Profits
(Loss) Note December 31, 2019 December 31, 2018 Shares Percentage of Ownership Carrying Value
The Corporation ACCHC Cayman Investment $ 13,660,636 $ 13,660,636 1,061,209,202 67.73 $ 41,411,828 $ 14,106,889 $ 9,554,596 A subsidiary of the
Corporation FENC Taiwan Textile 3,459,787 3,459,787 1,272,277,085 23.77 39,074,139 10,732,669 1,637,898 U-Ming Taiwan Marine transportation 510,236 510,236 331,701,152 39.25 10,462,271 1,621,695 636,545 DCI Taiwan Investment 2,555,255 2,555,255 595,576,603 99.99 13,656,200 1,262,905 1,262,788 A subsidiary of the
Corporation CHP Taiwan Power plant 3,119,492 3,119,492 280,093,521 59.59 6,059,603 1,097,061 653,769 A subsidiary of the
Corporation YDC Taiwan Investment 2,232,220 2,232,220 178,707,648 35.50 3,218,379 214,541 67,561 YYI Taiwan Investment 911,058 911,058 155,000,803 29.92 2,560,533 811,808 242,893 ACSPL Singapore Cement 186,958 186,958 10,495,495 99.96 4,142,011 693,709 693,431 A subsidiary of the
Corporation OSC Taiwan Broker 154,207 154,207 135,092,154 18.93 1,921,049 250,003 47,326 AIC Taiwan Investment 1,212,679 1,212,679 222,039,596 100.00 3,256,199 977,016 977,016 A subsidiary of the
Corporation YTRMC Taiwan Ready-mixed concrete, cement -
related products 1,042,252 1,042,252 159,067,779 99.99 1,801,770 146,801 146,801 A subsidiary of the
Corporation YLSS Taiwan Stainless steel 2,661,240 2,661,240 200,000,000 100.00 1,969,817 1,347 (6,939) A subsidiary of the
Corporation FMT Taiwan Transportation 68,416 68,416 29,517,188 99.82 1,410,458 213,189 213,363 A subsidiary of the
Corporation FEDSDL Taiwan Retails 500,000 500,000 53,250,000 25.00 640,867 152,284 56,887 NHC Taiwan Cement, granulated blast-furnace slag 410,994 410,994 26,128,171 99.94 261,372 52,531 52,499 A subsidiary of the
Corporation YDLC Taiwan Leasing 309,049 309,049 34,640,189 43.60 373,481 12,144 5,295 YLT Taiwan Transportation 22,110 22,110 5,100,000 51.00 265,154 22,796 11,626 A subsidiary of the
Corporation AEE Taiwan Engineering 5,136 5,136 7,970,703 98.23 182,274 59,946 58,885 A subsidiary of the
Corporation EISF Taiwan Iron and steel 31,463 31,463 3,199,823 40.40 80,652 14,020 5,664 YLPPC Taiwan Cement - related products 144,961 144,961 16,241,083 83.81 75,594 1,040 871 A subsidiary of the
Corporation SIHL B.V.I. Investment 2,898 2,898 90,000 100.00 54,922 3,038 3,038 A subsidiary of the
Corporation CSCGL Cayman Investment 4,821,008 4,821,008 331,878,315 7.62 5,248,933 13,578,105 965,182 DCI YDC Taiwan Investment 289,982 289,982 72,989,090 14.50 1,320,548 214,541 Not applicable FEC Taiwan Construction 140,138 140,138 115,882,928 33.76 4,402,354 725,256 Not applicable FENC Taiwan Textile 1,263,385 1,263,385 82,812,887 1.55 2,509,521 10,732,669 Not applicable KCC Hong Kong Cement 36,024 36,024 1,127,000 49.00 446,154 40,881
Not applicable A subsidiary of the
Corporation SHSTC Taiwan Storage and transportation - 143,516 - - - - Not applicable FSMS Taiwan Mining excavation, mineral
processing and sales 112,096 112,096 1,294,270 99.56 133,735 (6,936) Not applicable A subsidiary of the
Corporation U-Ming Taiwan Marine transportation 27,619 27,619 468,486 0.06 30,967 1,621,695 Not applicable AC Mega Investment Ltd. B.V.I. Investment 828,313 579,926 27,700,000 100.00 774,004 86,138 Not applicable A subsidiary of the
Corporation AC Leap Investment Ltd. B.V.I. Investment 846,224 579,439 28,300,000 100.00 855,589 100,918 Not applicable A subsidiary of the
Corporation AC Mega II Investment Ltd. B.V.I. Investment 289,050 289,050 10,000,000 100.00 281,337 46,877 Not applicable A subsidiary of the
Corporation
(Continued)
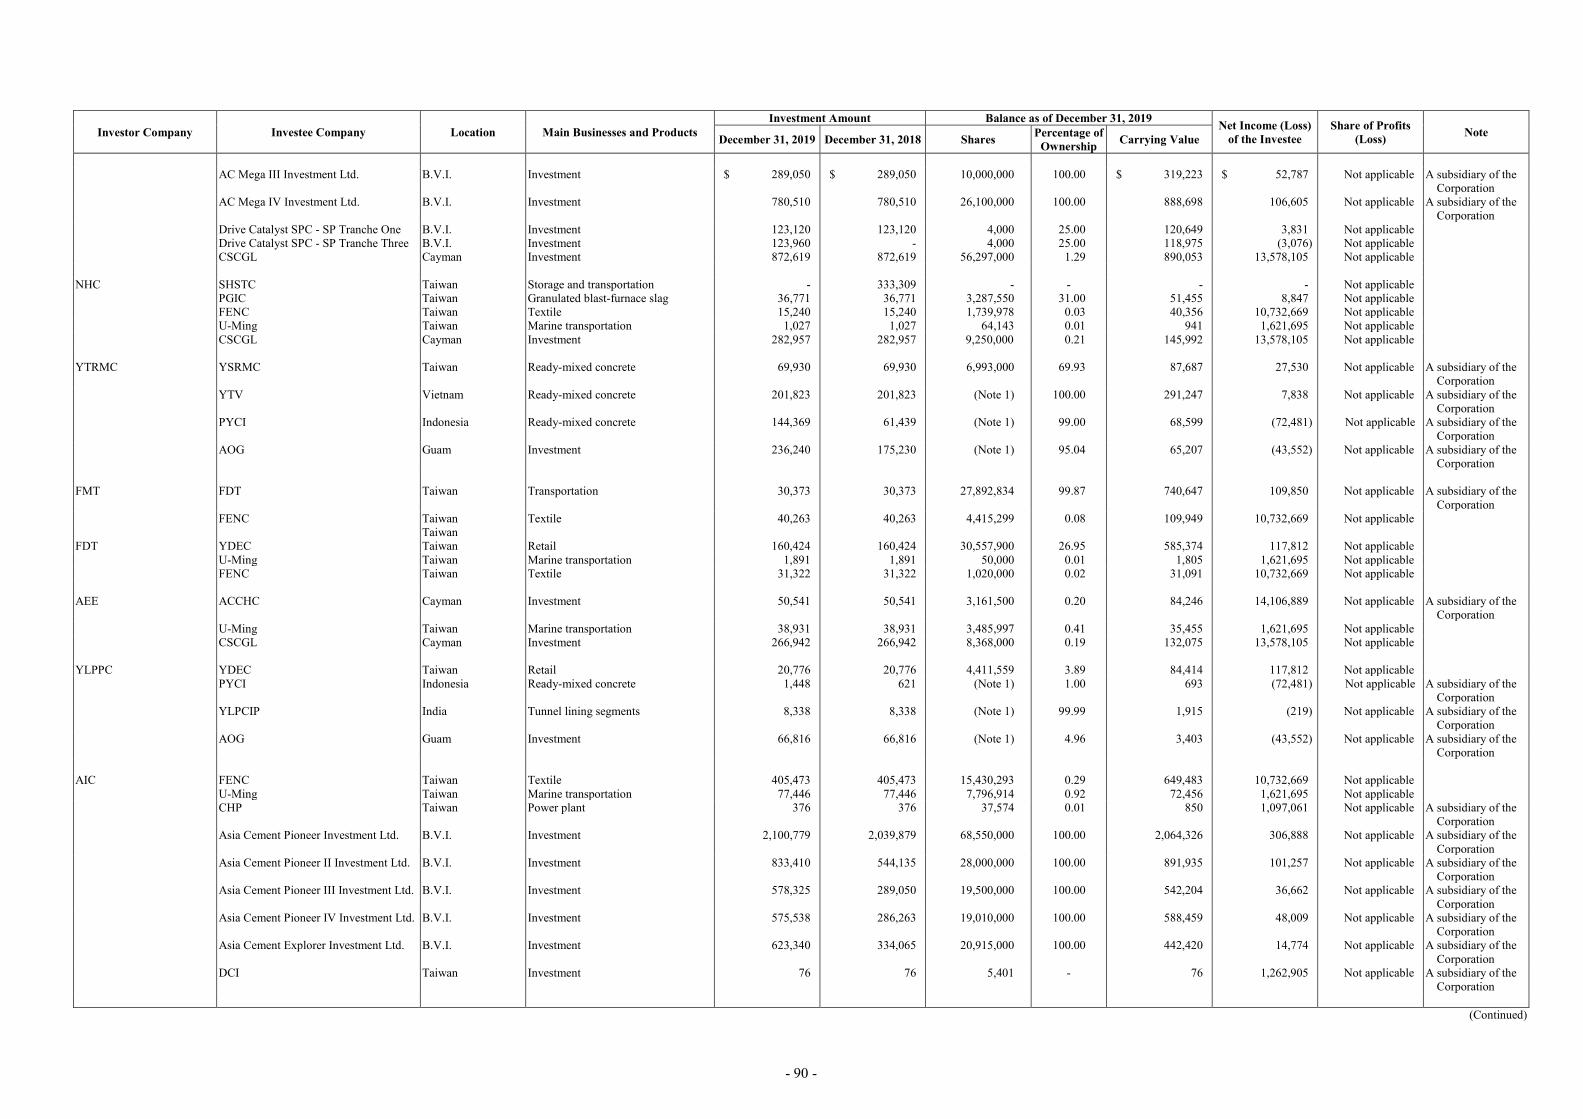
- 90 -
Investor Company Investee Company Location Main Businesses and Products Investment Amount Balance as of December 31, 2019 Net Income (Loss)
of the Investee Share of Profits
(Loss) Note December 31, 2019 December 31, 2018 Shares Percentage of Ownership Carrying Value
AC Mega III Investment Ltd. B.V.I. Investment $ 289,050 $ 289,050 10,000,000 100.00 $ 319,223 $ 52,787 Not applicable A subsidiary of the
Corporation AC Mega IV Investment Ltd. B.V.I. Investment 780,510 780,510 26,100,000 100.00 888,698 106,605 Not applicable A subsidiary of the
Corporation Drive Catalyst SPC - SP Tranche One B.V.I. Investment 123,120 123,120 4,000 25.00 120,649 3,831 Not applicable Drive Catalyst SPC - SP Tranche Three B.V.I. Investment 123,960 - 4,000 25.00 118,975 (3,076) Not applicable CSCGL Cayman Investment 872,619 872,619 56,297,000 1.29 890,053 13,578,105 Not applicable NHC SHSTC Taiwan Storage and transportation - 333,309 - - - - Not applicable PGIC Taiwan Granulated blast-furnace slag 36,771 36,771 3,287,550 31.00 51,455 8,847 Not applicable FENC Taiwan Textile 15,240 15,240 1,739,978 0.03 40,356 10,732,669 Not applicable U-Ming Taiwan Marine transportation 1,027 1,027 64,143 0.01 941 1,621,695 Not applicable CSCGL Cayman Investment 282,957 282,957 9,250,000 0.21 145,992 13,578,105 Not applicable YTRMC YSRMC Taiwan Ready-mixed concrete 69,930 69,930 6,993,000 69.93 87,687 27,530 Not applicable A subsidiary of the
Corporation YTV Vietnam Ready-mixed concrete 201,823 201,823 (Note 1) 100.00 291,247 7,838
Not applicable A subsidiary of the
Corporation PYCI Indonesia Ready-mixed concrete 144,369 61,439 (Note 1) 99.00 68,599 (72,481)
Not applicable A subsidiary of the
Corporation AOG Guam Investment 236,240 175,230 (Note 1) 95.04 65,207 (43,552)
Not applicable A subsidiary of the
Corporation FMT FDT Taiwan Transportation 30,373 30,373 27,892,834 99.87 740,647 109,850 Not applicable A subsidiary of the
Corporation FENC Taiwan Textile 40,263 40,263 4,415,299 0.08 109,949 10,732,669 Not applicable Taiwan FDT YDEC Taiwan Retail 160,424 160,424 30,557,900 26.95 585,374 117,812 Not applicable U-Ming Taiwan Marine transportation 1,891 1,891 50,000 0.01 1,805 1,621,695 Not applicable FENC Taiwan Textile 31,322 31,322 1,020,000 0.02 31,091 10,732,669 Not applicable AEE ACCHC Cayman Investment 50,541 50,541 3,161,500 0.20 84,246 14,106,889 Not applicable A subsidiary of the
Corporation U-Ming Taiwan Marine transportation 38,931 38,931 3,485,997 0.41 35,455 1,621,695 Not applicable CSCGL Cayman Investment 266,942 266,942 8,368,000 0.19 132,075 13,578,105 Not applicable YLPPC YDEC Taiwan Retail 20,776 20,776 4,411,559 3.89 84,414 117,812 Not applicable PYCI Indonesia Ready-mixed concrete 1,448 621 (Note 1) 1.00 693 (72,481)
Not applicable A subsidiary of the
Corporation YLPCIP India Tunnel lining segments 8,338 8,338 (Note 1) 99.99 1,915 (219)
Not applicable A subsidiary of the
Corporation AOG Guam Investment 66,816 66,816 (Note 1) 4.96 3,403 (43,552)
Not applicable A subsidiary of the
Corporation AIC FENC Taiwan Textile 405,473 405,473 15,430,293 0.29 649,483 10,732,669 Not applicable U-Ming Taiwan Marine transportation 77,446 77,446 7,796,914 0.92 72,456 1,621,695 Not applicable CHP Taiwan Power plant 376 376 37,574 0.01 850 1,097,061 Not applicable A subsidiary of the
Corporation Asia Cement Pioneer Investment Ltd. B.V.I. Investment 2,100,779 2,039,879 68,550,000 100.00 2,064,326 306,888 Not applicable A subsidiary of the
Corporation Asia Cement Pioneer II Investment Ltd. B.V.I. Investment 833,410 544,135 28,000,000 100.00 891,935 101,257 Not applicable A subsidiary of the
Corporation Asia Cement Pioneer III Investment Ltd. B.V.I. Investment 578,325 289,050 19,500,000 100.00 542,204 36,662 Not applicable A subsidiary of the
Corporation Asia Cement Pioneer IV Investment Ltd. B.V.I. Investment 575,538 286,263 19,010,000 100.00 588,459 48,009 Not applicable A subsidiary of the
Corporation Asia Cement Explorer Investment Ltd. B.V.I. Investment 623,340 334,065 20,915,000 100.00 442,420 14,774 Not applicable A subsidiary of the
Corporation DCI Taiwan Investment 76 76 5,401 - 76 1,262,905 Not applicable A subsidiary of the
Corporation
(Continued)

- 91 -
Investor Company Investee Company Location Main Businesses and Products Investment Amount Balance as of December 31, 2019 Net Income (Loss)
of the Investee Share of Profits
(Loss) Note December 31, 2019 December 31, 2018 Shares Percentage of Ownership Carrying Value
FMT Taiwan Transportation $ 176 $ 176 5,000 0.02 $ 272 $ 213,189 Not applicable A subsidiary of the
Corporation NHC Taiwan Cement, granulated blast-furnace slag 78 78 5,000 0.02 80 52,531 Not applicable A subsidiary of the
Corporation Taiwan AEE Taiwan Engineering 116 116 6,000 0.07 120 59,946 Not applicable A subsidiary of the
Corporation FSMS Taiwan Mining excavation, mineral
processing and sales 119 119 5,000 0.38 125 (6,936) Not applicable A subsidiary of the
Corporation FDT Taiwan Transportation 110 110 7,145 0.03 199 109,850 Not applicable A subsidiary of the
Corporation YSRMC Taiwan Ready-mixed concrete 37 37 5,000 0.05 44 27,530 Not applicable A subsidiary of the
Corporation EISF Taiwan Iron and steel 15,649 15,649 660,000 8.33 16,630 14,020 Not applicable YTRMC Taiwan Ready-mixed concrete, cement -
related products 53 53 5,782 - 53 146,801 Not applicable A subsidiary of the
Corporation CSCGL Cayman Investment 556,895 556,895 31,528,000 0.72 498,144 13,578,105 Not applicable YLT U-Ming Taiwan Marine transportation 58,840 58,840 6,348,103 0.75 308,774 1,621,695 Not applicable ACE CSCGL Cayman Investment 266,882 266,882 7,480,000 0.17 118,080 13,578,105 Not applicable Opas Fund Segregated Portfolio
Company Cayman Investment 1,531 1,531 33 33.00 1,607 113 Not applicable
Drive Catalyst SPC Cayman Investment 494 494 33 33.00 488 20 Not applicable ACP CSCGL Cayman Investment 1,959,250 1,959,250 107,536,000 2.47 1,700,893 13,578,105 Not applicable ACP II CSCGL Cayman Investment 544,689 544,689 36,865,000 0.85 583,507 13,578,105 Not applicable ACP III CSCGL Cayman Investment 290,967 290,967 14,790,000 0.34 233,970 13,578,105 Not applicable ACP IV CSCGL Cayman Investment 292,032 292,032 18,514,000 0.43 293,443 13,578,105 Not applicable Leap CSCGL Cayman Investment 567,556 567,556 35,569,000 0.82 562,979 13,578,105 Not applicable Mega CSCGL Cayman Investment 554,533 554,533 30,251,000 0.70 479,139 13,578,105 Not applicable Mega II CSCGL Cayman Investment 293,393 293,393 16,058,000 0.37 254,137 13,578,105 Not applicable Mega III CSCGL Cayman Investment 292,743 292,743 18,477,000 0.42 291,688 13,578,105 Not applicable Mega IV CSCGL Cayman Investment 504,078 504,078 37,410,000 0.86 591,806 13,578,105 Not applicable KCC KCCL Hong Kong Ready-mixed concrete 38
38
10,000 100.00 138,589
13,198
Not applicable A subsidiary of the Corporation
Join Fortune Trading Ltd. B.V.I. Investment 88,372
88,372
2,979,721 100.00 18,957
584
Not applicable A subsidiary of the Corporation
JFTL Empire Success Corp Ltd. Hong Kong Storage and transportation 65,076
65,076
17,040,000 50.00 16,508
(559)
Not applicable
Profit Enterprises Int'l Ltd. Hong Kong Barge transportation 23,296 23,296 6,100,000 50.00 3,289 1,253 Not applicable AOG Asia Oriental Concrete, LLC Guam Ready-mixed concrete 237,944 178,084 (Note 1) 71.70 22,269 (66,247) Not applicable A subsidiary of the
Corporation Perez-Mtec-ACC, L.L.C. Guam Ready-mixed concrete 8,979 8,979 (Note 1) 33.33 42 - Not applicable
(Continued)

- 92 -
Investor Company Investee Company Location Main Businesses and Products Investment Amount Balance as of December 31, 2019 Net Income (Loss)
of the Investee Share of Profits
(Loss) Note December 31, 2019 December 31, 2018 Shares Percentage of Ownership Carrying Value
ACSPL OCPL Singapore Ready-mixed concrete, leasing $ 377,230 $ 377,230 17,000,000 100.00 $ 260,244 $ 3,400 Not applicable A subsidiary of the
Corporation ACCHC Cayman Investment 598,600 598,600 63,790,798 4.07 2,488,498 14,106,889 Not applicable A subsidiary of the
Corporation Alliance Concrete Singapore Pte. Ltd. Singapore Ready-mixed concrete 155,330 155,330 6,000,000 50.00 206,833 204,204 Not applicable ACCHC PIHPL B.V.I. Investment 26,356,747 26,356,747 9,379,303 100.00 74,365,545 15,638,825 Not applicable A subsidiary of the
Corporation Note 1: This is not a company limited by shares.
(Concluded)

- 93 -
TABLE 8 ASIA CEMENT CORPORATION INVESTMENT IN MAINLAND CHINA YEAR ENDED DECEMBER 31, 2019 (In Thousands of New Taiwan Dollars, Unless Stated Otherwise)
Investee Company Main Businesses and Products Paid-in Capital Method of Investment
(Note 2)
Accumulated Outward Remittance for
Investment from Taiwan as of
January 1, 2019
Remittance of Funds Accumulated Outward Remittance for
Investment from Taiwan as of
December 31, 2019
Net Income (Loss) of the Investee
% Ownership of Direct or
Indirect Investment
Investment Gain (Loss) (Note 1)
Carrying Amount as of December 31, 2019
Accumulated Repatriation of
Investment Income as of December 31, 2019
Outward Inward
SHYLCP It manufactures and sells ready-mixed
concrete and cement - related products US$15,000 (equivalent
to NT$448,950 thousand)
(2) US$11,200 (equivalent to NT$335,216 thousand)
$ - $ - US$11,200 (equivalent to NT$335,216 thousand)
RMB14,271 (equivalent to NT$63,986 thousand)
72.00 RMB10,275 (equivalent to NT$46,070 thousand)
RMB10,405 (equivalent to NT$44,643 thousand)
US$800 (equivalent to NT$23,944 thousand)
JYDC It manufactures and sells cement, clinker
and ready-mixed concrete (including cement - related products).
US$356,104 (equivalent to NT$10,658,193 thousand)
(2) US$93,035 (equivalent to NT$2,784,538 thousand)
RMB(126,758) (equivalent to NT$(543,832) thousand)
- RMB(380,367) (equivalent to NT$(1,631,895) thousand)
US$93,035 (equivalent to NT$2,784,538 thousand)
RMB(507,125) (equivalent to NT$(2,175,727) thousand)
RMB1,488,812 (equivalent to NT$6,675,264 thousand)
68.40 RMB1,018,348 (equivalent to NT$4,565,881 thousand)
RMB4,112,215 (equivalent to NT$17,642,702 thousand)
US$50,781 (equivalent to NT$1,519,875 thousand)
RMB507,125 (equivalent to NT$2,175,727 thousand)
WYDC It manufactures and sells cement, slag
powder and slag cement. US$36,140 (equivalent
to NT$1,081,670 thousand)
(2) US$22,081 (equivalent to NT$660,884 thousand)
RMB(3,533) (equivalent to NT$(15,158) thousand)
- - US$22,081 (equivalent to NT$660,884 thousand)
RMB(3,533) (equivalent to NT$(15,158) thousand)
RMB29,023 (equivalent to NT$130,126 thousand)
72.00 RMB20,896 (equivalent to NT$93,691 thousand)
RMB438,541 (equivalent to NT$1,881,481 thousand)
US$4,469 (equivalent to NT$133,757 thousand)
RMB3,533 (equivalent to NT$15,158 thousand)
SHYFCP It manufactures and sells ready-mixed
concrete and cement - related products - - US$1,270 (equivalent to
NT$38,011 thousand) - - US$1,270 (equivalent to
NT$38,011 thousand) - - - - -
OHC Investment US$130,407 (equivalent
to NT$3,903,082 thousand)
(2) US$54,191 (equivalent to NT$1,621,937 thousand)
- - US$54,191 (equivalent to NT$1,621,937 thousand)
RMB386,044 (equivalent to NT$1,730,872 thousand)
72.00 RMB277,951 (equivalent to NT$1,246,228 thousand)
RMB2,077,855 (equivalent to NT$8,914,653 thousand)
US$809 (equivalent to NT$24,213 thousand)
NYLC It manufactures and sells ready-mixed
concrete and cement - related products RMB60,000 (equivalent
to NT$257,419 thousand)
(2) - - - - RMB(6,553) (equivalent to NT$(29,379) thousand)
68.40 RMB(4,482) (equivalent to NT$(20,096) thousand)
RMB112,989 (equivalent to NT$484,760 thousand)
-
NYDC It manufactures and sells cement, slag
powder and slag cement. RMB90,000 (equivalent
to NT$386,128 thousand)
(2) - - - - RMB15,586 (equivalent to NT$69,883 thousand)
52.20 RMB8,136 (equivalent to NT$36,479 thousand)
RMB88,543 (equivalent to NT$379,876 thousand)
-
SIYDCCL Cement, clinker, slag powder and
ready-mixed concrete (including cement - related products)
US$368,340 (equivalent to NT$11,024,416 thousand)
(2) US$67,585 (equivalent to NT$2,022,819 thousand)
RMB(4,091) (equivalent to NT$(17,552) thousand)
- RMB(136,094) (equivalent to NT$(583,886) thousand)
US$67,585 (equivalent to NT$2,022,819 thousand)
RMB(140,185) (equivalent to NT$(601,438) thousand)
RMB1,264,886 (equivalent to NT$5,671,266 thousand)
72.00 RMB910,718 (equivalent to NT$4,083,312 thousand)
RMB3,773,937 (equivalent to NT$16,191,384 thousand)
US$27,009 (equivalent to NT$808,379 thousand)
RMB140,185 (equivalent to NT$601,438 thousand)
CYCPCL It manufactures and sells ready-mixed
concrete and cement - related products US$4,100 (equivalent to
NT$122,713 thousand)
(2) US$2,023 (equivalent to NT$60,548 thousand)
- - US$2,023 (equivalent to NT$60,548 thousand)
RMB14,136 (equivalent to NT$63,381 thousand)
72.00 RMB10,178 (equivalent to NT$45,634 thousand)
RMB59,238 (equivalent to NT$254,151 thousand)
US$77 (equivalent to NT$2,305 thousand)
JYLTC Transportation RMB12,500 (equivalent
to NT$53,629 thousand)
(2) - - - - RMB6,397 (equivalent to NT$28,680 thousand)
70.12 RMB4,485 (equivalent to NT$20,111 thousand)
RMB25,780 (equivalent to NT$110,602 thousand)
-
(Continued)

- 94 -
Investee Company Main Businesses and Products Paid-in Capital Method of Investment
(Note 2)
Accumulated Outward Remittance for
Investment from Taiwan as of
January 1, 2019
Remittance of Funds Accumulated Outward Remittance for
Investment from Taiwan as of
December 31, 2019
Net Income (Loss) of the Investee
% Ownership of Direct or
Indirect Investment
Investment Gain (Loss) (Note 1)
Carrying Amount as of December 31, 2019
Accumulated Repatriation of
Investment Income as of December 31, 2019
Outward Inward
HYDCCL Cement, clinker, slag powder and
ready-mixed concrete (including cement - related products)
US$154,800 (equivalent to NT$4,633,164 thousand)
(2) US$44,610 (equivalent to NT$1,335,177 thousand)
RMB(36,155) (equivalent to NT$(155,116) thousand)
$ - RMB(87,753) (equivalent to NT$(376,488) thousand)
US$44,610 (equivalent to NT$1,335,177 thousand)
RMB(123,908) (equivalent to NT$(531,604) thousand)
RMB430,511 (equivalent to NT$1,930,247 thousand)
72.00 RMB309,968 (equivalent to NT$1,389,778 thousand)
RMB1,884,938 (equivalent to NT$8,086,981 thousand)
US$12,990 (equivalent to NT$388,791 thousand)
RMB123,908 (equivalent to NT$531,604 thousand)
CYSPC Slag powder - - US$980 (equivalent to
NT$29,331 thousand) - - US$980 (equivalent to
NT$29,331 thousand) - - - - -
SYCPCL It manufactures and sells ready-mixed
concrete and cement - related products US$3,300 (equivalent to
NT$98,769 thousand) (2) US$2,970 (equivalent to
NT$88,892 thousand) - - US$2,970 (equivalent to
NT$88,892 thousand) RMB17,747 (equivalent
to NT$79,571 thousand)
72.00 RMB12,778 (equivalent to
NT$57,291 thousand)
RMB38,641 (equivalent to NT$165,782 thousand)
-
SYTCL Transportation US$3,500 (equivalent to
NT$104,755 thousand)
(2) US$2,158 (equivalent to NT$64,589 thousand)
- - US$2,158 (equivalent to NT$64,589 thousand)
RMB4,087 (equivalent to NT$18,323 thousand)
72.00 RMB2,942 (equivalent to NT$13,193 thousand)
RMB31,255 (equivalent to NT$134,095 thousand)
US$992 (equivalent to NT$29,691 thousand)
YYDCCL Cement, slag powder and ready-mixed
concrete (including cement - related products)
US$35,530 (equivalent to NT$1,063,413 thousand)
(2) US$14,833 (equivalent to NT$443,952 thousand)
- - US$14,833 (equivalent to NT$443,952 thousand)
RMB50,419 (equivalent to NT$226,061 thousand)
72.00 RMB36,302 (equivalent to NT$162,764 thousand)
RMB300,302 (equivalent to NT$1,288,390 thousand)
US$1,016 (equivalent to NT$30,409 thousand)
HGYDC Cement, clinker, slag powder and
ready-mixed concrete (including cement - related products)
US$86,170 (equivalent to NT$2,579,068 thousand)
(2) US$13,513 (equivalent to NT$404,444 thousand)
RMB(24,078) (equivalent to NT$(103,302) thousand)
- RMB(67,959) (equivalent to NT$(291,566) thousand)
US$13,513 (equivalent to NT$404,444 thousand)
RMB(92,037) (equivalent to NT$(394,868) thousand)
RMB265,762 (equivalent to NT$1,191,577 thousand)
72.00 RMB191,349 (equivalent to NT$857,936 thousand)
RMB915,154 (equivalent to NT$3,926,300 thousand)
US$1,837 (equivalent to NT$54,981 thousand)
RMB92,037 (equivalent to NT$394,868 thousand)
HYTCL Transportation RMB13,000 (equivalent
to NT$55,774 thousand)
(2) - - - - RMB112 (equivalent to NT$501 thousand)
72.00 RMB80 (equivalent to NT$360 thousand)
RMB13,316 (equivalent to NT$57,130 thousand)
-
WYCPCL It manufactures and sells ready-mixed
concrete and cement - related products RMB60,000 (equivalent
to NT$257,419 thousand)
(2) - - - - RMB23,129 (equivalent to NT$103,702 thousand)
72.00 RMB16,653 (equivalent to NT$74,665 thousand)
RMB65,039 (equivalent to NT$279,036 thousand)
-
WYXC Cement, clinker, slag powder and
ready-mixed concrete (including cement - related products)
RMB90,000 (equivalent to NT$386,128 thousand)
(2) - - - - RMB45,088 (equivalent to NT$202,157 thousand)
64.79 RMB28,758 (equivalent to NT$128,941 thousand)
RMB256,172 (equivalent to NT$1,099,058 thousand)
-
HZYCCL It manufactures and sells ready-mixed
concrete and cement - related products RMB30,000 (equivalent
to NT$128,709 thousand)
(2) - - - - RMB6,787 (equivalent to NT$30,430 thousand)
28.80 RMB1,955 (equivalent to NT$8,764 thousand)
RMB13,305 (equivalent to NT$57,084 thousand)
-
HXMC Production and sales of limestone RMB10,000 (equivalent
to NT$42,903 thousand)
(2) - - - - RMB10,800 (equivalent to NT$48,425 thousand)
28.80 RMB2,948 (equivalent to NT$13,217 thousand)
RMB6,819 (equivalent to NT$29,255 thousand)
-
WAMTC Marine transportation RMB35,500 (equivalent
to NT$152,306 thousand)
(2) - - - - RMB10,804 (equivalent to NT$48,439 thousand)
34.20 RMB3,751 (equivalent to NT$16,820 thousand)
RMB32,162 (equivalent to NT$137,985 thousand)
-
TZOCCL Cement - related products US$16,000 (equivalent
to NT$478,880 thousand)
(2) - - - - RMB13,131 (equivalent to NT$58,875 thousand)
72.00 RMB8,982 (equivalent to NT$40,271 thousand)
RMB60,949 (equivalent to NT$261,493 thousand)
-
(Continued)

- 95 -
Investee Company Main Businesses and Products Paid-in Capital Method of Investment
(Note 2)
Accumulated Outward Remittance for
Investment from Taiwan as of
January 1, 2019
Remittance of Funds Accumulated Outward Remittance for
Investment from Taiwan as of
December 31, 2019
Net Income (Loss) of the Investee
% Ownership of Direct or
Indirect Investment
Investment Gain (Loss) (Note 1)
Carrying Amount as of December 31, 2019
Accumulated Repatriation of
Investment Income as of December 31, 2019
Outward Inward
SLCL Cement, clinker, slag powder and
ready-mixed concrete (including cement - related products)
RMB600,000 (equivalent to NT$2,574,190 thousand)
(2) $ - $ - $ - $ - RMB568,864 (equivalent to NT$2,550,570 thousand)
72.00 RMB407,522 (equivalent to NT$1,827,173 thousand)
RMB1,512,948 (equivalent to NT$6,491,023 thousand)
$ -
SLCCL Cement - related products RMB20,000 (equivalent
to NT$85,806 thousand)
(2) - - - - RMB(503) (equivalent to NT$((2,254) thousand)
72.00 RMB(362) (equivalent to NT$(1,623) thousand)
RMB(15,014) (equivalent to NT$(64,413) thousand)
-
YDES Wholesale of chemical products and
machinery equipment, design and development of computer software and network technology
RMB1,763,425 (equivalent to NT$7,565,650 thousand)
(2) - - - - RMB(22,262) (equivalent to NT$(99,813) thousand)
28.80 RMB(5,434) (equivalent to NT$(24,364) thousand)
RMB508,783 (equivalent to NT$2,182,839 thousand)
-
RYNM Building materials, products and
construction waste RMB2,000 (equivalent to
NT$8,581 thousand) (2) - - - - RMB47,672 (equivalent
to NT$213,741 thousand)
68.40 RMB32,607 (equivalent to NT$146,199 thousand)
RMB33,975 (equivalent to NT$145,765 thousand)
-
Accumulated Outward Remittance for Investment in Mainland China as of December 31, 2019
Investment Amounts Authorized by Investment Commission, MOEA
Upper Limit on the Amount of Investment Stipulated by Investment Commission, MOEA
US$481,069 (Note 3)
(equivalent to NT$14,398,395 thousand) US$2,284,279 (equivalent to NT$68,368,470 thousand) (Note 4) RMB(866,788)
(equivalent to NT$(3,718,794) thousand)
Note 1: The accrual is based on the financial statements audited by independent auditors. Note 2: The investor companies were incorporated in Mainland China by a company (2) (ACCHC) which was incorporated in the area other than Taiwan and Mainland China in order to invest in Mainland China. Note 3: As of December 31, 2019 accumulated investment in China Shanshui Cement Group Ltd which listed at HKEx for managing finance purpose was US$150,620 thousand included in Accumulated Outward Remittance for Investment in Mainland China. Note 4: The Corporation obtained certificate No. 10620435220 from Industrial Development Bureau, Ministry of Economic Affairs, according to the “Regulations Governing the Approval of Investment or Technical Cooperation in Mainland China”, the accumulation of fund is not limited. Note 5: The foreign currency amounts of original investment amount and carrying value are expressed in New Taiwan dollars at exchange rate as of December 31, 2019 the foreign currency amount of net income is expressed in New Taiwan dollars at average exchange rate for the year ended December 31, 2019.
(Concluded)