Embed Size (px)
Citation preview

Asia Economic Outlookand Implications for Cambodia
Presentation at the Royal School of Administration
Olaf UnteroberdoersterIMF Mission Chief for Cambodia
Phnom PenhMay 2, 2013

2
Outline and Summary
Global Setting
Financial Imbalances:New Challenges for Emerging Asia and Cambodia
Tail risks are receding, but still considerable
•Activity indicators stabilizing•Robust domestic demand•Strengthening external demand•Inflation remains low
•Improved financial conditions •Stronger capital inflows•Financial imbalances building
Asia Outlook
Common policy challenges:•Need for rebuilding space•Scope for macroprudential measures

3
Global tail risks are receding…
Global Setting
Selected Europe: Sovereign CDS Spreads (CDS Spreads in basis points, 5-year senior
debt)
Advanced Economies: Stock Market Performance
(Index; December 31, 2010 =100)
Jan-1
2
Feb-1
2
Mar-
12
Apr-
12
May-1
2
Jun-1
2
Jul-
12
Aug-1
2
Sep-1
2
Oct
-12
Nov-1
2
Dec-
12
Jan-1
3
Feb-1
3
Mar-
13
Apr-
13
0
100
200
300
400
500
600
700
800
900
0
200
400
600
800
1000
1200
1400
1600
1800
Italy France
Spain Ireland (RHS)
Portugal (RHS)
Jan-1
2
Feb-1
2
Mar-
12
Apr-
12
May-
12
Jun-1
2
Jul-
12
Aug-1
2
Sep-1
2
Oct
-12
Nov-
12
Dec-
12
Jan-1
3
Feb-1
3
Mar-
13
Apr-
13
70
80
90
100
110
120
5
15
25
35
US: S&P 500UK: Financial Times All SharesEuro Area: STOXX Broad Price IndexVIX (actual level, RHS)
4
…but growth in G2 set to remain sluggish
Global Setting
Advanced Economies: Manufacturing PMI(Seasonally adjusted; 50=neutral)
Advanced Economies: Consumer Confidence Index
(Standardized using historical average) 1
Jun-0
8S
ep-0
8D
ec-
08
Mar-
09
Jun-0
9S
ep-0
9D
ec-
09
Mar-
10
Jun-1
0S
ep-1
0D
ec-
10
Mar-
11
Jun-1
1S
ep-1
1D
ec-
11
Mar-
12
Jun-1
2S
ep-1
2D
ec-
12
Mar-
13
30
35
40
45
50
55
60
United States Euro area
Jan-0
8
May-0
8
Sep-0
8
Jan-0
9
May-0
9
Sep-0
9
Jan-1
0
May-1
0
Sep-1
0
Jan-1
1
May-1
1
Sep-1
1
Jan-1
2
May-1
2
Sep-1
2
Jan-1
3
-3.0
-2.5
-2.0
-1.5
-1.0
-0.5
0.0
0.5
1.0
United States Euro areaUnited Kingdom
1 Historical average defined from 2000 to 2010.Data as of April (US), March (UK, Euro area)
Apr-
13
5
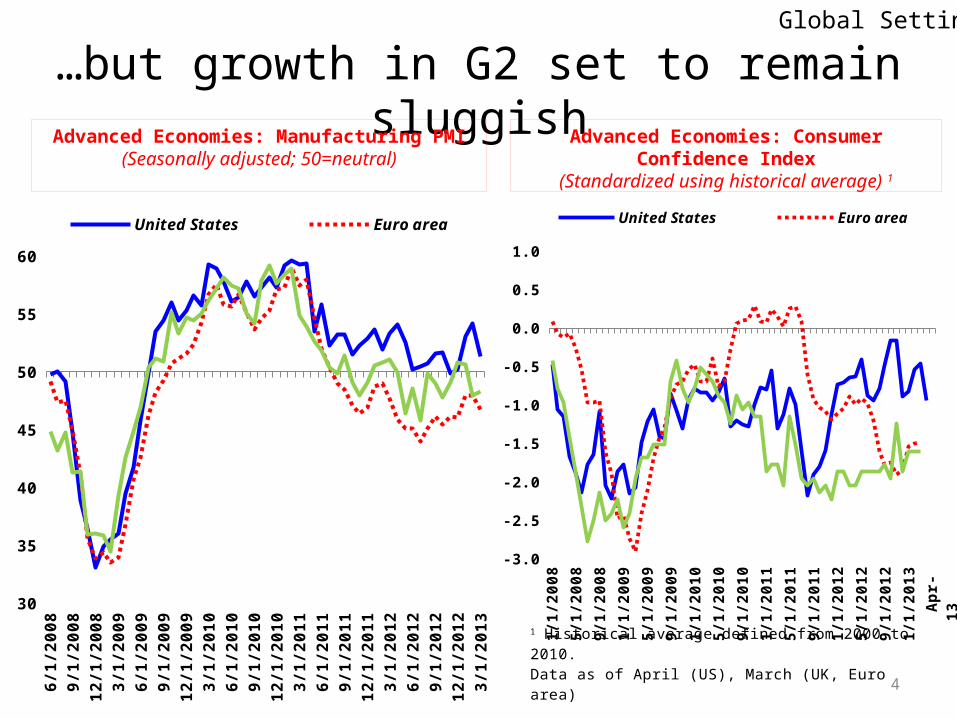
Growth in Asia slowed through 2012, and inflation moderated
Asia Outlook
Asia: Changes in Real GDP at Market Prices(In percent)
Asia: Headline Inflation1
(Year-on-year percent change)
Japan
New
Zeala
nd
Mala
ysia
Kore
a
Austr
alia
Chin
a
Cam
bodia
Philip
pin
es
Thailand
Hong K
ong S
AR
Indonesia
Sin
gapore
India
Vie
tnam
(R
HS
)
-2
0
2
4
6
8
10
12
-4
0
4
8
12
16
20
24End-2011 End-2012
Taiw
an P
rov
-in
ce o
f C
hin
a
2011:Q
32011:Q
42012:Q
12012:Q
22012:Q
32012:Q
4
2011:Q
32011:Q
42012:Q
12012:Q
22012:Q
32012:Q
4
2011:Q
32011:Q
42012:Q
12012:Q
22012:Q
32012:Q
4
2011:Q
32011:Q
42012:Q
12012:Q
22012:Q
32012:Q
42013:Q
1
2011:Q
32011:Q
42012:Q
12012:Q
22012:Q
32012:Q
4
Australia, Japan &
New Zea-land
East Asia (excl. China)
ASEAN China India
-3
0
3
6
9
12
15
Quarter over quarter (SAAR) Year over year
1 ASEAN includes Indonesia, Malaysia, the Philippines, Singapore, Thailand, and Vietnam.2 India's GDP is at factor cost
1 2

6
Near-term outlook: gradual growth pickupAsia Outlook
Indicator Model for Asia: Projected vs. Actual Real GDP Growth
(In percent; q/q SAAR)
Real GDP Growth in 2013(WEO forecast; In percent)
0.000 to 3.0003.000 to 5.0005.000 to 8.0008.000 to 40.000No data
1 3 5 7 9
11
13
15
17
19
21
23
25
27
29
31
33
-6
-3
0
3
6
9
12
15
confidencerval
WEO forecast
Actual growth rate (PPP weighted)
Model forecast
2013:
Q2

7
…underpinned by robust domestic demandAsia Outlook
Asia: Contributions to Projected Growth(In percentage points; year over year)
2012 2013 2012 2013 2012 2013 2012 2013 2012 2013Australia, Japan & New Zealand
China East Asia(excl. China)
India ASEAN
-2
0
2
4
6
8
10
12
Net exports Public domestic demand Private domestic demand Growth
1 ASEAN includes Indonesia, Malaysia, the Philippines, Singapore, Thailand, and Vietnam
1

8
1990
1992
1994
1996
1998
2000
2002
2004
2006
2008
201010
12
14
16
18
20
22
24
26
28
Capital goodsConsumption goodsIntermediate goods
ASEAN Intraregional Exports by Category
(In percent of total exports in each category)
Internal demand dynamics are becoming more favorable
15 25 35 45 55 65 750.3
0.4
0.5
0.6
0.7
0.8
0.9
1.0
1.1
1.2
0.884498506326379
0.62703801838355
0.775451110556515
0.442055725100394
0.707132910596549
1.01479075045515
0.89686428023659
Dem
and f
rom
Japan a
nd C
hin
a r
ela
tive
to d
em
and f
rom
U.S
. and E
U
Total export value added in percent of GDP
Greater openness and reliance on China
and Japan
Selected Asia: External Dependence(Value-added basis; average 2005-10)
9
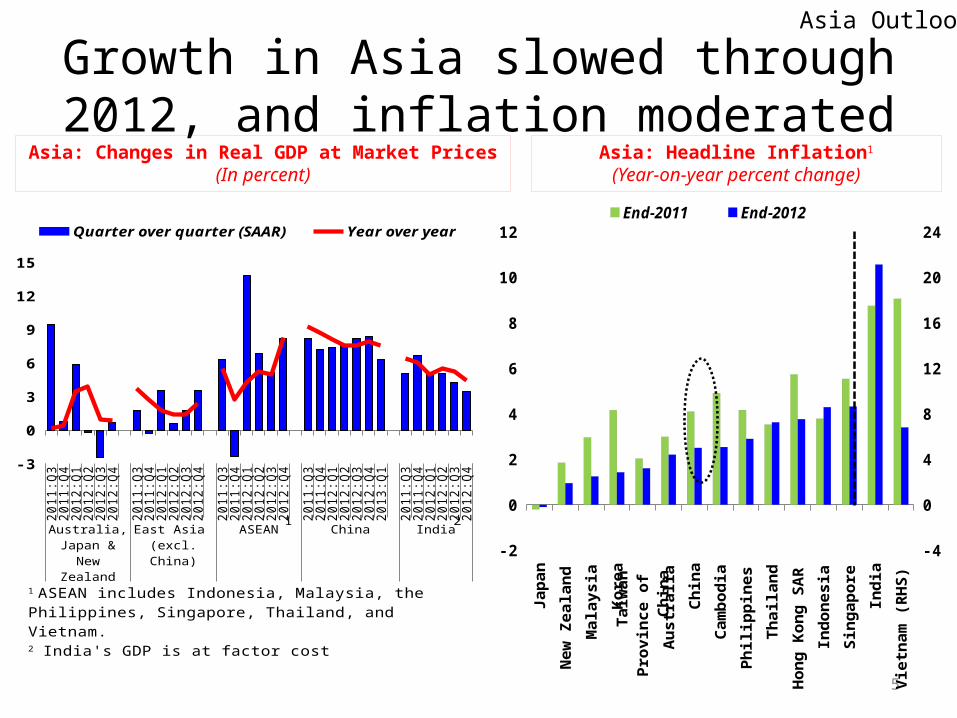
Inflation should remain within central banks’ explicit/implicit targets
Asia Outlook
Asia: Headline Consumer Price Inflation1
(In percent; year over year)
New
Zeala
nd
Thailand
Kore
a
Mala
ysia
Cam
bodia
Austr
alia
Philip
pin
es
Chin
a
Hong K
ong S
AR
Sin
gapore
Indonesia
Vie
tnam
India
Japan (
RH
S)
-4
0
4
8
12
-1
0
1
2
3
Latest 2014 forecast 2013 forecast Target
1 Target refers to mid-point of headline inflation target band (Australia, Korea, New Zealand, Indonesia, Japan and Philippines). Core inflation and core inflation target band mid-point (Thailand). For India WPI is used. Japan 2014 projection includes effects of consumption tax increase.
Taiw
an P
rov-
ince
of
Chin
a

10
Global risks have become more balanced, but considerable downside risks remain.
Risks
Asia: Real GDP Growth (Central forecast and selected confidence intervals; in percent)
2009 2010 2011 2012 2013 20140
1
2
3
4
5
6
7
8
9
Series550 percent confidence interval 70 percent confidence interval90 percent confidence interval (2012)
Central forecast

11
Financial stability risks amid renewed capital inflows and robust credit growth?
Risks
Emerging Asia: Equity and Bond Funds—Weekly Net Flows during 2010‒13 1
(In billions of U.S. dollars)
Asia: Change in Credit to GDP, 20121
(In percentage points)
2010:Q
1
2010:Q
2
2010:Q
3
2010:Q
4
2011:Q
1
2011:Q
2
2011:Q
3
2011:Q
4
2012:Q
1
2012:Q
2
2012:Q
3
2012:Q
4
2013:Q
1
-20000
-15000
-10000
-5000
0
5000
10000
15000
20000
25000
30000
Bond funds Equity fundsPeak in 2006-2007
1 Includes exchange traded fund flows and mutual fund flows for Emerging Asia, Singapore, Hong Kong SAR, Tai-wan Province of China, and Korea.
Vie
tnam
Kore
a
Japan
Austr
alia
India
New
Zeala
nd
Indonesia
Philip
pin
es
Hong K
ong S
AR
Mala
ysia
Chin
a
Thailand
Cam
bodia
Sin
gapore
Euro
are
a
Lati
n A
meri
ca
Unit
ed S
tate
s
-30
-20
-10
0
10
20
30
Change from 2011 Deviation from trend
1 Latest available in 2012. Trend calculated using HP filter over the period 2001‒11.
Taiw
an
Pro
v-
ince
of
Ch
ina
12
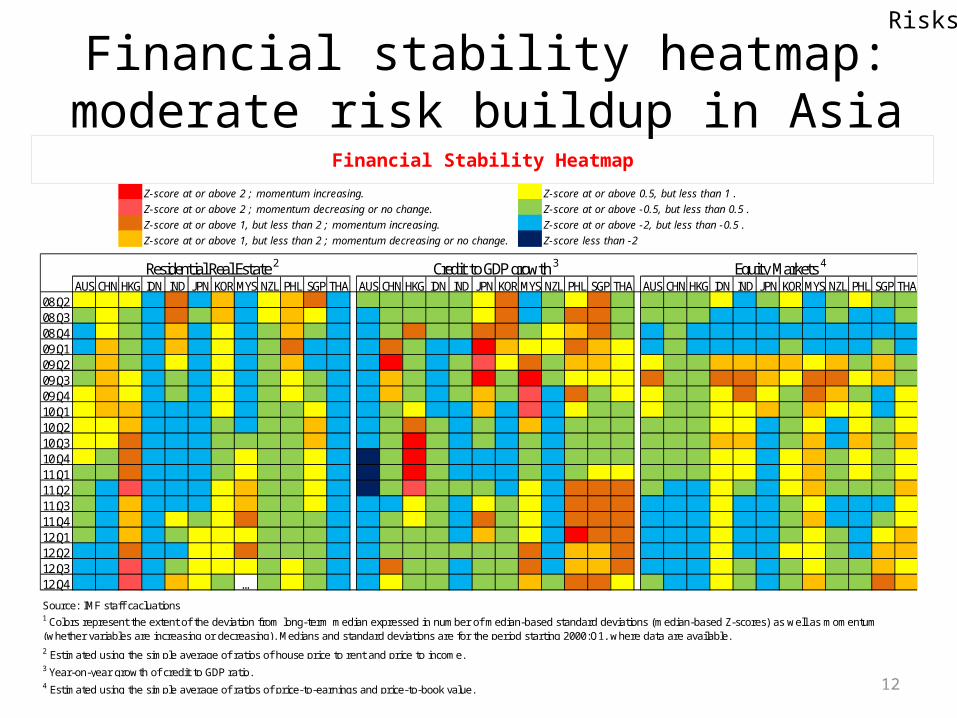
Financial stability heatmap:moderate risk buildup in Asia
Risks
Financial Stability Heatmap
Z-score at or above 2 ; momentum increasing. Z-score at or above 0.5, but less than 1 .
Z-score at or above 2 ; momentum decreasing or no change. Z-score at or above -0.5, but less than 0.5 .
Z-score at or above 1, but less than 2 ; momentum increasing. Z-score at or above -2, but less than -0.5 .
Z-score at or above 1, but less than 2 ; momentum decreasing or no change. Z-score less than -2
AUS CHNHKG IDN IND JPN KORMYS NZL PHL SGP THA AUS CHNHKG IDN IND JPN KORMYS NZL PHL SGP THA AUS CHNHKG IDN IND JPN KORMYS NZL PHL SGP THA08:Q2 1 1 1 -1 3 -1 2 -1 1 2 3 -1 0 0 0 0 0 1 3 -1 0 1 3 0 0 0 0 1 -1 0 1 -1 0 1 0 008:Q3 0 1 0 -1 3 0 2 -1 1 2 1 -1 -1 0 0 0 0 1 3 -1 0 3 3 0 0 0 0 -1 -1 -1 0 -1 0 -1 -1 008:Q4 -1 1 0 -1 2 -1 1 -1 0 2 0 -1 -1 0 3 0 0 3 3 0 1 2 3 0 -1 0 -1 -1 -1 -1 -1 -1 -1 -1 -1 -109:Q1 -1 2 0 -1 2 -1 1 -1 0 3 -1 -1 -1 3 0 -1 -1 5 2 1 1 3 2 1 -1 0 -1 -1 -1 -1 0 -1 -1 -1 0 -109:Q2 0 2 0 -1 1 -1 1 -1 0 2 -1 -1 -1 5 0 -1 0 4 1 3 0 2 2 1 1 0 0 2 2 2 2 1 2 0 2 009:Q3 0 2 1 -1 0 -1 1 -1 0 1 0 -1 -1 2 0 -1 0 5 0 5 0 1 1 1 3 0 0 3 3 2 1 3 3 1 2 009:Q4 1 2 1 -1 0 -1 1 -1 0 1 0 -1 -1 2 0 -1 0 2 0 4 -1 3 0 1 1 0 0 1 3 1 0 3 2 0 -1 110:Q1 1 2 2 -1 -1 -1 1 -1 0 0 1 -1 -1 0 1 -1 -1 2 -1 4 -1 1 0 0 1 0 0 1 1 2 0 2 1 1 -1 110:Q2 1 1 2 -1 -1 -1 0 -1 0 0 2 -1 -1 0 3 0 -1 0 -1 2 -1 0 0 0 0 0 0 1 1 -1 0 1 -1 1 0 110:Q3 1 1 3 -1 -1 -1 0 0 0 0 2 -1 -1 0 5 0 -1 0 -1 0 -1 0 0 0 0 0 0 2 2 -1 0 2 -1 2 0 210:Q4 1 0 3 -1 -1 -1 0 1 0 0 1 -1 -2 0 5 0 -1 -1 -1 0 -1 0 0 0 0 0 0 1 1 -1 1 2 0 1 0 111:Q1 0 0 3 -1 -1 -1 0 1 0 0 1 -1 -2 0 5 0 -1 -1 -1 0 -1 0 1 1 0 0 0 1 1 -1 1 2 0 1 0 111:Q2 0 -1 4 -1 -1 -1 1 2 0 0 1 -1 -2 0 4 0 0 0 -1 1 -1 3 3 3 0 -1 -1 1 0 -1 1 2 0 0 0 211:Q3 0 -1 2 -1 -1 -1 1 2 0 0 1 -1 -1 -1 1 0 -1 1 0 1 -1 3 3 3 -1 -1 -1 1 -1 -1 0 1 -1 -1 -1 111:Q4 0 -1 2 -1 1 0 1 3 0 0 0 -1 -1 0 1 0 -1 3 0 1 -1 3 3 3 -1 -1 -1 1 -1 -1 0 2 -1 -1 0 112:Q1 0 -1 2 -1 0 1 1 1 0 0 0 -1 -1 0 0 0 -1 2 0 1 -1 5 3 3 -1 -1 -1 1 -1 -1 0 1 0 -1 1 212:Q2 -1 -1 3 -1 -1 1 1 3 0 0 0 -1 -1 0 0 0 0 0 0 3 -1 2 2 3 -1 -1 -1 1 -1 -1 1 1 0 -1 2 212:Q3 -1 -1 4 -1 0 1 1 1 0 1 0 -1 -1 3 0 0 -1 0 0 3 -1 2 2 3 -1 -1 -1 1 0 -1 0 1 0 0 2 112:Q4 -1 -1 4 -1 2 1 0 … 0 1 0 -1 -1 1 0 0 -1 0 0 2 0 3 3 1 0 -1 -1 1 0 -1 0 2 0 0 3 2
Source: IMF staff cacluations
2 Estimated using the simple average of ratios of house price to rent and price to income.3 Year-on-year growth of credit to GDP ratio. 4 Estimated using the simple average of ratios of price-to-earnings and price-to-book value.
Residential Real Estate 2 Credit to GDP growth 3 Equity Markets 4
1 Colors represent the extent of the deviation from long-term median expressed in number of median-based standard deviations (median-based Z-scores) as well as momentum (whether variables are increasing or decreasing). Medians and standard deviations are for the period starting 2000:Q1, where data are available.

13
Corporate balance sheets generally sound
Risks
Selected Asia: Nonfinancial Sector Corporate Debt-to-Equity Ratio1
(In percentage points; cap-weighted mean; 2011)
KO
REA
PH
ILIP
PIN
ES
JAP
AN
IND
ON
ES
IA
AU
STR
ALIA
NEW
ZEA
LA
ND
MA
LA
YS
IA
IND
IA
VIE
TN
AM
CH
INA
TH
AIL
AN
D
HO
NG
KO
NG
SA
R
SIN
GA
PO
RE
EU
RO
ZO
NE
LA
TA
M
AS
IAN
AV
ER
AG
E
UN
ITED
STA
TES
-100
-80
-60
-40
-20
0
20
40
60
80
100Difference from 2009 Difference from Median (2002-2007)
1 Vietnam's data start in 2006.
TA
IWA
N
PR
OV
-IN
CE O
F C
HIN
A

14
Banks’ buffers increasing, although below international comparators in some cases
Risks
Selected Asia: Commercial Banks' Loss-Absorbing Buffers1
(In percent of risk-weighted assets; asset-weighted mean)
India
Austr
alia
Japan
New
Zeala
nd
Kore
a
Thailand
Chin
a
Mala
ysia
Hong K
ong S
AR
Philip
pin
es
Indonesia
Sin
gapore
-2
0
2
4
6
8
Tier-1 capital in excess of 8.5 % Loan loss reserves less nonperforming loansEffective buffer Latin AmericaUnited States Euro AreaAsia
1 Loss absorbing buffers are calculated as Tier-1 capital in excess of 8.5 percent plus loan loss reserves less impaired loans as percent of total risk-weighted assets.
Taiw
an P
rov-
ince
of
Chin
a

15
Cambodia: Rapid credit growth increasingly fuelled by foreign funds
Risks
Monetary Developments, 2008-12(Contribution to broad money growth, in percent)
Feb-0
8
Apr-
08
Jun-0
8
Aug-0
8
Oct
-08
Dec-
08
Feb-0
9
Apr-
09
Jun-0
9
Aug-0
9
Oct
-09
Dec-
09
Feb-1
0
Apr-
10
Jun-1
0
Aug-1
0
Oct
-10
Dec-
10
Feb-1
1
Apr-
11
Jun-1
1
Aug-1
1
Oct
-11
Dec-
11
Feb-1
2
Apr-
12
Jun-1
2
Aug-1
2
Oct
-12
Dec-
12
Feb-1
3
-20
0
20
40
60
80
100
120
-20
0
20
40
60
80
100
120 Net domestic assets Net foreign assets
Broad money growth 1/ Private sector credit 1/
1/ Year-on-year percent change.

16
Cambodia: When is credit growth too fast?
Risks
Credit to GDP Relative to Peers(In percent)
Credit Gap(In percent)
Jul-
04
Mar-
05
Nov-0
5Ju
l-06
Mar-
07
Nov-0
7Ju
l-08
Mar-
09
Nov-0
9Ju
l-10
Mar-
11
Nov-1
1Ju
l-12
Mar-
13
Nov-1
3Ju
l-14
Mar-
15
Nov-1
5
0
10
20
30
40
50
60
70
80Credit-to-GDPWith 30 percent credit growthWith 20 percent credit growthLIC median (2009)
Jul-
04
Mar-
05
Nov-0
5Ju
l-06
Mar-
07
Nov-0
7Ju
l-08
Mar-
09
Nov-0
9Ju
l-10
Mar-
11
Nov-1
1Ju
l-12
Mar-
13
Nov-1
3Ju
l-14
Mar-
15
Nov-1
5
-5
0
5
10
15
20
25
30 Credit-to-GDP gap
Gap with 30 percent credit growth
Gap with 20 percent credit growth
17
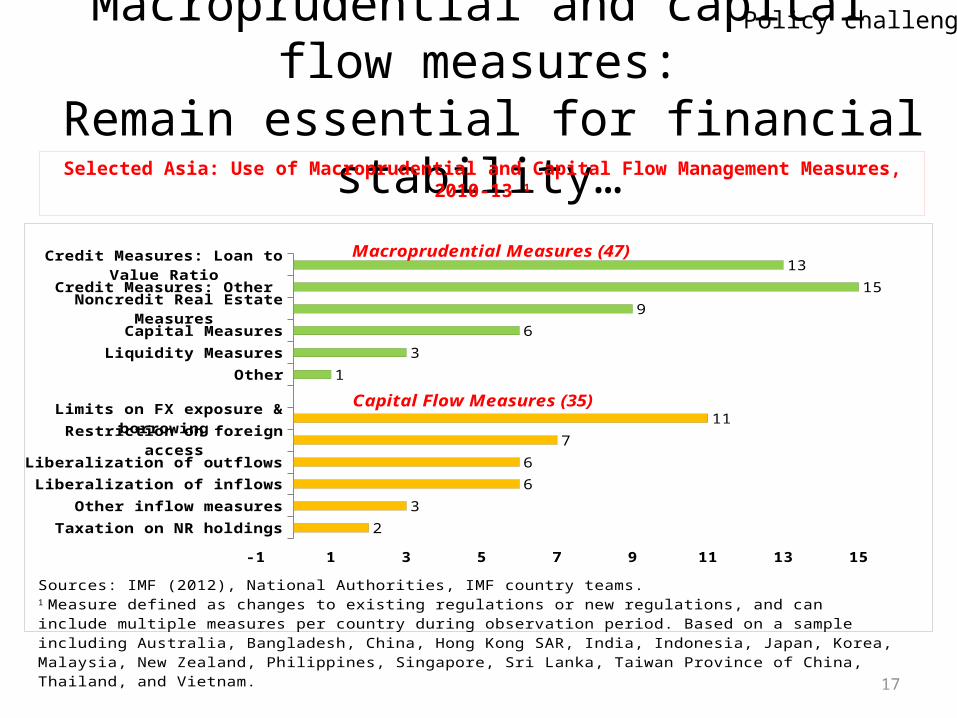
Macroprudential and capital flow measures: Remain essential for financial stability…
Policy challenges
Selected Asia: Use of Macroprudential and Capital Flow Management Measures, 2010-13 1
Taxation on NR holdings
Other inflow measures
Liberalization of inflows
Liberalization of outflows
Restriction on foreign access
Limits on FX exposure & borrowing
Other
Liquidity Measures
Capital Measures
Noncredit Real Estate Measures
Credit Measures: Other
Credit Measures: Loan to Value Ratio
-1 1 3 5 7 9 11 13 15
2
3
6
6
7
11
1
3
6
9
15
13Macroprudential Measures (47)
Capital Flow Measures (35)
Sources: IMF (2012), National Authorities, IMF country teams.1 Measure defined as changes to existing regulations or new regulations, and can include multiple measures per country during observation period. Based on a sample including Australia, Bangladesh, China, Hong Kong SAR, India, Indonesia, Japan, Korea, Malaysia, New Zealand, Philippines, Singapore, Sri Lanka, Taiwan Province of China, Thailand, and Vietnam.
18
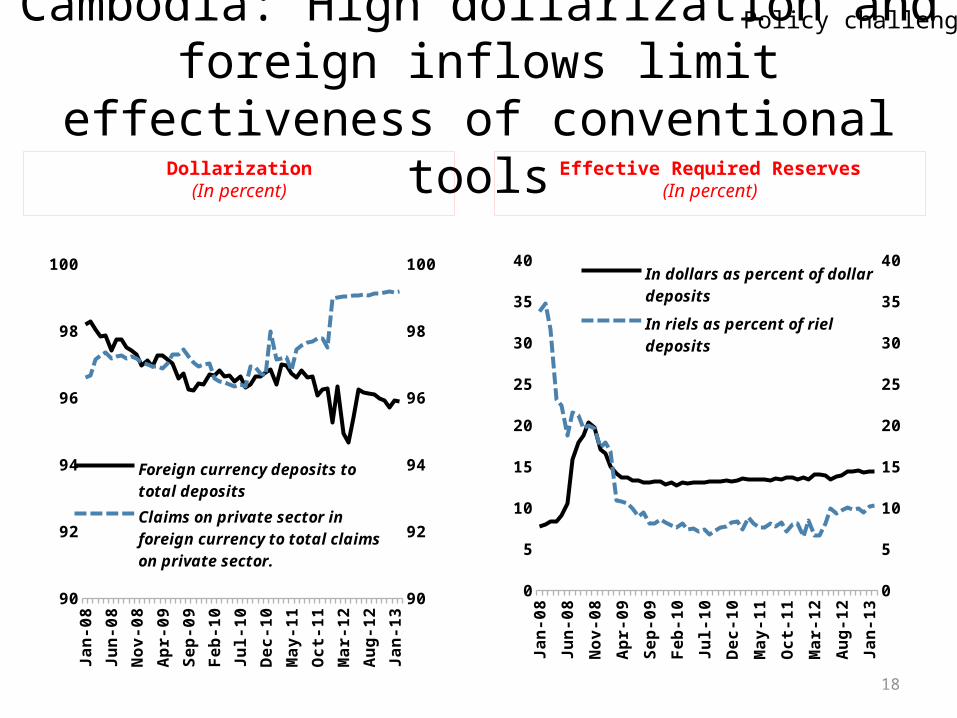
Cambodia: High dollarization and foreign inflows limit effectiveness of conventional tools
Policy challenges
Effective Required Reserves(In percent)
Dollarization(In percent)
Feb-0
8
Aug-0
8
Feb-0
9
Aug-0
9
Feb-1
0
Aug-1
0
Feb-1
1
Aug-1
1
Feb-1
2
Aug-1
2
Feb-1
3
90
92
94
96
98
100
90
92
94
96
98
100
Foreign currency deposits to total deposits
Claims on private sector in foreign currency to total claims on private sector.
Feb-0
8Ju
n-0
8O
ct-0
8Feb-0
9Ju
n-0
9O
ct-0
9Feb-1
0Ju
n-1
0O
ct-1
0Feb-1
1Ju
n-1
1O
ct-1
1Feb-1
2Ju
n-1
2O
ct-1
2Feb-1
3
0
5
10
15
20
25
30
35
40
0
5
10
15
20
25
30
35
40In dollars as percent of dollar deposits
In riels as percent of riel deposits

19
There is a need for rebuilding monetary and fiscal policy space
Policy challenges
Selected Asia: Policy Rates(In percent; as of December, 2012)
Selected Asia: Cyclically Adjusted Fiscal Balance
(In percent of GDP)
Ind
ia
Jap
an
Vie
tnam
Mala
ysia
Th
ailan
d
Hon
g K
on
g S
AR
Ph
ilip
pin
es
New
Zeala
nd
Ind
on
esia
Au
str
alia
Ch
ina
Kore
a
Sin
gap
ore
-10
-8
-6
-4
-2
0
2
4
6
8
2012 2013 Average: 2002-07
Taiw
an P
rov
-in
ce o
f C
hin
a
Jap
an
Sin
gap
ore
New
Zeala
nd
Th
ailan
d
Kore
a
Ch
ina
Au
str
alia
Mala
ysia
Ph
ilip
pin
es
Ind
on
esia
Vie
tnam
-4
-2
0
2
4
6
8
10
12
14
Current nominal policy rates
Real policy rates (deviation from 2002–07 av-erage, in percentage points)
Nominal policy rates end-2011
Taiw
an
Pro
v-
ince o
f C
hin
a

20
Cambodia: Fiscal Trends(In Percent of GDP)
2006 2007 2008 2009 2010 2011 2012-25
-20
-15
-10
-5
0
5
10
15
20
Capital expenditureCurrent expenditureGrantsDomestic revenueFiscal balanceDomestic financing
Selected Asia: Tax Revenue(In Percent of GDP)
2002
2003
2004
2005
2006
2007
2008
2009
2010
2011
0
5
10
15
20
25
Vietnam Cambodia
Lao PDR Myanmar
Other Asian LICs 1/
Cambodia: Fiscal buffers also key for stability and medium-term growth
Policy challenges

-4 -3 -2 -1 0 1 2 3 4 5 6 7 8 9 10 11 12 13 14 15 16 17 18 19 20 21 22 23 24 25 26 27 28 29 3050
100
150
200
250
300
350
400
450
500
550
600
650
700
750
Median
10th/90th percentile
25th/75th percentile
Indonesia 1983
Brazil 1961
Korea 1961
Mozambique 1996
1950–2011(normalized to 100 at t = 0, the year before the start of a strong growth episode; median economy; years on x-axis)
Cambodia 1996
Note: LICs exclude countries experiencing or recovering from a serious external or internal conflict at the start of their takeoffs.
Cambodia: A longer-term growth lesson Policy challenges

22
To wrap up…• Near-term growth prospects for Asia have improved, although global recovery remains fragile and subdued
• Easy global and domestic financial conditions and prospect of continued capital inflows require vigilance in monitoring build-up of potential financial stability risks
• Macroprudential tools have a role to play along a move toward rebuilding monetary and fiscal policy space
• For Cambodia, strengthening the conventional monetary tools will also be important while fiscal buffers remain the anchor of macroeconomic stability

23
THANK YOU