Embed Size (px)
Citation preview

Connecting Markets East & West
See Appendix A-1 for analyst certification, important disclosures and the status of non-US analysts.
Any authors named on this report are research
analysts unless otherwise indicated.
Global Markets Research
Tracking Trump, Commodities and China; How long will the reversals last?; Japan looking much better
January 2017
Asia equities – Uncertainty and divergence
Mixo Das – NSL +65 6433 6986 [email protected]

Asia equity outlook
Global factors at play
− Re-assess framework as ‘low for long’ growth/yield environment disrupted. What does it do to valuations?
− Growth: Cyclical component and structural changes. Trump boost to growth likely transitory
− Commodities: Oil at highs, industrial commodities peaked + implications on industrial sector
− China sentiment likely worsens before improving again heading into National Congress
Asia equity strategy
− Higher rates, stronger dollar, cyclical slowdown to weigh on Asia ex-Japan in 1H
− Structural themes: China mass-market consumption; China Tech; Korea biopharma; Korea consumer exports; India/Indo/Phil financials/property/infrastructure; Sing logistics/healthcare; Malaysia exporters; Thai services consumption; Food prices; Military spending; Regional tourism; EM pharma; Internet & data penetration.
− Tactical positioning: Still Neutral in absence of strong risk-reward balance
− Japan: Trump extracted Japan from policy corner. Multiple positives now from earnings and flow support
Long-term questions: impact of technology (AI/big data/cloud, ADAS/EV/solar, VR/AR, IoT, sharing), social changes (ageing, inequality, media), government debt. How China’s 3 Rs resolve?
Source: Nomura Strategy 1
100
200
400
6
12
24
Forward EPS MSCI World (rhs)
-4
-2
0
2
4
6
8
10
Global ERP
0
1
2
3
4
5
6
7
8
1992 1994 1996 1998 2000 2002 2004 2006 2008 2010 2012 2014 2016 2018
10yr UST
-5
-3
-1
1
3
5
7
90
1
2
3
4
5
6
7
8
9
1992 1994 1996 1998 2000 2002 2004 2006 2008 2010 2012 2014 2016 2018
US 10yr yield ERP (inverted, rhs)
Source: Bloomberg, Datastream, Nomura Strategy 2
The old framework less useful now but still instructive
But downgrade to return expectations may not turn quickly

“Good” sectors: still seeing earnings upside “Bad” sectors: a counter-trend cycle?
Source: Datastream, Nomura Strategy 3
Commodity prices have driven cyclical gains, US corporate tax cuts, growth, de-reg will help further
xxxx xxxx
0
50
100
150
200
250
300
1995
1996
1997
1998
1999
2000
2001
2002
2003
2004
2005
2006
2007
2008
2009
2010
2011
2012
2013
2014
2015
2016
2017
2018
Tech Health Care Discretionary Staples
0
50
100
150
200
250
300
1995
1996
1997
1998
1999
2000
2001
2002
2003
2004
2005
2006
2007
2008
2009
2010
2011
2012
2013
2014
2015
2016
2017
2018
Financials Utilities Materials Energy

Source: Bloomberg, Nomura Strategy 4
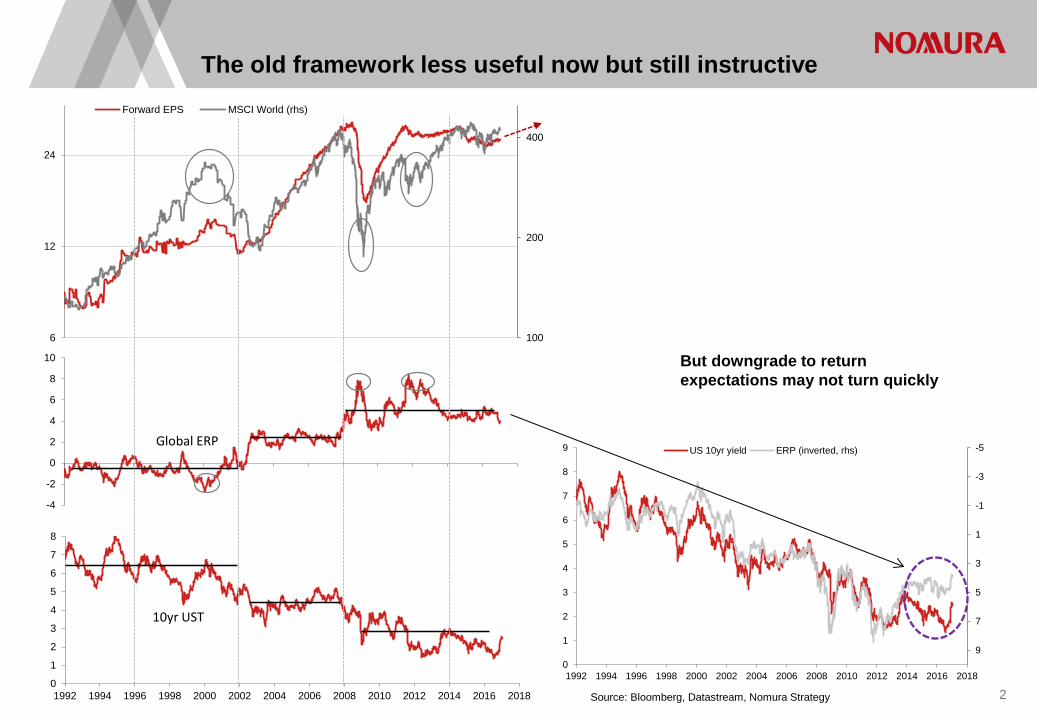
Outcome on growth beyond is the key question
Manufacturing PMIs have improved! G10 Economic surprise index
-40
-30
-20
-10
0
10
20
30
40
50G10 econ surprise
47
49
51
53
55
57
59US EU Japan China Global
?

Cross-asset correlation rose and fell Trade improvement has boosted shipping rates
Source: Bloomberg, Nomura Quantitative Strategy, Nomura Strategy 5
Many growth-related reversals this year
Value outperformance significant Percentage of US funds outperforming S&P on 5yr basis
200
400
600
800
1000
1200
1400
1600
1800
2000
600
700
800
900
1000
1100
1200Shanghai freight rate BDI
110
115
120
125
130
135
140Value / Growth

Penetration of passive funds has been very strong Excess returns have a good correlation with bond yields
Source: Nomura Quantitative Strategy, EPFR, Nomura Strategy 6
A closer look at active performance

Global Value / Growth performance over the past 40 years Value does best in early expansion, but also late-cycle
Source: Bloomberg, Nomura Strategy 7
A closer look at the Value surge
More mixed in EM Reversal has been sharp in Japan
80
90
100
110
120
130
140
150
160
170
180
1975 1980 1985 1990 1995 2000 2005 2010 2015
Value / Growth
80
180
280
380
480
580
680
1985 1990 1995 2000 2005 2010 2015
Value / Growth
70
80
90
100
110
120
130Value / Growth

20
30
40
50
60
70
80
90
100
1990 1993 1996 1999 2002 2005 2008 2011 2014 2017
EM / DM
EM performance called into question after Trump Growth expectations will be key
Tentative rotational flows have reversed Valuation gap is still large though
Source: Bloomberg, Datastream, EPFR, Nomura Strategy 8
EM vs DM: renewed underperformance?
-100000
-50000
0
50000
100000
Jan-15 Apr-15 Jul-15 Oct-15 Jan-16 Apr-16 Jul-16 Oct-16 Jan-17
Cumulative DM Cumulative EM
-40
-30
-20
-10
0
10
20
30
40
50
60
1992
1993
1994
1995
1996
1997
1998
1999
2000
2001
2002
2003
2004
2005
2006
2007
2008
2009
2010
2011
2012
2013
2014
2015
2016
2017
EM - DM Fwd earnings growth
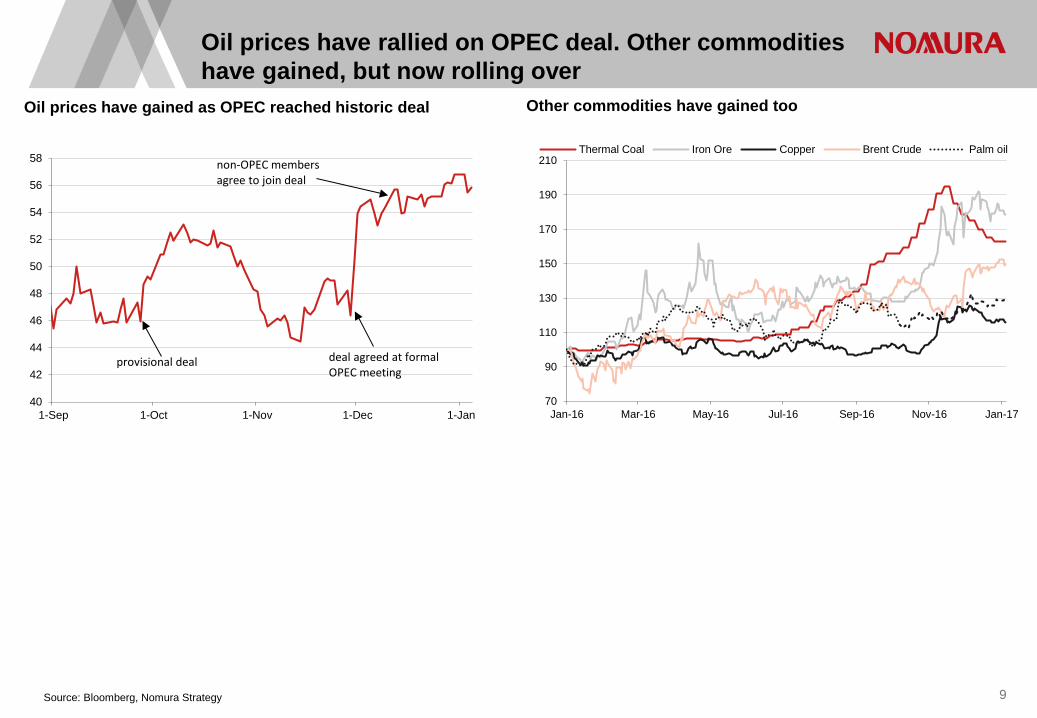
Oil prices have gained as OPEC reached historic deal Other commodities have gained too
Source: Bloomberg, Nomura Strategy 9
Oil prices have rallied on OPEC deal. Other commodities have gained, but now rolling over
40
42
44
46
48
50
52
54
56
58
1-Sep 1-Oct 1-Nov 1-Dec 1-Jan
provisional deal deal agreed at formal OPEC meeting
non-OPEC members agree to join deal
70
90
110
130
150
170
190
210
Jan-16 Mar-16 May-16 Jul-16 Sep-16 Nov-16 Jan-17
Thermal Coal Iron Ore Copper Brent Crude Palm oil
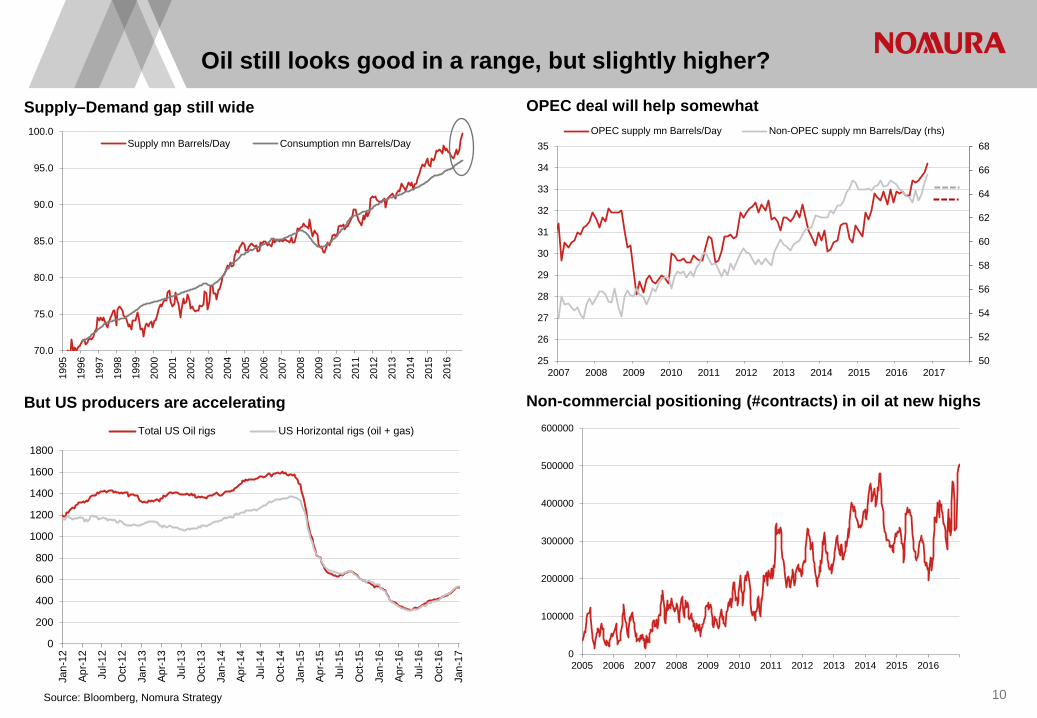
Supply–Demand gap still wide OPEC deal will help somewhat
But US producers are accelerating Non-commercial positioning (#contracts) in oil at new highs
Source: Bloomberg, Nomura Strategy 10
Oil still looks good in a range, but slightly higher?
70.0
75.0
80.0
85.0
90.0
95.0
100.0
1995
1996
1997
1998
1999
2000
2001
2002
2003
2004
2005
2006
2007
2008
2009
2010
2011
2012
2013
2014
2015
2016
Supply mn Barrels/Day Consumption mn Barrels/Day
50
52
54
56
58
60
62
64
66
68
25
26
27
28
29
30
31
32
33
34
35
2007 2008 2009 2010 2011 2012 2013 2014 2015 2016 2017
OPEC supply mn Barrels/Day Non-OPEC supply mn Barrels/Day (rhs)
0
200
400
600
800
1000
1200
1400
1600
1800
Jan-
12
Apr-1
2
Jul-1
2
Oct
-12
Jan-
13
Apr-1
3
Jul-1
3
Oct
-13
Jan-
14
Apr-1
4
Jul-1
4
Oct
-14
Jan-
15
Apr-1
5
Jul-1
5
Oct
-15
Jan-
16
Apr-1
6
Jul-1
6
Oct
-16
Jan-
17
Total US Oil rigs US Horizontal rigs (oil + gas)
0
100000
200000
300000
400000
500000
600000
2005 2006 2007 2008 2009 2010 2011 2012 2013 2014 2015 2016

Energy, Materials sectors have outperformed Credit spreads in Energy have rallied a lot!
Source: Bloomberg, Nomura Strategy 11
Impact of commodity rally in markets
-60
-40
-20
0
20
40
60
80
100
120300
500
700
900
1100
1300
1500
1700
US Energy sector HY credit spread (bp) Brent Crude (rhs, inverted)
Commodity prices have driven China PPI higher This has spurred industrial profits
-10
-5
0
5
10
15
20
25
-8
-6
-4
-2
0
2
4
Jan-13 Jan-14 Jan-15 Jan-16
China PPI China industrial profits (rhs)-60
-40
-20
0
20
40
60
80
-10
-5
0
5
10
15
2004 2005 2006 2007 2008 2009 2010 2011 2012 2013 2014 2015 2016 2017
China PPI %y-y 2m lag Commodity prices %y-y
70
75
80
85
90
95
100
105Energy Materials

China: dealing with a variety of risks
Source: CEIC, Bloomberg, Nomura global economics, IMF, Nomura Strategy
Credit spreads saw another spike, bond defaults rose FX risks rising again as outflows accelerate
Debt levels in private corporates is very high Proprietary indicators showing very stretched financial cycle (combining debt levels, credit growth, asset prices, FX)
12
2.4
2.6
2.8
3
3.2
3.4
3.6
3.8
4
Jan-16 Mar-16 May-16 Jul-16 Sep-16 Nov-16 Jan-17
China AA spread
0%
1%
2%
3%
4%
5%
6%CNY 12m depreciation expectation
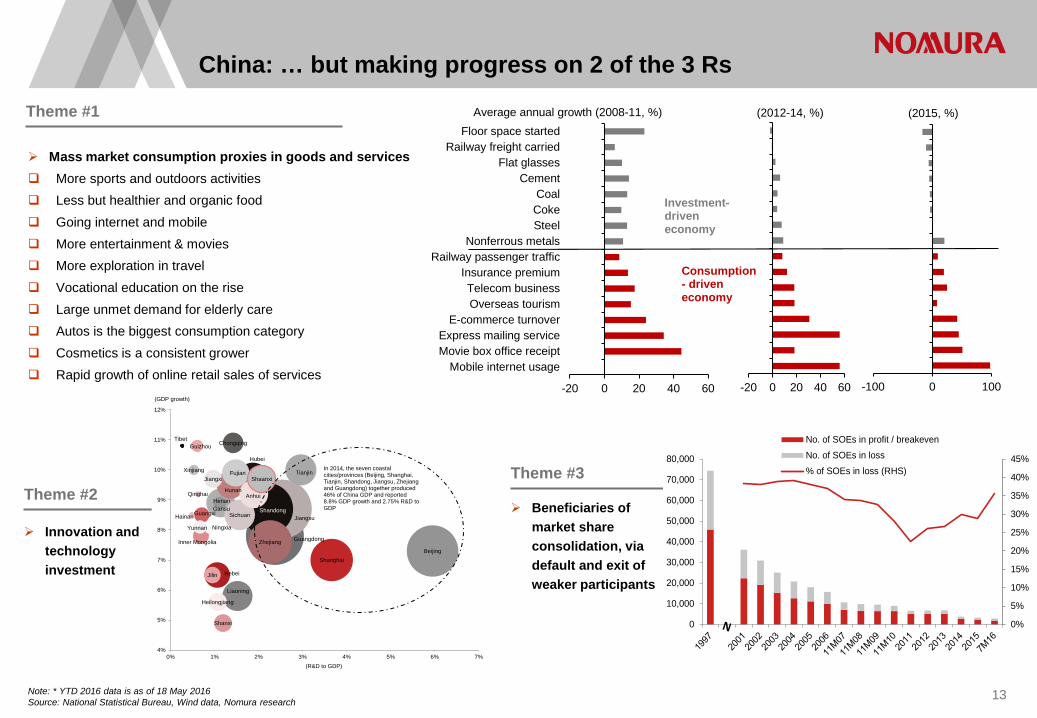
Mass market consumption proxies in goods and services More sports and outdoors activities Less but healthier and organic food Going internet and mobile More entertainment & movies More exploration in travel Vocational education on the rise Large unmet demand for elderly care Autos is the biggest consumption category Cosmetics is a consistent grower Rapid growth of online retail sales of services
Beneficiaries of market share consolidation, via default and exit of weaker participants
Innovation and technology investment
China: … but making progress on 2 of the 3 Rs
Note: * YTD 2016 data is as of 18 May 2016 Source: National Statistical Bureau, Wind data, Nomura research
13
Theme #1
Theme #2 Theme #3
Guangdong
JiangsuShandong
Zhejiang
Henan
Hebei
Liaoning
Sichuan
Hubei
Hunan
Fujian
ShanghaiBeijing
Anhui
Shaanxi
Inner Mongolia
Jiangxi
Guangxi
Tianjin
Heilongjiang
Chongqing
Jilin
Yunnan
Shanxi
Xinjiang
Guizhou
GansuHainan
Ningxia
Qinghai
Tibet
4%
5%
6%
7%
8%
9%
10%
11%
12%
0% 1% 2% 3% 4% 5% 6% 7%
(GDP growth)
(R&D to GDP)
In 2014, the seven coastal cities/provinces (Beijing, Shanghai, Tianjin, Shandong, Jiangsu, Zhejiangand Guangdong) together produced46% of China GDP and reported 8.8% GDP growth and 2.75% R&D to GDP
0%
5%
10%
15%
20%
25%
30%
35%
40%
45%
0
10,000
20,000
30,000
40,000
50,000
60,000
70,000
80,000
No. of SOEs in profit / breakevenNo. of SOEs in loss% of SOEs in loss (RHS)
-100 0 100
(2015, %)
-20 0 20 40 60
(2012-14, %)
-20 0 20 40 60
Mobile internet usageMovie box office receiptExpress mailing service
E-commerce turnoverOverseas tourismTelecom business
Insurance premiumRailway passenger traffic
Nonferrous metalsSteelCokeCoal
CementFlat glasses
Railway freight carriedFloor space started
Average annual growth (2008-11, %)
Investment-driven economy
Consumption- driven economy
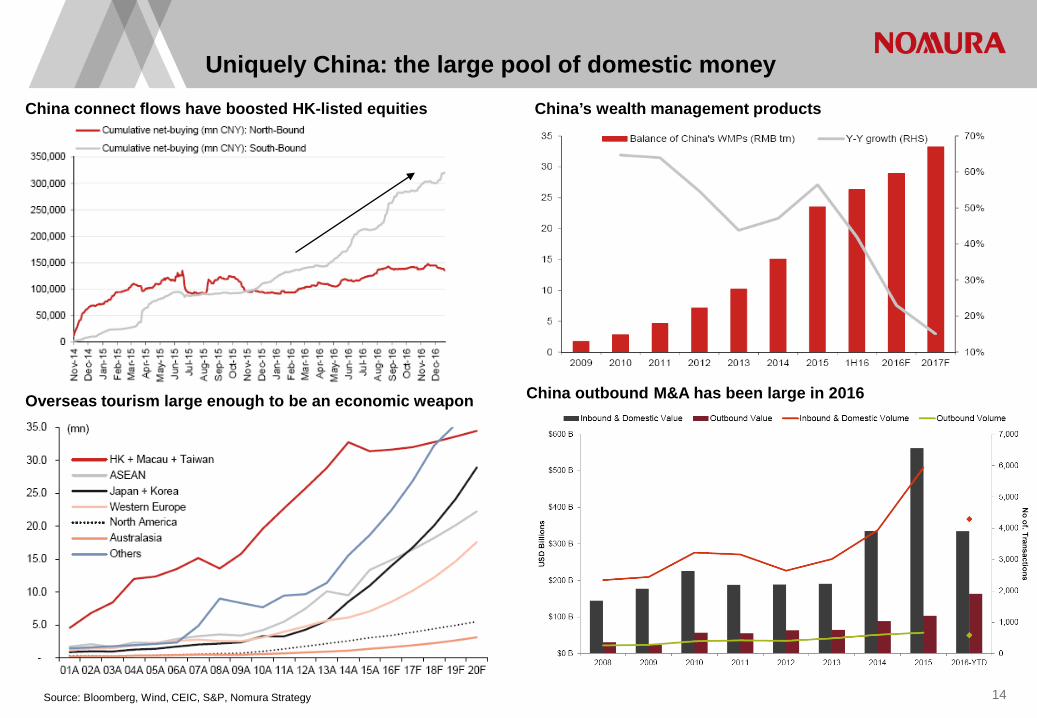
Uniquely China: the large pool of domestic money
Source: Bloomberg, Wind, CEIC, S&P, Nomura Strategy
China’s wealth management products China connect flows have boosted HK-listed equities
Overseas tourism large enough to be an economic weapon China outbound M&A has been large in 2016
14

420
440
460
480
500
520
540
560
580Bullish Cautious NeutralBullish
Source: Bloomberg, Nomura Strategy 15
Trend for MSCI AeJ likely declining as earning roll over and valuations face downside
MSCI Asia ex-Japan with our tactical calls and expected range.
?

16 Source: Nomura research
Asia strategy: Our positioning
Allocation Key long-term developments Key considerations for near-term allocation
China Overweight SOE/financial reform, investment-consumption rebalancing, debt restructuring, Implications from new technologies Credit risks, currency stability, southbound liquidity
HK Underweight Property cycle, China luxury/tourist spending, rates/dollar Domestic weakness, property measures
Korea Neutral Restructuring, cash return policies, foreign consumption Earnings revisions, potential policy changes
Taiwan Neutral Tech cycle, cross-Strait relations, dividends Tech-sector growth, yield-flow unwind
India Overweight Key reforms, private capex, bank NPLs Good value, growth to improve, policy support
Singapore Underweight Innovation economy, weak trade, ageing society Banks NIM, Energy upside played out
Malaysia Underweight Political risk premium, long-term growth, dividends Weak growth and risks, election may not help
Indonesia Overweight Private investment, liquidity, inflation, FDI, demographics Growth momentum, Jakarta elections, outflow risks
Thailand Neutral Road to elections, ageing and leveraged household Cyclically improving growth, flow support
Philippines Overweight Policies under new president, FDI, demographics Policy uncertainty is priced in, cheap
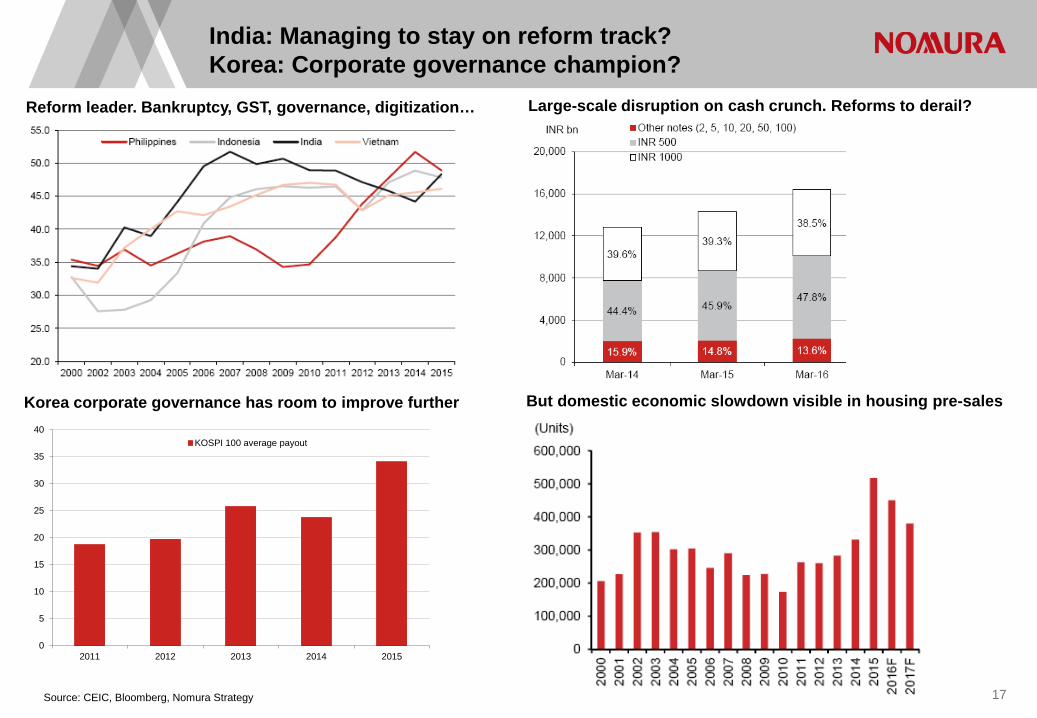
India: Managing to stay on reform track? Korea: Corporate governance champion?
Source: CEIC, Bloomberg, Nomura Strategy
Reform leader. Bankruptcy, GST, governance, digitization… Large-scale disruption on cash crunch. Reforms to derail?
But domestic economic slowdown visible in housing pre-sales Korea corporate governance has room to improve further
17
0
5
10
15
20
25
30
35
40
2011 2012 2013 2014 2015
KOSPI 100 average payout

Japan: Multiple positives for equities
Source: BOJ, Bloomberg, Quick, Nomura
Further JPY depreciation to help Earnings to drive gains
18
98
103
108
113
118
123
128
14000
15000
16000
17000
18000
19000
20000
21000
22000Nikkei JPY
BOJ’s ETF buying is large! Share buyback has also helped

Japan: What’s ahead?
Source: Cabinet office, BOJ, Nomura
Possibility of tax on undistributed profits Rise of ESG. ROE and governance focus to remain
19
Benchmarks used by GPIF and quasi public pension funds (JPY bn)
Where do you see upside for the Japanese economy? No more easing expected from BOJ
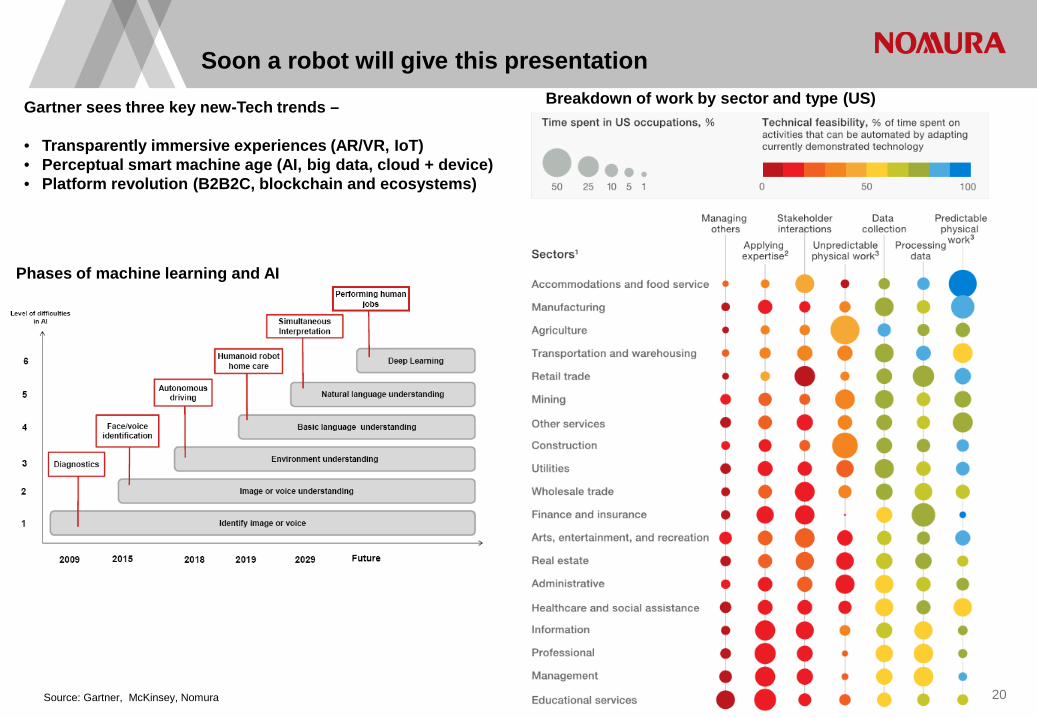
Gartner sees three key new-Tech trends – • Transparently immersive experiences (AR/VR, IoT) • Perceptual smart machine age (AI, big data, cloud + device) • Platform revolution (B2B2C, blockchain and ecosystems)
Phases of machine learning and AI
Breakdown of work by sector and type (US)
Source: Gartner, McKinsey, Nomura 20
Soon a robot will give this presentation
Appendix A-1 Analyst Certification I, Mixo Das, hereby certify (1) that the views expressed in this Research report accurately reflect my personal views about any or all of the subject securities or issuers referred to in this Research report, (2) no part of my compensation was, is or will be directly or indirectly related to the specific recommendations or views expressed in this Research report and (3) no part of my compensation is tied to any specific investment banking transactions performed by Nomura Securities International, Inc., Nomura International plc or any other Nomura Group company.
Important Disclosures Online availability of research and conflict-of-interest disclosures Nomura Group research is available on www.nomuranow.com/research, Bloomberg, Capital IQ, Factset, MarkitHub, Reuters and ThomsonOne. Important disclosures may be read at http://go.nomuranow.com/research/globalresearchportal/pages/disclosures/disclosures.aspx or requested from Nomura Securities International, Inc., or Instinet, LLC on 1-877-865-5752. If you have any difficulties with the website, please email [email protected] for help. The analysts responsible for preparing this report have received compensation based upon various factors including the firm's total revenues, a portion of which is generated by Investment Banking activities. Unless otherwise noted, the non-US analysts listed at the front of this report are not registered/qualified as research analysts under FINRA rules, may not be associated persons of NSI or ILLC, and may not be subject to FINRA Rule 2241 restrictions on communications with covered companies, public appearances, and trading securities held by a research analyst account. Nomura Global Financial Products Inc. (“NGFP”) Nomura Derivative Products Inc. (“NDPI”) and Nomura International plc. (“NIplc”) are registered with the Commodities Futures Trading Commission and the National Futures Association (NFA) as swap dealers. NGFP, NDPI, and NIplc are generally engaged in the trading of swaps and other derivative products, any of which may be the subject of this report. Distribution of ratings (Nomura Group) The distribution of all ratings published by Nomura Group Global Equity Research is as follows: 50% have been assigned a Buy rating which, for purposes of mandatory disclosures, are classified as a Buy rating; 38% of companies with this rating are investment banking clients of the Nomura Group*. 0% of companies (which are admitted to trading on a regulated market in the EEA) with this rating were supplied material services** by the Nomura Group. 42% have been assigned a Neutral rating which, for purposes of mandatory disclosures, is classified as a Hold rating; 53% of companies with this rating are investment banking clients of the Nomura Group*. 0% of companies (which are admitted to trading on a regulated market in the EEA) with this rating were supplied material services by the Nomura Group 8% have been assigned a Reduce rating which, for purposes of mandatory disclosures, are classified as a Sell rating; 8% of companies with this rating are investment banking clients of the Nomura Group*. 0% of companies (which are admitted to trading on a regulated market in the EEA) with this rating were supplied material services by the Nomura Group. As at 30 September 2016. *The Nomura Group as defined in the Disclaimer section at the end of this report. ** As defined by the EU Market Abuse Regulation Distribution of ratings (Instinet, LLC) The distribution of all ratings published by Instinet, LLC Equity Research is as follows: 53% have been assigned a Buy rating which, for purposes of mandatory disclosures, are classified as a Buy rating; Instinet LLC has provided investment banking services to 0% of companies with this rating within the previous 12 months. 42% have been assigned a Neutral rating which, for purposes of mandatory disclosures, is classified as a Hold rating; Instinet LLC has provided investment banking services to 0% of companies with this rating within the previous 12 months. 5% have been assigned a Reduce rating which, for purposes of mandatory disclosures, are classified as a Sell rating; Instinet LLC has provided investment banking services to 0% of companies with this rating within the previous 12 months.
21

Definition of Nomura Group's equity research rating system and sectors The rating system is a relative system, indicating expected performance against a specific benchmark identified for each individual stock, subject to limited management discretion. An analyst’s target price is an assessment of the current intrinsic fair value of the stock based on an appropriate valuation methodology determined by the analyst. Valuation methodologies include, but are not limited to, discounted cash flow analysis, expected return on equity and multiple analysis. Analysts may also indicate expected absolute upside/downside relative to the stated target price, defined as (target price - current price)/current price. STOCKS A rating of 'Buy', indicates that the analyst expects the stock to outperform the Benchmark over the next 12 months. A rating of 'Neutral', indicates that the analyst expects the stock to perform in line with the Benchmark over the next 12 months. A rating of 'Reduce', indicates that the analyst expects the stock to underperform the Benchmark over the next 12 months. A rating of 'Suspended', indicates that the rating, target price and estimates have been suspended temporarily to comply with applicable regulations and/or firm policies. Securities and/or companies that are labelled as 'Not rated' or shown as 'No rating' are not in regular research coverage. Investors should not expect continuing or additional information from Nomura relating to such securities and/or companies. Benchmarks are as follows: United States/Europe/Asia ex-Japan: please see valuation methodologies for explanations of relevant benchmarks for stocks, which can be accessed at: http://go.nomuranow.com/research/globalresearchportal/pages/disclosures/disclosures.aspx; Global Emerging Markets (ex-Asia): MSCI Emerging Markets ex-Asia, unless otherwise stated in the valuation methodology; Japan: Russell/Nomura Large Cap. SECTORS A 'Bullish' stance, indicates that the analyst expects the sector to outperform the Benchmark during the next 12 months. A 'Neutral' stance, indicates that the analyst expects the sector to perform in line with the Benchmark during the next 12 months. A 'Bearish' stance, indicates that the analyst expects the sector to underperform the Benchmark during the next 12 months. Sectors that are labelled as 'Not rated' or shown as 'N/A' are not assigned ratings. Benchmarks are as follows: United States: S&P 500; Europe: Dow Jones STOXX 600; Global Emerging Markets (ex-Asia): MSCI Emerging Markets ex-Asia. Japan/Asia ex-Japan: Sector ratings are not assigned. Target Price A Target Price, if discussed, indicates the analyst’s forecast for the share price with a 12-month time horizon, reflecting in part the analyst's estimates for the company's earnings. The achievement of any target price may be impeded by general market and macroeconomic trends, and by other risks related to the company or the market, and may not occur if the company's earnings differ from estimates. Disclaimers This publication contains material that has been prepared by the Nomura Group entity identified on page 1 and, if applicable, with the contributions of one or more Nomura Group entities whose employees and their respective affiliations are specified on page 1 or identified elsewhere in the publication. The term "Nomura Group" used herein refers to Nomura Holdings, Inc. and its affiliates and subsidiaries including: Nomura Securities Co., Ltd. ('NSC') Tokyo, Japan; Nomura International plc ('NIplc'), UK; Nomura Securities International, Inc. ('NSI'), New York, US; Instinet, LLC ('ILLC'); Nomura International (Hong Kong) Ltd. (‘NIHK’), Hong Kong; Nomura Financial Investment (Korea) Co., Ltd. (‘NFIK’), Korea (Information on Nomura analysts registered with the Korea Financial Investment Association ('KOFIA') can be found on the KOFIA Intranet at http://dis.kofia.or.kr); Nomura Singapore Ltd. (‘NSL’), Singapore (Registration number 197201440E, regulated by the Monetary Authority of Singapore); Nomura Australia Ltd. (‘NAL’), Australia (ABN 48 003 032 513), regulated by the Australian Securities and Investment Commission ('ASIC') and holder of an Australian financial services licence number 246412; P.T. Nomura Indonesia (‘PTNI’), Indonesia; Nomura Securities Malaysia Sdn. Bhd. (‘NSM’), Malaysia; NIHK, Taipei Branch (‘NITB’), Taiwan; Nomura Financial Advisory and Securities (India) Private Limited (‘NFASL’), Mumbai, India (Registered Address: Ceejay House, Level 11, Plot F, Shivsagar Estate, Dr. Annie Besant Road, Worli, Mumbai- 400 018, India; Tel: +91 22 4037 4037, Fax: +91 22 4037 4111; CIN No: U74140MH2007PTC169116, SEBI Registration No. for Stock Broking activities : BSE INB011299030, NSE INB231299034, INF231299034, INE 231299034, MCX: INE261299034; SEBI Registration No. for Merchant Banking : INM000011419; SEBI Registration No. for Research: INH000001014 and NIplc, Madrid Branch (‘NIplc, Madrid’). ‘CNS Thailand’ next to an analyst’s name on the front page of a research report indicates that the analyst is employed by Capital Nomura Securities Public Company Limited (‘CNS’) to provide research assistance services to NSL under an agreement between CNS and NSL. ‘NSFSPL’ next to an employee’s name on the front page of a research report indicates that the individual is employed by Nomura Structured Finance Services Private Limited to provide assistance to certain Nomura entities under inter-company agreements. ‘BDO NS’ next to an analyst’s name on the front page of a research report indicates that the analyst is employed by BDO Unibank Inc. (‘BDO’) who has been assigned to BDO Nomura Securities Inc. (a Philippines securities dealer which is a joint venture between BDO and the Nomura Group), to provide research assistance services to NSL under an agreement between BDO, NSL and BDO Nomura Securities Inc. THIS MATERIAL IS: (I) FOR YOUR PRIVATE INFORMATION, AND WE ARE NOT SOLICITING ANY ACTION BASED UPON IT; (II) NOT TO BE CONSTRUED AS AN OFFER TO SELL OR A SOLICITATION OF AN OFFER TO BUY ANY SECURITY IN ANY JURISDICTION WHERE SUCH OFFER OR SOLICITATION WOULD BE ILLEGAL; AND (III) OTHER THAN DISCLOSURES RELATING TO THE NOMURA GROUP, BASED UPON INFORMATION FROM SOURCES THAT WE CONSIDER RELIABLE, BUT HAS NOT BEEN INDEPENDENTLY VERIFIED BY NOMURA GROUP. Other than disclosures relating to the Nomura Group, the Nomura Group does not warrant or represent that the document is accurate, complete, reliable, fit for any particular purpose or merchantable and does not accept liability for any act (or decision not to act) resulting from use of this document and related data. To the maximum extent permissible all warranties and other assurances by the Nomura Group are hereby excluded and the Nomura Group shall have no liability for the use, misuse, or distribution of this information.
22

Opinions or estimates expressed are current opinions as of the original publication date appearing on this material and the information, including the opinions and estimates contained herein, are subject to change without notice. The Nomura Group is under no duty to update this document. Any comments or statements made herein are those of the author(s) and may differ from views held by other parties within Nomura Group. Clients should consider whether any advice or recommendation in this report is suitable for their particular circumstances and, if appropriate, seek professional advice, including tax advice. The Nomura Group does not provide tax advice. The Nomura Group, and/or its officers, directors and employees, may, to the extent permitted by applicable law and/or regulation, deal as principal, agent, or otherwise, or have long or short positions in, or buy or sell, the securities, commodities or instruments, or options or other derivative instruments based thereon, of issuers or securities mentioned herein. The Nomura Group companies may also act as market maker or liquidity provider (within the meaning of applicable regulations in the UK) in the financial instruments of the issuer. Where the activity of market maker is carried out in accordance with the definition given to it by specific laws and regulations of the US or other jurisdictions, this will be separately disclosed within the specific issuer disclosures. This document may contain information obtained from third parties, including ratings from credit ratings agencies such as Standard & Poor’s. Reproduction and distribution of third-party content in any form is prohibited except with the prior written permission of the related third-party. Third-party content providers do not guarantee the accuracy, completeness, timeliness or availability of any information, including ratings, and are not responsible for any errors or omissions (negligent or otherwise), regardless of the cause, or for the results obtained from the use of such content. Third-party content providers give no express or implied warranties, including, but not limited to, any warranties of merchantability or fitness for a particular purpose or use. Third-party content providers shall not be liable for any direct, indirect, incidental, exemplary, compensatory, punitive, special or consequential damages, costs, expenses, legal fees, or losses (including lost income or profits and opportunity costs) in connection with any use of their content, including ratings. Credit ratings are statements of opinions and are not statements of fact or recommendations to purchase hold or sell securities. They do not address the suitability of securities or the suitability of securities for investment purposes, and should not be relied on as investment advice. Any MSCI sourced information in this document is the exclusive property of MSCI Inc. (‘MSCI’). Without prior written permission of MSCI, this information and any other MSCI intellectual property may not be reproduced, re-disseminated or used to create any financial products, including any indices. This information is provided on an "as is" basis. The user assumes the entire risk of any use made of this information. MSCI, its affiliates and any third party involved in, or related to, computing or compiling the information hereby expressly disclaim all warranties of originality, accuracy, completeness, merchantability or fitness for a particular purpose with respect to any of this information. Without limiting any of the foregoing, in no event shall MSCI, any of its affiliates or any third party involved in, or related to, computing or compiling the information have any liability for any damages of any kind. MSCI and the MSCI indexes are services marks of MSCI and its affiliates. The intellectual property right and any other rights, in Russell/Nomura Japan Equity Index belong to Nomura Securities Co., Ltd. ("Nomura") and Frank Russell Company ("Russell"). Nomura and Russell do not guarantee accuracy, completeness, reliability, usefulness, marketability, merchantability or fitness of the Index, and do not account for business activities or services that any index user and/or its affiliates undertakes with the use of the Index. Investors should consider this document as only a single factor in making their investment decision and, as such, the report should not be viewed as identifying or suggesting all risks, direct or indirect, that may be associated with any investment decision. Nomura Group produces a number of different types of research product including, among others, fundamental analysis and quantitative analysis; recommendations contained in one type of research product may differ from recommendations contained in other types of research product, whether as a result of differing time horizons, methodologies or otherwise. The Nomura Group publishes research product in a number of different ways including the posting of product on the Nomura Group portals and/or distribution directly to clients. Different groups of clients may receive different products and services from the research department depending on their individual requirements. Figures presented herein may refer to past performance or simulations based on past performance which are not reliable indicators of future performance. Where the information contains an indication of future performance, such forecasts may not be a reliable indicator of future performance. Moreover, simulations are based on models and simplifying assumptions which may oversimplify and not reflect the future distribution of returns. Certain securities are subject to fluctuations in exchange rates that could have an adverse effect on the value or price of, or income derived from, the investment. With respect to Fixed Income Research: Recommendations fall into two categories: tactical, which typically last up to three months; or strategic, which typically last from 6-12 months. However, trade recommendations may be reviewed at any time as circumstances change. ‘Stop loss’ levels for trades are also provided; which, if hit, closes the trade recommendation automatically. Prices and yields shown in recommendations are taken at the time of submission for publication and are based on either indicative Bloomberg, Reuters or Nomura prices and yields at that time. The prices and yields shown are not necessarily those at which the trade recommendation can be implemented. The securities described herein may not have been registered under the US Securities Act of 1933 (the ‘1933 Act’), and, in such case, may not be offered or sold in the US or to US persons unless they have been registered under the 1933 Act, or except in compliance with an exemption from the registration requirements of the 1933 Act. Unless governing law permits otherwise, any transaction should be executed via a Nomura entity in your home jurisdiction.
23
This document has been approved for distribution in the UK and European Economic Area as investment research by NIplc. NIplc is authorised by the Prudential Regulation Authority and regulated by the Financial Conduct Authority and the Prudential Regulation Authority. NIplc is a member of the London Stock Exchange. This document does not constitute a personal recommendation within the meaning of applicable regulations in the UK, or take into account the particular investment objectives, financial situations, or needs of individual investors. This document is intended only for investors who are 'eligible counterparties' or 'professional clients' for the purposes of applicable regulations in the UK, and may not, therefore, be redistributed to persons who are 'retail clients' for such purposes. This document has been approved by NIHK, which is regulated by the Hong Kong Securities and Futures Commission, for distribution in Hong Kong by NIHK. This document has been approved for distribution in Australia by NAL, which is authorized and regulated in Australia by the ASIC. This document has also been approved for distribution in Malaysia by NSM. In Singapore, this document has been distributed by NSL. NSL accepts legal responsibility for the content of this document, where it concerns securities, futures and foreign exchange, issued by their foreign affiliates in respect of recipients who are not accredited, expert or institutional investors as defined by the Securities and Futures Act (Chapter 289). Recipients of this document in Singapore should contact NSL in respect of matters arising from, or in connection with, this document. Unless prohibited by the provisions of Regulation S of the 1933 Act, this material is distributed in the US, by NSI, a US-registered broker-dealer, which accepts responsibility for its contents in accordance with the provisions of Rule 15a-6, under the US Securities Exchange Act of 1934. The entity that prepared this document permits its separately operated affiliates within the Nomura Group to make copies of such documents available to their clients. This document has not been approved for distribution to persons other than ‘Authorised Persons’, ‘Exempt Persons’ or ‘Institutions’ (as defined by the Capital Markets Authority) in the Kingdom of Saudi Arabia (‘Saudi Arabia’) or 'professional clients' (as defined by the Dubai Financial Services Authority) in the United Arab Emirates (‘UAE’) or a ‘Market Counterparty’ or ‘Business Customers’ (as defined by the Qatar Financial Centre Regulatory Authority) in the State of Qatar (‘Qatar’) by Nomura Saudi Arabia, NIplc or any other member of the Nomura Group, as the case may be. Neither this document nor any copy thereof may be taken or transmitted or distributed, directly or indirectly, by any person other than those authorised to do so into Saudi Arabia or in the UAE or in Qatar or to any person other than ‘Authorised Persons’, ‘Exempt Persons’ or ‘Institutions’ located in Saudi Arabia or 'professional clients' in the UAE or a ‘Market Counterparty’ or ‘Business Customers’ in Qatar . By accepting to receive this document, you represent that you are not located in Saudi Arabia or that you are an ‘Authorised Person’, an ‘Exempt Person’ or an ‘Institution’ in Saudi Arabia or that you are a 'professional client' in the UAE or a ‘Market Counterparty’ or ‘Business Customers’ in Qatar and agree to comply with these restrictions. Any failure to comply with these restrictions may constitute a violation of the laws of the UAE or Saudi Arabia or Qatar. NO PART OF THIS MATERIAL MAY BE (I) COPIED, PHOTOCOPIED, OR DUPLICATED IN ANY FORM, BY ANY MEANS; OR (II) REDISTRIBUTED WITHOUT THE PRIOR WRITTEN CONSENT OF A MEMBER OF THE NOMURA GROUP. If this document has been distributed by electronic transmission, such as e-mail, then such transmission cannot be guaranteed to be secure or error-free as information could be intercepted, corrupted, lost, destroyed, arrive late or incomplete, or contain viruses. The sender therefore does not accept liability for any errors or omissions in the contents of this document, which may arise as a result of electronic transmission. If verification is required, please request a hard-copy version. The Nomura Group manages conflicts with respect to the production of research through its compliance policies and procedures (including, but not limited to, Conflicts of Interest, Chinese Wall and Confidentiality policies) as well as through the maintenance of Chinese walls and employee training. Additional information regarding the methodologies or models used in the production of any investment recommendations contained within this document is available upon request by contacting the Research Analysts listed on the front page. Disclosures information is available upon request and disclosure information is available at the Nomura Disclosure web page: http://go.nomuranow.com/research/globalresearchportal/pages/disclosures/disclosures.aspx Copyright © 2016 Nomura International (Hong Kong) Ltd. All rights reserved. Disclosures as of 01-Dec-2016.
24