Embed Size (px)
Citation preview

Copyright © 2017 Boeing. All rights reserved.
David LongridgeVice President, Commercial Services Sales & Marketing
Boeing Commercial AirplanesNovember 2017
Copyright © 2017 Boeing. All rights reserved.
The statements contained herein are based on good faith assumptions are to be used for general information purposes only.
These statements do not constitute an offer, promise, warranty or guarantee of performance.
Asia Market Outlook

Copyright © 2017 Boeing. All rights reserved.
1955-19566 men in 2 Land Rovers
6 months and 6 days

Copyright © 2017 Boeing. All rights reserved.
1979Singapore Airlines Concorde
1 stop, ~9 hoursSOURCE: Steve Fitzgerald - http://www.airliners.net/photo/Singapore-Airlines-(British/Aerospatiale-BAC-Concorde-102/1846825/L/&sid=d64f1a72380ece47cc35c0ad8ca0a598, GFDL 1.2, https://commons.wikimedia.org/w/index.php?curid=16535612

Copyright © 2017 Boeing. All rights reserved.
1997Singapore Airlines 747-400
0 or 1 stop, 13~16 hours

Copyright © 2017 Boeing. All rights reserved.
2017Singapore Airlines 777-300ER
0 stops, 13~14 hours

Copyright © 2017 Boeing. All rights reserved.
SOURCE: ICAO / IATA
Near-record airline profit in 2016
0%
1%
2%
3%
4%
5%
6%
7%
8%
9%
201
0
201
1
201
2
201
3
201
4
201
5
201
6
YT
D 2
01
7
Traffic growth rates (RPKs)
-2%
0%
2%
4%
6%
8%
10%
12%
14%
201
0
201
1
201
2
201
3
201
4
201
5
201
6
YT
D 2
01
7
Cargo growth rates (RTKs)
$0
$5
$10
$15
$20
$25
$30
$35
$40
201
0
201
1
201
2
201
3
201
4
201
5
201
6
201
7 F
Net profit (billions)
T r e n d
20%
Copyright © 2017 Boeing. All rights reserved.
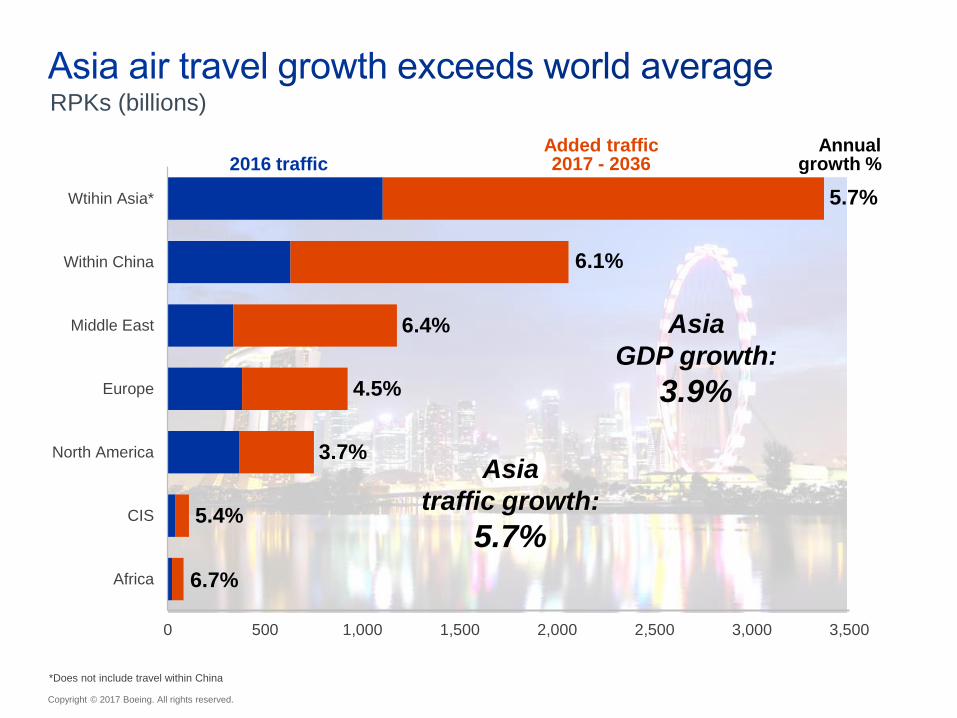
0 500 1,000 1,500 2,000 2,500 3,000 3,500
Wtihin Asia*
Within China
Middle East
Europe
North America
CIS
Africa
RPKs (billions)
*Does not include travel within China
Asia
GDP growth:
3.9%
5.7%
6.4%
4.5%
5.4%
6.7%
6.1%
2016 trafficAdded traffic2017 - 2036
Annualgrowth %
3.7%Asia
traffic growth:
5.7%
Copyright © 2017 Boeing. All rights reserved.
0
300
600
900
1,200
1,500
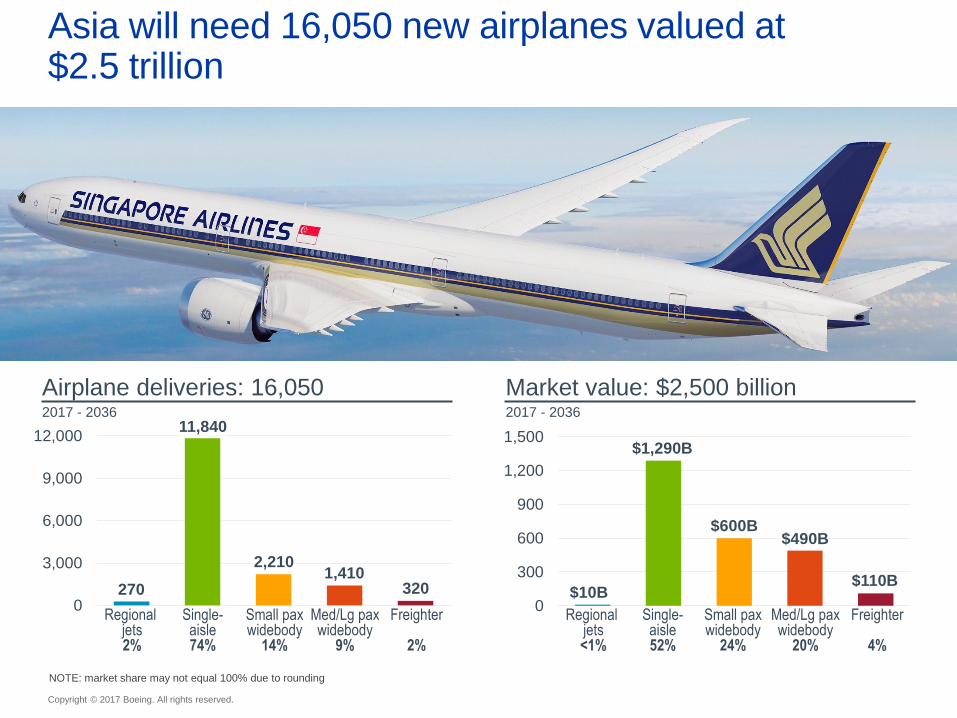
Airplane deliveries: 16,0502017 - 2036
Market value: $2,500 billion2017 - 2036
Regional jets<1%
Single-aisle52%
Small paxwidebody
24%
Freighter
4%
0
3,000
6,000
9,000
12,000
Regional jets2%
Single-aisle74%
Small paxwidebody
14%
Freighter
2%
Med/Lg paxwidebody
9%
Med/Lg paxwidebody
20%
270
11,840
2,210
3201,410
$10B
$1,290B
$600B
$110B
$490B
Asia will need 16,050 new airplanes valued at $2.5 trillion
NOTE: market share may not equal 100% due to rounding

Copyright © 2017 Boeing. All rights reserved.
Available Seat Miles (ASMs)
SOURCE: Boeing CMOs
62%
20% 55%21%
51%
27%
22%
24%18%
LCC Charter/IT Broad Network Other Networks
2026 20362016

Copyright © 2017 Boeing. All rights reserved.
320 new, 630 converted freighters
2017 to 2036Freighters
Delivery units
2016Freighters
330
2036Freighters1,040
Share of fleet
950
0%
20%
40%
60%
80%
100%
480
220
150
100
Large production>80 tonnes
Wide-body conversions40-120 tonnes
Medium wide-body production40-80 tonnes
Standard-body conversions<45 tonnes

Copyright © 2017 Boeing. All rights reserved.
Doubling U.S. growth rate going forward
SOURCES: US Dept of Commerce, FTI Consulting, Internet Retailer, China Daily, GB Times, China Xinhua
0
200
400
600
800
1,000
1,200
1,400
1,600
1,800
2010 2011 2012 2013 2014 2015 2020
49% growth per year
33%45%59%55%54%China on-line retail
sales annual growth
US
A
Ch
ina
15% growth per year15% growth per year
10% growth per year
22% growth per year
E-c
om
me
rce o
nlin
e r
eta
il sa
les, U
SD
bill
ion
s

Copyright © 2017 Boeing. All rights reserved.
25% growth -- express freighter fleet has doubled in just 4 years
* Is 737 Classic
0
10
20
30
40
50
60
70
80
90
100
2006 2007 2008 2009 2010 2011 2012 2013 2014 2015 2016 2017
767
757
737*

Copyright © 2017 Boeing. All rights reserved.
38%
21%
21%
9%
6%3%2%
Commercial Aviation Services: $8.5T2017 - 2036
Services by region2017 - 2036
0
1,000
2,000
3,000
4,000
5,000
Corporate & External
3.0%
Marketing& Planning
4.6%
FlightOps
4.1%
Ground, &Cargo Ops
4.1%
Maintenance& Engineering
4.0%
$125B$465B
$1,080B
$4,485B
$2,305B
$8.5T
CAGR
Asia 3,200 5.2%
North America 1,775 2.7%
Europe 1,765 3.0%
Middle East 730 4.8%
Latin America 530 5.0%
CIS 250 3.4%
Africa 210 4.9%
World Total $8,460 4.1%
Region Services | CAGR

Copyright © 2017 Boeing. All rights reserved.
Uniting for service strength around the globe
Worldwide presence
Robust service capabilities
Efficient performance

Copyright © 2017 Boeing. All rights reserved.
Significant opportunities for growth around the world in the markets we serve
SOURCE: 2017 Boeing Services Market Outlook, Commercial only
SERVICES BY REGION SERVICES BY SEGMENT
$3.2T4.0% CAGR
$3.2T4.0% CAGR
Asia Pacific
Latin America
North America
Europe
Middle East
CIS Africa
Maintenance, Engineering, &
Upgrades71%
Training & Prof. Svrcs
4%
Information Services
25%

Copyright © 2017 Boeing. All rights reserved.
5.2%
5.0%
2.7%
3.0%
4.8%
3.4%
4.9%
4.1%
0% 1% 2% 3% 4% 5% 6%
Asia Pacific
Latin America
North America
Europe
Middle East
CIS
Africa
World
Compound Annual Growth Rate
InformationServices, 6%
Training & PilotServices, 2%
Maintenance & Engineering, 24%
Ground Handling, 56%
CabinServices, 9%
Marketing &Planning, 3%
Sales
Copyright © 2017 Boeing. All rights reserved.
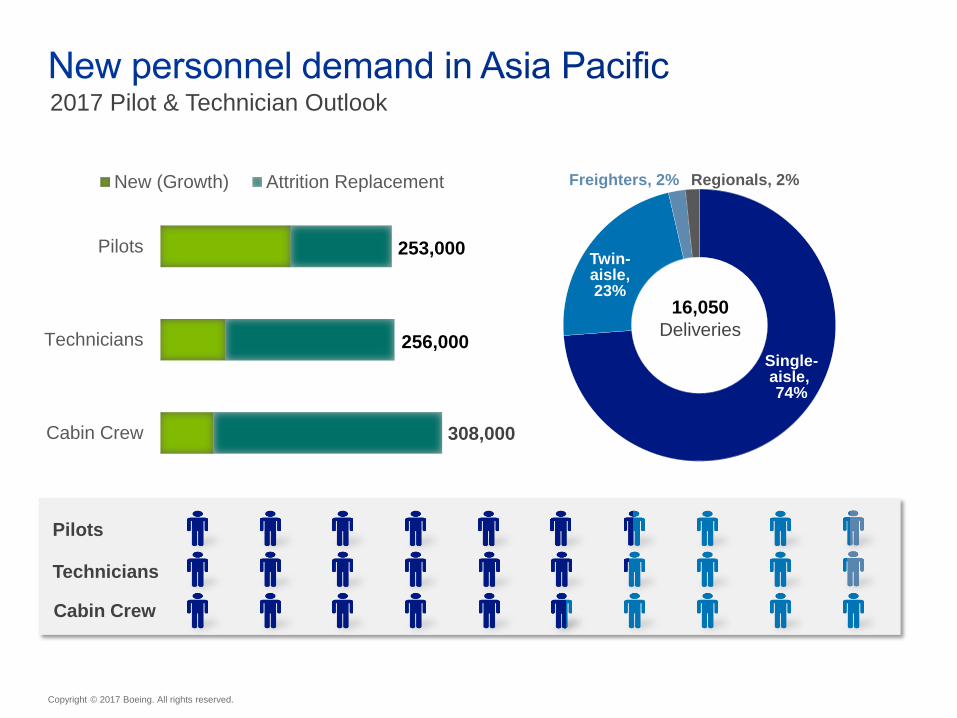
2017 Pilot & Technician Outlook
Cabin Crew
Technicians
Pilots
New (Growth) Attrition Replacement
253,000
256,000Single-aisle, 74%
Twin-aisle,23%
Freighters, 2% Regionals, 2%
16,050
Deliveries
Pilots
Technicians
Cabin Crew
308,000

Copyright © 2017 Boeing. All rights reserved.
Bringing training closer to our customers around the world
Copyright © 2017 Boeing. All rights reserved.
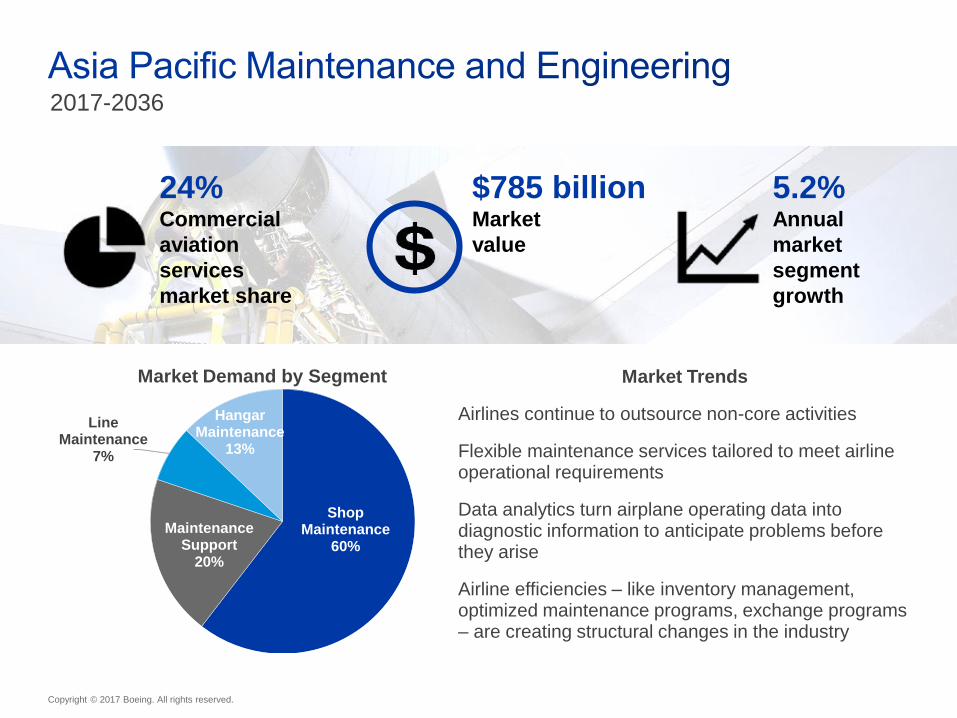
Market Trends
Airlines continue to outsource non-core activities
Flexible maintenance services tailored to meet airline operational requirements
Data analytics turn airplane operating data into diagnostic information to anticipate problems before they arise
Airline efficiencies – like inventory management, optimized maintenance programs, exchange programs – are creating structural changes in the industry
2017-2036
Shop Maintenance
60%
Maintenance Support
20%
LineMaintenance
7%
Hangar Maintenance
13%
Market Demand by Segment
24%Commercial
aviation
services
market share
$785 billionMarket
value
5.2%Annual
market
segment
growth

Copyright © 2017 Boeing. All rights reserved.
2017Singapore Airlines 777-300ER
0 stops ~ 13.67 hours

Copyright © 2017 Boeing. All rights reserved.

Copyright © 2017 Boeing. All rights reserved.