Embed Size (px)
Citation preview

1
Published sePtember 2017
asia MoneyMinded iMpact RepoRt 2016

2
MoneyMinded in Asia, Impact Report 2016
National University of Singapore, Chua Thian Poh Community Leadership Programme
Professor Albert Teo
Goh Si Wei

3
FoReWoRd
I am pleased to share with you this latest report of the effectiveness of MoneyMinded in four key countries across Southeast Asia: Cambodia, Indonesia, Philippines and Singapore.
Since 2003, MoneyMinded (ANZ’s flagship adult financial education program) has helped more than 420,000 people across Australia, New Zealand, Asia and the Pacific build money management skills, knowledge and confidence.
ANZ is one of many financial organisations in the SE Asian region that have committed to the principles of financial inclusion. We are happy to present this comprehensive overview of MoneyMinded’s impact to inform the dialogue, programs and policy of various stakeholders with this common aim.
MoneyMinded in Southeast Asia aims to improve financial knowledge, attitudes, and behaviour in students, young adults, women, and people with a disability.
In a program with global reach, it is important to understand inter-country and intra-country differences. This report applies a helpful financial literacy index to categorise effects related to financial knowledge, attitudes, or behaviour which are common to all participants, regardless of their culture or local context.
We’re delighted with this evidence confirming that MoneyMinded was effective in improving participants’ money management abilities, financial knowledge, and forward planning abilities. Importantly, participants reported an increase in overall wellbeing and positive impacts for their extended family and community.
A focus on the financial wellbeing of people with a disability is appropriate in line with ANZ’s commitment to accessibility in all aspects of our business. In the Philippines, MoneyMinded modules were, for the very first time, conducted in sign language. We have learned much about the particular accessibility challenges faced by many in our community and are encouraged by the positive effect of increased financial literacy and empowerment of participants in this group.
Thanks to the many partners and facilitators who have used MoneyMinded to such great effect across South East Asia. Their efforts have ensured that MoneyMinded has been successful in strengthening financial wellbeing, in turn leading to greater participation in social and economic life for participants.
Michelle CommandeurHead of Financial InclusionANZ
4
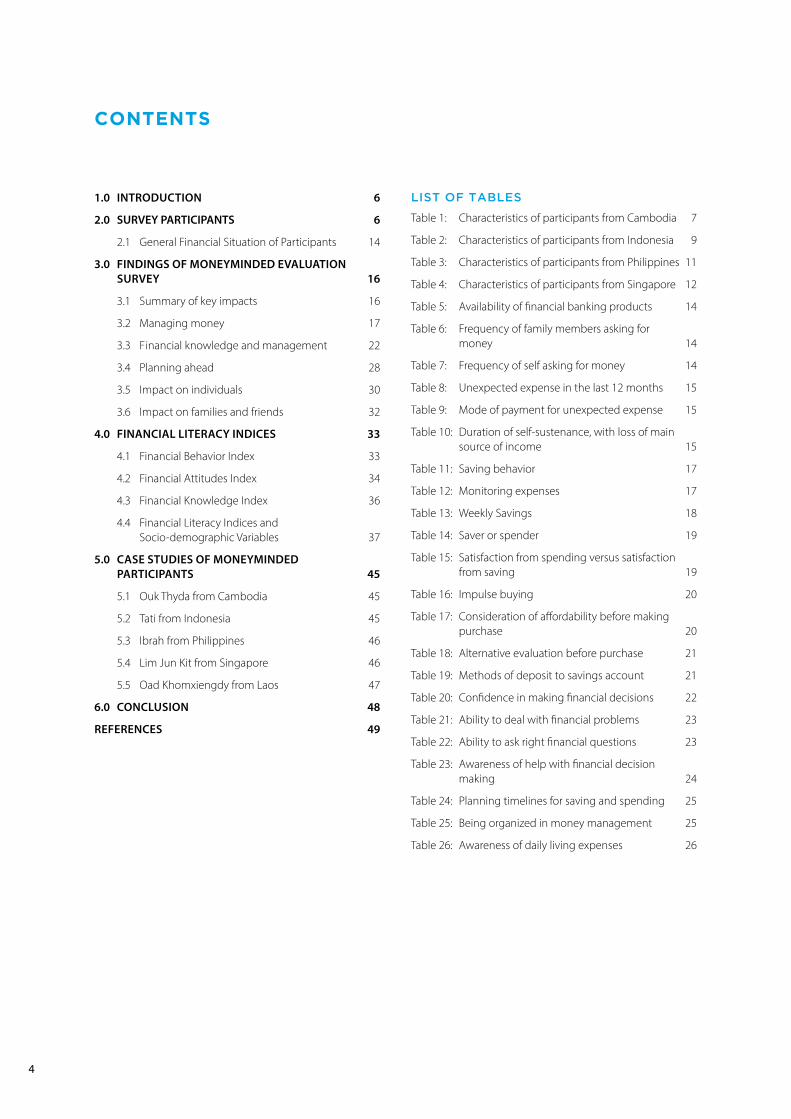
contents
list of tables
Table 1: Characteristics of participants from Cambodia 7
Table 2: Characteristics of participants from Indonesia 9
Table 3: Characteristics of participants from Philippines 11
Table 4: Characteristics of participants from Singapore 12
Table 5: Availability of financial banking products 14
Table 6: Frequency of family members asking for money 14
Table 7: Frequency of self asking for money 14
Table 8: Unexpected expense in the last 12 months 15
Table 9: Mode of payment for unexpected expense 15
Table 10: Duration of self-sustenance, with loss of main source of income 15
Table 11: Saving behavior 17
Table 12: Monitoring expenses 17
Table 13: Weekly Savings 18
Table 14: Saver or spender 19
Table 15: Satisfaction from spending versus satisfaction from saving 19
Table 16: Impulse buying 20
Table 17: Consideration of affordability before making purchase 20
Table 18: Alternative evaluation before purchase 21
Table 19: Methods of deposit to savings account 21
Table 20: Confidence in making financial decisions 22
Table 21: Ability to deal with financial problems 23
Table 22: Ability to ask right financial questions 23
Table 23: Awareness of help with financial decision making 24
Table 24: Planning timelines for saving and spending 25
Table 25: Being organized in money management 25
Table 26: Awareness of daily living expenses 26
1.0 IntRoductIon 6
2.0 SuRVEY PARtIcIPAntS 6
2.1 General Financial Situation of Participants 14
3.0 FIndIngS oF MonEYMIndEd EVAluAtIon SuRVEY 16
3.1 Summary of key impacts 16
3.2 Managing money 17
3.3 F inancial knowledge and management 22
3.4 Planning ahead 28
3.5 Impact on individuals 30
3.6 Impact on families and friends 32
4.0 FInAncIAl lItERAcY IndIcES 33
4.1 Financial Behavior Index 33
4.2 Financial Attitudes Index 34
4.3 Financial Knowledge Index 36
4.4 Financial Literacy Indices and Socio-demographic Variables 37
5.0 cASE StudIES oF MonEYMIndEd PARtIcIPAntS 45
5.1 Ouk Thyda from Cambodia 45
5.2 Tati from Indonesia 45
5.3 Ibrah from Philippines 46
5.4 Lim Jun Kit from Singapore 46
5.5 Oad Khomxiengdy from Laos 47
6.0 concluSIon 48
REFEREncES 49

5
Table 27: Ability to cope with unexpected expenses 26
Table 28: Availability of money for emergencies 27
Table 29: Shortage of money 27
Table 30: Money left over 28
Table 31: Planning ahead 28
Table 32: Setting financial goals 29
Table 33: Impact of financial management on future 30
Table 34: Impact of MoneyMinded on individuals 31
Table 35: Impact of MoneyMinded on personal well-being 32
Table 36: Impact of MoneyMinded on family and friends 32
Table 37: Creating a financial behavior index 33
Table 38: Creating a financial attitudes index 35
Table 39. Creating a financial knowledge index 36
Table 40. Income classification by country 42
list of fiGures
Figure 1. Average Financial Behavior Index Score by Country 34
Figure 2. Financial Behavior Index Score Distribution by Country 34
Figure 3. Average Financial Attitudes Index Score by Country 35
Figure 4. Financial Attitudes Index Score Distribution by Country 36
Figure 5. Average Financial Knowledge Index Score by Country 37
Figure 6. Financial Knowledge Index Score Distribution by Country 37
Figure 7. Average Financial Behaviour Index Score by Gender 38
Figure 8. Average Financial Attitudes Index Score by Gender 38
Figure 9. Average Financial Knowledge Index Score by Gender 39
Figure 10. Average Financial Behaviour Index Score by Age 39
Figure 11. Average Financial Attitudes Index Score by Age 40
Figure 12. Average Financial Knowledge Index Score by Age 40
Figure 13. Average Financial Behavior Index Score by Education 41
Figure 14. Average Financial Attitudes Index Score by Education 41
Figure 15. Average Financial Knowledge Index Score by Education 42
Figure 17. Average Financial Behaviour Index Score by Income 43
Figure 18. Average Financial Attitudes Index Score by Income 44
Figure 19. Average Financial Knowledge Index Score by Income 44

6
1.0 intRoduction
Financial literacy can be defined as “a combination of awareness, knowledge, skill, attitude, and behaviour necessary to make sound financial decisions and ultimately achieve individual financial well-being” (OECD, 2011). Following the global financial crisis in 2007 – 2008, improving financial literacy emerged as a global economic imperative given that the global financial crisis was a result of reckless and risky behaviour in financial markets (Anantha-Nageswaran, 2008). At present, economic growth in East Asia is expected to be resilient and regional poverty is expected to decline (World Bank, 2017). However, these positive prospects are threatened by regional vulnerabilities such as global financial tightening arising from increasing global protectionism (World Bank, 2017). In this context, financial literacy becomes an important ingredient for long-term economic stability in the region and financial well-being for households (Yoshino et al., 2015). To that end, various financial organizations have initiated financial education programmes targeting subpopulations perceived as economically vulnerable in Southeast Asia. One example is MoneyMinded, a comprehensive suite of financial education resources that has been developed by ANZ and used to improve financial knowledge, attitudes, and behaviour in students, young adults, women, and people with disabilities (PWDs). Since 2010, the programme has been offered annually in Asia Pacific, and is delivered directly by local ANZ staff.
The first section of this paper presents the findings of the MoneyMinded Evaluation Survey (2016) for 4 Southeast Asian countries: Cambodia, Indonesia, Philippines, and Singapore. This section provides a comprehensive overview of MoneyMinded’s impact on participants and reports participant responses to specific questions. Given that financial literacy is reflected in an individual’s financial knowledge, attitudes, and behaviour, the second section of the paper presents inter-country and intra-country comparisons using a financial literacy index comprising three sub-indices. Through factor analysis, questions from the MoneyMinded Evaluation Survey are categorized under financial knowledge, attitudes, or behaviour. This section of the paper thus seeks to:
1. evaluate baseline financial literacy in the 4 countries;
2. investigate inter-country variations in financial literacy, so that future runs of MoneyMinded can be tailored to country-specific requirements
3. investigate intra-country variations in financial literacy, so that future runs of MoneyMinded can be tailored to specific socio-demographic requirements.
2.0 suRvey paRticipants
As can be seen in Tables 1, 2, 3, and 4, the participants from the respective countries had the following characteristics:
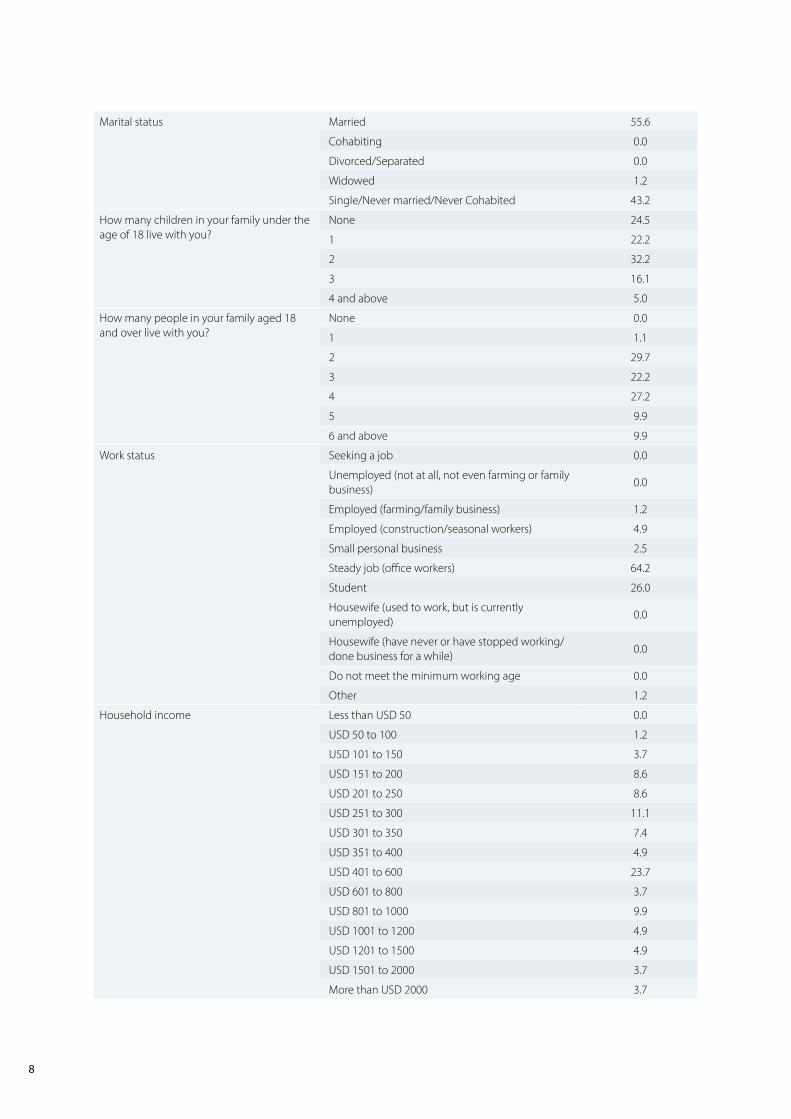
Cambodia (81 PartiCiPants)
• The majority (60.5%) were female.
• 51.9% of the participants were 35 years old and below.
• 55.6% of the participants had tertiary education or higher.
• 55.6% of the participants were married.
• The majority had two (29.7%), three (22.2%), or four (27.2%) adults, and zero (24.5%), one (22.2%), or two (32.2%) children living in their households.
• The majority (64.2%) had a steady job as an office worker, with students (26.0%) comprising the second largest category.
• 61.7% of the participants indicated that their households had regular income; and 69.2% of the participants indicated that their households had a monthly household income that fell within the range of 600 USD and below.
• 63.0% of the participants were involved in making day-to-day decisions on money in their households, with 24.7% bearing sole responsibility.
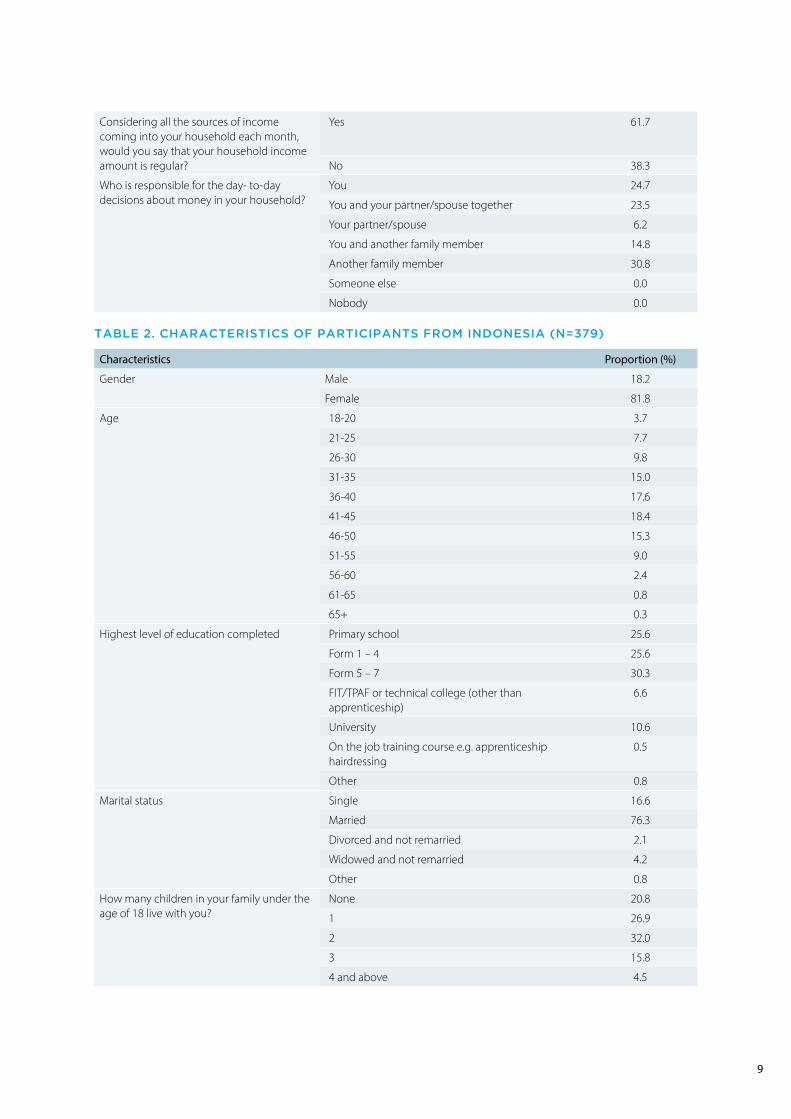
indonesia (379 PartiCiPants)
• The majority (81.8%) were female.
• 75.3% of the participants were considered middle-aged (31 – 55 years old).
• Secondary education was the highest education level attained by the majority (55.9%).
• 56.6% of the participants were self-employed, while 20.1% were in paid employment.
• 76.3% of the participants were married.
• The majority had 1 (30.0%), 2 (27.7%), or 3 (20.6%) adults, and 0 (20.8%), 1 (26.9%), or 2 (32.0%) children living in their households.
• The majority (57.8%) had a monthly household income in the range of IDR 1,500,001 to IDR 5,000,000
• 91.0% of the participants were involved in making day-to-day decisions on money in their households, with 64.6% bearing sole responsibility.
7
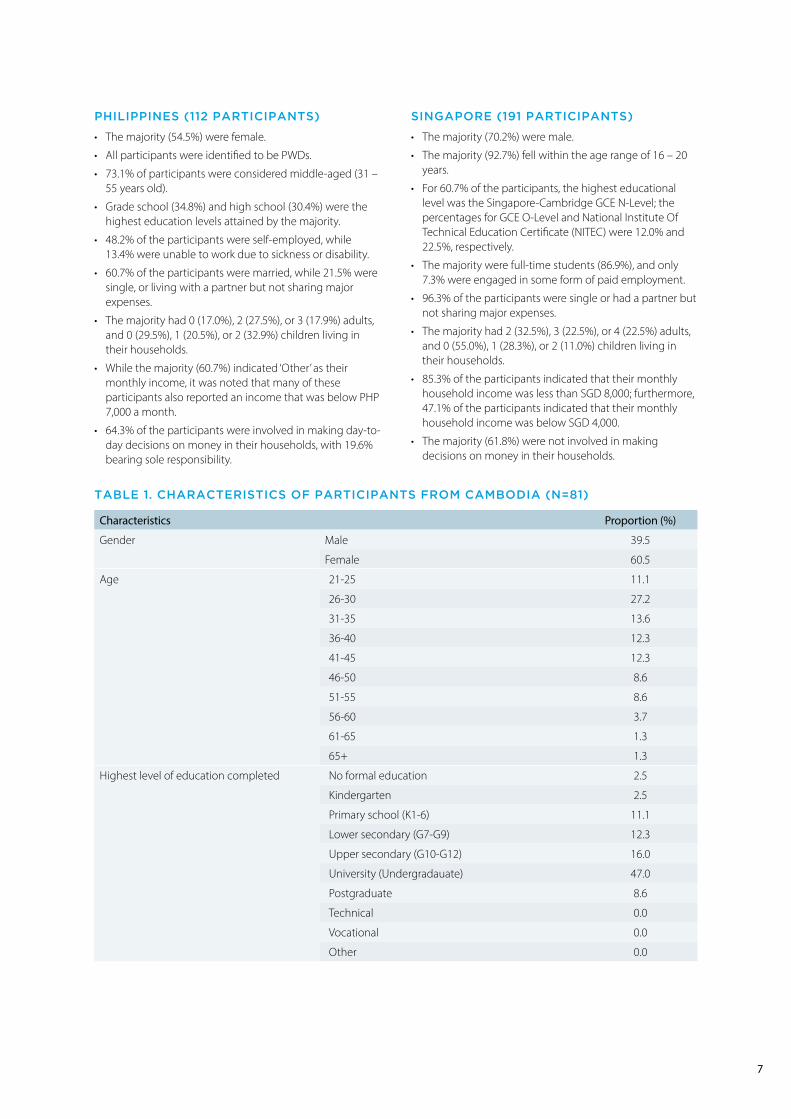
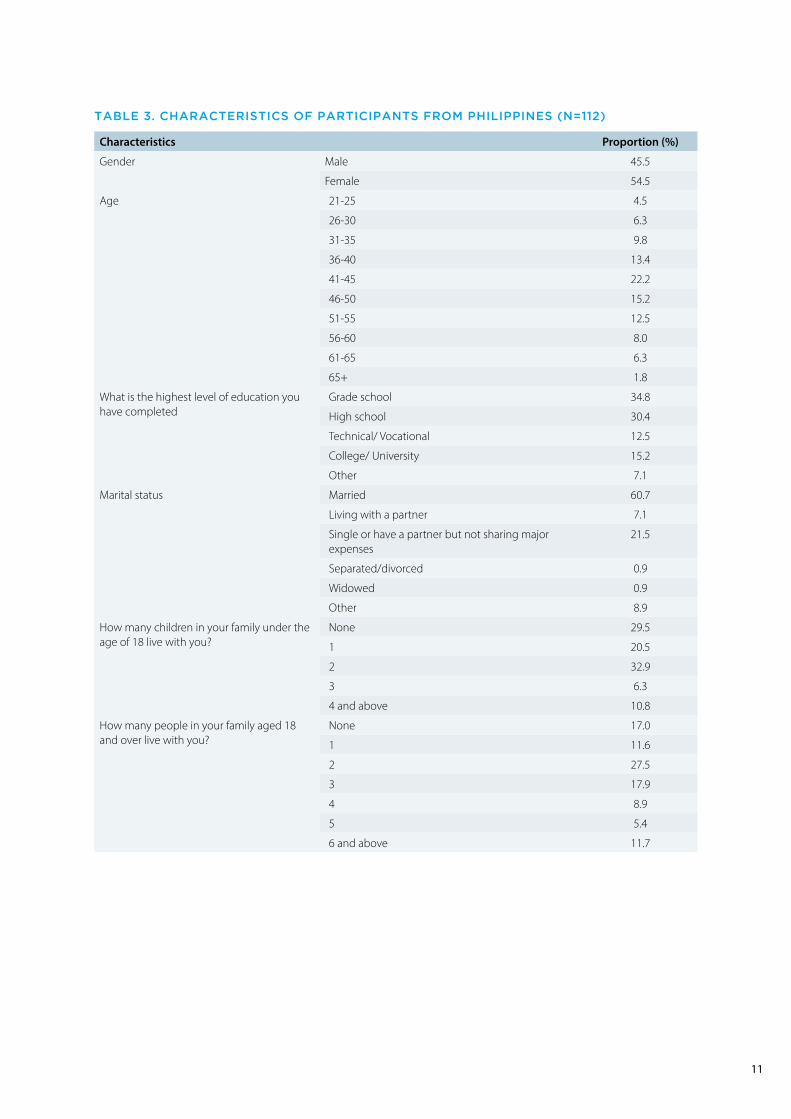
PhiliPPines (112 PartiCiPants)
• The majority (54.5%) were female.
• All participants were identified to be PWDs.
• 73.1% of participants were considered middle-aged (31 – 55 years old).
• Grade school (34.8%) and high school (30.4%) were the highest education levels attained by the majority.
• 48.2% of the participants were self-employed, while 13.4% were unable to work due to sickness or disability.
• 60.7% of the participants were married, while 21.5% were single, or living with a partner but not sharing major expenses.
• The majority had 0 (17.0%), 2 (27.5%), or 3 (17.9%) adults, and 0 (29.5%), 1 (20.5%), or 2 (32.9%) children living in their households.
• While the majority (60.7%) indicated ‘Other’ as their monthly income, it was noted that many of these participants also reported an income that was below PHP 7,000 a month.
• 64.3% of the participants were involved in making day-to-day decisions on money in their households, with 19.6% bearing sole responsibility.
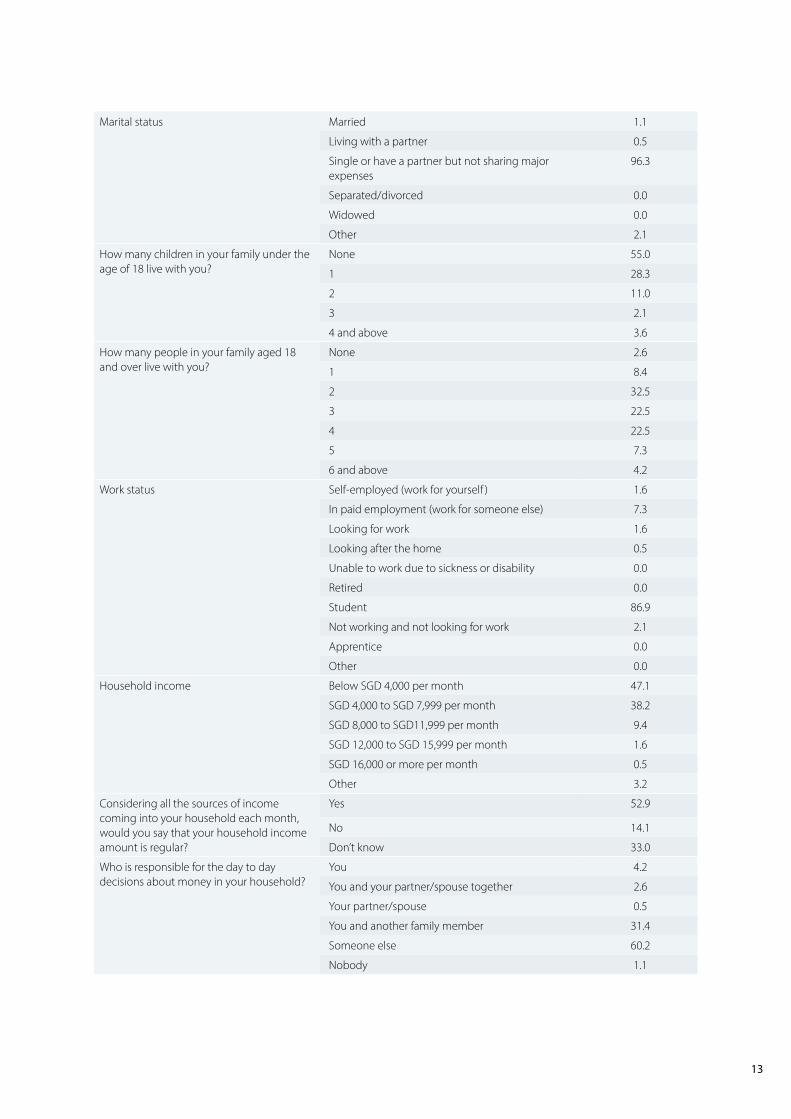
sinGaPore (191 PartiCiPants)
• The majority (70.2%) were male.
• The majority (92.7%) fell within the age range of 16 – 20 years.
• For 60.7% of the participants, the highest educational level was the Singapore-Cambridge GCE N-Level; the percentages for GCE O-Level and National Institute Of Technical Education Certificate (NITEC) were 12.0% and 22.5%, respectively.
• The majority were full-time students (86.9%), and only 7.3% were engaged in some form of paid employment.
• 96.3% of the participants were single or had a partner but not sharing major expenses.
• The majority had 2 (32.5%), 3 (22.5%), or 4 (22.5%) adults, and 0 (55.0%), 1 (28.3%), or 2 (11.0%) children living in their households.
• 85.3% of the participants indicated that their monthly household income was less than SGD 8,000; furthermore, 47.1% of the participants indicated that their monthly household income was below SGD 4,000.
• The majority (61.8%) were not involved in making decisions on money in their households.
table 1. CharaCteristiCs of PartiCiPants from Cambodia (n=81)
Characteristics Proportion (%)
Gender Male 39.5
Female 60.5
Age 21-25 11.1
26-30 27.2
31-35 13.6
36-40 12.3
41-45 12.3
46-50 8.6
51-55 8.6
56-60 3.7
61-65 1.3
65+ 1.3
Highest level of education completed No formal education 2.5
Kindergarten 2.5
Primary school (K1-6) 11.1
Lower secondary (G7-G9) 12.3
Upper secondary (G10-G12) 16.0
University (Undergradauate) 47.0
Postgraduate 8.6
Technical 0.0
Vocational 0.0
Other 0.0
8
Marital status Married 55.6
Cohabiting 0.0
Divorced/Separated 0.0
Widowed 1.2
Single/Never married/Never Cohabited 43.2
How many children in your family under the age of 18 live with you?
None 24.5
1 22.2
2 32.2
3 16.1
4 and above 5.0
How many people in your family aged 18 and over live with you?
None 0.0
1 1.1
2 29.7
3 22.2
4 27.2
5 9.9
6 and above 9.9
Work status Seeking a job 0.0
Unemployed (not at all, not even farming or family business)
0.0
Employed (farming/family business) 1.2
Employed (construction/seasonal workers) 4.9
Small personal business 2.5
Steady job (office workers) 64.2
Student 26.0
Housewife (used to work, but is currently unemployed)
0.0
Housewife (have never or have stopped working/done business for a while)
0.0
Do not meet the minimum working age 0.0
Other 1.2
Household income Less than USD 50 0.0
USD 50 to 100 1.2
USD 101 to 150 3.7
USD 151 to 200 8.6
USD 201 to 250 8.6
USD 251 to 300 11.1
USD 301 to 350 7.4
USD 351 to 400 4.9
USD 401 to 600 23.7
USD 601 to 800 3.7
USD 801 to 1000 9.9
USD 1001 to 1200 4.9
USD 1201 to 1500 4.9
USD 1501 to 2000 3.7
More than USD 2000 3.7
9
Considering all the sources of income coming into your household each month, would you say that your household income amount is regular?
Yes 61.7
No 38.3
Who is responsible for the day- to-day decisions about money in your household?
You 24.7
You and your partner/spouse together 23.5
Your partner/spouse 6.2
You and another family member 14.8
Another family member 30.8
Someone else 0.0
Nobody 0.0
table 2. CharaCteristiCs of PartiCiPants from indonesia (n=379)
Characteristics Proportion (%)
Gender Male 18.2
Female 81.8
Age 18-20 3.7
21-25 7.7
26-30 9.8
31-35 15.0
36-40 17.6
41-45 18.4
46-50 15.3
51-55 9.0
56-60 2.4
61-65 0.8
65+ 0.3
Highest level of education completed Primary school 25.6
Form 1 – 4 25.6
Form 5 – 7 30.3
FIT/TPAF or technical college (other than apprenticeship)
6.6
University 10.6
On the job training course e.g. apprenticeship hairdressing
0.5
Other 0.8
Marital status Single 16.6
Married 76.3
Divorced and not remarried 2.1
Widowed and not remarried 4.2
Other 0.8
How many children in your family under the age of 18 live with you?
None 20.8
1 26.9
2 32.0
3 15.8
4 and above 4.5

10
How many people in your family aged 18 and over live with you?
None 6.3
1 30.0
2 27.7
3 20.6
4 9.5
5 2.4
6 and above 3.5
Work status Self-employed (work for yourself ) 56.6
In paid employment (work for someone else) 20.1
Looking for work 6.1
Looking after the home 0.5
Unable to work due to sickness or disability 10.0
Retired 0.0
Student 0.3
Not working and not looking for work 3.2
Apprentice 1.1
Other 2.1
Household income < IDR 600,000 9.2
IDR 600,001 – 1,500,000 15.6
IDR 1,500,001 – 2,500,000 20.6
IDR 2,500,001 – 5,000,000 37.2
IDR 5,000,001 – 10,000,000 11.3
> IDR 10,000,000 6.1
Considering all the sources of income coming into your household each month, would you say that your household income amount is regular?
Yes59.8
No 38.8
Don’t know 1.4
Who is responsible for the day- to-day decisions about money in your household?
You 64.6
You and your partner/spouse together 21.9
Your partner/spouse 7.9
You and another family member 4.5
Another family member 1.1
Someone else 0.0
Nobody 0.0
11
table 3. CharaCteristiCs of PartiCiPants from PhiliPPines (n=112)
characteristics Proportion (%)
Gender Male 45.5
Female 54.5
Age 21-25 4.5
26-30 6.3
31-35 9.8
36-40 13.4
41-45 22.2
46-50 15.2
51-55 12.5
56-60 8.0
61-65 6.3
65+ 1.8
What is the highest level of education you have completed
Grade school 34.8
High school 30.4
Technical/ Vocational 12.5
College/ University 15.2
Other 7.1
Marital status Married 60.7
Living with a partner 7.1
Single or have a partner but not sharing major expenses
21.5
Separated/divorced 0.9
Widowed 0.9
Other 8.9
How many children in your family under the age of 18 live with you?
None 29.5
1 20.5
2 32.9
3 6.3
4 and above 10.8
How many people in your family aged 18 and over live with you?
None 17.0
1 11.6
2 27.5
3 17.9
4 8.9
5 5.4
6 and above 11.7

12
Work status Self-employed (work for yourself ) 48.2
In paid employment (work for someone else) 5.4
Looking for work 9.8
Looking after the home 7.1
Unable to work due to sickness or disability 13.4
Retired 0.9
Student 2.7
Not working and not looking for work 3.6
Apprentice 0.0
Other 8.9
Household income Between PHP 7,000 and PHP 15,000 per year 32.1
Between P15,001 and P25,000 per year 6.3
Between P25,001 and P45,000 per year 0.9
Over P45,000 per year 0.0
Other 60.7
Considering all the sources of income coming into your household each month, would you say that your household income amount is regular?
Yes 22.3
No 72.3
Don’t know 5.4
Who is responsible for the day to day decisions about money in your household?
You 19.6
You and your partner/spouse together 32.2
Your partner/spouse 11.6
You and another family member 12.5
Another family member 21.4
Someone else 0.0
Nobody 2.7
table 4. CharaCteristiCs of PartiCiPants from sinGaPore (n=191)
characteristics Proportion (%)
Gender Male 70.2
Female 29.8
Age 16-20 92.7
21-25 6.3
26-30 1.0
31-35 0.0
36-40 0.0
40 and Above 0.0
What is the highest level of education you have completed
Primary School 1.1
‘N’ Levels 60.7
‘O’ Levels 12.0
NITEC 22.5
Polytechnic 1.1
On the job training 0.0
University 0.0
Others 2.6
13
Marital status Married 1.1
Living with a partner 0.5
Single or have a partner but not sharing major expenses
96.3
Separated/divorced 0.0
Widowed 0.0
Other 2.1
How many children in your family under the age of 18 live with you?
None 55.0
1 28.3
2 11.0
3 2.1
4 and above 3.6
How many people in your family aged 18 and over live with you?
None 2.6
1 8.4
2 32.5
3 22.5
4 22.5
5 7.3
6 and above 4.2
Work status Self-employed (work for yourself ) 1.6
In paid employment (work for someone else) 7.3
Looking for work 1.6
Looking after the home 0.5
Unable to work due to sickness or disability 0.0
Retired 0.0
Student 86.9
Not working and not looking for work 2.1
Apprentice 0.0
Other 0.0
Household income Below SGD 4,000 per month 47.1
SGD 4,000 to SGD 7,999 per month 38.2
SGD 8,000 to SGD11,999 per month 9.4
SGD 12,000 to SGD 15,999 per month 1.6
SGD 16,000 or more per month 0.5
Other 3.2
Considering all the sources of income coming into your household each month, would you say that your household income amount is regular?
Yes 52.9
No 14.1
Don’t know 33.0
Who is responsible for the day to day decisions about money in your household?
You 4.2
You and your partner/spouse together 2.6
Your partner/spouse 0.5
You and another family member 31.4
Someone else 60.2
Nobody 1.1

14
2.1 General finanCial situation of PartiCiPants
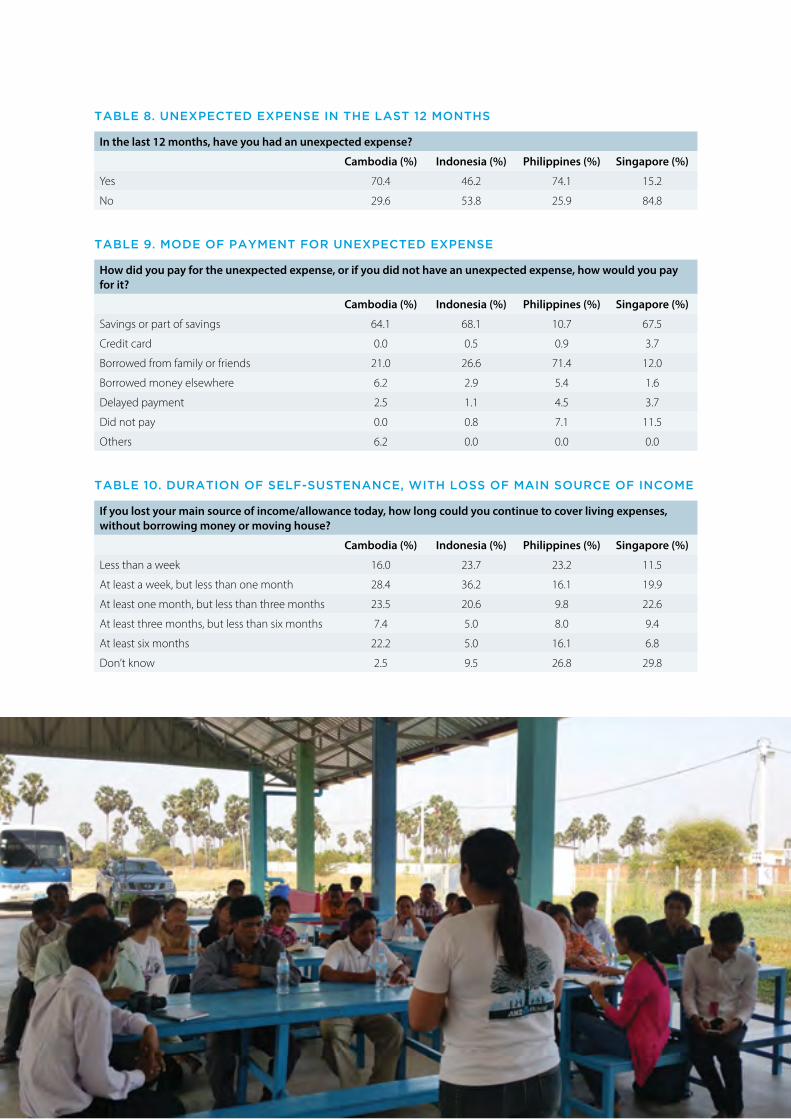
The majority of participants from Cambodia (64.1%), Indonesia (68.1%), and Singapore (67.5%), indicated savings as the main mode of payment for unexpected and non-unexpected expenses, while the majority of participants from Philippines (71.4%) indicated borrowing from relatives and friends as the main mode of payment for unexpected and non-unexpected expense (see Table 9).
When asked to indicate the duration of self-sustenance following a loss of income, 67.9%, 80.5%, 49.1%, and 54.0% of participants from Cambodia, Indonesia, Philippines, and Singapore, respectively, indicated a self-sustenance period of less than 3 months (see Table 10).
The majority of participants from Cambodia (53.1%), Philippines (59.9%), and Singapore (73.3%) never or rarely faced requests for money from their family members, while 47.2% of participants from Indonesia occasionally faced requests for money from their family members (see Table 6). Conversely, 38.2% of participants from Cambodia, 61.2% of participants from Indonesia, 45.6% of participants from Philippines, and 20.9% of participants from Singapore never or rarely asked for money from family members (see Table 7).
The majority of participants from Cambodia (70.4%) and Philippines (74.1%) indicated an unexpected expense in the last 12 months, while the majority of participants from Singapore (84.8%) and Indonesia (53.8%) indicated no unexpected expense in the last 12 months (see Table 8).
table 5. aVailabilitY of finanCial banKinG ProduCts
do you have any of the following types of financial banking products?a
cambodia (%) Indonesia (%) Philippines (%) Singapore (%)
Transaction account 18.5 46.2 9.8 33.0
Savings account 21.0 54.4 0.9 67.0
Mortgage 12.3 45.6 0.9 0.0
Credit card 2.5 6.3 0.9 14.1
Retirement fund 2.5 3.4 1.8 1.1
Personal loan or car loan 14.8 4.0 2.7 0.0
Insurance 23.5 38.8 0.9 12.6
Debit card 43.2 16.4 1.8 35.1
Mobile phone payment account or internet payment
6.2 1.6 13.4 12.6
a. Multiple responses allowed
table 6. freQuenCY of familY members asKinG for moneY
How often do other family members (not including your spouse or children) ask you for money?
cambodia (%) Indonesia (%) Philippines (%) Singapore (%)
Never/Rarely (about once a year) 53.1 41.5 59.9 73.3
Occasionally (about once a month) 18.5 47.2 20.5 22.0
Regularly (about every two weeks) 27.2 6.6 7.1 2.6
Frequently (every week) 1.2 4.7 12.5 2.1
table 7. freQuenCY of self asKinG for moneY
How often do you ask other family members (not including your spouse or children) for money?
cambodia (%) Indonesia (%) Philippines (%) Singapore (%)
Never/Rarely (about once a year) 38.2 61.2 45.6 20.9
Occasionally (about once a month) 27.2 31.4 34.8 34.6
Regularly (about every two weeks) 32.1 4.5 9.8 13.6
Frequently (every week) 2.5 2.9 9.8 30.9
15
table 8. uneXPeCted eXPense in the last 12 months
In the last 12 months, have you had an unexpected expense?
cambodia (%) Indonesia (%) Philippines (%) Singapore (%)
Yes 70.4 46.2 74.1 15.2
No 29.6 53.8 25.9 84.8
table 9. mode of PaYment for uneXPeCted eXPense
How did you pay for the unexpected expense, or if you did not have an unexpected expense, how would you pay for it?
cambodia (%) Indonesia (%) Philippines (%) Singapore (%)
Savings or part of savings 64.1 68.1 10.7 67.5
Credit card 0.0 0.5 0.9 3.7
Borrowed from family or friends 21.0 26.6 71.4 12.0
Borrowed money elsewhere 6.2 2.9 5.4 1.6
Delayed payment 2.5 1.1 4.5 3.7
Did not pay 0.0 0.8 7.1 11.5
Others 6.2 0.0 0.0 0.0
table 10. duration of self-sustenanCe, With loss of main sourCe of inCome
If you lost your main source of income/allowance today, how long could you continue to cover living expenses, without borrowing money or moving house?
cambodia (%) Indonesia (%) Philippines (%) Singapore (%)
Less than a week 16.0 23.7 23.2 11.5
At least a week, but less than one month 28.4 36.2 16.1 19.9
At least one month, but less than three months 23.5 20.6 9.8 22.6
At least three months, but less than six months 7.4 5.0 8.0 9.4
At least six months 22.2 5.0 16.1 6.8
Don’t know 2.5 9.5 26.8 29.8
16
3.0 Findings oF MoneyMinded evaluation suRvey
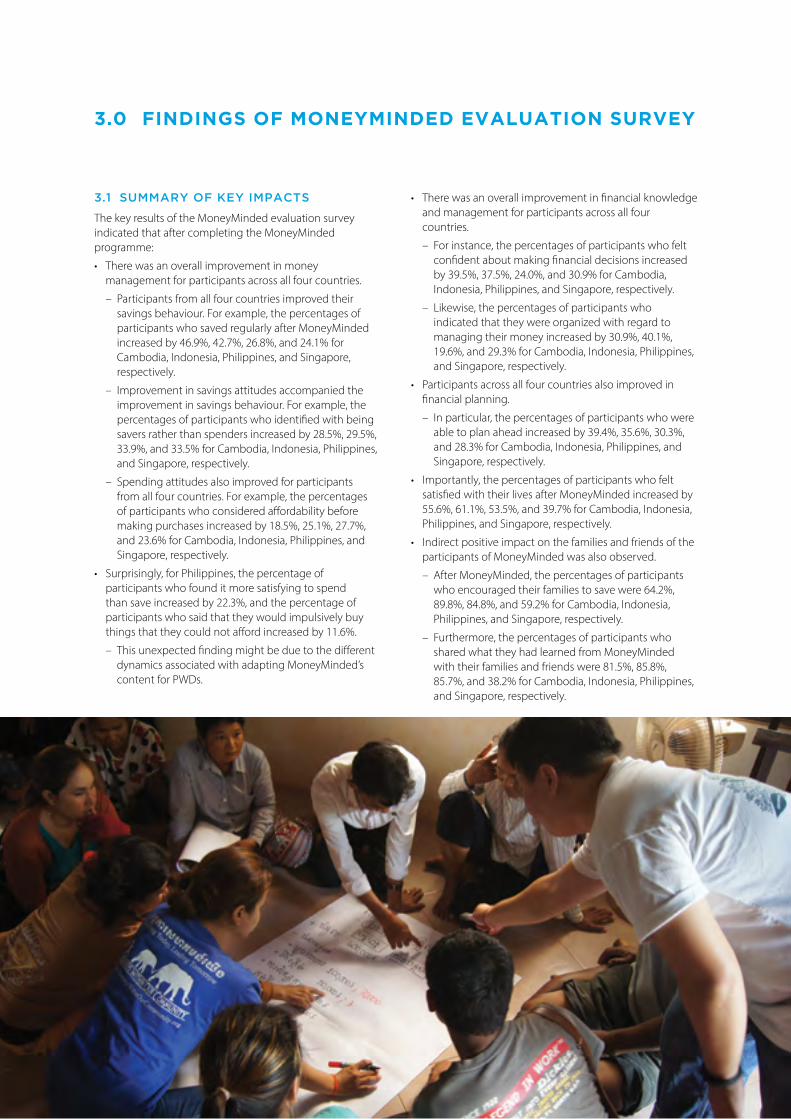
3.1 summarY of KeY imPaCts
The key results of the MoneyMinded evaluation survey indicated that after completing the MoneyMinded programme:
• There was an overall improvement in money management for participants across all four countries.
– Participants from all four countries improved their savings behaviour. For example, the percentages of participants who saved regularly after MoneyMinded increased by 46.9%, 42.7%, 26.8%, and 24.1% for Cambodia, Indonesia, Philippines, and Singapore, respectively.
– Improvement in savings attitudes accompanied the improvement in savings behaviour. For example, the percentages of participants who identified with being savers rather than spenders increased by 28.5%, 29.5%, 33.9%, and 33.5% for Cambodia, Indonesia, Philippines, and Singapore, respectively.
– Spending attitudes also improved for participants from all four countries. For example, the percentages of participants who considered affordability before making purchases increased by 18.5%, 25.1%, 27.7%, and 23.6% for Cambodia, Indonesia, Philippines, and Singapore, respectively.
• Surprisingly, for Philippines, the percentage of participants who found it more satisfying to spend than save increased by 22.3%, and the percentage of participants who said that they would impulsively buy things that they could not afford increased by 11.6%.
– This unexpected finding might be due to the different dynamics associated with adapting MoneyMinded’s content for PWDs.
• There was an overall improvement in financial knowledge and management for participants across all four countries.
– For instance, the percentages of participants who felt confident about making financial decisions increased by 39.5%, 37.5%, 24.0%, and 30.9% for Cambodia, Indonesia, Philippines, and Singapore, respectively.
– Likewise, the percentages of participants who indicated that they were organized with regard to managing their money increased by 30.9%, 40.1%, 19.6%, and 29.3% for Cambodia, Indonesia, Philippines, and Singapore, respectively.
• Participants across all four countries also improved in financial planning.
– In particular, the percentages of participants who were able to plan ahead increased by 39.4%, 35.6%, 30.3%, and 28.3% for Cambodia, Indonesia, Philippines, and Singapore, respectively.
• Importantly, the percentages of participants who felt satisfied with their lives after MoneyMinded increased by 55.6%, 61.1%, 53.5%, and 39.7% for Cambodia, Indonesia, Philippines, and Singapore, respectively.
• Indirect positive impact on the families and friends of the participants of MoneyMinded was also observed.
– After MoneyMinded, the percentages of participants who encouraged their families to save were 64.2%, 89.8%, 84.8%, and 59.2% for Cambodia, Indonesia, Philippines, and Singapore, respectively.
– Furthermore, the percentages of participants who shared what they had learned from MoneyMinded with their families and friends were 81.5%, 85.8%, 85.7%, and 38.2% for Cambodia, Indonesia, Philippines, and Singapore, respectively.
17
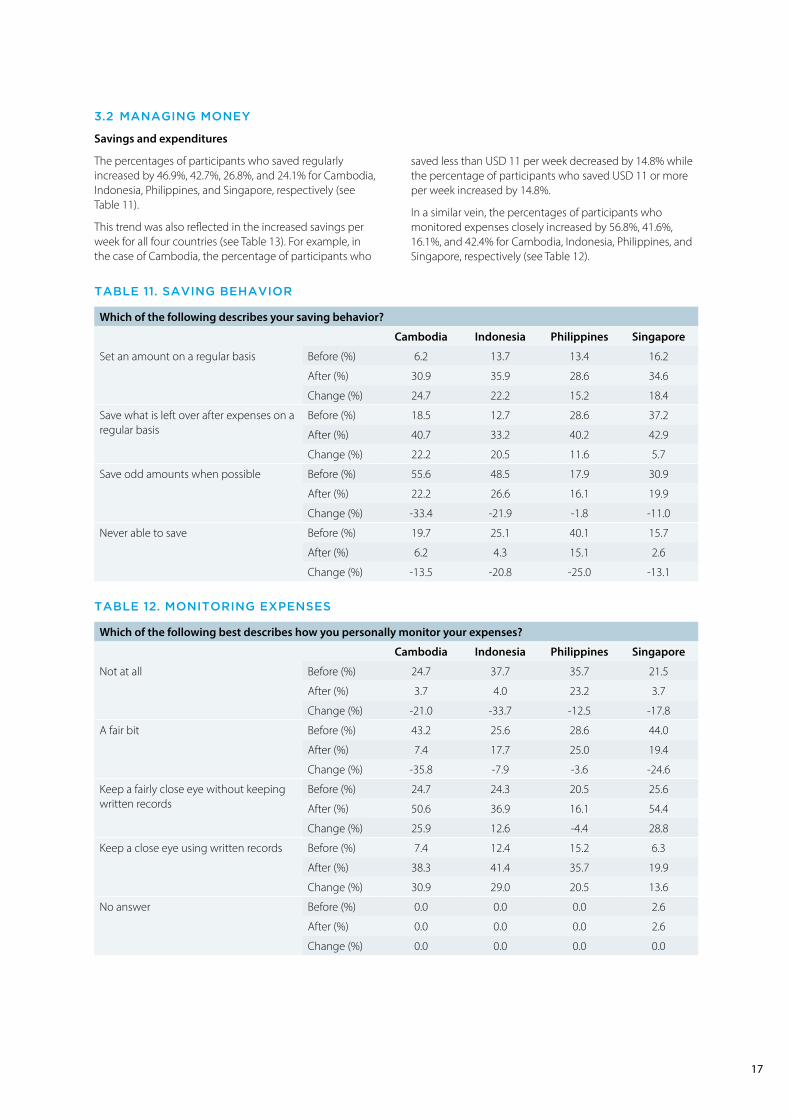
3.2 manaGinG moneY
Savings and expenditures
The percentages of participants who saved regularly increased by 46.9%, 42.7%, 26.8%, and 24.1% for Cambodia, Indonesia, Philippines, and Singapore, respectively (see Table 11).
This trend was also reflected in the increased savings per week for all four countries (see Table 13). For example, in the case of Cambodia, the percentage of participants who
table 11. saVinG behaVior
Which of the following describes your saving behavior?
cambodia Indonesia Philippines Singapore
Set an amount on a regular basis Before (%) 6.2 13.7 13.4 16.2
After (%) 30.9 35.9 28.6 34.6
Change (%) 24.7 22.2 15.2 18.4
Save what is left over after expenses on a regular basis
Before (%) 18.5 12.7 28.6 37.2
After (%) 40.7 33.2 40.2 42.9
Change (%) 22.2 20.5 11.6 5.7
Save odd amounts when possible Before (%) 55.6 48.5 17.9 30.9
After (%) 22.2 26.6 16.1 19.9
Change (%) -33.4 -21.9 -1.8 -11.0
Never able to save Before (%) 19.7 25.1 40.1 15.7
After (%) 6.2 4.3 15.1 2.6
Change (%) -13.5 -20.8 -25.0 -13.1
table 12. monitorinG eXPenses
Which of the following best describes how you personally monitor your expenses?
cambodia Indonesia Philippines Singapore
Not at all Before (%) 24.7 37.7 35.7 21.5
After (%) 3.7 4.0 23.2 3.7
Change (%) -21.0 -33.7 -12.5 -17.8
A fair bit Before (%) 43.2 25.6 28.6 44.0
After (%) 7.4 17.7 25.0 19.4
Change (%) -35.8 -7.9 -3.6 -24.6
Keep a fairly close eye without keeping written records
Before (%) 24.7 24.3 20.5 25.6
After (%) 50.6 36.9 16.1 54.4
Change (%) 25.9 12.6 -4.4 28.8
Keep a close eye using written records Before (%) 7.4 12.4 15.2 6.3
After (%) 38.3 41.4 35.7 19.9
Change (%) 30.9 29.0 20.5 13.6
No answer Before (%) 0.0 0.0 0.0 2.6
After (%) 0.0 0.0 0.0 2.6
Change (%) 0.0 0.0 0.0 0.0
saved less than USD 11 per week decreased by 14.8% while the percentage of participants who saved USD 11 or more per week increased by 14.8%.
In a similar vein, the percentages of participants who monitored expenses closely increased by 56.8%, 41.6%, 16.1%, and 42.4% for Cambodia, Indonesia, Philippines, and Singapore, respectively (see Table 12).

18
cambodia
USD 10 or less Before (%) 71.6
After (%) 56.8
Change (%) -14 .8
USD 11 to USD 20 Before (%) 6.2
After (%) 12.3
Change (%) 6.1
USD 21 to USD 50 Before (%) 13.6
After (%) 18.5
Change (%) 4.9
USD 51 to USD 100 Before (%) 3.7
After (%) 6.2
Change (%) 2.5
USD 101 or more Before (%) 4.9
After (%) 6.2
Change (%) 1.3
Indonesia
Less than IDR 40,000 Before (%) 49.6
After (%) 31.1
Change (%) -18.5
IDR 40,001 to IDR 100,000 Before (%) 16.9
After (%) 21.4
Change (%) 4.5
IDR 100,001 to IDR 2,000,000 Before (%) 33.0
After (%) 46.2
Change (%) 13.2
IDR 2,000,001 or more Before (%) 0.5
After (%) 1.3
Change (%) 0.8
Philippines
PHP 0 to PHP 500 Before (%) 85.7
After (%) 59.8
Change (%) -25.9
PHP 501 to PHP 1,000 Before (%) 7.1
After (%) 33.9
Change (%) 26.8
PHP 1,001 to PHP 5,000 Before (%) 5.4
After (%) 3.6
Change (%) -1.8
PHP 5,001 or more Before (%) 1.8
After (%) 2.7
Change (%) 0.9
Singapore
SGD10 or less Before (%) 61.3
After (%) 42.4
Change (%) -18.9
SGD11 to SGD20 Before (%) 14.1
After (%) 16.8
Change (%) 2.7
SGD21 to SGD50 Before (%) 12.5
After (%) 20.9
Change (%) 8.4
SGD51 to SGD100 Before (%) 6.3
After (%) 11.0
Change (%) 4.7
SGD 101 or more Before (%) 5.8
After (%) 8.9
Change (%) 3.1
table 13. WeeKlY saVinGs aPProXimatelY hoW muCh do You saVe a WeeK?

19
Attitudes towards saving
The percentages of participants who identified with being more of savers than spenders increased by 28.5%, 29.5%, 33.9%, and 33.5% for Cambodia, Indonesia, Philippines, and Singapore, respectively (see Table 14).
The percentages of participants who found it more satisfying to save money than to spend it also increased
table 14. saVer or sPender
I am more of a saver than spender.
cambodia Indonesia Philippines Singapore
Strongly disagree Before (%) 2.5 5.5 2.7 8.4
After (%) 0.0 3.2 0.9 2.1
Change (%) -2.5 -2.3 -1.8 -6.3
Disagree Before (%) 28.4 22.7 39.3 27.7
After (%) 7.4 6.9 13.4 9.4
Change (%) -21.0 -15.8 -25.9 -18.3
Neither agree nor disagree Before (%) 19.8 21.4 16.9 38.2
After (%) 14.8 10.0 10.7 29.3
Change (%) -5.0 -11.4 -6.2 -8.9
Agree Before (%) 43.2 41.4 34.8 19.4
After (%) 50.6 62 59.8 45.0
Change (%) 7.4 20.6 25.0 25.6
Strongly agree Before (%) 6.1 9.0 6.3 6.3
After (%) 27.2 17.9 15.2 14.2
Change (%) 21.1 8.9 8.9 7.9
table 15. satisfaCtion from sPendinG Versus satisfaCtion from saVinG
I find it more satisfying to spend money than to save it for the long term.
cambodia Indonesia Philippines Singapore
Strongly disagree Before (%) 3.7 14.5 2.7 8.4
After (%) 8.6 26.1 9.8 11.5
Change (%) 4.9 11.6 7.1 3.1
Disagree Before (%) 32.1 45.4 50.9 23.0
After (%) 54.3 50.4 25.0 36.1
Change (%) 22.2 5.0 -25.9 13.1
Neither agree nor disagree Before (%) 24.7 12.1 21.4 29.8
After (%) 17.3 4.8 17.9 22.1
Change (%) -7.4 -7.3 -3.5 -7.7
Agree Before (%) 37.0 23.5 25 30.9
After (%) 14.8 14.2 40.2 23.0
Change (%) -22.2 -9.3 15.2 -7.9
Strongly agree Before (%) 2.5 4.5 0 7.9
After (%) 5 4.5 7.1 7.3
Change (%) 2.5 0.0 7.1 -0.6
by 27.1%, 16.6%, and 16.2% for Cambodia, Indonesia, and Singapore, respectively (see Table 15).
On the other hand, the percentage of participants who found it more satisfying to save money than to spend it decreased by 18.8% for Philippines (see Table 15).

20
Attitudes towards spending
The percentages of participants who said that they would not impulsively buy things that they could not afford increased by 13.6%, 12.8%, and 19.8% for Cambodia, Indonesia, and Singapore, respectively (see Table 16).
However, the percentage of participants who said that they would not impulsively buy things that they could not afford decreased by 10.6% for Philippines (see Table 16).
table 16. imPulse buYinG
I am impulsive and buy things even when I can’t really afford them.
cambodia Indonesia Philippines Singapore
Strongly disagree Before (%) 12.4 19.3 12.5 12.6
After (%) 22.3 24.5 16.1 21.0
Change (%) 9.9 5.2 3.6 8.3
Disagree Before (%) 37.0 46.2 57.1 26.2
After (%) 40.7 53.8 42.9 37.7
Change (%) 3.7 7.6 -14.2 11.5
Neither agree nor disagree Before (%) 8.6 10.7 9.0 18.3
After (%) 17.3 8.3 8.0 23.0
Change (%) 8.7 -2.4 -1.0 4.7
Agree Before (%) 38.3 21.4 21.4 36.1
After (%) 16.0 11.3 32.1 16.2
Change (%) -22.3 -10.1 10.7 -19.9
Strongly agree Before (%) 3.7 2.4 0.0 6.8
After (%) 3.7 2.1 0.9 2.1
Change (%) 0.0 -0.3 0.9 -4.7
table 17. Consideration of affordabilitY before maKinG PurChase
Before I buy something, I carefully consider whether I can afford it.
cambodia Indonesia Philippines Singapore
Strongly disagree Before (%) 1.2 4.0 3.6 3.7
After (%) 1.2 1.1 5.4 2.1
Change (%) 0 -2.9 1.8 -1.6
Disagree Before (%) 14.8 17.9 26.8 14.1
After (%) 8.6 1.3 8.9 2.6
Change (%) -6.2 -16.6 -17.9 -11.5
Neither agree nor disagree Before (%) 16.0 10.0 18.7 23.0
After (%) 3.7 4.4 7.1 12.5
Change (%) -12.3 -5.6 -11.6 -10.5
Agree Before (%) 58.0 49.9 47.3 41.9
After (%) 50.6 57.3 61.6 46.1
Change (%) -7.4 7.4 14.3 4.2
Strongly agree Before (%) 10.0 18.2 3.6 17.3
After (%) 35.9 35.9 17.0 36.7
Change (%) 25.9 17.7 13.4 19.4
The percentages of participants who considered affordability before making purchases increased by 18.5%, 25.1%, 27.7%, and 23.6% for Cambodia, Indonesia, Philippines, and Singapore, respectively (see Table 17).
Likewise, the percentages of participants who made alternate evaluations before making purchases increased by 27.1%, 21.7%, 27.6%, and 19.8% for Cambodia, Indonesia, Philippines, and Singapore, respectively (see Table 18).

21
table 18. alternatiVe eValuation before PurChase
When I shop for products and services, I spend time comparing prices and features.
cambodia Indonesia Philippines Singapore
Strongly disagree Before (%) 0.0 4.3 0.9 2.6
After (%) 0.0 1.8 0.0 1.1
Change (%) 0.0 -2.5 -0.9 -1.5
Disagree Before (%) 13.5 12.9 29.5 11.5
After (%) 3.7 2.4 11.6 4.2
Change (%) -9.8 -10.5 -17.9 -7.3
Neither agree nor disagree Before (%) 23.5 13.5 19.6 20.4
After (%) 6.2 4.8 10.8 9.4
Change (%) -17.3 -8.7 -8.8 -11.0
Agree Before (%) 60.5 55.1 44.6 48.2
After (%) 61.7 60.4 57.1 47.6
Change (%) 1.2 5.3 12.5 -0.6
Strongly agree Before (%) 2.5 14.2 5.4 17.3
After (%) 28.4 30.6 20.5 37.7
Change (%) 25.9 16.4 15.1 20.4
Approach to saving
The percentages of participants who took cash to the bank increased by 19.7%, 4.0%, 11.6%, and 12.0% for Cambodia, Indonesia, Philippines, and Singapore, respectively (see Table 19).
Correspondingly, the percentages of participants who were unable to save decreased by 14.8%, 19.8%, 16.9%, and 16.7% for Cambodia, Indonesia, Philippines, and Singapore, respectively (see Table 19).
table 19. methods of dePosit to saVinGs aCCount
How do you generally make your savings deposit?
cambodia Indonesia Philippines Singapore
Take cash to the bank Before (%) 19.8 20.3 6.3 48.7
After (%) 39.5 24.3 17.9 60.7
Change (%) 19.7 4.0 11.6 12.0
Automatic deductions from pay Before (%) 8.6 3.7 4.5 5.3
After (%) 7.4 4.2 4.5 4.2
Change (%) -1.2 0.5 0 -1.1
Transfer from another account Before (%) 1.2 6.9 2.7 8.4
After (%) 0.0 9.2 3.6 16.2
Change (%) -1.2 2.3 0.9 7.8
Automatic deductions from bank account
Before (%) 2.5 0.8 2.7 5.2
After (%) 0.0 2.6 1.8 3.7
Change (%) -2.5 1.8 -0.9 -1.5
Unable to save Before (%) 21.0 25.9 48.2 20.4
After (%) 6.2 6.1 31.3 3.7
Change (%) -14.8 -19.8 -16.9 -16.7
Other Before (%) 46.9 42.4 35.6 12.0
After (%) 46.9 53.6 40.9 11.5
Change (%) 0.0 11.2 5.3 -0.5

22
3.3 finanCial KnoWledGe and manaGement
Financial knowledge
Regarding financial decision-making and problem-solving:
• The percentages of participants who felt confident about making financial decisions increased by 39.5%, 37.5%, 24.0%, and 30.9% for Cambodia, Indonesia, Philippines, and Singapore, respectively (see Table 20).
• The percentages of participants who were able to deal with financial problems also increased by 33.3%, 39.5%, 26.9%, and 33.5% for Cambodia, Indonesia, Philippines, and Singapore, respectively (see Table 21).
• Furthermore, the percentages of participants who knew the right questions to ask when presented with a financial decision increased by 46.9%, 21.9%, 26.8%, and 27.7% for Cambodia, Indonesia, Philippines, and Singapore, respectively (see Table 22).
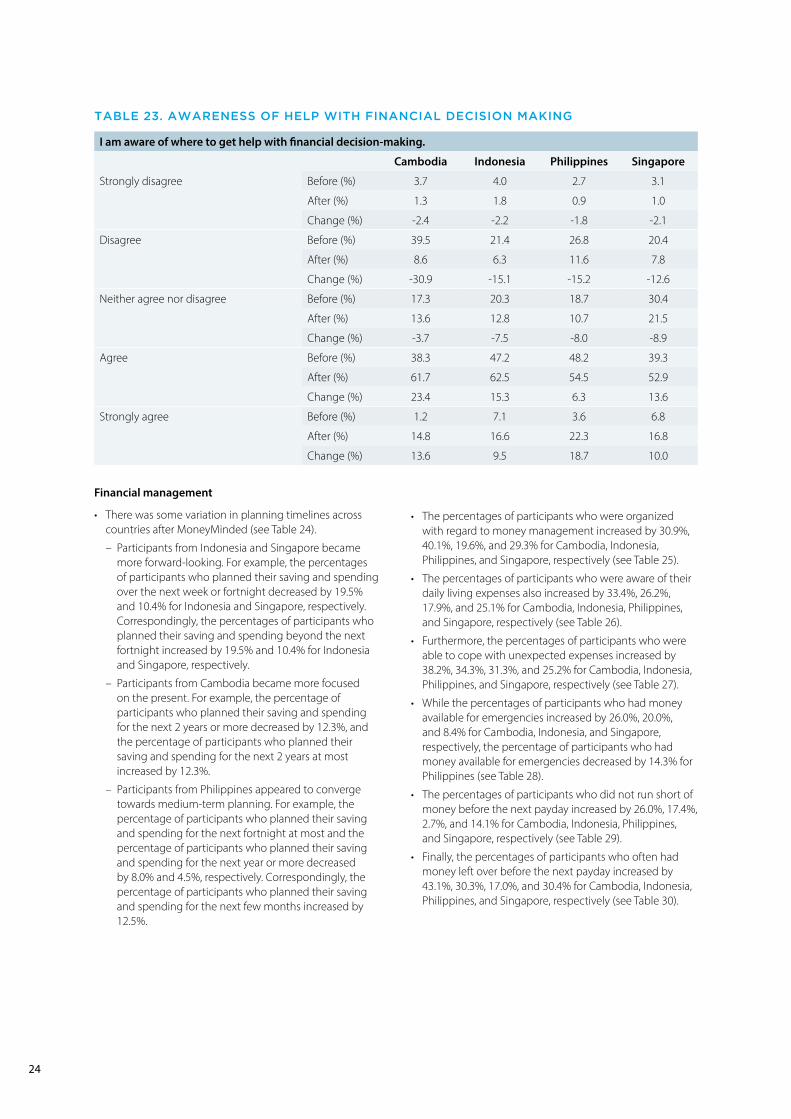
• Finally, the percentages of participants who knew where to get help with financial decision-making increased by 37.0%, 24.8%, 25.0%, and 23.6% for Cambodia, Indonesia, Philippines, and Singapore, respectively (see Table 23).
table 20. ConfidenCe in maKinG finanCial deCisions
I feel confident about making financial decisions.
cambodia Indonesia Philippines Singapore
Strongly disagree Before (%) 1.2 2.6 0.0 5.2
After (%) 2.5 1.1 2.7 2.1
Change (%) 1.3 -1.5 2.7 -3.1
Disagree Before (%) 22.2 25.6 31.3 23.6
After (%) 1.2 1.6 9.8 1.1
Change (%) -21.0 -24.0 -21.5 -22.5
Neither agree nor disagree Before (%) 24.7 19.1 21.3 29.3
After (%) 4.9 7.1 16.1 24.0
Change (%) -19.8 -12.0 -5.2 -5.3
Agree Before (%) 49.4 46.4 42.0 37.2
After (%) 64.2 67.5 58.9 59.7
Change (%) 14.8 21.1 16.9 22.5
Strongly agree Before (%) 2.5 6.3 5.4 4.7
After (%) 27.2 22.7 12.5 13.1
Change (%) 24.7 16.4 7.1 8.4

23
table 21. abilitY to deal With finanCial Problems
I am able to deal with financial problems.
cambodia Indonesia Philippines Singapore
Strongly disagree Before (%) 3.7 4.0 6.3 5.2
After (%) 0 1.1 1.8 1.1
Change (%) -3.7 -2.9 -4.5 -4.1
Disagree Before (%) 23.5 26.9 33.0 24.1
After (%) 1.3 2.6 16.1 3.1
Change (%) -22.2 -24.3 -16.9 -21.0
Neither agree nor disagree Before (%) 29.6 21.3 20.6 37.7
After (%) 22.2 9.0 15.1 29.3
Change (%) -7.4 -12.3 -5.5 -8.4
Agree Before (%) 38.3 41.7 32.1 30.4
After (%) 58.0 67.5 50.0 57.6
Change (%) 19.7 25.8 17.9 27.2
Strongly agree Before (%) 4.9 6.1 8.0 2.6
After (%) 18.5 19.8 17.0 8.9
Change (%) 13.6 13.7 9.0 6.3
table 22. abilitY to asK riGht finanCial Questions
When presented with a financial decision, I know the right question to ask.
cambodia Indonesia Philippines Singapore
Strongly disagree Before (%) 7.4 6.9 0.9 4.7
After (%) 3.7 5.3 1.8 1.0
Change (%) -3.7 -1.6 0.9 -3.7
Disagree Before (%) 35.8 17.4 40.2 16.7
After (%) 4.9 6.6 17.0 4.7
Change (%) -30.9 -10.8 -23.2 -12.0
Neither agree nor disagree Before (%) 25.9 21.6 21.4 35.6
After (%) 13.6 12.1 16.9 23.6
Change (%) -12.3 -9.5 -4.5 -12.0
Agree Before (%) 25.9 40.9 35.7 36.7
After (%) 53.1 50.4 45.5 56.0
Change (%) 27.2 9.5 9.8 19.3
Strongly agree Before (%) 5.0 13.2 1.8 6.3
After (%) 24.7 25.6 18.8 14.7
Change (%) 19.7 12.4 17.0 8.4
24
table 23. aWareness of helP With finanCial deCision maKinG
I am aware of where to get help with financial decision-making.
cambodia Indonesia Philippines Singapore
Strongly disagree Before (%) 3.7 4.0 2.7 3.1
After (%) 1.3 1.8 0.9 1.0
Change (%) -2.4 -2.2 -1.8 -2.1
Disagree Before (%) 39.5 21.4 26.8 20.4
After (%) 8.6 6.3 11.6 7.8
Change (%) -30.9 -15.1 -15.2 -12.6
Neither agree nor disagree Before (%) 17.3 20.3 18.7 30.4
After (%) 13.6 12.8 10.7 21.5
Change (%) -3.7 -7.5 -8.0 -8.9
Agree Before (%) 38.3 47.2 48.2 39.3
After (%) 61.7 62.5 54.5 52.9
Change (%) 23.4 15.3 6.3 13.6
Strongly agree Before (%) 1.2 7.1 3.6 6.8
After (%) 14.8 16.6 22.3 16.8
Change (%) 13.6 9.5 18.7 10.0
Financial management
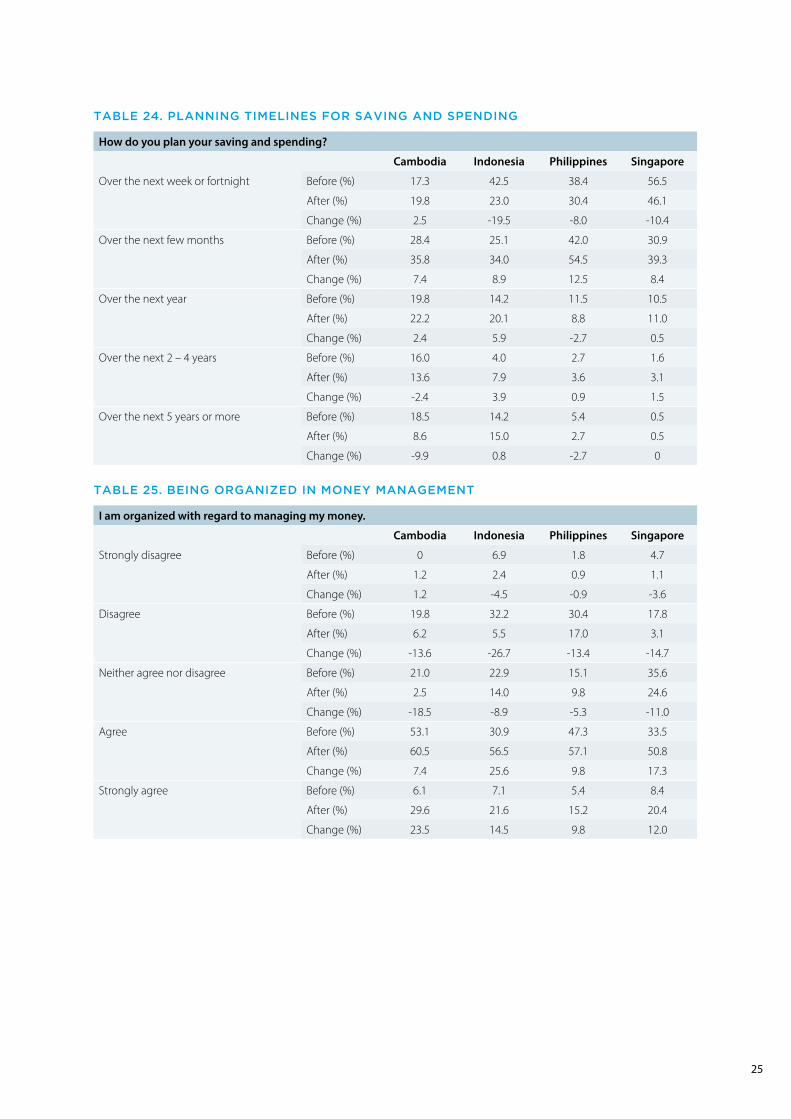
• There was some variation in planning timelines across countries after MoneyMinded (see Table 24).
– Participants from Indonesia and Singapore became more forward-looking. For example, the percentages of participants who planned their saving and spending over the next week or fortnight decreased by 19.5% and 10.4% for Indonesia and Singapore, respectively. Correspondingly, the percentages of participants who planned their saving and spending beyond the next fortnight increased by 19.5% and 10.4% for Indonesia and Singapore, respectively.
– Participants from Cambodia became more focused on the present. For example, the percentage of participants who planned their saving and spending for the next 2 years or more decreased by 12.3%, and the percentage of participants who planned their saving and spending for the next 2 years at most increased by 12.3%.
– Participants from Philippines appeared to converge towards medium-term planning. For example, the percentage of participants who planned their saving and spending for the next fortnight at most and the percentage of participants who planned their saving and spending for the next year or more decreased by 8.0% and 4.5%, respectively. Correspondingly, the percentage of participants who planned their saving and spending for the next few months increased by 12.5%.
• The percentages of participants who were organized with regard to money management increased by 30.9%, 40.1%, 19.6%, and 29.3% for Cambodia, Indonesia, Philippines, and Singapore, respectively (see Table 25).
• The percentages of participants who were aware of their daily living expenses also increased by 33.4%, 26.2%, 17.9%, and 25.1% for Cambodia, Indonesia, Philippines, and Singapore, respectively (see Table 26).
• Furthermore, the percentages of participants who were able to cope with unexpected expenses increased by 38.2%, 34.3%, 31.3%, and 25.2% for Cambodia, Indonesia, Philippines, and Singapore, respectively (see Table 27).
• While the percentages of participants who had money available for emergencies increased by 26.0%, 20.0%, and 8.4% for Cambodia, Indonesia, and Singapore, respectively, the percentage of participants who had money available for emergencies decreased by 14.3% for Philippines (see Table 28).
• The percentages of participants who did not run short of money before the next payday increased by 26.0%, 17.4%, 2.7%, and 14.1% for Cambodia, Indonesia, Philippines, and Singapore, respectively (see Table 29).
• Finally, the percentages of participants who often had money left over before the next payday increased by 43.1%, 30.3%, 17.0%, and 30.4% for Cambodia, Indonesia, Philippines, and Singapore, respectively (see Table 30).
25
table 24. PlanninG timelines for saVinG and sPendinG
How do you plan your saving and spending?
cambodia Indonesia Philippines Singapore
Over the next week or fortnight Before (%) 17.3 42.5 38.4 56.5
After (%) 19.8 23.0 30.4 46.1
Change (%) 2.5 -19.5 -8.0 -10.4
Over the next few months Before (%) 28.4 25.1 42.0 30.9
After (%) 35.8 34.0 54.5 39.3
Change (%) 7.4 8.9 12.5 8.4
Over the next year Before (%) 19.8 14.2 11.5 10.5
After (%) 22.2 20.1 8.8 11.0
Change (%) 2.4 5.9 -2.7 0.5
Over the next 2 – 4 years Before (%) 16.0 4.0 2.7 1.6
After (%) 13.6 7.9 3.6 3.1
Change (%) -2.4 3.9 0.9 1.5
Over the next 5 years or more Before (%) 18.5 14.2 5.4 0.5
After (%) 8.6 15.0 2.7 0.5
Change (%) -9.9 0.8 -2.7 0
table 25. beinG orGaniZed in moneY manaGement
I am organized with regard to managing my money.
cambodia Indonesia Philippines Singapore
Strongly disagree Before (%) 0 6.9 1.8 4.7
After (%) 1.2 2.4 0.9 1.1
Change (%) 1.2 -4.5 -0.9 -3.6
Disagree Before (%) 19.8 32.2 30.4 17.8
After (%) 6.2 5.5 17.0 3.1
Change (%) -13.6 -26.7 -13.4 -14.7
Neither agree nor disagree Before (%) 21.0 22.9 15.1 35.6
After (%) 2.5 14.0 9.8 24.6
Change (%) -18.5 -8.9 -5.3 -11.0
Agree Before (%) 53.1 30.9 47.3 33.5
After (%) 60.5 56.5 57.1 50.8
Change (%) 7.4 25.6 9.8 17.3
Strongly agree Before (%) 6.1 7.1 5.4 8.4
After (%) 29.6 21.6 15.2 20.4
Change (%) 23.5 14.5 9.8 12.0

26
table 26. aWareness of dailY liVinG eXPenses
I know how much I need for my daily living expenses.
cambodia Indonesia Philippines Singapore
Strongly disagree Before (%) 3.7 1.8 2.7 2.6
After (%) 0 0.5 1.8 0.5
Change (%) -3.7 -1.3 -0.9 -2.1
Disagree Before (%) 21.0 23.0 22.3 12.6
After (%) 1.2 6.3 8.0 1.1
Change (%) -19.8 -16.7 -14.3 -11.5
Neither agree nor disagree Before (%) 18.5 15.6 18.8 23.5
After (%) 8.6 7.4 16.1 12.0
Change (%) -9.9 -8.2 -2.7 -11.5
Agree Before (%) 48.1 52.2 47.3 52.9
After (%) 64.2 63.1 59.8 63.9
Change (%) 16.1 10.9 12.5 11.0
Strongly agree Before (%) 8.7 7.4 8.9 8.4
After (%) 26.0 22.7 14.3 22.5
Change (%) 17.3 15.3 5.4 14.1
table 27. abilitY to CoPe With uneXPeCted eXPenses
I am able to cope with unexpected expenses.
cambodia Indonesia Philippines Singapore
Strongly disagree Before (%) 4.9 5.3 1.8 6.3
After (%) 0.0 1.6 0.9 2.6
Change (%) -4.9 -3.7 -0.9 -3.7
Disagree Before (%) 28.4 25.1 35.7 21.0
After (%) 9.9 4.0 15.2 8.4
Change (%) -18.5 -21.1 -20.5 -12.6
Neither agree nor disagree Before (%) 28.4 20.6 27.7 43.4
After (%) 13.6 11.1 17.8 34.5
Change (%) -14.8 -9.5 -9.9 -8.9
Agree Before (%) 32.1 44.3 33.0 27.2
After (%) 61.7 68.3 54.5 48.7
Change (%) 29.6 24.0 21.5 21.5
Strongly agree Before (%) 6.2 4.7 1.8 2.1
After (%) 14.8 15.0 11.6 5.8
Change (%) 8.6 10.3 9.8 3.7

27
table 28. aVailabilitY of moneY for emerGenCies
Before/after doing MoneyMinded, I had money for emergencies and/or savings to cover my expenses if I got sick or lost my job.
cambodia Indonesia Philippines Singapore
Yes Before (%) 58.0 67.6 53.6 66.0
After (%) 84.0 87.6 39.3 74.4
Change (%) 26.0 20.0 -14.3 8.4
No Before (%) 42.0 32.4 46.4 34.0
After (%) 16.0 12.4 60.7 25.6
Change (%) -26.0 -20.0 14.3 -8.4
table 29. shortaGe of moneY
I often run short of money before my next pay is due.
cambodia Indonesia Philippines Singapore
Strongly disagree Before (%) 6.2 8.2 0.9 9.4
After (%) 9.9 13.2 5.4 16.2
Change (%) 3.7 5.0 4.5 6.8
Disagree Before (%) 29.6 31.1 34.8 34.1
After (%) 51.9 43.5 33.0 41.4
Change (%) 22.3 12.4 -1.8 7.3
Neither agree nor disagree Before (%) 17.3 19.5 25.0 28.3
After (%) 11.1 15.6 21.4 28.3
Change (%) -6.2 -3.9 -3.6 0.0
Agree Before (%) 42.0 35.9 38.4 20.9
After (%) 21.0 21.6 33.9 9.4
Change (%) -21.0 -14.3 -4.5 -11.5
Strongly agree Before (%) 4.9 5.3 0.9 7.3
After (%) 6.1 6.1 6.3 4.7
Change (%) 1.2 0.8 5.4 -2.6

28
table 30. moneY left oVer
How often did you have money left over by the time you receive your next pay/allowance?
cambodia Indonesia Philippines Singapore
Always Before (%) 18.5 21.7 16.1 24.6
After (%) 40.6 35.6 18.8 39.3
Change (%) 22.1 13.9 2.7 14.7
More often than not Before (%) 9.9 12.4 9.8 17.3
After (%) 30.9 28.8 24.1 33.0
Change (%) 21.0 16.4 14.3 15.7
Sometimes Before (%) 28.4 40.6 44.6 33.5
After (%) 19.8 28.0 44.6 23.0
Change (%) -8.6 -12.6 0.0 -10.5
Hardly ever Before (%) 29.6 11.6 6.3 17.3
After (%) 2.5 2.9 2.7 3.7
Change (%) -27.1 -8.7 -3.6 -13.6
Never Before (%) 13.6 13.7 23.2 7.3
After (%) 6.2 4.7 9.8 1.0
Change (%) -7.4 -9.0 -13.4 -6.3
3.4 PlanninG ahead
• The percentages of participants who were able to plan ahead increased by 39.4%, 35.6%, 30.3%, and 28.3% for Cambodia, Indonesia, Philippines, and Singapore, respectively (see Table 31).
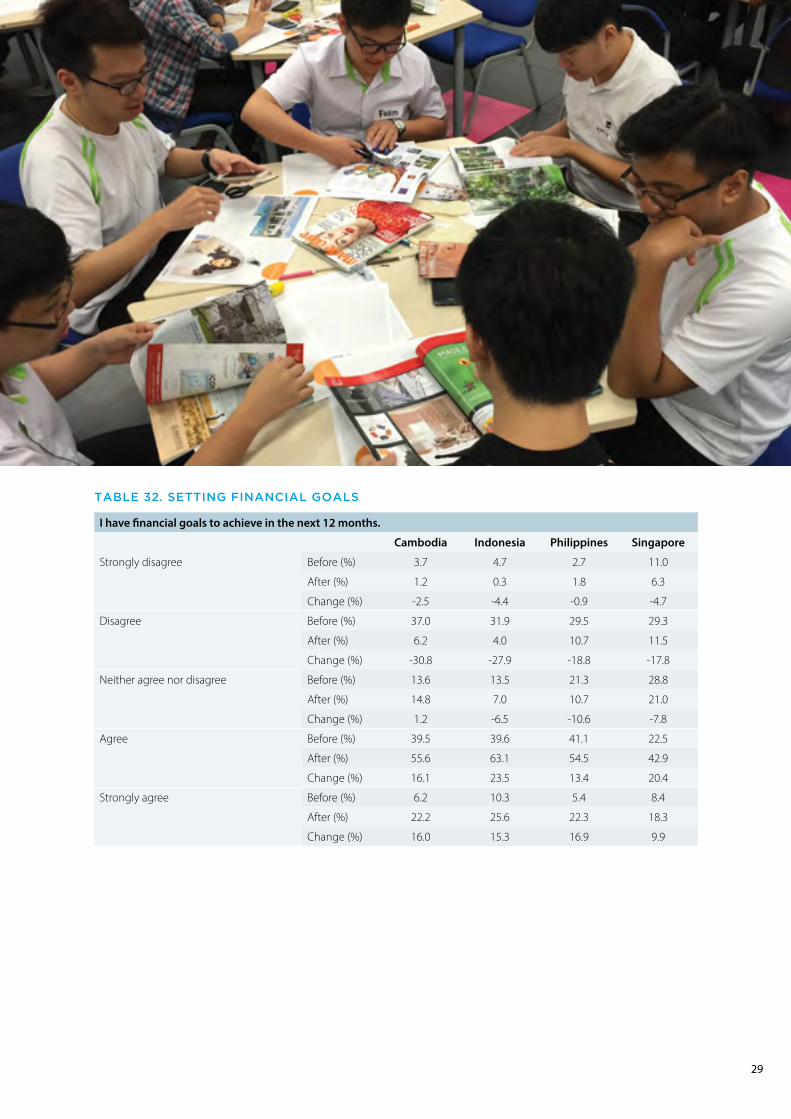
• In a similar vein, the percentages of participants who had financial goals to achieve in the next 12 months increased by 32.1%, 38.8%, 30.3%, and 30.3% for
Cambodia, Indonesia, Philippines, and Singapore, respectively (see Table 32).
• Additionally, the percentages of participants who believed that financial management affects one’s future increased by 7.4%, 28.0%, 30.4%, and 18.8% for Cambodia, Indonesia, Philippines, and Singapore, respectively (see Table 33).
table 31. PlanninG ahead
I am able to plan ahead.
cambodia Indonesia Philippines Singapore
Strongly disagree Before (%) 3.7 3.2 4.5 4.7
After (%) 0 0.3 2.7 0.5
Change (%) -3.7 -2.9 -1.8 -4.2
Disagree Before (%) 33.3 24.8 30.4 18.3
After (%) 2.5 1.8 8.9 2.6
Change (%) -30.8 -23.0 -21.5 -15.7
Neither agree nor disagree Before (%) 18.5 18.4 17.7 27.8
After (%) 13.6 8.7 10.7 19.4
Change (%) -4.9 -9.7 -7.0 -8.4
Agree Before (%) 37.0 46.7 42.9 42.9
After (%) 59.3 64.9 62.5 55.5
Change (%) 22.3 18.2 19.6 12.6
Strongly agree Before (%) 7.5 6.9 4.5 6.3
After (%) 24.6 24.3 15.2 22.0
Change (%) 17.1 17.4 10.7 15.7
29
table 32. settinG finanCial Goals
I have financial goals to achieve in the next 12 months.
cambodia Indonesia Philippines Singapore
Strongly disagree Before (%) 3.7 4.7 2.7 11.0
After (%) 1.2 0.3 1.8 6.3
Change (%) -2.5 -4.4 -0.9 -4.7
Disagree Before (%) 37.0 31.9 29.5 29.3
After (%) 6.2 4.0 10.7 11.5
Change (%) -30.8 -27.9 -18.8 -17.8
Neither agree nor disagree Before (%) 13.6 13.5 21.3 28.8
After (%) 14.8 7.0 10.7 21.0
Change (%) 1.2 -6.5 -10.6 -7.8
Agree Before (%) 39.5 39.6 41.1 22.5
After (%) 55.6 63.1 54.5 42.9
Change (%) 16.1 23.5 13.4 20.4
Strongly agree Before (%) 6.2 10.3 5.4 8.4
After (%) 22.2 25.6 22.3 18.3
Change (%) 16.0 15.3 16.9 9.9

30
3.5 imPaCt on indiViduals
• MoneyMinded significantly improved the personal well-being of participants from all four countries.
– Across all items, the majority (>50%) of participants from all four countries consistently expressed positive sentiments after completing MoneyMinded. For example, the percentages of participants who indicated that they felt less stressed after
MoneyMinded were 79.1%, 91.0%, 75.9%, and 60.2% for Cambodia, Indonesia, Philippines, and Singapore, respectively (see Table 34).
• Furthermore, the percentages of participants who felt satisfied with their lives increased by 55.6%, 61.1%, 53.5%, and 39.7% for Cambodia, Indonesia, Philippines, and Singapore respectively (see Table 35).
table 33. imPaCt of finanCial manaGement on future
I believe the way I manage my finances affects my future.
cambodia Indonesia Philippines Singapore
Strongly disagree Before (%) 7.4 4.0 0.9 4.2
After (%) 11.2 0.3 1.8 2.1
Change (%) 3.8 -3.7 0.9 -2.1
Disagree Before (%) 38.3 16.1 31.3 7.8
After (%) 33.3 0.5 10.7 1.6
Change (%) -5.0 -15.6 -20.6 -6.2
Neither agree nor disagree Before (%) 18.5 12.6 15.1 21.5
After (%) 12.3 3.9 4.4 11.0
Change (%) -6.2 -8.7 -10.7 -10.5
Agree Before (%) 33.3 53.3 46.4 47.1
After (%) 33.3 63.1 55.4 46.0
Change (%) 0.0 9.8 9.0 -1.1
Strongly agree Before (%) 2.5 14.0 6.3 19.4
After (%) 9.9 32.2 27.7 39.3
Change (%) 7.4 18.2 21.4 19.9

31
table 34. imPaCt of moneYminded on indiViduals
Since doing MoneyMinded, I feel less stressed about the future.
cambodia Indonesia Philippines Singapore
Strongly disagree (%) 0.0 0.3 1.8 2.1
Disagree (%) 4.9 1.3 12.5 5.2
Neither agree nor disagree (%) 16.0 7.4 9.8 32.5
Agree (%) 64.2 62.8 67.0 52.9
Strongly agree (%) 14.9 28.2 8.9 7.3
Since doing MoneyMinded, I feel more confident in other aspects of my life.
cambodia Indonesia Philippines Singapore
Strongly disagree (%) 0.0 0.0 0.0 1.0
Disagree (%) 0.0 0.5 8.0 1.6
Neither agree nor disagree (%) 12.3 7.4 8.9 27.2
Agree (%) 69.1 60.7 67.9 60.2
Strongly agree (%) 18.6 31.4 15.2 10.0
Since doing MoneyMinded, I feel I am able to better provide for my family.
cambodia Indonesia Philippines Singapore
Strongly disagree (%) 0.0 0.0 0.9 1.0
Disagree (%) 0.0 2.9 4.5 1.6
Neither agree nor disagree (%) 9.9 9.3 7.9 37.7
Agree (%) 67.9 60.4 68.8 48.2
Strongly agree (%) 22.2 27.4 17.9 11.5
MoneyMinded has given me the opportunity to meet new people.
cambodia Indonesia Philippines Singapore
Strongly disagree (%) 0.0 0.0 1.8 2.6
Disagree (%) 3.7 1.3 6.3 10.5
Neither agree nor disagree (%) 6.2 5.1 9.8 31.9
Agree (%) 75.3 57.5 61.6 42.9
Strongly agree (%) 14.8 36.1 20.5 12.1
I have learnt a lot from other participants in MoneyMinded.
cambodia Indonesia Philippines Singapore
Strongly disagree (%) 0.0 0.3 1.8 2.1
Disagree (%) 1.2 2.6 7.1 5.2
Neither agree nor disagree (%) 11.1 6.6 10.8 25.6
Agree (%) 67.9 59.4 58.9 52.4
Strongly agree (%) 19.8 31.1 21.4 14.7
MoneyMinded has helped me to feel more connected with my community.
cambodia Indonesia Philippines Singapore
Strongly disagree (%) 0.0 0.3 0.9 2.1
Disagree (%) 4.9 1.8 8.0 4.2
Neither agree nor disagree (%) 8.6 9.0 7.1 42.9
Agree (%) 63.0 57.0 66.1 37.7
Strongly agree (%) 23.5 31.9 17.9 13.1

32
table 35. imPaCt of moneY minded on Personal Well-beinG
Before you did MoneyMinded, how satisfied were you with your life as a whole? (%)
cambodia Indonesia Philippines Singapore
0 0.0 2.2 0.0 2.6
1 1.2 2.4 0.9 0.5
2 2.5 3.5 0.9 2.1
3 11.1 7.8 1.8 2.1
4 14.8 10.8 8.9 5.7
5 24.8 38.7 55.3 39.8
6 18.5 13.2 13.4 19.4
7 12.3 9.9 7.1 10.5
8 6.2 7.0 3.6 8.9
9 3.7 1.3 5.4 4.2
10 4.9 3.2 2.7 4.2
thinking about your own life and personal circumstances now, how satisfied are you with your life as a whole? (%)
cambodia Indonesia Philippines Singapore
0 0.0 0.0 0.0 1.0
1 0.0 0.0 0.9 0.0
2 0.0 0.3 0.9 0.0
3 0.0 0.3 0.9 1.6
4 1.2 0.5 0.9 2.6
5 5.0 7.8 21.4 13.1
6 11.1 8.6 2.7 14.1
7 22.2 21.8 16.1 25.7
8 30.9 25.8 19.6 23.0
9 14.8 17.7 19.6 10.0
10 14.8 17.2 17.0 8.9
Percentage change (%)
cambodia Indonesia Philippines Singapore
0 0.0 -2.2 0.0 -1.6
1 -1.2 -2.4 0.0 -0.5
2 -2.5 -3.2 0.0 -2.1
3 -11.1 -7.5 -0.9 -0.5
4 -13.6 -10.3 -8.0 -3.1
5 -19.8 -30.9 -33.9 -26.7
6 -7.4 -4.6 -10.7 -5.3
7 9.9 11.9 9.0 15.2
8 24.7 18.8 16.0 14.1
9 11.1 16.4 14.2 5.7
10 9.9 14.0 14.3 4.7
3.6 imPaCt on familY and friends
MoneyMinded also had an indirect positive impact on the families and friends of participants.
After completing MoneyMinded, the percentages of participants who encouraged their family to save were 64.2%, 89.8%, 84.8%, and 59.2% for Cambodia, Indonesia, Philippines, and Singapore, respectively (see Table 36).
The percentages of participants who shared what they had learned from MoneyMinded with their families and friends were 81.5%, 85.8%, 85.7%, and 38.2% for Cambodia, Indonesia, Philippines, and Singapore, respectively (see Table 36).
table 36. imPaCt of moneYminded on familY and friends
Since completing MoneyMinded, have you encouraged your family members to save?
cambodia Indonesia Philippines Singapore
Yes 64.2 89.8 84.8 59.2
No 35.8 10.2 15.2 40.8
Since completing MoneyMinded, have you shared anything else you learned about money with family and friends?
cambodia Indonesia Philippines Singapore
Yes 81.5 85.8 85.7 38.2
No 18.5 14.2 14.3 61.8

33
4.0 Financial liteRacy indices
Given that financial literacy comprises financial behavior, attitudes, and knowledge, evaluating participants with financial literacy indices allows for these characteristics to be captured on a spectrum. An individual is considered to have higher financial literacy if more positive behavior (such as organized money management), attitudes (such as finding it more satisfying to spend than save money), and knowledge (such as knowing the right questions to ask when faced with financial decisions) are observed. Having indices for financial behavior, financial attitudes and financial knowledge allows for analysis of inter-country and intra-country variations in financial literacy. Sections 4.1, 4.2 and 4.3 present the results for the financial behaviour, financial attitudes and financial knowledge indices, respectively. In each section, 2 figures are presented. The first figure shows the average index scores for the 4 countries, both before and after MoneyMinded. The second figure shows the index score distributions for the 4 countries, both before and after MoneyMinded. The index score distributions show whether financial behaviour, financial attitudes and financial knowledge improve or regress after MoneyMinded is conducted.
4.1 finanCial behaVior indeX
Ten questions from the MoneyMinded Evaluation Survey questionnaire were used to develop the financial behavior index (see Table 37). These questions captured diverse aspects of financial behavior and included questions on saving, planning, and money management behavior. For each behavioural question, participants were awarded 1 point if they reported “strongly agree” or “agree” to the question, and 0 point if they reported otherwise. The purpose of dichotomizing the responses was to identify a clear distinction between participants with positive financial behaviour and those with negative financial behavior. The final score for the financial behaviour index was calculated by adding the points for all ten questions. As such, for the financial behaviour index, the minimum score was 0 while the maximum score was 10. A high score reflected positive financial behavior and a lower score reflected negative financial behavior.
table 37. CreatinG a finanCial behaVior indeX
Question from survey questionnaire Behavior captured Scoring
I am organized with regard to money management. Money organization and management
1 point for participants who reported “strongly agree” or “agree”; 0 point otherwise
I am more of a saver than a spender. Saving and spending behavior
I know how much I need for my daily living expenses. Having a household budget
I have financial goals to achieve in the next 12 months. Setting short-term financial goals
I set longer-term financial goals and strive to achieve them. Setting long-term financial goals
I feel confident about making financial decisions Financial decision-making
I am able to plan ahead. Ability to make financial plans
I am able to deal with financial problems. Ability to address financial problems
I am able to cope with unexpected expenses. Having financial reserves for unexpected expenses
When I shop for products and services, I spend time comparing prices and features.
Alternative evaluation before purchase
Prior to MoneyMinded, participants from Singapore (average index score = 4.1) and Indonesia (average index score = 5.2) had the lowest and highest average financial behavior index scores, respectively (see Figure 1). After MoneyMinded, participants from Singapore (average score = 6.9) and Indonesia (average score = 8.6) had the lowest and highest average financial behaviour index scores, respectively. Overall, MoneyMinded was effective in improving the financial behavior of participants across all four countries. The average financial behavior index scores increased by 3.1, 3.4, 2.6, and 2.8 for participants from Cambodia, Indonesia, Philippines, and Singapore, respectively.

34
Before MoneyMinded, heterogeneous financial behavior was observed amongst participants from Cambodia, Indonesia, and Philippines, while negative financial behavior was observed amongst participants from Singapore (see Figure 2). These observations are reflected in the relatively flat score distributions for Cambodia, Indonesia, and Philippines, and the right-skewed score distribution for
fiGure 1. aVeraGe finanCial behaVior indeX sCore bY CountrY
fiGure 2. finanCial behaVior indeX sCore distribution bY CountrY
4.2 finanCial attitudes indeX
Three questions from the MoneyMinded Evaluation Survey questionnaire were used to develop the financial attitudes index (see Table 38). For each attitudinal question, participants were awarded 1 point if they reported “strongly disagree” or “disagree” to the question, and 0 point if they reported otherwise. The final score for the financial attitudes
Singapore. After MoneyMinded, positive financial behaviour was observed amongst participants from all four countries, as evidenced by the left-skewed score distributions for all four countries. Notably, Indonesia had the greatest percentage of participants (42.0%) who attained a perfect financial behaviour index score of 10.
index was calculated by adding the points for all three questions. As such, for the financial attitudes index, the minimum score was 0 while the maximum score was 3. A high score reflected positive financial attitudes and a low score reflected negative financial attitudes.
35
table 38. CreatinG a finanCial attitudes indeX
Question from survey questionnaire Attitude captured Scoring
I am impulsive and buy things even when I can’t really afford them.
Financial impulsiveness
1 point for participants who report-ed “strongly disagree” or “disagree”; 0 point otherwise
Money is there to be spent. Attitude towards money
I find it more satisfying to spend money than to save it for the long term.
Attitude towards spending and saving
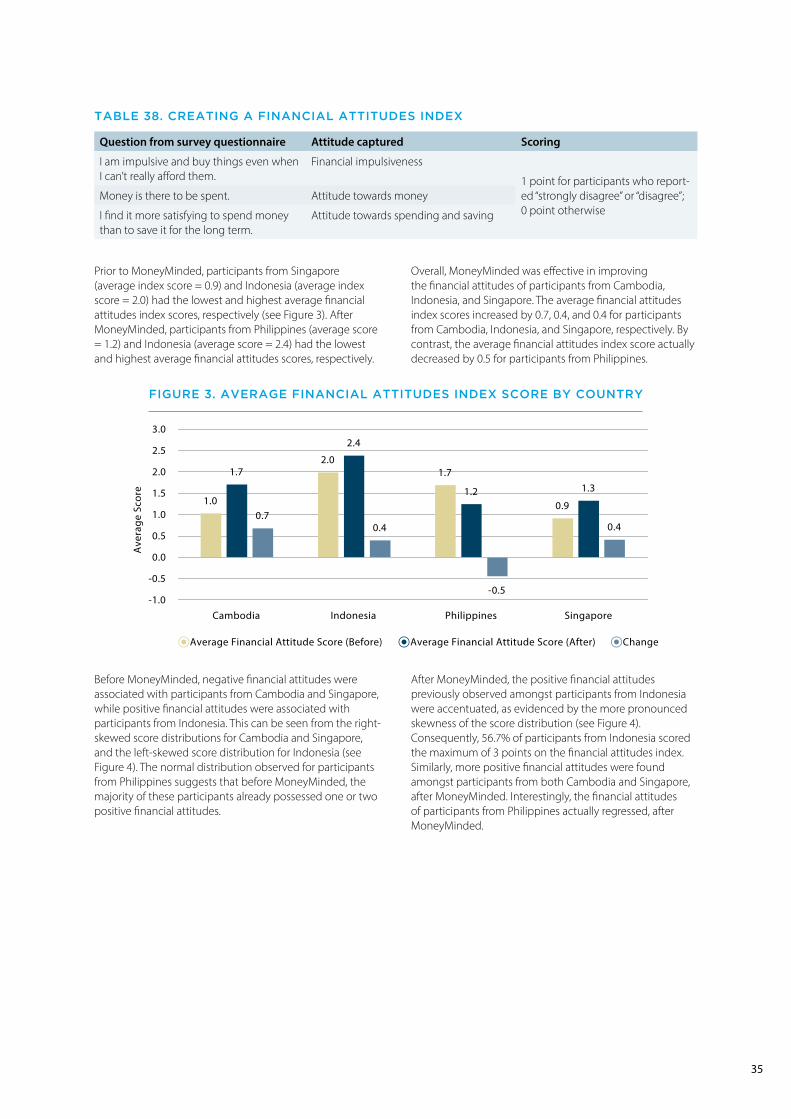
Prior to MoneyMinded, participants from Singapore (average index score = 0.9) and Indonesia (average index score = 2.0) had the lowest and highest average financial attitudes index scores, respectively (see Figure 3). After MoneyMinded, participants from Philippines (average score = 1.2) and Indonesia (average score = 2.4) had the lowest and highest average financial attitudes scores, respectively.
Overall, MoneyMinded was effective in improving the financial attitudes of participants from Cambodia, Indonesia, and Singapore. The average financial attitudes index scores increased by 0.7, 0.4, and 0.4 for participants from Cambodia, Indonesia, and Singapore, respectively. By contrast, the average financial attitudes index score actually decreased by 0.5 for participants from Philippines.
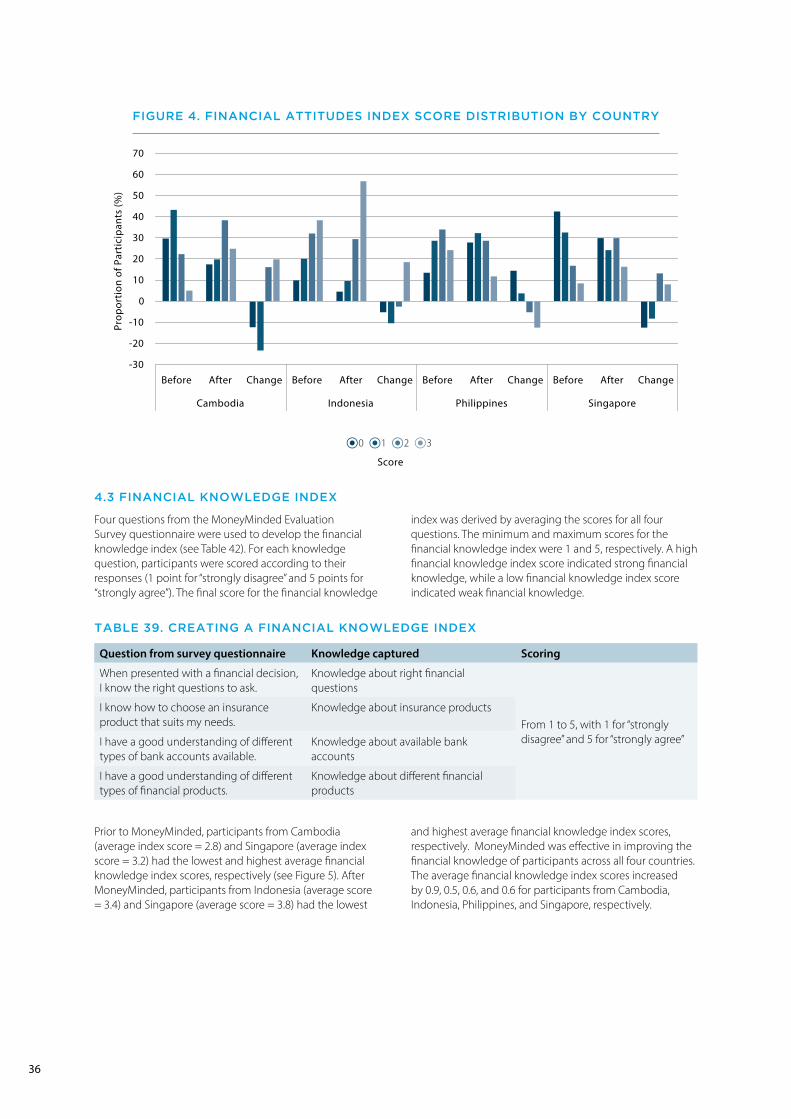
Before MoneyMinded, negative financial attitudes were associated with participants from Cambodia and Singapore, while positive financial attitudes were associated with participants from Indonesia. This can be seen from the right-skewed score distributions for Cambodia and Singapore, and the left-skewed score distribution for Indonesia (see Figure 4). The normal distribution observed for participants from Philippines suggests that before MoneyMinded, the majority of these participants already possessed one or two positive financial attitudes.
After MoneyMinded, the positive financial attitudes previously observed amongst participants from Indonesia were accentuated, as evidenced by the more pronounced skewness of the score distribution (see Figure 4). Consequently, 56.7% of participants from Indonesia scored the maximum of 3 points on the financial attitudes index. Similarly, more positive financial attitudes were found amongst participants from both Cambodia and Singapore, after MoneyMinded. Interestingly, the financial attitudes of participants from Philippines actually regressed, after MoneyMinded.
fiGure 3. aVeraGe finanCial attitudes indeX sCore bY CountrY
36
4.3 finanCial KnoWledGe indeX
Four questions from the MoneyMinded Evaluation Survey questionnaire were used to develop the financial knowledge index (see Table 42). For each knowledge question, participants were scored according to their responses (1 point for “strongly disagree” and 5 points for “strongly agree”). The final score for the financial knowledge
fiGure 4. finanCial attitudes indeX sCore distribution bY CountrY
index was derived by averaging the scores for all four questions. The minimum and maximum scores for the financial knowledge index were 1 and 5, respectively. A high financial knowledge index score indicated strong financial knowledge, while a low financial knowledge index score indicated weak financial knowledge.
table 39. CreatinG a finanCial KnoWledGe indeX
Question from survey questionnaire Knowledge captured Scoring
When presented with a financial decision, I know the right questions to ask.
Knowledge about right financial questions
From 1 to 5, with 1 for “strongly disagree” and 5 for “strongly agree”
I know how to choose an insurance product that suits my needs.
Knowledge about insurance products
I have a good understanding of different types of bank accounts available.
Knowledge about available bank accounts
I have a good understanding of different types of financial products.
Knowledge about different financial products
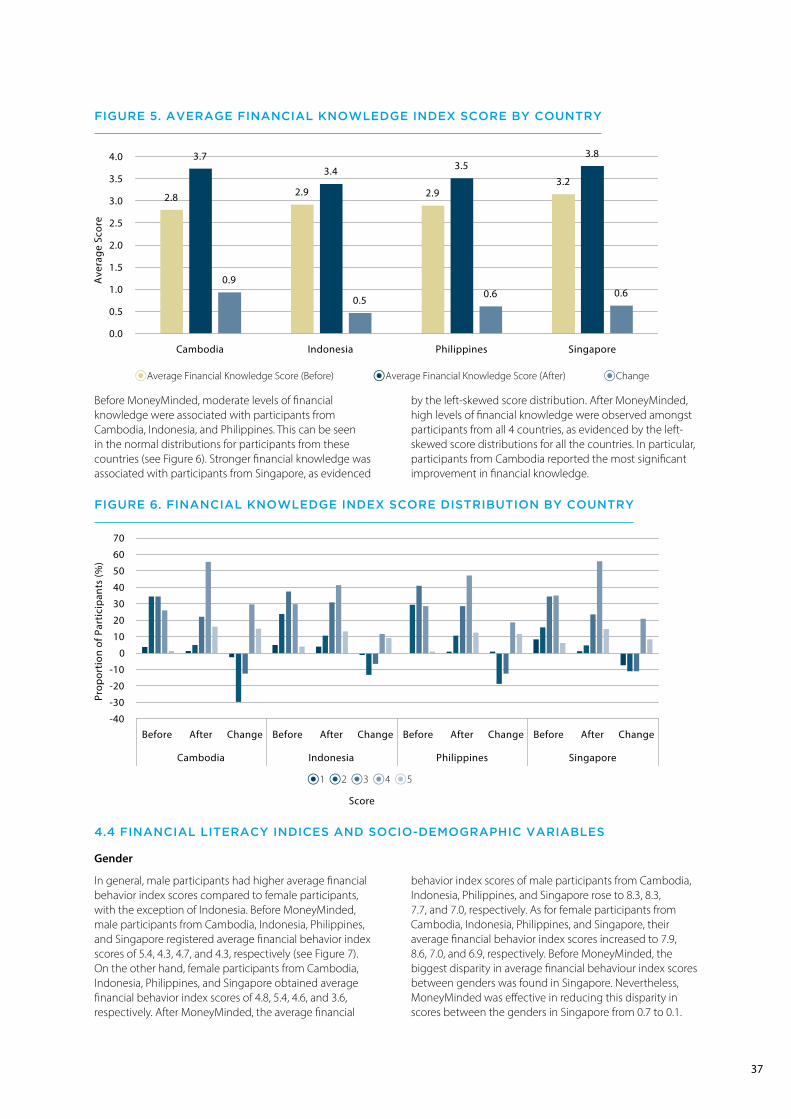
Prior to MoneyMinded, participants from Cambodia (average index score = 2.8) and Singapore (average index score = 3.2) had the lowest and highest average financial knowledge index scores, respectively (see Figure 5). After MoneyMinded, participants from Indonesia (average score = 3.4) and Singapore (average score = 3.8) had the lowest
and highest average financial knowledge index scores, respectively. MoneyMinded was effective in improving the financial knowledge of participants across all four countries. The average financial knowledge index scores increased by 0.9, 0.5, 0.6, and 0.6 for participants from Cambodia, Indonesia, Philippines, and Singapore, respectively.
37
Before MoneyMinded, moderate levels of financial knowledge were associated with participants from Cambodia, Indonesia, and Philippines. This can be seen in the normal distributions for participants from these countries (see Figure 6). Stronger financial knowledge was associated with participants from Singapore, as evidenced
by the left-skewed score distribution. After MoneyMinded, high levels of financial knowledge were observed amongst participants from all 4 countries, as evidenced by the left-skewed score distributions for all the countries. In particular, participants from Cambodia reported the most significant improvement in financial knowledge.
gender
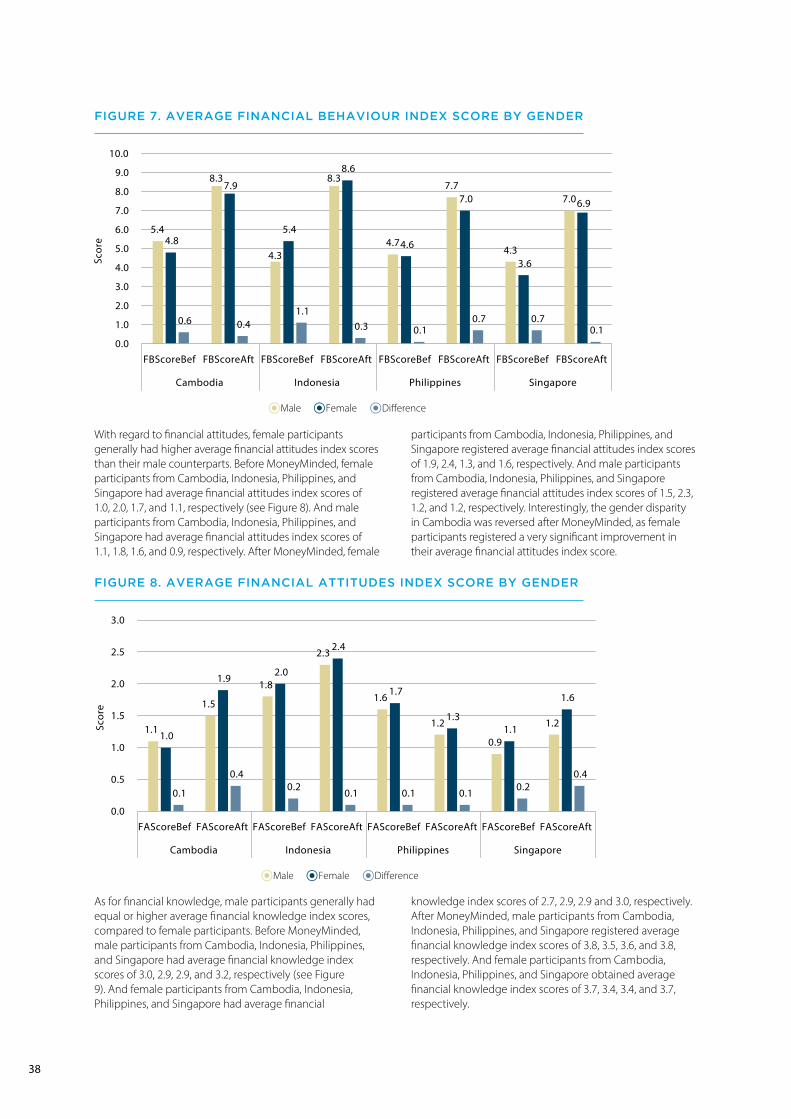
In general, male participants had higher average financial behavior index scores compared to female participants, with the exception of Indonesia. Before MoneyMinded, male participants from Cambodia, Indonesia, Philippines, and Singapore registered average financial behavior index scores of 5.4, 4.3, 4.7, and 4.3, respectively (see Figure 7). On the other hand, female participants from Cambodia, Indonesia, Philippines, and Singapore obtained average financial behavior index scores of 4.8, 5.4, 4.6, and 3.6, respectively. After MoneyMinded, the average financial
behavior index scores of male participants from Cambodia, Indonesia, Philippines, and Singapore rose to 8.3, 8.3, 7.7, and 7.0, respectively. As for female participants from Cambodia, Indonesia, Philippines, and Singapore, their average financial behavior index scores increased to 7.9, 8.6, 7.0, and 6.9, respectively. Before MoneyMinded, the biggest disparity in average financial behaviour index scores between genders was found in Singapore. Nevertheless, MoneyMinded was effective in reducing this disparity in scores between the genders in Singapore from 0.7 to 0.1.
4.4 finanCial literaCY indiCes and soCio-demoGraPhiC Variables
fiGure 5. aVeraGe finanCial KnoWledGe indeX sCore bY CountrY
fiGure 6. finanCial KnoWledGe indeX sCore distribution bY CountrY
38
With regard to financial attitudes, female participants generally had higher average financial attitudes index scores than their male counterparts. Before MoneyMinded, female participants from Cambodia, Indonesia, Philippines, and Singapore had average financial attitudes index scores of 1.0, 2.0, 1.7, and 1.1, respectively (see Figure 8). And male participants from Cambodia, Indonesia, Philippines, and Singapore had average financial attitudes index scores of 1.1, 1.8, 1.6, and 0.9, respectively. After MoneyMinded, female
fiGure 7. aVeraGe finanCial behaViour indeX sCore bY Gender
fiGure 8. aVeraGe finanCial attitudes indeX sCore bY Gender
participants from Cambodia, Indonesia, Philippines, and Singapore registered average financial attitudes index scores of 1.9, 2.4, 1.3, and 1.6, respectively. And male participants from Cambodia, Indonesia, Philippines, and Singapore registered average financial attitudes index scores of 1.5, 2.3, 1.2, and 1.2, respectively. Interestingly, the gender disparity in Cambodia was reversed after MoneyMinded, as female participants registered a very significant improvement in their average financial attitudes index score.
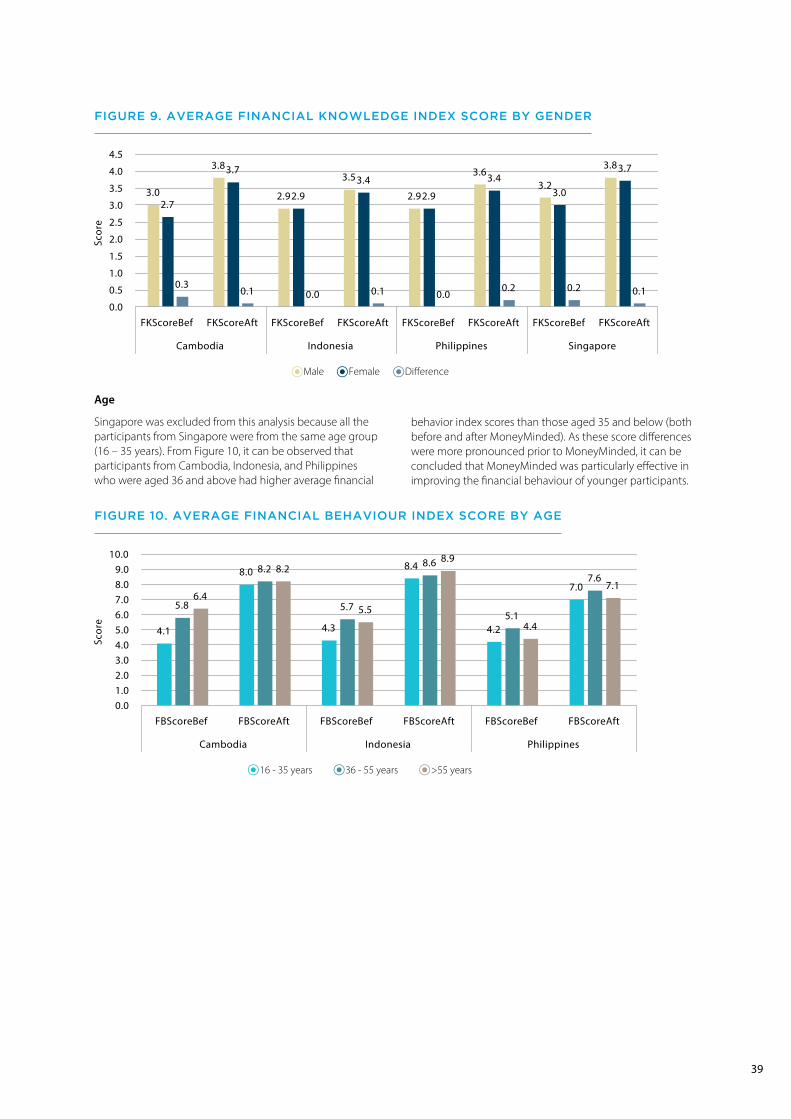
As for financial knowledge, male participants generally had equal or higher average financial knowledge index scores, compared to female participants. Before MoneyMinded, male participants from Cambodia, Indonesia, Philippines, and Singapore had average financial knowledge index scores of 3.0, 2.9, 2.9, and 3.2, respectively (see Figure 9). And female participants from Cambodia, Indonesia, Philippines, and Singapore had average financial
knowledge index scores of 2.7, 2.9, 2.9 and 3.0, respectively. After MoneyMinded, male participants from Cambodia, Indonesia, Philippines, and Singapore registered average financial knowledge index scores of 3.8, 3.5, 3.6, and 3.8, respectively. And female participants from Cambodia, Indonesia, Philippines, and Singapore obtained average financial knowledge index scores of 3.7, 3.4, 3.4, and 3.7, respectively.
39
Age
Singapore was excluded from this analysis because all the participants from Singapore were from the same age group (16 – 35 years). From Figure 10, it can be observed that participants from Cambodia, Indonesia, and Philippines who were aged 36 and above had higher average financial
fiGure 9. aVeraGe finanCial KnoWledGe indeX sCore bY Gender
fiGure 10. aVeraGe finanCial behaViour indeX sCore bY aGe
behavior index scores than those aged 35 and below (both before and after MoneyMinded). As these score differences were more pronounced prior to MoneyMinded, it can be concluded that MoneyMinded was particularly effective in improving the financial behaviour of younger participants.

40
From Figure 12, it can be observed that for Cambodia and Indonesia, participants in the middle-aged group (aged 36 – 55 years) registered higher average financial knowledge index scores, compared with the other age groups (both before and after MoneyMinded). Furthermore, MoneyMinded resulted in younger participants (aged 16 – 35 years) from Cambodia and Indonesia achieving
Figure 11 indicates that before MoneyMinded, younger participants (aged 16 – 35 years) were likely to have the lowest average financial attitudes index score. Greater inter-country variations in average financial attitudes index scores were observed after MoneyMinded. For Cambodia, the average financial attitudes index score seemed to have a negative relationship with the age group. For Indonesia, younger participants (aged 16 – 35 years) had an average
financial attitudes index score that was comparable with the scores of middle-aged participants (aged 36 – 55 years) and older participants (aged >55 years). For Philippines, the average financial attitudes index score of young participants (aged 16 – 35 years) was equal to the score of old participants (aged >55 years), but lower than the score of middle-aged participants (aged 36 – 55 years).
average financial knowledge index scores that were comparable with the scores of middle-aged participants. For Philippines, younger participants (aged 16 – 35 years) registered a higher average financial knowledge index score compared with the scores of the other age groups, prior to MoneyMinded. This difference in scores was maintained after MoneyMinded.
fiGure 11. aVeraGe finanCial attitudes indeX sCore bY aGe
fiGure 12. aVeraGe finanCial KnoWledGe indeX sCore bY aGe

41
Education
For Cambodia, Indonesia, and Singapore, the average financial behavior index score increased with decreasing educational qualification (see Figure 13). By contrast, participants from Philippines with pre-secondary educational qualification were found to have a lower average financial behavior index score, compared with the scores of participants with higher educational levels. After MoneyMinded, the average financial behavior index scores were generally similar across educational levels for
participants from Cambodia and Indonesia. For Philippines, the average financial behavior index score for participants with pre-secondary educational qualification became higher than that of participants with post-secondary educational qualification, but lower than that of participants with secondary educational qualification. In general, MoneyMinded effectively reduced differences in average behavior index scores across different educational levels.
Before MoneyMinded, for Indonesia and Singapore, the average financial attitudes index score decreased with increasing educational qualification (see Figure 14). This pattern persisted for Singapore after MoneyMinded. However, Indonesian participants with secondary or post-secondary educational qualification performed better than participants with a pre-secondary educational qualification, after MoneyMinded. For Cambodia and Philippines,
participants with secondary educational qualifications were found to have higher average financial attitudes index scores, compared with the scores of participants with other educational qualifications, before MoneyMinded. After MoneyMinded, participants from Cambodia and Philippines with pre-secondary educational qualification had a lower average financial attitudes index score, relative to participants with higher levels of educational qualification.
fiGure 13. aVeraGe finanCial behaVior indeX sCore bY eduCation
fiGure 14. aVeraGe finanCial attitudes indeX sCore bY eduCation
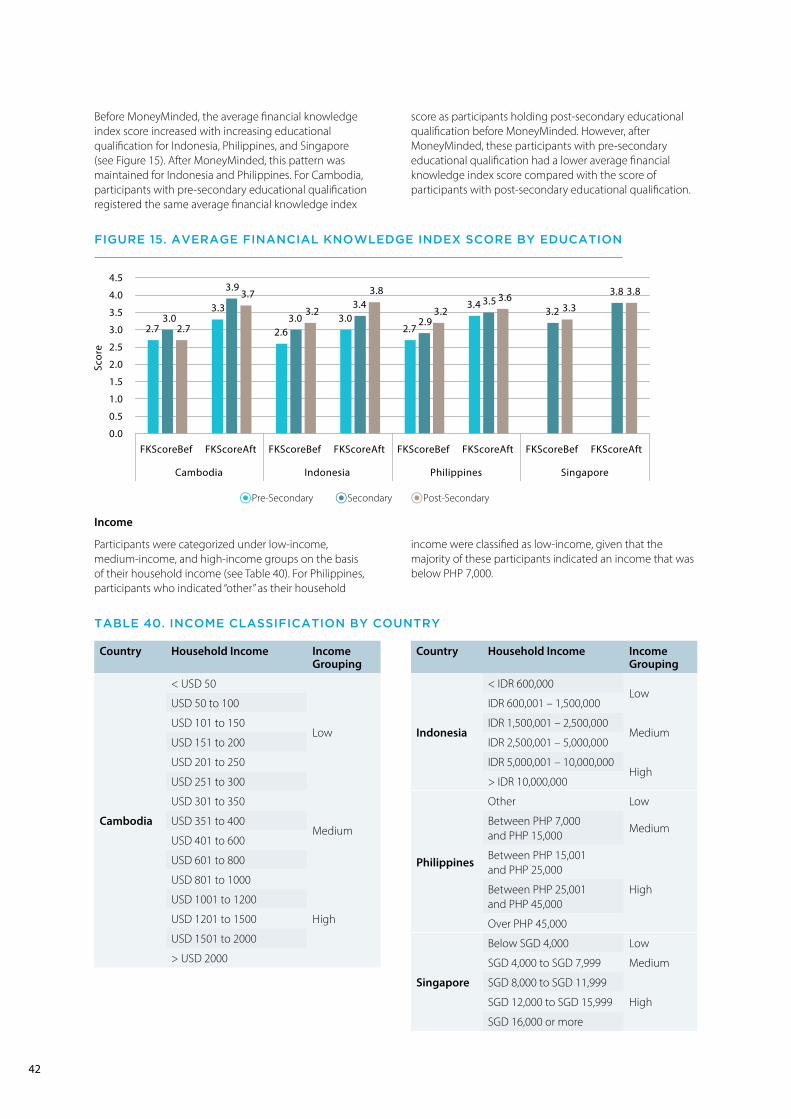
42
fiGure 15. aVeraGe finanCial KnoWledGe indeX sCore bY eduCation
Before MoneyMinded, the average financial knowledge index score increased with increasing educational qualification for Indonesia, Philippines, and Singapore (see Figure 15). After MoneyMinded, this pattern was maintained for Indonesia and Philippines. For Cambodia, participants with pre-secondary educational qualification registered the same average financial knowledge index
score as participants holding post-secondary educational qualification before MoneyMinded. However, after MoneyMinded, these participants with pre-secondary educational qualification had a lower average financial knowledge index score compared with the score of participants with post-secondary educational qualification.
Income
Participants were categorized under low-income, medium-income, and high-income groups on the basis of their household income (see Table 40). For Philippines, participants who indicated “other” as their household
income were classified as low-income, given that the majority of these participants indicated an income that was below PHP 7,000.
country Household Income Income grouping
cambodia
< USD 50
Low
USD 50 to 100
USD 101 to 150
USD 151 to 200
USD 201 to 250
USD 251 to 300
USD 301 to 350
MediumUSD 351 to 400
USD 401 to 600
USD 601 to 800
USD 801 to 1000
High
USD 1001 to 1200
USD 1201 to 1500
USD 1501 to 2000
> USD 2000
country Household Income Income grouping
Indonesia
< IDR 600,000Low
IDR 600,001 – 1,500,000
IDR 1,500,001 – 2,500,000Medium
IDR 2,500,001 – 5,000,000
IDR 5,000,001 – 10,000,000High
> IDR 10,000,000
Philippines
Other Low
Between PHP 7,000 and PHP 15,000
Medium
Between PHP 15,001 and PHP 25,000
HighBetween PHP 25,001 and PHP 45,000
Over PHP 45,000
Singapore
Below SGD 4,000 Low
SGD 4,000 to SGD 7,999 Medium
SGD 8,000 to SGD 11,999
HighSGD 12,000 to SGD 15,999
SGD 16,000 or more
table 40. inCome ClassifiCation bY CountrY
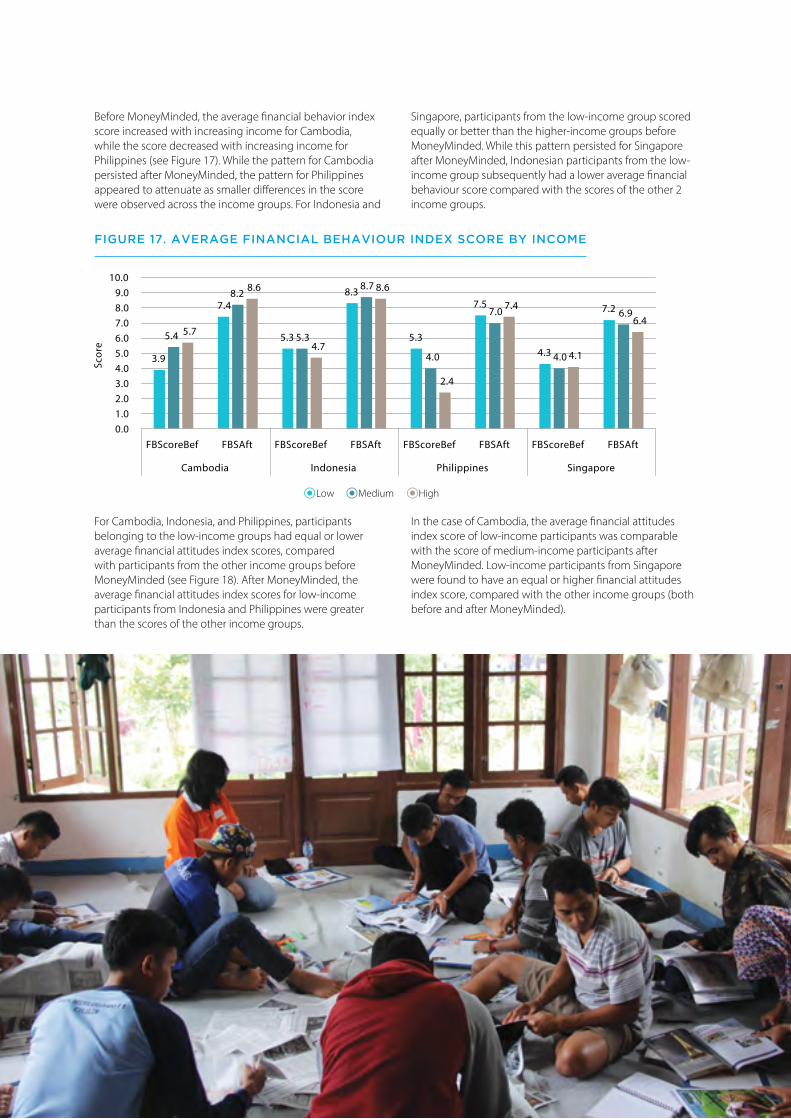
43
Before MoneyMinded, the average financial behavior index score increased with increasing income for Cambodia, while the score decreased with increasing income for Philippines (see Figure 17). While the pattern for Cambodia persisted after MoneyMinded, the pattern for Philippines appeared to attenuate as smaller differences in the score were observed across the income groups. For Indonesia and
Singapore, participants from the low-income group scored equally or better than the higher-income groups before MoneyMinded. While this pattern persisted for Singapore after MoneyMinded, Indonesian participants from the low-income group subsequently had a lower average financial behaviour score compared with the scores of the other 2 income groups.
For Cambodia, Indonesia, and Philippines, participants belonging to the low-income groups had equal or lower average financial attitudes index scores, compared with participants from the other income groups before MoneyMinded (see Figure 18). After MoneyMinded, the average financial attitudes index scores for low-income participants from Indonesia and Philippines were greater than the scores of the other income groups.
In the case of Cambodia, the average financial attitudes index score of low-income participants was comparable with the score of medium-income participants after MoneyMinded. Low-income participants from Singapore were found to have an equal or higher financial attitudes index score, compared with the other income groups (both before and after MoneyMinded).
fiGure 17. aVeraGe finanCial behaViour indeX sCore bY inCome

44
fiGure 19. aVeraGe finanCial KnoWledGe indeX sCore bY inCome
fiGure 18. aVeraGe finanCial attitudes indeX sCore bY inCome
For Cambodia and Indonesia, participants from the medium-income and high-income groups had higher average financial knowledge index scores, compared with participants from the low-income groups, (both before and after MoneyMinded) (see Table 19). For Singapore, participants from the low-income and medium-income groups had higher average financial knowledge index scores, compared with participants from the high-income
group before MoneyMinded. After MoneyMinded, Singaporean participants from the medium-income and high-income groups had higher average financial knowledge index scores than participants from the low-income group. And for Philippines, participants from the high-income group had an equal or higher average financial knowledge index score, compared with the other income groups (both before and after MoneyMinded).
45
5.0 case studies oF MoneyMinded paRticipants
This section presents case studies of MoneyMinded participants from the four countries, as well as an additional case study of a participant from Laos. These case studies show that MoneyMinded has effectively imparted financial knowledge to participants, and improved their abilities to manage expenses and savings, and set goals and plans for the future.
her savings. In the long run, she hopes to use the savings to open a restaurant with her sister. Upon further reflection, she acknowledges that she would never have saved nor developed a concrete plan for her future if she had not participated in MoneyMinded.
5.2 tati from indonesia
Tati, aged 39, is a member and also a group leader of YCAB Bogor, an NGO focusing on youth development. She lives in Kampung Hegarasa Leuwiliyang. Her husband is employed by a company near their house and earns a fixed income. Amongst their four children, the first and second are employed and live independently. However, the first and second children still provide financial support to the family, something that Tati is proud of and grateful for. The third child is in junior high school and the youngest is 3 years old.
Being a YCAB Bogor group leader comes with responsibility and obligation. Tati often feels obligated to help other YCAB Bogor members by lending them money. She finds it difficult to refuse their requests for financial aid. In 2016, her family faced an unexpected expense when her husband fell ill. With this financial burden, she knew that she could no longer help other members financially. As such, she felt sorry for her fellow members.
5.1 ouK thYda from Cambodia
Ouk Thyda, aged 21, comes from a poor family in Kandal province. She is a senior university student and is graduating this year. Her studies in a university in Phnom Penh are fully sponsored by a charity organization. Besides paying for her tuition fee, the charity also pays for her learning materials, uniform, and meals. She currently has other two sources of income, in addition to the non-financial sponsorship. They are pocket money of USD 1.75 per week and part-time job earnings of USD 6.00 per week. Given the low income, Thyda has often found herself without any money left before the next pay day. However, her situation has changed after her participation in MoneyMinded.
After two days of MoneyMinded training in 2016, Thyda has changed her attitude and behavior towards her personal finance and future. She now understands the importance of saving and how to do it effectively. She saves for both short-term and long-term goals by refraining from impulsive purchases, reducing expenditure on unnecessary items, and making a budget. Despite her low income, she now saves up to USD 6.00 per week. Furthermore, the training has motivated her to develop specific life plans, something that has never crossed her mind previously. She now plans to work in a company for four years after graduation; during this period of time, she will support her family and increase

46
“mY husband is VerY haPPY that i
attended moneYminded. he said
that the ProGram is VerY useful
for our familY.”
- tati, moneYminded PartiCiPant
Tati attended MoneyMinded in September 2016. The program has helped her to understand that money management is a family effort. After participating in MoneyMinded, she has begun to track the family’s cashflows diligently. She has become more open in discussing family finances with her husband, as well as seeking his advice on financial matters. She is also more assertive in dealing with other YCAB Bogor members’ requests for financial aid, as she now prioritizes her family’s needs. Additionally, she has learnt to make long-term financial plans. She and her husband are now working towards their plan to open a business selling bird feed in the local market. “My husband is very happy that I attended MoneyMinded. He said that the program is very useful for our family.”
5.3 ibrah from PhiliPPines
“after a feW months of folloWinG
mY Plan, i feel that mY life has
imProVed. i’m noW more PositiVe,
not onlY With mY finanCes,
but also With mY situation in
General. in faCt, the boost in
ConfidenCe has alloWed me to
seCure full-time WorK in a non-
Profit orGanisation that ProVides
assistanCe to other PWds liKe
mYself. thanK You, moneYminded,
for the Wonderful traininG.”
- ibrah, moneYminded PartiCiPant
Ibrah is a PWD who faces challenges every day. People’s biases and discriminatory behavior have limited her opportunities and negatively affected her self-confidence. As such, she has been burdened with doubt about her ability to improve her personal and financial situation in life.
Ibrah participated in MoneyMinded in June 2016. Since then, her mindset about what she can accomplish has changed. The program has helped her to think about her goals and when she wants to achieve them. The vision board that she created during the program (which she
places on her bed’s headboard) serves as a source of daily inspiration and a reminder to work hard for her dreams.
As a first step, Ibrah has started putting away her money in three coin banks: one for emergencies, one for her nieces’ education, and one for her personal expenses. The program has helped her to become wiser on how she tracks and spends money. She has bought a notebook and uses it to organize and track all her expenses. She also jots down her daily to-do and shopping list in the notebook.
“After a few months of following my plan, I feel that my life has improved. I’m now more positive, not only with my finances, but also with my situation in general. In fact, the boost in confidence has allowed me to secure full-time work in a non-profit organisation that provides assistance to other PWDs like myself. Thank you, MoneyMinded, for the wonderful training.”
5.4 lim Jun Kit from sinGaPore
Lim Jun Kit, aged 18, is an Information Technology student in a technical college in Singapore. He lives with his parents, and his household’s monthly income is between SGD 4000 and 8000.
Jun Kit is an avid gamer. He started saving money so that he could purchase the latest games. Each game he bought would cost about SGD 60 to 70, and so he often cut corners when it came to spending on other things, such as food. MoneyMinded taught him the importance of saving for the future, especially with regard to saving for emergencies. This has led him to significantly increase the amount of money he saves per week. In the past, he would spend all his remaining cash on games and clothes; now he saves between SGD 30 to 100 a week, depending on whether school is in session or he is taking on a vacation job. MoneyMinded taught him about needs and wants, as well as how to differentiate between them. This knowledge helps him to be more judicious in his spending, giving him a wider margin for savings.
Through MoneyMinded, Jun Kit learnt that saving money is not only about setting fixed amounts to save every week or month, but also about the attitudes he holds towards money. Prior to MoneyMinded, he spent much money on clothes; although he did not buy branded clothes, he still managed to spend a significant amount of his daily allowance on clothes. He believed then that money was meant to be spent, and as a student, he had no financial woes. MoneyMinded taught him that he needs money in order to fulfil his dreams for the future. While he cannot quite remember the goals he set during the first session of MoneyMinded, he remembers several tips the instructors taught the class to help them reach their goals.
Jun Kit learnt not only how to manage his money, but also how to counsel friends who wish to borrow significant amounts of cash from him. In the past, he had lent small amounts of money to friends. However, when he faced a request from a friend to borrow a large sum of money, say over SGD 100, he became unsure of how to respond. But now that he has attended MoneyMinded, he is likely to advise his friend to reconsider her/his purchase, as well

47
as offer her/him alternatives to the purchase which can yield the same level of satisfaction. Another takeaway from MoneyMinded for him is that as a student, he should approach his parents when he faces financial emergencies. This is more prudent than turning to other forms of financial assistance.
5.5 oad KhomXienGdY from laos
Oad Khomxiengdy, aged 51, lives in Sikai village and sells cooked food to workers in a garment factory. Her husband works in a jewellery factor, and her 3 children study in a secondary school. She sells packed food to the factory workers at USD 0.25 to 0.30 per pack. The price of her packed food is controlled by the factory, and is much lower than the price of USD 0.60 to 0.80 charged by sellers in the market. Her monthly income is between USD 80 and USD 90, and her husband’s salary is about USD 170.
Before attending MoneyMinded, Oad has never done budgeting. Most of the time, her family runs out of money before the next pay day, and has to borrow money from private lenders who charge high interest rates of 15-20% per month. Consequently, she and her husband often have to wake up at 1am to offer trolley services in the wet market for 3 to 4 hours to make more money to pay off their debts. “We don’t have time to relax and think of our future. We don’t know what will happen if we are sick or if we get older and don’t have energy to work anymore.”
After attending MoneyMinded, Oad realizes that she does not need to wait until she earns a higher income to start saving and managing her family finances. She now budgets, and prioritizes her family expenses by differentiating needs from wants. She is able to cut away unnecessary expenses, save, and set financial goals. “I will think twice or even thrice. Do I really need this? What are the pros and cons of spending on this?”
Oad has shared what she learnt from MoneyMinded with her husband. As a result, he has significantly reduced his expenses on cigarettes and alcohol. He has reflected on not only his monthly expenses on cigarettes and alcohol, but also the high cost of medical treatment should he contract cancer from excessive smoking and drinking. In particularly, he has heard that someone spent at least USD 80,000 in Thailand for cancer treatment. Given the family’s financial situation, he would definitely have to borrow a huge sum of money at high interest rates from private lenders, should he require medical treatment in future. As Oad and her husband are now prudent in their expenses, they have managed to settle 60% of their debts. She believes that she can settle all their debts in the near future, and eventually have enough savings to buy a new motorcycle for her husband.
Oad now displays her vision board on the wall beside her bed, to remind her of her family’s goals. And she and her husband maintain a family budgeting notebook, based on the household budgeting template that MoneyMinded has shared with participants. She hopes that her cousin and her children can attend MoneyMinded in future.

48
6.0 conclusion
Across all four countries, MoneyMinded was effective in improving participants’ money management abilities, financial knowledge, and forward planning abilities. Importantly, this improvement in financial literacy resulted in a better quality of life for the participants and a positive impact on their loved ones. While participants from Philippines appeared to experience regression in some financial attitudes after MoneyMinded, these contrarian findings might be due to the different dynamics associated with conducting the MoneyMinded modules in sign
language. Nevertheless, this first iteration of MoneyMinded targeted at PWDs did achieve its overall objective of raising PWDs’ financial literacy and providing a platform for their empowerment. The findings also revealed inter-country and intra-country variations in financial behaviour, attitudes, and knowledge. Furthermore, MoneyMinded appeared to have attenuated socio-demographic inequalities in financial literacy. These results would be useful in informing future iterations of MoneyMinded.

49
ReFeRences
Anatha-Nageswaran, V. (2008). [Commentary on “Global Financial Crisis: Implications for ASEAN”]. Institute of Southeast Asian Studies, Singapore.
Atkinson, A., & Messy, F. (2012). Measuring Financial Literacy: Results of the OECD/International Network on Financial Education (INFE) Pilot Study. OECD Working Papers on Finance, Insurance and Private Pensions, No. 15, OECD Publishing, Paris.
World Bank. (April, 2017). “Sustaining Resilience” East Asia and Pacific Economic Update.
Yoshino, N., Morgan, P., & Wignaraja, G. (2015). Financial Education in Asia: Assessment and Recommendations. ADBI Working Paper 534. Tokyo: Asian Development Bank Institute.

50


Australia and n
ew Zealand Banking g
roup limited (A
nZ) A
BN 11 005 357 522. 07/2017
HG
24
anz.com/asiapacific