Embed Size (px)
Citation preview
Equity research│June 13, 2018
Asia Pacific Daily - 13 June 2018 Equity Research Reports…
▌IDEA OF THE DAY | Hong Kong China Yuhua Education Corp (ADD, tp:HK$7.10▲) - Still a hidden gem | P2 We believe consensus underestimates the pace of Hunan Lie Ying's margin expansion, and raise our FY8/18-20 adjusted net profit forecasts by 0.4-7.8%. Yuhua has the ability to substantially raise Hunan Lie Ying's margin profile rapidly, in our view, given its expertise in managing its university in Zhengzhou. Organic growth remains strong on the back of influx of transfer students. We expect Yuhua to ride on positive policy tailwinds and conduct further M&As. Maintain Add. We raise our TP to HK$7.10. Yuhua is our top pick within the K-12 private school segment. ——————————————————————————————————————————————————————————————————————————————————————— ▌Australia Centuria Industrial REIT (HOLD▼, tp:A$2.63▲) - Revaluations, leasing and debt reduction | P3 ——————————————————————————————————————————————————————————————————————————————————————— ▌China/Hong Kong Autos (NEUTRAL) - May shipments: Slowdown from April | P4 Property - Overall (OVERWEIGHT) - Property Corporate Day takeaways - HK property | P5 ——————————————————————————————————————————————————————————————————————————————————————— ▌India Cement (NEUTRAL) - Into the value zone | P6 ——————————————————————————————————————————————————————————————————————————————————————— ▌Malaysia Agribusiness (NEUTRAL) - Weak demand concern trumps declining output | P7 ——————————————————————————————————————————————————————————————————————————————————————— ▌Singapore UOL Group (ADD, tp:S$9.65) - Ground checks show healthy residential take up | P8 ——————————————————————————————————————————————————————————————————————————————————————— ▌Thailand Minor International (ADD, tp:THB44.50) - MINT launches a tender offer for NHH | P9
Recent CGS-CIMB Research Ideas
HKG: GCL-Poly 11/6 A victim of government controls on solar power
——————————————————————————————————————————————————————————————————————————————————
KRW: Samsung Electro-Mechanics 8/6 Stronger MLCC momentum ahead
——————————————————————————————————————————————————————————————————————————————————
INA: Industrial - Overall 7/6 Set for smooth rolling
——————————————————————————————————————————————————————————————————————————————————
MAL: Strategy Note 6/6 Potential impact of higher minimum wage
——————————————————————————————————————————————————————————————————————————————————
THB: Banpu 5/6 Stronger core and reported quarterly NP from 2Q18F
——————————————————————————————————————————————————————————————————————————————————
Regional Equity Research Contact
Bertram LAI Head of Research T: (852) 2532 1111 E: [email protected]
———————————————————————————————————————————————————————————————————————————————————
Show Style "View Doc Map"
Upcoming CGS-CIMB Conf. / Events
CIMB Malaysia Consumer Day 03 Jul, Theme: Malaysia; LOC: Kuala Lumpur —————————————————————————————————————————
CGS-CIMB 12th Annual Indonesia Conference 11-13 Jul; Theme: Indonesia; LOC: Bali —————————————————————————————————————————
IMPORTANT DISCLOSURES, INCLUDING ANY REQUIRED RESEARCH CERTIFICATIONS, ARE PROVIDED AT THE END OF THIS REPORT. IF THIS REPORT IS DISTRIBUTED IN THE UNITED STATES IT IS DISTRIBUTED BY CIMB SECURITIES (USA), INC. AND IS CONSIDERED THIRD-PARTY AFFILIATED RESEARCH.
Powered by the EFA Platform
Company Note Education│Hong Kong│June 12, 2018
IMPORTANT DISCLOSURES, INCLUDING ANY REQUIRED RESEARCH CERTIFICATIONS, ARE PROVIDED AT THE END OF THIS REPORT. IF THIS REPORT IS DISTRIBUTED IN THE UNITED STATES IT IS DISTRIBUTED BY CIMB SECURITIES (USA), INC. AND IS CONSIDERED THIRD-PARTY AFFILIATED RESEARCH.
Powered by the EFA Platform
Insert Insert
China Yuhua Education Corp Still a hidden gem ■ We believe consensus underestimates the pace of Hunan Lie Ying’s margin
expansion, and raise our FY8/18-20 adjusted net profit forecasts by 0.4-7.8%. ■ Yuhua has the ability to substantially raise Hunan Lie Ying’s margin profile rapidly, in
our view, given its expertise in managing its university in Zhengzhou. ■ Organic growth remains strong on the back of influx of transfer students. ■ We expect Yuhua to ride on positive policy tailwinds and conduct further M&As. ■ Maintain Add. We raise our TP to HK$7.10. Yuhua is our top pick within the K-12
private school segment.
Market still underestimates margin recovery potential We lift our FY18/19 adjusted net profit forecasts 0.4%/7.2% to Rmb575.5m/Rmb736.4m, i.e. 33.9%/28.0% yoy growth on higher margin assumptions. Post Hunan Lie Ying’s consolidation in Jan, Yuhua is more confident of improving the university’s margin. We forecast Hunan Lie Ying’s NPM rising to 25%/40% in FY18/19F, from 17.0% in 1H18 and 8.8% in 9M17. We expect Hunan Lie Ying to post Rmb400m/Rmb420m revenue in FY18/ 19F, and contribute 12.2% and 16.0% of Yuhua’s adjusted net profit.
A clear path to higher margins We believe Yuhua can raise Hunan Lie Ying’s margin profile substantially within 1.5 years of consolidation, given its Zhengzhou university’s net margin of 55.6% in FY17. Management plans to raise the Hunan university’s fees in the 2018/19 academic year, as its average tuition fee of c.Rmb14,000 p.a. is far below peers’ c.Rmb22,000. Three areas have been outlined for cost cutting: 1) optimising student-to-teacher ratio (Hunan: 19x vs. Zhengzhou: 29x), 2) stricter cost control, and 3) paring down of debt. We forecast Yuhua can achieve overall adjusted NPM of 52.3% by FY20F (FY17: 48.2%).
Strong organic growth from incoming transfer students We forecast adjusted revenue growth of 41.2%/20.5% in FY18/19F (organic growth of 10.9%/8.0%). We understand from management that incoming transfer students for the second semester in 2017/18 academic year doubled to c.1,500 students from 2016/17. We also expect Yuhua to successfully raise tuition fees for its Hunan university for FY19F, given it does not need the local pricing authority’s approval but merely has to submit information on fees for record purposes.
Riding the policy tailwind; more M&As to come? We expect China Yuhua to continue riding the positive policy tailwinds. The consultation paper released by Ministry of Education in Apr reiterated the government’s supportive stance on private education, in our view. In late-May, Yuhua announced a US$75m loan from International Finance Corporation at an interest rate of LIBOR+1.7% p.a., with an additional US$75m tranche available for future drawdown. We estimate Yuhua currently has Rmb1.5bn available for potential acquisitions.
Maintain Add with a higher DCF-based TP of HK$7.10 (WACC: 8.9%) Maintain Add. Yuhua remains our top pick within the K-12 private school segment, as we see further room for Bloomberg consensus earning upgrades on the back of Hunan Lie Ying’s improving margin profile. We lift our DCF-based TP to HK$7.10 on the back of raised EPS forecasts, representing 25.6x FY19F P/E. Share price catalysts include 1) better-than-expected margin enhancement for Hunan Lie Ying, and 2) further M&As. Key risks include longer ramp-up periods for new schools and regulatory risks.
SOURCES: CGS-CIMB RESEARCH, COMPANY REPORTS
Hong Kong
ADD (no change) Consensus ratings*: Buy 15 Hold 3 Sell 1
Current price: HK$5.70 Target price: HK$7.10 Previous target: HK$5.40
Up/downside: 24.6% CGS-CIMB / Consensus: 20.9%
Reuters: 6169.HK Bloomberg: 6169 HK Market cap: US$2,372m HK$18,610m Average daily turnover: US$7.83m HK$61.41m Current shares o/s: 3,000m Free float: 25.0% *Source: Bloomberg Key changes in this note
FY18F EPS increased by 0.4%. FY19F EPS increased by 7.2%. FY20F EPS increased by 7.8%.
Source: Bloomberg
Price performance 1M 3M 12M Absolute (%) 15.4 24.5 110.3 Relative (%) 15.6 24.3 91
Major shareholders % held Li Guangyu 75.0 Insert
Analyst(s)
Lei YANG, CFA
T (86) 21 5047 1771 x108 E [email protected] ONG Khang Chuen T (852) 2539 1326 E [email protected]
Financial Summary Aug-16A Aug-17A Aug-18F Aug-19F Aug-20F
Revenue (Rmbm) 781 846 1,195 1,440 1,522Operating EBITDA (Rmbm) 411.7 384.1 591.7 811.1 893.2Net Profit (Rmbm) 311.7 319.3 481.7 676.3 746.6Normalised EPS (Rmb) 0.15 0.17 0.18 0.23 0.24Normalised EPS Growth 253% 14% 10% 23% 8%FD Normalised P/E (x) 31.59 28.00 25.49 20.55 19.02DPS (Rmb) 0.00 0.06 0.08 0.10 0.11Dividend Yield 0.00% 1.36% 1.67% 2.14% 2.31%EV/EBITDA (x) 24.05 22.80 18.59 14.78 13.27P/FCFE (x) 67.58 NA 21.87 18.35 19.65Net Gearing 1.1% (25.9%) (51.8%) (58.9%) (62.2%)P/BV (x) 11.15 5.63 4.35 3.95 3.58ROE 42.7% 25.7% 19.3% 20.1% 19.7%% Change In Normalised EPS Estimates 0.44% 7.19% 7.79%Normalised EPS/consensus EPS (x) 1.16 1.13 1.07
81
116
151
186
221
2.20
3.20
4.20
5.20
6.20Price Close Relative to HSI (RHS)
100200300400
Jun-17 Sep-17 Dec-17 Mar-18
Vol m
2
REIT│Australia│Equity research│June 12, 2018
IMPORTANT DISCLOSURES REGARDING COMPANIES THAT ARE THE SUBJECT OF THIS REPORT AND AN EXPLANATION OF RECOMMENDATIONS CAN BE FOUND AT THE END OF THIS DOCUMENT. MORGANS FINANCIAL LIMITED (ABN 49 010 669 726) AFSL 235410 - A PARTICIPANT OF ASX GROUP
Powered by EFA
Centuria Industrial REIT
Revaluations, leasing and debt reduction
CIP has announced some new leasing deals, revaluations and an asset sale pre ■30 June. Gearing now sits around 37% with NTA at A$2.58.
Post the asset sale, FY19 guidance has been provided comprising EPS of 18.5-■19c and DPS of 18.4c.
We move to a Hold rating (from Add) with a revised price target of A$2.63. ■
Further leasing activity Over April and May, CIP has agreed terms on a further 22,041sqm of the portfolio’s lettable area. Subsequently, FY18/FY19 lease expiries stand at 0%/6.1% (vs 3.5%/11.2% as at December 2017). During 1H18 there were 18 lease transactions completed (approximately 21% of portfolio GLA) so with 2H18 activity this increases leasing over FY18 to around 32% of GLA. Occupancy currently sits at around 94% (vs 95.9% at December 2017 which was +3.8% from June 2017).
Asset sales and revaluations move gearing to around 37% CIP has announced the sale of its Preston asset for A$30.1m (+10.7% premium to book value) with proceeds used to reduce debt (settlement June 2018). CIP has also announced revaluations of A$27.4m/+10.8% (across 10 assets mainly NSW/VIC and off the back of leasing outcomes). Incorporating the asset sale and revaluations, the portfolio is currently valued at around A$1bn (across 38 assets) with a WACR of approximately 6.8% and WALE of 5.2 years (up from 4.4 years as at June 2017). Positively, gearing is now around 37% post the asset sale and revaluations (down from around 43% at June 2017). NTA is currently A$2.58 (vs A$2.46 as at December 2017).
FY19 guidance provided post asset sale FY19 guidance has also been provided comprising EPS of 18.5-19.0c (vs Morgans at 20.4c) and DPS of 18.4c vs FY18 guidance comprising EPS of 19.5-20c and DPS of 19.4c. We adjust our forecasts for the asset sale and FY19 guidance and assume no further asset sales. We note CIP continues to hold a 7.7% interest in Propertylink (PLG). We expect the next trading update with the FY result on 21 August.
Offers exposure to Australian industrial property CIP offers investors a pure exposure to Australian industrial property. Despite some near-term leasing challenges, we back management’s in-house leasing capabilities to deliver improved occupancy over the medium term. CIP offers an attractive 7.1% FY19 distribution yield with cashflows supported by stable rents (around 80% of the portfolio is subject to average 3% rental growth pa). Following forecast changes and a roll forward, our price target moves to A$2.63 (from A$2.59) based on a 50/50 DCF/NAV (6.9% cap rate). Key near-term catalysts relate to earlier-than-expected leasing outcomes. Risks include material increases in bond yields; falls in asset prices; lack of access to funding and tenant default/non-renewal. Following security price appreciation, we move to a Hold rating with TSR forecast at <10%, however highlight CIP continues to offer an attractive yield.
SOURCE: MORGANS, COMPANY REPORTS
▎Australia
HOLD (previously ADD) Current price: A$2.56 Target price: A$2.63 Previous target: A$2.59 Up/downside: 2.8% Reuters: CIP.AX Bloomberg: CIP AU Market cap: US$484.0m A$635.8m Average daily turnover: US$0.36m A$0.48m Current shares o/s 248.4m Free float: 87.0%
Price performance 1M 3M 12M
Absolute (%) 1.2 2 1.6 Relative (%) 2 0.3 -4.9
Fiona BUCHANAN
T (61) 7 3334 4879
Key metrics
Jun-16A Jun-17A Jun-18E Jun-19E Jun-20E
Income (A$m) 66.7 65.5 68.6 69.2 73.5EBITDA (A$m) 60.2 58.7 62.4 64.1 68.3EBIT (A$m) 60.2 58.7 62.4 64.1 68.3NPAT (A$m) 46.4 43.5 49.1 48.5 52.9EPS Norm. (cps) 21.9 20.5 19.7 19.0 20.4EPS growth -4.0% -6.2% -3.9% -3.5% 7.3%Normalised P/E (X) 11.8 12.6 13.1 13.6 13.6EV/EBITDA (x) 15.5 15.9 15.0 15.9 15.0DPS 21.6 20.5 19.4 18.4 19.4Yield 8.4% 7.9% 7.5% 7.1% 7.5%Payout ratio 99% 100% 99% 97% 95%NTA (A$) 2.37 2.35 2.58Gearing (ND/A) 42% 42% 35% 33% 32%
87.0
90.6
94.1
97.7
101.2
2.300
2.400
2.500
2.600
2.700
Price Close Relative to S&P/ASX 200 (RHS)
Source: Bloomberg
5
10
15
Jun-17 Sep-17 Dec-17 Mar-18
Vol m
3
Sector Flash Note Automobiles and Parts│Hong Kong
IMPORTANT DISCLOSURES, INCLUDING ANY REQUIRED RESEARCH CERTIFICATIONS, ARE PROVIDED AT THE END OF THIS REPORT. IF THIS REPORT IS DISTRIBUTED IN THE UNITED STATES IT IS DISTRIBUTED BY CIMB SECURITIES (USA), INC. AND IS CONSIDERED THIRD-PARTY AFFILIATED RESEARCH.
Powered by the EFA Platform
Autos May shipments: Slowdown from April ■ China Passenger Cars Association (CPCA) announced passenger vehicle retail sales
rose 4% yoy to 1.8m units in May. YTD, sales have been within market expectations. ■ Geely and GAC saw stable market shares while Great Wall Motor (GWM) lost share.
Notably, BAIC Benz and Brilliance BMW maintained their market shares. ■ Maintain sector Neutral. Our top pick is Geely with a potential increase in FY18 sales
target by management a re-rating catalyst. Maintain Add on BAIC and Brilliance.
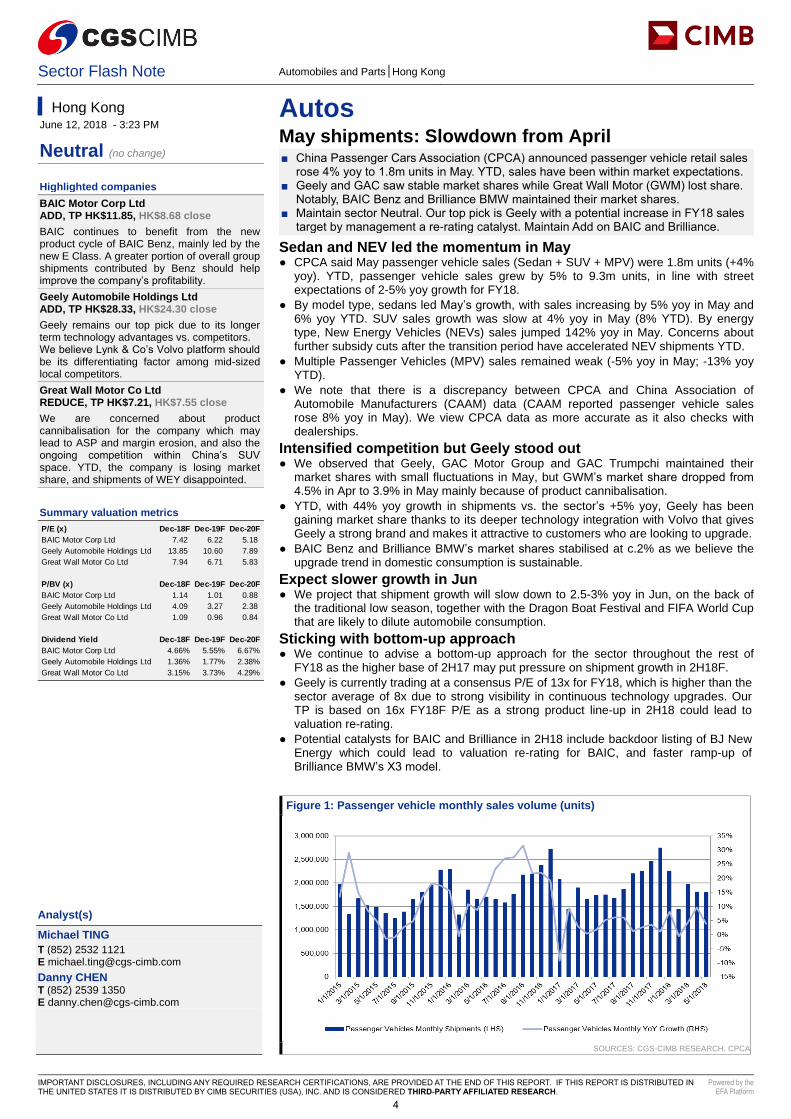
Sedan and NEV led the momentum in May ● CPCA said May passenger vehicle sales (Sedan + SUV + MPV) were 1.8m units (+4%
yoy). YTD, passenger vehicle sales grew by 5% to 9.3m units, in line with street expectations of 2-5% yoy growth for FY18.
● By model type, sedans led May’s growth, with sales increasing by 5% yoy in May and 6% yoy YTD. SUV sales growth was slow at 4% yoy in May (8% YTD). By energy type, New Energy Vehicles (NEVs) sales jumped 142% yoy in May. Concerns about further subsidy cuts after the transition period have accelerated NEV shipments YTD.
● Multiple Passenger Vehicles (MPV) sales remained weak (-5% yoy in May; -13% yoy YTD).
● We note that there is a discrepancy between CPCA and China Association of Automobile Manufacturers (CAAM) data (CAAM reported passenger vehicle sales rose 8% yoy in May). We view CPCA data as more accurate as it also checks with dealerships.
Intensified competition but Geely stood out ● We observed that Geely, GAC Motor Group and GAC Trumpchi maintained their
market shares with small fluctuations in May, but GWM’s market share dropped from 4.5% in Apr to 3.9% in May mainly because of product cannibalisation.
● YTD, with 44% yoy growth in shipments vs. the sector’s +5% yoy, Geely has been gaining market share thanks to its deeper technology integration with Volvo that gives Geely a strong brand and makes it attractive to customers who are looking to upgrade.
● BAIC Benz and Brilliance BMW’s market shares stabilised at c.2% as we believe the upgrade trend in domestic consumption is sustainable.
Expect slower growth in Jun ● We project that shipment growth will slow down to 2.5-3% yoy in Jun, on the back of
the traditional low season, together with the Dragon Boat Festival and FIFA World Cup that are likely to dilute automobile consumption.
Sticking with bottom-up approach ● We continue to advise a bottom-up approach for the sector throughout the rest of
FY18 as the higher base of 2H17 may put pressure on shipment growth in 2H18F. ● Geely is currently trading at a consensus P/E of 13x for FY18, which is higher than the
sector average of 8x due to strong visibility in continuous technology upgrades. Our TP is based on 16x FY18F P/E as a strong product line-up in 2H18 could lead to valuation re-rating.
● Potential catalysts for BAIC and Brilliance in 2H18 include backdoor listing of BJ New Energy which could lead to valuation re-rating for BAIC, and faster ramp-up of Brilliance BMW’s X3 model.
Figure 1: Passenger vehicle monthly sales volume (units)
SOURCES: CGS-CIMB RESEARCH, CPCA
Hong Kong June 12, 2018 - 3:23 PM
Neutral (no change)
Highlighted companies BAIC Motor Corp Ltd ADD, TP HK$11.85, HK$8.68 close BAIC continues to benefit from the new product cycle of BAIC Benz, mainly led by the new E Class. A greater portion of overall group shipments contributed by Benz should help improve the company’s profitability. Geely Automobile Holdings Ltd ADD, TP HK$28.33, HK$24.30 close Geely remains our top pick due to its longer term technology advantages vs. competitors. We believe Lynk & Co’s Volvo platform should be its differentiating factor among mid-sized local competitors. Great Wall Motor Co Ltd REDUCE, TP HK$7.21, HK$7.55 close We are concerned about product cannibalisation for the company which may lead to ASP and margin erosion, and also the ongoing competition within China’s SUV space. YTD, the company is losing market share, and shipments of WEY disappointed.
Summary valuation metrics
Insert
Analyst(s)
Michael TING T (852) 2532 1121 E [email protected] Danny CHEN T (852) 2539 1350 E [email protected]
P/E (x) Dec-18F Dec-19F Dec-20FBAIC Motor Corp Ltd 7.42 6.22 5.18 Geely Automobile Holdings Ltd 13.85 10.60 7.89 Great Wall Motor Co Ltd 7.94 6.71 5.83
P/BV (x) Dec-18F Dec-19F Dec-20FBAIC Motor Corp Ltd 1.14 1.01 0.88 Geely Automobile Holdings Ltd 4.09 3.27 2.38 Great Wall Motor Co Ltd 1.09 0.96 0.84
Dividend Yield Dec-18F Dec-19F Dec-20FBAIC Motor Corp Ltd 4.66% 5.55% 6.67%Geely Automobile Holdings Ltd 1.36% 1.77% 2.38%Great Wall Motor Co Ltd 3.15% 3.73% 4.29%
4
Sector Note Property│Hong Kong│June 12, 2018
IMPORTANT DISCLOSURES, INCLUDING ANY REQUIRED RESEARCH CERTIFICATIONS, ARE PROVIDED AT THE END OF THIS REPORT. IF THIS REPORT IS DISTRIBUTED IN THE UNITED STATES IT IS DISTRIBUTED BY CIMB SECURITIES (USA), INC. AND IS CONSIDERED THIRD-PARTY AFFILIATED RESEARCH.
Powered by the EFA Platform
Property - Overall Property Corporate Day takeaways – HK property ■ We hosted a Hong Kong and China property corporate day in Hong Kong on 7 Jun
2018. A total of 40 corporates and 100 institutional clients participated. ■ Retail landlords reported encouraging sales growth numbers YTD. We think the
opening of the bridge and high-speed railway will further boost the retail market. ■ Developers remain positive on the residential market and are keen to replenish their
landbank. Farmland conversion has slowed down with public consultation ongoing. ■ Office market remains solid. Central vacancies are tight driven by Chinese demand.
Decentralised office clusters are also benefiting from the decentralisation trend. ■ We prefer Wharf REIC and Hysan for retail landlords, while we like Swire Prop and
HKLand for office landlords. For developers, we like SHKP, HLD and Sino Land.
We hosted a HK/China property corporate Day We hosted a Hong Kong and China property corporate day in Hong Kong on 7 Jun 2018 which received strong response with a total of 40 corporates and 100 institutional clients participating. Of the 40 corporates, 15 of them are HK property names featuring the major developers, landlords, REITs and a property agent.
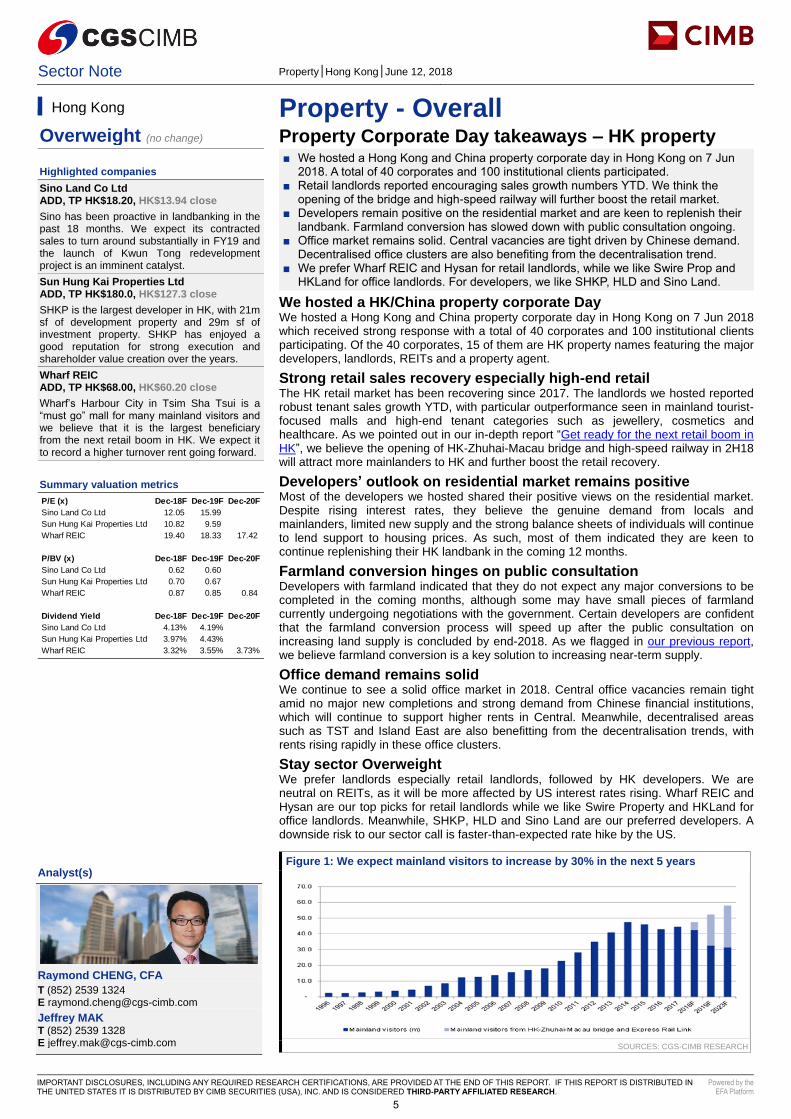
Strong retail sales recovery especially high-end retail The HK retail market has been recovering since 2017. The landlords we hosted reported robust tenant sales growth YTD, with particular outperformance seen in mainland tourist-focused malls and high-end tenant categories such as jewellery, cosmetics and healthcare. As we pointed out in our in-depth report “Get ready for the next retail boom in HK”, we believe the opening of HK-Zhuhai-Macau bridge and high-speed railway in 2H18 will attract more mainlanders to HK and further boost the retail recovery.
Developers’ outlook on residential market remains positive Most of the developers we hosted shared their positive views on the residential market. Despite rising interest rates, they believe the genuine demand from locals and mainlanders, limited new supply and the strong balance sheets of individuals will continue to lend support to housing prices. As such, most of them indicated they are keen to continue replenishing their HK landbank in the coming 12 months.
Farmland conversion hinges on public consultation Developers with farmland indicated that they do not expect any major conversions to be completed in the coming months, although some may have small pieces of farmland currently undergoing negotiations with the government. Certain developers are confident that the farmland conversion process will speed up after the public consultation on increasing land supply is concluded by end-2018. As we flagged in our previous report, we believe farmland conversion is a key solution to increasing near-term supply.
Office demand remains solid We continue to see a solid office market in 2018. Central office vacancies remain tight amid no major new completions and strong demand from Chinese financial institutions, which will continue to support higher rents in Central. Meanwhile, decentralised areas such as TST and Island East are also benefitting from the decentralisation trends, with rents rising rapidly in these office clusters.
Stay sector Overweight We prefer landlords especially retail landlords, followed by HK developers. We are neutral on REITs, as it will be more affected by US interest rates rising. Wharf REIC and Hysan are our top picks for retail landlords while we like Swire Property and HKLand for office landlords. Meanwhile, SHKP, HLD and Sino Land are our preferred developers. A downside risk to our sector call is faster-than-expected rate hike by the US.
Figure 1: We expect mainland visitors to increase by 30% in the next 5 years
SOURCES: CGS-CIMB RESEARCH
Hong Kong
Overweight (no change)
Highlighted companies Sino Land Co Ltd ADD, TP HK$18.20, HK$13.94 close Sino has been proactive in landbanking in the past 18 months. We expect its contracted sales to turn around substantially in FY19 and the launch of Kwun Tong redevelopment project is an imminent catalyst. Sun Hung Kai Properties Ltd ADD, TP HK$180.0, HK$127.3 close SHKP is the largest developer in HK, with 21m sf of development property and 29m sf of investment property. SHKP has enjoyed a good reputation for strong execution and shareholder value creation over the years. Wharf REIC ADD, TP HK$68.00, HK$60.20 close Wharf’s Harbour City in Tsim Sha Tsui is a “must go” mall for many mainland visitors and we believe that it is the largest beneficiary from the next retail boom in HK. We expect it to record a higher turnover rent going forward.
Summary valuation metrics
Insert
Analyst(s)
Raymond CHENG, CFA T (852) 2539 1324 E [email protected] Jeffrey MAK T (852) 2539 1328 E [email protected]
P/E (x) Dec-18F Dec-19F Dec-20FSino Land Co Ltd 12.05 15.99 Sun Hung Kai Properties Ltd 10.82 9.59 Wharf REIC 19.40 18.33 17.42
P/BV (x) Dec-18F Dec-19F Dec-20FSino Land Co Ltd 0.62 0.60 Sun Hung Kai Properties Ltd 0.70 0.67 Wharf REIC 0.87 0.85 0.84
Dividend Yield Dec-18F Dec-19F Dec-20FSino Land Co Ltd 4.13% 4.19%Sun Hung Kai Properties Ltd 3.97% 4.43%Wharf REIC 3.32% 3.55% 3.73%
5
Sector Note Construction and Materials│India│June 12, 2018
IMPORTANT DISCLOSURES, INCLUDING ANY REQUIRED RESEARCH CERTIFICATIONS, ARE PROVIDED AT THE END OF THIS REPORT. IF THIS REPORT IS DISTRIBUTED IN THE UNITED STATES IT IS DISTRIBUTED BY CIMB SECURITIES (USA), INC. AND IS CONSIDERED THIRD-PARTY AFFILIATED RESEARCH.
Powered by the EFA Platform
Cement Into the value zone ■ India's cement industry has witnessed erosion in pricing power, with 6-7% yoy price
drop in Apr-May 2018. We expect price stability to return in the next 2-3 quarters. ■ With coal, pet coke and crude prices hardening, we believe costs are likely to have
peaked. A potential ban on pet coke imports is a cost risk for the cement sector. ■ Steady demand growth of 7-8% in FY19F should absorb incremental capacity from
the ongoing capex cycle. Gradual increase in utilisation should restore price sanity. ■ The recent price correction presents a buying opportunity. Retain sector Neutral.
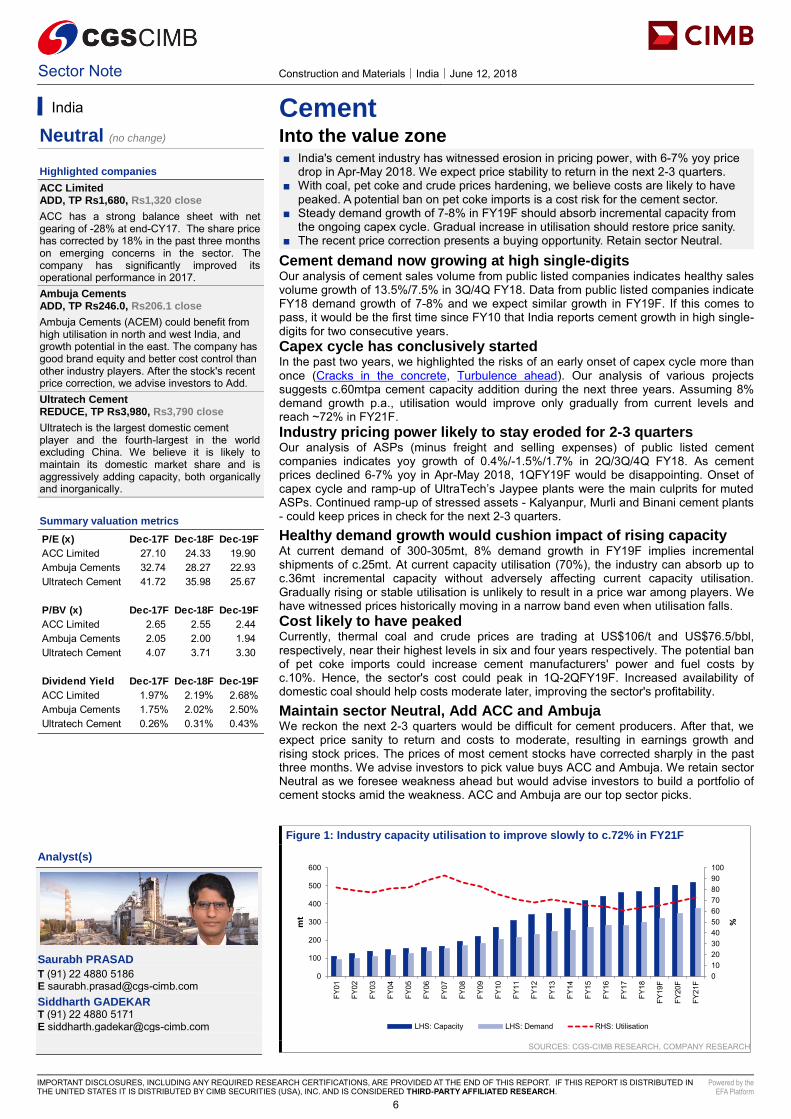
Cement demand now growing at high single-digits Our analysis of cement sales volume from public listed companies indicates healthy sales volume growth of 13.5%/7.5% in 3Q/4Q FY18. Data from public listed companies indicate FY18 demand growth of 7-8% and we expect similar growth in FY19F. If this comes to pass, it would be the first time since FY10 that India reports cement growth in high single-digits for two consecutive years. Capex cycle has conclusively started In the past two years, we highlighted the risks of an early onset of capex cycle more than once (Cracks in the concrete, Turbulence ahead). Our analysis of various projects suggests c.60mtpa cement capacity addition during the next three years. Assuming 8% demand growth p.a., utilisation would improve only gradually from current levels and reach ~72% in FY21F. Industry pricing power likely to stay eroded for 2-3 quarters Our analysis of ASPs (minus freight and selling expenses) of public listed cement companies indicates yoy growth of 0.4%/-1.5%/1.7% in 2Q/3Q/4Q FY18. As cement prices declined 6-7% yoy in Apr-May 2018, 1QFY19F would be disappointing. Onset of capex cycle and ramp-up of UltraTech’s Jaypee plants were the main culprits for muted ASPs. Continued ramp-up of stressed assets - Kalyanpur, Murli and Binani cement plants - could keep prices in check for the next 2-3 quarters.
Healthy demand growth would cushion impact of rising capacity At current demand of 300-305mt, 8% demand growth in FY19F implies incremental shipments of c.25mt. At current capacity utilisation (70%), the industry can absorb up to c.36mt incremental capacity without adversely affecting current capacity utilisation. Gradually rising or stable utilisation is unlikely to result in a price war among players. We have witnessed prices historically moving in a narrow band even when utilisation falls. Cost likely to have peaked Currently, thermal coal and crude prices are trading at US$106/t and US$76.5/bbl, respectively, near their highest levels in six and four years respectively. The potential ban of pet coke imports could increase cement manufacturers' power and fuel costs by c.10%. Hence, the sector's cost could peak in 1Q-2QFY19F. Increased availability of domestic coal should help costs moderate later, improving the sector's profitability.
Maintain sector Neutral, Add ACC and Ambuja We reckon the next 2-3 quarters would be difficult for cement producers. After that, we expect price sanity to return and costs to moderate, resulting in earnings growth and rising stock prices. The prices of most cement stocks have corrected sharply in the past three months. We advise investors to pick value buys ACC and Ambuja. We retain sector Neutral as we foresee weakness ahead but would advise investors to build a portfolio of cement stocks amid the weakness. ACC and Ambuja are our top sector picks.
Figure 1: Industry capacity utilisation to improve slowly to c.72% in FY21F
SOURCES: CGS-CIMB RESEARCH, COMPANY RESEARCH
India
Neutral (no change)
Highlighted companies
ACC Limited ADD, TP Rs1,680, Rs1,320 close
ACC has a strong balance sheet with net gearing of -28% at end-CY17. The share price has corrected by 18% in the past three months on emerging concerns in the sector. The company has significantly improved its operational performance in 2017. Ambuja Cements ADD, TP Rs246.0, Rs206.1 close
Ambuja Cements (ACEM) could benefit from high utilisation in north and west India, and growth potential in the east. The company has good brand equity and better cost control than other industry players. After the stock's recent price correction, we advise investors to Add. Ultratech Cement REDUCE, TP Rs3,980, Rs3,790 close
Ultratech is the largest domestic cement player and the fourth-largest in the world excluding China. We believe it is likely to maintain its domestic market share and is aggressively adding capacity, both organically and inorganically.
Summary valuation metrics
Insert
Analyst(s)
Saurabh PRASAD
T (91) 22 4880 5186 E [email protected] Siddharth GADEKAR T (91) 22 4880 5171 E [email protected]
P/E (x) Dec-17F Dec-18F Dec-19F
ACC Limited 27.10 24.33 19.90 Ambuja Cements 32.74 28.27 22.93 Ultratech Cement 41.72 35.98 25.67
P/BV (x) Dec-17F Dec-18F Dec-19F
ACC Limited 2.65 2.55 2.44 Ambuja Cements 2.05 2.00 1.94 Ultratech Cement 4.07 3.71 3.30
Dividend Yield Dec-17F Dec-18F Dec-19F
ACC Limited 1.97% 2.19% 2.68%Ambuja Cements 1.75% 2.02% 2.50%Ultratech Cement 0.26% 0.31% 0.43%
0102030405060708090100
0
100
200
300
400
500
600
FY01
FY02
FY03
FY04
FY05
FY06
FY07
FY08
FY09
FY10
FY11
FY12
FY13
FY14
FY15
FY16
FY17
FY18
FY19
F
FY20
F
FY21
F
%mt
LHS: Capacity LHS: Demand RHS: Utilisation
6
Sector Note Commodities│Malaysia│June 12, 2018
IMPORTANT DISCLOSURES, INCLUDING ANY REQUIRED RESEARCH CERTIFICATIONS, ARE PROVIDED AT THE END OF THIS REPORT. IF THIS REPORT IS DISTRIBUTED IN THE UNITED STATES IT IS DISTRIBUTED BY CIMB SECURITIES (USA), INC. AND IS CONSIDERED THIRD-PARTY AFFILIATED RESEARCH.
Powered by the EFA Platform
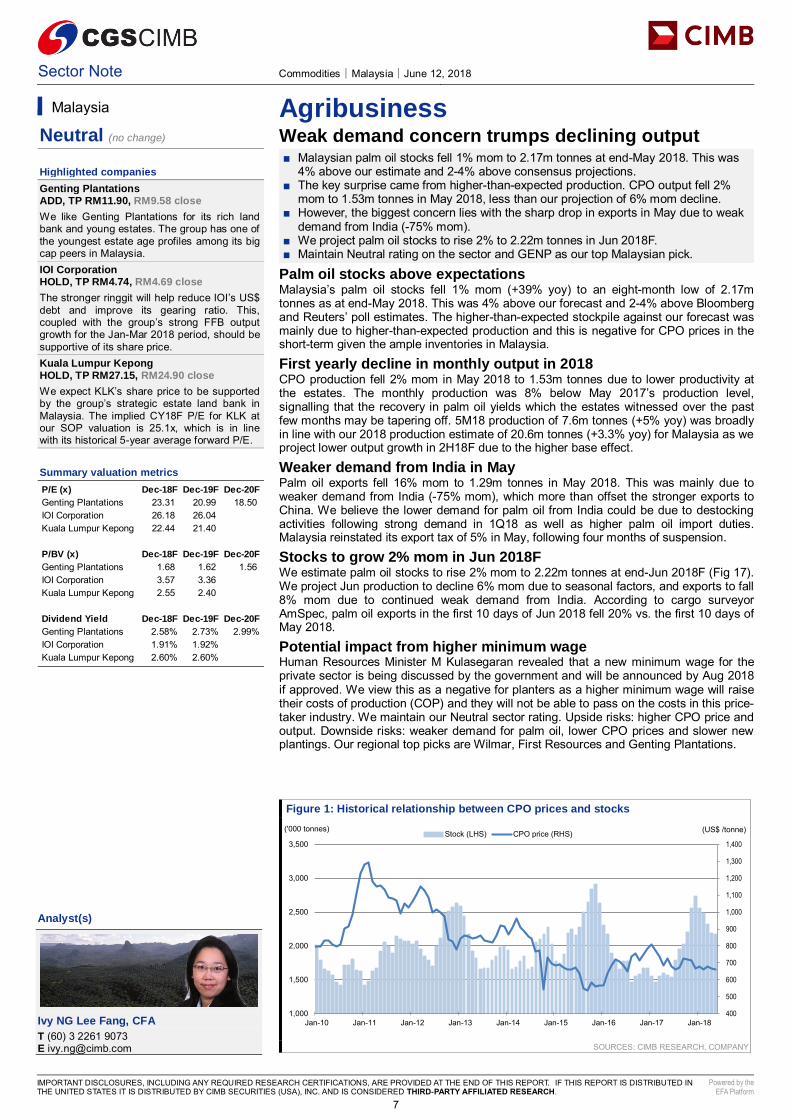
Agribusiness Weak demand concern trumps declining output ■ Malaysian palm oil stocks fell 1% mom to 2.17m tonnes at end-May 2018. This was
4% above our estimate and 2-4% above consensus projections. ■ The key surprise came from higher-than-expected production. CPO output fell 2%
mom to 1.53m tonnes in May 2018, less than our projection of 6% mom decline. ■ However, the biggest concern lies with the sharp drop in exports in May due to weak
demand from India (-75% mom). ■ We project palm oil stocks to rise 2% to 2.22m tonnes in Jun 2018F. ■ Maintain Neutral rating on the sector and GENP as our top Malaysian pick.
Palm oil stocks above expectations Malaysia’s palm oil stocks fell 1% mom (+39% yoy) to an eight-month low of 2.17m tonnes as at end-May 2018. This was 4% above our forecast and 2-4% above Bloomberg and Reuters’ poll estimates. The higher-than-expected stockpile against our forecast was mainly due to higher-than-expected production and this is negative for CPO prices in the short-term given the ample inventories in Malaysia.
First yearly decline in monthly output in 2018 CPO production fell 2% mom in May 2018 to 1.53m tonnes due to lower productivity at the estates. The monthly production was 8% below May 2017’s production level, signalling that the recovery in palm oil yields which the estates witnessed over the past few months may be tapering off. 5M18 production of 7.6m tonnes (+5% yoy) was broadly in line with our 2018 production estimate of 20.6m tonnes (+3.3% yoy) for Malaysia as we project lower output growth in 2H18F due to the higher base effect.
Weaker demand from India in May Palm oil exports fell 16% mom to 1.29m tonnes in May 2018. This was mainly due to weaker demand from India (-75% mom), which more than offset the stronger exports to China. We believe the lower demand for palm oil from India could be due to destocking activities following strong demand in 1Q18 as well as higher palm oil import duties. Malaysia reinstated its export tax of 5% in May, following four months of suspension.
Stocks to grow 2% mom in Jun 2018F We estimate palm oil stocks to rise 2% mom to 2.22m tonnes at end-Jun 2018F (Fig 17). We project Jun production to decline 6% mom due to seasonal factors, and exports to fall 8% mom due to continued weak demand from India. According to cargo surveyor AmSpec, palm oil exports in the first 10 days of Jun 2018 fell 20% vs. the first 10 days of May 2018.
Potential impact from higher minimum wage Human Resources Minister M Kulasegaran revealed that a new minimum wage for the private sector is being discussed by the government and will be announced by Aug 2018 if approved. We view this as a negative for planters as a higher minimum wage will raise their costs of production (COP) and they will not be able to pass on the costs in this price-taker industry. We maintain our Neutral sector rating. Upside risks: higher CPO price and output. Downside risks: weaker demand for palm oil, lower CPO prices and slower new plantings. Our regional top picks are Wilmar, First Resources and Genting Plantations.
Figure 1: Historical relationship between CPO prices and stocks
SOURCES: CIMB RESEARCH, COMPANY
Malaysia
Neutral (no change)
Highlighted companies
Genting Plantations ADD, TP RM11.90, RM9.58 close
We like Genting Plantations for its rich land bank and young estates. The group has one of the youngest estate age profiles among its big cap peers in Malaysia. IOI Corporation HOLD, TP RM4.74, RM4.69 close
The stronger ringgit will help reduce IOI’s US$ debt and improve its gearing ratio. This, coupled with the group’s strong FFB output growth for the Jan-Mar 2018 period, should be supportive of its share price. Kuala Lumpur Kepong HOLD, TP RM27.15, RM24.90 close
We expect KLK’s share price to be supported by the group’s strategic estate land bank in Malaysia. The implied CY18F P/E for KLK at our SOP valuation is 25.1x, which is in line with its historical 5-year average forward P/E.
Summary valuation metrics
Insert
Analyst(s)
Ivy NG Lee Fang, CFA
T (60) 3 2261 9073 E [email protected]
P/E (x) Dec-18F Dec-19F Dec-20F
Genting Plantations 23.31 20.99 18.50 IOI Corporation 26.18 26.04 Kuala Lumpur Kepong 22.44 21.40
P/BV (x) Dec-18F Dec-19F Dec-20F
Genting Plantations 1.68 1.62 1.56 IOI Corporation 3.57 3.36 Kuala Lumpur Kepong 2.55 2.40
Dividend Yield Dec-18F Dec-19F Dec-20F
Genting Plantations 2.58% 2.73% 2.99%IOI Corporation 1.91% 1.92%Kuala Lumpur Kepong 2.60% 2.60%
400
500
600
700
800
900
1,000
1,100
1,200
1,300
1,400
1,000
1,500
2,000
2,500
3,000
3,500
Jan-10 Jan-11 Jan-12 Jan-13 Jan-14 Jan-15 Jan-16 Jan-17 Jan-18
Stock (LHS) CPO price (RHS)('000 tonnes) (US$ /tonne)
7
Company Note Property Devt & Invt│Singapore│June 12, 2018
IMPORTANT DISCLOSURES, INCLUDING ANY REQUIRED RESEARCH CERTIFICATIONS, ARE PROVIDED AT THE END OF THIS REPORT. IF THIS REPORT IS DISTRIBUTED IN THE UNITED STATES IT IS DISTRIBUTED BY CIMB SECURITIES (USA), INC. AND IS CONSIDERED THIRD-PARTY AFFILIATED RESEARCH.
Powered by the EFA Platform
Insert Insert
UOL Group Ground checks show healthy residential take up ■ Take-up rate at Amber 45 continues to increase ■ New project The Tre Ver to be rolled out in 3Q18 ■ Inching up stake in UIC, builds exposure to the rising office market and recurrent
income base ■ Maintain Add with unchanged TP of S$9.65, based on 20% discount to RNAV
Take-up continues to improve We visited UOL’s Amber 45 showflat and found that the take-up rate for the project continues to improve, rising from c.55-60% (of the total 139 units) during the initial launch in mid-May to c.65% at present, indicating continued buyer interest in the development. The project is slated to be completed in 2021.
Smaller sized units the most popular Designed by ADDP Architect, Amber 45 is impressive with high-quality finishing and well-thought and efficient layout, in our view. Most sought-after are the 2-bedroom units which range from 614-872sf per unit. The 3-bedroom units range from 1,130-1,324sf while the largest configurations are the 4-bedroom units with 1,346-1,798sf. Buyers are largely Singaporeans and prices average c.S$2,200psf.
Another new project rollout in 3Q Following this success, UOL plans to release The Tre Ver (former Raintree Gardens enbloc site) in 3Q18. The 563,941sf GFA site can house about 729 condos. This land parcel was acquired in late-2016 at a lower-than-current land cost. We estimate a breakeven cost of c.S$1,200psf. Based on an estimated selling price of S$1,400psf, UOL should generate a healthy PBT margin of c.15%. This will continue to extend UOL’s residential income visibility.
Continues to up stake in UIC Meanwhile, UOL has been acquiring UIC shares in the open market and has increased its stake to 49.985% as at 12 Jun. This would likely expand the group’s exposure to the rising office leasing market in Singapore as well as build up its recurrent income base. Overall, UOL (plus UIC) owns 5.6m sq ft of office and retail investment properties, making it one of the larger landlords in Singapore.
Maintain Add rating UOL’s share price has declined in recent weeks, in tandem with other property peers. At the current 34% discount to RNAV, UOL is trading slightly above its long-term average discount trend. Hence, we maintain our Add rating with an unchanged target price of S$9.65. Given its strong balance sheet and net-debt-to-equity of 0.21x, we think UOL can deploy more capital into new investments, which could catalyse its stock price. Downside risks to our call include slower-than-expected pace of sales for new launches.
SOURCES: CGS-CIMB RESEARCH, COMPANY REPORTS
Singapore
ADD (no change) Consensus ratings*: Buy 11 Hold 1 Sell 1
Current price: S$8.04 Target price: S$9.65 Previous target: S$9.65
Up/downside: 20.0% CGS-CIMB / Consensus: -2.0%
Reuters: UTOS.SI Bloomberg: UOL SP Market cap: US$5,075m S$6,774m Average daily turnover: US$8.47m S$11.21m Current shares o/s: 842.3m Free float: 54.0% *Source: Bloomberg Key changes in this note
No changes
Source: Bloomberg
Price performance 1M 3M 12M Absolute (%) -7.8 -8.1 4.8 Relative (%) -4.2 -6.8 -1
Major shareholders % held Wee related vehicles (incl Haw Par) 31.2 United Overseas Bank 9.8 Schroders 5.0 Insert
Analyst(s)
LOCK Mun Yee
T (65) 6210 8606 E [email protected]
Financial Summary Dec-16A Dec-17A Dec-18F Dec-19F Dec-20F
Total Net Revenues (S$m) 1,441 2,103 1,923 1,506 1,633Operating EBITDA (S$m) 341.9 548.3 827.9 752.0 764.0Net Profit (S$m) 287.0 886.8 430.9 381.2 403.2Core EPS (S$) 0.40 0.46 0.51 0.45 0.48Core EPS Growth (9.3%) 15.7% 10.9% (11.6%) 5.8%FD Core P/E (x) 20.16 17.43 15.71 17.76 16.79DPS (S$) 0.15 0.18 0.17 0.17 0.17Dividend Yield 1.87% 2.18% 2.17% 2.17% 2.17%EV/EBITDA (x) 26.28 26.23 17.29 18.95 18.36P/FCFE (x) 28.10 6.56 10.36 14.82 10.64Net Gearing 23.6% 21.6% 18.5% 16.9% 14.2%P/BV (x) 0.80 0.72 0.70 0.68 0.66ROE 3.99% 4.32% 4.49% 3.87% 4.00%CIMB/consensus EPS (x) 1.04 0.92 1.00
97.0101.0105.0109.0113.0117.0
7.207.708.208.709.209.70
Price Close Relative to FSSTI (RHS)
2
4
6
Jun-17 Sep-17 Dec-17 Mar-18
Vol m
8
Company Flash Note Hotels│Thailand│June 12, 2018
IMPORTANT DISCLOSURES, INCLUDING ANY REQUIRED RESEARCH CERTIFICATIONS, ARE PROVIDED AT THE END OF THIS REPORT. IF THIS REPORT IS DISTRIBUTED IN THE UNITED STATES IT IS DISTRIBUTED BY CIMB SECURITIES (USA), INC. AND IS CONSIDERED THIRD-PARTY AFFILIATED RESEARCH.
Powered by the EFA Platform
Insert Insert
Minor International MINT launches a tender offer for NHH ■ The final tender offer price for NHH is likely to be EUR6.30/share, based on our
estimates. We do not expect many NHH SM shareholders to tender their shares. ■ With its current 38% stake of NHH, we expect MINT’s CY19F net profit to come in
13% higher than our current forecast. ■ We maintain our Add call with a target price of THB44.50 (30x CY19F P/E).
Final tender offer price for NHH is likely to be EUR6.30/share ● MINT reported to the Stock Exchange of Thailand that it has today made a formal
notification to the National Securities Market Commission of Spain (CNMV) and the Madrid Stock Exchange to launch an all-cash public tender offer to acquire all the remaining shares of NH Hotel Group (NHH SM, Not Rated) at a price of EUR 6.40/share, which is at a premium of <1% over NHH’s current market price (EUR6.36).
● Meanwhile NHH plans to pay DPS of EUR0.10 in the next few months, which will be deducted from the tender offer price. As such, we think the final tender offer price is likely to be EUR6.30/share. MINT will hold its extraordinary general meeting (EGM) on 9 Aug 2018 and will file the tender offer with the CNMV by 12 Jul 2018. The tender offer process is expected to take 3-5 months from the announcement of the tender offer.
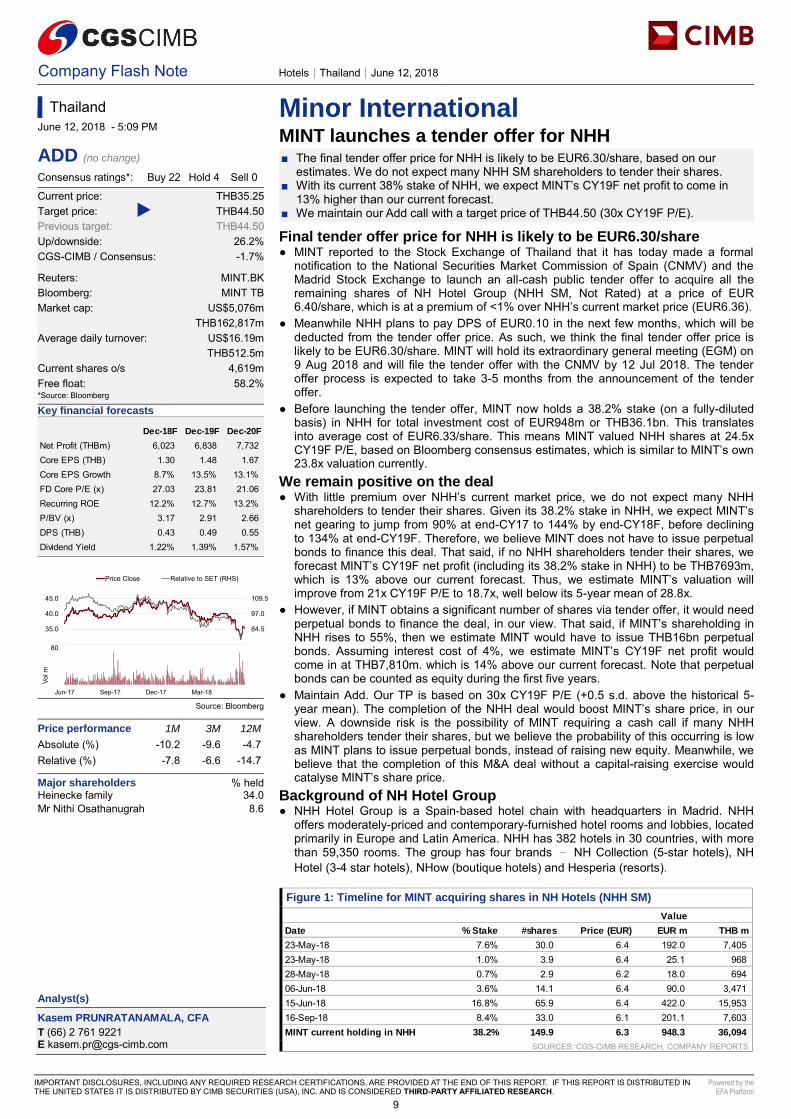
● Before launching the tender offer, MINT now holds a 38.2% stake (on a fully-diluted basis) in NHH for total investment cost of EUR948m or THB36.1bn. This translates into average cost of EUR6.33/share. This means MINT valued NHH shares at 24.5x CY19F P/E, based on Bloomberg consensus estimates, which is similar to MINT’s own 23.8x valuation currently.
We remain positive on the deal ● With little premium over NHH’s current market price, we do not expect many NHH
shareholders to tender their shares. Given its 38.2% stake in NHH, we expect MINT’s net gearing to jump from 90% at end-CY17 to 144% by end-CY18F, before declining to 134% at end-CY19F. Therefore, we believe MINT does not have to issue perpetual bonds to finance this deal. That said, if no NHH shareholders tender their shares, we forecast MINT’s CY19F net profit (including its 38.2% stake in NHH) to be THB7693m, which is 13% above our current forecast. Thus, we estimate MINT’s valuation will improve from 21x CY19F P/E to 18.7x, well below its 5-year mean of 28.8x.
● However, if MINT obtains a significant number of shares via tender offer, it would need perpetual bonds to finance the deal, in our view. That said, if MINT’s shareholding in NHH rises to 55%, then we estimate MINT would have to issue THB16bn perpetual bonds. Assuming interest cost of 4%, we estimate MINT’s CY19F net profit would come in at THB7,810m. which is 14% above our current forecast. Note that perpetual bonds can be counted as equity during the first five years.
● Maintain Add. Our TP is based on 30x CY19F P/E (+0.5 s.d. above the historical 5-year mean). The completion of the NHH deal would boost MINT’s share price, in our view. A downside risk is the possibility of MINT requiring a cash call if many NHH shareholders tender their shares, but we believe the probability of this occurring is low as MINT plans to issue perpetual bonds, instead of raising new equity. Meanwhile, we believe that the completion of this M&A deal without a capital-raising exercise would catalyse MINT’s share price.
Background of NH Hotel Group ● NHH Hotel Group is a Spain-based hotel chain with headquarters in Madrid. NHH
offers moderately-priced and contemporary-furnished hotel rooms and lobbies, located primarily in Europe and Latin America. NHH has 382 hotels in 30 countries, with more than 59,350 rooms. The group has four brands – NH Collection (5-star hotels), NH Hotel (3-4 star hotels), NHow (boutique hotels) and Hesperia (resorts).
Figure 1: Timeline for MINT acquiring shares in NH Hotels (NHH SM)
SOURCES: CGS-CIMB RESEARCH, COMPANY REPORTS
Value
Date % Stake #shares Price (EUR) EUR m THB m
23-May-18 7.6% 30.0 6.4 192.0 7,405 23-May-18 1.0% 3.9 6.4 25.1 968 28-May-18 0.7% 2.9 6.2 18.0 694 06-Jun-18 3.6% 14.1 6.4 90.0 3,471 15-Jun-18 16.8% 65.9 6.4 422.0 15,953 16-Sep-18 8.4% 33.0 6.1 201.1 7,603 MINT current holding in NHH 38.2% 149.9 6.3 948.3 36,094
Thailand
June 12, 2018 - 5:09 PM
ADD (no change) Consensus ratings*: Buy 22 Hold 4 Sell 0
Current price: THB35.25 Target price: THB44.50 Previous target: THB44.50
Up/downside: 26.2% CGS-CIMB / Consensus: -1.7%
Reuters: MINT.BK Bloomberg: MINT TB Market cap: US$5,076m THB162,817m Average daily turnover: US$16.19m THB512.5m Current shares o/s 4,619m Free float: 58.2% *Source: Bloomberg Key financial forecasts
Source: Bloomberg Price performance 1M 3M 12M
Absolute (%) -10.2 -9.6 -4.7 Relative (%) -7.8 -6.6 -14.7
Major shareholders % held Heinecke family 34.0 Mr Nithi Osathanugrah 8.6 Insert
Analyst(s)
Kasem PRUNRATANAMALA, CFA
T (66) 2 761 9221 E [email protected]
Dec-18F Dec-19F Dec-20F
Net Profit (THBm) 6,023 6,838 7,732Core EPS (THB) 1.30 1.48 1.67Core EPS Growth 8.7% 13.5% 13.1%FD Core P/E (x) 27.03 23.81 21.06Recurring ROE 12.2% 12.7% 13.2%P/BV (x) 3.17 2.91 2.66DPS (THB) 0.43 0.49 0.55Dividend Yield 1.22% 1.39% 1.57%
72.0
84.5
97.0
109.5
30.0
35.0
40.0
45.0
Price Close Relative to SET (RHS)
20406080
Jun-17 Sep-17 Dec-17 Mar-18
Vol m
9
Asia Pacific Daily │ Equity Research │ June 13, 2018
REGIONAL HEAD
Bertram LAI Regional Head of Research +852 2532 1111 [email protected]
COUNTRY HEADS OF RESEARCH
Ivy NG, CFA Siew Khee. LIM Erwan TEGUH Kasem PRUNRATANAMALA, CFA Raymond CHENG Malaysia Singapore Indonesia Thailand Hong Kong/China +60 (3) 2261-9073 +65 6210-8664 +62 (21) 3006-1720 +66 (2) 657-9221 +852 2539-1324 [email protected] [email protected] [email protected] [email protected] [email protected] Dohoon LEE Satish KUMAR South Korea India +82 (2) 6730-6121 +91 (22) 6602-5185 [email protected] [email protected] Yolan SEIMON Anirban LAHIRI Sri Lanka Vietnam +94 (11) 230-6273 +8428 7300-0688 (ext: 21242) [email protected] [email protected] Coverage via partnership arrangement with John Keells Stock Brokers
Coverage via partnership arrangement with VNDirect Securities Corporation
REGIONAL SECTOR HEADS
KJ KWANG Ivy NG, CFA Raymond YAP, CFA Offshore & Marine Plantations Transportation +82 (2) 6730-6123 +60 (3) 2261-9073 +60 (3) 2261-9072 [email protected] [email protected] [email protected]
7
10
Asia Pacific Daily │ Equity Research │ June 13, 2018
DISCLAIMER The content of this report (including the views and opinions expressed therein, and the information comprised therein) has been prepared by and belongs to CGS-CIMB or CIMB, as the case may be, save that (i) if it is a report written by the analyst(s) of John Keells Stock Brokers (“John Keells”), it belongs to John Keells; (ii) if it is a report written by the analyst(s) of SB Equities Inc (“SBE”), it belongs to SBE; and (iii) if it is a report written by the analyst(s) of Morgans Financial Limited (“Morgans”), it belongs to Morgans. This report is distributed by CGS-CIMB or CIMB, as the case may be, and in respect of sections of the report relating to (i), (ii) and/or (iii) aforesaid, it is distributed pursuant to an arrangement between John Keells, SBE and Morgans respectively and none of the aforesaid parties is an affiliate of CGS-CIMB or CIMB. This report is not directed to, or intended for distribution to or use by, any person or entity who is a citizen or resident of or located in any locality, state, country or other jurisdiction where such distribution, publication, availability or use would be contrary to law or regulation. By accepting this report, the recipient hereof represents and warrants that he is entitled to receive such report in accordance with the restrictions set forth below and agrees to be bound by the limitations contained herein (including the “Restrictions on Distributions” set out below). Any failure to comply with these limitations may constitute a violation of law. This publication is being supplied to you strictly on the basis that it will remain confidential. No part of this report may be (i) copied, photocopied, duplicated, stored or reproduced in any form by any means or (ii) redistributed or passed on, directly or indirectly, to any other person in whole or in part, for any purpose without the prior written consent of CGS-CIMB or CIMB, as the case may be. The information contained in this research report is prepared from data believed to be correct and reliable at the time of issue of this report. CGS-CIMB, CIMB, John Keells, SBE and/or Morgans, as the case may be, may or may not issue regular reports on the subject matter of this report at any frequency and may cease to do so or change the periodicity of reports at any time. None of CGS-CIMB, CIMB, John Keells, SBE or Morgans is under any obligation to update this report in the event of a material change to the information contained in this report. None of CGS-CIMB, CIMB, John Keells, SBE or Morgans has any and none of them will accept any, obligation to (i) check or ensure that the contents of this report remain current, reliable or relevant, (ii) ensure that the content of this report constitutes all the information a prospective investor may require, (iii) ensure the adequacy, accuracy, completeness, reliability or fairness of any views, opinions and information, and accordingly, CGS-CIMB, CIMB, John Keells, SBE and Morgans and their respective affiliates and related persons including China Galaxy International Financial Holdings Limited (“CGIFHL”) and CIMB Group Sdn. Bhd. (“CIMBG”) and their respective related corporations (and their respective directors, associates, connected persons and/or employees) shall not be liable in any manner whatsoever for any consequences (including but not limited to any direct, indirect or consequential losses, loss of profits and damages) of any reliance thereon or usage thereof. In particular, CGS-CIMB, CIMB, John Keells, SBE and Morgans disclaim all responsibility and liability for the views and opinions set out in this report. Unless otherwise specified, this report is based upon reasonable sources. Such sources will, unless otherwise specified, for market data, be market data and prices available from the main stock exchange or market where the relevant security is listed, or, where appropriate, any other market. Information on the accounts and business of company(ies) will generally be based on published statements of the company(ies), information disseminated by regulatory information services, other publicly available information and information resulting from our research. Whilst every effort is made to ensure that statements of facts made in this report are accurate, all estimates, projections, forecasts, expressions of opinion and other subjective judgments contained in this report are based on assumptions considered to be reasonable as of the date of the document in which they are contained and must not be construed as a representation that the matters referred to therein will occur. Past performance is not a reliable indicator of future performance. The value of investments may go down as well as up and those investing may, depending on the investments in question, lose more than the initial investment. No report shall constitute an offer or an invitation by or on behalf of CGS-CIMB, CIMB, John Keells, SBE or Morgans or their respective affiliates (including CGIFHL, CIMBG and their respective related corporations) to any person to buy or sell any investments. CGS-CIMB, CIMB, John Keells, SBE and/or Morgans and/or their respective affiliates and related corporations (including CGIFHL, CIMBG and their respective related corporations), their directors, associates, connected parties and/or employees may own or have positions in securities of the company(ies) covered in this research report or any securities related thereto and may from time to time add to or dispose of, or may be materially interested in, any such securities. Further, CGS-CIMB, CIMB, John Keells, SBE and/or Morgans and/or their respective affiliates and related corporations (including CGIFHL, CIMBG and their respective related corporations) do and seek to do business with the company(ies) covered in this research report and may from time to time act as market maker or have assumed an underwriting commitment in securities of such company(ies), may sell them to or buy them from customers on a principal basis and may also perform or seek to perform significant investment banking, advisory, underwriting or placement services for or relating to such company(ies) as well as solicit such investment, advisory or other services from any entity mentioned in this report. CGS-CIMB, CIMB, John Keells, SBE and/or Morgans and/or their respective affiliates (including CGIFHL, CIMBG and their respective related corporations) may enter into an agreement with the company(ies) covered in this report relating to the production of research reports. CGS-CIMB, CIMB, John Keells, SBE and/or Morgans may disclose the contents of this report to the company(ies) covered by it and may have amended the contents of this report following such disclosure. The analyst responsible for the production of this report hereby certifies that the views expressed herein accurately and exclusively reflect his or her personal views and opinions about any and all of the issuers or securities analysed in this report and were prepared independently and autonomously. No part of the compensation of the analyst(s) was, is, or will be directly or indirectly related to the inclusion of specific recommendations(s) or view(s) in this report. The analyst(s) who prepared this research report are prohibited from receiving any compensation, incentive or bonus based on specific investment banking transactions or for providing a specific recommendation for, or view of, a particular company. Information barriers and other arrangements may be established where necessary to prevent conflicts of interests arising. However, the analyst(s) may receive compensation that is based on his/their coverage of company(ies) in the performance of his/their duties or the performance of his/their recommendations and the research personnel involved in the preparation of this report may also participate in the solicitation of the businesses as described above. In reviewing this research report, an investor should be aware that any or all of the foregoing, among other things, may give rise to real or potential conflicts of interest. Additional information is, subject to the duties of confidentiality, available on request. The term “John Keells Stock Brokers” shall, unless the context otherwise requires, mean each of John Keells Stock Brokers and its affiliates,
8
11
Asia Pacific Daily │ Equity Research │ June 13, 2018
subsidiaries and related corporations. The term “SB Equities Inc.” shall, unless the context otherwise requires, mean each of SB Equities Inc. and its affiliates, subsidiaries and related corporations. The term “Morgans Financial Limited” shall, unless the context otherwise requires, mean each of Morgans Financial Limited and its affiliates, subsidiaries and related corporations. The term “CIMB” shall denote CIMB Investment Bank Berhad, being the entity distributing or disseminating the report in Malaysia, or, in every other case, CIMBG and its affiliates, subsidiaries and related corporations. The term “CGS-CIMB” shall denote, where appropriate, the relevant entity distributing or disseminating the report in the particular jurisdiction referenced below, or, in every other case except as otherwise stated herein, CGS-CIMB Securities International Pte. Ltd. and its affiliates, subsidiaries and related corporations.
CGS-CIMB
Country CGS-CIMB Entity Regulated by Hong Kong CGS-CIMB Securities (Hong Kong) Limited Securities and Futures Commission Hong Kong India CGS-CIMB Securities (India) Private Limited Securities and Exchange Board of India (SEBI) Indonesia PT CGS-CIMB Sekuritas Indonesia Financial Services Authority of Indonesia Singapore CGS-CIMB Research Pte. Ltd. Monetary Authority of Singapore South Korea CGS-CIMB Securities (Hong Kong) Limited, Korea Branch Financial Services Commission and Financial Supervisory Service Thailand CGS-CIMB Securities (Thailand) Co. Ltd. Securities and Exchange Commission Thailand
CIMB
Country CIMB Entity Regulated by Malaysia CIMB Investment Bank Berhad Securities Commission Malaysia
Information in this report is a summary derived from individual research reports. As such, readers are directed to the individual research report or note to review the individual Research Analyst’s full analysis of the subject company. Important disclosures relating to the companies that are the subject of research reports published by CGS-CIMB, CIMB, John Keells, SBE or Morgans, as the case may be, and the proprietary position by each of them and shareholdings of its Research Analysts’ who prepared the report in the securities of the company(s) are available in the individual research report. This report does not purport to contain all the information that a prospective investor may require. CGS-CIMB, CIMB, John Keells, SBE and Morgans and their respective affiliates (including CGIFHL, CIMBG and their respective related corporations) do not make any guarantee, representation or warranty, express or implied, as to the adequacy, accuracy, completeness, reliability or fairness of any such information and opinion contained in this report. None of CGS-CIMB, CIMB, John Keells, SBE, Morgans and their respective affiliates and related persons (including CGIFHL, CIMBG and their respective related corporations) shall be liable in any manner whatsoever for any consequences (including but not limited to any direct, indirect or consequential losses, loss of profits and damages) of any reliance thereon or usage thereof. This report is general in nature and has been prepared for information purposes only. It is intended for circulation amongst CGS-CIMB’s, CIMB’s and their respective affiliates’ (including CGIFHL’s, CIMBG’s and their respective related corporations’s) clients generally and does not have regard to the specific investment objectives, financial situation and the particular needs of any specific person who may receive this report. The information and opinions in this report are not and should not be construed or considered as an offer, recommendation or solicitation to buy or sell the subject securities, related investments or other financial instruments or any derivative instrument, or any rights pertaining thereto. Investors are advised to make their own independent evaluation of the information contained in this research report, consider their own individual investment objectives, financial situation and particular needs and consult their own professional and financial advisers as to the legal, business, financial, tax and other aspects before participating in any transaction in respect of the securities of company(ies) covered in this research report. The securities of such company(ies) may not be eligible for sale in all jurisdictions or to all categories of investors. Australia : The distribution of this report is not an offer to buy or sell to any person within or outside Australia or a solicitation to any person within or outside of Australia to buy or sell any instrument described herein. This report is being issued outside Australia to a limited number of institutional investors and may not be provided to any person other than the original recipient and may not be reproduced or used for any other purposes. Canada: This research report has not been prepared in accordance with the disclosure requirements of Dealer Member Rule 3400 – Research Restrictions and Disclosure Requirements of the Investment Industry Regulatory Organization of Canada. For any research report distributed by CIBC, further disclosures related to CIBC conflicts of interest can be found at https://researchcentral.cibcwm.com . China: For the purpose of this report, the People’s Republic of China (“PRC”) does not include the Hong Kong Special Administrative Region, the Macau Special Administrative Region or Taiwan. The distributor of this report has not been approved or licensed by the China Securities Regulatory Commission or any other relevant regulatory authority or governmental agency in the PRC. This report contains only marketing information. The distribution of this report is not an offer to buy or sell to any person within or outside PRC or a solicitation to any person within or outside of PRC to buy or sell any instruments described herein. This report is being issued outside the PRC to a limited number of institutional investors and may not be provided to any person other than the original recipient and may not be reproduced or used for any other purpose. France: Only qualified investors within the meaning of French law shall have access to this report. This report shall not be considered as an offer to subscribe to, or used in connection with, any offer for subscription or sale or marketing or direct or indirect distribution of financial instruments and it is not intended as a solicitation for the purchase of any financial instrument. Germany: This report is only directed at persons who are professional investors as defined in sec 31a(2) of the German Securities Trading Act (WpHG). This publication constitutes research of a non-binding nature on the market situation and the investment instruments cited here at the time of the publication of the information. The current prices/yields in this issue are based upon closing prices from Bloomberg as of the day preceding publication. Please note that neither the German Federal Financial Supervisory Agency (BaFin), nor any other supervisory authority exercises any control over the content of this report. Hong Kong: This report is issued and distributed in Hong Kong by CGS-CIMB Securities (Hong Kong) Limited (“CHK”) which is licensed in Hong Kong by the Securities and Futures Commission for Type 1 (dealing in securities), Type 4 (advising on securities) and Type 6 (advising on corporate finance) activities. Any investors wishing to purchase or otherwise deal in the securities covered in this report should contact the Head of Sales at
9
12
Asia Pacific Daily │ Equity Research │ June 13, 2018
CGS-CIMB Securities (Hong Kong) Limited. The views and opinions in this research report are of CGS-CIMB, CIMB, John Keells, SBE or Morgans, as the case may be, as of the date hereof and are subject to change. If the Financial Services and Markets Act of the United Kingdom or the rules of the Financial Conduct Authority apply to a recipient, our obligations owed to such recipient therein are unaffected. CHK has no obligation to update its opinion or the information in this research report. This publication is strictly confidential and is for private circulation only to clients of CHK. India: This report is issued and distributed in India by CGS-CIMB Securities (India) Private Limited (”CGS-CIMB India") which is registered with SEBI as a stock-broker under the Securities and Exchange Board of India (Stock Brokers and Sub-Brokers) Regulations, 1992, the Securities and Exchange Board of India (Research Analyst) Regulations, 2014 (SEBI Registration Number INH000000669) and in accordance with the provisions of Regulation 4 (g) of the Securities and Exchange Board of India (Investment Advisers) Regulations, 2013, CGS-CIMB India is not required to seek registration with SEBI as an Investment Adviser. The research analysts, strategists or economists principally responsible for the preparation of this research report are segregated from equity stock broking and merchant banking of CGS-CIMB India and they have received compensation based upon various factors, including quality, accuracy and value of research, firm profitability or revenues, client feedback and competitive factors. Research analysts', strategists' or economists' compensation is not linked to investment banking or capital markets transactions performed or proposed to be performed by CGS-CIMB India or its affiliates.” Indonesia: This report is issued and distributed by PT CGS-CIMB Sekuritas Indonesia (“CGS-CIMB Indonesia”). The views and opinions in this research report are our own as of the date hereof and are subject to change. CGS-CIMB Indonesia has no obligation to update its opinion or the information in this research report. Neither this report nor any copy hereof may be distributed in Indonesia or to any Indonesian citizens wherever they are domiciled or to Indonesian residents except in compliance with applicable Indonesian capital market laws and regulations. This research report is not an offer of securities in Indonesia. The securities referred to in this research report have not been registered with the Financial Services Authority (Otoritas Jasa Keuangan) pursuant to relevant capital market laws and regulations, and may not be offered or sold within the territory of the Republic of Indonesia or to Indonesian citizens through a public offering or in circumstances which constitute an offer within the meaning of the Indonesian capital market law and regulations. Ireland: CGS-CIMB is not an investment firm authorised in the Republic of Ireland and no part of this document should be construed as CGS-CIMB acting as, or otherwise claiming or representing to be, an investment firm authorised in the Republic of Ireland. Malaysia: This report is issued and distributed by CIMB solely for the benefit of and for the exclusive use of our clients. CIMB has no obligation to update, revise or reaffirm its opinion or the information in this research reports after the date of this report. New Zealand: In New Zealand, this report is for distribution only to persons who are wholesale clients pursuant to section 5C of the Financial Advisers Act 2008. Singapore: This report is issued and distributed by CGS-CIMB Research Pte Ltd (“CGS-CIMBR”). CGS-CIMBR is a financial adviser licensed under the Financial Advisers Act, Cap 110 (“FAA”) for advising on investment products, by issuing or promulgating research analyses or research reports, whether in electronic, print or other form. Accordingly CGS-CIMBR is a subject to the applicable rules under the FAA unless it is able to avail itself to any prescribed exemptions. Recipients of this report are to contact CGS-CIMB Research Pte Ltd, 50 Raffles Place, #16-02 Singapore Land Tower, Singapore in respect of any matters arising from, or in connection with this report. CGS-CIMBR has no obligation to update its opinion or the information in this research report. This publication is strictly confidential and is for private circulation only. If you have not been sent this report by CGS-CIMBR directly, you may not rely, use or disclose to anyone else this report or its contents. If the recipient of this research report is not an accredited investor, expert investor or institutional investor, CGS-CIMBR accepts legal responsibility for the contents of the report without any disclaimer limiting or otherwise curtailing such legal responsibility. If the recipient is an accredited investor, expert investor or institutional investor, the recipient is deemed to acknowledge that CGS-CIMBR is exempt from certain requirements under the FAA and its attendant regulations, and as such, is exempt from complying with the following : (a) Section 25 of the FAA (obligation to disclose product information); (b) Section 27 (duty not to make recommendation with respect to any investment product without having a reasonable basis where you may be reasonably expected to rely on the recommendation) of the FAA; (c) MAS Notice on Information to Clients and Product Information Disclosure [Notice No. FAA-N03]; (d) MAS Notice on Recommendation on Investment Products [Notice No. FAA-N16]; (e) Section 36 (obligation on disclosure of interest in securities), and (f) any other laws, regulations, notices, directive, guidelines, circulars and practice notes which are relates to the above, to the extent permitted by applicable laws, as may be amended from time to time, and any other laws, regulations, notices, directive, guidelines, circulars, and practice notes as we may notify you from time to time. In addition, the recipient who is an accredited investor, expert investor or institutional investor acknowledges that a CGS-CIMBR is exempt from Section 27 of the FAA, the recipient will also not be able to file a civil claim against CGS-CIMBR for any loss or damage arising from the recipient’s reliance on any recommendation made by CGS-CIMBR which would otherwise be a right that is available to the recipient under Section 27 of the FAA, the recipient will also not be able to file a civil claim against CGS-CIMBR for any loss or damage arising from the recipient’s reliance on any recommendation made by CGS-CIMBR which would otherwise be a right that is available to the recipient under Section 27 of the FAA. South Korea: This report is issued and distributed in South Korea by CGS-CIMB Securities (Hong Kong) Limited, Korea Branch (“CGS-CIMB Korea”) which is licensed as a cash equity broker, and regulated by the Financial Services Commission and Financial Supervisory Service of Korea. In South Korea, this report is for distribution only to professional investors under Article 9(5) of the Financial Investment Services and Capital Market Act of Korea (“FSCMA”). Spain: This document is a research report and it is addressed to institutional investors only. The research report is of a general nature and not personalised and does not constitute investment advice so, as the case may be, the recipient must seek proper advice before adopting any investment decision. This document does not constitute a public offering of securities. CGS-CIMB is not registered with the Spanish Comision Nacional del Mercado de Valores to provide investment services.
10
13
Asia Pacific Daily │ Equity Research │ June 13, 2018
Sweden: This report contains only marketing information and has not been approved by the Swedish Financial Supervisory Authority. The distribution of this report is not an offer to sell to any person in Sweden or a solicitation to any person in Sweden to buy any instruments described herein and may not be forwarded to the public in Sweden. Switzerland: This report has not been prepared in accordance with the recognized self-regulatory minimal standards for research reports of banks issued by the Swiss Bankers’ Association (Directives on the Independence of Financial Research). Thailand: This report is issued and distributed by CGS-CIMB Securities (Thailand) Co., Ltd. (“CGS-CIMB Thailand”) based upon sources believed to be reliable (but their accuracy, completeness or correctness is not guaranteed). The statements or expressions of opinion herein were arrived at after due and careful consideration for use as information for investment. Such opinions are subject to change without notice and CGS-CIMB Thailand has no obligation to update its opinion or the information in this research report. CGS-CIMB Thailand may act or acts as Market Maker, and issuer and offerer of Derivative Warrants and Structured Note which may have the following securities as its underlying securities. Investors should carefully read and study the details of the derivative warrants in the prospectus before making investment decisions. AAV, ADVANC, AMATA, ANAN, AOT, AP, BA, BANPU, BBL, BCH, BCP, BCPG, BDMS, BEAUTY, BEC, BEM, BJC, BH, BIG, BLAND, BPP, BTS, CBG, CENTEL, CHG, CK, CKP, COM7, CPALL, CPF, CPN, DTAC, EA, EGCO, EPG, ESSO, GGC, GFPT, GLOBAL, GPSC, GUNKUL, HANA, HMPRO, INTUCH, IRPC, ITD, IVL, JMART, JWD, KBANK, KCE, KKP, KTB, KTC, LH, LPN, MAJOR, MC, MEGA, MINT, MONO, MTLS, ORI, PSH, PSL, PTG, PTT, PTTEP, PTTGC, QH, ROBINS, SAWAD, SCB, SCC, SGP, SIRI, SPALI, SPRC, STA, STEC, SUPER, TASCO, TCAP, THAI, THCOM, TISCO, TKN, TMB, TOP, TPIPL, TPIPP, TRUE, TTA, TU, TVO, UNIQ, UV, WHA, WHAUP, WORK. Corporate Governance Report: The disclosure of the survey result of the Thai Institute of Directors Association (“IOD”) regarding corporate governance is made pursuant to the policy of the Office of the Securities and Exchange Commission. The survey of the IOD is based on the information of a company listed on the Stock Exchange of Thailand and the Market for Alternative Investment disclosed to the public and able to be accessed by a general public investor. The result, therefore, is from the perspective of a third party. It is not an evaluation of operation and is not based on inside information. The survey result is as of the date appearing in the Corporate Governance Report of Thai Listed Companies. As a result, the survey result may be changed after that date. CGS-CIMB Thailand does not confirm nor certify the accuracy of such survey result.
Score Range: 90 - 100 80 - 89 70 - 79 Below 70 or No Survey Result Description: Excellent Very Good Good N/A
United Arab Emirates: The distributor of this report has not been approved or licensed by the UAE Central Bank or any other relevant licensing authorities or governmental agencies in the United Arab Emirates. This report is strictly private and confidential and has not been reviewed by, deposited or registered with UAE Central Bank or any other licensing authority or governmental agencies in the United Arab Emirates. This report is being issued outside the United Arab Emirates to a limited number of institutional investors and must not be provided to any person other than the original recipient and may not be reproduced or used for any other purpose. Further, the information contained in this report is not intended to lead to the sale of investments under any subscription agreement or the conclusion of any other contract of whatsoever nature within the territory of the United Arab Emirates. United Kingdom and European Economic Area (EEA): In the United Kingdom and European Economic Area, this material is also being distributed by CGS-CIMB Securities (UK) Limited (“CGS-CIMB UK”). CGS-CIMB UK is authorized and regulated by the Financial Conduct Authority and its registered office is at 27 Knightsbridge, London, SW1X7YB. The material distributed by CGS-CIMB UK has been prepared in accordance with CGS-CIMB Group’s policies for managing conflicts of interest arising as a result of publication and distribution of this material. This material is for distribution only to, and is solely directed at, selected persons on the basis that those persons: (a) are eligible counterparties and professional clients of CGS-CIMB UK; (b) have professional experience in matters relating to investments falling within Article 19(5) of the Financial Services and Markets Act 2000 (Financial Promotion) Order 2005 (as amended, the “Order”), (c) fall within Article 49(2)(a) to (d) (“high net worth companies, unincorporated associations etc”) of the Order; (d) are outside the United Kingdom subject to relevant regulation in each jurisdiction, material(all such persons together being referred to as “relevant persons”). This material is directed only at relevant persons and must not be acted on or relied on by persons who are not relevant persons. Any investment or investment activity to which this material relates is available only to relevant persons and will be engaged in only with relevant persons. Where this material is labelled as non-independent, it does not provide an impartial or objective assessment of the subject matter and does not constitute independent “research” under the applicable rules of the Financial Conduct Authority in the UK. Consequently, any such non-independent material will not have been prepared in accordance with legal requirements designed to promote the independence of research and will not subject to any prohibition on dealing ahead of the dissemination of research. Any such non-independent material must be considered as a marketing communication. United States: This research report is distributed in the United States of America by CGS-CIMB Securities (USA) Inc, a U.S. registered broker-dealer and a related corporation of CGS-CIMB Research Pte Ltd, PT CGS-CIMB Sekuritas Indonesia, CGS-CIMB Securities (Thailand) Co. Ltd., CGS-CIMB Securities (Hong Kong) Limited, CGS-CIMB Securities (India) Private Limited, and is distributed solely to persons who qualify as “U.S. Institutional Investors” as defined in Rule 15a-6 under the Securities and Exchange Act of 1934. This communication is only for Institutional Investors whose ordinary business activities involve investing in shares, bonds, and associated securities and/or derivative securities and who have professional experience in such investments. Any person who is not a U.S. Institutional Investor or Major Institutional Investor must not rely on this communication. The delivery of this research report to any person in the United States of America is not a recommendation to effect any transactions in the securities discussed herein, or an endorsement of any opinion expressed herein. CGS-CIMB Securities (USA) Inc, is a FINRA/SIPC member and takes responsibility for the content of this report. For further information or to place an order in any of the above-mentioned securities please contact a registered representative of CGS-CIMB Securities (USA) Inc. Other jurisdictions: In any other jurisdictions, except if otherwise restricted by laws or regulations, this report is only for distribution to professional, institutional or sophisticated investors as defined in the laws and regulations of such jurisdictions.
11
14
Asia Pacific Daily │ Equity Research │ June 13, 2018
Corporate Governance Report of Thai Listed Companies (CGR). CG Rating by the Thai Institute of Directors Association (Thai IOD) in 2017, Anti-Corruption 2017 AAV – Very Good, n/a, ADVANC – Excellent, Certified, AEONTS – Good, n/a, AMATA – Very Good, n/a, ANAN – Excellent, n/a, AOT – Excellent, Declared, AP – Excellent, Declared, ASK – Very Good, Declared, ASP – Very Good, Certified, BANPU – Excellent, Certified, BAY – Excellent, Certified, BBL – Very Good, Certified, BCH – Good, Declared, BCP - Excellent, Certified, BCPG – Very Good, n/a, BEM – Very Good, n/a, BDMS – Very Good, n/a, BEAUTY – Good, n/a, BEC – Very Good, n/a, , BGRIM – not available, n/a, BH - Good, n/a, BJC – Very Good, Declared, BJCHI – Very Good, Declared, BLA – Very Good, Certified, BPP – Good, n/a, BR - Good, Declared, BTS - Excellent, Certified, CBG – Good, n/a, CCET – Good, n/a, CENTEL – Very Good, Certified, CHG – Very Good, Declared, CK – Excellent, n/a, COL – Very Good, Declared, CPALL – not available, Declared, CPF – Excellent, Declared, CPN - Excellent, Certified, DELTA - Excellent, n/a, DEMCO – Excellent, Certified, DIF – not available, n/a, DTAC – Excellent, Certified, EA – Very Good, n/a, ECL – Very Good, Certified, EGCO - Excellent, Certified, EPG – Very Good, n/a, GFPT - Excellent, Declared, GGC – not available, Declared, GLOBAL – Very Good, Declared, GLOW – Very Good, Certified, GPSC – Excellent, Declared, GRAMMY - Excellent, n/a, GUNKUL – Excellent, Declared, HANA - Excellent, Certified, HMPRO - Excellent, Certified, ICHI – Excellent, n/a, III – not available, n/a, INTUCH - Excellent, Certified, IRPC – Excellent, Certified, ITD – Very Good, n/a, IVL - Excellent, Certified, JAS – not available, Declared, JASIF – not available, n/a, JUBILE – Good, Declared, KAMART – not available, n/a, KBANK - Excellent, Certified, KCE - Excellent, Certified, KGI – Very Good, Certified, KKP – Excellent, Certified, KSL – Very Good, Certified, KTB - Excellent, Certified, KTC – Excellent, Certified, LH - Very Good, n/a, LPN – Excellent, Certified, M – Very Good, n/a, MACO – Very Good, n/a, MAJOR – Very Good, n/a, MAKRO – Very Good, Declared, MALEE – Very Good, n/a, MBKET – Very Good, Certified, MC – Very Good, Declared, MCOT – Excellent, Certified, MEGA – Very Good, n/a, MINT - Excellent, Certified, MTLS – Very Good, Declared, NYT – Excellent, n/a, OISHI – Very Good, n/a, PLANB – Excellent, Declared, PLAT – Very Good, Certified, PSH – Excellent, Certified, PSL - Excellent, Certified, PTT - Excellent, Certified, PTTEP - Excellent, Certified, PTTGC - Excellent, Certified, QH – Excellent, Certified, RATCH – Excellent, Certified, ROBINS – Excellent, Certified, RS – Very Good, n/a, SAMART - Excellent, n/a, SAPPE - Good, n/a, SAT – Excellent, Certified, SAWAD – Very Good, n/a, SC – Excellent, Declared, SCB - Excellent, Certified, SCBLIF – not available, n/a, SCC – Excellent, Certified, SCN – Very Good, Declared, SCCC - Excellent, Declared, SIM - Excellent, n/a, SIRI – Very Good, Declared, SPA - Good, n/a, SPALI - Excellent, n/a, SPRC – Excellent, Declared, STA – Very Good, Declared, STEC – Excellent, n/a, SVI – Excellent, Certified, TASCO – Very Good, n/a, TCAP – Excellent, Certified, THAI – Very Good, n/a, THANI – Very Good, Certified, THCOM – Excellent, Certified, THRE – Very Good, Certified, THREL – Excellent, Certified, TICON – Very Good, Declared, TIPCO – Very Good, Certified, TISCO - Excellent, Certified, TK – Very Good, n/a, TKN – Very Good, Declared, TMB - Excellent, Certified, TNR – Good, n/a, TOP - Excellent, Certified, TPCH – Good, n/a, TPIPP – not available, n/a, TRUE – Excellent, Declared, TTW – Very Good, n/a, TU – Excellent, Declared, TVO – Excellent, Declared, UNIQ – not available, Declared, VGI – Excellent, Declared, WHA – not available, Declared, WHART – not available, n/a, WORK – not available, n/a. Companies participating in Thailand’s Private Sector Collective Action Coalition Against Corruption programme (Thai CAC) under Thai Institute of Directors (as of October 28, 2016) are categorized into: - Companies that have declared their intention to join CAC, and - Companies certified by CAC
Recommendation Framework Stock Ratings Definition: Add The stock’s total return is expected to exceed 10% over the next 12 months. Hold The stock’s total return is expected to be between 0% and positive 10% over the next 12 months. Reduce The stock’s total return is expected to fall below 0% or more over the next 12 months. The total expected return of a stock is defined as the sum of the: (i) percentage difference between the target price and the current price and (ii) the forward net dividend yields of the stock. Stock price targets have an investment horizon of 12 months.
Sector Ratings Definition: Overweight An Overweight rating means stocks in the sector have, on a market cap-weighted basis, a positive absolute recommendation. Neutral A Neutral rating means stocks in the sector have, on a market cap-weighted basis, a neutral absolute recommendation. Underweight An Underweight rating means stocks in the sector have, on a market cap-weighted basis, a negative absolute recommendation.
Country Ratings Definition: Overweight An Overweight rating means investors should be positioned with an above-market weight in this country relative to benchmark. Neutral A Neutral rating means investors should be positioned with a neutral weight in this country relative to benchmark. Underweight An Underweight rating means investors should be positioned with a below-market weight in this country relative to benchmark.
WJV#05
12
15