Embed Size (px)
Citation preview
Asian American Eldersin New York City:
A Study of Health, Social Needs, Quality of Life and Quality of Care
The Asian American Federation of New YorkFebruary 2003
In Collaboration With:Brookdale Center on Aging, Hunter College
Copyright 2003
COLLABORATING ORGANIZATIONSAsian American Federation of New YorkBrookdale Center on Aging, Hunter College
ADVISORY COMMITTEEJames Dumpson, Ph.D., Chair New York Center for Policy on Aging of the New
York Community Trust
Rose Dobrof, D.S.W., Co-Chair Brookdale Center on Aging, Hunger College
Le Lieu Browne Refugee Women’s Council
Marjorie H. Cantor, M.A. Fordham Graduate School of Social Sciences
David Chen, M.S.W. Chinese-American Planning Council
Namkee G. Choi, D.S.W. University of Texas, Austin
Henry Chung, M.D. Pfizer
Gloria Galura-Siasoco, Ph.D. Rusk Institute of Rehabilitation Medicine
Kwang Suk Kim, M.S.W. Korean Community Services of Metropolitan New York
Kiyoka Koizumi, Ph.D. Brooklyn College of Health & Nutrition Sciences
Ji Seon Lee, Ph.D. Fordham Graduate School of Social Sciences
Mari Sakaji Japanese American Social Services, Inc.
Tazuko Shibusawa, Ph.D. Columbia University School of Social Work
RESEARCH TEAMProject Director: Angela Shen Ryan, D.S.W., Hunter College School
of Social Work
Principal Investigator: Ada Mui, Ph.D., Associate Professor, ColumbiaUniversity School of Social Work York.
Principal Investigator: Peter Cross, M.S.W., Brookdale Center on Aging ofHunter College
Survey conducted by Harris Interactive, Inc.
David Krane, Senior Vice PresidentMichele Salamon, Project ManagerDiana Gravitch, Research Associate
ASIAN AMERICAN ELDERS IN NEW YORK CITY
ASIAN AMERICAN FEDERATION OF NEW YORK B
ACKNOWLEDGEMENTSFunding support for this study has been generously provided by:
Altman FoundationJames N. Jarvie Commonweal ServiceJean and Louis Dreyfus FoundationMacKintosh FoundationThe New York Community TrustStarr FoundationUnited Hospital FundWayen Charitable Foundation
The Asian American Federation is also grateful to the following individuals who haveoffered invaluable advice, insights, information and assistance:
Julie Chan Asian American Federation of New York
Meghan Clarke Asian American Federation of New York
Ramon Gil Ramon Gil Art & Design
Kristin Hokoyama Asian American Federation of New York
Lori Kitazono Asian American Federation of New York
Hong Shing Lee YMCA, Chinatown Branch
Lakshmi Malroutu, Ph.D.
Len McNally The New York Community Trust
Cyril Nishimoto Iwa
Terri Raphael, Ph.D.
Vicki Shu Asian American Federation of New York
Shao-Chee Sim Asian American Federation of New York
Haeyoung Yoon
ASIAN AMERICAN ELDERS IN NEW YORK CITY
ASIAN AMERICAN FEDERATION OF NEW YORK C
CONTENTS
Foreword: Cao K. O . . . . . . . . . . . . . . . . . . . . . . . . . . . . . . . . . . . . . . . . . . . . . . . . . . E
Preface: James R. Dumpson, Ph.D., and Rose Dobrof, D.S.W. . . . . . . . . . . . . . . . . . . F
Executive Summary: Angela Shen Ryan, D.S.W. . . . . . . . . . . . . . . . . . . . . . . . . . . . H
Chapter 1: Overview . . . . . . . . . . . . . . . . . . . . . . . . . . . . . . . . . . . . . . . . . . . . . . . . . . 11.1 Introduction - Angela Shen Ryan, D.S.W.. . . . . . . . . . . . . . . . . . . . . . . . . . . . . . 11.2 Methodology - Harris Interactive, Inc. . . . . . . . . . . . . . . . . . . . . . . . . . . . . . . . . 4
Literature Cited . . . . . . . . . . . . . . . . . . . . . . . . . . . . . . . . . . . . . . . . . . . . . . . . . 11
Chapter 2: A Demographic and Economic Profile . . . . . . . . . . . . . . . . . . . . . . . . . . 12Peter S. Cross, M.S.W2.1 Demographic and Background Characteristics . . . . . . . . . . . . . . . . . . . . . . . . . 142.2 Living Arrangements . . . . . . . . . . . . . . . . . . . . . . . . . . . . . . . . . . . . . . . . . . . . 212.3 Economic Well-Being . . . . . . . . . . . . . . . . . . . . . . . . . . . . . . . . . . . . . . . . . . . . 232.4 Work History and Occupation . . . . . . . . . . . . . . . . . . . . . . . . . . . . . . . . . . . . . 242.5 Summary and Implications . . . . . . . . . . . . . . . . . . . . . . . . . . . . . . . . . . . . . . . . 25
Literature Cited . . . . . . . . . . . . . . . . . . . . . . . . . . . . . . . . . . . . . . . . . . . . . . . . . 27
Chapter 3: Physical Health, Mental Health and Quality of Life . . . . . . . . . . . . . . . . 28Ada C. Mui, Ph.D., A.C.S.W3.1 Population Trends and Need for Data . . . . . . . . . . . . . . . . . . . . . . . . . . . . . . . 303.2 Physical Health . . . . . . . . . . . . . . . . . . . . . . . . . . . . . . . . . . . . . . . . . . . . . . . . . 303.3 Quality of Life . . . . . . . . . . . . . . . . . . . . . . . . . . . . . . . . . . . . . . . . . . . . . . . . . . 353.4 Mental Health . . . . . . . . . . . . . . . . . . . . . . . . . . . . . . . . . . . . . . . . . . . . . . . . . . 413.5 Explanations . . . . . . . . . . . . . . . . . . . . . . . . . . . . . . . . . . . . . . . . . . . . . . . . . . . 433.6 Summary and Implications . . . . . . . . . . . . . . . . . . . . . . . . . . . . . . . . . . . . . . . . 44
Literature Cited . . . . . . . . . . . . . . . . . . . . . . . . . . . . . . . . . . . . . . . . . . . . . . . . . 46
Chapter 4: Informal and Formal Supports . . . . . . . . . . . . . . . . . . . . . . . . . . . . . . . . 47Ada C. Mui, Ph.D., A.C.S.W., and Peter S. Cross, M.S.W.4.1 Structure of Informal Support Networks . . . . . . . . . . . . . . . . . . . . . . . . . . . . . 494.2 Interaction within Informal Support Networks . . . . . . . . . . . . . . . . . . . . . . . . 544.3 Intergenerational Assistance. . . . . . . . . . . . . . . . . . . . . . . . . . . . . . . . . . . . . . . 634.4 Use of Formal Services . . . . . . . . . . . . . . . . . . . . . . . . . . . . . . . . . . . . . . . . . . . 734.5 Unmet Needs. . . . . . . . . . . . . . . . . . . . . . . . . . . . . . . . . . . . . . . . . . . . . . . . . . . 784.6 Summary and Implications . . . . . . . . . . . . . . . . . . . . . . . . . . . . . . . . . . . . . . . . 82
Literature Cited . . . . . . . . . . . . . . . . . . . . . . . . . . . . . . . . . . . . . . . . . . . . . . . . . 84
Chapter 5: Traditional Values, Stress and Life Satisfaction . . . . . . . . . . . . . . . . . . . 85Ada C. Mui, Ph.D., A.C.S.W., and Peter S. Cross, M.S.W.5.1 Traditional Values and Culture Gap . . . . . . . . . . . . . . . . . . . . . . . . . . . . . . . . . 875.2 Stressful Life Events . . . . . . . . . . . . . . . . . . . . . . . . . . . . . . . . . . . . . . . . . . . . . 975.3 Leisure Time . . . . . . . . . . . . . . . . . . . . . . . . . . . . . . . . . . . . . . . . . . . . . . . . . . 1055.4 Quality of Life . . . . . . . . . . . . . . . . . . . . . . . . . . . . . . . . . . . . . . . . . . . . . . . . . 1065.5 Summary and Implications . . . . . . . . . . . . . . . . . . . . . . . . . . . . . . . . . . . . . . . 112
Literature Cited . . . . . . . . . . . . . . . . . . . . . . . . . . . . . . . . . . . . . . . . . . . . . . . . 115
Chapter 6: Recommendations . . . . . . . . . . . . . . . . . . . . . . . . . . . . . . . . . . . . . . . . . 116Angela Shen Ryan, D.S.W.
Appendix: Census 2000 Data for Asian American Elders . . . . . . . . . . . . . . . . . . . 122
ASIAN AMERICAN ELDERS IN NEW YORK CITY
ASIAN AMERICAN FEDERATION OF NEW YORK D
ForewordCao K. O, Executive Director
Asian American Federation of New York
According to the 2000 Census, the elderly Asian American population in New York Citygrew by 86% during the previous decade. Accompanying this striking increase is analarming additional Census revelation that 24% of Asian American elders (or almost 1in 4 of them) live in poverty, in contrast with about 18% of the general elderly popula-tion in the city.
Demographic statistics such as these stood largely unexplained, without human texture,until this study. The Asian American Federation initiated Asian American Elders in NewYork City to fill a void of in-depth documented and shared knowledge of this burgeoningpopulation group, which numbered 59,184 in 2000.
This landmark study provides an important baseline of information on quality of life andcare, encompassing underlying factors. The report also points out critical needs that poli-cy makers, service providers and philanthropic leaders must address -- from retirement pro-tections to senior housing, and from health insurance access to geriatric mental health.
As the report illustrates in unprecedented detail, Asian American elders experiencegreater socio-economic vulnerability and have fewer options for available, culturally-and linguistically-appropriate health care and social services than the general elderlypopulation in the city. Among key results, older Asian Americans endure a lower-than-average quality of life, marked by higher levels of depression, anxiety, loneliness, physi-cal illness and social difficulties.
The city and the state must make it a high priority to enhance the well-being of the sus-ceptible senior Asian American population. Furthermore, policy makers and service plan-ners must consider language access and cultural competence in serving this ethnicallydiverse population. Existing service and social infrastructures of the various AsianAmerican ethnic communities also need to be taken into account.
Asian American Elders in New York City is the result of a wonderful collaboration betweenthe Brookdale Center on Aging of Hunter College and the Asian American Federation. Wewere fortunate to have a highly respected and dedicated research team willing to take onthe challenges associated with producing the first comprehensive study of its kind in NewYork City. In addition, the insights and assistance of members of the Advisory Committeewere invaluable and contributed to the thoroughness of this study. We are particularlyindebted to Dr. James Dumpson, Dr. Rose Dobrof and Professor Marjorie Cantor, the prin-cipals of the 1993 study Growing Older in the 1990s: A Study of Changing Lifestyles,Quality of Life and Quality of Care, on which the research design of this study is based.This report would not have been possible without the financial support of several founda-tions, whose generosity and commitment we appreciate. Last but not least, we owe ourdeep gratitude to the 407 Asian American elders who opened their doors and shared theirlife stories with us.
Our seniors have spoken. It is now our turn to act.
ASIAN AMERICAN ELDERS IN NEW YORK CITY
ASIAN AMERICAN FEDERATION OF NEW YORK E
PrefaceBy James R. Dumpson, Ph.D., Chair, Advisory Committee
and Rose Dobrof, D.S.W.,Co-Chair, Advisory Committee
Asian American Elders in New York City is the result of years of planning and work bydedicated researchers. The seeds for the study were planted nearly a decade ago whenan earlier study on aging in New York City, Growing Older in the 1990s: A Study ofChanging Lifestyles, Quality of Life and Quality of Care, was published in 1993.
Data collection for Growing Older began in 1989 under the direction of Marjorie Cantor,then University Professor and Brookdale Distinguished Scholar at the Third Age Centerof Fordham University, and Barry Gurland, M.D., of Columbia University’s Center forGeriatrics. Cathy Berkman, Ph.D., M.S.W., and Mark Brenner, Ph.D., then a DoctoralFellow, also at the Third Age Center, served as Co-Principal Investigators.
An Advisory Committee was established and co-chaired by James R. Dumpson, Ph.D.,then Senior Vice-President of the New York Community Trust, and Rose Dobrof,D.S.W., then Executive Director of the Brookdale Center on Aging of Hunter College.The Committee, which included leaders in the fields of Social Work and Gerontology inNew York City, met frequently and provided important guidance to the Cantor -Gurland team and staff. The study focused on the Caucasian, African-American andHispanic, particularly Puerto Rican, elderly of the city and comparisons among themwith respect to important topics such as:
• Family composition and function• Economic and educational status• Living arrangements• Composition of informal support systems and help from family, neighbors and
friends • Use of formal systems and professional services
Although some Asian-American elders were respondents in the Growing Older study,the sample was too small to permit a statistically valid analysis of the findings. At a 1995conference attended by several hundred public officials, service providers and academ-ics, Mr. Cyril Nishimoto, Chair of the Asian American Task Force on the Aging of theAsian American Federation of New York, questioned the impact of the omission onproviding responsive and effective services for an important and growing population.
As a result, an Advisory Committee was convened and the decision made to seek fund-ing for a replication - to the extent possible and with ethnically sensitive modifications- of the original study with specific focus on Asian American elders. Angela Shen Ryan,D.S.W., then Professor at Hunter College School of Social Work, accepted the position
ASIAN AMERICAN ELDERS IN NEW YORK CITY
ASIAN AMERICAN FEDERATION OF NEW YORK F
of Project Director. With initial support from The New York Community Trust, thestudy was launched.
We owe special thanks to the seven foundations that joined the Trust in support. They are:
* Altman Foundation* James N. Jarvie Commonweal Service* Jean and Louis Dreyfus Foundation* MacKintosh Foundation* Starr Foundation* United Hospital Fund* Wayen Charitable Foundation
In an important and serendipitous fashion, the passage of years between the originalstudy and this one was advantageous. The decade of 1990s was a period in which theAsian American population in New York City grew significantly in size as well as indiversity. Indeed, one of the most difficult design issues that faced the AdvisoryCommittee, Dr. Shen Ryan and Mr. Cao O was identifying the countries of origin to beincluded in the study. The final decision about inclusion rested on a number of factors,including population size and estimates of the number of older people in each. We alsowanted to be certain that the diversity of Asian Americans would be represented interms of cultural factors, religion, family composition, time of arrival in New York Cityand economic status. Not every group could be included, yet we are comfortable withthe range and heterogeneity of the sample populations in the study.
We believe that like the original study and Professor Cantor’s subsequent research onJewish elderly, Asian American Elders in New York City will help policy makers andpublic officials, academics, professionals and staff of the network of aging servicesorganizations work effectively with Asian American elders and their families.
We salute Professor Shen Ryan, Mr. O and all the participants in the study, and weexpress our gratitude to the members of the Advisory Committee and the foundationswho made the study possible.
ASIAN AMERICAN ELDERS IN NEW YORK CITY
ASIAN AMERICAN FEDERATION OF NEW YORK G

Executive SummaryAngela Shen Ryan, D.S.W.
The population of Asian Americans has been increasing in number and diversity.Cultural and linguistic differences as well as varying immigration experiences make itcritical to have formal services available that are both accessible to and appropriate forAsian American elders from many ethnic groups.
Asian American Elders in New York City is a result of a needs assessment study initi-ated by the Asian American Federation of New York to identify program and knowledgegaps that can guide policy and service planning in both the public and voluntary sectors.Information was gathered through a locally represented survey conducted by HarrisInteractive, Inc., of 407 Chinese, Filipino, Indian, Japanese, Korean and Vietnameseadults aged 65 and over living in one of the boroughs of New York City. Each ethnicgroup has its own strengths and needs. Major findings from the study are summarizedbelow to give a composite profile of the population.
Due to several limitations of the study design, readers are advised to be cautious in draw-ing inferences about the wider population Asian American elders as well as about spe-cific Asian ethnic subgroups in New York City. First, the study is based on a sample ofAsian Americans living in block groups of the city most densely populated by AsianAmericans. Thus, the findings are more indicative of characteristics of Asian Americanelderly who live in block groups with relatively high proportion of Asian Americans thanthose who are more dispersed. Second, Filipino, Japanese and Vietnamese elderly groupshave less than 100 each in the sample. Therefore, the findings about them should beviewed as merely suggestive and require further research to ascertain their representa-tiveness. Furthermore, percentage calculations may be suggestive of higher confidencethan warranted, and comparisons with other Asian ethnic groups are inappropriate.
Major Findings1. Socio-Economic Characteristics
• The average age of Asian American elders is 72.4 years, and the population is 56%female.
• Fifty per cent of the elders are married, 42% widowed, 4% are divorced, and only 3%never married.
• Nineteen per cent (19%) of Asian American elders live alone. The majority (51%)live in households with three or more individuals.
• Asian American elders live with significant financial limitations, with the medianhousehold income ranging from $6000 to $8,500. Fifty-two per cent (52%) do not
ASIAN AMERICAN ELDERS IN NEW YORK CITY
ASIAN AMERICAN FEDERATION OF NEW YORK H
receive Social Security benefits, and slightly more than one-third (37%) depend uponSupplemental Security Income (SSI), which is a means tested program.
• The majority (51%) of people surveyed live in rented apartments, including 31% whoreside in walk-up apartment buildings.
• Thirty-nine per cent (39%) of the people surveyed did not graduate from high school,while 44% completed high school and 17% had at least some years of college.
• Religion is very important in the lives of Asian American elders. Nearly 84% of thepeople in the sample report an affiliation with organized religion, including 22%Catholic, 21% Buddhist, 17% Hindu, 16% Protestant, and 5% Muslim.
• Nearly 100% of the people in the study are immigrants who came to the United Statesin middle and late-middle age. Immigration occurs primarily to join family members.
• Less than 25% describe themselves as speaking English well. Only 10% sometimesspeak English at home with family and friends, while 25% live in households inwhich no member speaks English well.
• Forty-six per cent (46%) are citizens, and 44% have permanent residency status.
2. Physical Health, Mental Health and Quality of Life
• Asian American elders rate their overall general health as good and have an averageof 2.8 medical conditions per person.
• The four most prevalent medical conditions are arthritis (43.4%), high blood pressure(41.5%), high cholesterol (28%) and cataracts (26.7%).
• On measures of physical functioning, general health, social functioning, and mentalhealth, Asian American elders rank their quality of life 10% or more lower than doesthe general elderly population in the United States.
• Depression is experienced among Asian American elders at a higher rate than the generalelderly population, with 40% reporting depressive symptoms ranging from mild to severe.
• Asian American elders are more likely to be depressed when they perceive their healthas poor, experience more stressful life changes, have higher levels of assistance fromtheir children, have children who do not live in proximity, are less religious and expe-rience a greater cultural gap between themselves and their children.
• Asian American elders are more likely to have poor general mental health when thereis a greater cultural gap between elders and their children, have more stressful lifechanges and are unable to read English.
• Elders are more likely to have poor social functioning when they have more depres-sive symptoms, more Activities of Daily Living (ADL)1 impairments, are unable toread English and are not enrolled in private health insurance plans.”
ASIAN AMERICAN ELDERS IN NEW YORK CITY
ASIAN AMERICAN FEDERATION OF NEW YORK I
1 Activities of Daily Living (ADLs) includebathing, dressing, grooming, transfer-ring, toileting and feeding.
3. Informal and Formal Social Supports
• Asian American elders have an average of 2.6 children residing in the United States.Nearly half of all elders see their children daily.
• Elders have more neighbors and close friends than children for informal support. Onaverage, people report having 3.4 close friends and 2.9 neighbors whom they know well.
• Although intergenerational assistance is reciprocal, children provide more extensivehelp to their parents than vice versa. More than half of Asian American elders receivehelp from their children when someone is ill, with shopping or errands, driving, fix-ing things around the house, advice on money matters and direct financial assistance.Elders living with others are more likely to have the help of their children.
• Almost 60% of the people in the survey turn to the formal sector for two or more serv-ices annually. Social Security, Medicare and Medicaid, senior centers and religiousleaders are the services that they report using most frequently. The highest use is byindividuals who are in poor health and speak English or live in households where atleast one member knows the language.
• Fully 80% of Asian American elders have a regular source of medical care, typicallyfrom a doctor practicing Western-style medicine. Almost half of the people report see-ing their doctor five or more times during the year, and more than 40% spent one to10 days sick in bed.
• Approximately half of Asian American elders have health insurance throughMedicare (51% Part A and 66% Part B coverage) in contrast to 90% of the elderlypopulation at large. Other sources of health insurance are Medicaid (41%) and HealthMaintenance Organizations (24%).
• Elders identify unmet needs for Social Security, Medicaid and Medicare, legal servic-es, language translation, someone to call or visit, help with entitlements and expand-ed help with Activities of Daily Living (ADLs).
4. Traditional Values, Stress and Life Satisfaction
• Values for honor, responsibility and unity of family that are traditionally held in highregard in many Asian cultures continue to be honored among Asian American elders.
• The majority of elders perceive that their traditional values differ from their childrennot at all or only in small ways.
• During the three years prior to the survey, one-quarter or more of the elders experi-enced stressful life events, including serious financial problems (39.2%), death of aspouse (9.5%), death of a relative or close friend (29.1%), personal serious illness orinjury (29.2%), having many family problems (22.7%), being dependent on others(29.9%), poverty (39.2%), anxiety (33.6%) and loneliness (21.8%).
ASIAN AMERICAN ELDERS IN NEW YORK CITY
ASIAN AMERICAN FEDERATION OF NEW YORK J
• For 39.2% of elders, family financial condition is a serious problem, and 23.5% reportthat having too many medical bills is a serious problem.
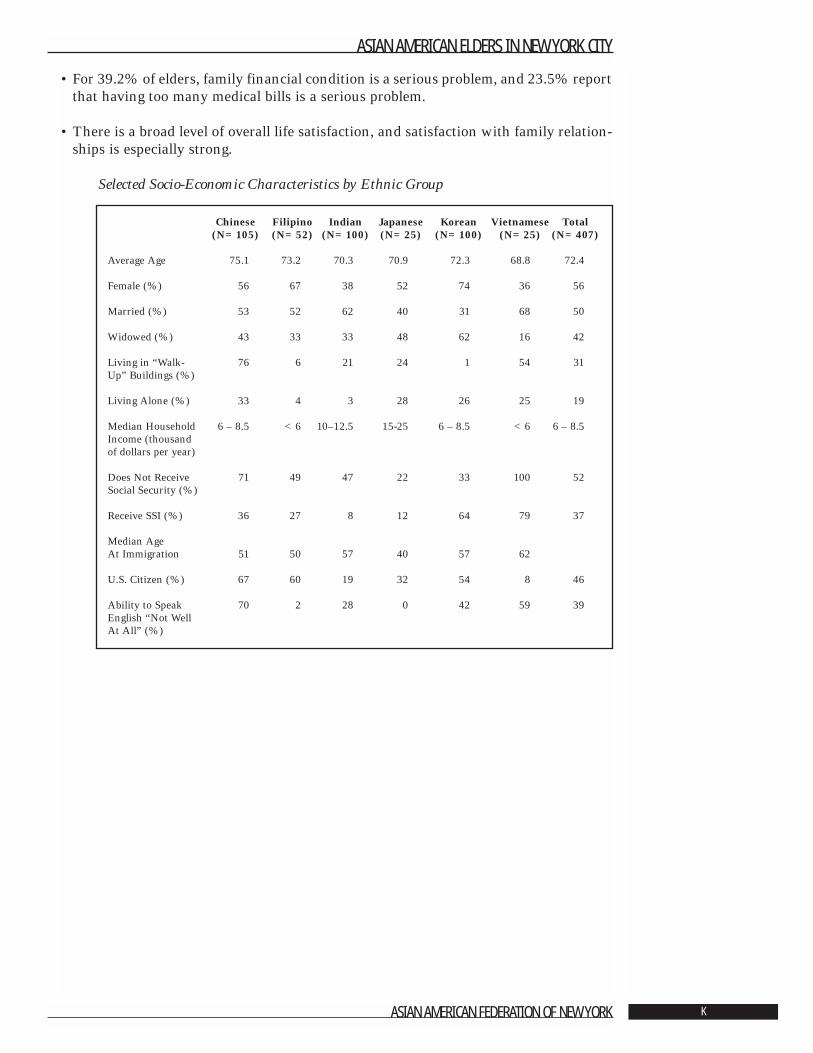
• There is a broad level of overall life satisfaction, and satisfaction with family relation-ships is especially strong.
Selected Socio-Economic Characteristics by Ethnic Group
ASIAN AMERICAN ELDERS IN NEW YORK CITY
ASIAN AMERICAN FEDERATION OF NEW YORK K
Chinese Filipino Indian Japanese Korean Vietnamese Total(N=105) (N=52) (N=100) (N=25) (N=100) (N=25) (N=407)
Average Age 75.1 73.2 70.3 70.9 72.3 68.8 72.4
Female (%) 56 67 38 52 74 36 56
Married (%) 53 52 62 40 31 68 50
Widowed (%) 43 33 33 48 62 16 42
Living in “Walk- 76 6 21 24 1 54 31Up” Buildings (%)
Living Alone (%) 33 4 3 28 26 25 19
Median Household 6 – 8.5 <6 10–12.5 15-25 6 – 8.5 <6 6 – 8.5Income (thousand of dollars per year)
Does Not Receive 71 49 47 22 33 100 52Social Security (%)
Receive SSI (%) 36 27 8 12 64 79 37
Median AgeAt Immigration 51 50 57 40 57 62
U.S. Citizen (%) 67 60 19 32 54 8 46
Ability to Speak 70 2 28 0 42 59 39English “Not WellAt All” (%)
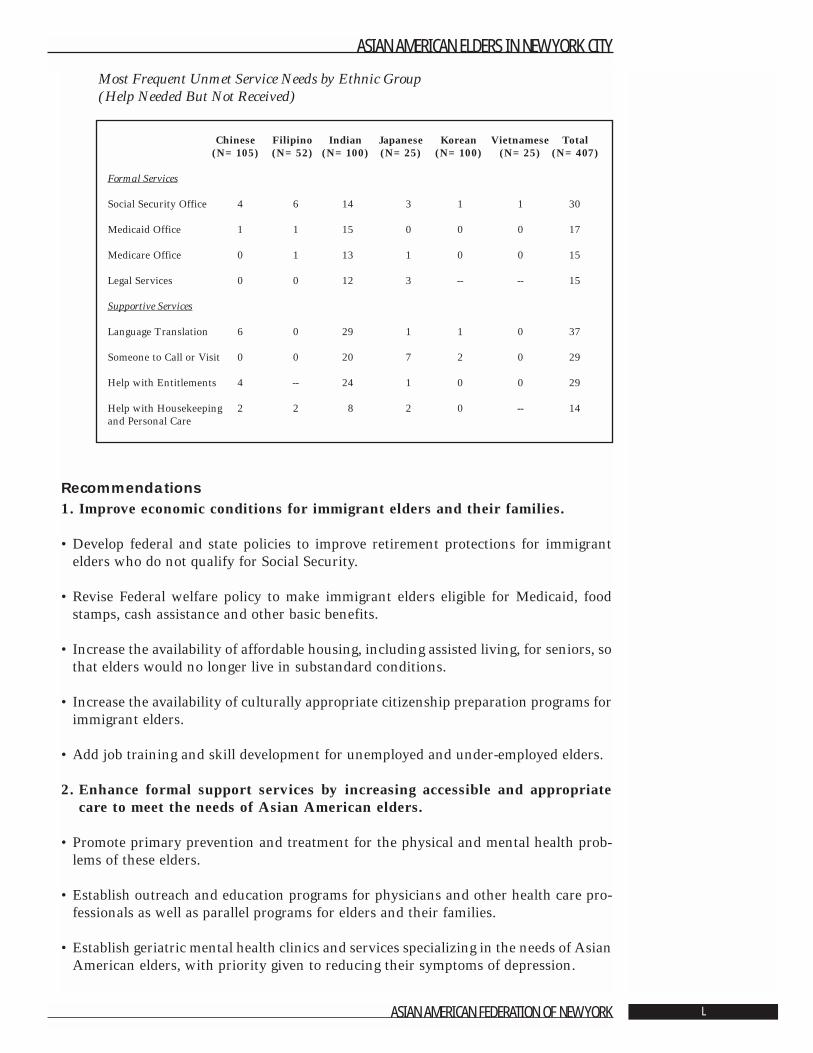
Most Frequent Unmet Service Needs by Ethnic Group(Help Needed But Not Received)
Recommendations1. Improve economic conditions for immigrant elders and their families.
• Develop federal and state policies to improve retirement protections for immigrantelders who do not qualify for Social Security.
• Revise Federal welfare policy to make immigrant elders eligible for Medicaid, foodstamps, cash assistance and other basic benefits.
• Increase the availability of affordable housing, including assisted living, for seniors, sothat elders would no longer live in substandard conditions.
• Increase the availability of culturally appropriate citizenship preparation programs forimmigrant elders.
• Add job training and skill development for unemployed and under-employed elders.
2. Enhance formal support services by increasing accessible and appropriatecare to meet the needs of Asian American elders.
• Promote primary prevention and treatment for the physical and mental health prob-lems of these elders.
• Establish outreach and education programs for physicians and other health care pro-fessionals as well as parallel programs for elders and their families.
• Establish geriatric mental health clinics and services specializing in the needs of AsianAmerican elders, with priority given to reducing their symptoms of depression.
ASIAN AMERICAN ELDERS IN NEW YORK CITY
ASIAN AMERICAN FEDERATION OF NEW YORK L
Chinese Filipino Indian Japanese Korean Vietnamese Total(N=105) (N=52) (N=100) (N=25) (N=100) (N=25) (N=407)
Formal Services
Social Security Office 4 6 14 3 1 1 30
Medicaid Office 1 1 15 0 0 0 17
Medicare Office 0 1 13 1 0 0 15
Legal Services 0 0 12 3 -- -- 15
Supportive Services
Language Translation 6 0 29 1 1 0 37
Someone to Call or Visit 0 0 20 7 2 0 29
Help with Entitlements 4 -- 24 1 0 0 29
Help with Housekeeping 2 2 8 2 0 -- 14and Personal Care
• Increase the availability of programs aimed at reducing the number of elders whoexperience limitations in their Activities of Daily Living (ADL).
• Increase access to health insurance among immigrant elders not covered by Medicareor Medicaid.
3. Integrate informal social support systems into program development andservice delivery.
• Reinforce values shared across generations and communities as part of routine serv-ice delivery.
• Recognize the impact of acculturation levels and generational gaps on family stressand mental health.
• Acknowledge and nurture the strength in social networks and social supports as partof service planning and delivery.
• Mobilize elders to become active participants on behalf of their own communities.
4. Improve the cultural competence of programs serving Asian American elders.
• Design English language classes to build a sense of personal integrity and identityalong with new and practical skills.
• Develop language specific and culturally sensitive strategies to improve access to infor-mation about entitlements, legal services and case management resources.
• Target funds to increase ethnically specific senior centers to serve new immigrants.
• Provide funding to train Asian American professionals to work with elders.
• Expand the presence of bilingual and bicultural staff in ethnic-specific programs aswell as in all health and social service settings with Asian American elders.
ASIAN AMERICAN ELDERS IN NEW YORK CITY
ASIAN AMERICAN FEDERATION OF NEW YORK M
Chapter 1: Overview1.1 Introduction
Angela Shen Ryan, D.S.W.
There are approximately 10.2 million Asian Americans in the United States, and it isprojected that by 2020, the number will grow to approximately 20.2 million. More than439,000 people age 65 and older identified themselves as Asian in 1990, and 801,300did so in 2000. In 1990, there were 33,000 Asian American elders in New York City and59,200 by 2000. The Asian American elders represented 7.5% of the total of 787,047Asian Americans of all ages living in New York City in 2000 [1]. Nearly one in every 10residents living in New York City is self-described as Asian, up from one in 14 as recent-ly as 1990 [2]. This demographic change will have a powerful impact on policy and theprovision of health and social services as the volume of need among an important andoften overlooked aging minority population increases dramatically.
The record increase in the elderly population during the period 1950 to 2000 drovemajor growth and reshaping of health and social services. More senior services, homehealth care, adult day care services, respite services, and community-based long termcare services were created. National surveys of health and social service problemsamong older adults focused primarily on the elderly population at large, with someattention to special issues of minority aging among Hispanic and African American eld-ers. Rarely were Asian elders included in research. The rationale was that samples ofAsian subgroups were too small to provide valid data [3, 4]. The omission of AsianAmerican elders from such studies has had significant deleterious impact on currentlevels of service provision as well as on preparing for future service needs [5].
Asians and Pacific Islanders often are misunderstood to be a single homogeneous eth-nic group. Unfortunately, failure to make distinctions among diverse ethnic, culturaland language groups can lead to false conclusions about their social and health needs.Moreover, Asian Americans are not only increasing in number but also becomingincreasingly diverse. Asians of Chinese descent remain the largest Asian group, makingup nearly half of all Asians. The Asian Indian population grew by 81% and now repre-sents 22% of all Asians. Two other large Asian groups are Filipinos and Koreans. EachAsian ethnic group has its own distinctive cultural background, unique historical expe-riences and reasons for immigration [6]. The tendency to generalize about their eco-nomic, cultural, social and political circumstances has led to programs that are not acces-sible or appropriate for many Asians. The lack of culturally and linguistically relevantservices has resulted in difficulty for many elders in accessing a range of formal servic-es from primary health care to nursing homes.
In 1993, the Asian American Federation of New York, acting in the face of a rapidlygrowing elderly Asian population and rising worry about elders’ inability to access
ASIAN AMERICAN ELDERS IN NEW YORK CITY
ASIAN AMERICAN FEDERATION OF NEW YORK 1
health and social services in New York City, created a task force on aging with con-cerned professionals as well as social service agencies serving Asian American elders.The task force conducted a survey of Asian American service agencies and reported itsfindings at their conference in 1995. One of the major findings was the lack of formalservices available to meet the needs of Asian American elders. It also indicated that abroader understanding of the health and social service needs of the Asian American eld-erly would be valuable. The task force recommended conducting a needs assessmentstudy. The findings would then serve as a basis for policy and program development inboth the public and voluntary sectors of New York City to meet current and future serv-ice needs of Asian American elders.
Some members of the task force, led by the Asian American Federation of New York,approached Dr. Rose Dobrof of the Brookdale Center on Aging of Hunter College andDr. James Dumpson, Project Director of the landmark study Growing Older in New YorkCity in the 1990s, to explore the feasibility of conducting a needs assessment of AsianAmerican elders in New York City. The objectives of the study were to:
• Profile the health and social service needs of Asian American elders in New York City• Document their current quality of life and care;• Identify the impact of the immigrant experience and acculturation on informal and
formal supports, service needs and mental health;• Establish a benchmark for measuring and evaluating changes in the quality of life and
care of Asian American elders in New York City and other urban areas;• Provide current information to guide program planning in New York City and other
communities.
In 1997, an Executive Committee was formed to oversee implementation of the study.It included: Cao K. O, Executive Director of the Asian American Federation of NewYork; James Dumpson, Ph.D., New York Center for Policy on Aging of the New YorkCommunity Trust; Rose Dobrof, D.S.W., Brookdale Professor of Gerontology at HunterCollege School of Social Work; and Angela Shen Ryan, D.S.W., Hunter College Schoolof Social Work.
The Committee made key decisions to guide the study. They identified Chinese, Filipino,Indian, Japanese, Korean, and Vietnamese ethnic groups for inclusion in the study anddetermined that all respondents would be age 65 or older. They focused the study ondemographic characteristics, social and mental health issues, formal and informal sup-ports and traditional cultural values. Specific survey questions were based on those usedfor the Growing Older study and adapted for Asian Americans. The final form of thequestionnaire was revised by the Principal Investigators and Project Director.
Harris Interactive, Inc., was selected to conduct the fieldwork phase of the study basedon their documented expertise with large-scale surveys, experience working with elder-ly respondents and their contributions to the earlier Growing Older study. The ques-tionnaire was pretested in Chinese, Korean and Vietnamese. Survey participants wereinterviewed in English, Chinese (both Mandarin and Cantonese), Hindi, Korean,Tagalog and Vietnamese.
A total of 407 interviews were completed for use in the study. By ethnic group theyincluded: • 105 Chinese• 100 Korean
ASIAN AMERICAN ELDERS IN NEW YORK CITY
ASIAN AMERICAN FEDERATION OF NEW YORK 2
• 100 Indian• 52 Filipino• 25 Vietnamese• 25 Japanese
The Project Director was responsible for setting the overall research goals, maintainingcommunications with the Advisory Committee members, reviewing and approvingreports as well as ensuring day-to-day coordination and integration of project activities.Ada Mui, Ph.D., Assistant Professor, Columbia University School of Social Work andPeter Cross, M.S.W., Brookdale Center on Aging of Hunter College, were the project’sPrincipal Investigators. They were responsible for the technical quality and integrity ofthe research as well as analysis of the data.
The Advisory Committee was formed with representatives of key health and social serv-ice agencies serving elderly Asian Americans, those knowledgeable about research onolder adults, and experts on sub-Asian languages, customs and culture. The group,which met at least quarterly, ensured that the project was implemented with full infor-mation about and sensitivity to Asian subgroup values and preferences. JamesDumpson, Ph.D., served as Committee Chair and Rose Dobrof, D.S.W., as Co-Chair. TheAdvisory Committee members included: Le Lieu Browne, Marjorie H. Cantor, M.A.,David Chen, M.S.W., Namkee G. Choi, D.S.W., Henry Chung, M.D., Gloria Galura-Siasoco, Ph.D., Kwang Suk Kim, M.S.W., Kiyoka Koizumi, Ph.D., Ji Seon Lee, Ph.D.,Mari Sakaji and Tazuko Shibusawa, Ph.D. The members deserve special appreciationfor reviewing the project methodology, questionnaire and findings.
Finally, Terrie Raphael, Ph.D., ably edited reports of the study findings and prepared thetext for publication.
The results of the research initiative Asian American Elders in New York City arereported in six chapters:
Chapter 1: OverviewChapter 2: A Demographic and Economic ProfileChapter 3: Physical Health, Mental Health, and Quality of Life Chapter 4: Informal and Formal Social SupportsChapter 5: Traditional Values, Stress and Life SatisfactionChapter 6: Recommendations
On behalf of the project team and the Asian American Federation of New York, it is myhope that the needs identified through the study will lead to initiatives that improveservices and support for Asian American Elders in New York City.
ASIAN AMERICAN ELDERS IN NEW YORK CITY
ASIAN AMERICAN FEDERATION OF NEW YORK 3
1.2 Methodology2
By David Krane, Michele Salomon, and Diana GravitchHarris Interactive, Inc.
IntroductionHarris Interactive, Inc.3 conducted the Asian American Elders in New York City surveyof adults aged 65 and older who belong to one of the following groups: Chinese, Korean,Indian, Filipino, Vietnamese or Japanese on behalf of the Asian American Federationof New York. This survey is based on face-to-face interviews with a regionally repre-sentative sample of 407 adults aged 65 and over who are members of the above notedethnic groups residing in one of the five boroughs of New York City. The survey isintended to explore the health status, financial status and overall well-being and lifeexperience of these groups. Topics covered in this survey include overall health status,quantity and quality of relationships with family, friends and neighbors, immigrationexperiences, mental status, depression and overall life satisfaction.
Survey MethodA total of 407 adults aged 65 and older who identify as Chinese, Korean, Indian,Filipino, Vietnamese or Japanese and reside in New York City were surveyed in theirhomes by an in-person interviewer. Interviews averaged one hour and thirty minutesin length and were conducted between February 2, 2000, and May 31, 2000. Interviewswere conducted in English, Chinese, Korean, Hindi, Tagalog and Vietnamese.
Project Responsibility and Acknowledgements The Harris team responsible for the project management, sampling design, data collec-tion and data processing of the survey included David Krane, Senior Vice President,Michele Salomon, Project Manager, and Diana Gravitch, Research Associate.
Harris Interactive, Inc. is especially grateful to Project Director Angela Shen Ryan, D.S.W.,Hunter College School of Social Work, as well as Co-Principal Investigators Ada Mui,Ph.D., Columbia University School of Social Work and Peter Cross, M.S.W., BrookdaleCenter on Aging of Hunter College. Harris would also like to thank Mr. Cao K. O, M.S.W.,Executive Director of the Asian American Federation of New York for his support, inputand guidance and without whom this project would not have been possible.
Public Release of Survey FindingsAll Harris Interactive, Inc. surveys are designed to comply with the code and standardsof the Council of American Survey Research Organizations (CASRO) and the code ofthe National Council of Public Polls (NCPP). The complete report, original question-naire and more information about project methodology are available from HarrisInteractive, Inc.4
In-Person Survey MethodologyThis methodology describes the sampling and interviewing procedures used by HarrisInteractive, Inc. in interviewing adults of Asian origin, aged 65 and older residing inNew York City. The survey was conducted by means of an in-person interview to a totalof 407 adults aged 65 and older who identify themselves as being a member of one ofthe following groups: Chinese, Korean, Indian, Filipino, Vietnamese, or Japanese.Interviewing took place between February 2 and May 31, 2000.
ASIAN AMERICAN ELDERS IN NEW YORK CITY
ASIAN AMERICAN FEDERATION OF NEW YORK 4
2 (c) Harris Interactive, Inc.
3 Harris Interactive was formerly calledLouis Harris and Associates. The compa-ny’s name was changed in December1999.
4 Harris Interactive, Inc. is located at 111Fifth Avenue, New York, NY 10003.
Using the 1990 U.S. Census list of over 5,785 block groups in the five boroughs of NewYork City (Brooklyn, Bronx, Manhattan, Queens and Staten Island), Census blockgroups were ranked according to the percentage of Asian households. A cut-off wasmade at the Census block group that represents 70% of all Asians 65 and older. A ran-dom selection of block groups was then made based on the Asian population aged 65and older within each block group. The sample consisted of 60 block groups of primarysample units (P.S.U.s) in the cross-section.
The study utilized an area probability sample. Area probabilities are designed to giveeach eligible population member or household in the area a known chance of beinginterviewed. The final stage in this type of sample was to list systematically all or a por-tion of the housing units in the special block or area. This usually is performed by theinterviewer in the field at the time of the survey. Using a map and specifically designedlisting sheets, the interviewer goes to a randomly designated point in the area and beginsto list housing units. These listed households then become the interviewer’s assignment.
For each of the 60 selected maps in this study, 100 to 150 households were listed andbecame the interviewer’s sample for interviewing. In this type of sample, many call-backs may be required to complete all of the assigned interviews. For this project, inter-viewers were required to contact a selected household up to four times to determine eli-gibility and up to four attempts to procure an interview.
Some area probability samples, such as the current study’s sample, may require con-ducting a short screening interview to determine whether or not the household quali-fies for the survey. In the current survey, a qualifying household has an adult age 65 orolder residing in New York City who belongs to one of the following groups: Chinese,Korean, Filipino, Indian, Vietnamese or Japanese. Interviews are then completed onlyat those households found eligible for the survey. For households that are not eligible,interviews record the reason. In this instance, ineligible households will either have amember aged 65 and older who is not a member of one of the eligible groups in the sur-vey or residents will be a member of one of the ethnic groups included but may not beof sufficient age.
One respondent per household was interviewed. If more than one eligible respondentlived in the household, then the person who had most recently celebrated a birthday wasselected as the respondent.
Survey SampleAlthough the ideal method would have been to set targets in accordance with eachgroup’s representation in the population, obtaining this information proved difficult. Inlieu of such exactness, targets for each group were set taking into account each group’sestimated representation in the population as well as a desire to obtain data on all thesegroups. It is acknowledged that the Vietnamese and Japanese groups are small and,therefore, these findings are more useful qualitatively than quantitatively. The follow-ing table displays the targets set for each group as well as the actual number of inter-views achieved in each group.
ASIAN AMERICAN ELDERS IN NEW YORK CITY
ASIAN AMERICAN FEDERATION OF NEW YORK 5
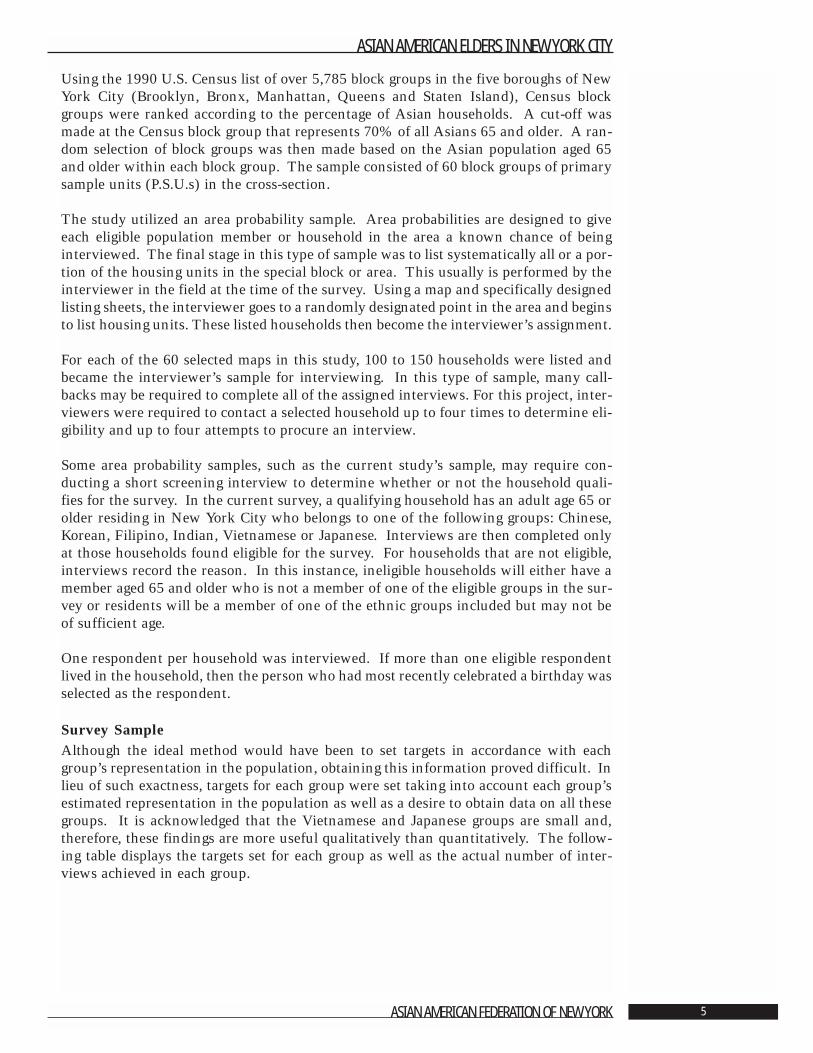
Table 1.1: Planned and Completed Interviews by Ethnic Group
In order to increase cooperation rates, be inclusive and accommodate the needs of thispopulation, interviews were conducted in English, Chinese (Mandarin and Cantonese),Hindi, Tagalog and Vietnamese. No Japanese translation was prepared, and thus allJapanese respondents were interviewed in English. The translations were carried outby staff at the Asian American Foundation of New York.
Overall, 30% of the interviews were conducted in English and 70% in one of the otherlanguages. A more specific breakdown is presented in the following table:
Table 1.2: Completed Interviews by Language
Interviewer Recruitment In order to meet the specific language requirements of this project, Harris needed tobroaden the scope of its typical interviewer recruitment efforts. Our normal means ofrecruiting in-person interviewers includes hiring interviewers who had previouslyworked on in-person projects or by receiving a direct referral from such experiencedinterviewers. These methods proved insufficient to meet the particular staffing needsof this project. Thus, we utilized not only general media outlets such as The New YorkTimes but also targeted media outlets to the various ethnic groups. These sources pro-vided the base from which we began interviewing. Subsequently, we employed a refer-ral method and thus were able to have sufficient numbers of interviewers in all lan-guages required. We also followed up on referrals provided to us by Dr. Ryan and thestaff at the Asian American Federation of New York.
ASIAN AMERICAN ELDERS IN NEW YORK CITY
ASIAN AMERICAN FEDERATION OF NEW YORK 6
Ethnic Group Pre-set TargetActual Surveys Achieved
Chinese 100 105Korean 100 100Indian 100 100
Filipino 50 52Vietnamese 25 25
Japanese 25 25Total 400 407
Language survey was conducted in: No. of interviews
English 123
Chinese 91Hindi 55
Korean 96Tagalog 14
Vietnamese 25English and Chinese 1Chinese and Korean 2
Total 407

All potential candidates were interviewed, screened and hired based on their qualifica-tions. Some had previous related experience that made them good candidates for thisproject.
Interviewer TrainingInterviewers were provided with a two-day training session before starting fieldwork.They also received an interviewing manual and a set of question-by-question instruc-tions that could be used as aids during the interviewing process. The first day of thetraining session covered general research, interviewing and sampling procedures.Interviewing topics covered included:
• The role of the interviewer with regard to respondent motivation• Importance of communicating to and maintaining the respondent’s confidentiality• Importance of the interviewer to maintain a neutral stance• How to prevent refusals• An explanation of the different types of questions in the questionnaire
Among the sampling related issues covered were:
• Methods of locating respondents• How to list households in a selected PSU• The correct procedures for recording attempt information on the listing sheet• The importance of varying the time of day and days of the week that they attempted
to conduct interviews• The number of attempts that should be made at each household for screening and
interviewing purposes• Methods for handling building access issues and/or general community conditions.
Finally, general administrative matters such as payroll, quality control and communica-tion with Harris staff on a regular basis to report progress, problems and concerns werereviewed.
The second day of training was designed to emphasize and reinforce the learning fromday one utilizing the actual questionnaire instrument. Role-playing was used to demon-strate techniques for probing, non-biasing, effective introductions and refusal conver-sion and prevention.
In addition to the research, interviewing and sampling issues, Harris was fortunate tohave Dr. Ryan, Mr. Peter Cross and Mr. Cao O attend at least some of the initial train-ing sessions and/or the initial debriefing. Their input was helpful particularly in dis-cussing some cultural differences among these groups that the interviewers mightencounter. Further, they explained the importance of the project, the aims of theresearch and provided encouragement to the interviewers in this endeavor.
Respondent CooperationInterviewers also were provided with two letters designed to elicit cooperation fromrespondents and, where necessary, building owners and managers. These letters statedthe purpose of the study, the study sponsor and the importance of participation. Theletters directed toward the respondents were written in English, Chinese, Korean,Hindi, Vietnamese and Tagalog. Respondents were provided with an internationalphone card worth $10.00 as thanks for their participation in the survey. While thephone card worked fairly well as an incentive and is easy to administer, there is some
ASIAN AMERICAN ELDERS IN NEW YORK CITY
ASIAN AMERICAN FEDERATION OF NEW YORK 7
indication that there may have been a language barrier since the directions to place acall after dialing the 800-telephone number were available in only Spanish and English.
After approximately two weeks in the field during which time interviewers primarilywere listing and screening households, a debriefing was held to discuss any potentialissues and to further assist interviewers with various aspects of interviewing. Thebiggest challenge, by far, was gaining entry to large apartment buildings with securityand restricted access. Ideas were brainstormed including gaining cooperation from thebuilding management at either the local level (the building superintendent, for example)or the central location of the management company. When necessary, Harris staff pro-vided follow-up to elicit such cooperation. Use of the drop-off letters was encouraged,and it was at this meeting that the idea of the letter for building owners and managerswas conceived.
Interviewer FeedbackA debriefing meeting was held on October 13, 2000, with a group of interviewers tounderstand their experiences in the field during the interviewing process. In general,the interviewers said they had positive experiences interacting with the respondentsand carrying out the objectives of the research. Interviewers found that engaging therespondent in general conversation before beginning the formal interview was helpfulin gaining cooperation by making the respondent feel more comfortable. Several inter-viewers also felt that the timing of the interviews, which coincided with the Census datacollection effort, was both an advantage and a disadvantage. Some respondents werefamiliar with being interviewed for a fairly substantial length of time so consenting toanother interview was not problematic. Others, having already participated in theCensus interviews, were unclear as to how the interview for this study differed.Interviewers stated that in these cases, they took extra time to explain this particularstudy in greater detail to help the respondent distinguish between the interviews.
Overall, interviewers felt that respondents were willing to answer the survey questions.However, the topics of immigration and income proved to be sensitive, and respondentsquestioned the importance of these items. One interviewer felt that respondents werehesitant to answer these questions because they were concerned about losing certainbenefits. Again in this case, the interviewer took additional time to explain the impor-tance of the questions and that answers were confidential and could not be linked toprovision of services. In general, interviewers observed that respondents were morewilling to talk when other people, such as their children, were not present at the inter-view. If respondents wished to have other people present during the interview, inter-viewers were encouraged during the training to allow this. Harris guidelines, however,also recommend that if the presence of others would distract the respondent, the inter-viewer may suggest that the interview take place without others present.
Interviewers also made suggestions about how to prepare interviewers if there arefuture waves of this study. One idea was to allow interviewers to work in pairs.Another recommendation was to continually emphasize that taking the time to explainthe study clearly to the respondent, discussing why participation is important for therespondent, showing identification badges and dressing professionally will help elicitcooperation. An additional suggestion was to network within the list of respondents.Some interviewers found it helpful in locating potential respondents by asking subjectsif they were familiar with any of the other names or addresses in the listing for a par-ticular area. Another proposition was for interviewers to conduct their interviews at avariety of times based on the respondent’s housing or the type of neighborhood. One
ASIAN AMERICAN ELDERS IN NEW YORK CITY
ASIAN AMERICAN FEDERATION OF NEW YORK 8
interviewer found that gaining access and interviewing respondents who lived in anapartment building was easier during the day, while the evening was better for respon-dents in single family housing.
During the debriefing meeting, interviewers provided helpful insight into how theyapplied the information learned during the training session, the contact they had withrespondents and shared their suggestions about how to improve cooperation.
Cleaning the DataAll interviews were carefully edited and checked for completeness and accuracy.Surveys with significant errors or large proportions of missing data were removed; typ-ically this represents less than 1% of the questionnaires that arrive in-house. However,as with all non-computer assisted interviews, occasional questions are left blank.
Potential Sampling ErrorThe results for sample surveys are subject to sampling error - the potential differencebetween results obtained from the sample and those that would have been obtained hadthe entire population been questioned. The size of the potential sampling error varieswith both the size of the sample and with the percentage giving a particular answer.
Sampling error is only one way in which a survey may vary from the findings thatwould result from interviewing the entire population under study. Survey research issusceptible to human and mechanical errors as well. The most important potentialsources are:
• Non-response (if those who are interviewed differed from those who are not inter-viewed).
• Random or sampling error, which may in theory be substantial, even on large samples.Contrary to the impression given by the typical media caveat, there is no way to cal-culate the maximum possible error for any survey. All we deal with are probabilities.
• Question wording, particularly where the survey is measuring attitude or futureintention and not a “fact.” Several equally good questions may yield different (andequally valid) responses. In addition, question sequence can influence responses, par-ticularly to attitude questions.
The results of any survey, therefore, are susceptible to a variety of errors, some of whichcannot be quantified. However, the procedures used by the Harris firm keep these typesof errors to a minimum.
Response RateIn addition to potential error or biases in any research, the response rate is also importantto evaluate. The response rate, or the rate at which people were willing to participate inthe survey, is a result of how willing people are to participate as well as how much effortwas employed by the interviewers in attempting to locate and track down respondents,prevent and convert refusals and screen all households within the assigned sampling unit.As previously stated, for this project, up to four attempts were made to determine house-hold eligibility and up to four more attempts were made to conduct an interview.Additionally, refusal conversion was attempted at all households that initially refused.
The following table lists the outcomes from each household contacted as well as twopossible ways a response rate may be calculated. There are a number of other formulas
ASIAN AMERICAN ELDERS IN NEW YORK CITY
ASIAN AMERICAN FEDERATION OF NEW YORK 9
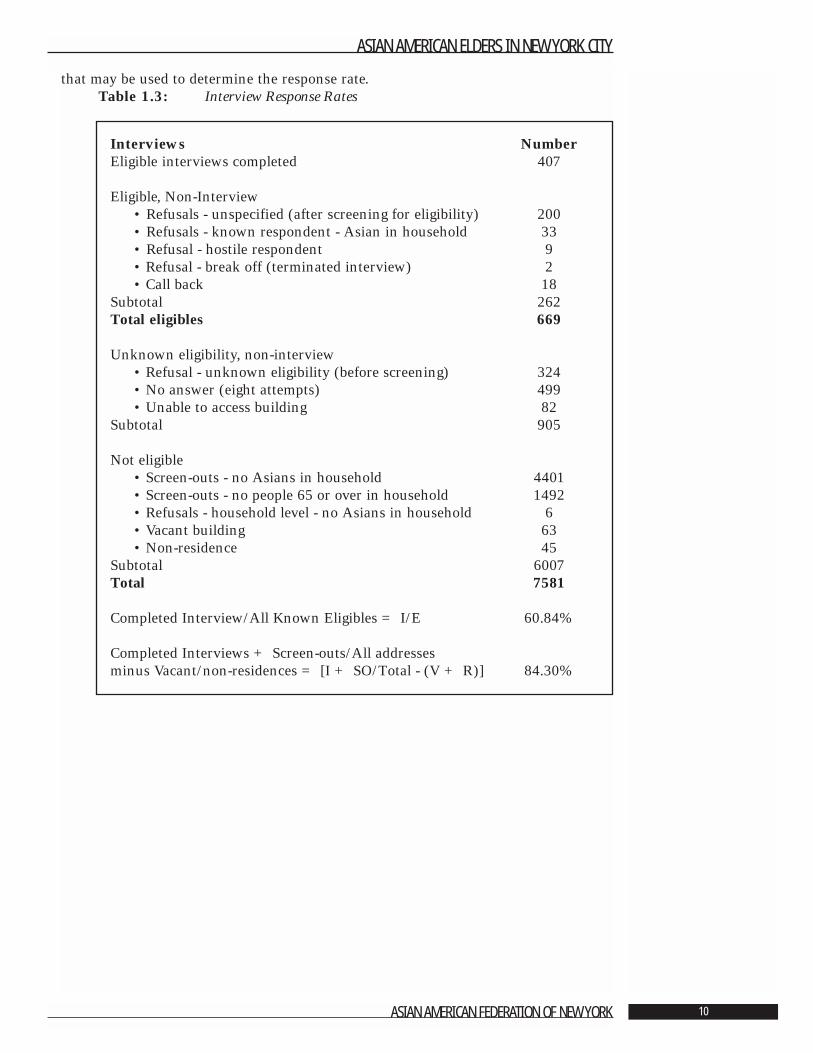
that may be used to determine the response rate.Table 1.3: Interview Response Rates
ASIAN AMERICAN ELDERS IN NEW YORK CITY
ASIAN AMERICAN FEDERATION OF NEW YORK 10
Interviews NumberEligible interviews completed 407
Eligible, Non-Interview• Refusals - unspecified (after screening for eligibility) 200• Refusals - known respondent - Asian in household 33• Refusal - hostile respondent 9• Refusal - break off (terminated interview) 2• Call back 18
Subtotal 262Total eligibles 669
Unknown eligibility, non-interview• Refusal - unknown eligibility (before screening) 324• No answer (eight attempts) 499• Unable to access building 82
Subtotal 905
Not eligible• Screen-outs - no Asians in household 4401• Screen-outs - no people 65 or over in household 1492• Refusals - household level - no Asians in household 6• Vacant building 63• Non-residence 45
Subtotal 6007Total 7581
Completed Interview/All Known Eligibles = I/E 60.84%
Completed Interviews + Screen-outs/All addresses minus Vacant/non-residences = [I + SO/Total - (V + R)] 84.30%
Literature Cited
1. Census Information Center. Asian American Federation of New York, 2001.
2. Scott, J. “In Population Ranks, Ascent of Asians.” New York Times, July 11, 2001.Section B1.
3. Dumpson, J., Dobrof, R. Cantor, M. Gurland, B. Berkman, C. and Brenner, M.“Growing Older in New York City in the 1990s.” New York: New York Center on Agingof the New York Community Trust, 1993.
4. LaViest, T.A. “Data Sources for Aging Research on Racial and Ethnic Groups.” TheGerontologist, 1995. 35:328-339.
5. Boult, C. and Boult, L. “Under Use of Physician Services by Older Asian Americans.”Journal of the American Geriatric Society, 1995. 43:408-411.
6. Sandhu, D. “Psychocultural Profiles of Asian and Pacific Islander Americans:Implications for Counseling and Psychotherapy.” Journal of Multicultural Counselingand Development, 1997. 25:7-23.
ASIAN AMERICAN ELDERS IN NEW YORK CITY
ASIAN AMERICAN FEDERATION OF NEW YORK 11
Chapter 2: A Demographic
and Economic ProfilePeter S. Cross, M.S.W.
Significant Findings• The average age of the people in the project sample is 72.4 years. The Chinese (75.1),
Filipinos (73.2) and Koreans (72.3) are somewhat older than the Japanese (70.9),Indians (70.3) and Vietnamese (68.8).
• The population of Asian American elders is 56% female. The Vietnamese (36%) andIndian (38%) groups have disproportionately low percentages of females, while theKoreans (74%) and Filipinos (67%) have high proportions of females.
• Fifty per cent (50%) of the elders are married, 42% widowed, 4% are divorced, andonly 3% never married.
• The majority (56%) of people surveyed live in rented apartments, including 31% whoreside in walk-up apartment buildings.
• Nineteen per cent (19%) of Asian American elders live alone. Except for Indian (3%)and Filipino (4%) elders, between one-quarter and one-third of elders live alone. Themajority (51%) live in households with three or more individuals.
• The median household income is $6,000 - $8,500. Indian and Japanese elders are rel-atively advantaged economically in comparison to other elderly Asians. Filipinos andChinese are less well-off: rents are lower, household income is lower, and over one-quarter of each is eligible for Supplemental Social Security Insurance (SSI) which is ameans-tested program. Korean and Vietnamese elders are most disadvantaged eco-nomically, with over three-quarters receiving SSI.
• Thirty-nine per cent (39%) of the people surveyed did not graduate from high school,44% completed high school and 17% had at least some years of college. The groupsvary sharply in level of education. The Japanese, Filipinos and Indians are markedlymore educated than the others.
• Religion is very important in the lives of Asian American elders. Nearly 84% of thesample reported an affiliation with organized religion. Twenty-two per cent (22%)
ASIAN AMERICAN ELDERS IN NEW YORK CITY
ASIAN AMERICAN FEDERATION OF NEW YORK 12
are Catholic, 21% Buddhist, 17% Hindu, 16% Protestant, and 5% Muslim. Only 15%identify with no religious community.
• Nearly all the Asian American elders in the study were born in Asia.
• Forty-four per cent (44%) of the survey respondents are citizens, and 46% are per-manent residents. Only 10% identify themselves as visitors or were unwilling to pro-vide information.
• Nearly 100% of the people in the study are immigrants who came to the United Statesin middle and late-middle age. Immigration occurs primarily to join family members.
• Less than one-quarter describe themselves as speaking English well. Only one-tenthsometimes speaks English at home with family and friends. About one-quarter live inhouseholds in which no member speaks English well.
ASIAN AMERICAN ELDERS IN NEW YORK CITY
ASIAN AMERICAN FEDERATION OF NEW YORK 13
IntroductionThis chapter describes the demographic and economic characteristics of AsianAmerican elders in New York City based on a survey of older Chinese, Filipino, Indian,Japanese, Korean, and Vietnamese New Yorkers. Information is presented about eth-nicity, nationality, natality, age, gender, marital status, ability to speak English, level ofeducation, religious affiliation, age at immigration and immigration experience, livingarrangements, economic well-being, and work history. The findings are intended toassist the immediate and long-range planning of services to Asian American elders andcontribute to a general understanding of the older adult population in New York Cityand other communities.
The information is covered in the following four sections:
Section 1 Demographic and Background CharacteristicsSection 2 Living ArrangementsSection 3 Economic Well-BeingSection 4 Work History and Occupation
2.1 Demographic and Background CharacteristicsThe major demographic characteristics of the study participants are described in thischapter. Comparisons are drawn among the six groups of Asian American New Yorkersand also between older Asian American New Yorkers and New Yorkers in general. Itis well to recall that the study (see Chapter 1) is based on a sample of Asian AmericanNew Yorkers living in districts of the city most densely populated by Asian Americans.Sample size was designed to include a predetermined number of individuals from eachof the six Asian groups. As a result, some groups are over represented in contrast totheir likely true representation in the whole population, while others are under repre-sented. In comparing the Asian Americans to the New York City elderly population atlarge we draw especially on the study Growing Older in New York City in the 1990s [1],in many ways the precursor to this one.
Ethnicity, Nationality, and NatalityFor the purpose of this study, group membership was based on response to one question:“What ethnic or nationality group do you consider yourself to be a member of?” Hadgroupings been based on reported country of birth, the groups would have varied onlyminimally. Only three of the 105 Chinese were born outside China; a single Indian wasborn outside India. Three of the Japanese were born in the United States. Ninety-eightof 100 Koreans were born in Korea. All but one of 25 Vietnamese were born inVietnam. Similarly, had the groups been based on language usually spoken with familyand friends, they would not have differed much.
The size of each group in our sample both absolutely and relative to each other is a sim-ple artifact of the study design. The actual proportions in the New York City elderly Asianpopulation as of Census 2000 are seen in Table 2.1. The sample is slightly more than one-quarter Chinese, while the population of elderly Asian Americans is nearly 65% Chinese.Koreans comprise nearly 10% of the elderly Asian American population but one-quarterof our study sample. One-quarter of our study sample is Indian, while the population ofelderly Asian Americans is nearly 12% Indian. Filipinos constitute about 7% of the eld-erly Asian American population and they are 13% of the study sample. While the sam-ple is about 6% Japanese, the elderly Asian American population is about 2%.Vietnamese, who are about 1% in Census 2000, represent 6% of the study sample.
ASIAN AMERICAN ELDERS IN NEW YORK CITY
ASIAN AMERICAN FEDERATION OF NEW YORK 14
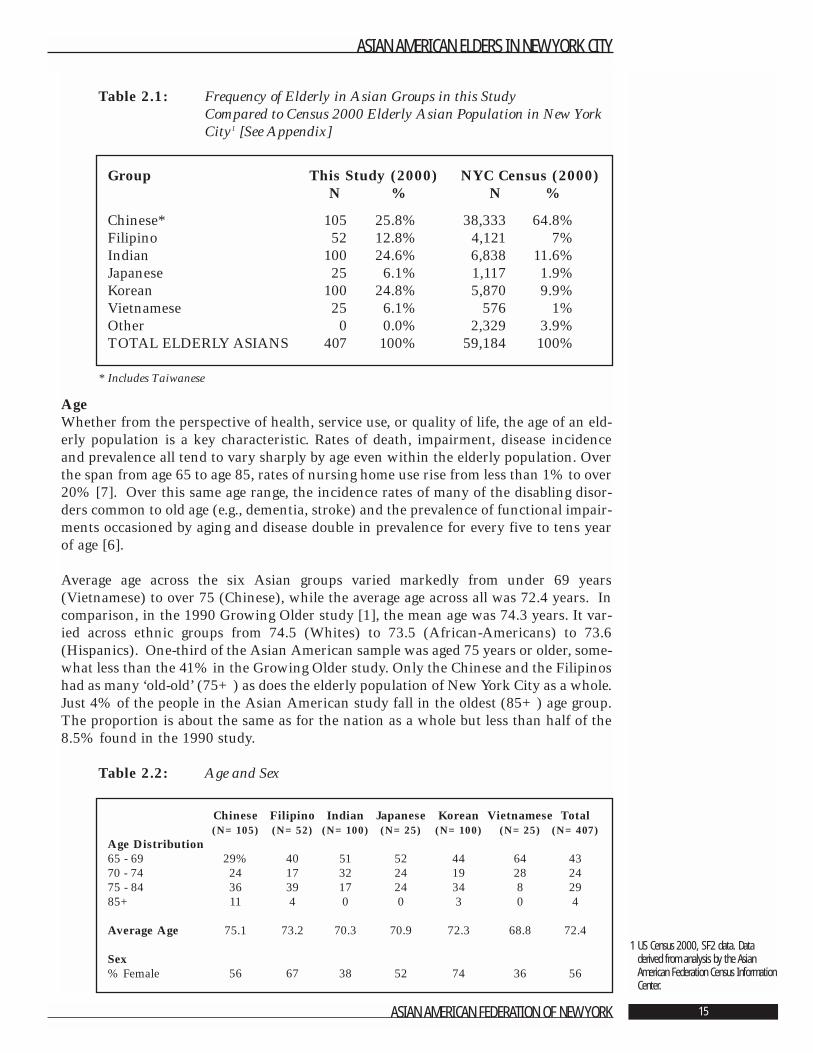
Table 2.1: Frequency of Elderly in Asian Groups in this Study Compared to Census 2000 Elderly Asian Population in New YorkCity1 [See Appendix]
* Includes Taiwanese
Age Whether from the perspective of health, service use, or quality of life, the age of an eld-erly population is a key characteristic. Rates of death, impairment, disease incidenceand prevalence all tend to vary sharply by age even within the elderly population. Overthe span from age 65 to age 85, rates of nursing home use rise from less than 1% to over20% [7]. Over this same age range, the incidence rates of many of the disabling disor-ders common to old age (e.g., dementia, stroke) and the prevalence of functional impair-ments occasioned by aging and disease double in prevalence for every five to tens yearof age [6].
Average age across the six Asian groups varied markedly from under 69 years(Vietnamese) to over 75 (Chinese), while the average age across all was 72.4 years. Incomparison, in the 1990 Growing Older study [1], the mean age was 74.3 years. It var-ied across ethnic groups from 74.5 (Whites) to 73.5 (African-Americans) to 73.6(Hispanics). One-third of the Asian American sample was aged 75 years or older, some-what less than the 41% in the Growing Older study. Only the Chinese and the Filipinoshad as many ‘old-old’ (75+) as does the elderly population of New York City as a whole.Just 4% of the people in the Asian American study fall in the oldest (85+) age group.The proportion is about the same as for the nation as a whole but less than half of the8.5% found in the 1990 study.
Table 2.2: Age and Sex
ASIAN AMERICAN ELDERS IN NEW YORK CITY
ASIAN AMERICAN FEDERATION OF NEW YORK 15
1 US Census 2000, SF2 data. Dataderived from analysis by the AsianAmerican Federation Census InformationCenter.
Group This Study (2000) NYC Census (2000)N % N %
Chinese* 105 25.8% 38,333 64.8%Filipino 52 12.8% 4,121 7%Indian 100 24.6% 6,838 11.6%Japanese 25 6.1% 1,117 1.9%Korean 100 24.8% 5,870 9.9%Vietnamese 25 6.1% 576 1%Other 0 0.0% 2,329 3.9%TOTAL ELDERLY ASIANS 407 100% 59,184 100%
Chinese Filipino Indian Japanese Korean Vietnamese Total(N=105) (N=52) (N=100) (N=25) (N=100) (N=25) (N=407)
Age Distribution65 - 69 29% 40 51 52 44 64 4370 - 74 24 17 32 24 19 28 2475 - 84 36 39 17 24 34 8 2985+ 11 4 0 0 3 0 4
Average Age 75.1 73.2 70.3 70.9 72.3 68.8 72.4
Sex% Female 56 67 38 52 74 36 56
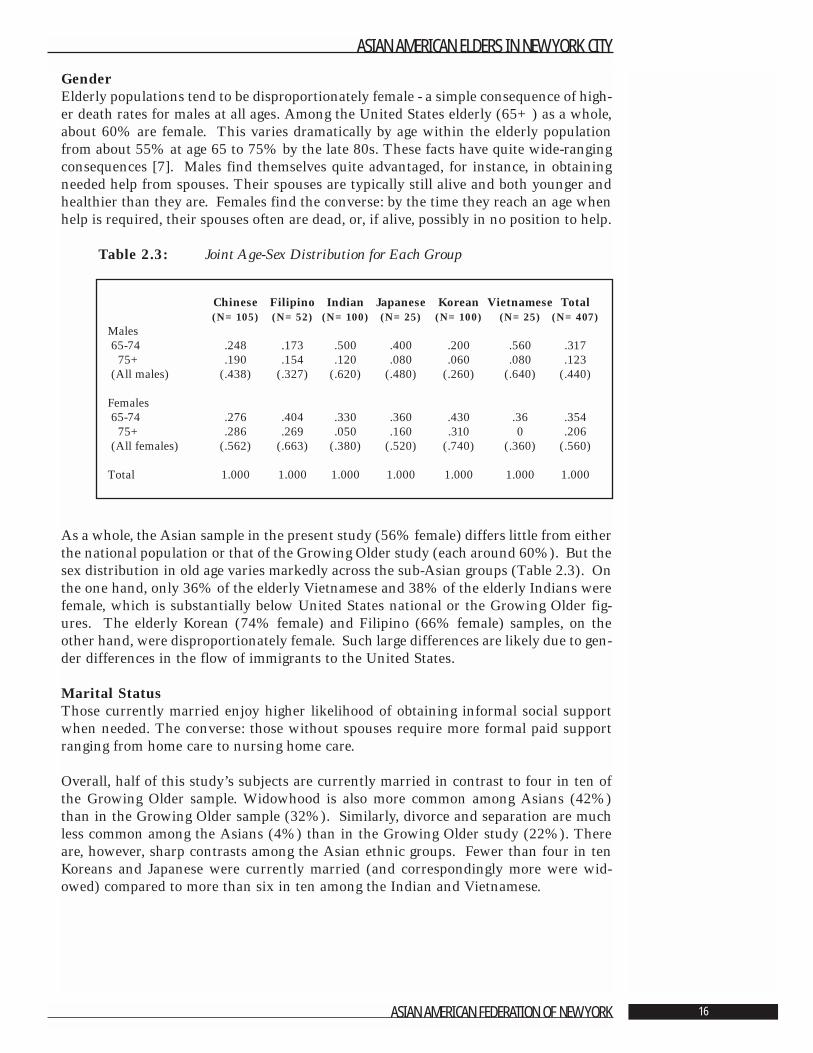
GenderElderly populations tend to be disproportionately female - a simple consequence of high-er death rates for males at all ages. Among the United States elderly (65+) as a whole,about 60% are female. This varies dramatically by age within the elderly populationfrom about 55% at age 65 to 75% by the late 80s. These facts have quite wide-rangingconsequences [7]. Males find themselves quite advantaged, for instance, in obtainingneeded help from spouses. Their spouses are typically still alive and both younger andhealthier than they are. Females find the converse: by the time they reach an age whenhelp is required, their spouses often are dead, or, if alive, possibly in no position to help.
Table 2.3: Joint Age-Sex Distribution for Each Group
As a whole, the Asian sample in the present study (56% female) differs little from eitherthe national population or that of the Growing Older study (each around 60%). But thesex distribution in old age varies markedly across the sub-Asian groups (Table 2.3). Onthe one hand, only 36% of the elderly Vietnamese and 38% of the elderly Indians werefemale, which is substantially below United States national or the Growing Older fig-ures. The elderly Korean (74% female) and Filipino (66% female) samples, on theother hand, were disproportionately female. Such large differences are likely due to gen-der differences in the flow of immigrants to the United States.
Marital StatusThose currently married enjoy higher likelihood of obtaining informal social supportwhen needed. The converse: those without spouses require more formal paid supportranging from home care to nursing home care.
Overall, half of this study’s subjects are currently married in contrast to four in ten ofthe Growing Older sample. Widowhood is also more common among Asians (42%)than in the Growing Older sample (32%). Similarly, divorce and separation are muchless common among the Asians (4%) than in the Growing Older study (22%). Thereare, however, sharp contrasts among the Asian ethnic groups. Fewer than four in tenKoreans and Japanese were currently married (and correspondingly more were wid-owed) compared to more than six in ten among the Indian and Vietnamese.
ASIAN AMERICAN ELDERS IN NEW YORK CITY
ASIAN AMERICAN FEDERATION OF NEW YORK 16
Chinese Filipino Indian Japanese Korean Vietnamese Total(N=105) (N=52) (N=100) (N=25) (N=100) (N=25) (N=407)
Males65-74 .248 .173 .500 .400 .200 .560 .317
75+ .190 .154 .120 .080 .060 .080 .123(All males) (.438) (.327) (.620) (.480) (.260) (.640) (.440)
Females65-74 .276 .404 .330 .360 .430 .36 .354
75+ .286 .269 .050 .160 .310 0 .206(All females) (.562) (.663) (.380) (.520) (.740) (.360) (.560)
Total 1.000 1.000 1.000 1.000 1.000 1.000 1.000
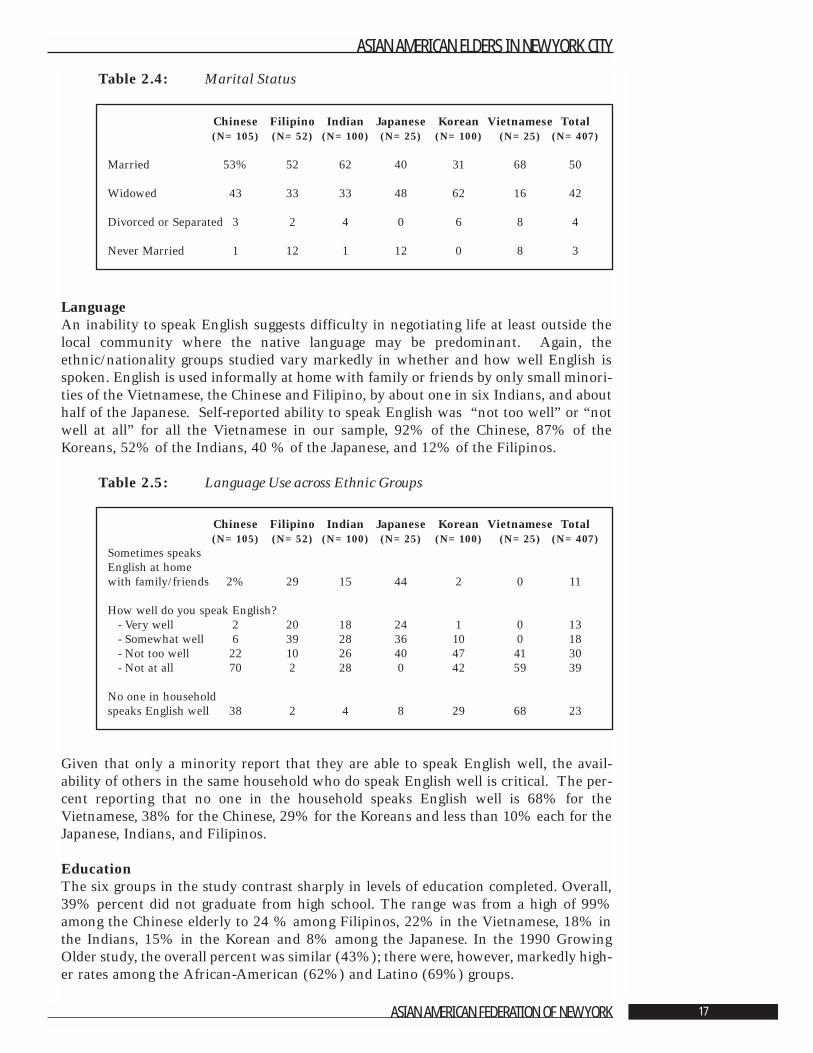
Table 2.4: Marital Status
Language An inability to speak English suggests difficulty in negotiating life at least outside thelocal community where the native language may be predominant. Again, theethnic/nationality groups studied vary markedly in whether and how well English isspoken. English is used informally at home with family or friends by only small minori-ties of the Vietnamese, the Chinese and Filipino, by about one in six Indians, and abouthalf of the Japanese. Self-reported ability to speak English was “not too well” or “notwell at all” for all the Vietnamese in our sample, 92% of the Chinese, 87% of theKoreans, 52% of the Indians, 40 % of the Japanese, and 12% of the Filipinos.
Table 2.5: Language Use across Ethnic Groups
Given that only a minority report that they are able to speak English well, the avail-ability of others in the same household who do speak English well is critical. The per-cent reporting that no one in the household speaks English well is 68% for theVietnamese, 38% for the Chinese, 29% for the Koreans and less than 10% each for theJapanese, Indians, and Filipinos.
EducationThe six groups in the study contrast sharply in levels of education completed. Overall,39% percent did not graduate from high school. The range was from a high of 99%among the Chinese elderly to 24 % among Filipinos, 22% in the Vietnamese, 18% inthe Indians, 15% in the Korean and 8% among the Japanese. In the 1990 GrowingOlder study, the overall percent was similar (43%); there were, however, markedly high-er rates among the African-American (62%) and Latino (69%) groups.
ASIAN AMERICAN ELDERS IN NEW YORK CITY
ASIAN AMERICAN FEDERATION OF NEW YORK 17
Chinese Filipino Indian Japanese Korean Vietnamese Total(N=105) (N=52) (N=100) (N=25) (N=100) (N=25) (N=407)
Married 53% 52 62 40 31 68 50
Widowed 43 33 33 48 62 16 42
Divorced or Separated 3 2 4 0 6 8 4
Never Married 1 12 1 12 0 8 3
Chinese Filipino Indian Japanese Korean Vietnamese Total(N=105) (N=52) (N=100) (N=25) (N=100) (N=25) (N=407)
Sometimes speaks English at home with family/friends 2% 29 15 44 2 0 11
How well do you speak English?- Very well 2 20 18 24 1 0 13- Somewhat well 6 39 28 36 10 0 18- Not too well 22 10 26 40 47 41 30- Not at all 70 2 28 0 42 59 39
No one in household speaks English well 38 2 4 8 29 68 23
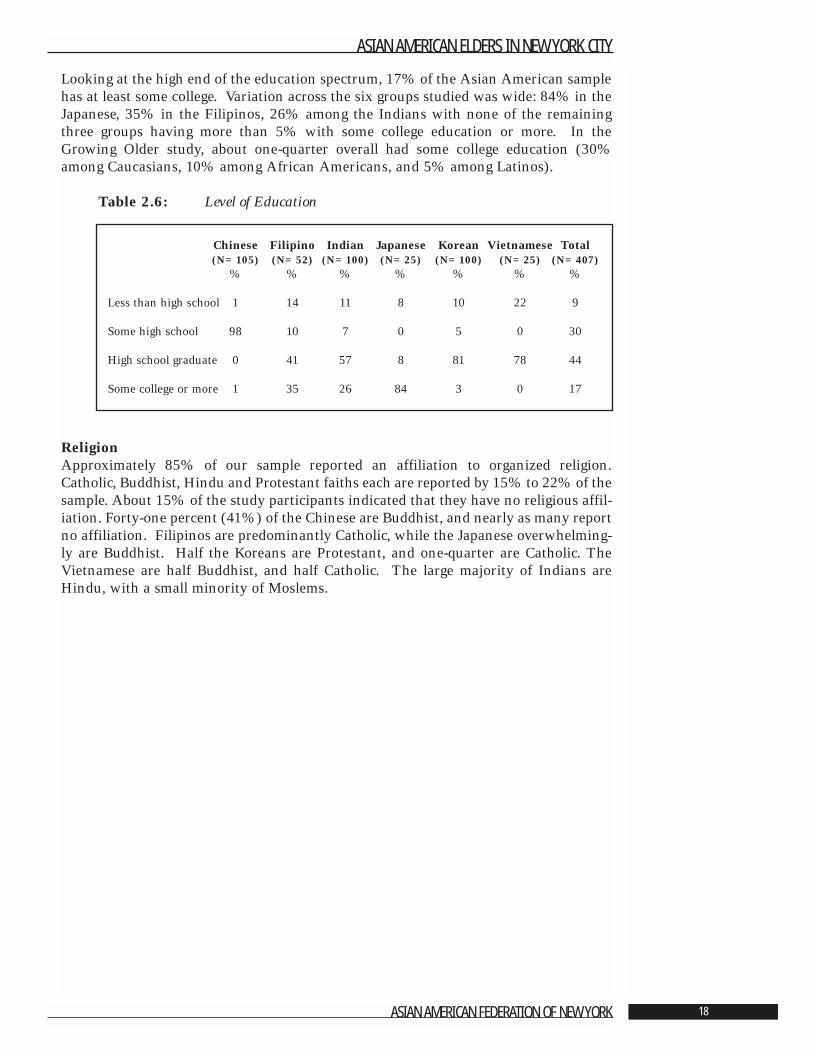
Looking at the high end of the education spectrum, 17% of the Asian American samplehas at least some college. Variation across the six groups studied was wide: 84% in theJapanese, 35% in the Filipinos, 26% among the Indians with none of the remainingthree groups having more than 5% with some college education or more. In theGrowing Older study, about one-quarter overall had some college education (30%among Caucasians, 10% among African Americans, and 5% among Latinos).
Table 2.6: Level of Education
ReligionApproximately 85% of our sample reported an affiliation to organized religion.Catholic, Buddhist, Hindu and Protestant faiths each are reported by 15% to 22% of thesample. About 15% of the study participants indicated that they have no religious affil-iation. Forty-one percent (41%) of the Chinese are Buddhist, and nearly as many reportno affiliation. Filipinos are predominantly Catholic, while the Japanese overwhelming-ly are Buddhist. Half the Koreans are Protestant, and one-quarter are Catholic. TheVietnamese are half Buddhist, and half Catholic. The large majority of Indians areHindu, with a small minority of Moslems.
ASIAN AMERICAN ELDERS IN NEW YORK CITY
ASIAN AMERICAN FEDERATION OF NEW YORK 18
Chinese Filipino Indian Japanese Korean Vietnamese Total(N=105) (N=52) (N=100) (N=25) (N=100) (N=25) (N=407)
% % % % % % %
Less than high school 1 14 11 8 10 22 9
Some high school 98 10 7 0 5 0 30
High school graduate 0 41 57 8 81 78 44
Some college or more 1 35 26 84 3 0 17
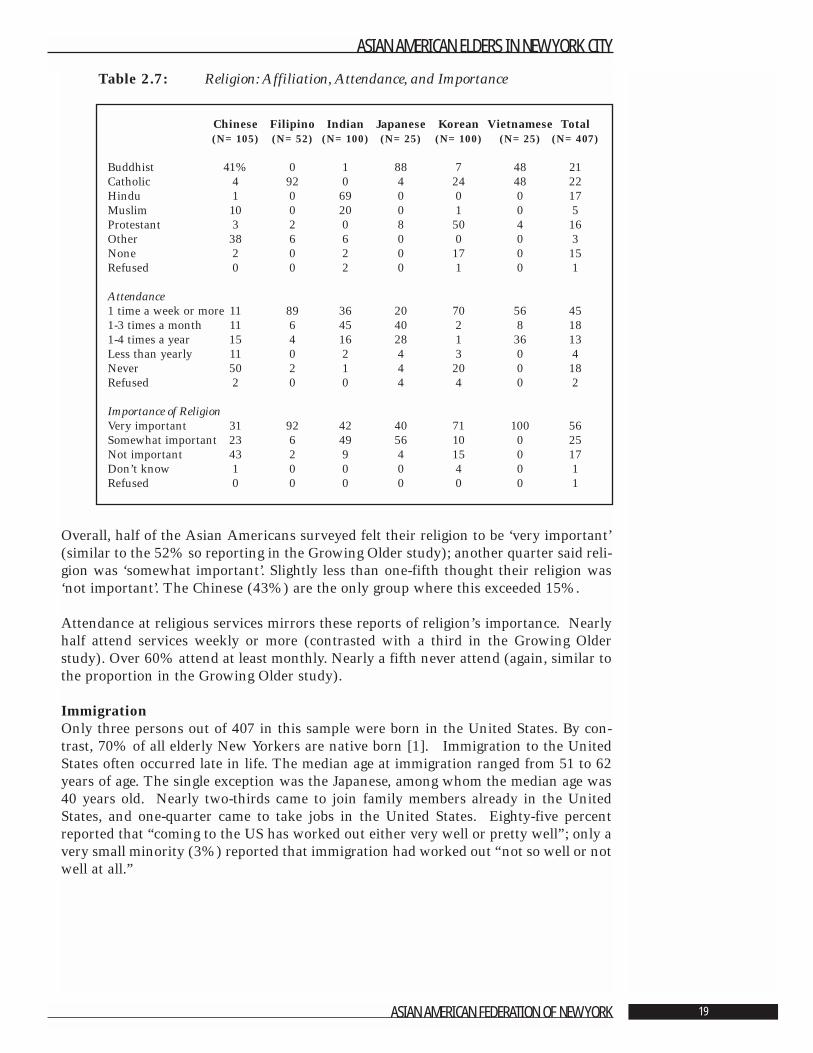
Table 2.7: Religion: Affiliation, Attendance, and Importance
Overall, half of the Asian Americans surveyed felt their religion to be ‘very important’(similar to the 52% so reporting in the Growing Older study); another quarter said reli-gion was ‘somewhat important’. Slightly less than one-fifth thought their religion was‘not important’. The Chinese (43%) are the only group where this exceeded 15%.
Attendance at religious services mirrors these reports of religion’s importance. Nearlyhalf attend services weekly or more (contrasted with a third in the Growing Olderstudy). Over 60% attend at least monthly. Nearly a fifth never attend (again, similar tothe proportion in the Growing Older study).
ImmigrationOnly three persons out of 407 in this sample were born in the United States. By con-trast, 70% of all elderly New Yorkers are native born [1]. Immigration to the UnitedStates often occurred late in life. The median age at immigration ranged from 51 to 62years of age. The single exception was the Japanese, among whom the median age was40 years old. Nearly two-thirds came to join family members already in the UnitedStates, and one-quarter came to take jobs in the United States. Eighty-five percentreported that “coming to the US has worked out either very well or pretty well”; only avery small minority (3%) reported that immigration had worked out “not so well or notwell at all.”
ASIAN AMERICAN ELDERS IN NEW YORK CITY
ASIAN AMERICAN FEDERATION OF NEW YORK 19
Chinese Filipino Indian Japanese Korean Vietnamese Total(N=105) (N=52) (N=100) (N=25) (N=100) (N=25) (N=407)
Buddhist 41% 0 1 88 7 48 21Catholic 4 92 0 4 24 48 22Hindu 1 0 69 0 0 0 17Muslim 10 0 20 0 1 0 5Protestant 3 2 0 8 50 4 16Other 38 6 6 0 0 0 3None 2 0 2 0 17 0 15Refused 0 0 2 0 1 0 1
Attendance1 time a week or more 11 89 36 20 70 56 451-3 times a month 11 6 45 40 2 8 181-4 times a year 15 4 16 28 1 36 13Less than yearly 11 0 2 4 3 0 4Never 50 2 1 4 20 0 18Refused 2 0 0 4 4 0 2
Importance of ReligionVery important 31 92 42 40 71 100 56Somewhat important 23 6 49 56 10 0 25Not important 43 2 9 4 15 0 17Don’t know 1 0 0 0 4 0 1Refused 0 0 0 0 0 0 1
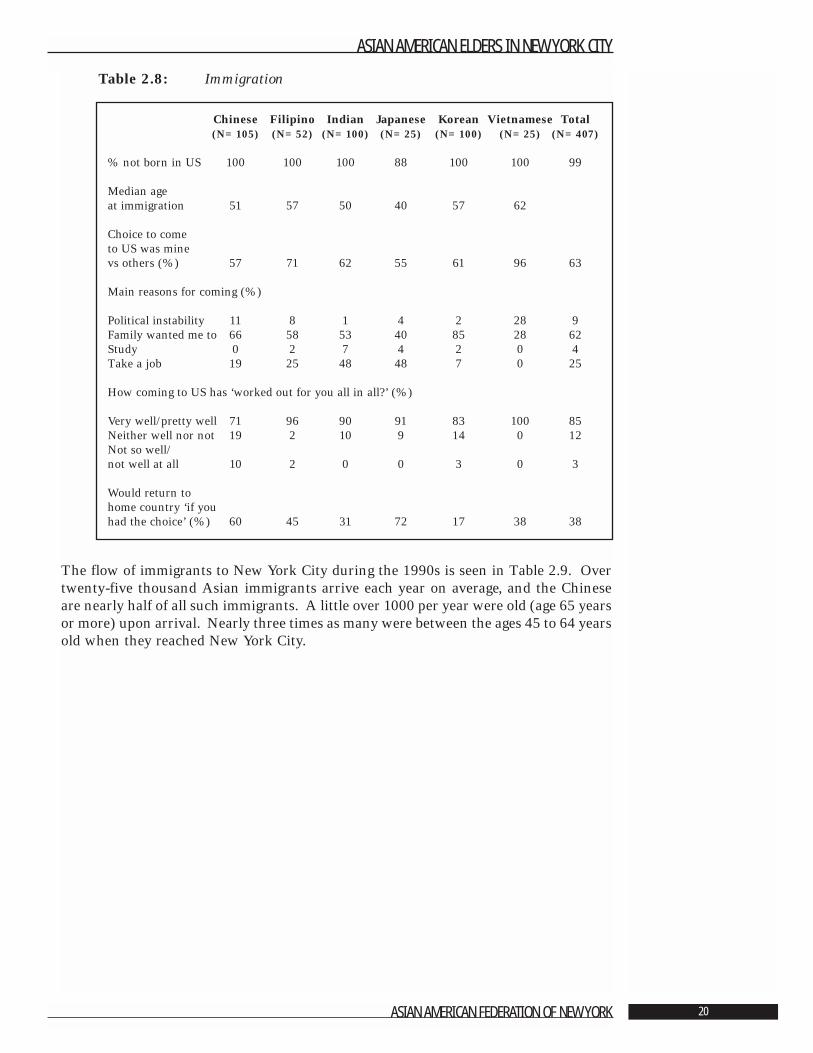
Table 2.8: Immigration
The flow of immigrants to New York City during the 1990s is seen in Table 2.9. Overtwenty-five thousand Asian immigrants arrive each year on average, and the Chineseare nearly half of all such immigrants. A little over 1000 per year were old (age 65 yearsor more) upon arrival. Nearly three times as many were between the ages 45 to 64 yearsold when they reached New York City.
ASIAN AMERICAN ELDERS IN NEW YORK CITY
ASIAN AMERICAN FEDERATION OF NEW YORK 20
Chinese Filipino Indian Japanese Korean Vietnamese Total(N=105) (N=52) (N=100) (N=25) (N=100) (N=25) (N=407)
% not born in US 100 100 100 88 100 100 99
Median age at immigration 51 57 50 40 57 62
Choice to come to US was mine vs others (%) 57 71 62 55 61 96 63
Main reasons for coming (%)
Political instability 11 8 1 4 2 28 9Family wanted me to 66 58 53 40 85 28 62Study 0 2 7 4 2 0 4Take a job 19 25 48 48 7 0 25
How coming to US has ‘worked out for you all in all?’ (%)
Very well/pretty well 71 96 90 91 83 100 85Neither well nor not 19 2 10 9 14 0 12Not so well/not well at all 10 2 0 0 3 0 3
Would return to home country ‘if you had the choice’ (%) 60 45 31 72 17 38 38
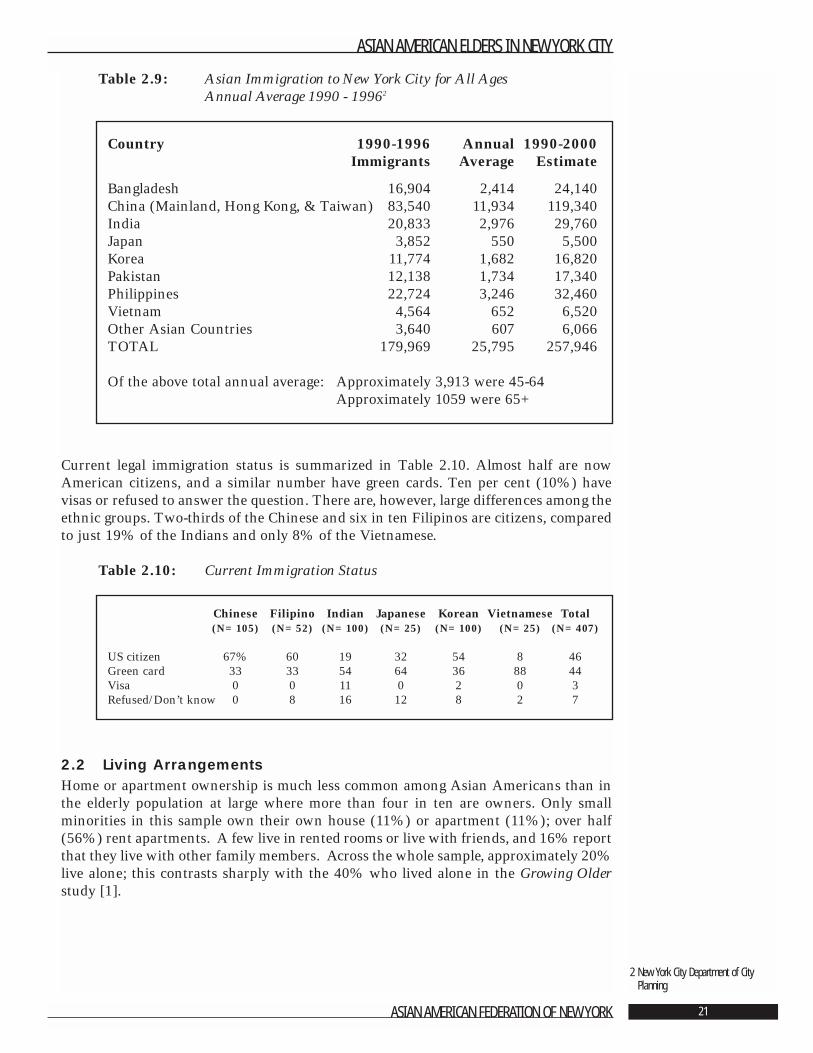
Table 2.9: Asian Immigration to New York City for All AgesAnnual Average 1990 - 19962
Current legal immigration status is summarized in Table 2.10. Almost half are nowAmerican citizens, and a similar number have green cards. Ten per cent (10%) havevisas or refused to answer the question. There are, however, large differences among theethnic groups. Two-thirds of the Chinese and six in ten Filipinos are citizens, comparedto just 19% of the Indians and only 8% of the Vietnamese.
Table 2.10: Current Immigration Status
2.2 Living ArrangementsHome or apartment ownership is much less common among Asian Americans than inthe elderly population at large where more than four in ten are owners. Only smallminorities in this sample own their own house (11%) or apartment (11%); over half(56%) rent apartments. A few live in rented rooms or live with friends, and 16% reportthat they live with other family members. Across the whole sample, approximately 20%live alone; this contrasts sharply with the 40% who lived alone in the Growing Olderstudy [1].
ASIAN AMERICAN ELDERS IN NEW YORK CITY
ASIAN AMERICAN FEDERATION OF NEW YORK 21
2 New York City Department of CityPlanning
Chinese Filipino Indian Japanese Korean Vietnamese Total(N=105) (N=52) (N=100) (N=25) (N=100) (N=25) (N=407)
US citizen 67% 60 19 32 54 8 46Green card 33 33 54 64 36 88 44Visa 0 0 11 0 2 0 3Refused/Don’t know 0 8 16 12 8 2 7
Country 1990-1996 Annual 1990-2000Immigrants Average Estimate
Bangladesh 16,904 2,414 24,140China (Mainland, Hong Kong, & Taiwan) 83,540 11,934 119,340India 20,833 2,976 29,760Japan 3,852 550 5,500Korea 11,774 1,682 16,820Pakistan 12,138 1,734 17,340Philippines 22,724 3,246 32,460Vietnam 4,564 652 6,520Other Asian Countries 3,640 607 6,066TOTAL 179,969 25,795 257,946
Of the above total annual average: Approximately 3,913 were 45-64Approximately 1059 were 65+
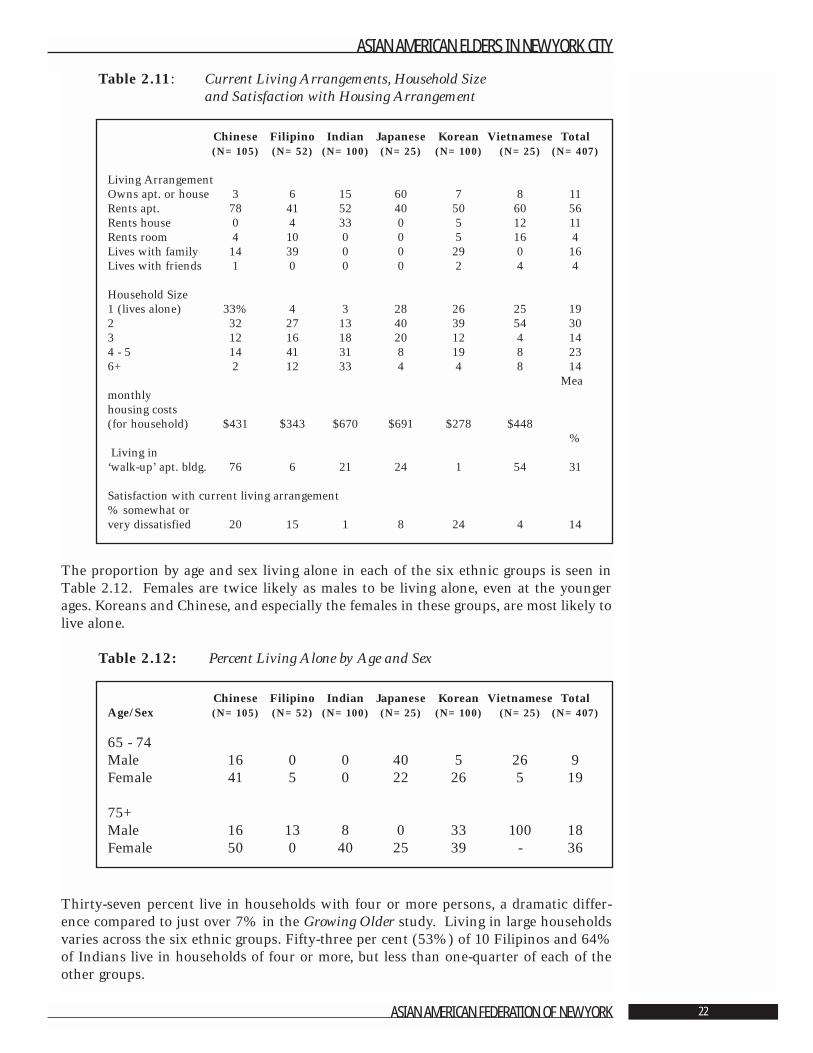
Table 2.11: Current Living Arrangements, Household Sizeand Satisfaction with Housing Arrangement
The proportion by age and sex living alone in each of the six ethnic groups is seen inTable 2.12. Females are twice likely as males to be living alone, even at the youngerages. Koreans and Chinese, and especially the females in these groups, are most likely tolive alone.
Table 2.12: Percent Living Alone by Age and Sex
Thirty-seven percent live in households with four or more persons, a dramatic differ-ence compared to just over 7% in the Growing Older study. Living in large householdsvaries across the six ethnic groups. Fifty-three per cent (53%) of 10 Filipinos and 64%of Indians live in households of four or more, but less than one-quarter of each of theother groups.
ASIAN AMERICAN ELDERS IN NEW YORK CITY
ASIAN AMERICAN FEDERATION OF NEW YORK 22
Chinese Filipino Indian Japanese Korean Vietnamese Total(N=105) (N=52) (N=100) (N=25) (N=100) (N=25) (N=407)
Living ArrangementOwns apt. or house 3 6 15 60 7 8 11Rents apt. 78 41 52 40 50 60 56Rents house 0 4 33 0 5 12 11Rents room 4 10 0 0 5 16 4Lives with family 14 39 0 0 29 0 16Lives with friends 1 0 0 0 2 4 4
Household Size1 (lives alone) 33% 4 3 28 26 25 192 32 27 13 40 39 54 303 12 16 18 20 12 4 144 - 5 14 41 31 8 19 8 236+ 2 12 33 4 4 8 14
Meamonthly housing costs (for household) $431 $343 $670 $691 $278 $448
%Living in
‘walk-up’ apt. bldg. 76 6 21 24 1 54 31
Satisfaction with current living arrangement% somewhat or very dissatisfied 20 15 1 8 24 4 14
Chinese Filipino Indian Japanese Korean Vietnamese TotalAge/Sex (N=105) (N=52) (N=100) (N=25) (N=100) (N=25) (N=407)
65 - 74Male 16 0 0 40 5 26 9Female 41 5 0 22 26 5 19
75+Male 16 13 8 0 33 100 18Female 50 0 40 25 39 - 36
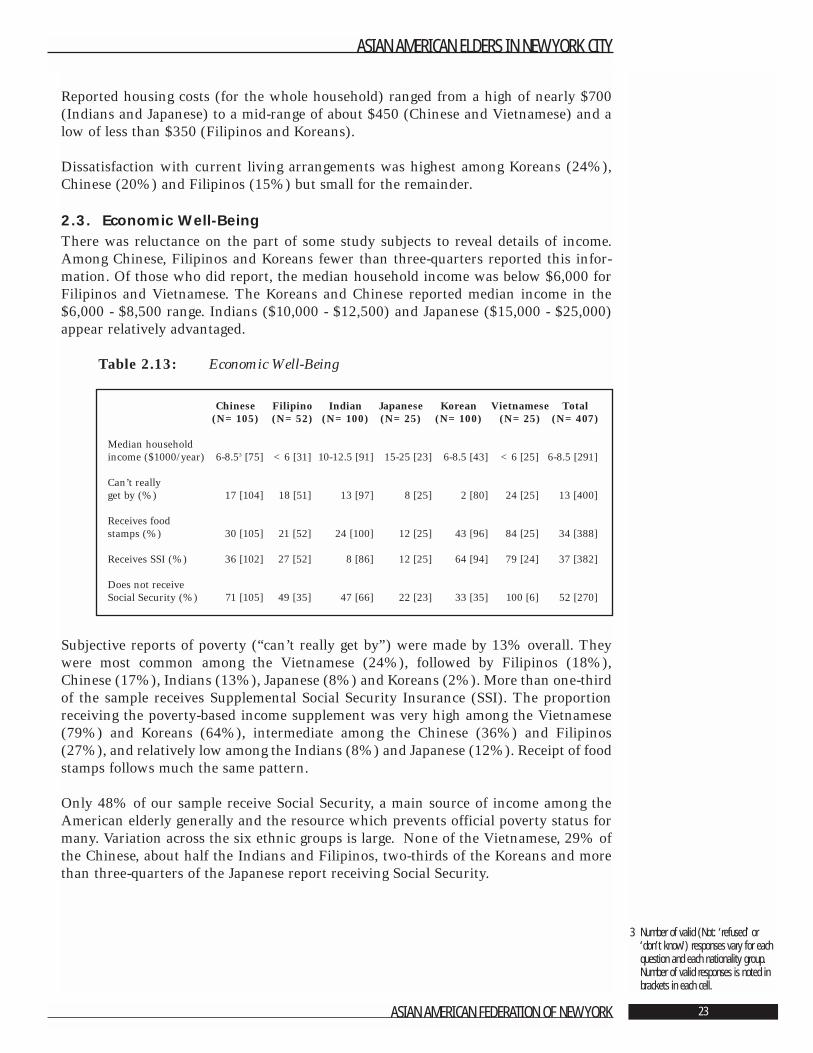
Reported housing costs (for the whole household) ranged from a high of nearly $700(Indians and Japanese) to a mid-range of about $450 (Chinese and Vietnamese) and alow of less than $350 (Filipinos and Koreans).
Dissatisfaction with current living arrangements was highest among Koreans (24%),Chinese (20%) and Filipinos (15%) but small for the remainder.
2.3. Economic Well-BeingThere was reluctance on the part of some study subjects to reveal details of income.Among Chinese, Filipinos and Koreans fewer than three-quarters reported this infor-mation. Of those who did report, the median household income was below $6,000 forFilipinos and Vietnamese. The Koreans and Chinese reported median income in the$6,000 - $8,500 range. Indians ($10,000 - $12,500) and Japanese ($15,000 - $25,000)appear relatively advantaged.
Table 2.13: Economic Well-Being
Subjective reports of poverty (“can’t really get by”) were made by 13% overall. Theywere most common among the Vietnamese (24%), followed by Filipinos (18%),Chinese (17%), Indians (13%), Japanese (8%) and Koreans (2%). More than one-thirdof the sample receives Supplemental Social Security Insurance (SSI). The proportionreceiving the poverty-based income supplement was very high among the Vietnamese(79%) and Koreans (64%), intermediate among the Chinese (36%) and Filipinos(27%), and relatively low among the Indians (8%) and Japanese (12%). Receipt of foodstamps follows much the same pattern.
Only 48% of our sample receive Social Security, a main source of income among theAmerican elderly generally and the resource which prevents official poverty status formany. Variation across the six ethnic groups is large. None of the Vietnamese, 29% ofthe Chinese, about half the Indians and Filipinos, two-thirds of the Koreans and morethan three-quarters of the Japanese report receiving Social Security.
ASIAN AMERICAN ELDERS IN NEW YORK CITY
ASIAN AMERICAN FEDERATION OF NEW YORK 23
3 Number of valid (Not: ‘refused’ or‘don’t know’) responses vary for eachquestion and each nationality group.Number of valid responses is noted inbrackets in each cell.
Chinese Filipino Indian Japanese Korean Vietnamese Total(N=105) (N=52) (N=100) (N=25) (N=100) (N=25) (N=407)
Median household income ($1000/year) 6-8.53 [75] <6 [31] 10-12.5 [91] 15-25 [23] 6-8.5 [43] <6 [25] 6-8.5 [291]
Can’t really get by (%) 17 [104] 18 [51] 13 [97] 8 [25] 2 [80] 24 [25] 13 [400]
Receives food stamps (%) 30 [105] 21 [52] 24 [100] 12 [25] 43 [96] 84 [25] 34 [388]
Receives SSI (%) 36 [102] 27 [52] 8 [86] 12 [25] 64 [94] 79 [24] 37 [382]
Does not receive Social Security (%) 71 [105] 49 [35] 47 [66] 22 [23] 33 [35] 100 [6] 52 [270]
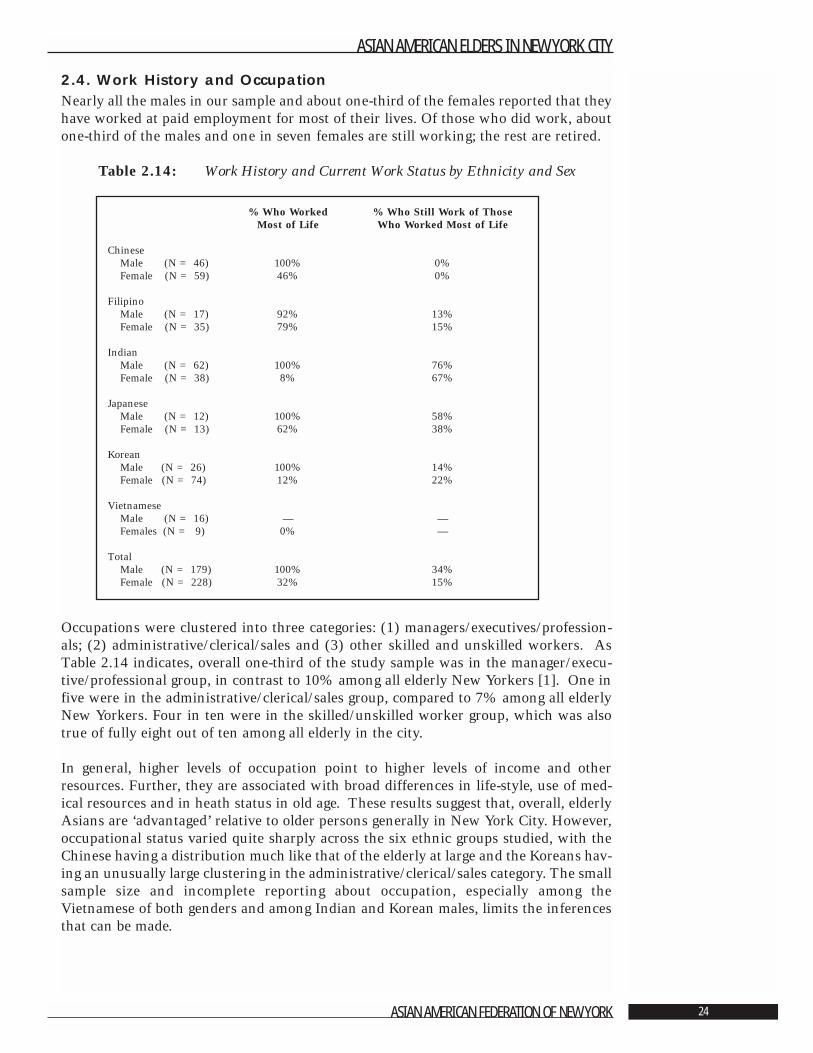
2.4. Work History and OccupationNearly all the males in our sample and about one-third of the females reported that theyhave worked at paid employment for most of their lives. Of those who did work, aboutone-third of the males and one in seven females are still working; the rest are retired.
Table 2.14: Work History and Current Work Status by Ethnicity and Sex
Occupations were clustered into three categories: (1) managers/executives/profession-als; (2) administrative/clerical/sales and (3) other skilled and unskilled workers. AsTable 2.14 indicates, overall one-third of the study sample was in the manager/execu-tive/professional group, in contrast to 10% among all elderly New Yorkers [1]. One infive were in the administrative/clerical/sales group, compared to 7% among all elderlyNew Yorkers. Four in ten were in the skilled/unskilled worker group, which was alsotrue of fully eight out of ten among all elderly in the city.
In general, higher levels of occupation point to higher levels of income and otherresources. Further, they are associated with broad differences in life-style, use of med-ical resources and in heath status in old age. These results suggest that, overall, elderlyAsians are ‘advantaged’ relative to older persons generally in New York City. However,occupational status varied quite sharply across the six ethnic groups studied, with theChinese having a distribution much like that of the elderly at large and the Koreans hav-ing an unusually large clustering in the administrative/clerical/sales category. The smallsample size and incomplete reporting about occupation, especially among theVietnamese of both genders and among Indian and Korean males, limits the inferencesthat can be made.
ASIAN AMERICAN ELDERS IN NEW YORK CITY
ASIAN AMERICAN FEDERATION OF NEW YORK 24
% Who Worked % Who Still Work of Those Most of Life Who Worked Most of Life
ChineseMale (N = 46) 100% 0%Female (N = 59) 46% 0%
FilipinoMale (N = 17) 92% 13%Female (N = 35) 79% 15%
IndianMale (N = 62) 100% 76%Female (N = 38) 8% 67%
JapaneseMale (N = 12) 100% 58% Female (N = 13) 62% 38%
KoreanMale (N = 26) 100% 14% Female (N = 74) 12% 22%
VietnameseMale (N = 16) — —Females (N = 9) 0% —
TotalMale (N = 179) 100% 34%Female (N = 228) 32% 15%
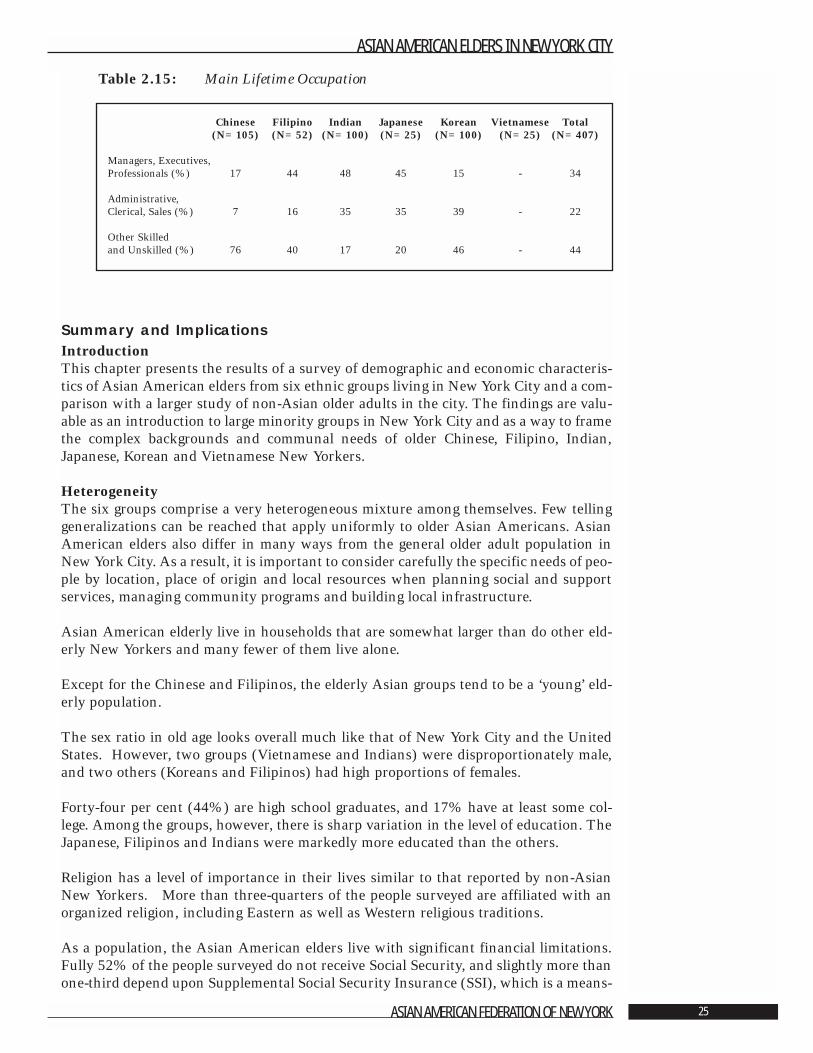
Table 2.15: Main Lifetime Occupation
Summary and ImplicationsIntroductionThis chapter presents the results of a survey of demographic and economic characteris-tics of Asian American elders from six ethnic groups living in New York City and a com-parison with a larger study of non-Asian older adults in the city. The findings are valu-able as an introduction to large minority groups in New York City and as a way to framethe complex backgrounds and communal needs of older Chinese, Filipino, Indian,Japanese, Korean and Vietnamese New Yorkers.
HeterogeneityThe six groups comprise a very heterogeneous mixture among themselves. Few tellinggeneralizations can be reached that apply uniformly to older Asian Americans. AsianAmerican elders also differ in many ways from the general older adult population inNew York City. As a result, it is important to consider carefully the specific needs of peo-ple by location, place of origin and local resources when planning social and supportservices, managing community programs and building local infrastructure.
Asian American elderly live in households that are somewhat larger than do other eld-erly New Yorkers and many fewer of them live alone.
Except for the Chinese and Filipinos, the elderly Asian groups tend to be a ‘young’ eld-erly population.
The sex ratio in old age looks overall much like that of New York City and the UnitedStates. However, two groups (Vietnamese and Indians) were disproportionately male,and two others (Koreans and Filipinos) had high proportions of females.
Forty-four per cent (44%) are high school graduates, and 17% have at least some col-lege. Among the groups, however, there is sharp variation in the level of education. TheJapanese, Filipinos and Indians were markedly more educated than the others.
Religion has a level of importance in their lives similar to that reported by non-AsianNew Yorkers. More than three-quarters of the people surveyed are affiliated with anorganized religion, including Eastern as well as Western religious traditions.
As a population, the Asian American elders live with significant financial limitations.Fully 52% of the people surveyed do not receive Social Security, and slightly more thanone-third depend upon Supplemental Social Security Insurance (SSI), which is a means-
ASIAN AMERICAN ELDERS IN NEW YORK CITY
ASIAN AMERICAN FEDERATION OF NEW YORK 25
Chinese Filipino Indian Japanese Korean Vietnamese Total(N=105) (N=52) (N=100) (N=25) (N=100) (N=25) (N=407)
Managers, Executives,Professionals (%) 17 44 48 45 15 - 34
Administrative, Clerical, Sales (%) 7 16 35 35 39 - 22
Other Skilled and Unskilled (%) 76 40 17 20 46 - 44
tested program. There is substantial variation among the ethnic groups. From anabsolute perspective, the Indian and Japanese are relatively advantaged economically incomparison both to other elderly Asians and to elderly New Yorkers in general. Theyare, however, living just above the poverty level. Filipinos and Chinese are less well off:rents are lower, household income is lower, and over one-quarter of each is eligible forSSI. Koreans and Vietnamese are the most disadvantaged economically, with over three-quarters receiving SSI.
ImmigrationNearly all the Asian American elders in the study were born in Asia. Hence, charac-teristics related to the immigration experience (e.g., numbers, locations, age at arrival)strongly shape group characteristics, their needs as older adults and other imperativesspecific to their distinctive histories and cultures.
Immigration takes place in middle and late-middle age and occurs primarily to join fam-ily members already in the United States. This is too late in life for all but the most ableto master a new language. Less than one-quarter describe themselves as speakingEnglish well. Only one-tenth sometimes speak English at home with family and friends.About one-quarter live in households where no one speaks English well. The challengeof functioning in the English-only mainstream of New York City creates an urgent theneed for translation and interpreter services as well as English as a Second Language(ESL) training adapted to the older adult learner.
CautionsTwo features of the study design make it prudent to be cautious in drawing inferencesabout the wider population Asian American elders in New York City. First, the samplesof each ethnic group studied here are small and drawn exclusively from geographicalareas of the city most densely Asian. As a result, they may be untypical of Asians in thecity as a whole. Second, to large extent each ethnic group was interviewed in a differentlanguage and by different interviewers. Differences in translation, understanding of thequestions, willingness to respond - all of which may well be confounded with ethnicgroup membership - are rival explanations wherever differences among the six groupsare found.
ASIAN AMERICAN ELDERS IN NEW YORK CITY
ASIAN AMERICAN FEDERATION OF NEW YORK 26
Literature Cited
1. Dumpson, James, et al. “Growing Older in New York City in the 1990s.” New York:New York Center on Aging of the New York Community Trust, 1993.
Volume 1 Introduction, Compendium of Significant Findings, Recommendations and Methodology
Volume 2 A Demographic and Economic ProfileVolume 3 Impact of Health Problems on Quality of LifeVolume 4 Life Space, Environment, and Impact of CrimeVolume 5 Family and Community Support Systems
2. NYC Department of City Planning. 1990 Census: Demographic Profiles of SelectedAsian Groups, 1992.
3. NYC Department of City Planning. 1990 Census: Total Asian by Specified AsianGroup. New York City, Boroughs and Census Tracts, 1992.
4. NYC Department of Planning. 1990 Census: Demographic and SocioeconomicProfiles. Selected Tabulations. Specified Asian Groups, New York City and Boroughs,1994.
5. NYC Department of Aging. Profile of New York City’s Asian Elderly. May, 1995.
6. US Bureau of Census. Census 200, SF2 data. Data derived from analysis by the AsianAmerican Federation Census Information Center.
7. Cohen, R.A. and Nostrand J.F. “Trends in the Health of Older Americans.” Vital HealthStat, 1995.
8. NYC Department of City Planning.
ASIAN AMERICAN ELDERS IN NEW YORK CITY
ASIAN AMERICAN FEDERATION OF NEW YORK 27
Chapter 3: Physical Health,
Mental Health and Quality of Life
Ada C. Mui ,Ph.D., A.C.S.W.1
Significant Findings • Asian American elders rate their overall general health as good. Each of 20 medical
conditions is reported at least once, with an average of 2.8 medical conditions perelder.
• The four most prevalent medical conditions are arthritis (43.4%), high blood pressure(41.5%), high cholesterol (28%) and cataracts (26.7%).
• Asian American elders report a moderate incidence of physical health challenges andfew impairments with Activities of Daily Living (ADLs). 2
• Asian American elders rank their quality of life 10% or more below the general eld-erly population in the United States on measures of physical functioning, generalhealth, social functioning, and mental health.
• Depression is very evident among the Asian American elders, with 40% reportingdepressive symptoms ranging from mild to severe. Depressive symptoms vary by eth-nic group, martial status and living arrangements.
• Higher numbers of depressive symptoms, greater impairments with Activities of DailyLiving (ADLs) and poor ability to read English contribute to perceiving quality of lifeas poor.
• Asian American elders are more likely to be depressed when they perceive their healthas poor, experience more stressful life changes, have higher levels of assistance fromtheir children, have children who do not live in proximity, are less religious and expe-rience a greater cultural gap between themselves and their children.
• They are more likely to have poor general health when they have more depressivesymptoms, more medical conditions, are unable to read English, are more religious,have more impairments with Activities of Daily Living (ADLs), live alone and areenrolled in Medicaid.
ASIAN AMERICAN ELDERS IN NEW YORK CITY
ASIAN AMERICAN FEDERATION OF NEW YORK 28
1 The author is grateful to Li-Mei Chen,Margaret Dietz Domanski, and Suk-Young Kang for their valuable assistanceon earlier drafts of this report.
2 Activities of Daily Living (ADLs) includebathing, dressing, grooming, transfer-ring, toileting and feeding.
• Asian American elders are more likely to have poor general mental health when thereis a greater cultural gap between elders and their children, when they have morestressful life changes and are unable to read English.
• The elders are more likely to have poor social functioning when they have moredepressive symptoms, more impairments with Activities of Daily Living, are unable toread English and are not enrolled in private health insurance plans.
ASIAN AMERICAN ELDERS IN NEW YORK CITY
ASIAN AMERICAN FEDERATION OF NEW YORK 29
IntroductionThis chapter provides scientific data on physical health, mental health and quality of lifefor a sample of Asian Americans in New York City. The six Asian American ethnicgroups in this study were elders of Chinese, Filipino, Indian, Japanese, Korean, andVietnamese origin. The information is intended to guide planning health and supportservices for Asian American elders. Further, results of the study should enhance gener-al knowledge about the diversity and complexity of the older adult population in NewYork City and other communities with substantial minority communities.
The information is covered in the following five sections:
Section 1 Population Trends and the Need for DataSection 2 Physical HealthSection 3 Quality of LifeSection 4 Mental Health Section 5 Explanations
3.1 Population Trends and the Need for DataBetween 1980 and 1990, the Asian American population in the United States increasedby 107.8% compared with 6% for Whites, 13% for Blacks, and 53% for Hispanics [1].Between 1990 and 2000, the Asian American population grew 41%. Asian Americanelders age 65 years and over increased by 76%. Nationally, American elders constitut-ed 12.4% of the total population.
The growing numbers in the aging population is one of the most significant demograph-ic trends in modern history. With the increased life expectancy in American society, theimpact of this population trend has been - and continues to be - felt by many institutions.It is especially significant for the many programs financing and providing health care,mental health care, long-term care, employment, and personal social services.
Despite the increasing number of ethnic elders in the American population, there aresubstantial knowledge gaps regarding their physical and mental health status. This isespecially true for Asian minorities. It is due to a lack of empirical research [2, 3] andthe consequent unavailability of data on these elders.
The absence of scientific information makes it difficult for service programs to under-stand Asian American elders’ health care needs, assess their functional health limita-tions, ascertain the clinical effectiveness of service programs, and develop and evaluateculturally appropriate programs for this underserved population. Further, despite anincreasing interest in providing culturally responsive health care services, the development and implementation of culturally sensitive programs for Asian Americanelders is hindered by the paucity of empirical data on physical health, mental health, andhealth-related quality of life for this population.
3.2 Physical HealthThe following analysis utilized two sets of measures for assessing the physical health ofAsian American elders. The first was a self-report of whether respondents had beentold that they had a medical condition or diagnosis. The second focused on elders’reports of problems or difficulty they have with the six Activities of Daily Living(ADLs). These are: bathing, toileting, getting dressed, combing or brushing, getting inand out of bed, and feeding. Information on the use of assistive devices was collected as
ASIAN AMERICAN ELDERS IN NEW YORK CITY
ASIAN AMERICAN FEDERATION OF NEW YORK 30
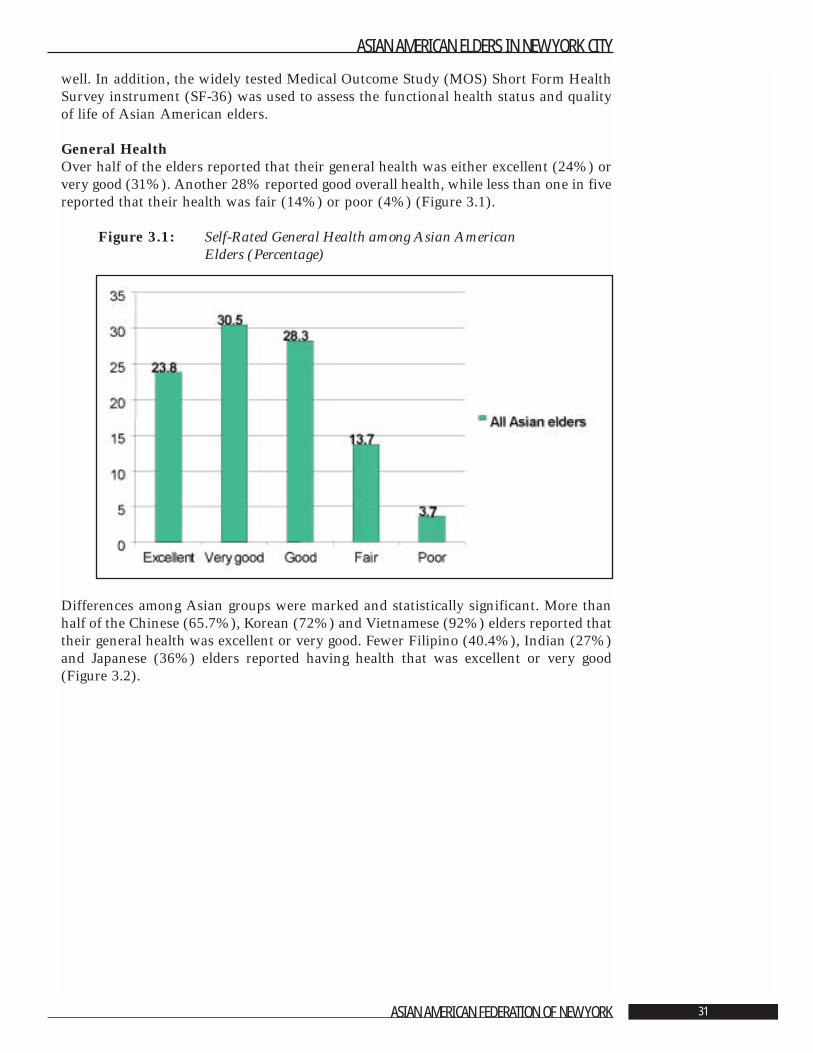
well. In addition, the widely tested Medical Outcome Study (MOS) Short Form HealthSurvey instrument (SF-36) was used to assess the functional health status and qualityof life of Asian American elders.
General Health Over half of the elders reported that their general health was either excellent (24%) orvery good (31%). Another 28% reported good overall health, while less than one in fivereported that their health was fair (14%) or poor (4%) (Figure 3.1).
Figure 3.1: Self-Rated General Health among Asian American Elders (Percentage)
Differences among Asian groups were marked and statistically significant. More thanhalf of the Chinese (65.7%), Korean (72%) and Vietnamese (92%) elders reported thattheir general health was excellent or very good. Fewer Filipino (40.4%), Indian (27%)and Japanese (36%) elders reported having health that was excellent or very good(Figure 3.2).
ASIAN AMERICAN ELDERS IN NEW YORK CITY
ASIAN AMERICAN FEDERATION OF NEW YORK 31
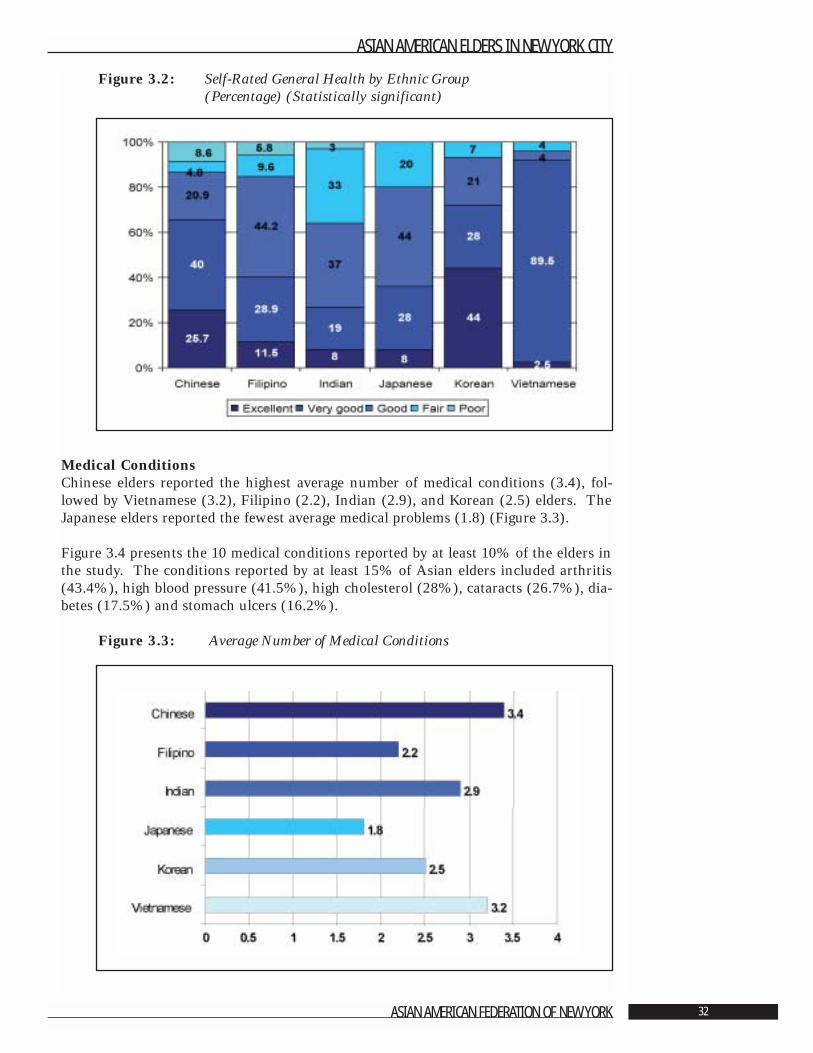
Figure 3.2: Self-Rated General Health by Ethnic Group (Percentage) (Statistically significant)
Medical ConditionsChinese elders reported the highest average number of medical conditions (3.4), fol-lowed by Vietnamese (3.2), Filipino (2.2), Indian (2.9), and Korean (2.5) elders. TheJapanese elders reported the fewest average medical problems (1.8) (Figure 3.3).
Figure 3.4 presents the 10 medical conditions reported by at least 10% of the elders inthe study. The conditions reported by at least 15% of Asian elders included arthritis(43.4%), high blood pressure (41.5%), high cholesterol (28%), cataracts (26.7%), dia-betes (17.5%) and stomach ulcers (16.2%).
Figure 3.3: Average Number of Medical Conditions
ASIAN AMERICAN ELDERS IN NEW YORK CITY
ASIAN AMERICAN FEDERATION OF NEW YORK 32
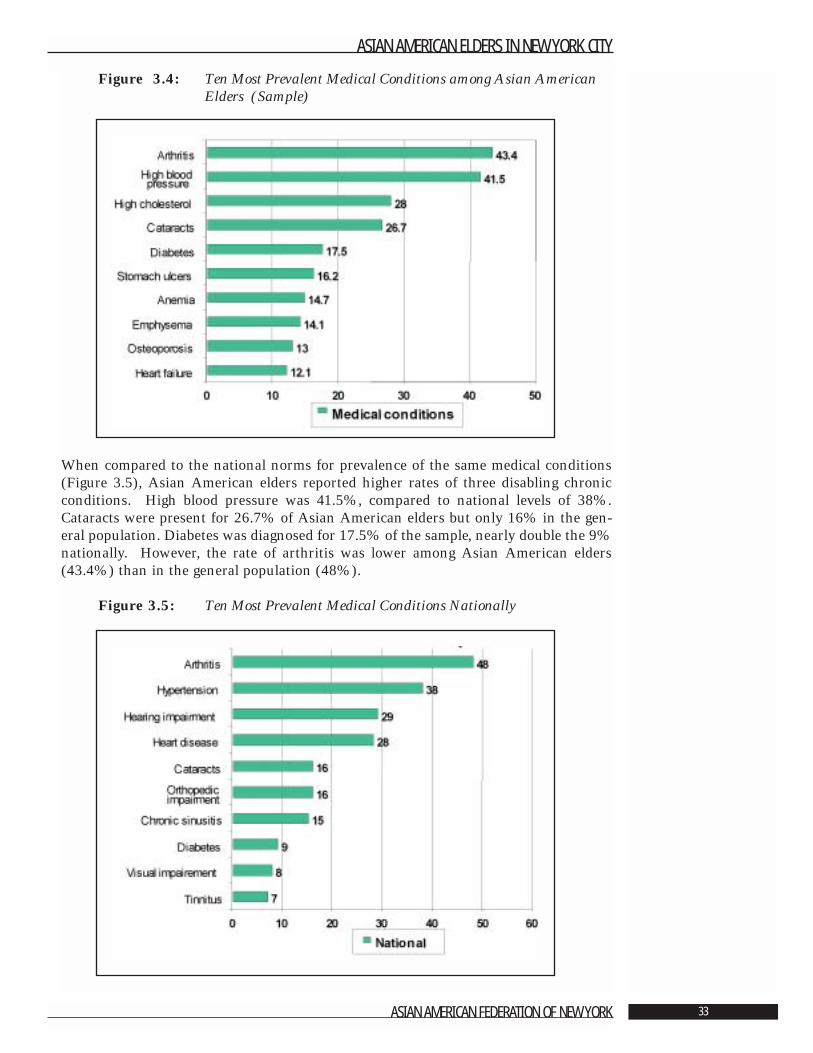
Figure 3.4: Ten Most Prevalent Medical Conditions among Asian AmericanElders (Sample)
When compared to the national norms for prevalence of the same medical conditions(Figure 3.5), Asian American elders reported higher rates of three disabling chronicconditions. High blood pressure was 41.5%, compared to national levels of 38%.Cataracts were present for 26.7% of Asian American elders but only 16% in the gen-eral population. Diabetes was diagnosed for 17.5% of the sample, nearly double the 9%nationally. However, the rate of arthritis was lower among Asian American elders(43.4%) than in the general population (48%).
Figure 3.5: Ten Most Prevalent Medical Conditions Nationally
ASIAN AMERICAN ELDERS IN NEW YORK CITY
ASIAN AMERICAN FEDERATION OF NEW YORK 33
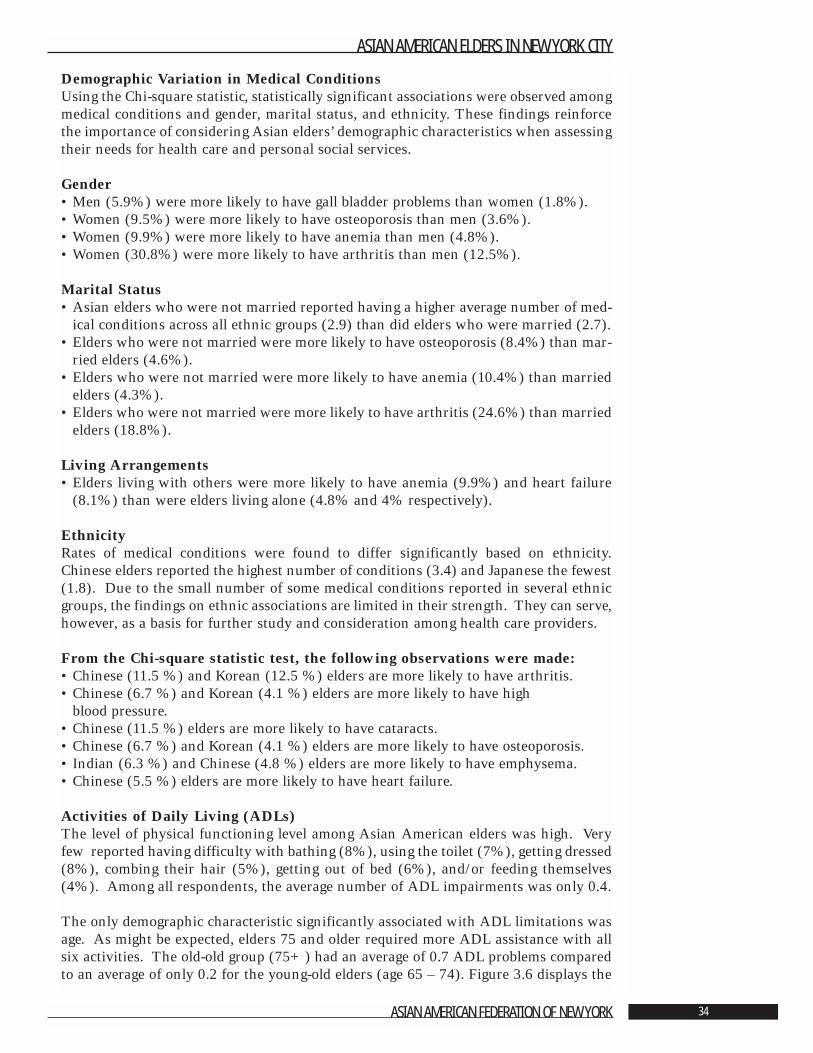
Demographic Variation in Medical Conditions Using the Chi-square statistic, statistically significant associations were observed amongmedical conditions and gender, marital status, and ethnicity. These findings reinforcethe importance of considering Asian elders’ demographic characteristics when assessingtheir needs for health care and personal social services.
Gender• Men (5.9%) were more likely to have gall bladder problems than women (1.8%).• Women (9.5%) were more likely to have osteoporosis than men (3.6%). • Women (9.9%) were more likely to have anemia than men (4.8%).• Women (30.8%) were more likely to have arthritis than men (12.5%).
Marital Status • Asian elders who were not married reported having a higher average number of med-
ical conditions across all ethnic groups (2.9) than did elders who were married (2.7).• Elders who were not married were more likely to have osteoporosis (8.4%) than mar-
ried elders (4.6%).• Elders who were not married were more likely to have anemia (10.4%) than married
elders (4.3%).• Elders who were not married were more likely to have arthritis (24.6%) than married
elders (18.8%).
Living Arrangements• Elders living with others were more likely to have anemia (9.9%) and heart failure
(8.1%) than were elders living alone (4.8% and 4% respectively).
Ethnicity Rates of medical conditions were found to differ significantly based on ethnicity.Chinese elders reported the highest number of conditions (3.4) and Japanese the fewest(1.8). Due to the small number of some medical conditions reported in several ethnicgroups, the findings on ethnic associations are limited in their strength. They can serve,however, as a basis for further study and consideration among health care providers.
From the Chi-square statistic test, the following observations were made:• Chinese (11.5 %) and Korean (12.5 %) elders are more likely to have arthritis.• Chinese (6.7 %) and Korean (4.1 %) elders are more likely to have high
blood pressure.• Chinese (11.5 %) elders are more likely to have cataracts.• Chinese (6.7 %) and Korean (4.1 %) elders are more likely to have osteoporosis.• Indian (6.3 %) and Chinese (4.8 %) elders are more likely to have emphysema.• Chinese (5.5 %) elders are more likely to have heart failure.
Activities of Daily Living (ADLs)The level of physical functioning level among Asian American elders was high. Veryfew reported having difficulty with bathing (8%), using the toilet (7%), getting dressed(8%), combing their hair (5%), getting out of bed (6%), and/or feeding themselves(4%). Among all respondents, the average number of ADL impairments was only 0.4.
The only demographic characteristic significantly associated with ADL limitations wasage. As might be expected, elders 75 and older required more ADL assistance with allsix activities. The old-old group (75+) had an average of 0.7 ADL problems comparedto an average of only 0.2 for the young-old elders (age 65 – 74). Figure 3.6 displays the
ASIAN AMERICAN ELDERS IN NEW YORK CITY
ASIAN AMERICAN FEDERATION OF NEW YORK 34
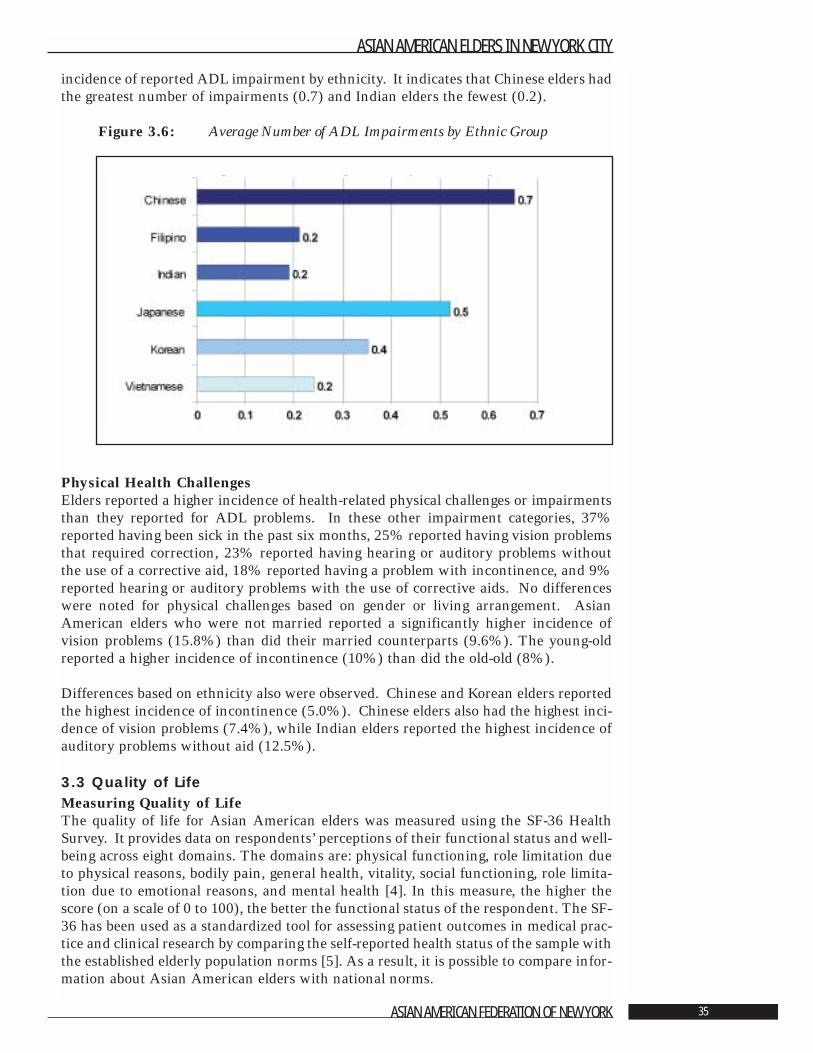
incidence of reported ADL impairment by ethnicity. It indicates that Chinese elders hadthe greatest number of impairments (0.7) and Indian elders the fewest (0.2).
Figure 3.6: Average Number of ADL Impairments by Ethnic Group
Physical Health ChallengesElders reported a higher incidence of health-related physical challenges or impairmentsthan they reported for ADL problems. In these other impairment categories, 37%reported having been sick in the past six months, 25% reported having vision problemsthat required correction, 23% reported having hearing or auditory problems withoutthe use of a corrective aid, 18% reported having a problem with incontinence, and 9%reported hearing or auditory problems with the use of corrective aids. No differenceswere noted for physical challenges based on gender or living arrangement. AsianAmerican elders who were not married reported a significantly higher incidence ofvision problems (15.8%) than did their married counterparts (9.6%). The young-oldreported a higher incidence of incontinence (10%) than did the old-old (8%).
Differences based on ethnicity also were observed. Chinese and Korean elders reportedthe highest incidence of incontinence (5.0%). Chinese elders also had the highest inci-dence of vision problems (7.4%), while Indian elders reported the highest incidence ofauditory problems without aid (12.5%).
3.3 Quality of LifeMeasuring Quality of LifeThe quality of life for Asian American elders was measured using the SF-36 HealthSurvey. It provides data on respondents’ perceptions of their functional status and well-being across eight domains. The domains are: physical functioning, role limitation dueto physical reasons, bodily pain, general health, vitality, social functioning, role limita-tion due to emotional reasons, and mental health [4]. In this measure, the higher thescore (on a scale of 0 to 100), the better the functional status of the respondent. The SF-36 has been used as a standardized tool for assessing patient outcomes in medical prac-tice and clinical research by comparing the self-reported health status of the sample withthe established elderly population norms [5]. As a result, it is possible to compare infor-mation about Asian American elders with national norms.
ASIAN AMERICAN ELDERS IN NEW YORK CITY
ASIAN AMERICAN FEDERATION OF NEW YORK 35
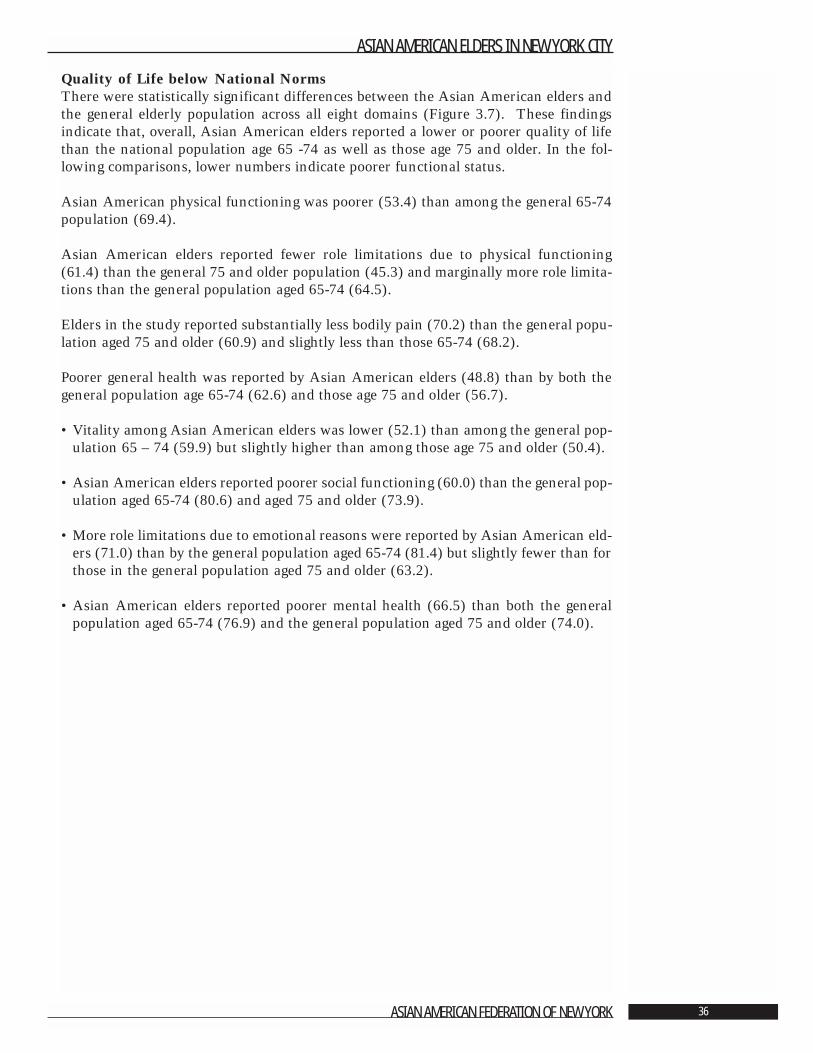
Quality of Life below National Norms There were statistically significant differences between the Asian American elders andthe general elderly population across all eight domains (Figure 3.7). These findingsindicate that, overall, Asian American elders reported a lower or poorer quality of lifethan the national population age 65 -74 as well as those age 75 and older. In the fol-lowing comparisons, lower numbers indicate poorer functional status.
Asian American physical functioning was poorer (53.4) than among the general 65-74population (69.4).
Asian American elders reported fewer role limitations due to physical functioning(61.4) than the general 75 and older population (45.3) and marginally more role limita-tions than the general population aged 65-74 (64.5).
Elders in the study reported substantially less bodily pain (70.2) than the general popu-lation aged 75 and older (60.9) and slightly less than those 65-74 (68.2).
Poorer general health was reported by Asian American elders (48.8) than by both thegeneral population age 65-74 (62.6) and those age 75 and older (56.7).
• Vitality among Asian American elders was lower (52.1) than among the general pop-ulation 65 – 74 (59.9) but slightly higher than among those age 75 and older (50.4).
• Asian American elders reported poorer social functioning (60.0) than the general pop-ulation aged 65-74 (80.6) and aged 75 and older (73.9).
• More role limitations due to emotional reasons were reported by Asian American eld-ers (71.0) than by the general population aged 65-74 (81.4) but slightly fewer than forthose in the general population aged 75 and older (63.2).
• Asian American elders reported poorer mental health (66.5) than both the generalpopulation aged 65-74 (76.9) and the general population aged 75 and older (74.0).
ASIAN AMERICAN ELDERS IN NEW YORK CITY
ASIAN AMERICAN FEDERATION OF NEW YORK 36
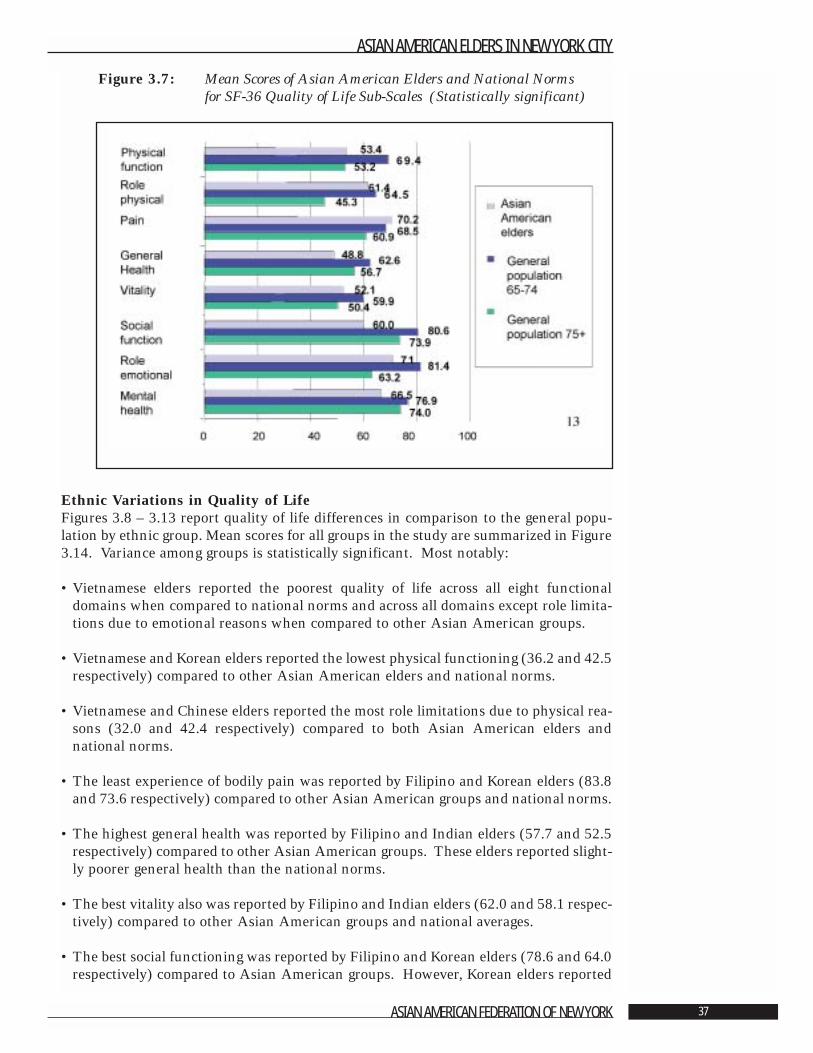
Figure 3.7: Mean Scores of Asian American Elders and National Norms for SF-36 Quality of Life Sub-Scales (Statistically significant)
Ethnic Variations in Quality of Life Figures 3.8 – 3.13 report quality of life differences in comparison to the general popu-lation by ethnic group. Mean scores for all groups in the study are summarized in Figure3.14. Variance among groups is statistically significant. Most notably:
• Vietnamese elders reported the poorest quality of life across all eight functionaldomains when compared to national norms and across all domains except role limita-tions due to emotional reasons when compared to other Asian American groups.
• Vietnamese and Korean elders reported the lowest physical functioning (36.2 and 42.5respectively) compared to other Asian American elders and national norms.
• Vietnamese and Chinese elders reported the most role limitations due to physical rea-sons (32.0 and 42.4 respectively) compared to both Asian American elders andnational norms.
• The least experience of bodily pain was reported by Filipino and Korean elders (83.8and 73.6 respectively) compared to other Asian American groups and national norms.
• The highest general health was reported by Filipino and Indian elders (57.7 and 52.5respectively) compared to other Asian American groups. These elders reported slight-ly poorer general health than the national norms.
• The best vitality also was reported by Filipino and Indian elders (62.0 and 58.1 respec-tively) compared to other Asian American groups and national averages.
• The best social functioning was reported by Filipino and Korean elders (78.6 and 64.0respectively) compared to Asian American groups. However, Korean elders reported
ASIAN AMERICAN ELDERS IN NEW YORK CITY
ASIAN AMERICAN FEDERATION OF NEW YORK 37
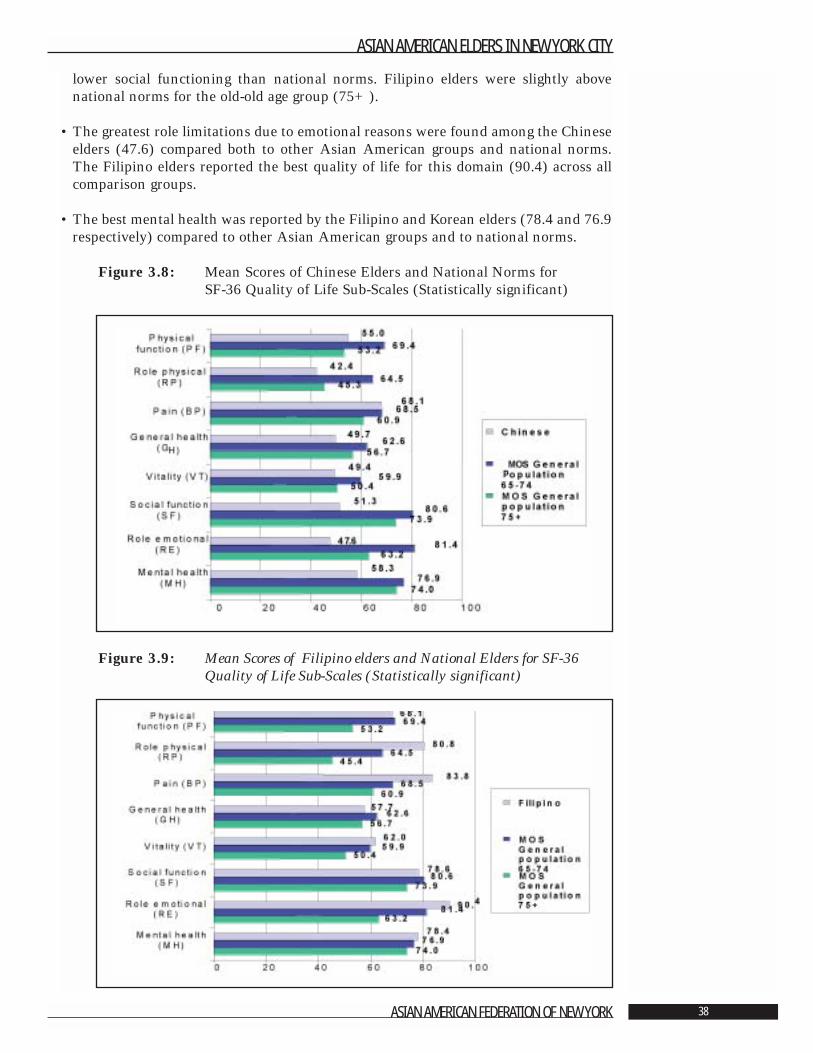
lower social functioning than national norms. Filipino elders were slightly abovenational norms for the old-old age group (75+).
• The greatest role limitations due to emotional reasons were found among the Chineseelders (47.6) compared both to other Asian American groups and national norms.The Filipino elders reported the best quality of life for this domain (90.4) across allcomparison groups.
• The best mental health was reported by the Filipino and Korean elders (78.4 and 76.9respectively) compared to other Asian American groups and to national norms.
Figure 3.8: Mean Scores of Chinese Elders and National Norms for SF-36 Quality of Life Sub-Scales (Statistically significant)
Figure 3.9: Mean Scores of Filipino elders and National Elders for SF-36Quality of Life Sub-Scales (Statistically significant)
ASIAN AMERICAN ELDERS IN NEW YORK CITY
ASIAN AMERICAN FEDERATION OF NEW YORK 38
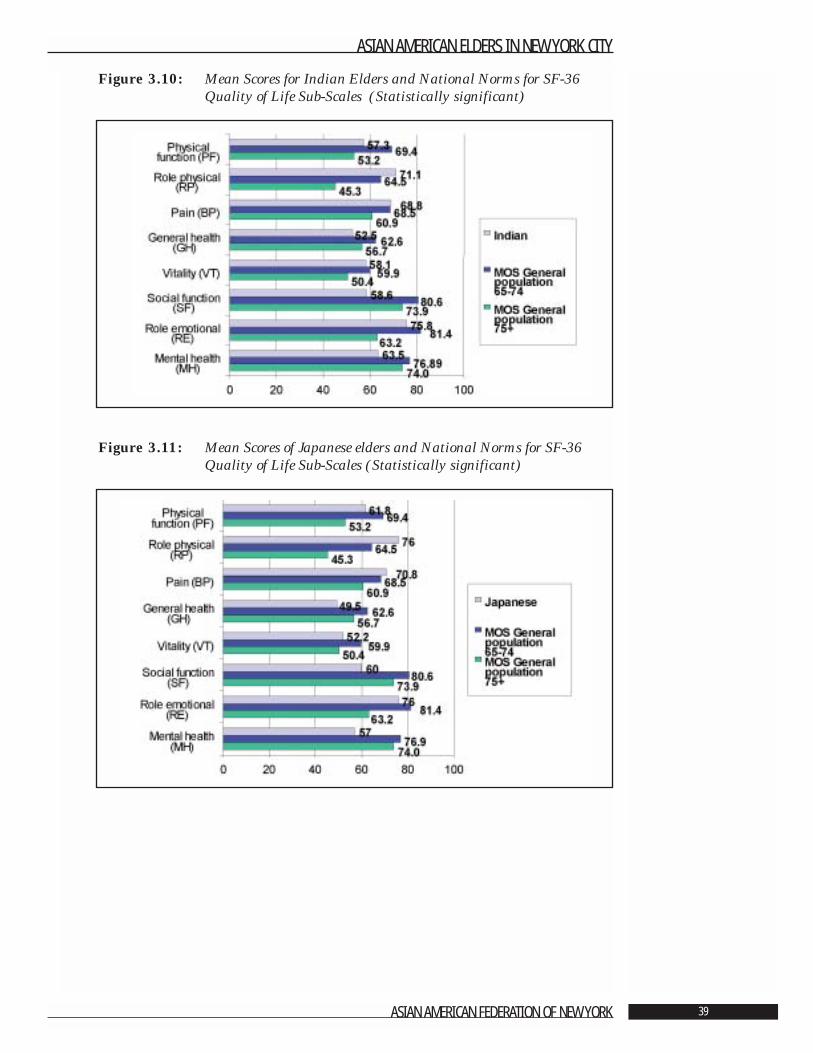
Figure 3.10: Mean Scores for Indian Elders and National Norms for SF-36Quality of Life Sub-Scales (Statistically significant)
Figure 3.11: Mean Scores of Japanese elders and National Norms for SF-36Quality of Life Sub-Scales (Statistically significant)
ASIAN AMERICAN ELDERS IN NEW YORK CITY
ASIAN AMERICAN FEDERATION OF NEW YORK 39
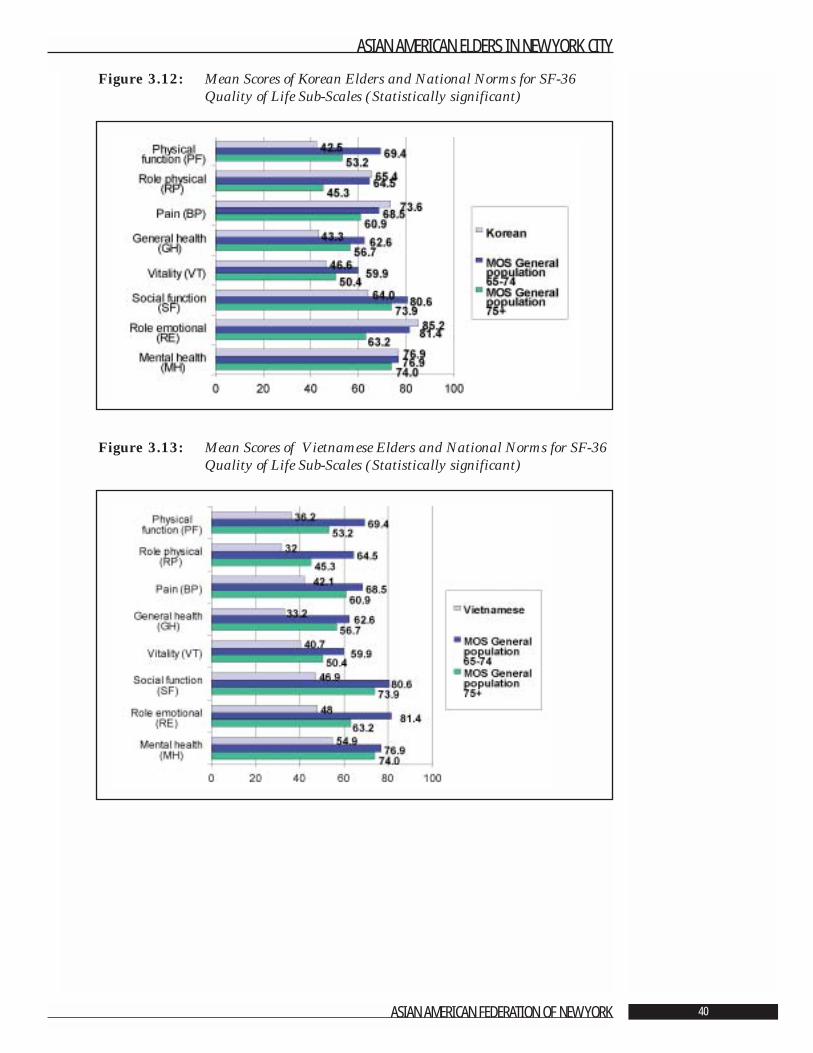
Figure 3.12: Mean Scores of Korean Elders and National Norms for SF-36Quality of Life Sub-Scales (Statistically significant)
Figure 3.13: Mean Scores of Vietnamese Elders and National Norms for SF-36Quality of Life Sub-Scales (Statistically significant)
ASIAN AMERICAN ELDERS IN NEW YORK CITY
ASIAN AMERICAN FEDERATION OF NEW YORK 40
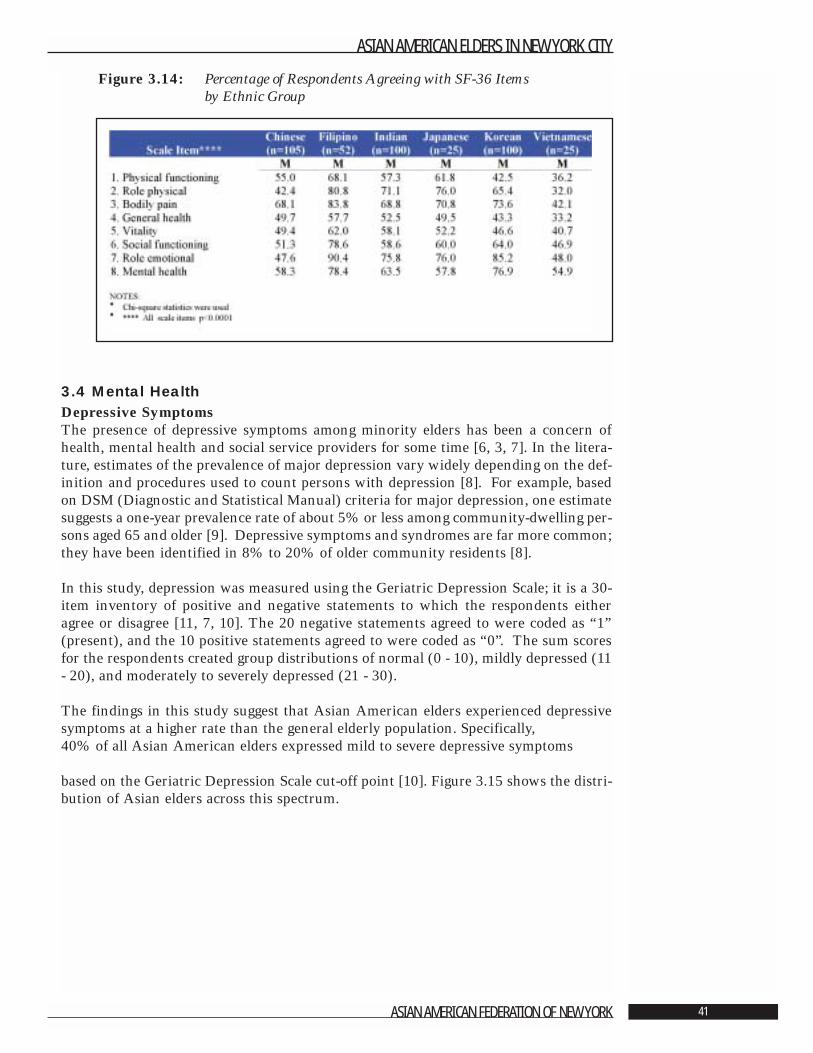
Figure 3.14: Percentage of Respondents Agreeing with SF-36 Items by Ethnic Group
3.4 Mental HealthDepressive Symptoms The presence of depressive symptoms among minority elders has been a concern ofhealth, mental health and social service providers for some time [6, 3, 7]. In the litera-ture, estimates of the prevalence of major depression vary widely depending on the def-inition and procedures used to count persons with depression [8]. For example, basedon DSM (Diagnostic and Statistical Manual) criteria for major depression, one estimatesuggests a one-year prevalence rate of about 5% or less among community-dwelling per-sons aged 65 and older [9]. Depressive symptoms and syndromes are far more common;they have been identified in 8% to 20% of older community residents [8].
In this study, depression was measured using the Geriatric Depression Scale; it is a 30-item inventory of positive and negative statements to which the respondents eitheragree or disagree [11, 7, 10]. The 20 negative statements agreed to were coded as “1”(present), and the 10 positive statements agreed to were coded as “0”. The sum scoresfor the respondents created group distributions of normal (0 - 10), mildly depressed (11- 20), and moderately to severely depressed (21 - 30).
The findings in this study suggest that Asian American elders experienced depressivesymptoms at a higher rate than the general elderly population. Specifically, 40% of all Asian American elders expressed mild to severe depressive symptoms
based on the Geriatric Depression Scale cut-off point [10]. Figure 3.15 shows the distri-bution of Asian elders across this spectrum.
ASIAN AMERICAN ELDERS IN NEW YORK CITY
ASIAN AMERICAN FEDERATION OF NEW YORK 41
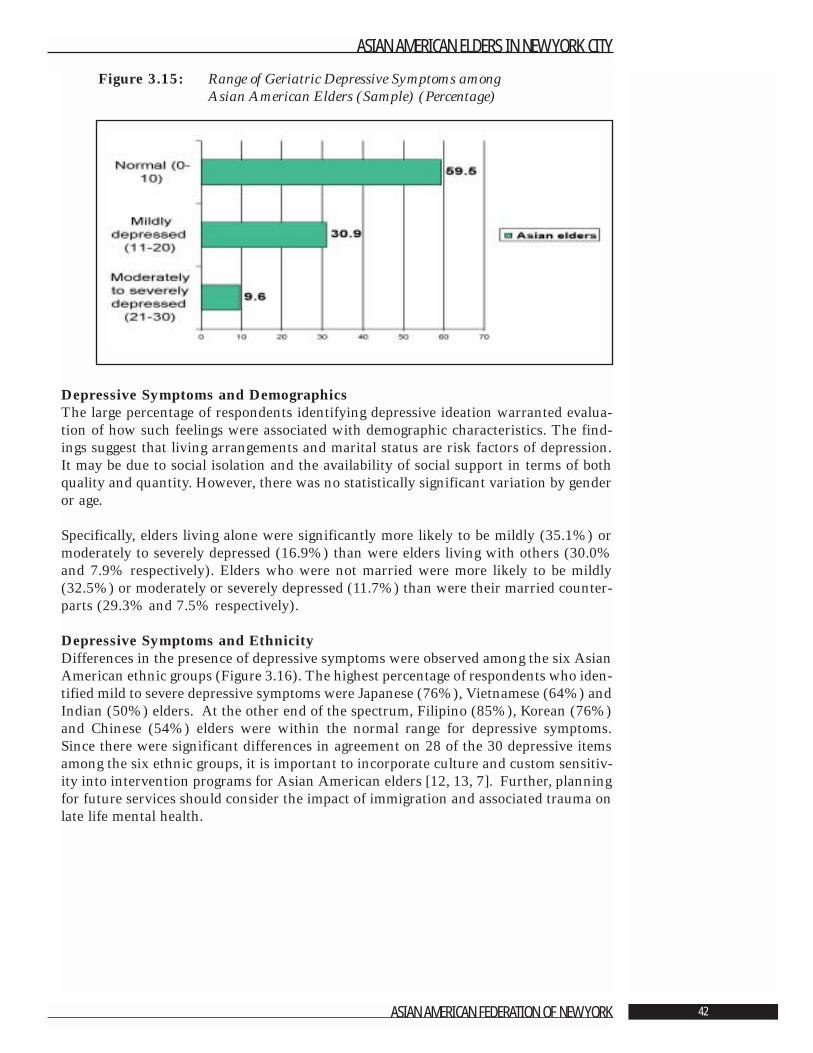
Figure 3.15: Range of Geriatric Depressive Symptoms among Asian American Elders (Sample) (Percentage)
Depressive Symptoms and Demographics The large percentage of respondents identifying depressive ideation warranted evalua-tion of how such feelings were associated with demographic characteristics. The find-ings suggest that living arrangements and marital status are risk factors of depression.It may be due to social isolation and the availability of social support in terms of bothquality and quantity. However, there was no statistically significant variation by genderor age.
Specifically, elders living alone were significantly more likely to be mildly (35.1%) ormoderately to severely depressed (16.9%) than were elders living with others (30.0%and 7.9% respectively). Elders who were not married were more likely to be mildly(32.5%) or moderately or severely depressed (11.7%) than were their married counter-parts (29.3% and 7.5% respectively).
Depressive Symptoms and Ethnicity Differences in the presence of depressive symptoms were observed among the six AsianAmerican ethnic groups (Figure 3.16). The highest percentage of respondents who iden-tified mild to severe depressive symptoms were Japanese (76%), Vietnamese (64%) andIndian (50%) elders. At the other end of the spectrum, Filipino (85%), Korean (76%)and Chinese (54%) elders were within the normal range for depressive symptoms.Since there were significant differences in agreement on 28 of the 30 depressive itemsamong the six ethnic groups, it is important to incorporate culture and custom sensitiv-ity into intervention programs for Asian American elders [12, 13, 7]. Further, planningfor future services should consider the impact of immigration and associated trauma onlate life mental health.
ASIAN AMERICAN ELDERS IN NEW YORK CITY
ASIAN AMERICAN FEDERATION OF NEW YORK 42
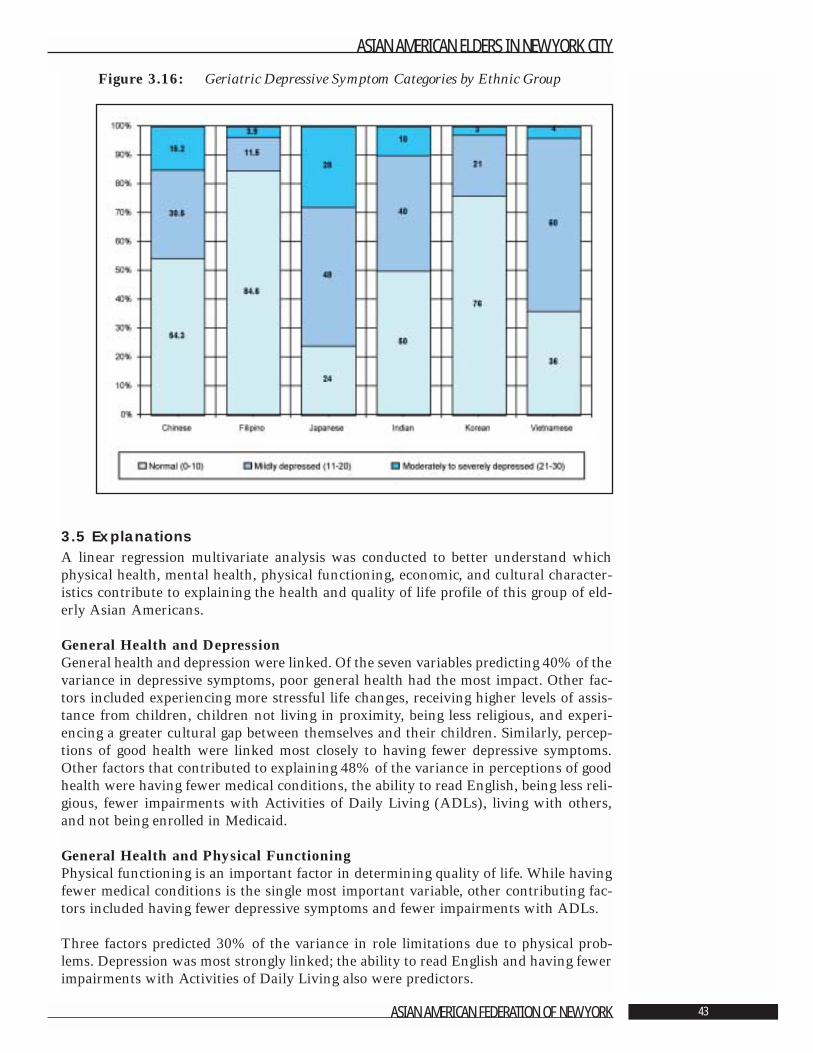
Figure 3.16: Geriatric Depressive Symptom Categories by Ethnic Group
3.5 Explanations A linear regression multivariate analysis was conducted to better understand whichphysical health, mental health, physical functioning, economic, and cultural character-istics contribute to explaining the health and quality of life profile of this group of eld-erly Asian Americans.
General Health and Depression General health and depression were linked. Of the seven variables predicting 40% of thevariance in depressive symptoms, poor general health had the most impact. Other fac-tors included experiencing more stressful life changes, receiving higher levels of assis-tance from children, children not living in proximity, being less religious, and experi-encing a greater cultural gap between themselves and their children. Similarly, percep-tions of good health were linked most closely to having fewer depressive symptoms.Other factors that contributed to explaining 48% of the variance in perceptions of goodhealth were having fewer medical conditions, the ability to read English, being less reli-gious, fewer impairments with Activities of Daily Living (ADLs), living with others,and not being enrolled in Medicaid.
General Health and Physical FunctioningPhysical functioning is an important factor in determining quality of life. While havingfewer medical conditions is the single most important variable, other contributing fac-tors included having fewer depressive symptoms and fewer impairments with ADLs.
Three factors predicted 30% of the variance in role limitations due to physical prob-lems. Depression was most strongly linked; the ability to read English and having fewerimpairments with Activities of Daily Living also were predictors.
ASIAN AMERICAN ELDERS IN NEW YORK CITY
ASIAN AMERICAN FEDERATION OF NEW YORK 43
Bodily Pain and DepressionThe most powerful predictor of bodily pain was depression. Fewer depressive symptomsand less bodily pain were most closely linked. Having fewer impairments with Activitiesof Daily Living and the ability to read English also were significant predictors of lessbodily pain.
VitalityFour factors predicted 41% of the variance observed in the quality of life domain cate-gorized as vitality. Most important was having fewer depressive symptoms. The otherswere having fewer impairments with Activities of Daily Living (ADLs), having fewermedical conditions, and having the ability to read English.
Social FunctioningFewer depressive symptoms and fewer impairments with Activities of Daily Living werethe strongest predictors of better social functioning. Other significant factors were hav-ing the ability to read English and being enrolled in a private health insurance plan.Together, these factors explained 46% of the variance.
Role Limitations due to Emotional ProblemsThirty-two percent (32%) of the variance in role limitations due to emotional problemswas linked to two variables. Most important was having fewer depressive symptoms;second was having the ability to read English.
General Mental HealthOnly 18% of the variance in general mental health was predicted. Nearly equal contri-butions were made by having less of a cultural gap between elders and their children,having fewer stressful life changes, and, once again, having the ability to read English.
3.6 Summary and ImplicationsPhysical HealthMore than half of Asian American elders reported that their general health was eitherexcellent or very good. However, when compared to national norms for prevalence ofmedical conditions, the same population reported higher rates of hypertension, cataractsand diabetes. There was, as well, significant variation in the number and types of med-ical conditions across the six ethnic groups studied; gender and marital status also werefactors associated with a range of medical conditions.
The information about physical health in this population must be considered when assess-ing the need for health care and personal social services. There is a substantial need toeducate Asian American elders about preventive health measures as part of communityoutreach strategies. It also is important to promote primary prevention and treatment forthe major health problems reported by these elders. Attention should be directed to physi-cians and other health care professionals as well as to elders and their families.
There should be a commitment to educating the community about the intimate con-nection between physical health and mental health. Lifting the stigma commonly asso-ciated with depression and other mental health problems will be vital to strengtheningcoping skills, restoring health and improving the quality of life for Asian American eld-ers. It is necessary, as well, to rectify the absence of geriatric mental health clinics andservices specializing in the needs of this population. Culturally competent services pro-vided in the language with which patients are most comfortable are critical needs.
ASIAN AMERICAN ELDERS IN NEW YORK CITY
ASIAN AMERICAN FEDERATION OF NEW YORK 44
Interventions to Improve Quality of Life The findings regarding explanations of quality of life among Asian American eldershave important implications for program planning and service delivery. Several factorscan be addressed through physical health, mental health and social service programs.
DepressionThe presence of depressive symptoms among the sample of Asian American elders wasextensive. Fewer depressive symptoms were shown to be a factor in higher quality of lifein terms of general health, general mental health, physical and social functioning andvitality. Depression and other mood disorders are highly treatable conditions. Programsaimed at reducing depression symptoms among the Asian American elders need to begiven a priority. Understanding the economic cost and benefit of improved mental healthservices and the treatment of depression is an important area for further study.
Activities of Daily Living (ADLs)Reducing Asian American elders’ experience with limitations in their Activities ofDaily Living (ADLs) is another important area for program attention and improvement.Having fewer ADL impairments explained better general health and better social func-tioning. As with depression, improving independence in ADLs is a quality of lifedomain that is responsive to heath and social service interventions. Health promotionprograms aimed at increasing physical activities for these older Asian Americans shouldalso be a priority.
Education The ability of the Asian American elders to read English was a significant factor fortheir quality of life. It contributed to explaining better general mental health and bettersocial functioning. Having the ability to read English may give Asian American eldersa greater sense of control, an improved sense of competency, and a stronger sense ofindependence. With these, they may be able to communicate with and negotiate in anysystem in their everyday life. More programs teaching English as a second language andother educational opportunities may empower Asian American elders and thus enhancetheir quality of life. Educational programs in senior centers and those accessible viabroadcast media that are designed to improve the reading skills of seniors also would bebeneficial.
Other areas for intervention include increasing the availability of health insurance,addressing the cultural gap between elders and their children, and reducing life stresses.
ASIAN AMERICAN ELDERS IN NEW YORK CITY
ASIAN AMERICAN FEDERATION OF NEW YORK 45
Literature Cited
1. US Bureau of the Census. Census Bureau Press Release CB91-215, September, 1991.
2. LaVeist, T.A. “Data Sources for Aging Research on Racial and Ethnic Groups.” TheGerontologist, 1995. 35: 328-339.
3. Mui, A. C. “Depression Among Elderly Chinese Immigrants: An Exploratory Study.”Social Work, 1996a. 41: 633-645.
4. Ware, J.E., and Sherbourne, C. D. “The MOS 36-Item Short-Form Health Survey (SF-36).” Medical Care, 1992. 30: 473-483.
5. Stewart, A.L., and Ware, J.E., eds. “Measuring Functioning and Well-Being — theMedical Outcomes Study Approach.” Durham, NC: Duke University Press, 1992.
6. Gibson, R.C. “Minority Aging Research: Opportunity and Challenge.” Journal ofGerontology: Social Sciences, 1989. 44: 1-2.
7. Ren, S.R. and Chang, K. “Evaluating Health Status of Elderly Chinese in Boston.”Journal of Epidimiology, 1998. 51: 429-435.
8. Gallo, J.J. and Lebowitz, B.D. “The Epidemiology of Common Late-Life MentalDisorders in the Community: Themes for the New Century.” Psychiatric Services, 1999.50: 1158-1166.
9. Gurland, B.J., Cross, P., and Katz, S. “Epidemiological Perspectives on Opportunities forTreatment of Depression.” American Journal of Geriatric Psychiatry, 1996. 4 (Suppl.1): S7-S13.
10. Yesavage, J.A., Brink, T.L., Rose, T.L., Lum, O., Huang, V., Adey, M. and Leirer, V.O.“Development and Validation of a Screening Scale: A Preliminary Report.” Journal ofPsychiatric Research, 1983. 17: 37-49.
11. Mui, A. C. “Geriatric Depression Scale as a Community Screening Instrument forElderly Chinese Immigrants.” International Psychogeriatric. 1996b. 8: 445-458.
12. Fong, R. and Mokuau, N. “Not Simply ‘Asian Americans’: Periodical LiteratureReview on Asians and Pacific Islanders.” Social Work,1994. 39: 298-305.
13. Mui, A.C. and Domanski, M.D. “A Community Needs Assessment Among AsianAmerican Elders.” Journal of Cross-Cultural Gerontology, 1999. 14: 77-90.
14. Yesavage, J. A.; Brink, T. L.; Rose, T. L. Lum, O.; Huang, V.; Adey, M., and Leirer, V.O. “Development and Validation of a Screening Scale: A Preliminary Report.” Journalof Psychiatric Research, 1983. 17: 37-49.
ASIAN AMERICAN ELDERS IN NEW YORK CITY
ASIAN AMERICAN FEDERATION OF NEW YORK 46
Chapter 4: Informal and Formal
Social Supports Ada C. Mui, Ph.D., A.C.S.W.,1 and Peter S. Cross, M.S.W.
Significant Findings• The key building blocks in informal support networks for Asian American elders are
children residing the United States, neighbors whom they know well and other peo-ple to whom they feel close.
• Age is linked to significant differences in the size of the informal support system.Elders age 75 and older have more children living in New York City and nearby areas,while elders 65 – 74 have more neighbors whom they know well.
• Elders have an average of 2.6 children residing in the United States. The number ishighest among Vietnamese (3.9) and Chinese (3.1) elders, virtually identical amongFilipino, Indian and Korean elders (2.4), and only slightly lower for Japanese elders(2.1). Nearly half of all elders see their children daily.
• Elders have more neighbors and close friends than children for informal support. Onaverage, elders report having 3.4 close friends and 2.9 neighbors whom they knowwell.
• More than two-thirds of Asian American elders report having at least one person withwhom they feel close and can share confidences. Elders, especially men, have activebut limited reciprocal relationships with neighbors.
• Although intergenerational assistance is reciprocal, children provide more extensivehelp to their parents than vice versa. More than half of Asian American elders receivehelp from their children when someone is ill, with shopping or errands, driving, fix-ing things around the house, advice on money matters and direct financial assistance.Elders living with others are more likely to have the help of their children.
• Almost 60% of the people in the survey turn to the formal sector for two or more serv-ices annually. Social Security, Medicare and Medicaid, senior centers and religiousleaders are the services that they report using most frequently. The highest use is byindividuals who are in poor health and speak English or live in households where atleast one member knows the language.
ASIAN AMERICAN ELDERS IN NEW YORK CITY
ASIAN AMERICAN FEDERATION OF NEW YORK 47
1 Ada Mui is grateful to Suk-Young Kang,Margaret Dietz Domanski and Li-MeiChen for their valuable assistance on ear-lier drafts of this report.
• The vast majority of Asian American elders have a regular source of medical care, typ-ically from a doctor practicing Western-style medicine. Almost half of the peoplereport seeing their doctor five or more times during the year, and more than 40%spent one to 10 days sick in bed.
• Sources of health insurance are Medicare (51%), Medicaid (41%) and HealthMaintenance Organizations (24%).
• Despite help from family, friends, and the public sector, elders identify many unmetneeds. Most needed in terms of formal services are services from Social Security,Medicaid and Medicare, and legal services. Among supportive services, there are gapsin language translation services, someone to call or visit, and help with entitlementsand language translation services. The vast majority of people surveyed indicated thatthey need more help with Activities of Daily Living(ADLs).2
ASIAN AMERICAN ELDERS IN NEW YORK CITY
ASIAN AMERICAN FEDERATION OF NEW YORK 48
2 Activities of Daily Living (ADLs) includebathing, dressing, grooming, transfer-ring, toileting and feeding.
IntroductionThis chapter focuses on Asian American elders’ social support networks, inter-genera-tional exchange, and the use of formal support services. It also addresses psycho-socialquality of life issues as these relate to availability of back-up support, perceived unmetneeds and level of exchange between elders and adult children.
The information is covered in the following five sections: Section 1 Structure of Informal Support Networks Section 2 Interaction within Informal Support NetworksSection 3 Intergenerational AssistanceSection 4 Use of Formal Services Section 5 Need for Additional Help
Section 4.1: Structure of Informal Support NetworksSocial networks are structural configurations of the relationships among people. Socialsupport is a resource provided by social network relationships [1]. Support, both formaland informal, is a result of these relationships. Social support plays an important role inbuffering the stresses of daily life for elders in general and for immigrant elders in par-ticular. As a result, understanding the scope and variety of social support resources andsocial networks is a critical element for setting social service policy and planning pro-grams.
To outline the dimensions of informal social support among Asian American elders inNew York City, questions were posed concerning the amount of contact elders reportedwith a network of informal social support resources. These resources included theelder’s children, grandchildren, siblings, other relatives, neighbors and close friends.
Size of Informal Support NetworksAs Figure 4.1 shows, the three main sources of informal social support for elders werechildren residing in the United States, well-known neighbors, and other people to whomthey felt close.
There were no statistically significant differences in the size of the social supportresources based on gender. For example, the same proportion of men and women report-ed having two children who lived within a two-hour radius from New York City whilethe men reported only slightly more children living in the United States than did thewomen.
ASIAN AMERICAN ELDERS IN NEW YORK CITY
ASIAN AMERICAN FEDERATION OF NEW YORK 49
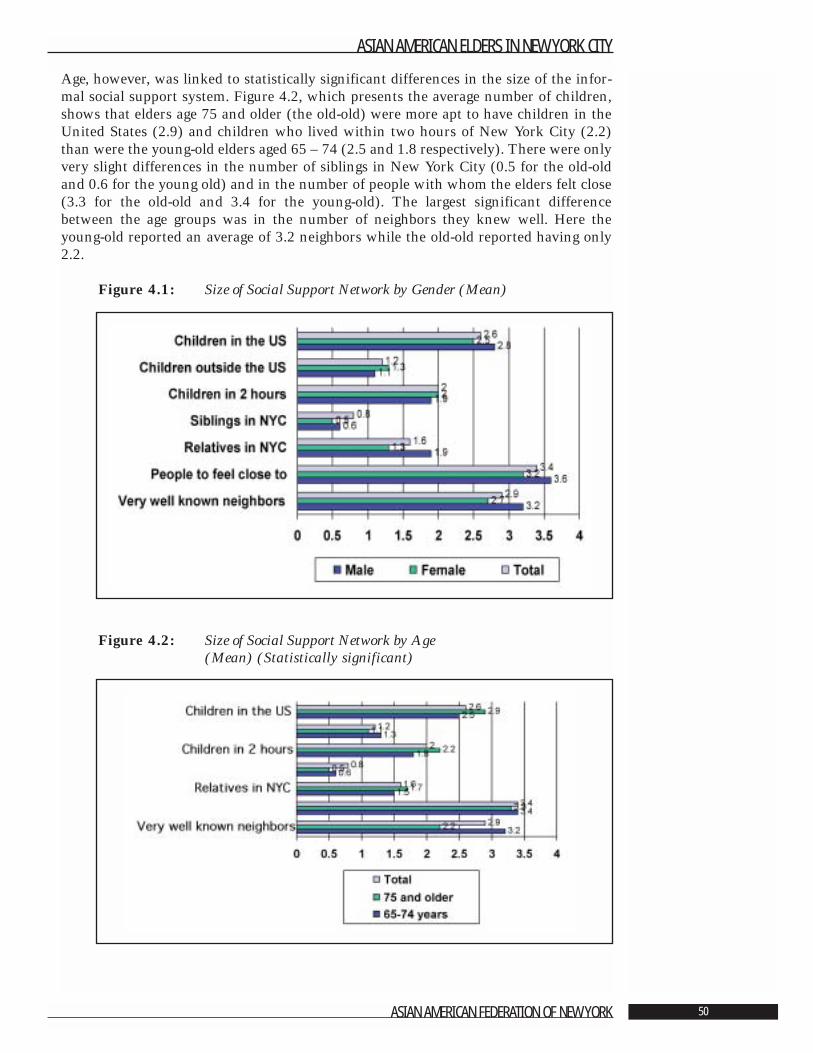
Age, however, was linked to statistically significant differences in the size of the infor-mal social support system. Figure 4.2, which presents the average number of children,shows that elders age 75 and older (the old-old) were more apt to have children in theUnited States (2.9) and children who lived within two hours of New York City (2.2)than were the young-old elders aged 65 – 74 (2.5 and 1.8 respectively). There were onlyvery slight differences in the number of siblings in New York City (0.5 for the old-oldand 0.6 for the young old) and in the number of people with whom the elders felt close(3.3 for the old-old and 3.4 for the young-old). The largest significant differencebetween the age groups was in the number of neighbors they knew well. Here theyoung-old reported an average of 3.2 neighbors while the old-old reported having only2.2.
Figure 4.1: Size of Social Support Network by Gender (Mean)
Figure 4.2: Size of Social Support Network by Age (Mean) (Statistically significant)
ASIAN AMERICAN ELDERS IN NEW YORK CITY
ASIAN AMERICAN FEDERATION OF NEW YORK 50
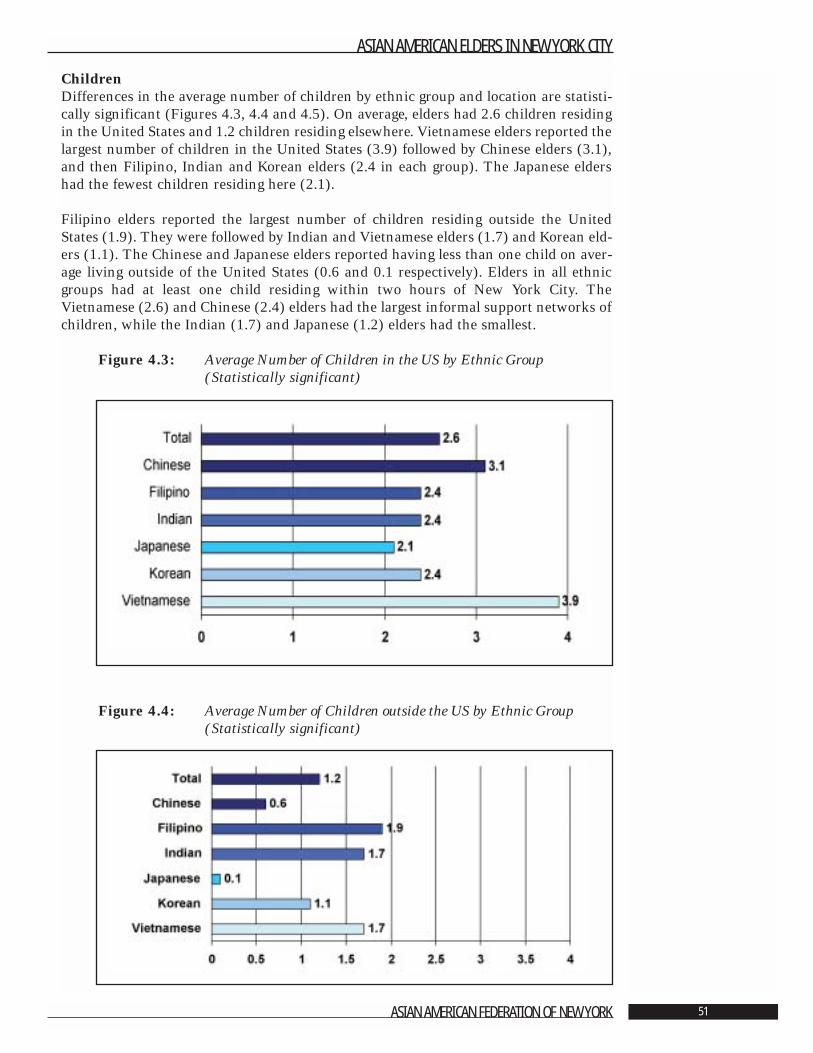
ChildrenDifferences in the average number of children by ethnic group and location are statisti-cally significant (Figures 4.3, 4.4 and 4.5). On average, elders had 2.6 children residingin the United States and 1.2 children residing elsewhere. Vietnamese elders reported thelargest number of children in the United States (3.9) followed by Chinese elders (3.1),and then Filipino, Indian and Korean elders (2.4 in each group). The Japanese eldershad the fewest children residing here (2.1).
Filipino elders reported the largest number of children residing outside the UnitedStates (1.9). They were followed by Indian and Vietnamese elders (1.7) and Korean eld-ers (1.1). The Chinese and Japanese elders reported having less than one child on aver-age living outside of the United States (0.6 and 0.1 respectively). Elders in all ethnicgroups had at least one child residing within two hours of New York City. TheVietnamese (2.6) and Chinese (2.4) elders had the largest informal support networks ofchildren, while the Indian (1.7) and Japanese (1.2) elders had the smallest.
Figure 4.3: Average Number of Children in the US by Ethnic Group(Statistically significant)
Figure 4.4: Average Number of Children outside the US by Ethnic Group (Statistically significant)
ASIAN AMERICAN ELDERS IN NEW YORK CITY
ASIAN AMERICAN FEDERATION OF NEW YORK 51
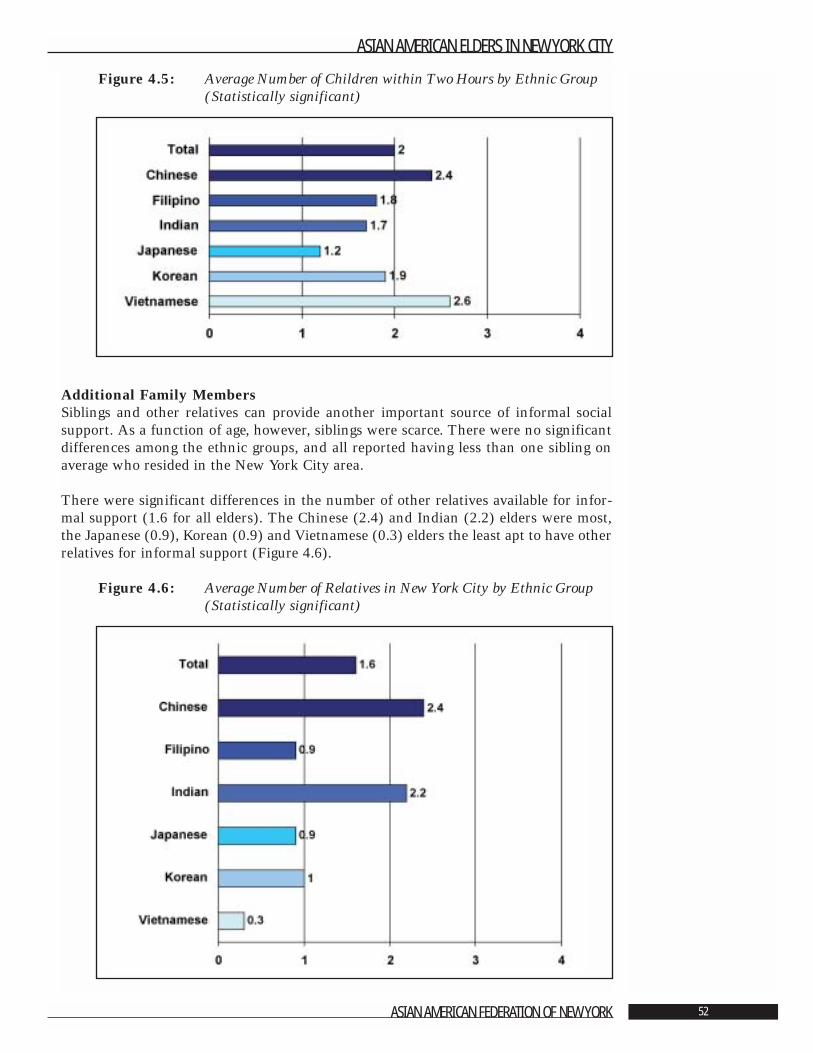
Figure 4.5: Average Number of Children within Two Hours by Ethnic Group (Statistically significant)
Additional Family MembersSiblings and other relatives can provide another important source of informal socialsupport. As a function of age, however, siblings were scarce. There were no significantdifferences among the ethnic groups, and all reported having less than one sibling onaverage who resided in the New York City area.
There were significant differences in the number of other relatives available for infor-mal support (1.6 for all elders). The Chinese (2.4) and Indian (2.2) elders were most,the Japanese (0.9), Korean (0.9) and Vietnamese (0.3) elders the least apt to have otherrelatives for informal support (Figure 4.6).
Figure 4.6: Average Number of Relatives in New York City by Ethnic Group (Statistically significant)
ASIAN AMERICAN ELDERS IN NEW YORK CITY
ASIAN AMERICAN FEDERATION OF NEW YORK 52
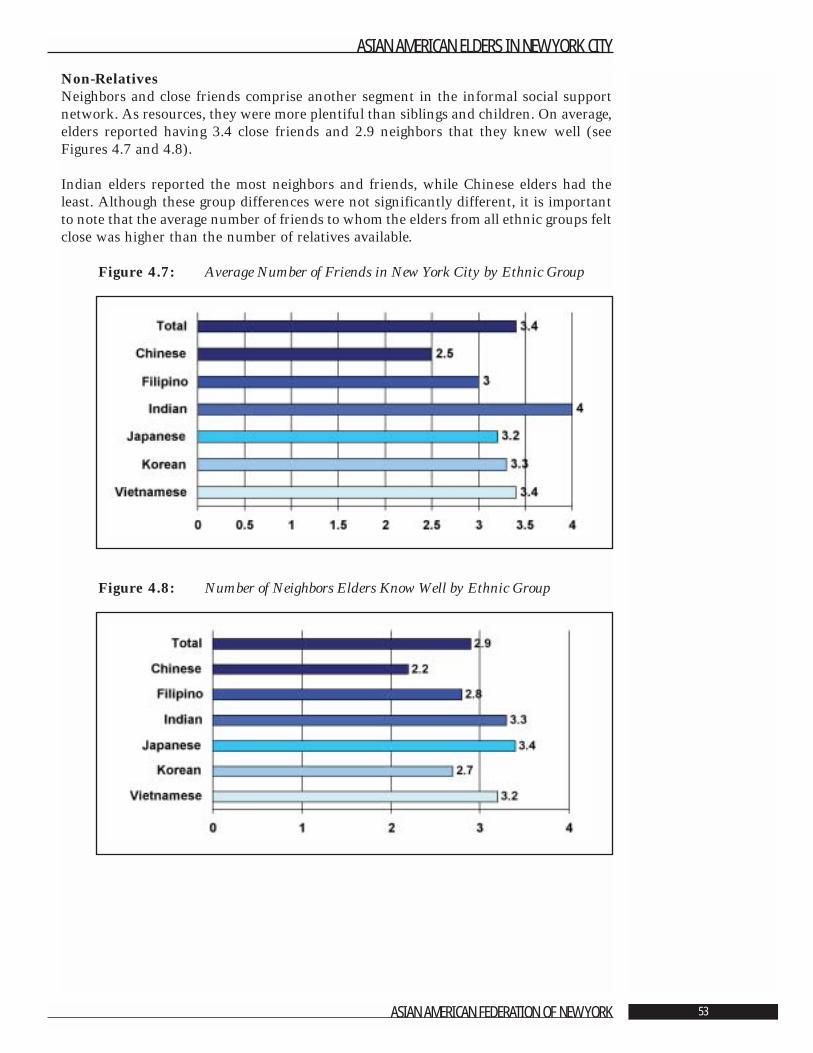
Non-Relatives Neighbors and close friends comprise another segment in the informal social supportnetwork. As resources, they were more plentiful than siblings and children. On average,elders reported having 3.4 close friends and 2.9 neighbors that they knew well (seeFigures 4.7 and 4.8).
Indian elders reported the most neighbors and friends, while Chinese elders had theleast. Although these group differences were not significantly different, it is importantto note that the average number of friends to whom the elders from all ethnic groups feltclose was higher than the number of relatives available.
Figure 4.7: Average Number of Friends in New York City by Ethnic Group
Figure 4.8: Number of Neighbors Elders Know Well by Ethnic Group
ASIAN AMERICAN ELDERS IN NEW YORK CITY
ASIAN AMERICAN FEDERATION OF NEW YORK 53
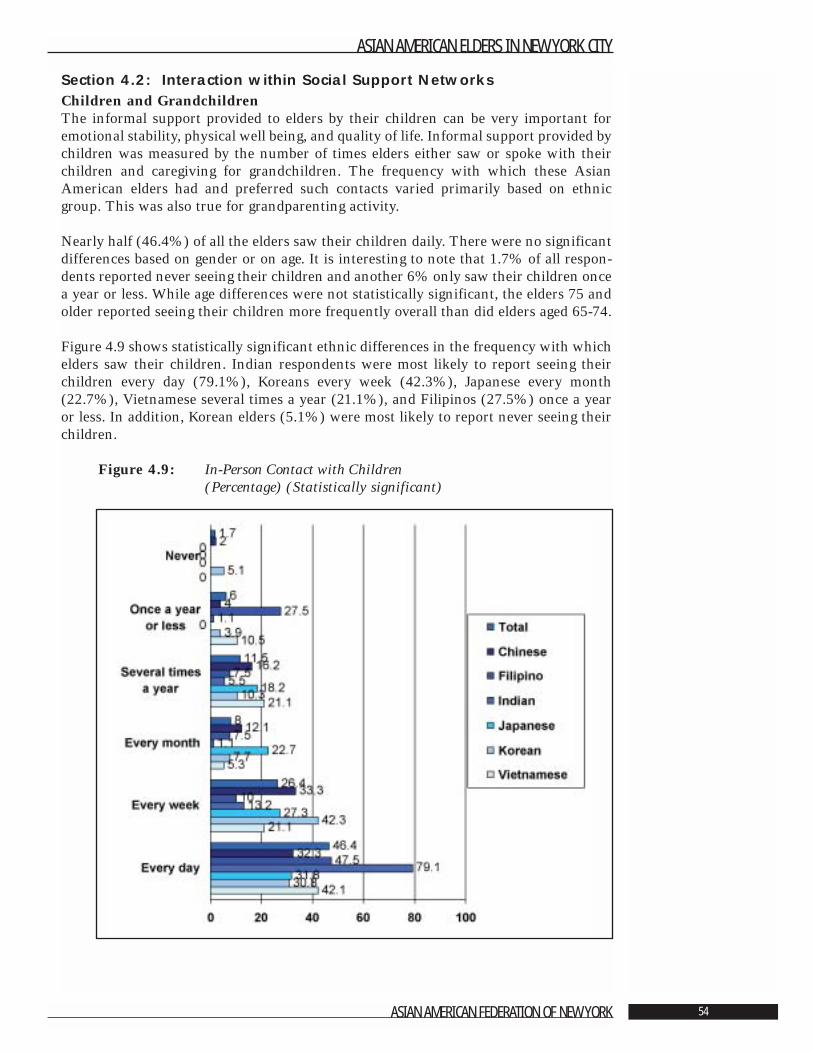
Section 4.2: Interaction within Social Support NetworksChildren and GrandchildrenThe informal support provided to elders by their children can be very important foremotional stability, physical well being, and quality of life. Informal support provided bychildren was measured by the number of times elders either saw or spoke with theirchildren and caregiving for grandchildren. The frequency with which these AsianAmerican elders had and preferred such contacts varied primarily based on ethnicgroup. This was also true for grandparenting activity.
Nearly half (46.4%) of all the elders saw their children daily. There were no significantdifferences based on gender or on age. It is interesting to note that 1.7% of all respon-dents reported never seeing their children and another 6% only saw their children oncea year or less. While age differences were not statistically significant, the elders 75 andolder reported seeing their children more frequently overall than did elders aged 65-74.
Figure 4.9 shows statistically significant ethnic differences in the frequency with whichelders saw their children. Indian respondents were most likely to report seeing theirchildren every day (79.1%), Koreans every week (42.3%), Japanese every month(22.7%), Vietnamese several times a year (21.1%), and Filipinos (27.5%) once a yearor less. In addition, Korean elders (5.1%) were most likely to report never seeing theirchildren.
Figure 4.9: In-Person Contact with Children(Percentage) (Statistically significant)
ASIAN AMERICAN ELDERS IN NEW YORK CITY
ASIAN AMERICAN FEDERATION OF NEW YORK 54
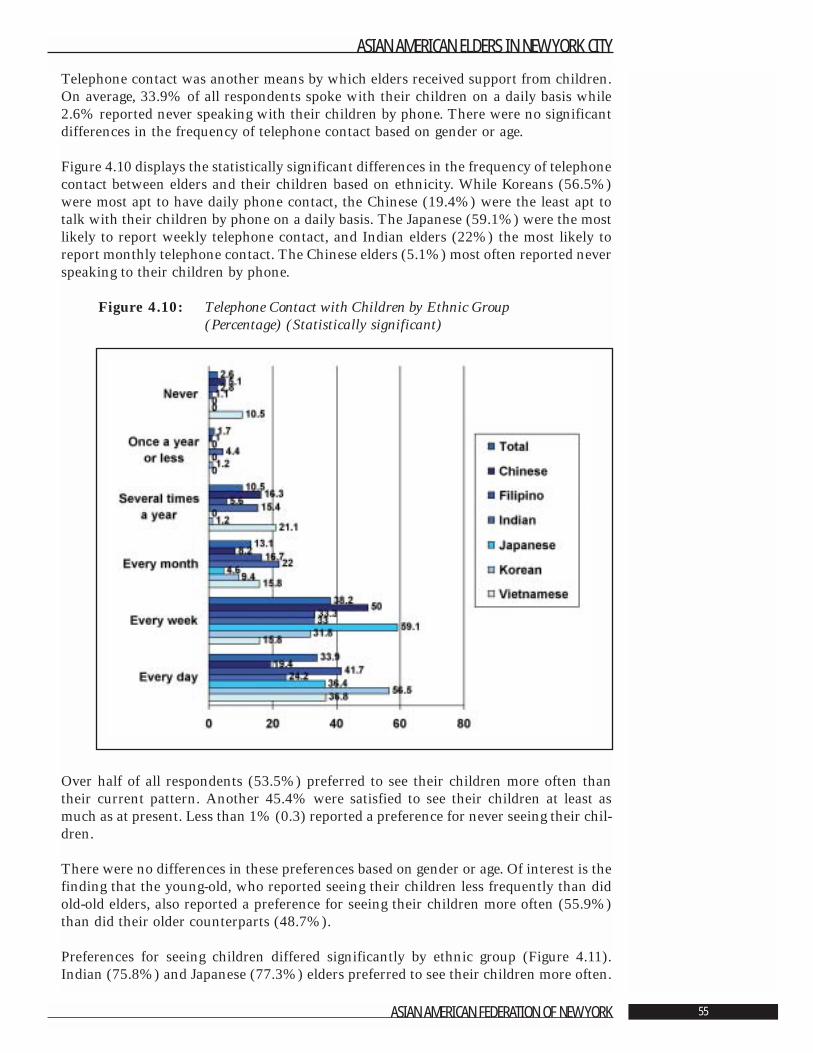
Telephone contact was another means by which elders received support from children.On average, 33.9% of all respondents spoke with their children on a daily basis while2.6% reported never speaking with their children by phone. There were no significantdifferences in the frequency of telephone contact based on gender or age.
Figure 4.10 displays the statistically significant differences in the frequency of telephonecontact between elders and their children based on ethnicity. While Koreans (56.5%)were most apt to have daily phone contact, the Chinese (19.4%) were the least apt totalk with their children by phone on a daily basis. The Japanese (59.1%) were the mostlikely to report weekly telephone contact, and Indian elders (22%) the most likely toreport monthly telephone contact. The Chinese elders (5.1%) most often reported neverspeaking to their children by phone.
Figure 4.10: Telephone Contact with Children by Ethnic Group(Percentage) (Statistically significant)
Over half of all respondents (53.5%) preferred to see their children more often thantheir current pattern. Another 45.4% were satisfied to see their children at least asmuch as at present. Less than 1% (0.3) reported a preference for never seeing their chil-dren.
There were no differences in these preferences based on gender or age. Of interest is thefinding that the young-old, who reported seeing their children less frequently than didold-old elders, also reported a preference for seeing their children more often (55.9%)than did their older counterparts (48.7%).
Preferences for seeing children differed significantly by ethnic group (Figure 4.11).Indian (75.8%) and Japanese (77.3%) elders preferred to see their children more often.
ASIAN AMERICAN ELDERS IN NEW YORK CITY
ASIAN AMERICAN FEDERATION OF NEW YORK 55
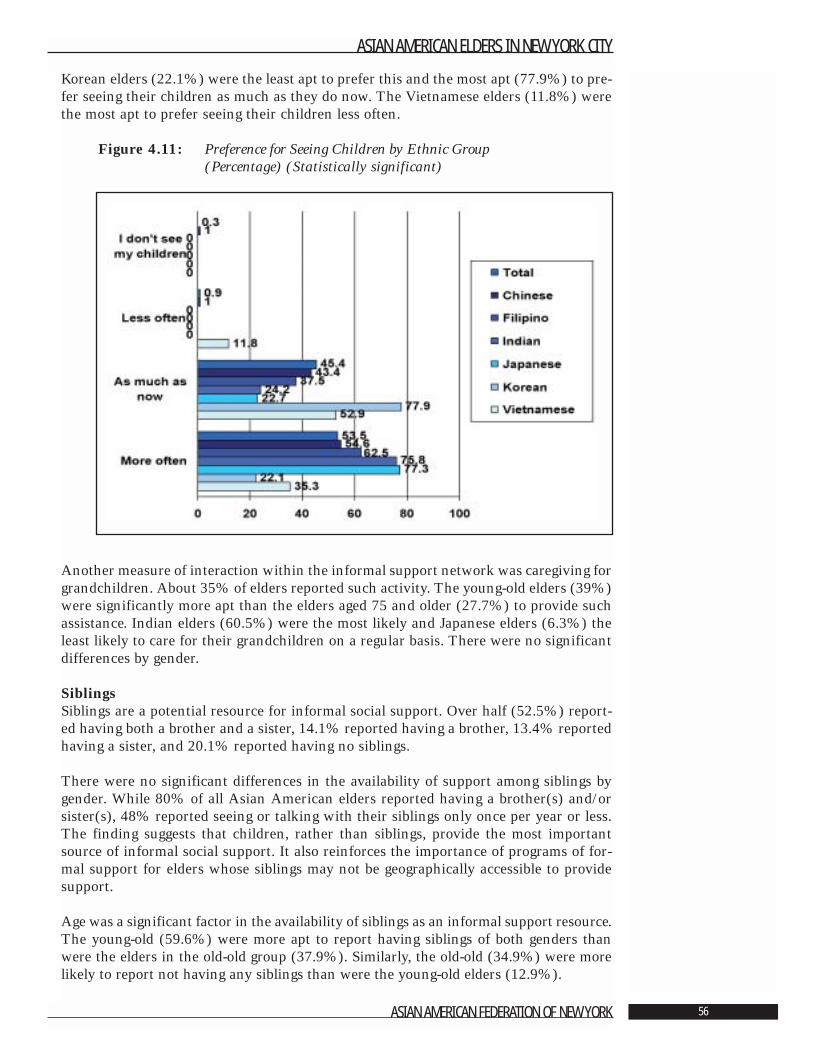
Korean elders (22.1%) were the least apt to prefer this and the most apt (77.9%) to pre-fer seeing their children as much as they do now. The Vietnamese elders (11.8%) werethe most apt to prefer seeing their children less often.
Figure 4.11: Preference for Seeing Children by Ethnic Group (Percentage) (Statistically significant)
Another measure of interaction within the informal support network was caregiving forgrandchildren. About 35% of elders reported such activity. The young-old elders (39%)were significantly more apt than the elders aged 75 and older (27.7%) to provide suchassistance. Indian elders (60.5%) were the most likely and Japanese elders (6.3%) theleast likely to care for their grandchildren on a regular basis. There were no significantdifferences by gender.
SiblingsSiblings are a potential resource for informal social support. Over half (52.5%) report-ed having both a brother and a sister, 14.1% reported having a brother, 13.4% reportedhaving a sister, and 20.1% reported having no siblings.
There were no significant differences in the availability of support among siblings bygender. While 80% of all Asian American elders reported having a brother(s) and/orsister(s), 48% reported seeing or talking with their siblings only once per year or less.The finding suggests that children, rather than siblings, provide the most importantsource of informal social support. It also reinforces the importance of programs of for-mal support for elders whose siblings may not be geographically accessible to providesupport.
Age was a significant factor in the availability of siblings as an informal support resource.The young-old (59.6%) were more apt to report having siblings of both genders thanwere the elders in the old-old group (37.9%). Similarly, the old-old (34.9%) were morelikely to report not having any siblings than were the young-old elders (12.9%).
ASIAN AMERICAN ELDERS IN NEW YORK CITY
ASIAN AMERICAN FEDERATION OF NEW YORK 56
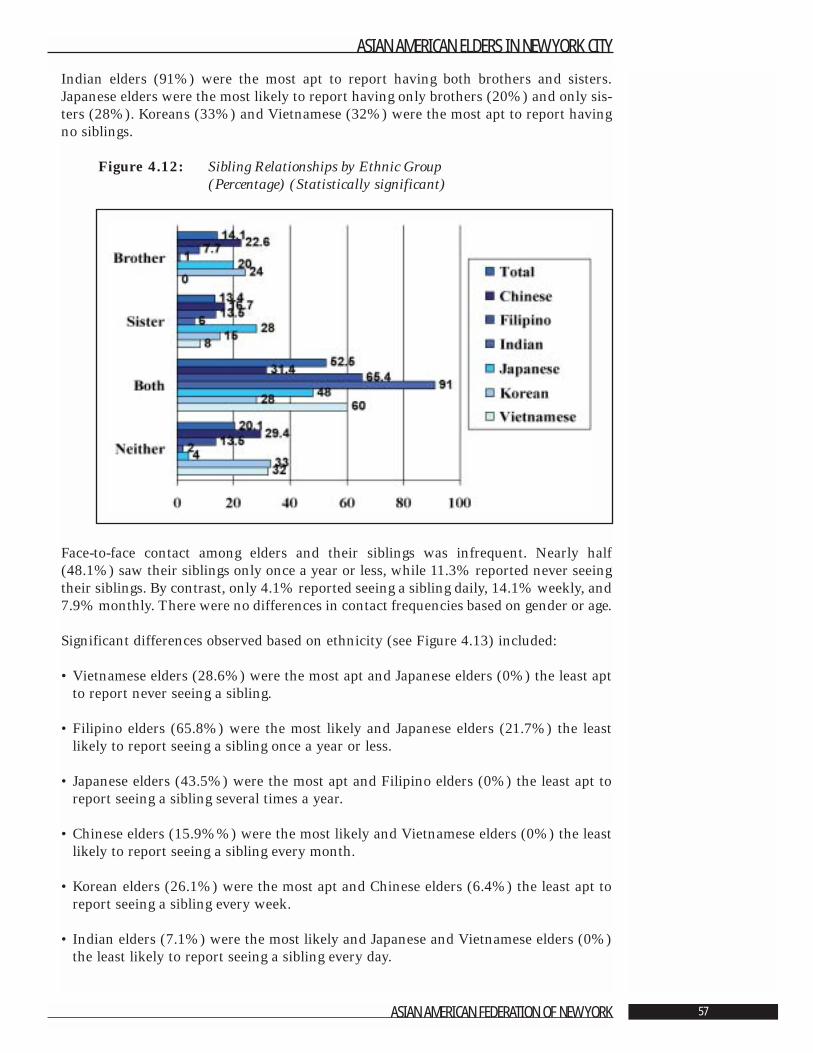
Indian elders (91%) were the most apt to report having both brothers and sisters.Japanese elders were the most likely to report having only brothers (20%) and only sis-ters (28%). Koreans (33%) and Vietnamese (32%) were the most apt to report havingno siblings.
Figure 4.12: Sibling Relationships by Ethnic Group(Percentage) (Statistically significant)
Face-to-face contact among elders and their siblings was infrequent. Nearly half(48.1%) saw their siblings only once a year or less, while 11.3% reported never seeingtheir siblings. By contrast, only 4.1% reported seeing a sibling daily, 14.1% weekly, and7.9% monthly. There were no differences in contact frequencies based on gender or age.
Significant differences observed based on ethnicity (see Figure 4.13) included:
• Vietnamese elders (28.6%) were the most apt and Japanese elders (0%) the least aptto report never seeing a sibling.
• Filipino elders (65.8%) were the most likely and Japanese elders (21.7%) the leastlikely to report seeing a sibling once a year or less.
• Japanese elders (43.5%) were the most apt and Filipino elders (0%) the least apt toreport seeing a sibling several times a year.
• Chinese elders (15.9%%) were the most likely and Vietnamese elders (0%) the leastlikely to report seeing a sibling every month.
• Korean elders (26.1%) were the most apt and Chinese elders (6.4%) the least apt toreport seeing a sibling every week.
• Indian elders (7.1%) were the most likely and Japanese and Vietnamese elders (0%)the least likely to report seeing a sibling every day.
ASIAN AMERICAN ELDERS IN NEW YORK CITY
ASIAN AMERICAN FEDERATION OF NEW YORK 57
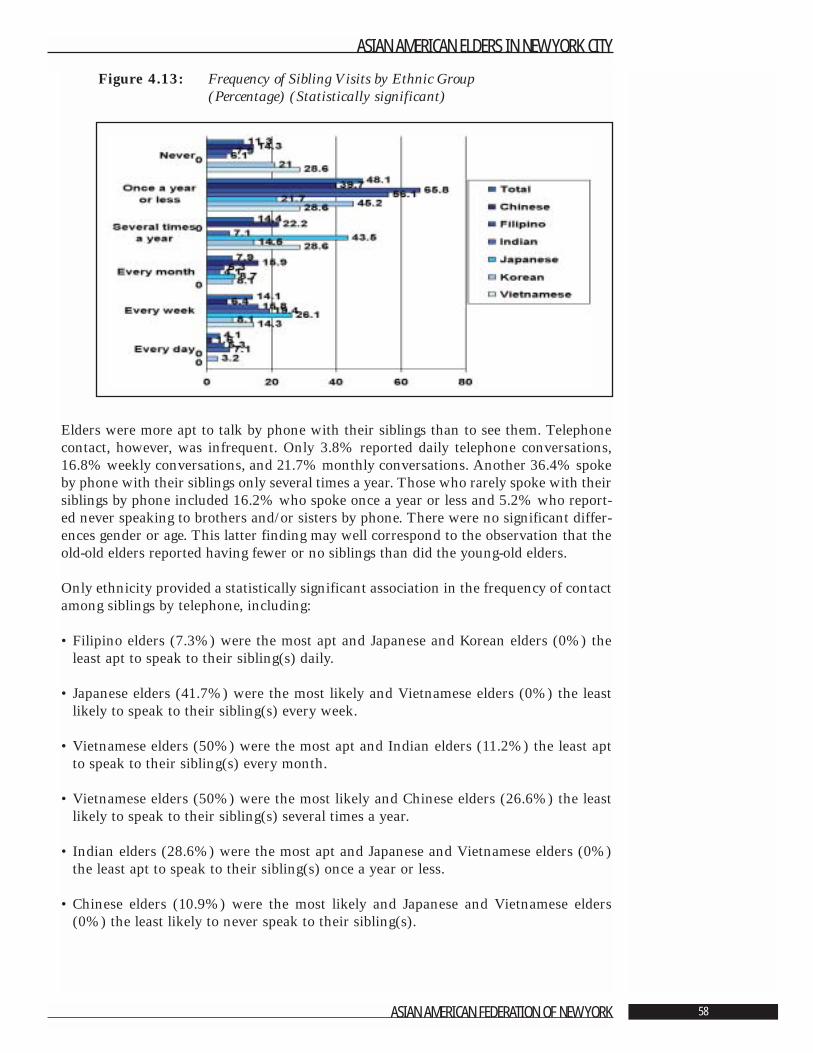
Figure 4.13: Frequency of Sibling Visits by Ethnic Group (Percentage) (Statistically significant)
Elders were more apt to talk by phone with their siblings than to see them. Telephonecontact, however, was infrequent. Only 3.8% reported daily telephone conversations,16.8% weekly conversations, and 21.7% monthly conversations. Another 36.4% spokeby phone with their siblings only several times a year. Those who rarely spoke with theirsiblings by phone included 16.2% who spoke once a year or less and 5.2% who report-ed never speaking to brothers and/or sisters by phone. There were no significant differ-ences gender or age. This latter finding may well correspond to the observation that theold-old elders reported having fewer or no siblings than did the young-old elders.
Only ethnicity provided a statistically significant association in the frequency of contactamong siblings by telephone, including:
• Filipino elders (7.3%) were the most apt and Japanese and Korean elders (0%) theleast apt to speak to their sibling(s) daily.
• Japanese elders (41.7%) were the most likely and Vietnamese elders (0%) the leastlikely to speak to their sibling(s) every week.
• Vietnamese elders (50%) were the most apt and Indian elders (11.2%) the least aptto speak to their sibling(s) every month.
• Vietnamese elders (50%) were the most likely and Chinese elders (26.6%) the leastlikely to speak to their sibling(s) several times a year.
• Indian elders (28.6%) were the most apt and Japanese and Vietnamese elders (0%)the least apt to speak to their sibling(s) once a year or less.
• Chinese elders (10.9%) were the most likely and Japanese and Vietnamese elders(0%) the least likely to never speak to their sibling(s).
ASIAN AMERICAN ELDERS IN NEW YORK CITY
ASIAN AMERICAN FEDERATION OF NEW YORK 58
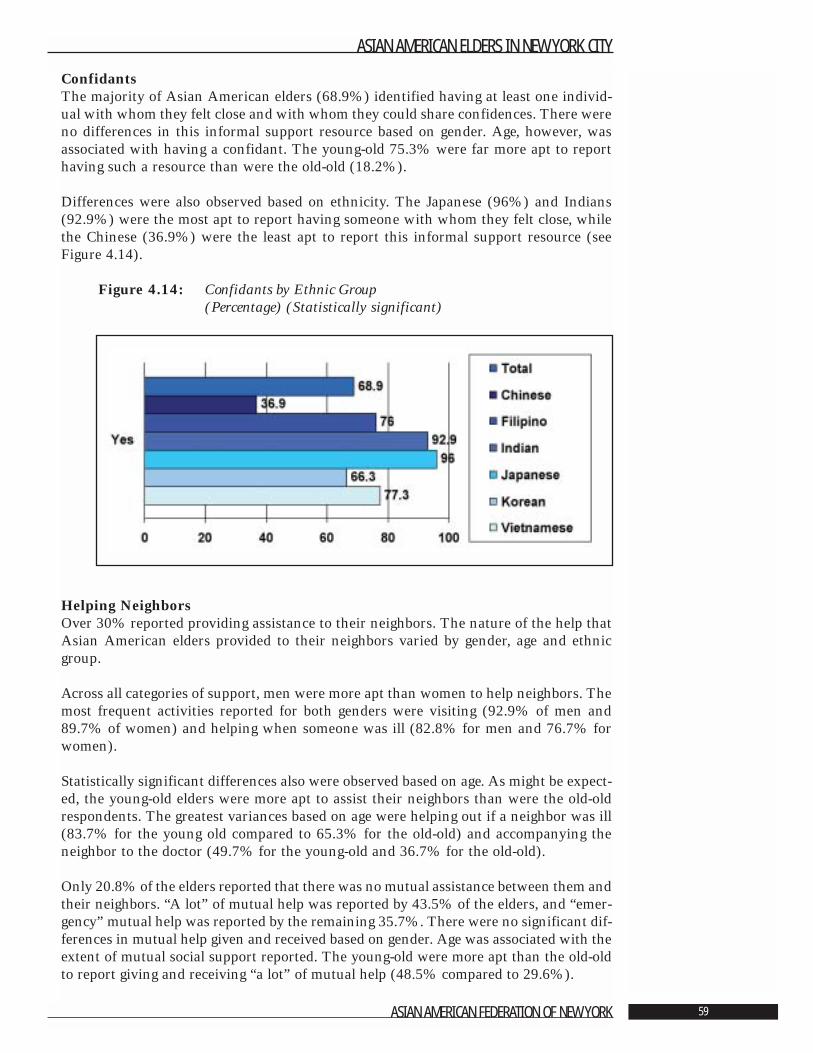
ConfidantsThe majority of Asian American elders (68.9%) identified having at least one individ-ual with whom they felt close and with whom they could share confidences. There wereno differences in this informal support resource based on gender. Age, however, wasassociated with having a confidant. The young-old 75.3% were far more apt to reporthaving such a resource than were the old-old (18.2%).
Differences were also observed based on ethnicity. The Japanese (96%) and Indians(92.9%) were the most apt to report having someone with whom they felt close, whilethe Chinese (36.9%) were the least apt to report this informal support resource (seeFigure 4.14).
Figure 4.14: Confidants by Ethnic Group (Percentage) (Statistically significant)
Helping NeighborsOver 30% reported providing assistance to their neighbors. The nature of the help thatAsian American elders provided to their neighbors varied by gender, age and ethnicgroup.
Across all categories of support, men were more apt than women to help neighbors. Themost frequent activities reported for both genders were visiting (92.9% of men and89.7% of women) and helping when someone was ill (82.8% for men and 76.7% forwomen).
Statistically significant differences also were observed based on age. As might be expect-ed, the young-old elders were more apt to assist their neighbors than were the old-oldrespondents. The greatest variances based on age were helping out if a neighbor was ill(83.7% for the young old compared to 65.3% for the old-old) and accompanying theneighbor to the doctor (49.7% for the young-old and 36.7% for the old-old).
Only 20.8% of the elders reported that there was no mutual assistance between them andtheir neighbors. “A lot” of mutual help was reported by 43.5% of the elders, and “emer-gency” mutual help was reported by the remaining 35.7%. There were no significant dif-ferences in mutual help given and received based on gender. Age was associated with theextent of mutual social support reported. The young-old were more apt than the old-oldto report giving and receiving “a lot” of mutual help (48.5% compared to 29.6%).
ASIAN AMERICAN ELDERS IN NEW YORK CITY
ASIAN AMERICAN FEDERATION OF NEW YORK 59
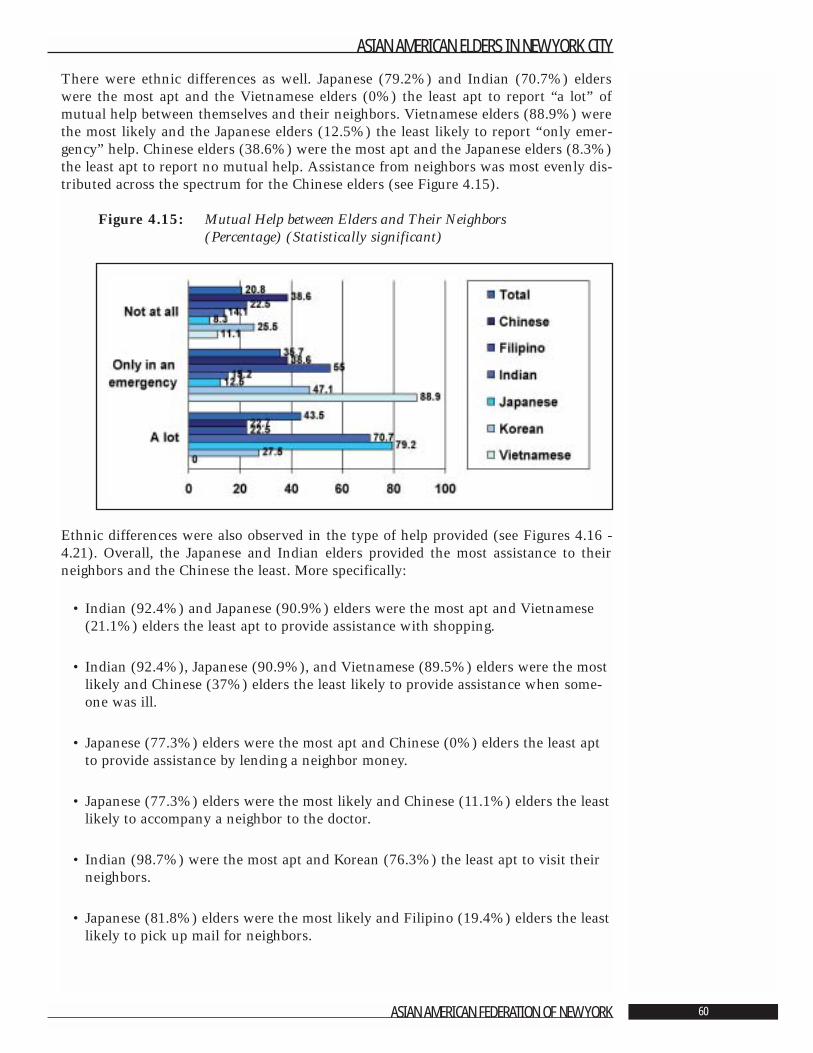
There were ethnic differences as well. Japanese (79.2%) and Indian (70.7%) elderswere the most apt and the Vietnamese elders (0%) the least apt to report “a lot” ofmutual help between themselves and their neighbors. Vietnamese elders (88.9%) werethe most likely and the Japanese elders (12.5%) the least likely to report “only emer-gency” help. Chinese elders (38.6%) were the most apt and the Japanese elders (8.3%)the least apt to report no mutual help. Assistance from neighbors was most evenly dis-tributed across the spectrum for the Chinese elders (see Figure 4.15).
Figure 4.15: Mutual Help between Elders and Their Neighbors (Percentage) (Statistically significant)
Ethnic differences were also observed in the type of help provided (see Figures 4.16 -4.21). Overall, the Japanese and Indian elders provided the most assistance to theirneighbors and the Chinese the least. More specifically:
• Indian (92.4%) and Japanese (90.9%) elders were the most apt and Vietnamese(21.1%) elders the least apt to provide assistance with shopping.
• Indian (92.4%), Japanese (90.9%), and Vietnamese (89.5%) elders were the mostlikely and Chinese (37%) elders the least likely to provide assistance when some-one was ill.
• Japanese (77.3%) elders were the most apt and Chinese (0%) elders the least aptto provide assistance by lending a neighbor money.
• Japanese (77.3%) elders were the most likely and Chinese (11.1%) elders the leastlikely to accompany a neighbor to the doctor.
• Indian (98.7%) were the most apt and Korean (76.3%) the least apt to visit theirneighbors.
• Japanese (81.8%) elders were the most likely and Filipino (19.4%) elders the leastlikely to pick up mail for neighbors.
ASIAN AMERICAN ELDERS IN NEW YORK CITY
ASIAN AMERICAN FEDERATION OF NEW YORK 60
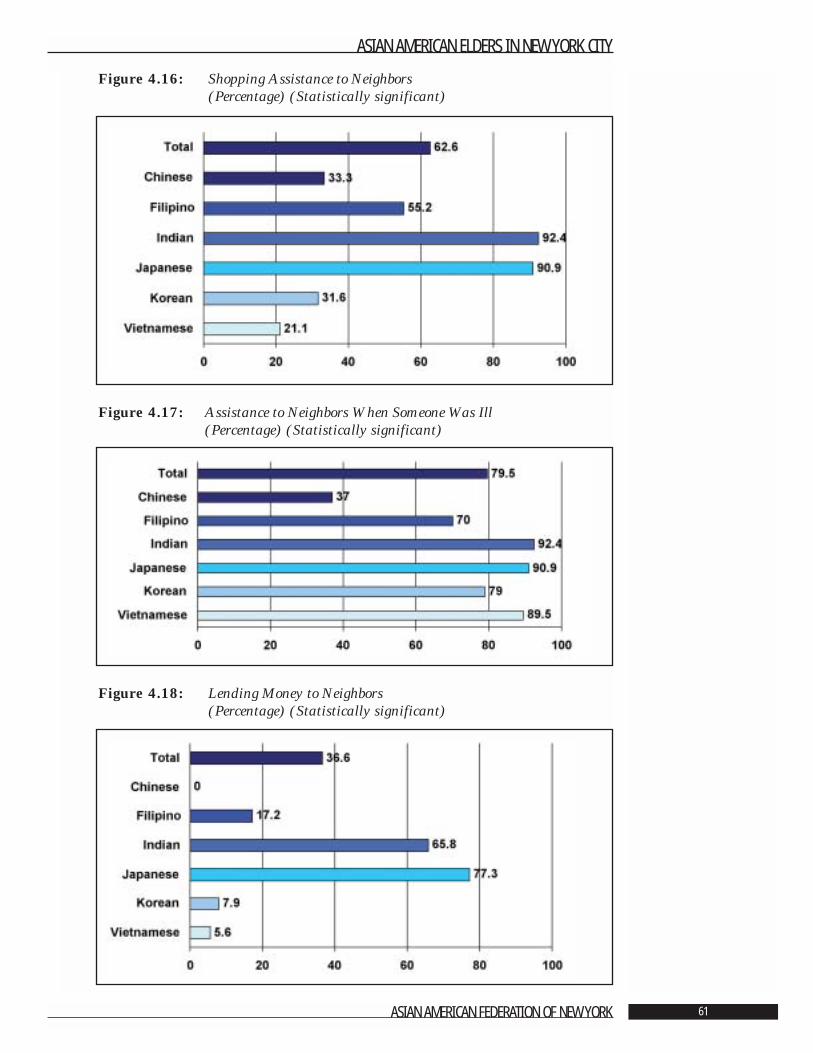
Figure 4.16: Shopping Assistance to Neighbors (Percentage) (Statistically significant)
Figure 4.17: Assistance to Neighbors When Someone Was Ill (Percentage) (Statistically significant)
Figure 4.18: Lending Money to Neighbors (Percentage) (Statistically significant)
ASIAN AMERICAN ELDERS IN NEW YORK CITY
ASIAN AMERICAN FEDERATION OF NEW YORK 61
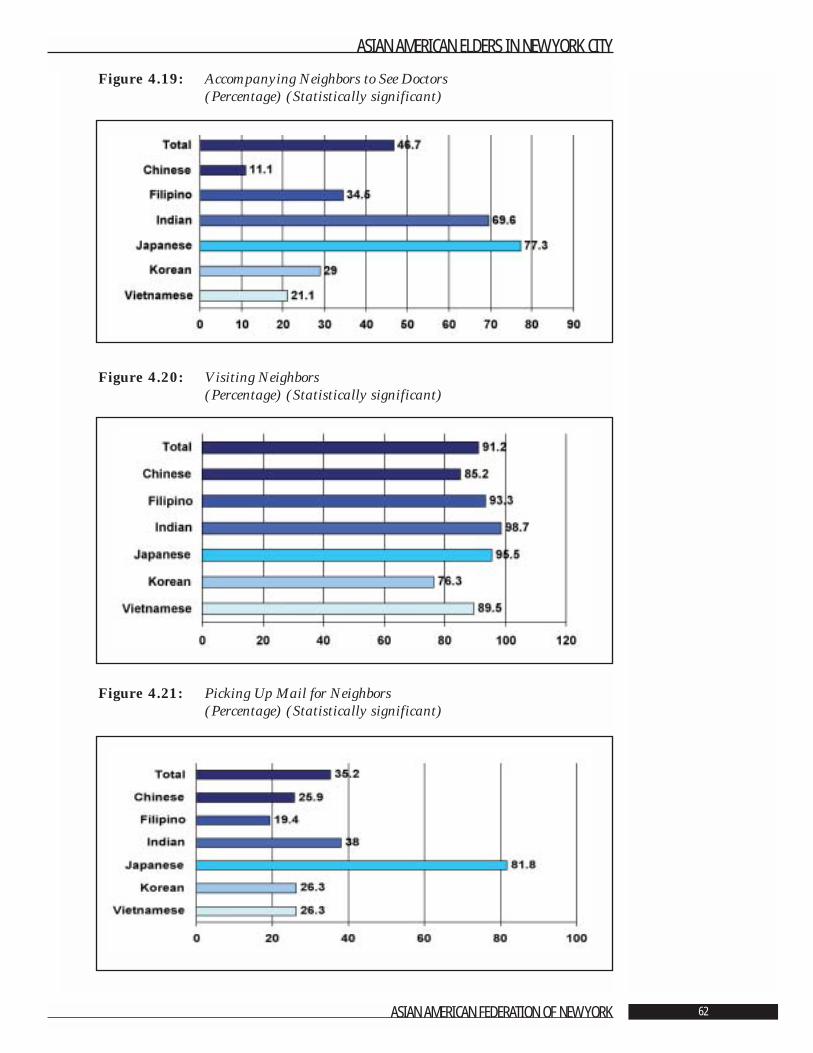
Figure 4.19: Accompanying Neighbors to See Doctors (Percentage) (Statistically significant)
Figure 4.20: Visiting Neighbors (Percentage) (Statistically significant)
Figure 4.21: Picking Up Mail for Neighbors (Percentage) (Statistically significant)
ASIAN AMERICAN ELDERS IN NEW YORK CITY
ASIAN AMERICAN FEDERATION OF NEW YORK 62
Section 4.3: Intergenerational AssistanceIn order to measure the amount of instrumental help that occurred between AsianAmerican elders and their children, questions were asked about assistance with keep-ing and fixing the household, financial assistance, shopping and homemaking tasks,helping someone is ill, and providing household management, monetary, or child rear-ing advice. Elders were asked if their children provided such assistance to them and ifthey provided such assistance to their children.
Parents Helping Their ChildrenElders reported assisting their children in six areas that are listed below in descendingorder of the frequency:
• 56.3% helped out their children when someone is ill.• 44.9% kept house for their children.• 41.6% shopped or ran errands for their children. • 39.1% give advice on running a home or bringing up a child.• 34.9% fixed things around the child’s house.• 22.7% helped their children with money.
There were statistically significant differences by gender in four areas of assistance pro-vided by elders to their children. Men were more apt than women to assist with shop-ping or running errands (49% compared to 35.7%), to fix things around the house(42.5% compared to 28.9%), and to assist their children with money (31% comparedto 16.2%). Men (32.9%) were less apt than women (44.1%) to give advice on runninga home and bringing up their grandchildren.
The type of assistance to children varied with the age of the parents. The younger eld-ers were more apt than the old-old to:
• Assist children when someone is ill (65.4% vs. 37.7%). • Keep house for their children (49.4% vs. 35.4%).• Shop or run errands (48.7% vs. 26.1%).• Fix things around the house (43.2% vs. 17.1%).• Help their children with money (28.6% vs. 9.8%).
In contrast, the young-old (31.2%) were less apt than the old-old (55.8%) to provideadvice on managing a household and rearing grandchildren (Figure 4.22).
ASIAN AMERICAN ELDERS IN NEW YORK CITY
ASIAN AMERICAN FEDERATION OF NEW YORK 63
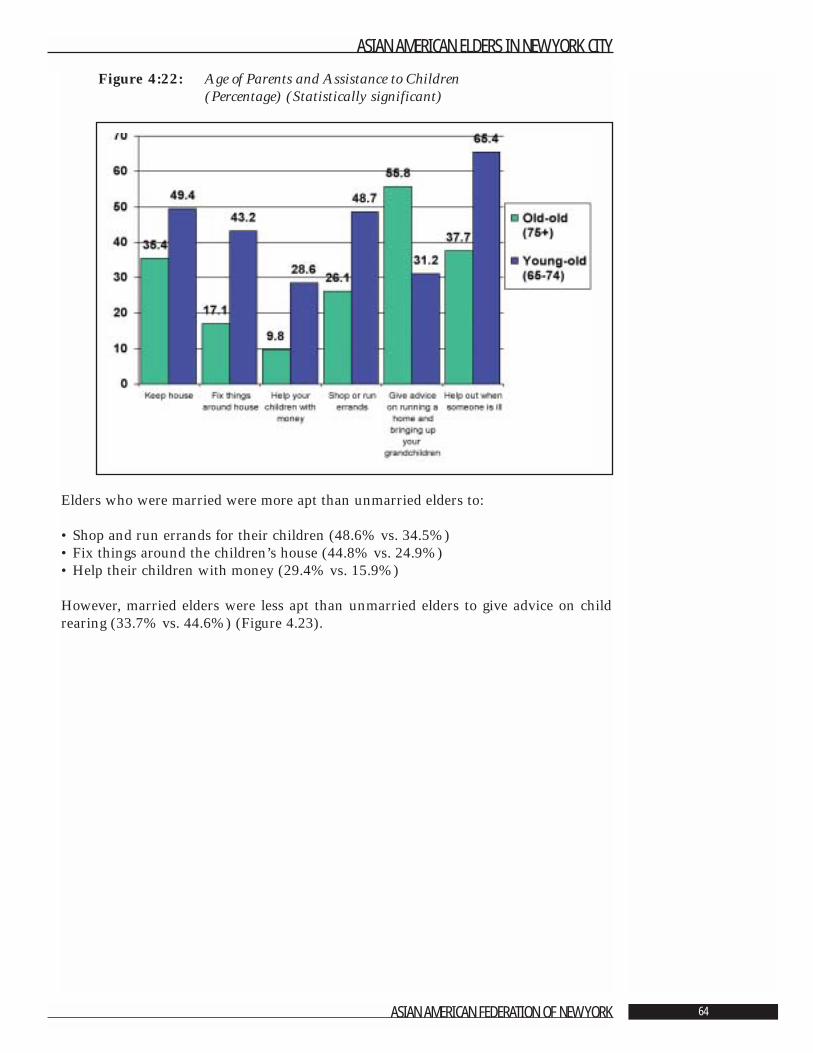
Figure 4:22: Age of Parents and Assistance to Children (Percentage) (Statistically significant)
Elders who were married were more apt than unmarried elders to:
• Shop and run errands for their children (48.6% vs. 34.5%)• Fix things around the children’s house (44.8% vs. 24.9%)• Help their children with money (29.4% vs. 15.9%)
However, married elders were less apt than unmarried elders to give advice on childrearing (33.7% vs. 44.6%) (Figure 4.23).
ASIAN AMERICAN ELDERS IN NEW YORK CITY
ASIAN AMERICAN FEDERATION OF NEW YORK 64
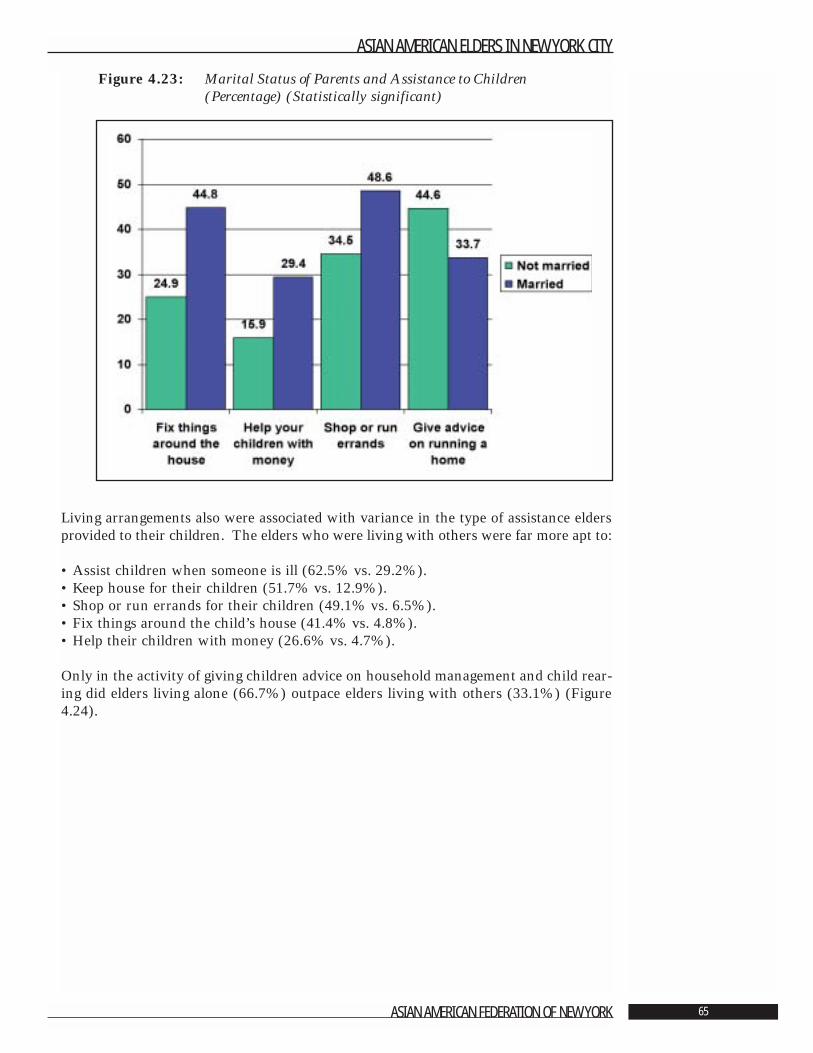
Figure 4.23: Marital Status of Parents and Assistance to Children (Percentage) (Statistically significant)
Living arrangements also were associated with variance in the type of assistance eldersprovided to their children. The elders who were living with others were far more apt to:
• Assist children when someone is ill (62.5% vs. 29.2%). • Keep house for their children (51.7% vs. 12.9%).• Shop or run errands for their children (49.1% vs. 6.5%). • Fix things around the child’s house (41.4% vs. 4.8%).• Help their children with money (26.6% vs. 4.7%).
Only in the activity of giving children advice on household management and child rear-ing did elders living alone (66.7%) outpace elders living with others (33.1%) (Figure4.24).
ASIAN AMERICAN ELDERS IN NEW YORK CITY
ASIAN AMERICAN FEDERATION OF NEW YORK 65
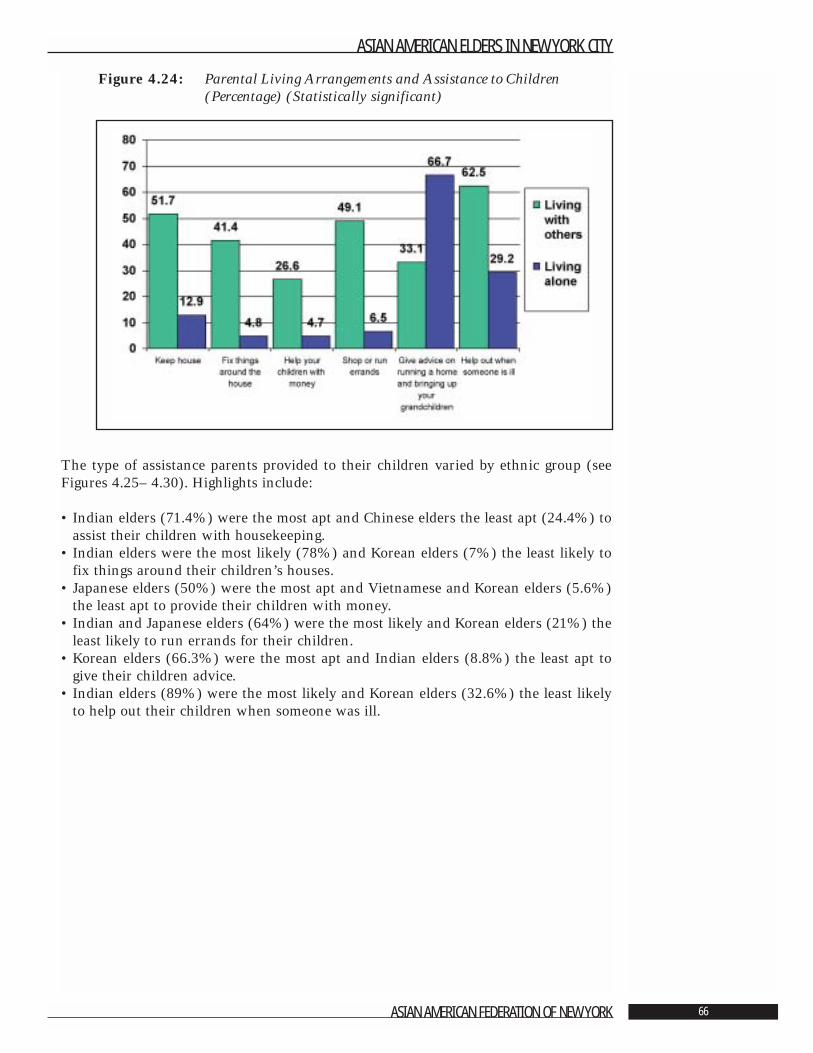
Figure 4.24: Parental Living Arrangements and Assistance to Children (Percentage) (Statistically significant)
The type of assistance parents provided to their children varied by ethnic group (seeFigures 4.25– 4.30). Highlights include:
• Indian elders (71.4%) were the most apt and Chinese elders the least apt (24.4%) toassist their children with housekeeping.
• Indian elders were the most likely (78%) and Korean elders (7%) the least likely tofix things around their children’s houses.
• Japanese elders (50%) were the most apt and Vietnamese and Korean elders (5.6%)the least apt to provide their children with money.
• Indian and Japanese elders (64%) were the most likely and Korean elders (21%) theleast likely to run errands for their children.
• Korean elders (66.3%) were the most apt and Indian elders (8.8%) the least apt togive their children advice.
• Indian elders (89%) were the most likely and Korean elders (32.6%) the least likelyto help out their children when someone was ill.
ASIAN AMERICAN ELDERS IN NEW YORK CITY
ASIAN AMERICAN FEDERATION OF NEW YORK 66
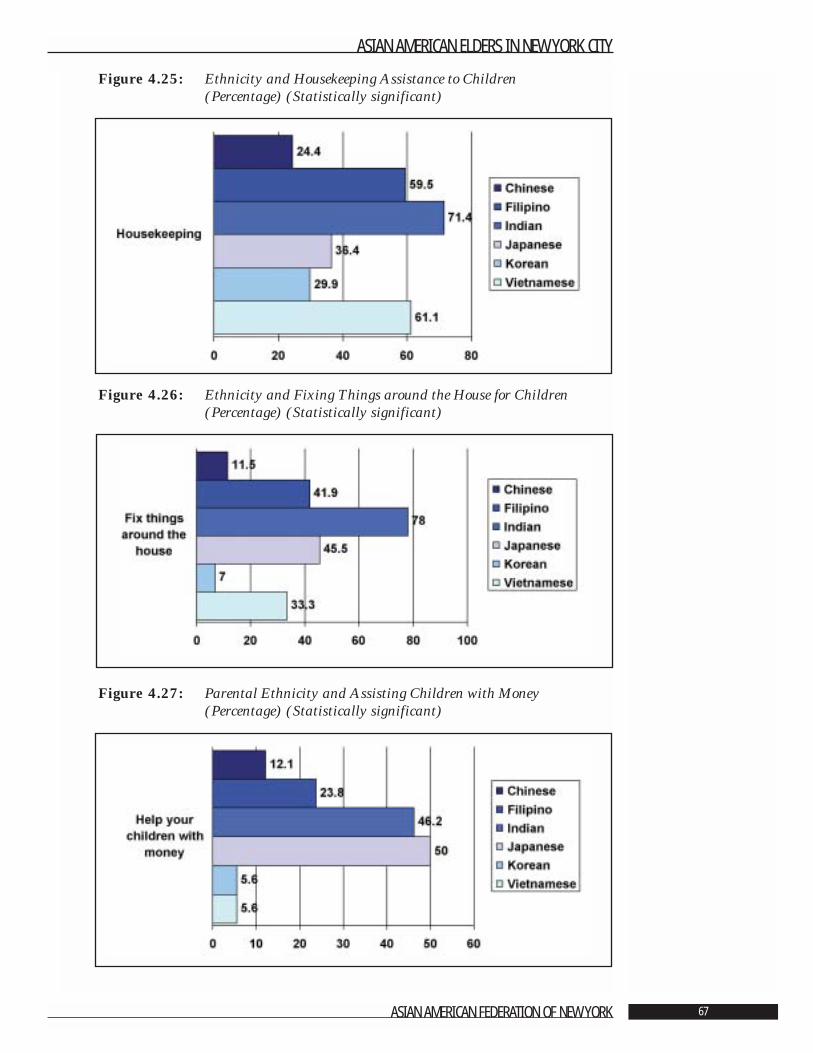
Figure 4.25: Ethnicity and Housekeeping Assistance to Children (Percentage) (Statistically significant)
Figure 4.26: Ethnicity and Fixing Things around the House for Children(Percentage) (Statistically significant)
Figure 4.27: Parental Ethnicity and Assisting Children with Money (Percentage) (Statistically significant)
ASIAN AMERICAN ELDERS IN NEW YORK CITY
ASIAN AMERICAN FEDERATION OF NEW YORK 67
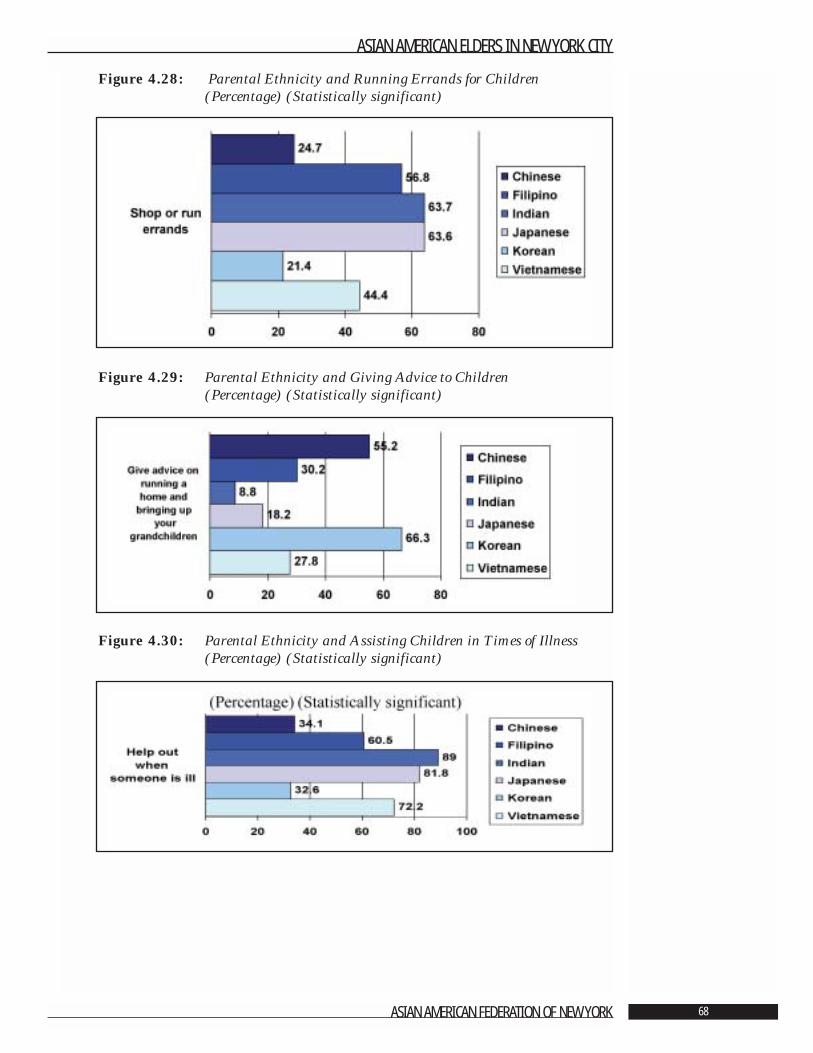
Figure 4.28: Parental Ethnicity and Running Errands for Children(Percentage) (Statistically significant)
Figure 4.29: Parental Ethnicity and Giving Advice to Children(Percentage) (Statistically significant)
Figure 4.30: Parental Ethnicity and Assisting Children in Times of Illness (Percentage) (Statistically significant)
ASIAN AMERICAN ELDERS IN NEW YORK CITY
ASIAN AMERICAN FEDERATION OF NEW YORK 68
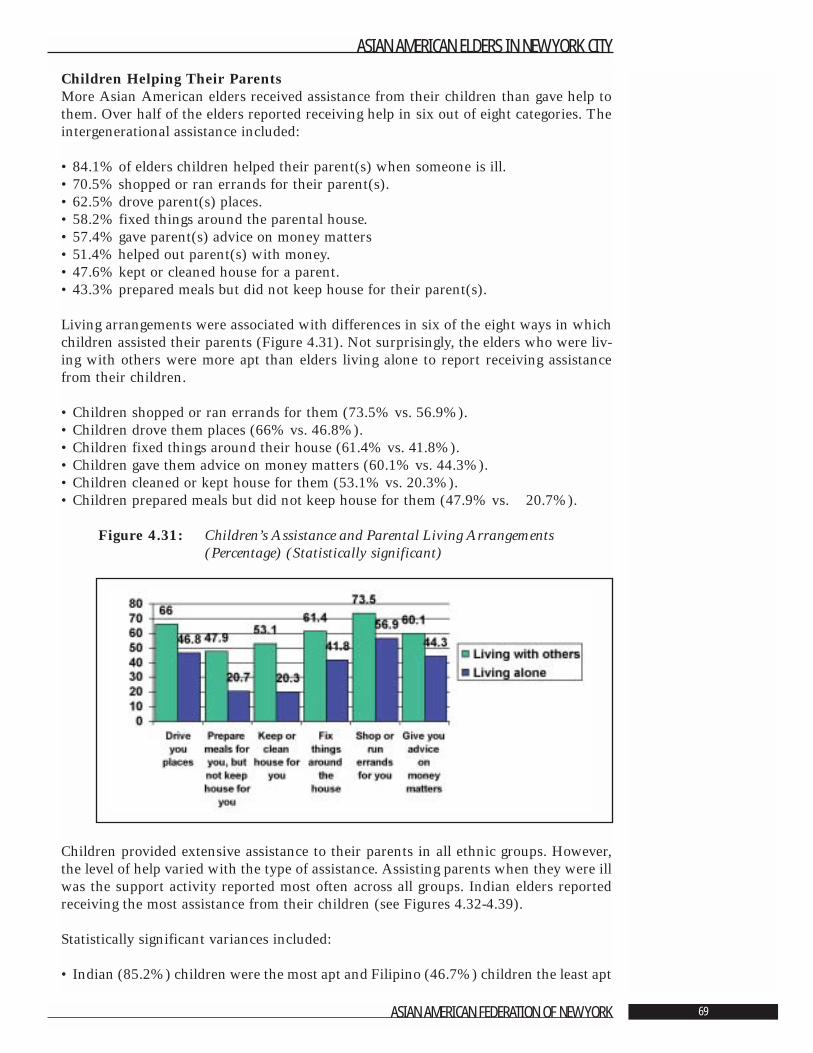
Children Helping Their ParentsMore Asian American elders received assistance from their children than gave help tothem. Over half of the elders reported receiving help in six out of eight categories. Theintergenerational assistance included:
• 84.1% of elders children helped their parent(s) when someone is ill.• 70.5% shopped or ran errands for their parent(s).• 62.5% drove parent(s) places.• 58.2% fixed things around the parental house.• 57.4% gave parent(s) advice on money matters• 51.4% helped out parent(s) with money.• 47.6% kept or cleaned house for a parent.• 43.3% prepared meals but did not keep house for their parent(s).
Living arrangements were associated with differences in six of the eight ways in whichchildren assisted their parents (Figure 4.31). Not surprisingly, the elders who were liv-ing with others were more apt than elders living alone to report receiving assistancefrom their children.
• Children shopped or ran errands for them (73.5% vs. 56.9%).• Children drove them places (66% vs. 46.8%).• Children fixed things around their house (61.4% vs. 41.8%).• Children gave them advice on money matters (60.1% vs. 44.3%).• Children cleaned or kept house for them (53.1% vs. 20.3%).• Children prepared meals but did not keep house for them (47.9% vs. 20.7%).
Figure 4.31: Children’s Assistance and Parental Living Arrangements (Percentage) (Statistically significant)
Children provided extensive assistance to their parents in all ethnic groups. However,the level of help varied with the type of assistance. Assisting parents when they were illwas the support activity reported most often across all groups. Indian elders reportedreceiving the most assistance from their children (see Figures 4.32-4.39).
Statistically significant variances included:
• Indian (85.2%) children were the most apt and Filipino (46.7%) children the least apt
ASIAN AMERICAN ELDERS IN NEW YORK CITY
ASIAN AMERICAN FEDERATION OF NEW YORK 69
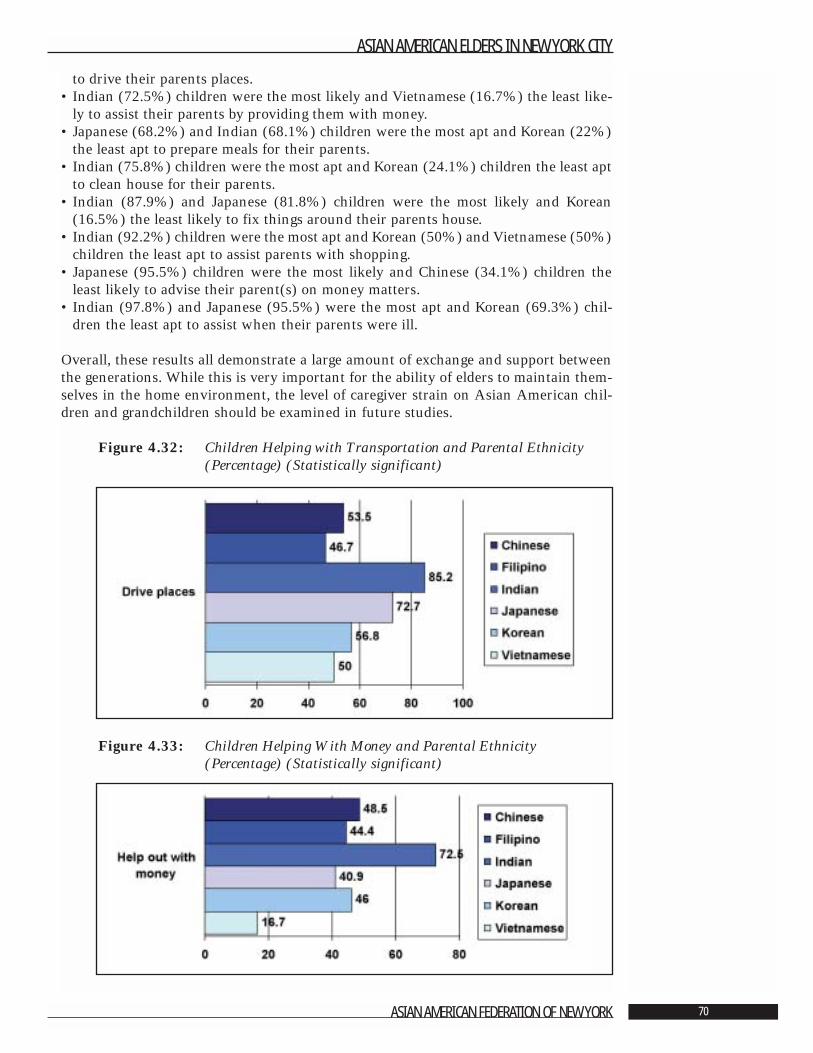
to drive their parents places.• Indian (72.5%) children were the most likely and Vietnamese (16.7%) the least like-
ly to assist their parents by providing them with money.• Japanese (68.2%) and Indian (68.1%) children were the most apt and Korean (22%)
the least apt to prepare meals for their parents.• Indian (75.8%) children were the most apt and Korean (24.1%) children the least apt
to clean house for their parents.• Indian (87.9%) and Japanese (81.8%) children were the most likely and Korean
(16.5%) the least likely to fix things around their parents house.• Indian (92.2%) children were the most apt and Korean (50%) and Vietnamese (50%)
children the least apt to assist parents with shopping.• Japanese (95.5%) children were the most likely and Chinese (34.1%) children the
least likely to advise their parent(s) on money matters.• Indian (97.8%) and Japanese (95.5%) were the most apt and Korean (69.3%) chil-
dren the least apt to assist when their parents were ill.
Overall, these results all demonstrate a large amount of exchange and support betweenthe generations. While this is very important for the ability of elders to maintain them-selves in the home environment, the level of caregiver strain on Asian American chil-dren and grandchildren should be examined in future studies.
Figure 4.32: Children Helping with Transportation and Parental Ethnicity (Percentage) (Statistically significant)
Figure 4.33: Children Helping With Money and Parental Ethnicity(Percentage) (Statistically significant)
ASIAN AMERICAN ELDERS IN NEW YORK CITY
ASIAN AMERICAN FEDERATION OF NEW YORK 70
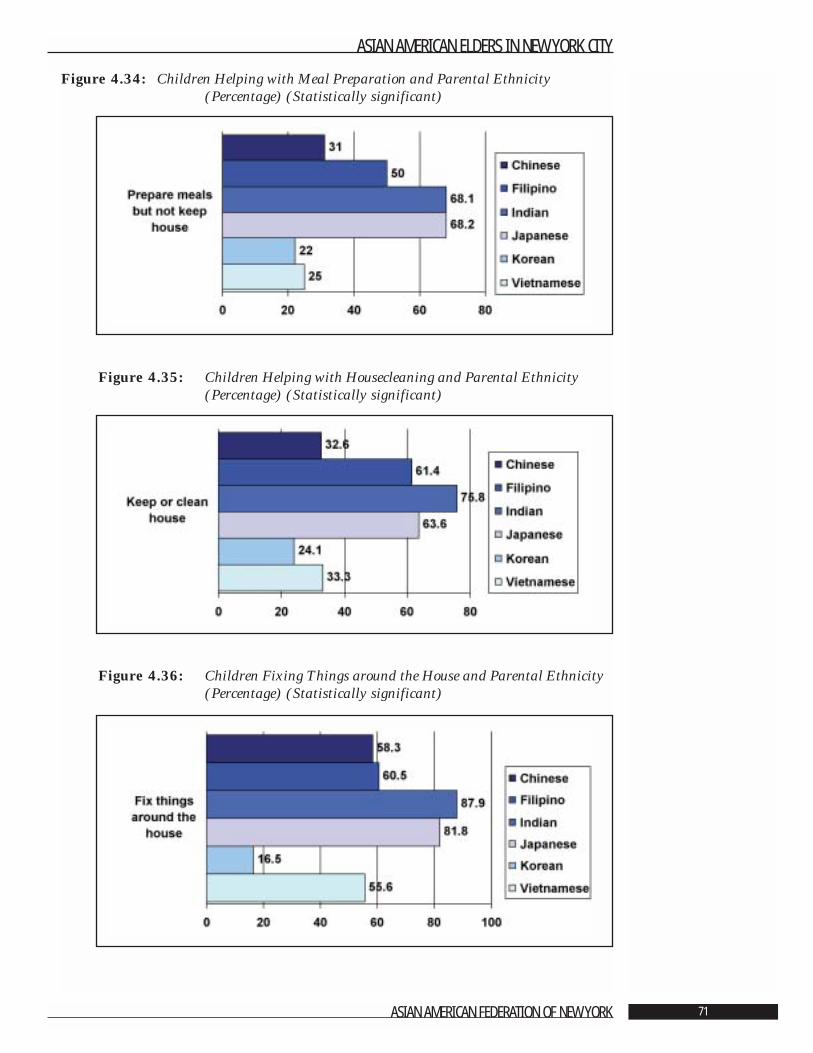
Figure 4.34: Children Helping with Meal Preparation and Parental Ethnicity (Percentage) (Statistically significant)
Figure 4.35: Children Helping with Housecleaning and Parental Ethnicity (Percentage) (Statistically significant)
Figure 4.36: Children Fixing Things around the House and Parental Ethnicity (Percentage) (Statistically significant)
ASIAN AMERICAN ELDERS IN NEW YORK CITY
ASIAN AMERICAN FEDERATION OF NEW YORK 71
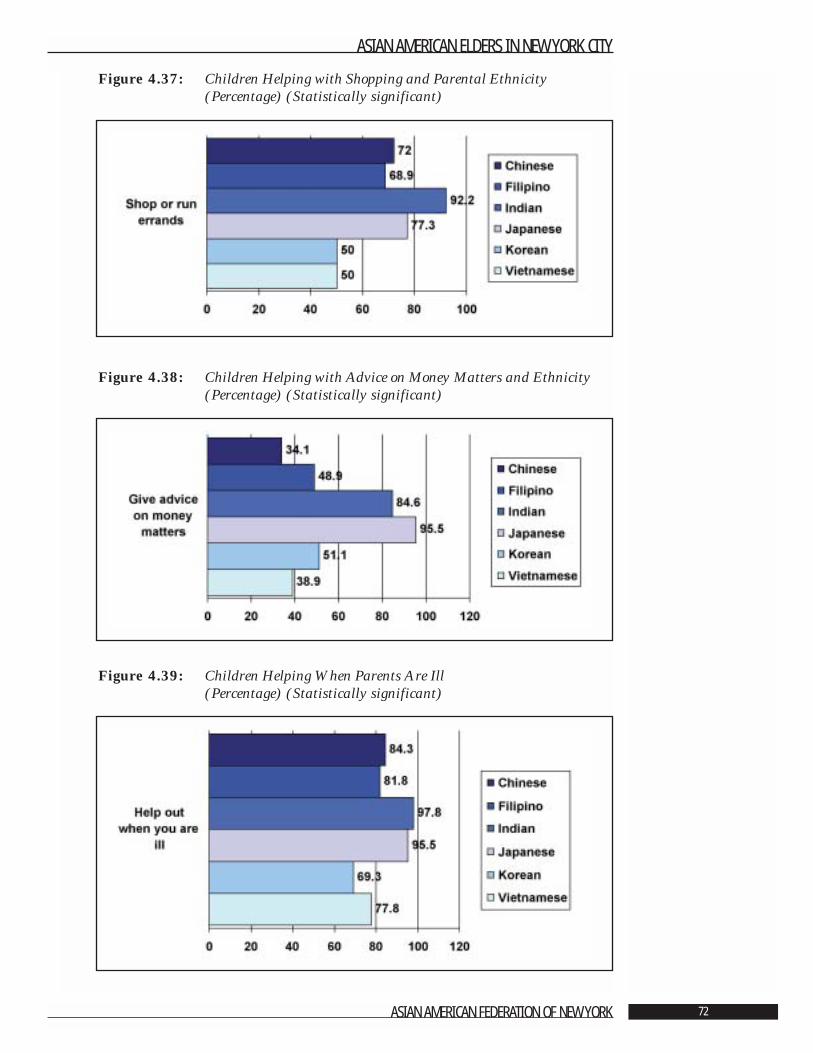
Figure 4.37: Children Helping with Shopping and Parental Ethnicity (Percentage) (Statistically significant)
Figure 4.38: Children Helping with Advice on Money Matters and Ethnicity(Percentage) (Statistically significant)
Figure 4.39: Children Helping When Parents Are Ill (Percentage) (Statistically significant)
ASIAN AMERICAN ELDERS IN NEW YORK CITY
ASIAN AMERICAN FEDERATION OF NEW YORK 72
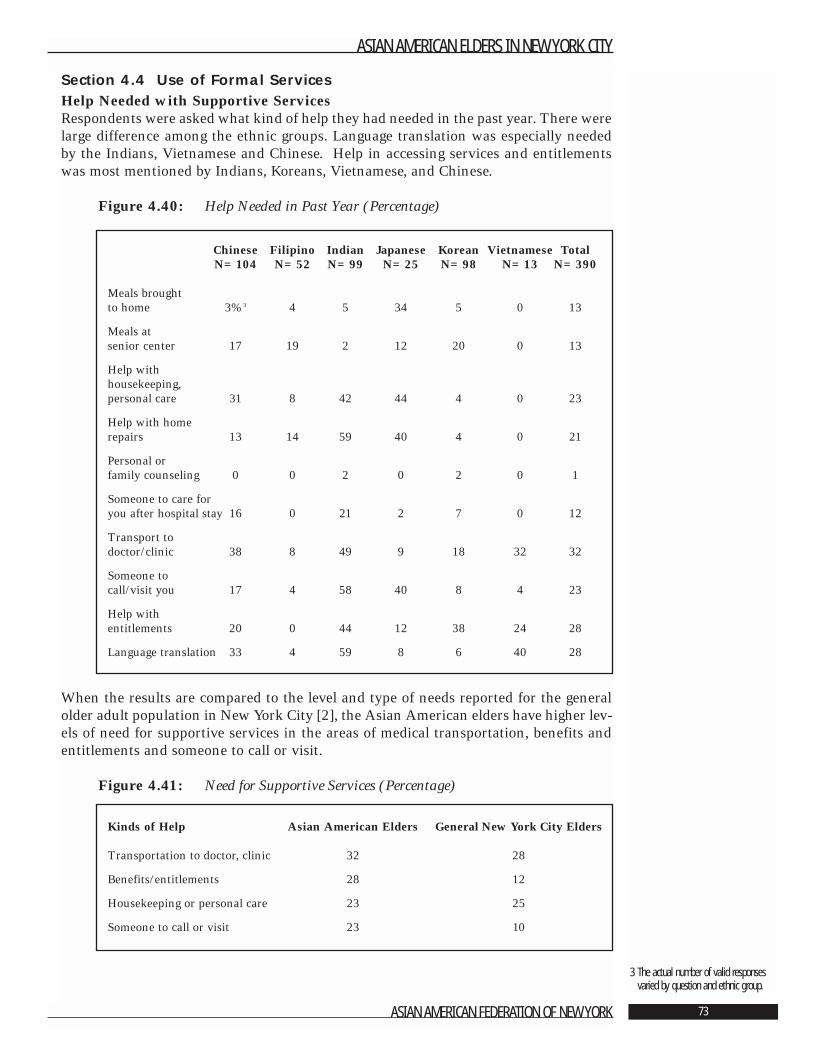
Section 4.4 Use of Formal ServicesHelp Needed with Supportive ServicesRespondents were asked what kind of help they had needed in the past year. There werelarge difference among the ethnic groups. Language translation was especially neededby the Indians, Vietnamese and Chinese. Help in accessing services and entitlementswas most mentioned by Indians, Koreans, Vietnamese, and Chinese.
Figure 4.40: Help Needed in Past Year (Percentage)
When the results are compared to the level and type of needs reported for the generalolder adult population in New York City [2], the Asian American elders have higher lev-els of need for supportive services in the areas of medical transportation, benefits andentitlements and someone to call or visit.
Figure 4.41: Need for Supportive Services (Percentage)
ASIAN AMERICAN ELDERS IN NEW YORK CITY
ASIAN AMERICAN FEDERATION OF NEW YORK 73
3 The actual number of valid responsesvaried by question and ethnic group.
Chinese Filipino Indian Japanese Korean Vietnamese TotalN=104 N=52 N=99 N=25 N=98 N=13 N=390
Meals brought to home 3%3 4 5 34 5 0 13
Meals at senior center 17 19 2 12 20 0 13
Help with housekeeping, personal care 31 8 42 44 4 0 23
Help with home repairs 13 14 59 40 4 0 21
Personal or family counseling 0 0 2 0 2 0 1
Someone to care for you after hospital stay 16 0 21 2 7 0 12
Transport to doctor/clinic 38 8 49 9 18 32 32
Someone to call/visit you 17 4 58 40 8 4 23
Help with entitlements 20 0 44 12 38 24 28
Language translation 33 4 59 8 6 40 28
Kinds of Help Asian American Elders General New York City Elders
Transportation to doctor, clinic 32 28
Benefits/entitlements 28 12
Housekeeping or personal care 23 25
Someone to call or visit 23 10
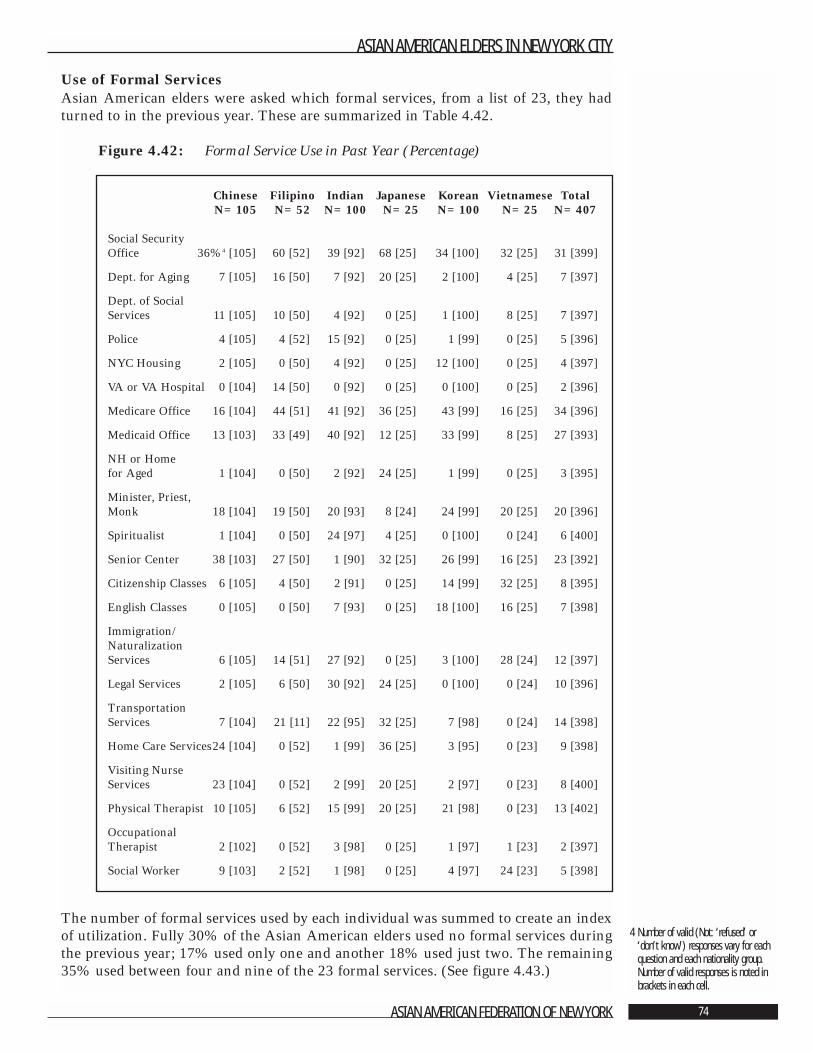
Use of Formal ServicesAsian American elders were asked which formal services, from a list of 23, they hadturned to in the previous year. These are summarized in Table 4.42.
Figure 4.42: Formal Service Use in Past Year (Percentage)
The number of formal services used by each individual was summed to create an indexof utilization. Fully 30% of the Asian American elders used no formal services duringthe previous year; 17% used only one and another 18% used just two. The remaining35% used between four and nine of the 23 formal services. (See figure 4.43.)
ASIAN AMERICAN ELDERS IN NEW YORK CITY
ASIAN AMERICAN FEDERATION OF NEW YORK 74
4 Number of valid (Not: ‘refused’ or‘don’t know’) responses vary for eachquestion and each nationality group.Number of valid responses is noted inbrackets in each cell.
Chinese Filipino Indian Japanese Korean Vietnamese TotalN=105 N=52 N=100 N=25 N=100 N=25 N=407
Social Security Office 36%4 [105] 60 [52] 39 [92] 68 [25] 34 [100] 32 [25] 31 [399]
Dept. for Aging 7 [105] 16 [50] 7 [92] 20 [25] 2 [100] 4 [25] 7 [397]
Dept. of Social Services 11 [105] 10 [50] 4 [92] 0 [25] 1 [100] 8 [25] 7 [397]
Police 4 [105] 4 [52] 15 [92] 0 [25] 1 [99] 0 [25] 5 [396]
NYC Housing 2 [105] 0 [50] 4 [92] 0 [25] 12 [100] 0 [25] 4 [397]
VA or VA Hospital 0 [104] 14 [50] 0 [92] 0 [25] 0 [100] 0 [25] 2 [396]
Medicare Office 16 [104] 44 [51] 41 [92] 36 [25] 43 [99] 16 [25] 34 [396]
Medicaid Office 13 [103] 33 [49] 40 [92] 12 [25] 33 [99] 8 [25] 27 [393]
NH or Home for Aged 1 [104] 0 [50] 2 [92] 24 [25] 1 [99] 0 [25] 3 [395]
Minister, Priest, Monk 18 [104] 19 [50] 20 [93] 8 [24] 24 [99] 20 [25] 20 [396]
Spiritualist 1 [104] 0 [50] 24 [97] 4 [25] 0 [100] 0 [24] 6 [400]
Senior Center 38 [103] 27 [50] 1 [90] 32 [25] 26 [99] 16 [25] 23 [392]
Citizenship Classes 6 [105] 4 [50] 2 [91] 0 [25] 14 [99] 32 [25] 8 [395]
English Classes 0 [105] 0 [50] 7 [93] 0 [25] 18 [100] 16 [25] 7 [398]
Immigration/Naturalization Services 6 [105] 14 [51] 27 [92] 0 [25] 3 [100] 28 [24] 12 [397]
Legal Services 2 [105] 6 [50] 30 [92] 24 [25] 0 [100] 0 [24] 10 [396]
Transportation Services 7 [104] 21 [11] 22 [95] 32 [25] 7 [98] 0 [24] 14 [398]
Home Care Services24 [104] 0 [52] 1 [99] 36 [25] 3 [95] 0 [23] 9 [398]
Visiting Nurse Services 23 [104] 0 [52] 2 [99] 20 [25] 2 [97] 0 [23] 8 [400]
Physical Therapist 10 [105] 6 [52] 15 [99] 20 [25] 21 [98] 0 [23] 13 [402]
Occupational Therapist 2 [102] 0 [52] 3 [98] 0 [25] 1 [97] 1 [23] 2 [397]
Social Worker 9 [103] 2 [52] 1 [98] 0 [25] 4 [97] 24 [23] 5 [398]
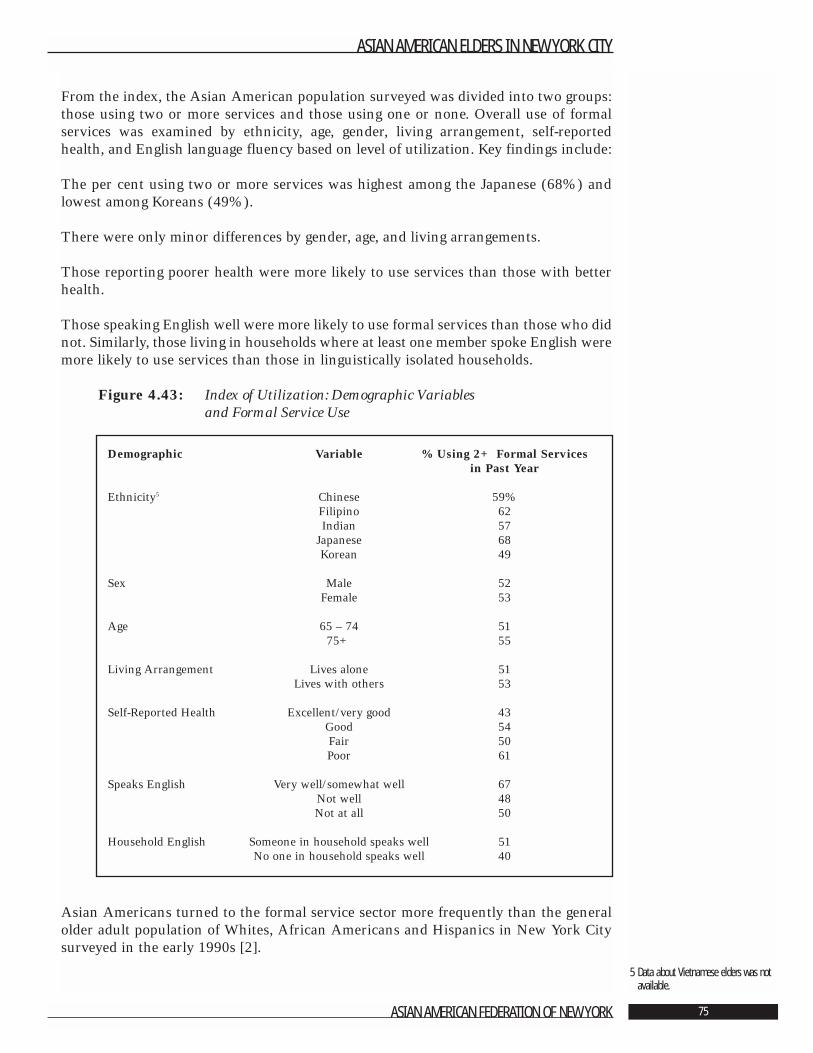
From the index, the Asian American population surveyed was divided into two groups:those using two or more services and those using one or none. Overall use of formalservices was examined by ethnicity, age, gender, living arrangement, self-reportedhealth, and English language fluency based on level of utilization. Key findings include:
The per cent using two or more services was highest among the Japanese (68%) andlowest among Koreans (49%).
There were only minor differences by gender, age, and living arrangements.
Those reporting poorer health were more likely to use services than those with betterhealth.
Those speaking English well were more likely to use formal services than those who didnot. Similarly, those living in households where at least one member spoke English weremore likely to use services than those in linguistically isolated households.
Figure 4.43: Index of Utilization: Demographic Variables and Formal Service Use
Asian Americans turned to the formal service sector more frequently than the generalolder adult population of Whites, African Americans and Hispanics in New York Citysurveyed in the early 1990s [2].
ASIAN AMERICAN ELDERS IN NEW YORK CITY
ASIAN AMERICAN FEDERATION OF NEW YORK 75
5 Data about Vietnamese elders was notavailable.
Demographic Variable % Using 2+ Formal Services in Past Year
Ethnicity5 Chinese 59%Filipino 62Indian 57
Japanese 68Korean 49
Sex Male 52Female 53
Age 65 – 74 5175+ 55
Living Arrangement Lives alone 51Lives with others 53
Self-Reported Health Excellent/very good 43Good 54Fair 50Poor 61
Speaks English Very well/somewhat well 67Not well 48Not at all 50
Household English Someone in household speaks well 51No one in household speaks well 40
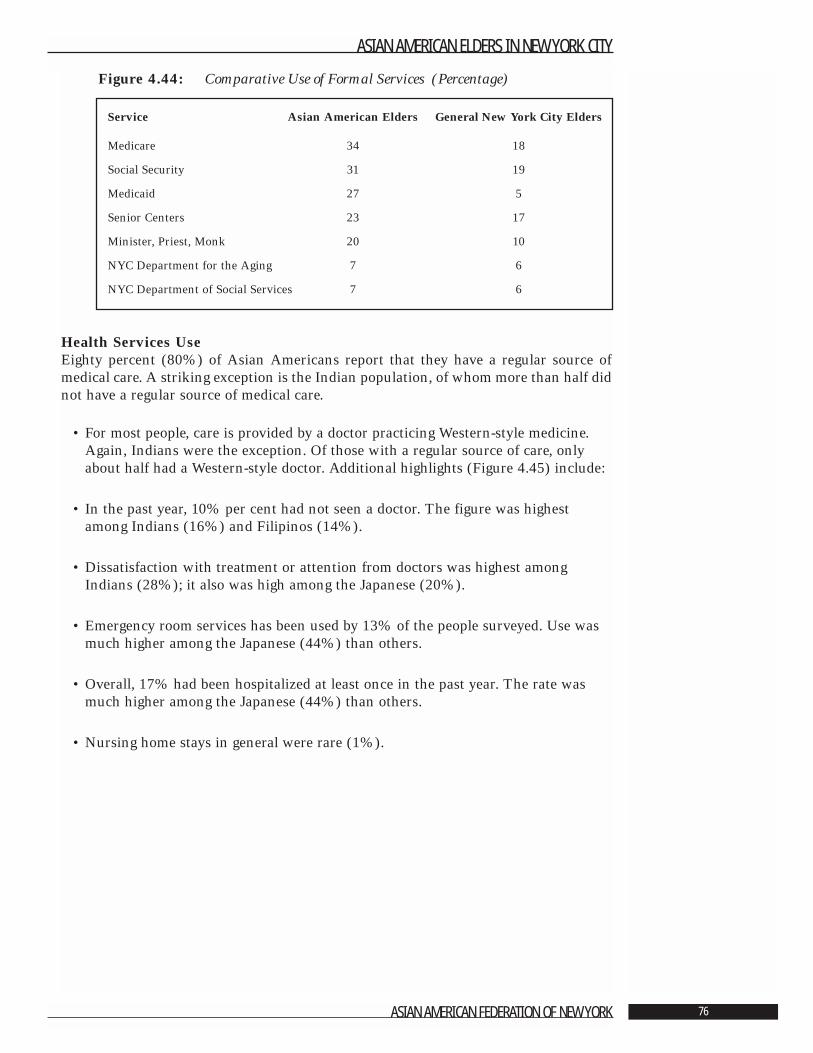
Figure 4.44: Comparative Use of Formal Services (Percentage)
Health Services UseEighty percent (80%) of Asian Americans report that they have a regular source ofmedical care. A striking exception is the Indian population, of whom more than half didnot have a regular source of medical care.
• For most people, care is provided by a doctor practicing Western-style medicine.Again, Indians were the exception. Of those with a regular source of care, onlyabout half had a Western-style doctor. Additional highlights (Figure 4.45) include:
• In the past year, 10% per cent had not seen a doctor. The figure was highestamong Indians (16%) and Filipinos (14%).
• Dissatisfaction with treatment or attention from doctors was highest amongIndians (28%); it also was high among the Japanese (20%).
• Emergency room services has been used by 13% of the people surveyed. Use wasmuch higher among the Japanese (44%) than others.
• Overall, 17% had been hospitalized at least once in the past year. The rate wasmuch higher among the Japanese (44%) than others.
• Nursing home stays in general were rare (1%).
ASIAN AMERICAN ELDERS IN NEW YORK CITY
ASIAN AMERICAN FEDERATION OF NEW YORK 76
Service Asian American Elders General New York City Elders
Medicare 34 18
Social Security 31 19
Medicaid 27 5
Senior Centers 23 17
Minister, Priest, Monk 20 10
NYC Department for the Aging 7 6
NYC Department of Social Services 7 6
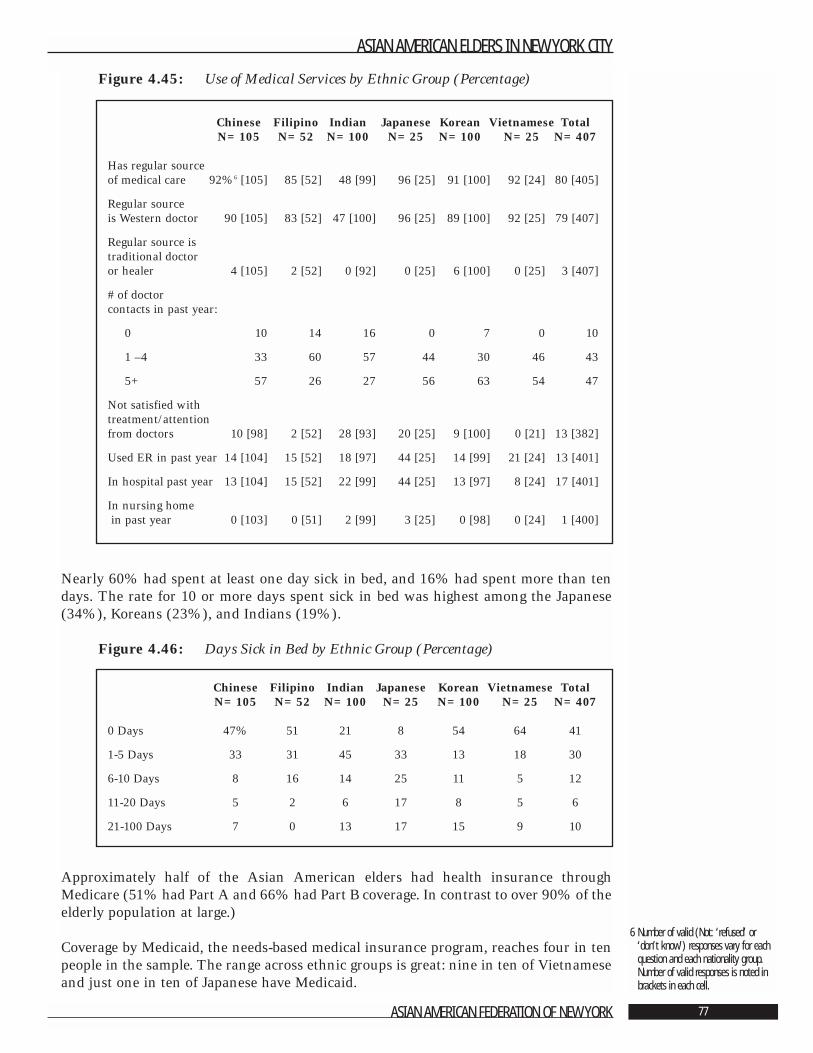
Figure 4.45: Use of Medical Services by Ethnic Group (Percentage)
Nearly 60% had spent at least one day sick in bed, and 16% had spent more than tendays. The rate for 10 or more days spent sick in bed was highest among the Japanese(34%), Koreans (23%), and Indians (19%).
Figure 4.46: Days Sick in Bed by Ethnic Group (Percentage)
Approximately half of the Asian American elders had health insurance throughMedicare (51% had Part A and 66% had Part B coverage. In contrast to over 90% of theelderly population at large.)
Coverage by Medicaid, the needs-based medical insurance program, reaches four in tenpeople in the sample. The range across ethnic groups is great: nine in ten of Vietnameseand just one in ten of Japanese have Medicaid.
ASIAN AMERICAN ELDERS IN NEW YORK CITY
ASIAN AMERICAN FEDERATION OF NEW YORK 77
6 Number of valid (Not: ‘refused’ or‘don’t know’) responses vary for eachquestion and each nationality group.Number of valid responses is noted inbrackets in each cell.
Chinese Filipino Indian Japanese Korean Vietnamese TotalN=105 N=52 N=100 N=25 N=100 N=25 N=407
Has regular source of medical care 92%6 [105] 85 [52] 48 [99] 96 [25] 91 [100] 92 [24] 80 [405]
Regular source is Western doctor 90 [105] 83 [52] 47 [100] 96 [25] 89 [100] 92 [25] 79 [407]
Regular source is traditional doctor or healer 4 [105] 2 [52] 0 [92] 0 [25] 6 [100] 0 [25] 3 [407]
# of doctor contacts in past year:
0 10 14 16 0 7 0 10
1 –4 33 60 57 44 30 46 43
5+ 57 26 27 56 63 54 47
Not satisfied with treatment/attention from doctors 10 [98] 2 [52] 28 [93] 20 [25] 9 [100] 0 [21] 13 [382]
Used ER in past year 14 [104] 15 [52] 18 [97] 44 [25] 14 [99] 21 [24] 13 [401]
In hospital past year 13 [104] 15 [52] 22 [99] 44 [25] 13 [97] 8 [24] 17 [401]
In nursing homein past year 0 [103] 0 [51] 2 [99] 3 [25] 0 [98] 0 [24] 1 [400]
Chinese Filipino Indian Japanese Korean Vietnamese TotalN=105 N=52 N=100 N=25 N=100 N=25 N=407
0 Days 47% 51 21 8 54 64 41
1-5 Days 33 31 45 33 13 18 30
6-10 Days 8 16 14 25 11 5 12
11-20 Days 5 2 6 17 8 5 6
21-100 Days 7 0 13 17 15 9 10
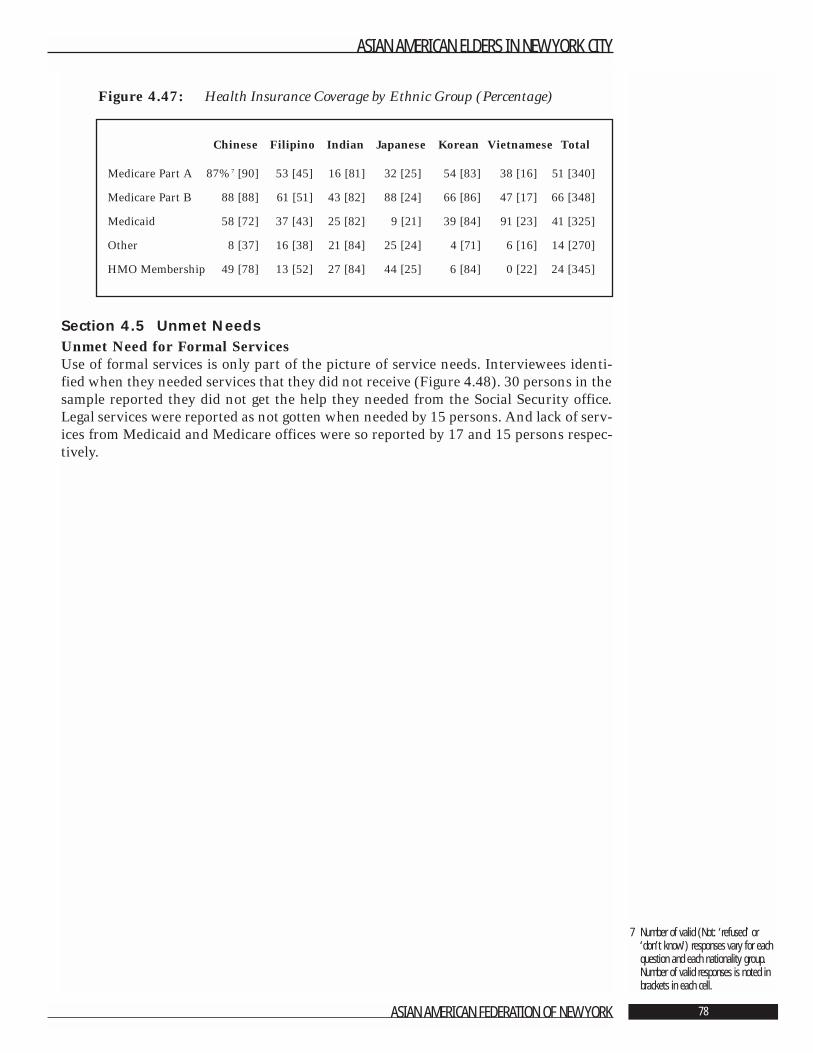
Figure 4.47: Health Insurance Coverage by Ethnic Group (Percentage)
Section 4.5 Unmet NeedsUnmet Need for Formal Services Use of formal services is only part of the picture of service needs. Interviewees identi-fied when they needed services that they did not receive (Figure 4.48). 30 persons in thesample reported they did not get the help they needed from the Social Security office.Legal services were reported as not gotten when needed by 15 persons. And lack of serv-ices from Medicaid and Medicare offices were so reported by 17 and 15 persons respec-tively.
ASIAN AMERICAN ELDERS IN NEW YORK CITY
ASIAN AMERICAN FEDERATION OF NEW YORK 78
7 Number of valid (Not: ‘refused’ or‘don’t know’) responses vary for eachquestion and each nationality group.Number of valid responses is noted inbrackets in each cell.
Chinese Filipino Indian Japanese Korean Vietnamese Total
Medicare Part A 87%7 [90] 53 [45] 16 [81] 32 [25] 54 [83] 38 [16] 51 [340]
Medicare Part B 88 [88] 61 [51] 43 [82] 88 [24] 66 [86] 47 [17] 66 [348]
Medicaid 58 [72] 37 [43] 25 [82] 9 [21] 39 [84] 91 [23] 41 [325]
Other 8 [37] 16 [38] 21 [84] 25 [24] 4 [71] 6 [16] 14 [270]
HMO Membership 49 [78] 13 [52] 27 [84] 44 [25] 6 [84] 0 [22] 24 [345]
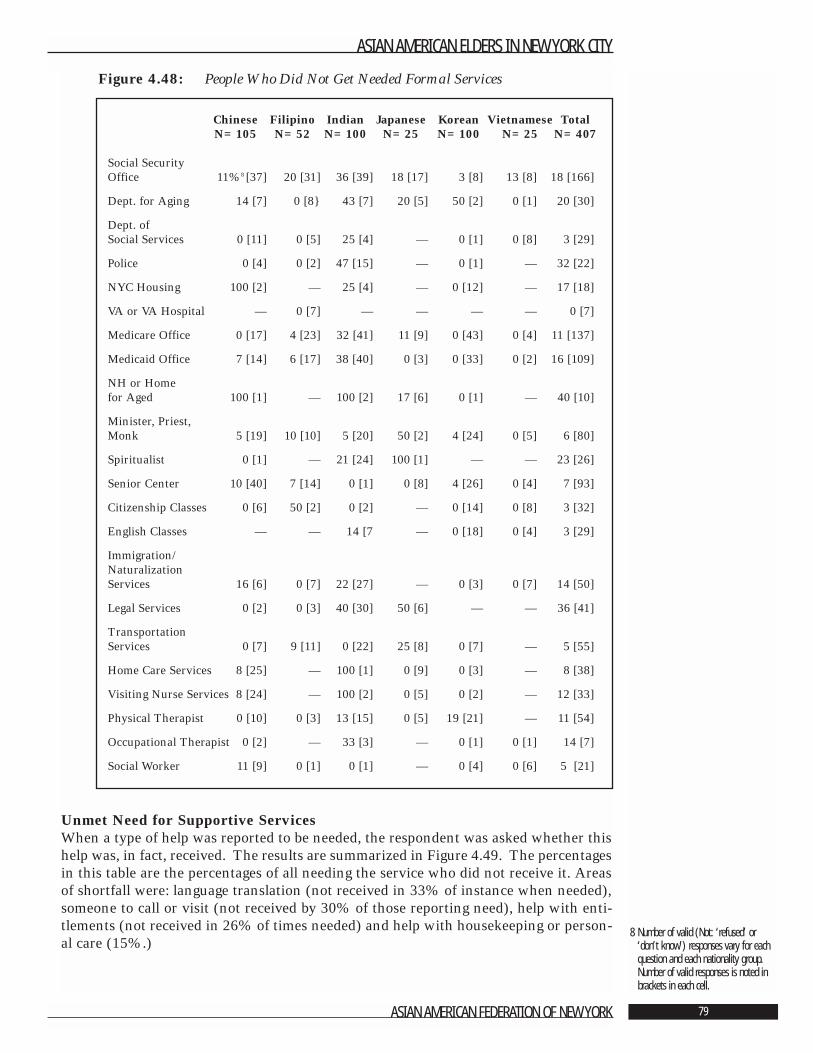
Figure 4.48: People Who Did Not Get Needed Formal Services
Unmet Need for Supportive Services When a type of help was reported to be needed, the respondent was asked whether thishelp was, in fact, received. The results are summarized in Figure 4.49. The percentagesin this table are the percentages of all needing the service who did not receive it. Areasof shortfall were: language translation (not received in 33% of instance when needed),someone to call or visit (not received by 30% of those reporting need), help with enti-tlements (not received in 26% of times needed) and help with housekeeping or person-al care (15%.)
ASIAN AMERICAN ELDERS IN NEW YORK CITY
ASIAN AMERICAN FEDERATION OF NEW YORK 79
8 Number of valid (Not: ‘refused’ or‘don’t know’) responses vary for eachquestion and each nationality group.Number of valid responses is noted inbrackets in each cell.
Chinese Filipino Indian Japanese Korean Vietnamese TotalN=105 N=52 N=100 N=25 N=100 N=25 N=407
Social Security Office 11%8 [37] 20 [31] 36 [39] 18 [17] 3 [8] 13 [8] 18 [166]
Dept. for Aging 14 [7] 0 [8} 43 [7] 20 [5] 50 [2] 0 [1] 20 [30]
Dept. of Social Services 0 [11] 0 [5] 25 [4] — 0 [1] 0 [8] 3 [29]
Police 0 [4] 0 [2] 47 [15] — 0 [1] — 32 [22]
NYC Housing 100 [2] — 25 [4] — 0 [12] — 17 [18]
VA or VA Hospital — 0 [7] — — — — 0 [7]
Medicare Office 0 [17] 4 [23] 32 [41] 11 [9] 0 [43] 0 [4] 11 [137]
Medicaid Office 7 [14] 6 [17] 38 [40] 0 [3] 0 [33] 0 [2] 16 [109]
NH or Home for Aged 100 [1] — 100 [2] 17 [6] 0 [1] — 40 [10]
Minister, Priest, Monk 5 [19] 10 [10] 5 [20] 50 [2] 4 [24] 0 [5] 6 [80]
Spiritualist 0 [1] — 21 [24] 100 [1] — — 23 [26]
Senior Center 10 [40] 7 [14] 0 [1] 0 [8] 4 [26] 0 [4] 7 [93]
Citizenship Classes 0 [6] 50 [2] 0 [2] — 0 [14] 0 [8] 3 [32]
English Classes — — 14 [7 — 0 [18] 0 [4] 3 [29]
Immigration/ Naturalization Services 16 [6] 0 [7] 22 [27] — 0 [3] 0 [7] 14 [50]
Legal Services 0 [2] 0 [3] 40 [30] 50 [6] — — 36 [41]
Transportation Services 0 [7] 9 [11] 0 [22] 25 [8] 0 [7] — 5 [55]
Home Care Services 8 [25] — 100 [1] 0 [9] 0 [3] — 8 [38]
Visiting Nurse Services 8 [24] — 100 [2] 0 [5] 0 [2] — 12 [33]
Physical Therapist 0 [10] 0 [3] 13 [15] 0 [5] 19 [21] — 11 [54]
Occupational Therapist 0 [2] — 33 [3] — 0 [1] 0 [1] 14 [7]
Social Worker 11 [9] 0 [1] 0 [1] — 0 [4] 0 [6] 5 [21]
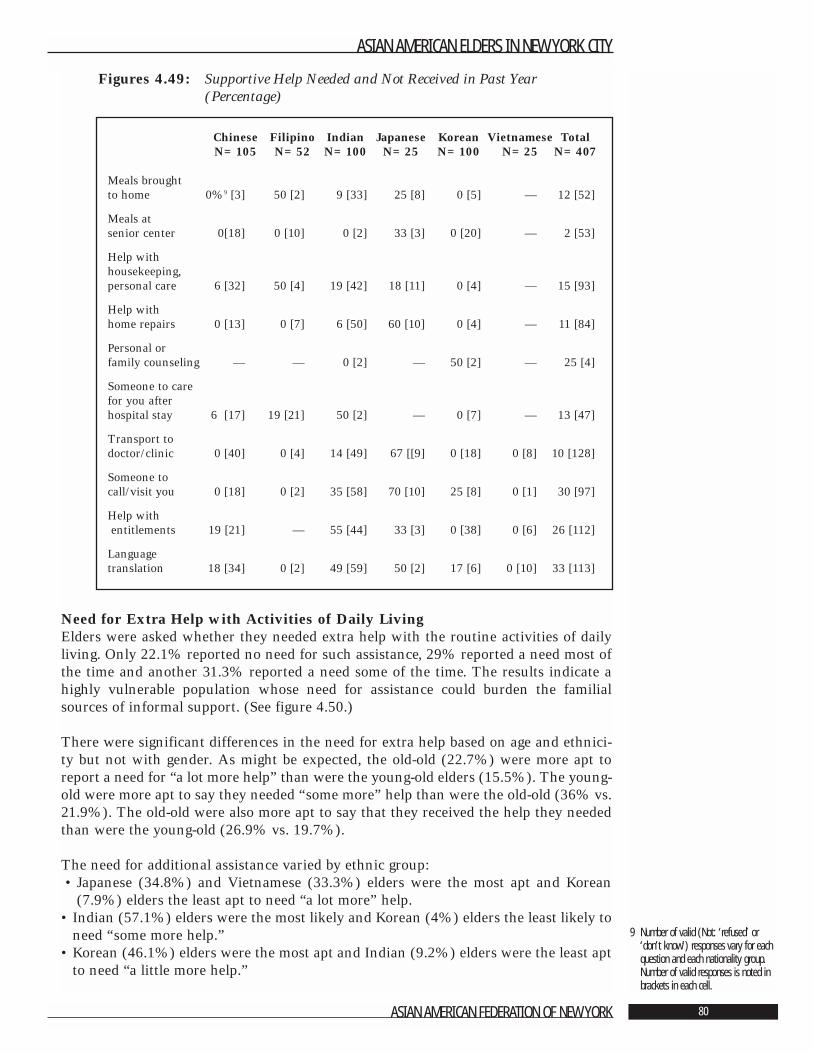
Figures 4.49: Supportive Help Needed and Not Received in Past Year(Percentage)
Need for Extra Help with Activities of Daily LivingElders were asked whether they needed extra help with the routine activities of dailyliving. Only 22.1% reported no need for such assistance, 29% reported a need most ofthe time and another 31.3% reported a need some of the time. The results indicate ahighly vulnerable population whose need for assistance could burden the familialsources of informal support. (See figure 4.50.)
There were significant differences in the need for extra help based on age and ethnici-ty but not with gender. As might be expected, the old-old (22.7%) were more apt toreport a need for “a lot more help” than were the young-old elders (15.5%). The young-old were more apt to say they needed “some more” help than were the old-old (36% vs.21.9%). The old-old were also more apt to say that they received the help they neededthan were the young-old (26.9% vs. 19.7%).
The need for additional assistance varied by ethnic group:• Japanese (34.8%) and Vietnamese (33.3%) elders were the most apt and Korean
(7.9%) elders the least apt to need “a lot more” help.• Indian (57.1%) elders were the most likely and Korean (4%) elders the least likely to
need “some more help.”• Korean (46.1%) elders were the most apt and Indian (9.2%) elders were the least apt
to need “a little more help.”
ASIAN AMERICAN ELDERS IN NEW YORK CITY
ASIAN AMERICAN FEDERATION OF NEW YORK 80
9 Number of valid (Not: ‘refused’ or‘don’t know’) responses vary for eachquestion and each nationality group.Number of valid responses is noted inbrackets in each cell.
Chinese Filipino Indian Japanese Korean Vietnamese TotalN=105 N=52 N=100 N=25 N=100 N=25 N=407
Meals brought to home 0%9 [3] 50 [2] 9 [33] 25 [8] 0 [5] — 12 [52]
Meals atsenior center 0[18] 0 [10] 0 [2] 33 [3] 0 [20] — 2 [53]
Help with housekeeping, personal care 6 [32] 50 [4] 19 [42] 18 [11] 0 [4] — 15 [93]
Help with home repairs 0 [13] 0 [7] 6 [50] 60 [10] 0 [4] — 11 [84]
Personal or family counseling — — 0 [2] — 50 [2] — 25 [4]
Someone to care for you after hospital stay 6 [17] 19 [21] 50 [2] — 0 [7] — 13 [47]
Transport to doctor/clinic 0 [40] 0 [4] 14 [49] 67 [[9] 0 [18] 0 [8] 10 [128]
Someone to call/visit you 0 [18] 0 [2] 35 [58] 70 [10] 25 [8] 0 [1] 30 [97]
Help withentitlements 19 [21] — 55 [44] 33 [3] 0 [38] 0 [6] 26 [112]
Language translation 18 [34] 0 [2] 49 [59] 50 [2] 17 [6] 0 [10] 33 [113]
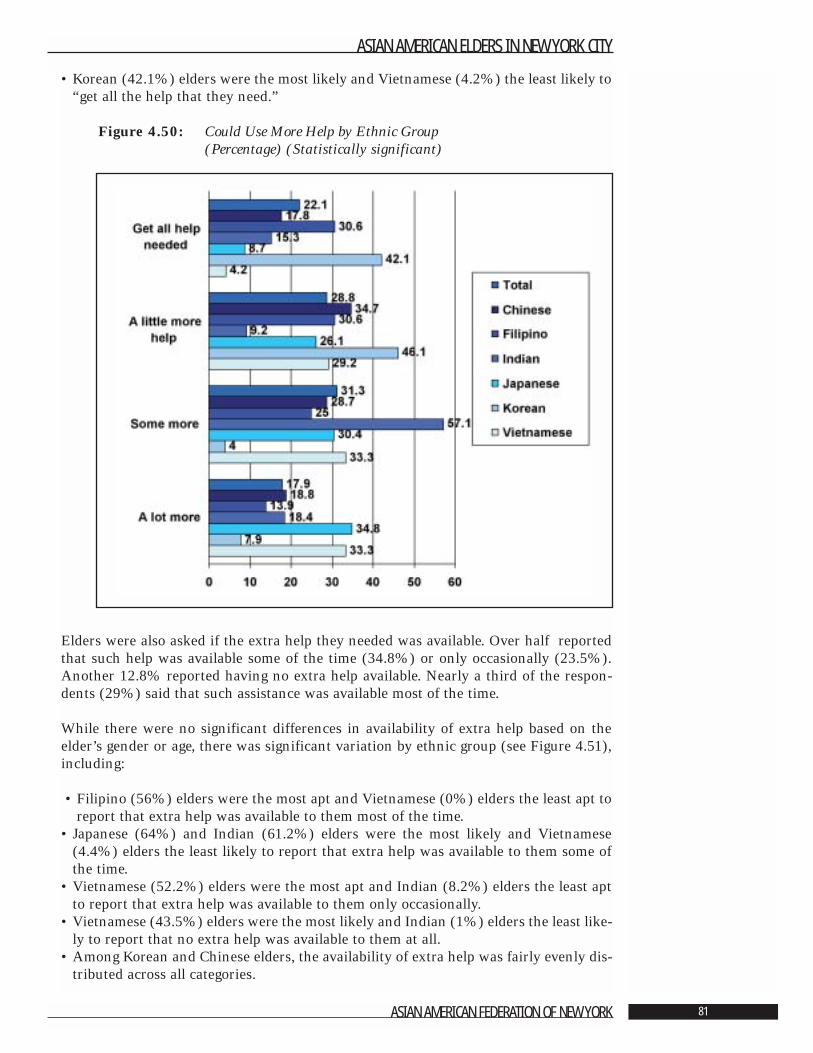
• Korean (42.1%) elders were the most likely and Vietnamese (4.2%) the least likely to“get all the help that they need.”
Figure 4.50: Could Use More Help by Ethnic Group(Percentage) (Statistically significant)
Elders were also asked if the extra help they needed was available. Over half reportedthat such help was available some of the time (34.8%) or only occasionally (23.5%).Another 12.8% reported having no extra help available. Nearly a third of the respon-dents (29%) said that such assistance was available most of the time.
While there were no significant differences in availability of extra help based on theelder’s gender or age, there was significant variation by ethnic group (see Figure 4.51),including:
• Filipino (56%) elders were the most apt and Vietnamese (0%) elders the least apt toreport that extra help was available to them most of the time.
• Japanese (64%) and Indian (61.2%) elders were the most likely and Vietnamese(4.4%) elders the least likely to report that extra help was available to them some ofthe time.
• Vietnamese (52.2%) elders were the most apt and Indian (8.2%) elders the least aptto report that extra help was available to them only occasionally.
• Vietnamese (43.5%) elders were the most likely and Indian (1%) elders the least like-ly to report that no extra help was available to them at all.
• Among Korean and Chinese elders, the availability of extra help was fairly evenly dis-tributed across all categories.
ASIAN AMERICAN ELDERS IN NEW YORK CITY
ASIAN AMERICAN FEDERATION OF NEW YORK 81
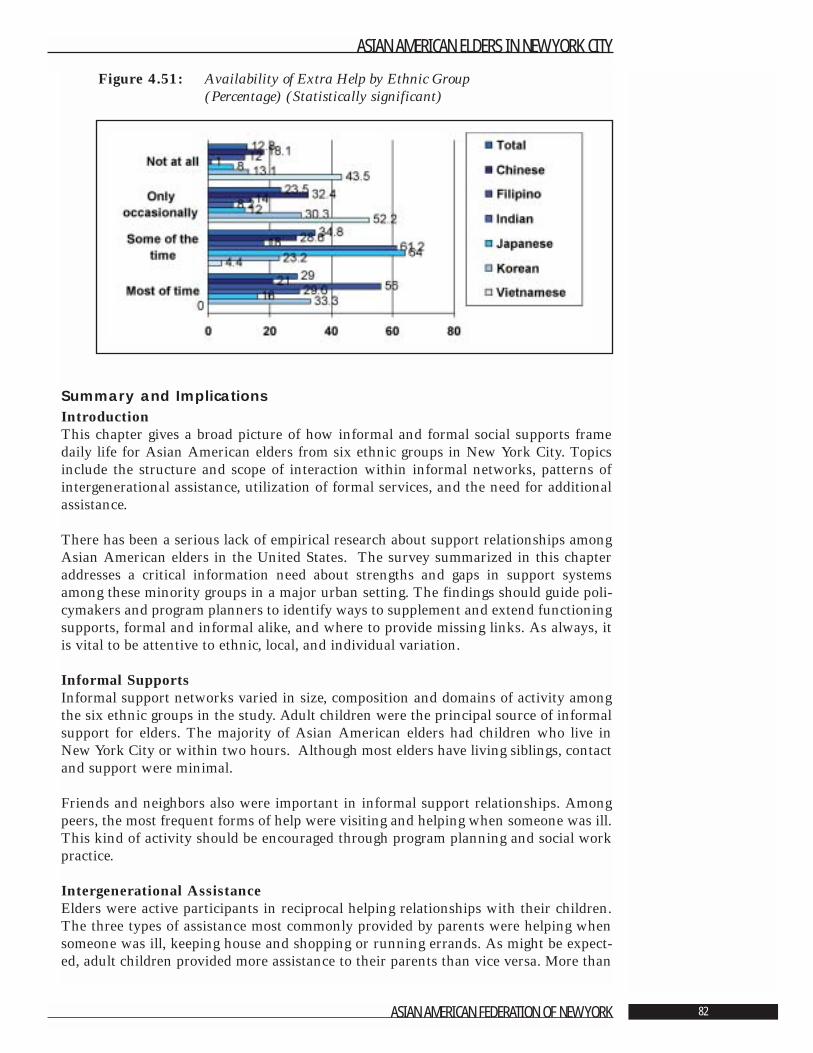
Figure 4.51: Availability of Extra Help by Ethnic Group (Percentage) (Statistically significant)
Summary and ImplicationsIntroductionThis chapter gives a broad picture of how informal and formal social supports framedaily life for Asian American elders from six ethnic groups in New York City. Topicsinclude the structure and scope of interaction within informal networks, patterns ofintergenerational assistance, utilization of formal services, and the need for additionalassistance.
There has been a serious lack of empirical research about support relationships amongAsian American elders in the United States. The survey summarized in this chapteraddresses a critical information need about strengths and gaps in support systemsamong these minority groups in a major urban setting. The findings should guide poli-cymakers and program planners to identify ways to supplement and extend functioningsupports, formal and informal alike, and where to provide missing links. As always, itis vital to be attentive to ethnic, local, and individual variation.
Informal SupportsInformal support networks varied in size, composition and domains of activity amongthe six ethnic groups in the study. Adult children were the principal source of informalsupport for elders. The majority of Asian American elders had children who live inNew York City or within two hours. Although most elders have living siblings, contactand support were minimal.
Friends and neighbors also were important in informal support relationships. Amongpeers, the most frequent forms of help were visiting and helping when someone was ill.This kind of activity should be encouraged through program planning and social workpractice.
Intergenerational AssistanceElders were active participants in reciprocal helping relationships with their children.The three types of assistance most commonly provided by parents were helping whensomeone was ill, keeping house and shopping or running errands. As might be expect-ed, adult children provided more assistance to their parents than vice versa. More than
ASIAN AMERICAN ELDERS IN NEW YORK CITY
ASIAN AMERICAN FEDERATION OF NEW YORK 82
half of the elders benefited when their children helped in times of illness, with shoppingor errands, drove them places, fixed things around the house and helped with money.
Additional research is needed about the quality and content of interaction between par-ents and children. For the elders, we need to know more about the impact of familydynamics on mental health. As findings from Chapter 3 indicated, parents whoreceived higher levels of assistance from their children and those whose children did notlive in close proximity tended to have higher levels of depression. Also, it is importantto gain a more precise picture of caregiver burden for adult children.
Formal & Supportive ServicesThe supportive services most often needed from the formal sector were transportationto medical appointments, language translation, help with entitlements, someone to callor visit, and help with housekeeping or personal care. Levels of need overall were high-er among Asian American elders than in the general older adult population in NewYork City. There was, however, wide variation in service need profiles among the eth-nic groups.
Use of formal services spanned a wide continuum. Approximately two-thirds reportedthat they used either no services or up to two during the past year. The remaining third,who used between four and nine services, tended to be in poorer health or have greaterpersonal or household English language ability. Asian American elders turned to theformal service sector more frequently than did the general older adult population inNew York City. It is, therefore, critical for program developers to carefully consider localand cultural issues to assure that resources are used most strategically. Utilizing the fullrange of services depends significantly on the capacity of agencies to provide bilingualstaff or interpreters.
Access to consistent health care is particularly important for older adults. Most of theAsian American elders had regular sources of medical care, primarily Western-stylemedicine. Almost half of the people reported seeing their doctor five or more times dur-ing the year, and more than 40% spent one to 10 days sick in bed. Medicare andMedicaid were the sources of health insurance for most of the people in the study.
Unmet Needs Of the formal services that people indicated they needed but did not receive, the fourmost frequently identified were services from the Social Security Office, Medicaid andMedicare, and legal services. In terms of supportive services, transportation to medicalappointments, language translation services, someone to call or visit, help with entitle-ments, and help with housekeeping and personal care are areas where additionalresources should be directed to meet the gaps identified by Asian American elders. Thepriorities identified by consumers set a clear mandate for planning future programs.
The vast majority of people surveyed indicated that they needed more help withActivities of Daily Living, and, again, most had less available than they felt that theyneeded. This, too, suggests an area of focus for targeting public resources to have maxi-mal value for elders in specific communities.
ASIAN AMERICAN ELDERS IN NEW YORK CITY
ASIAN AMERICAN FEDERATION OF NEW YORK 83
Literature Cited
1. Gottlieb, B.H. “Social Networks and Social Support in Community Mental Health.”In Gottlieb, B.H. ed. Social Networks and Social Support. Beverly Hills, CA: SagePublications, 1981. Pp. 11-42.
2. Dumpson, James, et al. Growing Older in New York City in the 1990s. New York:New York Center on Aging of the New York Community Trust, 1993.
Volume 1 Introduction, Compendium of Significant Findings,Recommendations and Methodology
Volume 2 A Demographic and Economic ProfileVolume 3 Impact of Health Problems on Quality of LifeVolume 4 Life Space, Environment, and Impact of CrimeVolume 5 Family and Community Support Systems
ASIAN AMERICAN ELDERS IN NEW YORK CITY
ASIAN AMERICAN FEDERATION OF NEW YORK 84
Chapter 5: Traditional Values,
Stress and Life SatisfactionAda C. Mui, Ph.D., A.C.S.W.,1 and Peter S. Cross, M.S.W.
Significant Findings• Values of honor, responsibility and family unity that are traditionally held in high
regard in many Asian cultures continue to be honored among Asian American elders.
• More than half of the elders feel that it is important or somewhat important to knowone’s family lineage and extended family, remember ancestors, have decisions madeby the eldest son when the father was absent, have children and parents live together,have parents able to rely on their children for support, receive some return for sacri-fices made on behalf of children, have families take care of their elders, have parentalapproval of their children’s spouses before marriage and have children avoid divorceto not let the family down.
• The majority of elders perceive that their traditional values differ from their childrennot at all or only in small ways.
• During the three years prior to the survey, one-quarter or more of the elders experi-enced stressful life events including death of a spouse (9.5%), death of a relative orclose friend (29.1%), personal serious illness or injury (29.2%), having many familyproblems (22.7%), being dependent on others (29.9%), poverty (39.2%), anxiety(33.6%), and loneliness (21.8%).
• For 39.2% of the respondents, family financial condition is a serious problem; an addi-tional 23.5% report that having too many medical bills is a serious problem.
• Between one-tenth and one-fifth of the elders have dealt with robbery or burglary,changes in household location or composition, children moving away and caring for asick relative or friend during the previous three years.
• Elders are active in a wide range of leisure activities, some of which are related to theroutines of daily life while others reflect personal interests. Least frequent are volun-teer work and playing games or cards. There are only minimal differences across eth-nic groups.
• There is a broad level of overall life satisfaction, and satisfaction with family relation-ships is especially strong.
ASIAN AMERICAN ELDERS IN NEW YORK CITY
ASIAN AMERICAN FEDERATION OF NEW YORK 85
1 Ada Mui is grateful to Suk-YoungKang, Margaret Dietz Domanski and Li-Mei Chen for their valuable assistanceon earlier drafts of this chapter.
• The level of depression is the most powerful predictor of the degree of life satisfaction.Lower general life satisfaction is the strongest predictor of lower satisfaction with fam-ily relationships.
• The inability to read English has the strongest correlation with the perception of lessavailable back-up help.
• Predictors of greater perceived unmet needs include demographic factors, parent-childrelationships, elders’ emotional health and stressful life events. The most powerful ofthese predictors is the higher level of assistance provided to the elders by their adultchildren.
• The most powerful predictor of parental assistance to adult children is a high level ofhelp from children to their aging parents. Other predictors include living with others,being young-old parents, having more perceived unmet needs and having a high levelof face-to-face contact with children.
• The strongest predictor of level of assistance from adult children to parents is a high-er level of face-to-face contact with children. Additional predictors include providingmore assistance to adult children, being more depressed, having more unmet needs,the availability of back-up help, less stress from life events and having a confidant.
• The two characteristics that contribute to predicting 15% of the variance observed inthe width of the cultural gap between Asian American elders and their children aredepression and lower levels of face-to-face contact.
ASIAN AMERICAN ELDERS IN NEW YORK CITY
ASIAN AMERICAN FEDERATION OF NEW YORK 86
IntroductionThis chapter focuses on acculturation and qualitative aspects of life for Asian Americanelders in six ethnic communities in New York City. Understanding traditional valuesfrom the perspective of generational and ethnic variation provides valuable guidance fordeveloping programs that meet the particular needs of people whose adult lives spanmultiple cultures. Similarly, identifying life events and losses that elders experience asstressful supports targeted use of community resources to meet felt needs. Finally, aglobal look at perceptions of quality of life in general and with family relationships inparticular gives a rounded picture of what it means to be an Asian American elder inone city in the early years of the twenty-first century.
The information is covered in the following five sections:Section 1 Traditional Values and Culture GapSection 2 Stressful Life EventsSection 3 Leisure TimeSection 4 Quality of LifeSection 5 Summary and Implications
Section 5.1: Traditional Values and Culture GapCultural values are beliefs about preferred choices that govern conduct, life decisionsand related normative actions taken by individuals, families, groups and society as awhole. These values are rooted in ethnic, religious and generational beliefs as well as tra-ditions and practices that influence individual and social outlooks [1].
The Asian American population is comprised of many distinctive ethnic groups withsome shared values, most of which derive from a world view rooted in an Eastern philo-sophical background and religious traditions. Asian cultures emphasize values such asfamily responsibility and obligations, filial piety, and a hierarchical order in duty to fam-ily, sensitivity for the feelings of others, respect and loyalty [2]. Given the significanceof cultural values, a profile of the strength of these elements of tradition among con-temporary Asian Americans is valuable for policy development and service planning.
Respondents were surveyed about the importance of twelve traditional values. Theywere asked to rate the importance of knowing family lineage, knowing extended fami-ly, remembering ancestors, decision-making by the eldest son, respect and obedience toelders, generations living together, relying on children for support, return for parentalsacrifice, familial and government responsibility for elders, parental approval for chil-dren’s marriage partners, avoiding divorce, and gap between viewpoints of parent andchildren. Responses to each of these statements are important for understanding com-munity strengths and local needs and should be considered carefully in program plan-ning to enhance caregiving and informal networks of social support.
Family LineageAmong all respondents, 53% felt that knowing family lineage was somewhat or veryimportant (Figure 5.1). The Chinese were the most likely to feel this knowledge wasvery important (39.8%), whereas the Vietnamese were the most apt to feel that suchknowledge was not important at all (100%). There were no significant differencesbased on either gender or age.
ASIAN AMERICAN ELDERS IN NEW YORK CITY
ASIAN AMERICAN FEDERATION OF NEW YORK 87
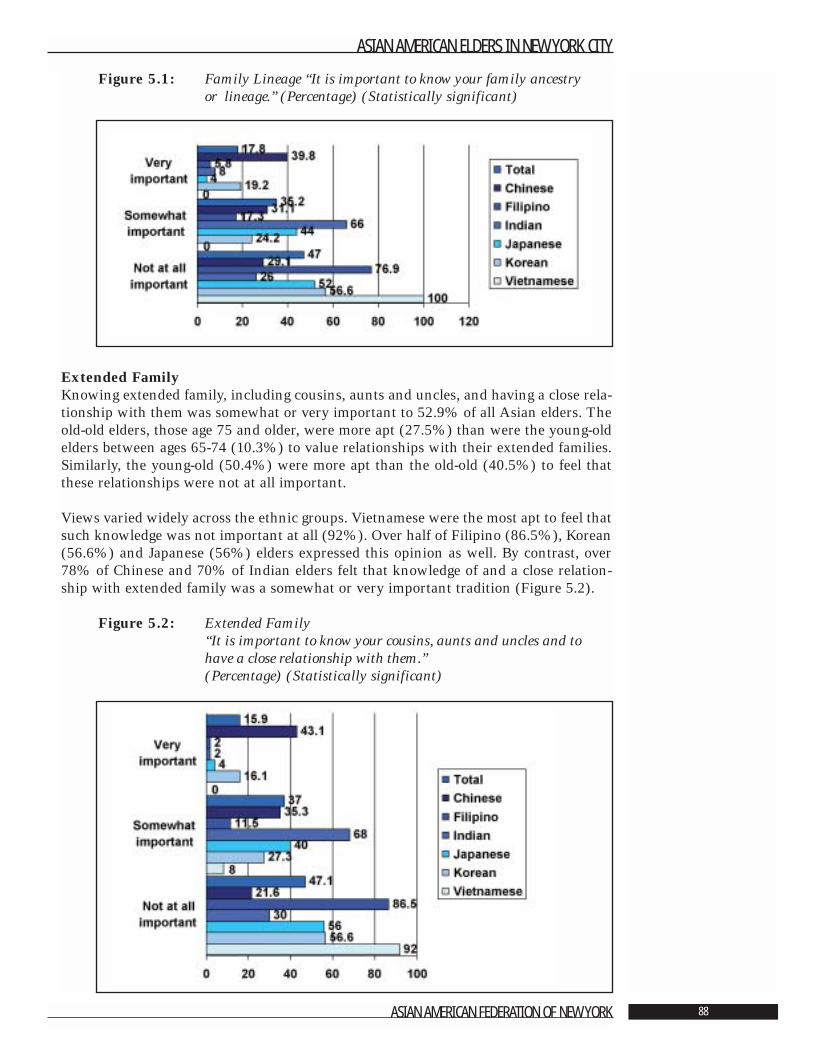
Figure 5.1: Family Lineage “It is important to know your family ancestry or lineage.” (Percentage) (Statistically significant)
Extended FamilyKnowing extended family, including cousins, aunts and uncles, and having a close rela-tionship with them was somewhat or very important to 52.9% of all Asian elders. Theold-old elders, those age 75 and older, were more apt (27.5%) than were the young-oldelders between ages 65-74 (10.3%) to value relationships with their extended families.Similarly, the young-old (50.4%) were more apt than the old-old (40.5%) to feel thatthese relationships were not at all important.
Views varied widely across the ethnic groups. Vietnamese were the most apt to feel thatsuch knowledge was not important at all (92%). Over half of Filipino (86.5%), Korean(56.6%) and Japanese (56%) elders expressed this opinion as well. By contrast, over78% of Chinese and 70% of Indian elders felt that knowledge of and a close relation-ship with extended family was a somewhat or very important tradition (Figure 5.2).
Figure 5.2: Extended Family “It is important to know your cousins, aunts and uncles and tohave a close relationship with them.” (Percentage) (Statistically significant)
ASIAN AMERICAN ELDERS IN NEW YORK CITY
ASIAN AMERICAN FEDERATION OF NEW YORK 88
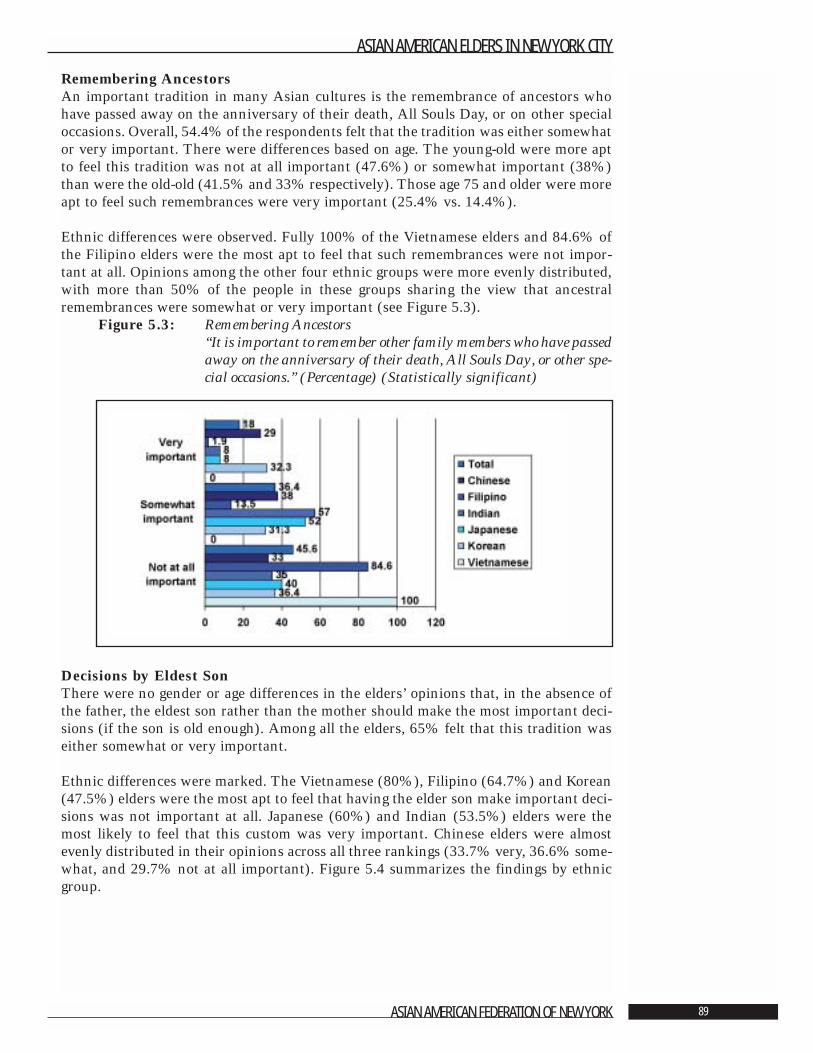
Remembering AncestorsAn important tradition in many Asian cultures is the remembrance of ancestors whohave passed away on the anniversary of their death, All Souls Day, or on other specialoccasions. Overall, 54.4% of the respondents felt that the tradition was either somewhator very important. There were differences based on age. The young-old were more aptto feel this tradition was not at all important (47.6%) or somewhat important (38%)than were the old-old (41.5% and 33% respectively). Those age 75 and older were moreapt to feel such remembrances were very important (25.4% vs. 14.4%).
Ethnic differences were observed. Fully 100% of the Vietnamese elders and 84.6% ofthe Filipino elders were the most apt to feel that such remembrances were not impor-tant at all. Opinions among the other four ethnic groups were more evenly distributed,with more than 50% of the people in these groups sharing the view that ancestralremembrances were somewhat or very important (see Figure 5.3).
Figure 5.3: Remembering Ancestors“It is important to remember other family members who have passedaway on the anniversary of their death, All Souls Day, or other spe-cial occasions.” (Percentage) (Statistically significant)
Decisions by Eldest SonThere were no gender or age differences in the elders’ opinions that, in the absence ofthe father, the eldest son rather than the mother should make the most important deci-sions (if the son is old enough). Among all the elders, 65% felt that this tradition waseither somewhat or very important.
Ethnic differences were marked. The Vietnamese (80%), Filipino (64.7%) and Korean(47.5%) elders were the most apt to feel that having the elder son make important deci-sions was not important at all. Japanese (60%) and Indian (53.5%) elders were themost likely to feel that this custom was very important. Chinese elders were almostevenly distributed in their opinions across all three rankings (33.7% very, 36.6% some-what, and 29.7% not at all important). Figure 5.4 summarizes the findings by ethnicgroup.
ASIAN AMERICAN ELDERS IN NEW YORK CITY
ASIAN AMERICAN FEDERATION OF NEW YORK 89
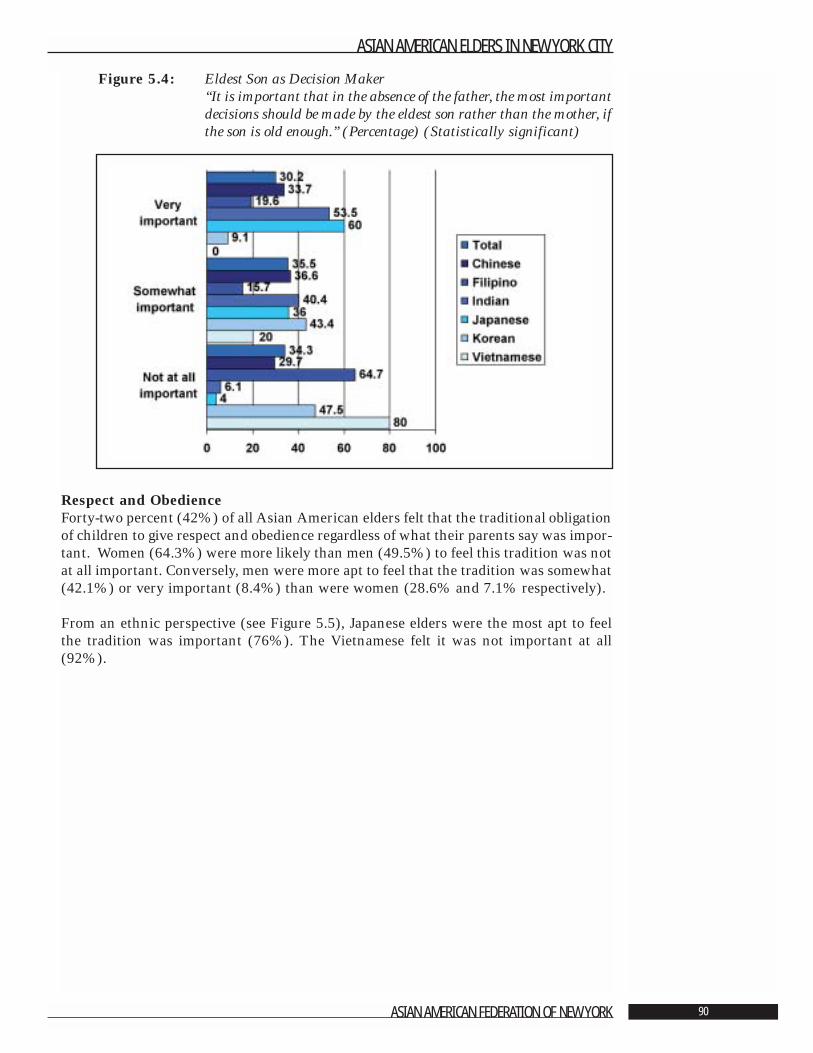
Figure 5.4: Eldest Son as Decision Maker“It is important that in the absence of the father, the most importantdecisions should be made by the eldest son rather than the mother, ifthe son is old enough.” (Percentage) (Statistically significant)
Respect and ObedienceForty-two percent (42%) of all Asian American elders felt that the traditional obligationof children to give respect and obedience regardless of what their parents say was impor-tant. Women (64.3%) were more likely than men (49.5%) to feel this tradition was notat all important. Conversely, men were more apt to feel that the tradition was somewhat(42.1%) or very important (8.4%) than were women (28.6% and 7.1% respectively).
From an ethnic perspective (see Figure 5.5), Japanese elders were the most apt to feelthe tradition was important (76%). The Vietnamese felt it was not important at all(92%).
ASIAN AMERICAN ELDERS IN NEW YORK CITY
ASIAN AMERICAN FEDERATION OF NEW YORK 90
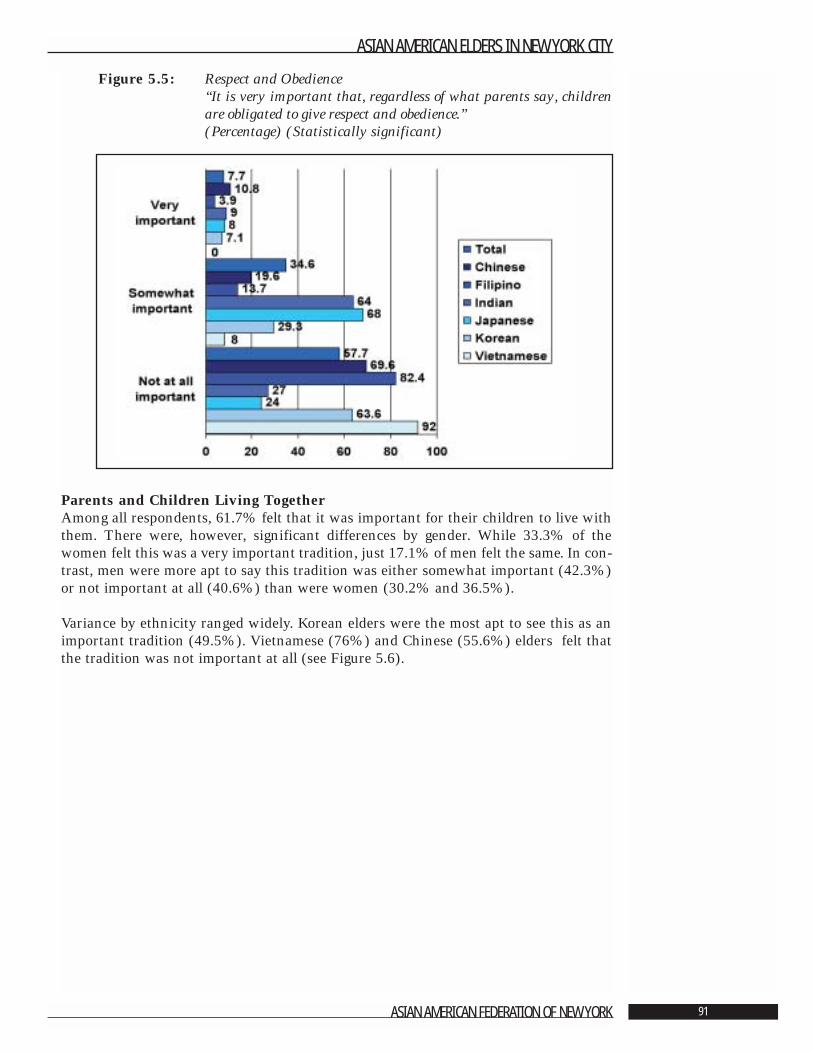
Figure 5.5: Respect and Obedience“It is very important that, regardless of what parents say, childrenare obligated to give respect and obedience.” (Percentage) (Statistically significant)
Parents and Children Living TogetherAmong all respondents, 61.7% felt that it was important for their children to live withthem. There were, however, significant differences by gender. While 33.3% of thewomen felt this was a very important tradition, just 17.1% of men felt the same. In con-trast, men were more apt to say this tradition was either somewhat important (42.3%)or not important at all (40.6%) than were women (30.2% and 36.5%).
Variance by ethnicity ranged widely. Korean elders were the most apt to see this as animportant tradition (49.5%). Vietnamese (76%) and Chinese (55.6%) elders felt thatthe tradition was not important at all (see Figure 5.6).
ASIAN AMERICAN ELDERS IN NEW YORK CITY
ASIAN AMERICAN FEDERATION OF NEW YORK 91
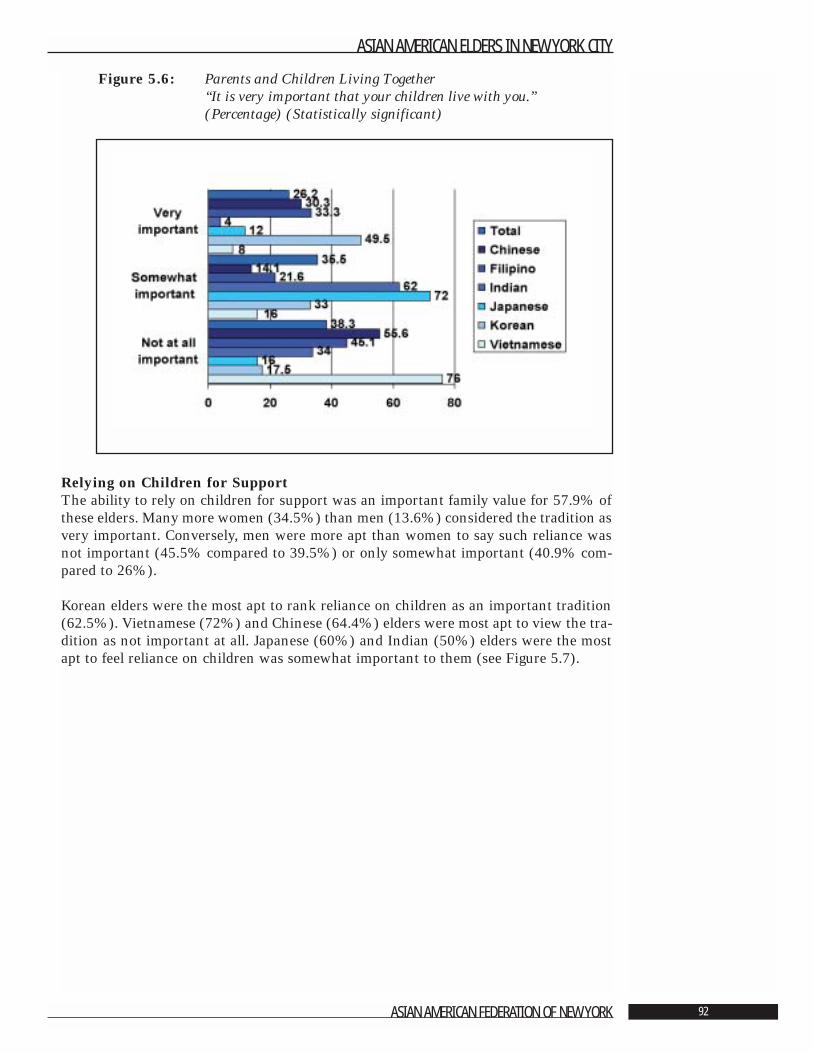
Figure 5.6: Parents and Children Living Together“It is very important that your children live with you.” (Percentage) (Statistically significant)
Relying on Children for SupportThe ability to rely on children for support was an important family value for 57.9% ofthese elders. Many more women (34.5%) than men (13.6%) considered the tradition asvery important. Conversely, men were more apt than women to say such reliance wasnot important (45.5% compared to 39.5%) or only somewhat important (40.9% com-pared to 26%).
Korean elders were the most apt to rank reliance on children as an important tradition(62.5%). Vietnamese (72%) and Chinese (64.4%) elders were most apt to view the tra-dition as not important at all. Japanese (60%) and Indian (50%) elders were the mostapt to feel reliance on children was somewhat important to them (see Figure 5.7).
ASIAN AMERICAN ELDERS IN NEW YORK CITY
ASIAN AMERICAN FEDERATION OF NEW YORK 92
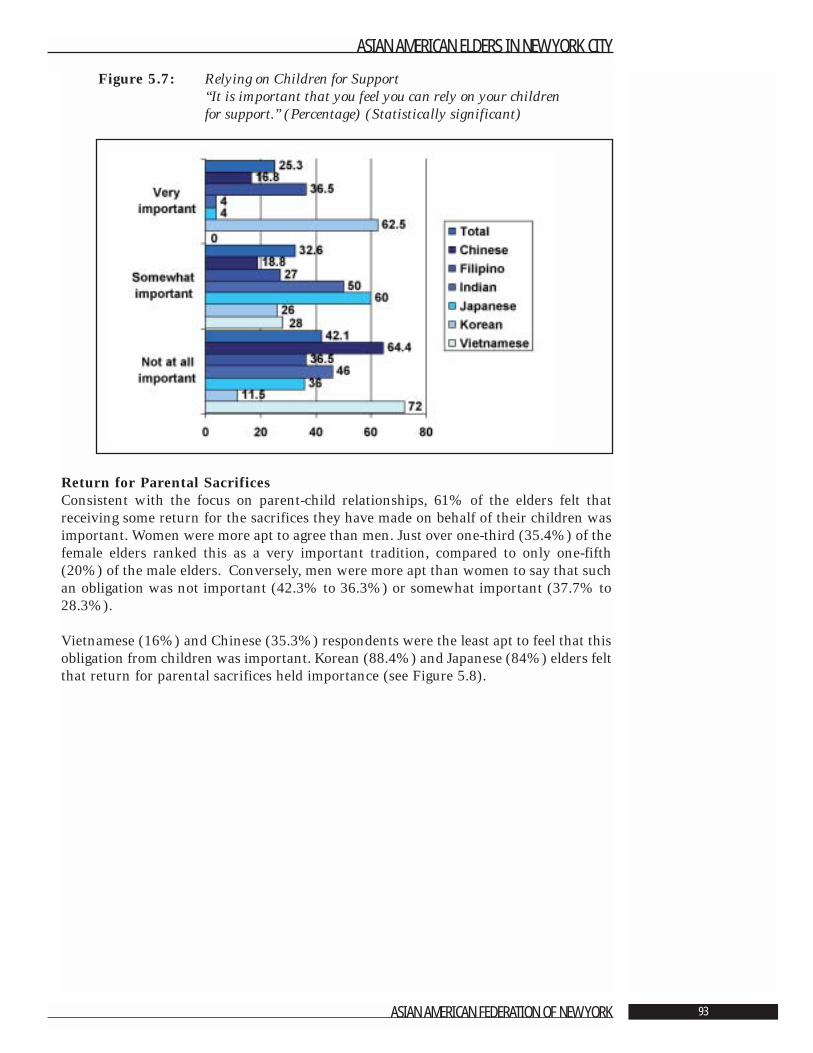
Figure 5.7: Relying on Children for Support“It is important that you feel you can rely on your children for support.” (Percentage) (Statistically significant)
Return for Parental SacrificesConsistent with the focus on parent-child relationships, 61% of the elders felt thatreceiving some return for the sacrifices they have made on behalf of their children wasimportant. Women were more apt to agree than men. Just over one-third (35.4%) of thefemale elders ranked this as a very important tradition, compared to only one-fifth(20%) of the male elders. Conversely, men were more apt than women to say that suchan obligation was not important (42.3% to 36.3%) or somewhat important (37.7% to28.3%).
Vietnamese (16%) and Chinese (35.3%) respondents were the least apt to feel that thisobligation from children was important. Korean (88.4%) and Japanese (84%) elders feltthat return for parental sacrifices held importance (see Figure 5.8).
ASIAN AMERICAN ELDERS IN NEW YORK CITY
ASIAN AMERICAN FEDERATION OF NEW YORK 93
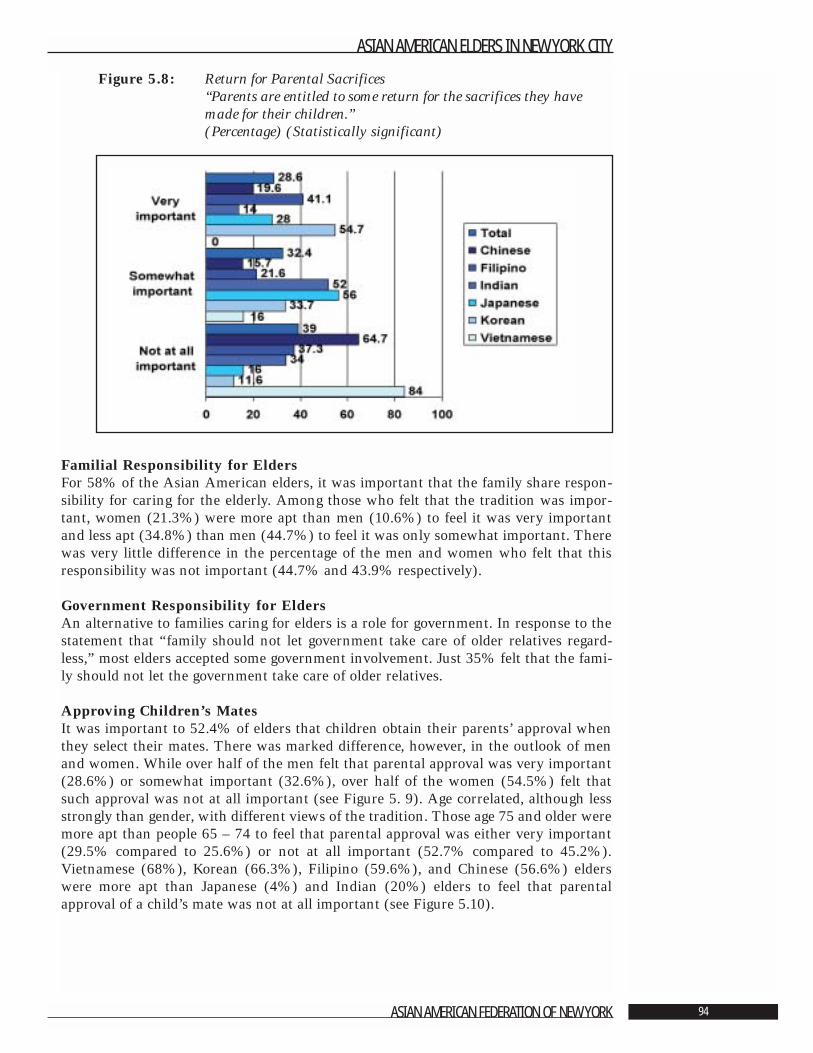
Figure 5.8: Return for Parental Sacrifices“Parents are entitled to some return for the sacrifices they havemade for their children.” (Percentage) (Statistically significant)
Familial Responsibility for EldersFor 58% of the Asian American elders, it was important that the family share respon-sibility for caring for the elderly. Among those who felt that the tradition was impor-tant, women (21.3%) were more apt than men (10.6%) to feel it was very importantand less apt (34.8%) than men (44.7%) to feel it was only somewhat important. Therewas very little difference in the percentage of the men and women who felt that thisresponsibility was not important (44.7% and 43.9% respectively).
Government Responsibility for EldersAn alternative to families caring for elders is a role for government. In response to thestatement that “family should not let government take care of older relatives regard-less,” most elders accepted some government involvement. Just 35% felt that the fami-ly should not let the government take care of older relatives.
Approving Children’s MatesIt was important to 52.4% of elders that children obtain their parents’ approval whenthey select their mates. There was marked difference, however, in the outlook of menand women. While over half of the men felt that parental approval was very important(28.6%) or somewhat important (32.6%), over half of the women (54.5%) felt thatsuch approval was not at all important (see Figure 5. 9). Age correlated, although lessstrongly than gender, with different views of the tradition. Those age 75 and older weremore apt than people 65 – 74 to feel that parental approval was either very important(29.5% compared to 25.6%) or not at all important (52.7% compared to 45.2%).Vietnamese (68%), Korean (66.3%), Filipino (59.6%), and Chinese (56.6%) elderswere more apt than Japanese (4%) and Indian (20%) elders to feel that parentalapproval of a child’s mate was not at all important (see Figure 5.10).
ASIAN AMERICAN ELDERS IN NEW YORK CITY
ASIAN AMERICAN FEDERATION OF NEW YORK 94
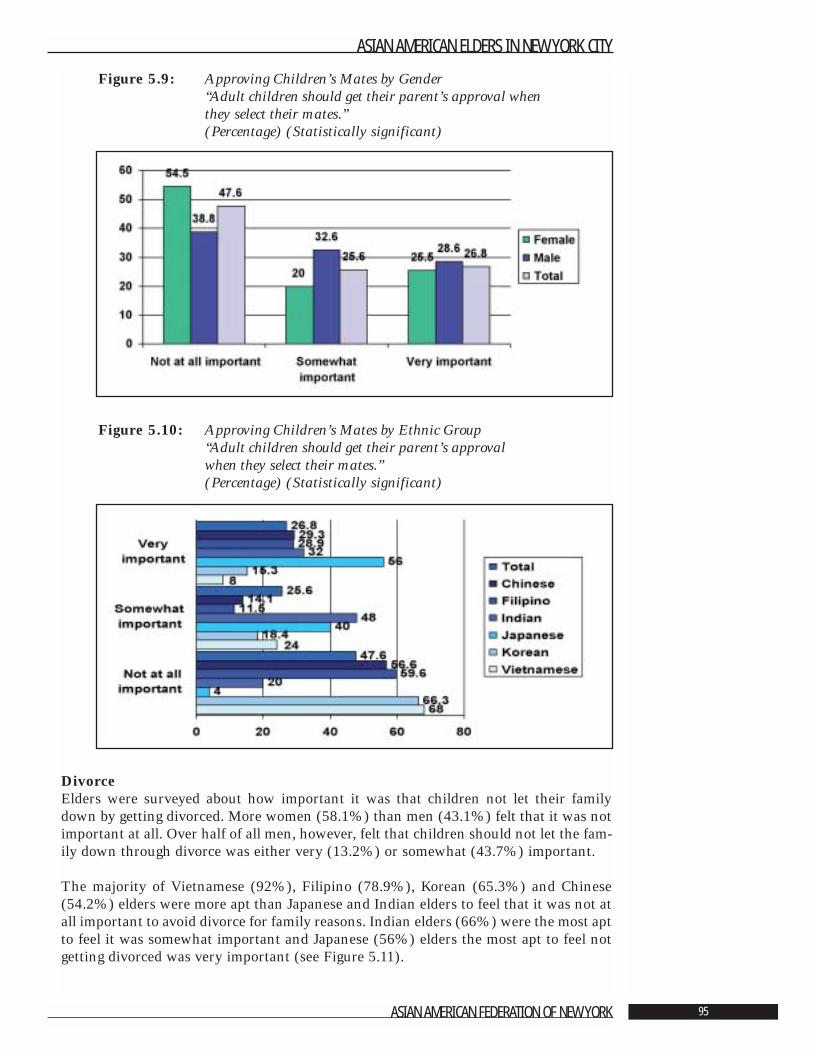
Figure 5.9: Approving Children’s Mates by Gender“Adult children should get their parent’s approval when they select their mates.” (Percentage) (Statistically significant)
Figure 5.10: Approving Children’s Mates by Ethnic Group“Adult children should get their parent’s approval when they select their mates.” (Percentage) (Statistically significant)
DivorceElders were surveyed about how important it was that children not let their familydown by getting divorced. More women (58.1%) than men (43.1%) felt that it was notimportant at all. Over half of all men, however, felt that children should not let the fam-ily down through divorce was either very (13.2%) or somewhat (43.7%) important.
The majority of Vietnamese (92%), Filipino (78.9%), Korean (65.3%) and Chinese(54.2%) elders were more apt than Japanese and Indian elders to feel that it was not atall important to avoid divorce for family reasons. Indian elders (66%) were the most aptto feel it was somewhat important and Japanese (56%) elders the most apt to feel notgetting divorced was very important (see Figure 5.11).
ASIAN AMERICAN ELDERS IN NEW YORK CITY
ASIAN AMERICAN FEDERATION OF NEW YORK 95
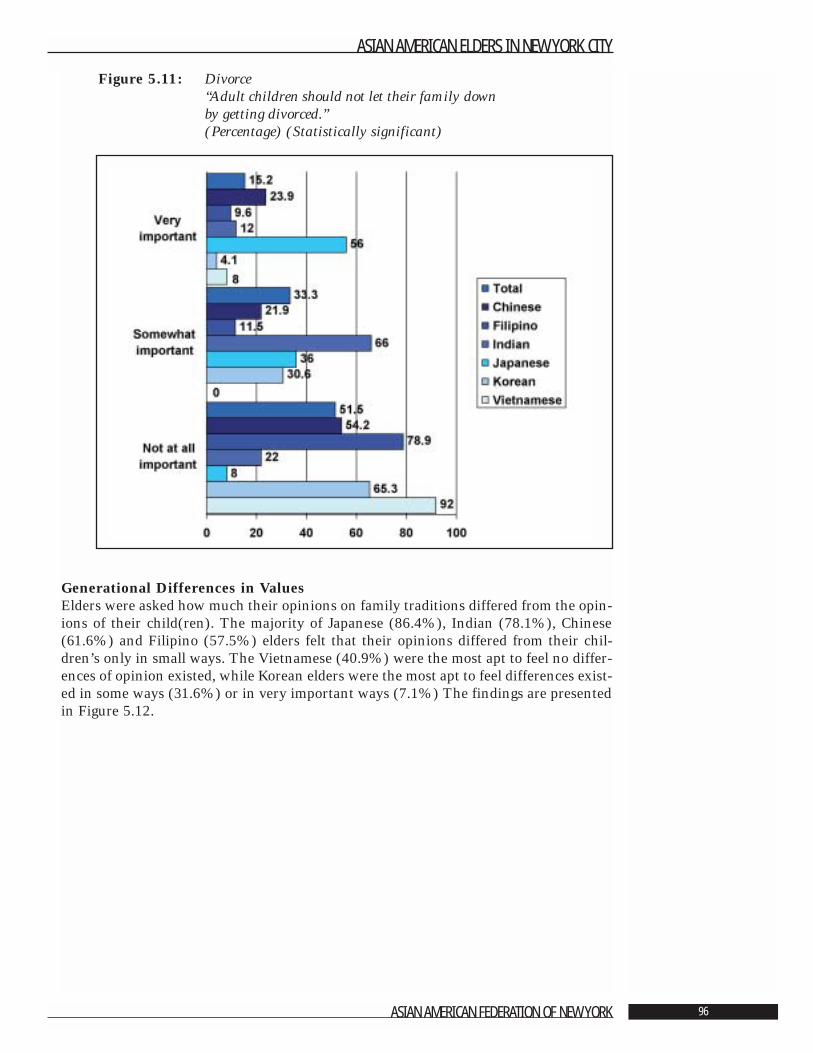
Figure 5.11: Divorce“Adult children should not let their family down by getting divorced.”(Percentage) (Statistically significant)
Generational Differences in ValuesElders were asked how much their opinions on family traditions differed from the opin-ions of their child(ren). The majority of Japanese (86.4%), Indian (78.1%), Chinese(61.6%) and Filipino (57.5%) elders felt that their opinions differed from their chil-dren’s only in small ways. The Vietnamese (40.9%) were the most apt to feel no differ-ences of opinion existed, while Korean elders were the most apt to feel differences exist-ed in some ways (31.6%) or in very important ways (7.1%) The findings are presentedin Figure 5.12.
ASIAN AMERICAN ELDERS IN NEW YORK CITY
ASIAN AMERICAN FEDERATION OF NEW YORK 96
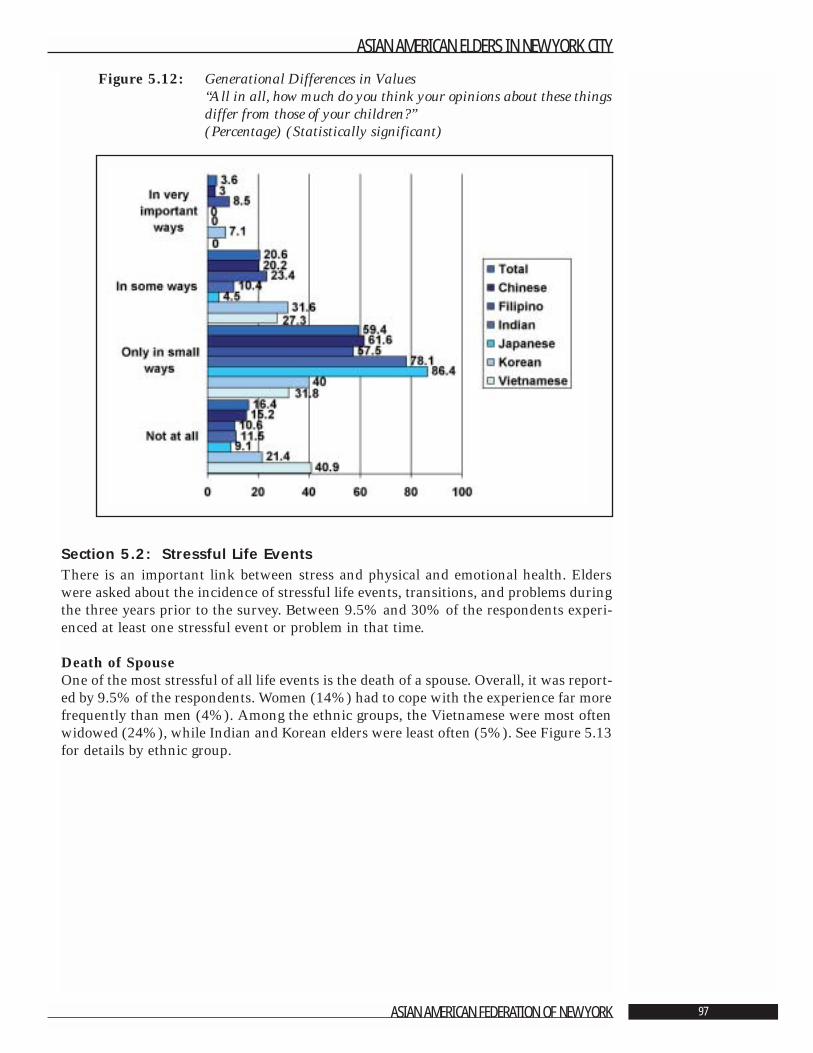
Figure 5.12: Generational Differences in Values“All in all, how much do you think your opinions about these things differ from those of your children?” (Percentage) (Statistically significant)
Section 5.2: Stressful Life EventsThere is an important link between stress and physical and emotional health. Elderswere asked about the incidence of stressful life events, transitions, and problems duringthe three years prior to the survey. Between 9.5% and 30% of the respondents experi-enced at least one stressful event or problem in that time.
Death of SpouseOne of the most stressful of all life events is the death of a spouse. Overall, it was report-ed by 9.5% of the respondents. Women (14%) had to cope with the experience far morefrequently than men (4%). Among the ethnic groups, the Vietnamese were most oftenwidowed (24%), while Indian and Korean elders were least often (5%). See Figure 5.13for details by ethnic group.
ASIAN AMERICAN ELDERS IN NEW YORK CITY
ASIAN AMERICAN FEDERATION OF NEW YORK 97
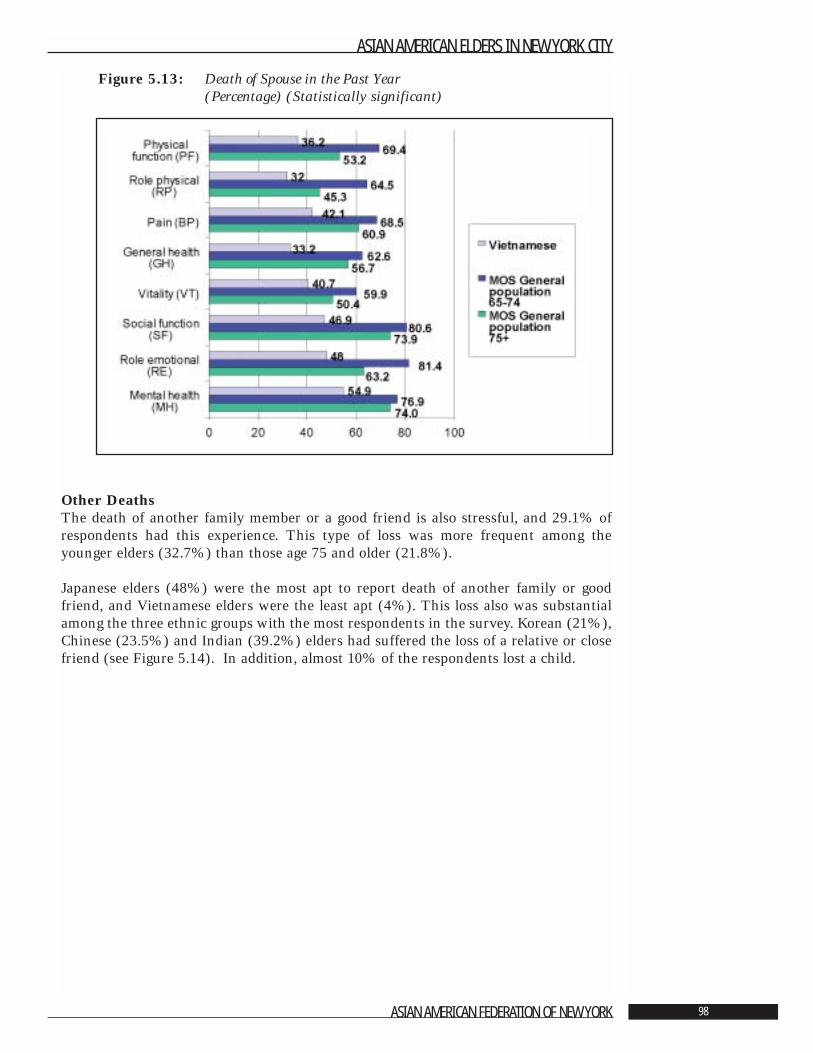
Figure 5.13: Death of Spouse in the Past Year (Percentage) (Statistically significant)
Other DeathsThe death of another family member or a good friend is also stressful, and 29.1% ofrespondents had this experience. This type of loss was more frequent among theyounger elders (32.7%) than those age 75 and older (21.8%).
Japanese elders (48%) were the most apt to report death of another family or goodfriend, and Vietnamese elders were the least apt (4%). This loss also was substantialamong the three ethnic groups with the most respondents in the survey. Korean (21%),Chinese (23.5%) and Indian (39.2%) elders had suffered the loss of a relative or closefriend (see Figure 5.14). In addition, almost 10% of the respondents lost a child.
ASIAN AMERICAN ELDERS IN NEW YORK CITY
ASIAN AMERICAN FEDERATION OF NEW YORK 98
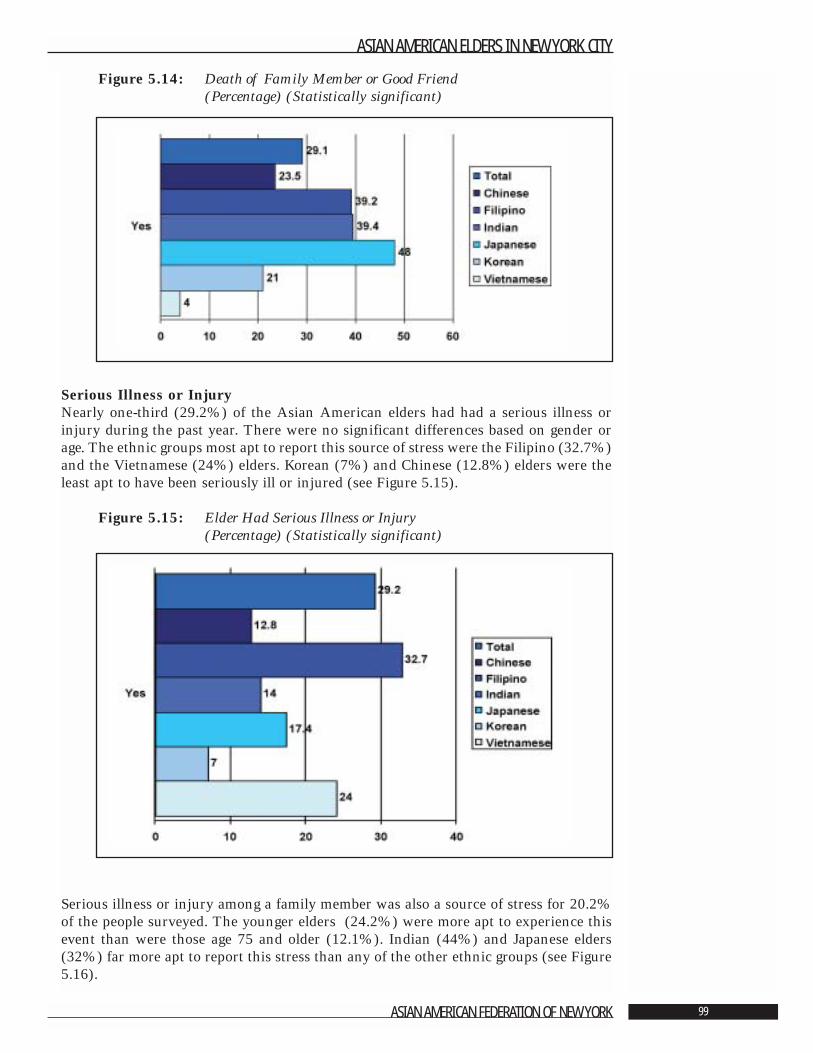
Figure 5.14: Death of Family Member or Good Friend (Percentage) (Statistically significant)
Serious Illness or InjuryNearly one-third (29.2%) of the Asian American elders had had a serious illness orinjury during the past year. There were no significant differences based on gender orage. The ethnic groups most apt to report this source of stress were the Filipino (32.7%)and the Vietnamese (24%) elders. Korean (7%) and Chinese (12.8%) elders were theleast apt to have been seriously ill or injured (see Figure 5.15).
Figure 5.15: Elder Had Serious Illness or Injury (Percentage) (Statistically significant)
Serious illness or injury among a family member was also a source of stress for 20.2%of the people surveyed. The younger elders (24.2%) were more apt to experience thisevent than were those age 75 and older (12.1%). Indian (44%) and Japanese elders(32%) far more apt to report this stress than any of the other ethnic groups (see Figure5.16).
ASIAN AMERICAN ELDERS IN NEW YORK CITY
ASIAN AMERICAN FEDERATION OF NEW YORK 99
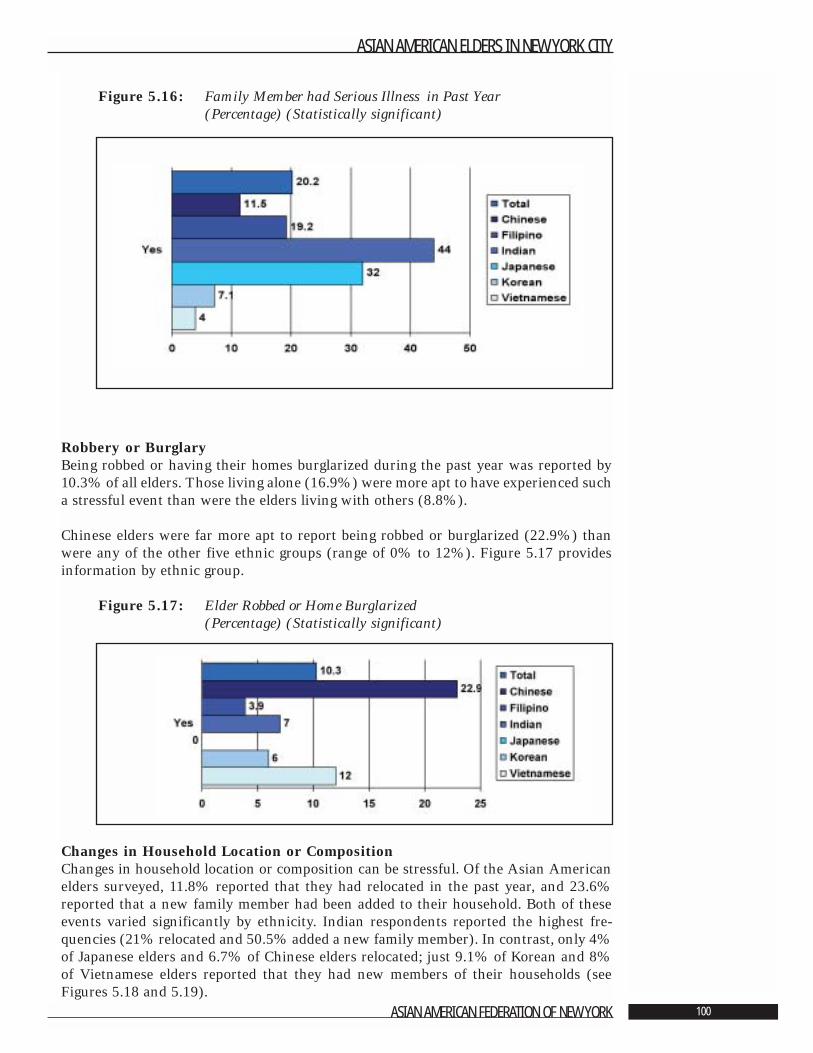
Figure 5.16: Family Member had Serious Illness in Past Year (Percentage) (Statistically significant)
Robbery or BurglaryBeing robbed or having their homes burglarized during the past year was reported by10.3% of all elders. Those living alone (16.9%) were more apt to have experienced sucha stressful event than were the elders living with others (8.8%).
Chinese elders were far more apt to report being robbed or burglarized (22.9%) thanwere any of the other five ethnic groups (range of 0% to 12%). Figure 5.17 providesinformation by ethnic group.
Figure 5.17: Elder Robbed or Home Burglarized (Percentage) (Statistically significant)
Changes in Household Location or CompositionChanges in household location or composition can be stressful. Of the Asian Americanelders surveyed, 11.8% reported that they had relocated in the past year, and 23.6%reported that a new family member had been added to their household. Both of theseevents varied significantly by ethnicity. Indian respondents reported the highest fre-quencies (21% relocated and 50.5% added a new family member). In contrast, only 4%of Japanese elders and 6.7% of Chinese elders relocated; just 9.1% of Korean and 8%of Vietnamese elders reported that they had new members of their households (seeFigures 5.18 and 5.19).
ASIAN AMERICAN ELDERS IN NEW YORK CITY
ASIAN AMERICAN FEDERATION OF NEW YORK 100
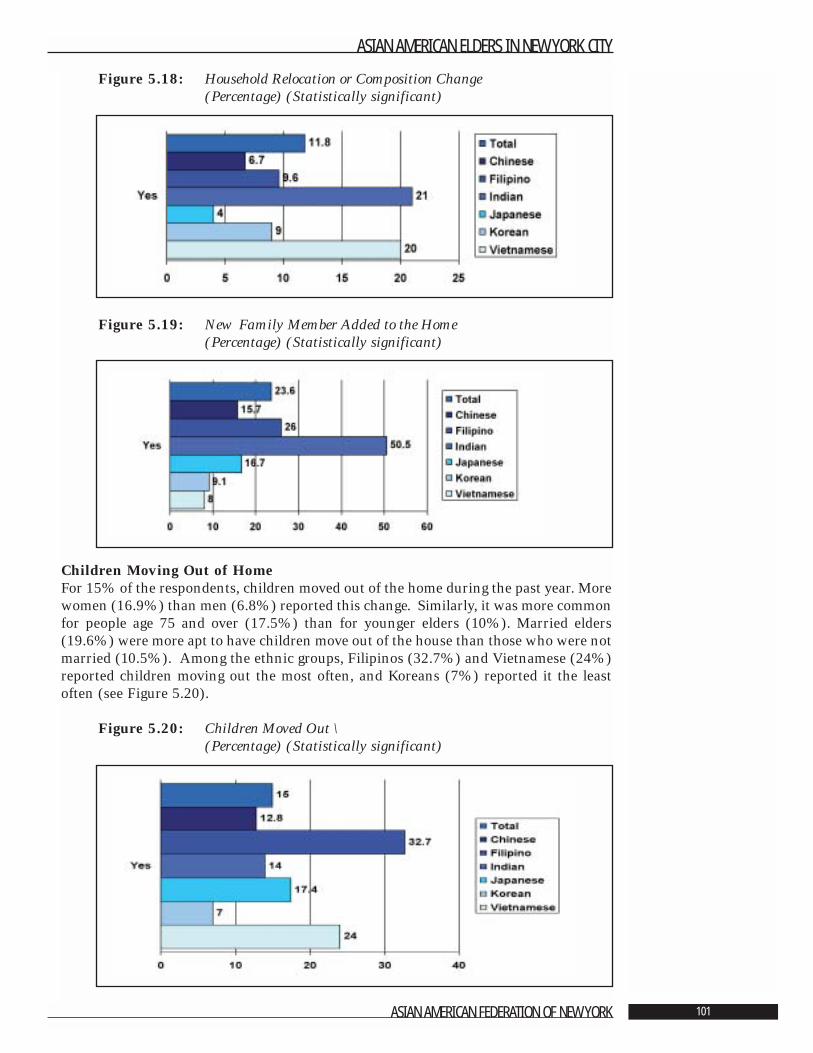
Figure 5.18: Household Relocation or Composition Change(Percentage) (Statistically significant)
Figure 5.19: New Family Member Added to the Home (Percentage) (Statistically significant)
Children Moving Out of HomeFor 15% of the respondents, children moved out of the home during the past year. Morewomen (16.9%) than men (6.8%) reported this change. Similarly, it was more commonfor people age 75 and over (17.5%) than for younger elders (10%). Married elders(19.6%) were more apt to have children move out of the house than those who were notmarried (10.5%). Among the ethnic groups, Filipinos (32.7%) and Vietnamese (24%)reported children moving out the most often, and Koreans (7%) reported it the leastoften (see Figure 5.20).
Figure 5.20: Children Moved Out \(Percentage) (Statistically significant)
ASIAN AMERICAN ELDERS IN NEW YORK CITY
ASIAN AMERICAN FEDERATION OF NEW YORK 101
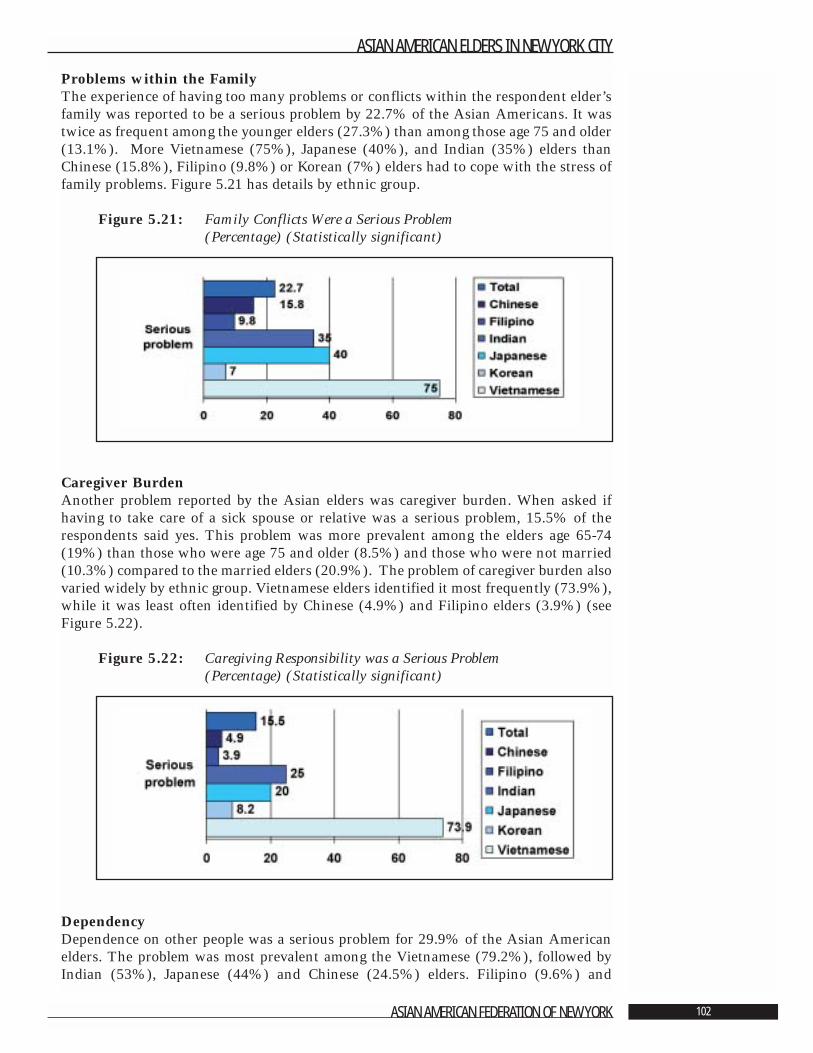
Problems within the FamilyThe experience of having too many problems or conflicts within the respondent elder’sfamily was reported to be a serious problem by 22.7% of the Asian Americans. It wastwice as frequent among the younger elders (27.3%) than among those age 75 and older(13.1%). More Vietnamese (75%), Japanese (40%), and Indian (35%) elders thanChinese (15.8%), Filipino (9.8%) or Korean (7%) elders had to cope with the stress offamily problems. Figure 5.21 has details by ethnic group.
Figure 5.21: Family Conflicts Were a Serious Problem (Percentage) (Statistically significant)
Caregiver BurdenAnother problem reported by the Asian elders was caregiver burden. When asked ifhaving to take care of a sick spouse or relative was a serious problem, 15.5% of therespondents said yes. This problem was more prevalent among the elders age 65-74(19%) than those who were age 75 and older (8.5%) and those who were not married(10.3%) compared to the married elders (20.9%). The problem of caregiver burden alsovaried widely by ethnic group. Vietnamese elders identified it most frequently (73.9%),while it was least often identified by Chinese (4.9%) and Filipino elders (3.9%) (seeFigure 5.22).
Figure 5.22: Caregiving Responsibility was a Serious Problem (Percentage) (Statistically significant)
DependencyDependence on other people was a serious problem for 29.9% of the Asian Americanelders. The problem was most prevalent among the Vietnamese (79.2%), followed byIndian (53%), Japanese (44%) and Chinese (24.5%) elders. Filipino (9.6%) and
ASIAN AMERICAN ELDERS IN NEW YORK CITY
ASIAN AMERICAN FEDERATION OF NEW YORK 102
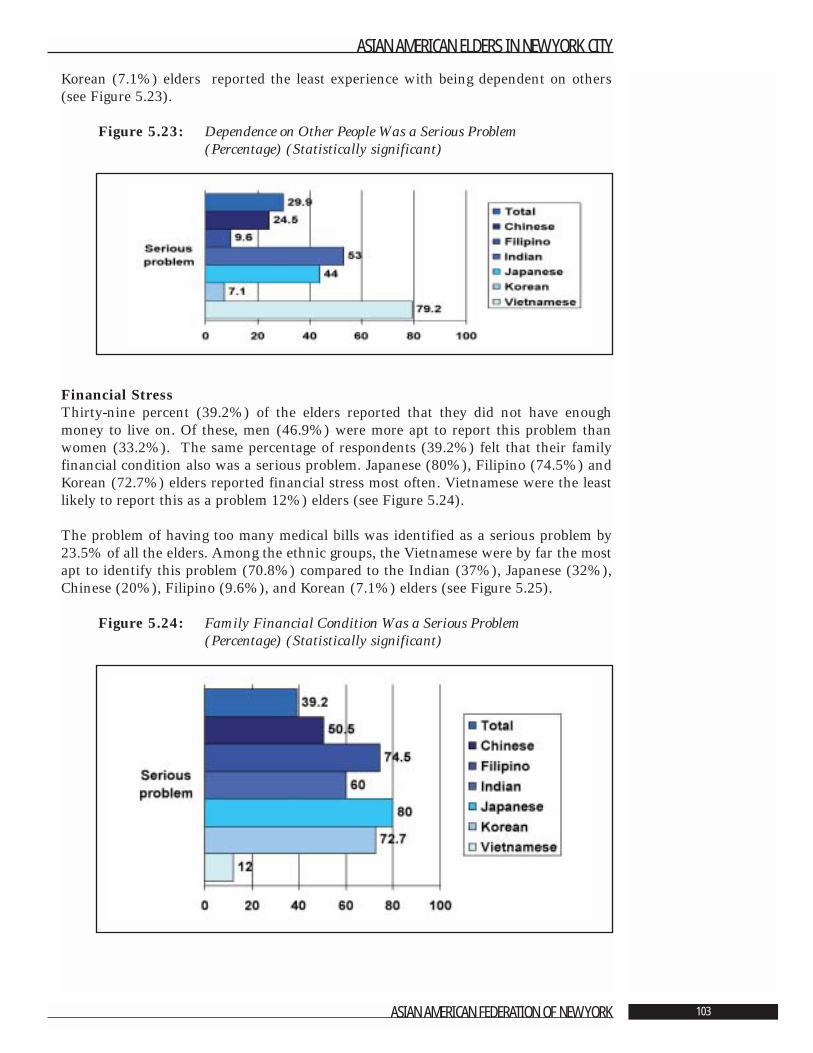
Korean (7.1%) elders reported the least experience with being dependent on others(see Figure 5.23).
Figure 5.23: Dependence on Other People Was a Serious Problem (Percentage) (Statistically significant)
Financial StressThirty-nine percent (39.2%) of the elders reported that they did not have enoughmoney to live on. Of these, men (46.9%) were more apt to report this problem thanwomen (33.2%). The same percentage of respondents (39.2%) felt that their familyfinancial condition also was a serious problem. Japanese (80%), Filipino (74.5%) andKorean (72.7%) elders reported financial stress most often. Vietnamese were the leastlikely to report this as a problem 12%) elders (see Figure 5.24).
The problem of having too many medical bills was identified as a serious problem by23.5% of all the elders. Among the ethnic groups, the Vietnamese were by far the mostapt to identify this problem (70.8%) compared to the Indian (37%), Japanese (32%),Chinese (20%), Filipino (9.6%), and Korean (7.1%) elders (see Figure 5.25).
Figure 5.24: Family Financial Condition Was a Serious Problem (Percentage) (Statistically significant)
ASIAN AMERICAN ELDERS IN NEW YORK CITY
ASIAN AMERICAN FEDERATION OF NEW YORK 103
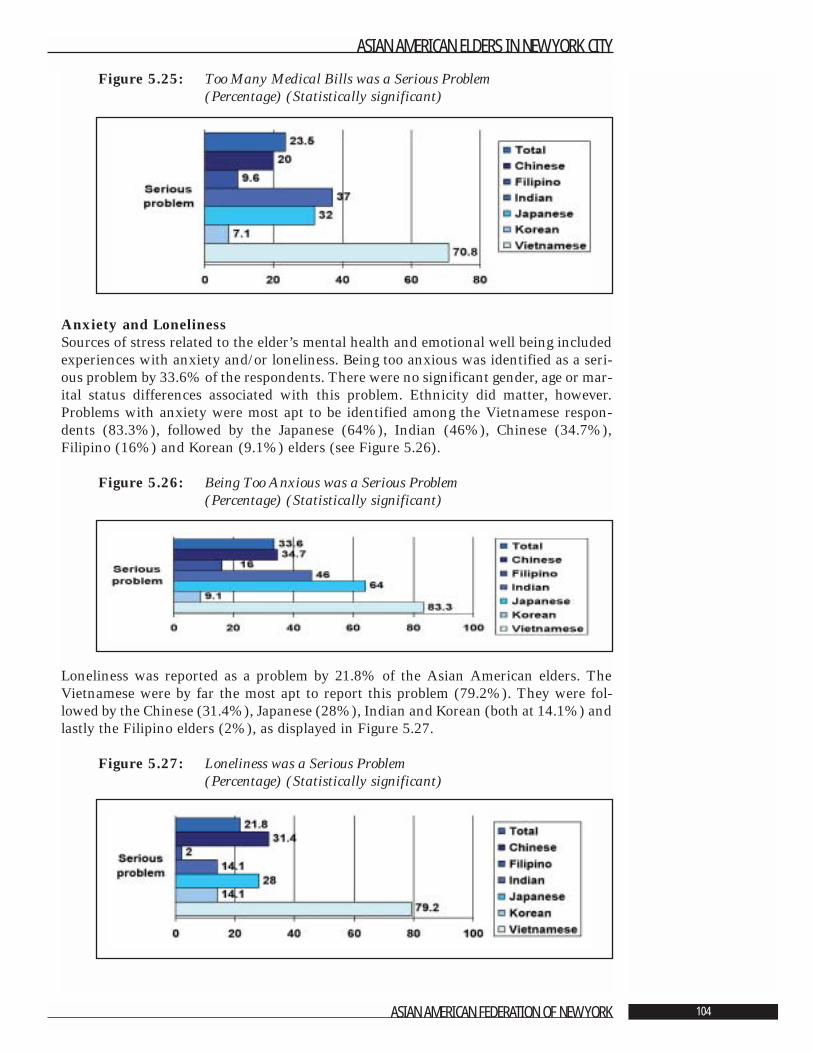
Figure 5.25: Too Many Medical Bills was a Serious Problem (Percentage) (Statistically significant)
Anxiety and LonelinessSources of stress related to the elder’s mental health and emotional well being includedexperiences with anxiety and/or loneliness. Being too anxious was identified as a seri-ous problem by 33.6% of the respondents. There were no significant gender, age or mar-ital status differences associated with this problem. Ethnicity did matter, however.Problems with anxiety were most apt to be identified among the Vietnamese respon-dents (83.3%), followed by the Japanese (64%), Indian (46%), Chinese (34.7%),Filipino (16%) and Korean (9.1%) elders (see Figure 5.26).
Figure 5.26: Being Too Anxious was a Serious Problem (Percentage) (Statistically significant)
Loneliness was reported as a problem by 21.8% of the Asian American elders. TheVietnamese were by far the most apt to report this problem (79.2%). They were fol-lowed by the Chinese (31.4%), Japanese (28%), Indian and Korean (both at 14.1%) andlastly the Filipino elders (2%), as displayed in Figure 5.27.
Figure 5.27: Loneliness was a Serious Problem (Percentage) (Statistically significant)
ASIAN AMERICAN ELDERS IN NEW YORK CITY
ASIAN AMERICAN FEDERATION OF NEW YORK 104
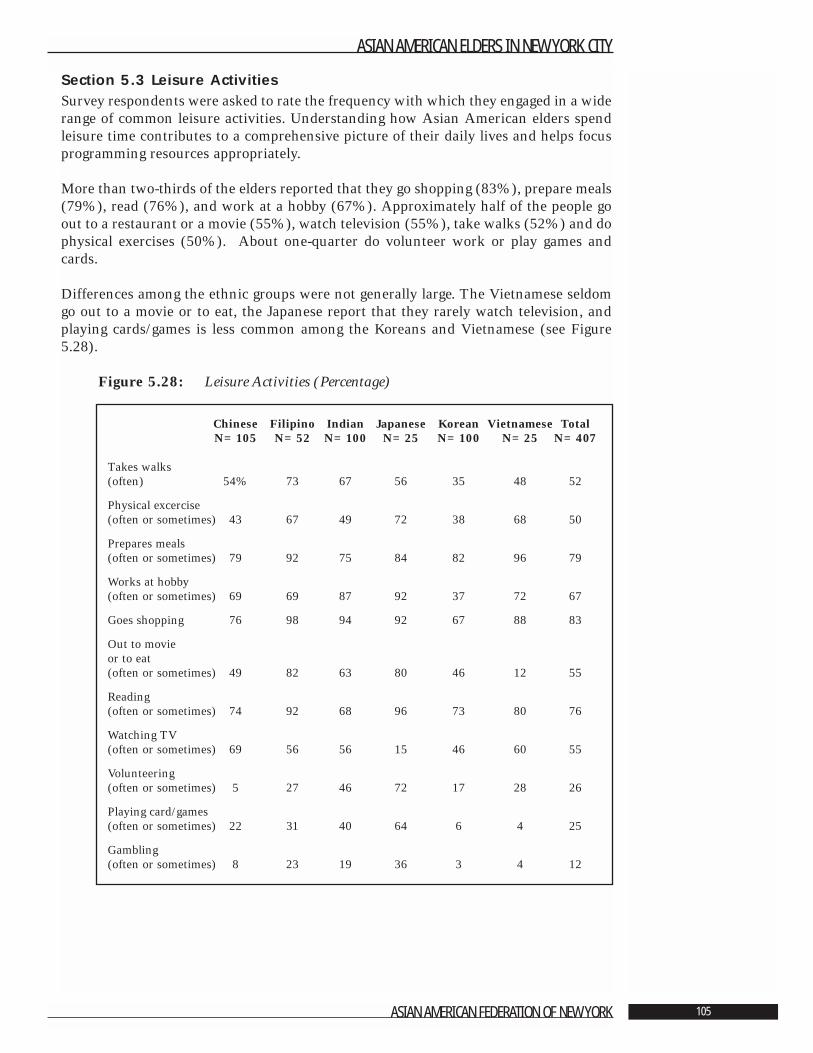
Section 5.3 Leisure ActivitiesSurvey respondents were asked to rate the frequency with which they engaged in a widerange of common leisure activities. Understanding how Asian American elders spendleisure time contributes to a comprehensive picture of their daily lives and helps focusprogramming resources appropriately.
More than two-thirds of the elders reported that they go shopping (83%), prepare meals(79%), read (76%), and work at a hobby (67%). Approximately half of the people goout to a restaurant or a movie (55%), watch television (55%), take walks (52%) and dophysical exercises (50%). About one-quarter do volunteer work or play games andcards.
Differences among the ethnic groups were not generally large. The Vietnamese seldomgo out to a movie or to eat, the Japanese report that they rarely watch television, andplaying cards/games is less common among the Koreans and Vietnamese (see Figure5.28).
Figure 5.28: Leisure Activities (Percentage)
ASIAN AMERICAN ELDERS IN NEW YORK CITY
ASIAN AMERICAN FEDERATION OF NEW YORK 105
Chinese Filipino Indian Japanese Korean Vietnamese TotalN=105 N=52 N=100 N=25 N=100 N=25 N=407
Takes walks (often) 54% 73 67 56 35 48 52
Physical excercise(often or sometimes) 43 67 49 72 38 68 50
Prepares meals(often or sometimes) 79 92 75 84 82 96 79
Works at hobby(often or sometimes) 69 69 87 92 37 72 67
Goes shopping 76 98 94 92 67 88 83
Out to movie or to eat(often or sometimes) 49 82 63 80 46 12 55
Reading(often or sometimes) 74 92 68 96 73 80 76
Watching TV(often or sometimes) 69 56 56 15 46 60 55
Volunteering(often or sometimes) 5 27 46 72 17 28 26
Playing card/games(often or sometimes) 22 31 40 64 6 4 25
Gambling(often or sometimes) 8 23 19 36 3 4 12
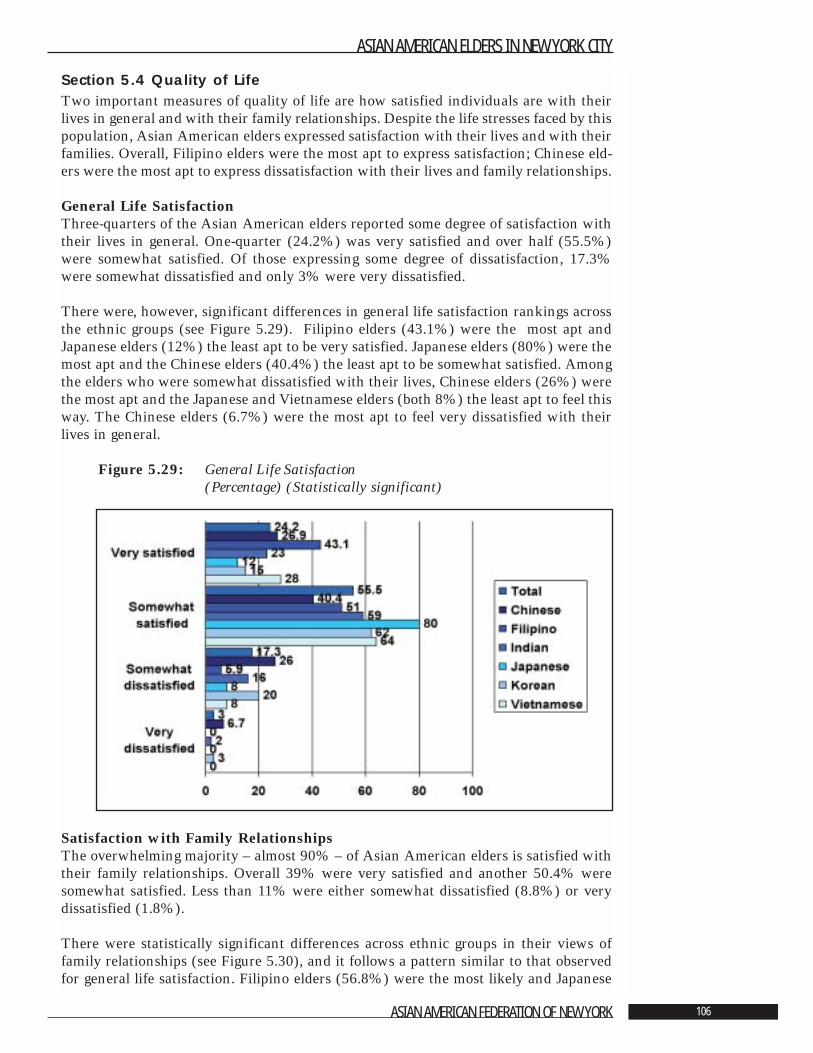
Section 5.4 Quality of LifeTwo important measures of quality of life are how satisfied individuals are with theirlives in general and with their family relationships. Despite the life stresses faced by thispopulation, Asian American elders expressed satisfaction with their lives and with theirfamilies. Overall, Filipino elders were the most apt to express satisfaction; Chinese eld-ers were the most apt to express dissatisfaction with their lives and family relationships.
General Life SatisfactionThree-quarters of the Asian American elders reported some degree of satisfaction withtheir lives in general. One-quarter (24.2%) was very satisfied and over half (55.5%)were somewhat satisfied. Of those expressing some degree of dissatisfaction, 17.3%were somewhat dissatisfied and only 3% were very dissatisfied.
There were, however, significant differences in general life satisfaction rankings acrossthe ethnic groups (see Figure 5.29). Filipino elders (43.1%) were the most apt andJapanese elders (12%) the least apt to be very satisfied. Japanese elders (80%) were themost apt and the Chinese elders (40.4%) the least apt to be somewhat satisfied. Amongthe elders who were somewhat dissatisfied with their lives, Chinese elders (26%) werethe most apt and the Japanese and Vietnamese elders (both 8%) the least apt to feel thisway. The Chinese elders (6.7%) were the most apt to feel very dissatisfied with theirlives in general.
Figure 5.29: General Life Satisfaction (Percentage) (Statistically significant)
Satisfaction with Family RelationshipsThe overwhelming majority – almost 90% – of Asian American elders is satisfied withtheir family relationships. Overall 39% were very satisfied and another 50.4% weresomewhat satisfied. Less than 11% were either somewhat dissatisfied (8.8%) or verydissatisfied (1.8%).
There were statistically significant differences across ethnic groups in their views offamily relationships (see Figure 5.30), and it follows a pattern similar to that observedfor general life satisfaction. Filipino elders (56.8%) were the most likely and Japanese
ASIAN AMERICAN ELDERS IN NEW YORK CITY
ASIAN AMERICAN FEDERATION OF NEW YORK 106
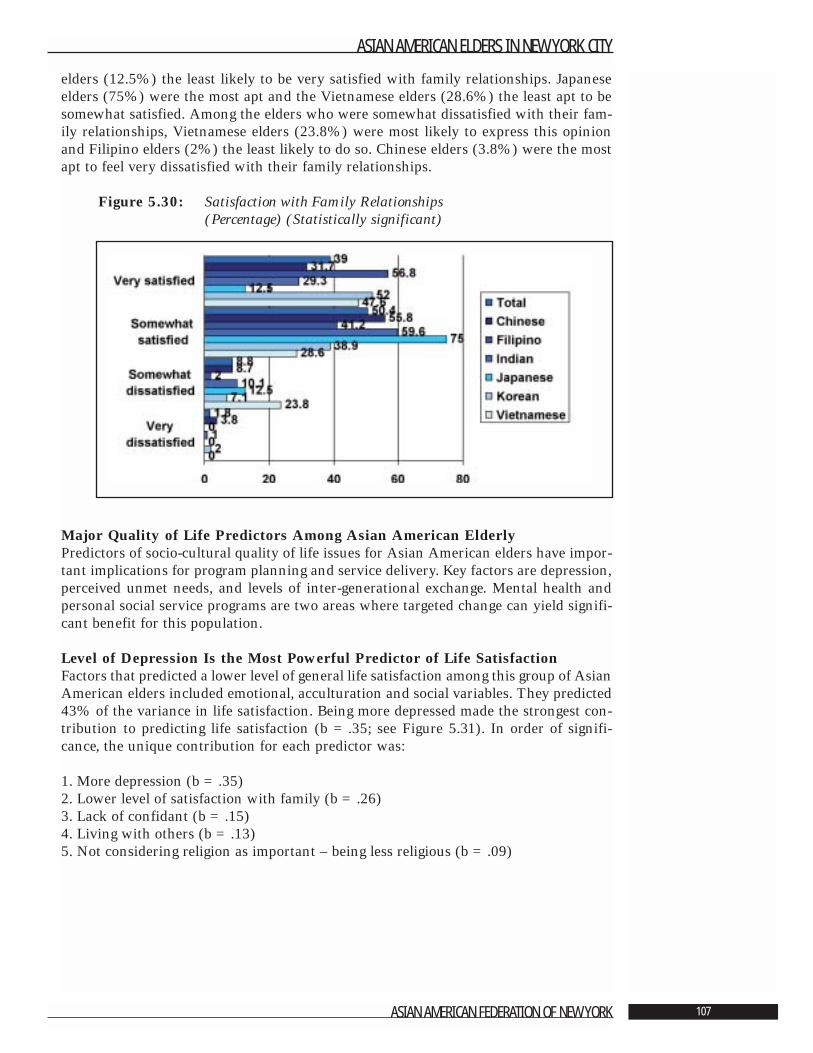
elders (12.5%) the least likely to be very satisfied with family relationships. Japaneseelders (75%) were the most apt and the Vietnamese elders (28.6%) the least apt to besomewhat satisfied. Among the elders who were somewhat dissatisfied with their fam-ily relationships, Vietnamese elders (23.8%) were most likely to express this opinionand Filipino elders (2%) the least likely to do so. Chinese elders (3.8%) were the mostapt to feel very dissatisfied with their family relationships.
Figure 5.30: Satisfaction with Family Relationships (Percentage) (Statistically significant)
Major Quality of Life Predictors Among Asian American Elderly Predictors of socio-cultural quality of life issues for Asian American elders have impor-tant implications for program planning and service delivery. Key factors are depression,perceived unmet needs, and levels of inter-generational exchange. Mental health andpersonal social service programs are two areas where targeted change can yield signifi-cant benefit for this population.
Level of Depression Is the Most Powerful Predictor of Life SatisfactionFactors that predicted a lower level of general life satisfaction among this group of AsianAmerican elders included emotional, acculturation and social variables. They predicted43% of the variance in life satisfaction. Being more depressed made the strongest con-tribution to predicting life satisfaction (b =.35; see Figure 5.31). In order of signifi-cance, the unique contribution for each predictor was:
1. More depression (b =.35)2. Lower level of satisfaction with family (b =.26)3. Lack of confidant (b =.15)4. Living with others (b =.13) 5. Not considering religion as important – being less religious (b =.09)
ASIAN AMERICAN ELDERS IN NEW YORK CITY
ASIAN AMERICAN FEDERATION OF NEW YORK 107
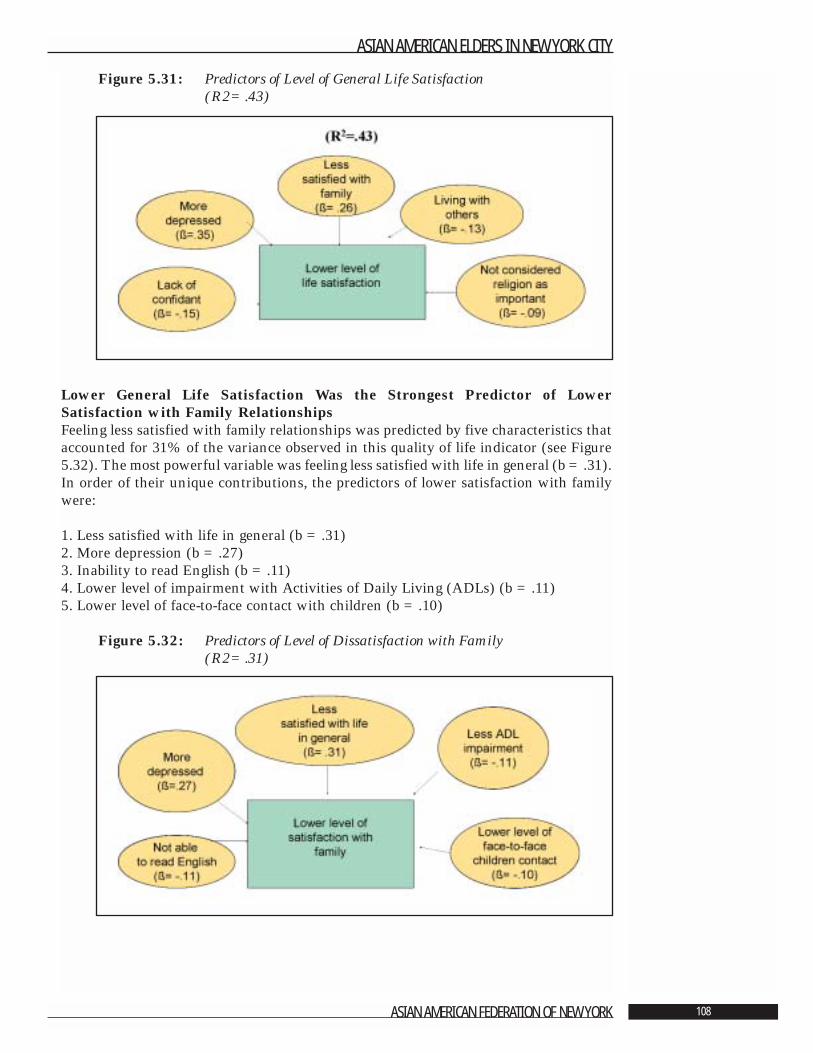
Figure 5.31: Predictors of Level of General Life Satisfaction (R2=.43)
Lower General Life Satisfaction Was the Strongest Predictor of LowerSatisfaction with Family Relationships Feeling less satisfied with family relationships was predicted by five characteristics thataccounted for 31% of the variance observed in this quality of life indicator (see Figure5.32). The most powerful variable was feeling less satisfied with life in general (b =.31).In order of their unique contributions, the predictors of lower satisfaction with familywere:
1. Less satisfied with life in general (b =.31)2. More depression (b =.27)3. Inability to read English (b =.11)4. Lower level of impairment with Activities of Daily Living (ADLs) (b =.11) 5. Lower level of face-to-face contact with children (b =.10)
Figure 5.32: Predictors of Level of Dissatisfaction with Family (R2=.31)
ASIAN AMERICAN ELDERS IN NEW YORK CITY
ASIAN AMERICAN FEDERATION OF NEW YORK 108
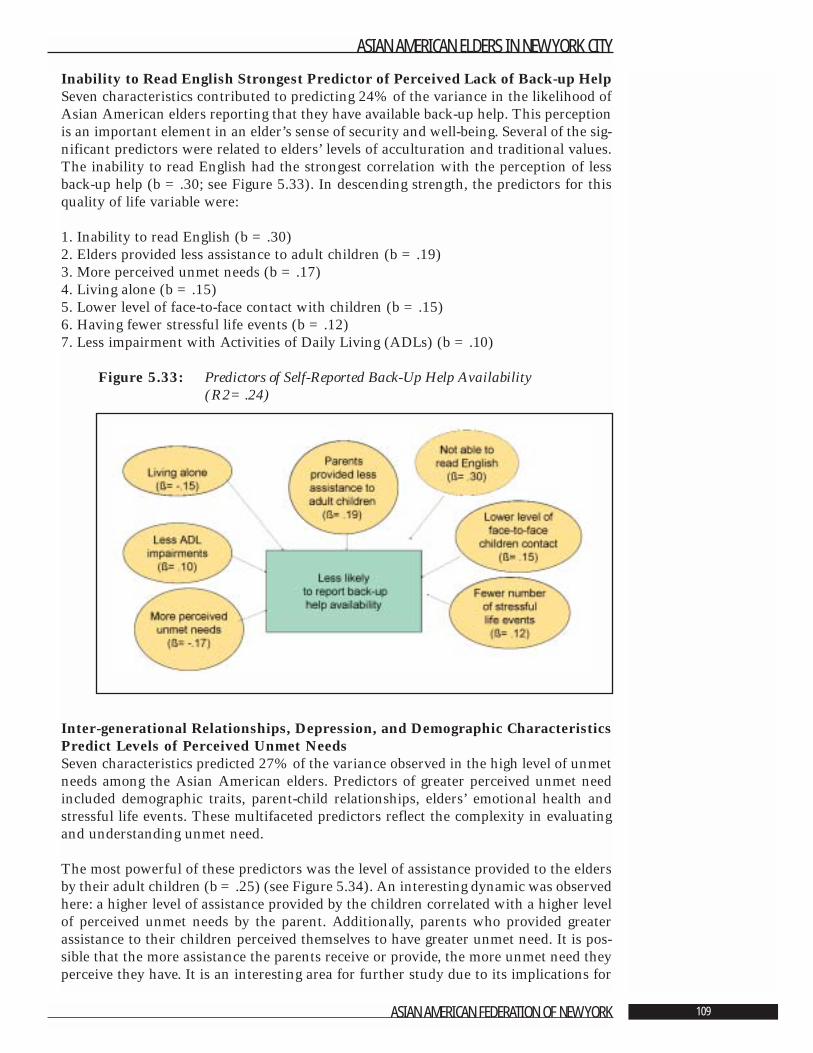
Inability to Read English Strongest Predictor of Perceived Lack of Back-up HelpSeven characteristics contributed to predicting 24% of the variance in the likelihood ofAsian American elders reporting that they have available back-up help. This perceptionis an important element in an elder’s sense of security and well-being. Several of the sig-nificant predictors were related to elders’ levels of acculturation and traditional values.The inability to read English had the strongest correlation with the perception of lessback-up help (b =.30; see Figure 5.33). In descending strength, the predictors for thisquality of life variable were:
1. Inability to read English (b =.30)2. Elders provided less assistance to adult children (b =.19)3. More perceived unmet needs (b =.17)4. Living alone (b =.15)5. Lower level of face-to-face contact with children (b =.15)6. Having fewer stressful life events (b =.12)7. Less impairment with Activities of Daily Living (ADLs) (b =.10)
Figure 5.33: Predictors of Self-Reported Back-Up Help Availability (R2=.24)
Inter-generational Relationships, Depression, and Demographic CharacteristicsPredict Levels of Perceived Unmet NeedsSeven characteristics predicted 27% of the variance observed in the high level of unmetneeds among the Asian American elders. Predictors of greater perceived unmet needincluded demographic traits, parent-child relationships, elders’ emotional health andstressful life events. These multifaceted predictors reflect the complexity in evaluatingand understanding unmet need.
The most powerful of these predictors was the level of assistance provided to the eldersby their adult children (b =.25) (see Figure 5.34). An interesting dynamic was observedhere: a higher level of assistance provided by the children correlated with a higher levelof perceived unmet needs by the parent. Additionally, parents who provided greaterassistance to their children perceived themselves to have greater unmet need. It is pos-sible that the more assistance the parents receive or provide, the more unmet need theyperceive they have. It is an interesting area for further study due to its implications for
ASIAN AMERICAN ELDERS IN NEW YORK CITY
ASIAN AMERICAN FEDERATION OF NEW YORK 109
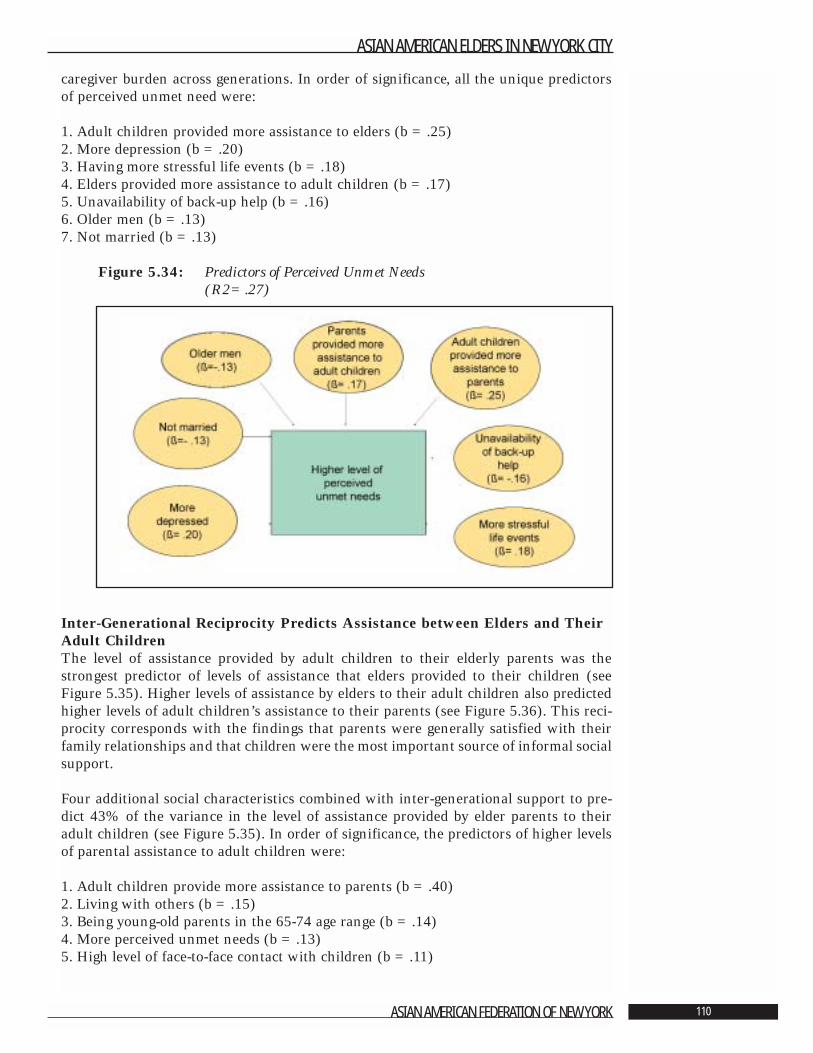
caregiver burden across generations. In order of significance, all the unique predictorsof perceived unmet need were:
1. Adult children provided more assistance to elders (b =.25)2. More depression (b =.20)3. Having more stressful life events (b =.18)4. Elders provided more assistance to adult children (b =.17)5. Unavailability of back-up help (b =.16)6. Older men (b =.13)7. Not married (b =.13)
Figure 5.34: Predictors of Perceived Unmet Needs (R2=.27)
Inter-Generational Reciprocity Predicts Assistance between Elders and TheirAdult Children The level of assistance provided by adult children to their elderly parents was thestrongest predictor of levels of assistance that elders provided to their children (seeFigure 5.35). Higher levels of assistance by elders to their adult children also predictedhigher levels of adult children’s assistance to their parents (see Figure 5.36). This reci-procity corresponds with the findings that parents were generally satisfied with theirfamily relationships and that children were the most important source of informal socialsupport.
Four additional social characteristics combined with inter-generational support to pre-dict 43% of the variance in the level of assistance provided by elder parents to theiradult children (see Figure 5.35). In order of significance, the predictors of higher levelsof parental assistance to adult children were:
1. Adult children provide more assistance to parents (b =.40)2. Living with others (b =.15)3. Being young-old parents in the 65-74 age range (b =.14)4. More perceived unmet needs (b =.13)5. High level of face-to-face contact with children (b =.11)
ASIAN AMERICAN ELDERS IN NEW YORK CITY
ASIAN AMERICAN FEDERATION OF NEW YORK 110
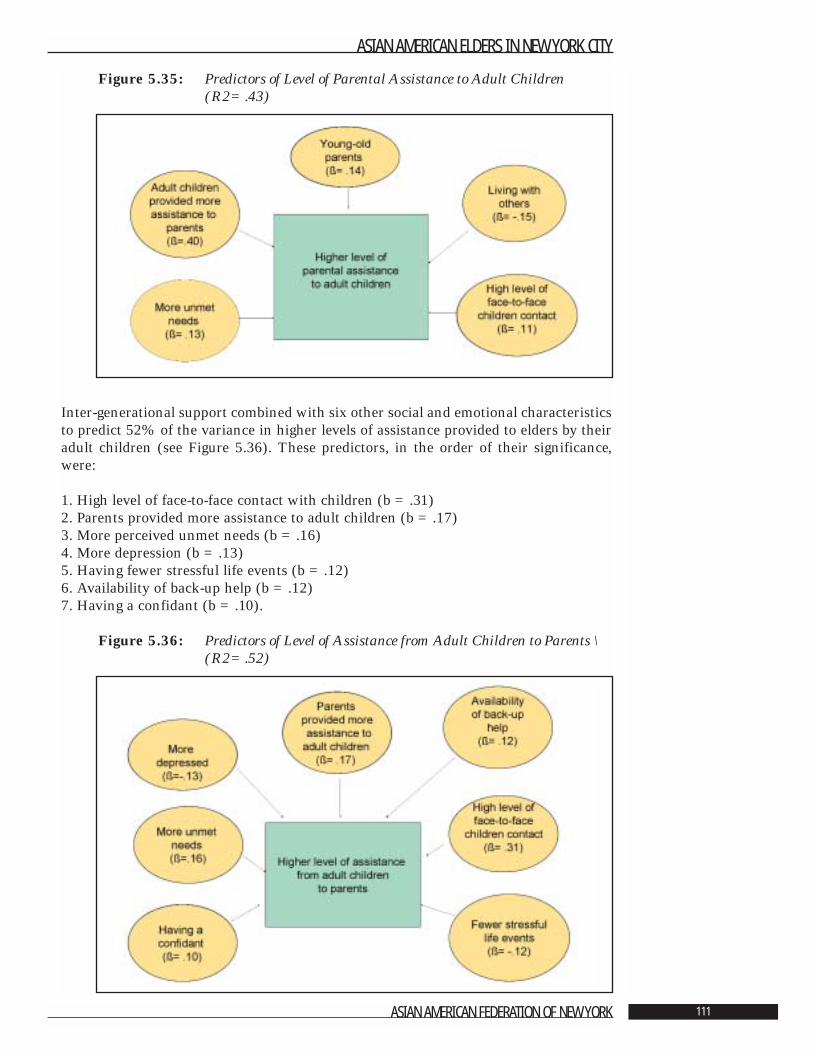
Figure 5.35: Predictors of Level of Parental Assistance to Adult Children (R2=.43)
Inter-generational support combined with six other social and emotional characteristicsto predict 52% of the variance in higher levels of assistance provided to elders by theiradult children (see Figure 5.36). These predictors, in the order of their significance,were:
1. High level of face-to-face contact with children (b =.31)2. Parents provided more assistance to adult children (b =.17)3. More perceived unmet needs (b =.16)4. More depression (b =.13)5. Having fewer stressful life events (b =.12)6. Availability of back-up help (b =.12)7. Having a confidant (b =.10).
Figure 5.36: Predictors of Level of Assistance from Adult Children to Parents \(R2=.52)
ASIAN AMERICAN ELDERS IN NEW YORK CITY
ASIAN AMERICAN FEDERATION OF NEW YORK 111
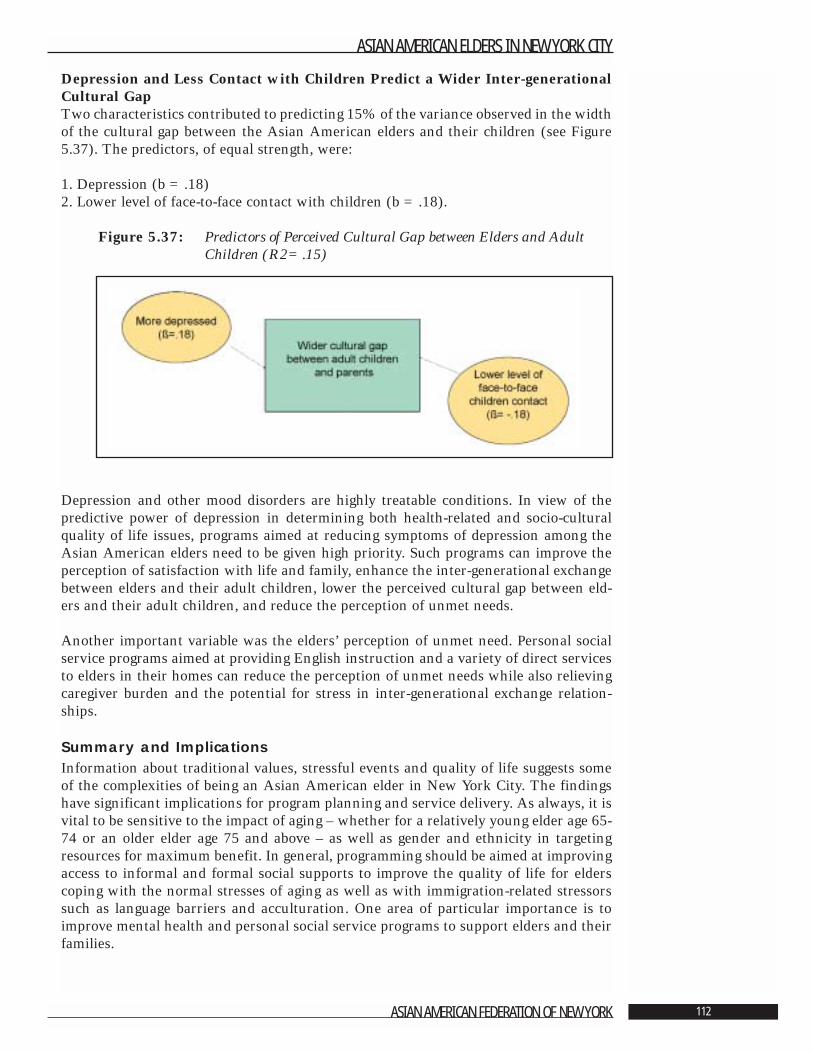
Depression and Less Contact with Children Predict a Wider Inter-generationalCultural GapTwo characteristics contributed to predicting 15% of the variance observed in the widthof the cultural gap between the Asian American elders and their children (see Figure5.37). The predictors, of equal strength, were:
1. Depression (b =.18) 2. Lower level of face-to-face contact with children (b =.18).
Figure 5.37: Predictors of Perceived Cultural Gap between Elders and Adult Children (R2=.15)
Depression and other mood disorders are highly treatable conditions. In view of thepredictive power of depression in determining both health-related and socio-culturalquality of life issues, programs aimed at reducing symptoms of depression among theAsian American elders need to be given high priority. Such programs can improve theperception of satisfaction with life and family, enhance the inter-generational exchangebetween elders and their adult children, lower the perceived cultural gap between eld-ers and their adult children, and reduce the perception of unmet needs.
Another important variable was the elders’ perception of unmet need. Personal socialservice programs aimed at providing English instruction and a variety of direct servicesto elders in their homes can reduce the perception of unmet needs while also relievingcaregiver burden and the potential for stress in inter-generational exchange relation-ships.
Summary and ImplicationsInformation about traditional values, stressful events and quality of life suggests someof the complexities of being an Asian American elder in New York City. The findingshave significant implications for program planning and service delivery. As always, it isvital to be sensitive to the impact of aging – whether for a relatively young elder age 65-74 or an older elder age 75 and above – as well as gender and ethnicity in targetingresources for maximum benefit. In general, programming should be aimed at improvingaccess to informal and formal social supports to improve the quality of life for elderscoping with the normal stresses of aging as well as with immigration-related stressorssuch as language barriers and acculturation. One area of particular importance is toimprove mental health and personal social service programs to support elders and theirfamilies.
ASIAN AMERICAN ELDERS IN NEW YORK CITY
ASIAN AMERICAN FEDERATION OF NEW YORK 112
Traditional Values and Cultural GapsVeneration of aged and deceased relatives, honor for parents demonstrated throughrespect and obedience, and familial responsibility to care for aging relatives are impor-tant traditions in Asian cultures generally. The present study confirmed that these tra-ditions continue to be valued among Asian American elders. It is significant to note thata majority of elders felt that their opinions regarding family traditions differed fromtheir children either not at all or only in small ways. At the same time, professionalsshould observe the level of acculturation and signs of generational gap, recognizing thepotential for conflict between elders and their children and its negative impact on men-tal health. Reinforcement of values shared across generations and communities shouldbe a priority in the organization and delivery of support services.
Other areas of strength in social networks and social supports may derive from both theAmerican and urban experience of these elders. These, too, should be acknowledgedand nurtured in service planning and delivery. For example, peer relationships areactive and valued by elders (see Chapter 3 for details). Additional research to under-stand the depth and focus of these relationships can lead to developing appropriate pro-grams to enhance quality of life and simultaneously reduce caregiver burden.
Leisure TimeAlthough elders are involved in physical activities and games, social isolation and lone-liness have been identified as problem areas. Older adults can learn new communicationand social skills which support and extend social networks. Therefore, group programsshould be designed to foster peer interaction as a strengths-based approach to amelio-rating some of the social needs experienced by these elders [3].
Stressful Life EventsAsian American elders experience many stressful life events that may affect health, cop-ing capacities and quality of life generally. Reducing or eliminating the damaging effectsof stress is important to both physical and mental health. Community and publicly-fund-ed programs alike serving this population should have a standing commitment to iden-tify and address the impact of stressful life events.
Between one-quarter and one-third of elders reported serious problems resulting fromlife events. The issues included financial problems, anxiety, dependence on others, lossof relatives or close friends, serious illness or injury, and family problems or conflicts.The extent and variety of problems raises serious concern about levels of depression andcaregiver burden as well as about the gaps in services necessary to protect or improvequality of life for a vulnerable population.
Despite the number of problems identified by Asian American elders, social work andcounseling services are underutilized. It is possible that individuals do not have a clearunderstanding of the role of social workers or how counseling could be beneficial. Thelack of bilingual, bicultural experts is another potential factor. Understanding culturaland generational barriers to the use of professional mental health services is importantfor planning models that are compatible with the needs and values of the population. Inaddition, it would be advantageous to develop strategies to increase access to informa-tion about entitlements, legal services and case management resources. Satisfaction
Life in general, and family life in particular, had elements of satisfaction for most AsianAmerican elders. The strength of family relationships combined with personal
ASIAN AMERICAN ELDERS IN NEW YORK CITY
ASIAN AMERICAN FEDERATION OF NEW YORK 113
resilience are impressive in light of the sources and depths of stress that are part of dailylife for these elders. Understanding the strong cultural and interpersonal resources thatshape their overall outlook and coping abilities will be an asset in sustaining strongmulti-ethnic, multi-generational communities that can contribute to the vitality of NewYork City.
ASIAN AMERICAN ELDERS IN NEW YORK CITY
ASIAN AMERICAN FEDERATION OF NEW YORK 114
Literature Cited
1. Lum, D. “Culturally Competent Practice: A Framework for Growth and Action.” PacificGrove, CA: Brooks/Cole, 1999.
2. Ross-Sheriff, F. “Adaptation and Integration into American Society: Major IssuesAffecting Asian Americans.” In Furuto, S., Biswas, R., Chun, D., Murase, K., andRoss-Sheriff, F., eds. Social Work Practice with Asian Americans. Newbury Park, CA:Sage Publications, 1992. Pps. 45-63.
3. Potts, M.K. “Social Support and Depression among Older Adults Living Alone: TheImportance of Friends Within and Outside of a Retirement Community.” Social Work,1997. 42: 348-362.
ASIAN AMERICAN ELDERS IN NEW YORK CITY
ASIAN AMERICAN FEDERATION OF NEW YORK 115
Chapter 6: Recommendations
Angela Shen Ryan, D.S.W.
Asian American Elders in New York City is a study with substantive detail profilingdiverse ethnic communities that share some traditional values as well as the need formore responsive, culturally appropriate and accessible social and health services. Theresults of the study should be applied widely to guide policy, program planning and serv-ice delivery for Asian elders and their families in many communities. The following rec-ommendations identify major implications for policy makers, planners, funders, andadministrators. Although each ethnic group has specific needs and strengths, these sug-gestions can lead to meaningful improvements for every group included in the study.
1. Improve economic conditions for Asian American elders and their families.
A major concern of this population is poverty. Nearly 40% of respondents reported thattheir family financial condition was a serious problem, and an equal number stated thatthey did not have enough money to live on. The median annual household incomeranges from $6,000 - $8,500. One-third receives food stamps and the means-tested assis-tance of Supplemental Security Income (SSI). Fifty-one per cent (52%) are not eligiblefor Social Security. These factors indicate that the majority of Asian American eldersare living below the national poverty line.
Virtually all of these elders arrived in the United States as immigrants at age 50 or olderto join their families. Age and language skills posed barriers to employment and finan-cial security. For example, only one-quarter described themselves as speaking Englishwell. Overall poverty and financial insecurity among Asian American elders is compa-rable to the situation of Latino elders in New York City in the early 1990s, of whom64% reported incomes below $10,0001. Fifty-one per cent (51%) of Asian Americanelders receive financial assistance from their families. However, 30% of respondentsreported that depending on others for financial and other support is a serious problem.This raises concern about the long-term stability of intergenerational relationships.
Individuals with low incomes throughout their lives are not able to improve their finan-cial security in later years. Low wage earners are likely to receive very low SocialSecurity payments, if they are eligible at all, and at best entitled to minimal pensions andother benefits. Significant improvement will require changes in existing federal andstate policies that would increase retirement protections for immigrant and other lowwage earning adults. Increasing the availability of affordable housing, including assist-ed living, is also essential. More than thirty per cent of Asian American elders live in
ASIAN AMERICAN ELDERS IN NEW YORK CITY
ASIAN AMERICAN FEDERATION OF NEW YORK 116
substandard apartment buildings, and access to housing for seniors has been very lim-ited, especially among elders in certain immigrant communities.
The Federal Welfare Reform Act of 1996 left thousands of New York immigrants ineli-gible for Medicare, food stamps and cash assistance. Even though New York State has aspecial program to meet the needs of immigrants who are disabled and victims of domes-tic violence, the state’s food assistance programs exclude immigrants who arrived after1996 and who have been out of the country for more than 90 days in the year when theyapply for food stamp assistance. Participants also must apply for citizenship within 30days of submitting their request for food stamps. Only 44% of elders in this study arecitizens. Many others who are eligible do not apply for citizenship because of languagebarriers and low levels of education. As a result, they do not qualify for essential serv-ices. Programs to assist these elders to become citizens are vital.
Welfare reform should target funds to immigrant elders and other people in need andinclude meaningful access to information and entitlements. Similarly, there should bejob training and skill development for elders earning low incomes and those who areunemployed so that they can continue to contribute to the local economy and maintaina tolerable standard of living.
2. Enhance formal support services by increasing accessible and appropriatecare to meet the needs of Asian American elders.
More than half of Asian American elders reported that their general health was eitherexcellent or very good. However, when compared to national norms for prevalence ofmedical conditions, the same population reported higher rates of hypertension, cataractsand diabetes. There was, as well, significant variation in the number and types of med-ical conditions across the six ethnic groups studied; gender and marital status also werefactors associated with a range of medical conditions.
Information about physical health in this population must be considered when assess-ing the need for health care and personal social services. Asian American elders shouldbe educated about preventive health measures as part of community outreach strategies.Also, it is important to promote primary prevention and treatment for the major healthproblems reported by these elders. Outreach and education programs for physicians andother health care professionals are urgently needed along with parallel programs for eld-ers and their families.
The presence of depressive symptoms among the sample of Asian American elders wasextensive. Having fewer depressive symptoms was shown to be a factor in higher qual-ity of life in terms of general physical health, general mental health, physical and socialfunctioning and vitality. Depression and other mood disorders are highly treatable con-ditions. Programs aimed at reducing symptoms of depression among Asian Americanelders need to be given priority. Health care professionals in primary care and geriatricpsychiatry should become skilled at assessing and identifying depression and other men-tal health problems in this population. Understanding the economic costs and benefitsof improved mental health services and the treatment of depression is an important areafor further study.
New programs need to be developed to educate the community about the intimate con-nection between physical health and mental health. Lifting the stigma commonly asso-ciated with depression and other mental health problems will be vital to strengthening
ASIAN AMERICAN ELDERS IN NEW YORK CITY
ASIAN AMERICAN FEDERATION OF NEW YORK 117
coping skills, restoring health and improving the quality of life for Asian American eld-ers. It is necessary, as well, to rectify the absence of geriatric mental health clinics andservices specializing in the needs of this population.
Another important area for program attention and improvement is reducing the num-ber of Asian American elders who experience limitations in their Activities of DailyLiving (ADLs).1 Better general health and social functioning is linked with having fewerADL impairments. Improving independence in ADLs is a quality of life domain that isresponsive to health and social service intervention. Community-based health promo-tion programs aimed at increasing physical activities for these older adults should be apriority to maximize health status. Concurrently, there is a great need for appropriatelong term care options, including nursing homes.
Policy-driven interventions should include increasing access to health insurance amongimmigrant elders. Among the sample of Asian American elders, 51% rely on Medicare,41% on Medicaid, and 24% on Health Maintenance Organizations for their healthinsurance. Given the high levels of poverty in the population, paying for insurance pre-miums and prescription medications are major barriers to good health. For example,nearly one-quarter of the respondents noted that they had a serious problem with toomany medical bills. The rapidly rising cost of medication is a national concern that hasspecial urgency for elders with acute and chronic care needs. Developing programs thatassure basic health care protection would address specific concerns identified by theseindividuals.
Finally, there is a vital need to make information about existing entitlement programsavailable in languages and formats that are accessible to Asian American elders.Increasing targeted outreach activities and translating written materials are modeststeps that can generate substantial benefit. Similarly, providing classes in English as asecond language - using modalities appropriate to the age and learning style of theseprospective students - will increase the ability of elders to utilize the programs and serv-ices that currently are available.
3. Integrate informal social support systems into program development andservice delivery.
Veneration of aged and deceased relatives, honor for parents demonstrated throughrespect and obedience, and familial responsibility to care for aging relatives are impor-tant traditions in Asian cultures generally [2]. The present study confirmed that thesetraditions continue to be valued among the Asian American elders and that they are keyto sustaining informal social support systems. A majority of elders felt that their opin-ions regarding family traditions differed from their children’s opinions either not at allor only in small ways. Nonetheless, professionals should observe the level of accultura-tion and signs of generation gap, recognizing the potential for conflict between eldersand their children with its negative impact on mental health. Reinforcement of valuesshared across generations and communities should be a priority in the organization anddelivery of support services.
Informal social supports among family and friends should be reinforced. There is ampleevidence that helping relationships are reciprocal, especially between generations. Adultchildren are the principal source of informal support for elders. More than half of thepeople in the study reported receiving help from their children in times of illness andwith shopping or errands, transportation, fixing things around the house and money. It
ASIAN AMERICAN ELDERS IN NEW YORK CITY
ASIAN AMERICAN FEDERATION OF NEW YORK 118
1 Activities of Daily Living includebathing, dressing, grooming, transfer-ring, toileting and feeding.
is important, as well, to integrate peer and family relationships into the larger commu-nity. The benefits will include reducing social isolation among elders, improving theirsense of meaning and purpose in life plus reducing caregiver burden for the youngergeneration. There also may be positive impact on physical health.
Other areas of strength in social networks and social supports may derive from theAmerican and urban experience of these elders. These, too, should be acknowledgedand nurtured in service planning and delivery. For example, peer relationships are activeand valued by elders. Additional research to understand the depth and focus of theserelationships can lead to developing appropriate programs to enhance quality of life andsimultaneously reduce caregiver burden. Service providers need to support efforts tostrengthen the full range of social networks available to older Asians. As well, priorityattention should be directed to mobilizing elders to become active participants on behalfof their own communities.
4. Improve the cultural competence of programs serving Asian American elders.
Although nearly 60% of Asian American elders turn to the formal service sector fortwo or more formal services annually, language poses a major barrier to service effec-tiveness. More than two-thirds of the survey participants have English language skillsranging from poor to non-existent, and almost one-quarter live in households in whichno one speaks English well. Problems with English language competency are the mostcommon of all adaptation difficulties among Asian American immigrant groups and asignificant challenge for accessing needed services. Moreover, levels of depression aresignificantly influenced by language barriers [3, 4]. Learning a new language is a seri-ous undertaking for older adults, offering both mental stimulation and risks of low self-esteem and feelings of failure. Therefore, English language classes should be designed tobuild integrity and identity along with new and practical skills.
Between one-quarter and one-third of elders reported serious problems resulting fromlife events. Despite the range and complexity of problems these elders experience, just5% reported that they turned to social workers for assistance. Causes of underutiliza-tion may include inadequate understanding about the role of social workers or howcounseling could be beneficial. The lack of bilingual, bicultural experts is another poten-tial factor. Understanding cultural and generational barriers to professional mentalhealth services is important for planning approaches that are compatible with the needsand values of Asian American elders. In addition, it would be beneficial to developstrategies to increase access to information about entitlements, legal services and casemanagement resources. Culturally competent service providers need to incorporatemodels of best practice from a variety of cultures into the delivery of services to the eld-erly.
In senior centers there is a need for more programs geared to the cultural backgroundof this population. Only 24% of the respondents attend senior center programs. Leisureactivities, foods, interpersonal communication styles and group activities developed forcenters in communities where Asian American elders reside should reflect traditionalvalues and enhance ethnic identities. These improvements can reduce barriers to par-ticipation. Among newer immigrants, use of senior centers is especially low. There is,therefore, a need for ethnically specific centers offering the full range of services in aculturally competent context.
Professionals should be sensitive to the world view and religious practices of Asian
ASIAN AMERICAN ELDERS IN NEW YORK CITY
ASIAN AMERICAN FEDERATION OF NEW YORK 119
American elders, which include both Eastern and Western religious traditions. Morethan three-quarters of the people who participated in the study reported that religionwas either very important or somewhat important to them, and 45% attend religiousservices weekly or more often. Outreach to churches serving each ethnic group couldimprove the cultural competence of programs and service settings. Simultaneously, reli-gious leaders can be important advocates helping elders to appropriately use availablesocial and health resources.
There is a great need for bilingual and bicultural staff in ethnic-specific programs and,as important, in all health and social service settings that serve Asian American elders.Survey participants identified a special urgency for language and cultural sensitivity inlegal services, entitlement information and transportation. Strategies and programs areneeded to recruit bilingual and bicultural Asian professionals to serve this population.Funding special fellowship programs for Asian American physicians, social workersand other health and social service workers is needed on the federal, state and local lev-els. All health and social services staff should be trained to be culturally sensitive andcompetent to best serve Asian American elders.
In conclusion, the strong family relationships and personal resilience among AsianAmerican elders are impressive in light of the stresses that mark their daily lives.Understanding the cultural and interpersonal resources that shape their overall outlookand coping abilities as well as their service needs is necessary to sustain vibrant multi-ethnic, multi-generational communities.
This study identified significant needs among a large and diverse minority population.Future national and local studies of elders should include this population so that criti-cal information will be available for planning programs that fully meet the urgent needsof Asian American elders. The findings of Asian American Elders in New York Cityfill a critical knowledge gap in the field of aging and can lead to caring, effective and effi-cient services for a population that deserves no less.
ASIAN AMERICAN ELDERS IN NEW YORK CITY
ASIAN AMERICAN FEDERATION OF NEW YORK 120
Literature Cited
1. Dumpson, James, et al. “Growing Older in New York City in the 1990s.” Volume 1:Introduction, Compendium of Significant Findings, Recommendations andMethodology. New York: New York Center on Aging of the New York CommunityTrust, 1993.
2. Sung, Kyu-taik. “Filial Piety: The Traditional Ideal of Parent Care in East Asia.” Agingand Spirituality, 1998. 10: 1, 7-8.
3. Lam, R.E., Pacala, J.T., and Smith, S.L. “Factors Related to Depressive Symptoms in AnElderly Chinese American Sample.” Clinical Gerontologist, 1997. 17: 57-70.
4. Cheung, M. “Elderly Chinese Living in the United States.” Social Work, 1989. 34: 457-461.
ASIAN AMERICAN ELDERS IN NEW YORK CITY
ASIAN AMERICAN FEDERATION OF NEW YORK 121
AppendixCensus 2000 Data for Asian American EldersMeghan L. Clark, Asian American Federation
Census Information Center
Census 2000 Notes / ExplanationsCensus 2000 is the first decennial census in which respondents were allowed to selectmore than one race category. The Census 2000 data (“Alone” and “Alone or in anyCombination”) has not been statistically adjusted to compensate for any undercount.
The Census 2000 elderly Asian population numbers provided in Table 2.1 are for the“Asian alone” elderly population. This number corresponds to the respondents whoreported exactly one Asian group and no other Asian group or race category. The“Alone” number should be considered the minimum population size in any analysis thatuses Census 2000 data.
The “Asian alone or in any Combination” elderly population corresponds to theresponses (not respondents) that include the selected Asian group, either alone or inany combination with other Asian groups or other race categories. “Alone or in anyCombination” should be considered the maximum population size in any analysis thatuses Census 2000 data.
If a respondent selected more than one Asian group (i.e. “Korean” and “Chinese”), thatindividual would be tallied in the total for each Asian group. Therefore, Asian grouptotals under “Alone or in any Combination” are not mutually exclusive and cannot becompared or aggregated.
Census 2000 Population DataIncluded below is a table that includes the “Asian alone or in any Combination” elder-ly population numbers for New York City. We have also included tables for each of theboroughs to provide more detail about the Elderly Asian Population in New York City.
ASIAN AMERICAN ELDERS IN NEW YORK CITY
ASIAN AMERICAN FEDERATION OF NEW YORK 122
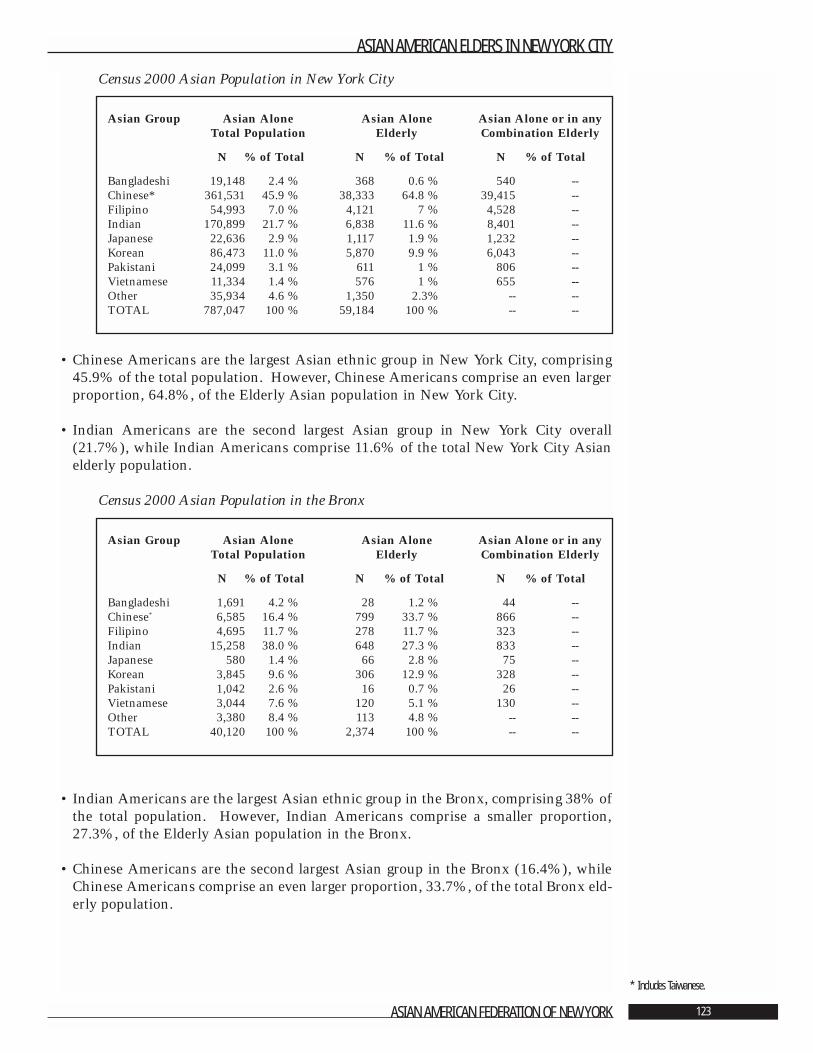
Census 2000 Asian Population in New York City
• Chinese Americans are the largest Asian ethnic group in New York City, comprising45.9% of the total population. However, Chinese Americans comprise an even largerproportion, 64.8%, of the Elderly Asian population in New York City.
• Indian Americans are the second largest Asian group in New York City overall(21.7%), while Indian Americans comprise 11.6% of the total New York City Asianelderly population.
Census 2000 Asian Population in the Bronx
• Indian Americans are the largest Asian ethnic group in the Bronx, comprising 38% ofthe total population. However, Indian Americans comprise a smaller proportion,27.3%, of the Elderly Asian population in the Bronx.
• Chinese Americans are the second largest Asian group in the Bronx (16.4%), whileChinese Americans comprise an even larger proportion, 33.7%, of the total Bronx eld-erly population.
ASIAN AMERICAN ELDERS IN NEW YORK CITY
ASIAN AMERICAN FEDERATION OF NEW YORK 123
* Includes Taiwanese.
Asian Group Asian Alone Asian Alone Asian Alone or in anyTotal Population Elderly Combination Elderly
N % of Total N % of Total N % of Total
Bangladeshi 1,691 4.2 % 28 1.2 % 44 --Chinese* 6,585 16.4 % 799 33.7 % 866 --Filipino 4,695 11.7 % 278 11.7 % 323 --Indian 15,258 38.0 % 648 27.3 % 833 --Japanese 580 1.4 % 66 2.8 % 75 --Korean 3,845 9.6 % 306 12.9 % 328 --Pakistani 1,042 2.6 % 16 0.7 % 26 --Vietnamese 3,044 7.6 % 120 5.1 % 130 --Other 3,380 8.4 % 113 4.8 % -- --TOTAL 40,120 100 % 2,374 100 % -- --
Asian Group Asian Alone Asian Alone Asian Alone or in anyTotal Population Elderly Combination Elderly
N % of Total N % of Total N % of Total
Bangladeshi 19,148 2.4 % 368 0.6 % 540 --Chinese* 361,531 45.9 % 38,333 64.8 % 39,415 --Filipino 54,993 7.0 % 4,121 7 % 4,528 --Indian 170,899 21.7 % 6,838 11.6 % 8,401 --Japanese 22,636 2.9 % 1,117 1.9 % 1,232 --Korean 86,473 11.0 % 5,870 9.9 % 6,043 --Pakistani 24,099 3.1 % 611 1 % 806 --Vietnamese 11,334 1.4 % 576 1 % 655 --Other 35,934 4.6 % 1,350 2.3% -- --TOTAL 787,047 100 % 59,184 100 % -- --
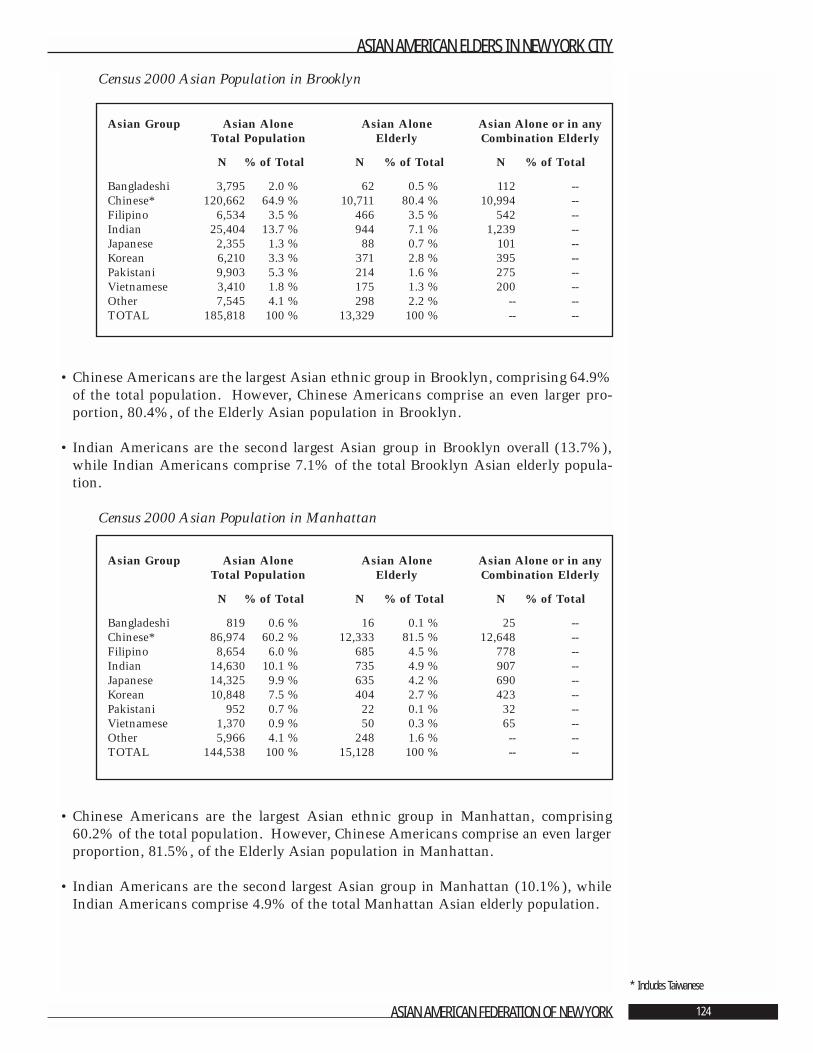
Census 2000 Asian Population in Brooklyn
• Chinese Americans are the largest Asian ethnic group in Brooklyn, comprising 64.9%of the total population. However, Chinese Americans comprise an even larger pro-portion, 80.4%, of the Elderly Asian population in Brooklyn.
• Indian Americans are the second largest Asian group in Brooklyn overall (13.7%),while Indian Americans comprise 7.1% of the total Brooklyn Asian elderly popula-tion.
Census 2000 Asian Population in Manhattan
• Chinese Americans are the largest Asian ethnic group in Manhattan, comprising60.2% of the total population. However, Chinese Americans comprise an even largerproportion, 81.5%, of the Elderly Asian population in Manhattan.
• Indian Americans are the second largest Asian group in Manhattan (10.1%), whileIndian Americans comprise 4.9% of the total Manhattan Asian elderly population.
ASIAN AMERICAN ELDERS IN NEW YORK CITY
ASIAN AMERICAN FEDERATION OF NEW YORK 124
* Includes Taiwanese
Asian Group Asian Alone Asian Alone Asian Alone or in anyTotal Population Elderly Combination Elderly
N % of Total N % of Total N % of Total
Bangladeshi 819 0.6 % 16 0.1 % 25 --Chinese* 86,974 60.2 % 12,333 81.5 % 12,648 --Filipino 8,654 6.0 % 685 4.5 % 778 --Indian 14,630 10.1 % 735 4.9 % 907 --Japanese 14,325 9.9 % 635 4.2 % 690 --Korean 10,848 7.5 % 404 2.7 % 423 --Pakistani 952 0.7 % 22 0.1 % 32 --Vietnamese 1,370 0.9 % 50 0.3 % 65 --Other 5,966 4.1 % 248 1.6 % -- --TOTAL 144,538 100 % 15,128 100 % -- --
Asian Group Asian Alone Asian Alone Asian Alone or in anyTotal Population Elderly Combination Elderly
N % of Total N % of Total N % of Total
Bangladeshi 3,795 2.0 % 62 0.5 % 112 --Chinese* 120,662 64.9 % 10,711 80.4 % 10,994 --Filipino 6,534 3.5 % 466 3.5 % 542 --Indian 25,404 13.7 % 944 7.1 % 1,239 --Japanese 2,355 1.3 % 88 0.7 % 101 --Korean 6,210 3.3 % 371 2.8 % 395 --Pakistani 9,903 5.3 % 214 1.6 % 275 --Vietnamese 3,410 1.8 % 175 1.3 % 200 --Other 7,545 4.1 % 298 2.2 % -- --TOTAL 185,818 100 % 13,329 100 % -- --
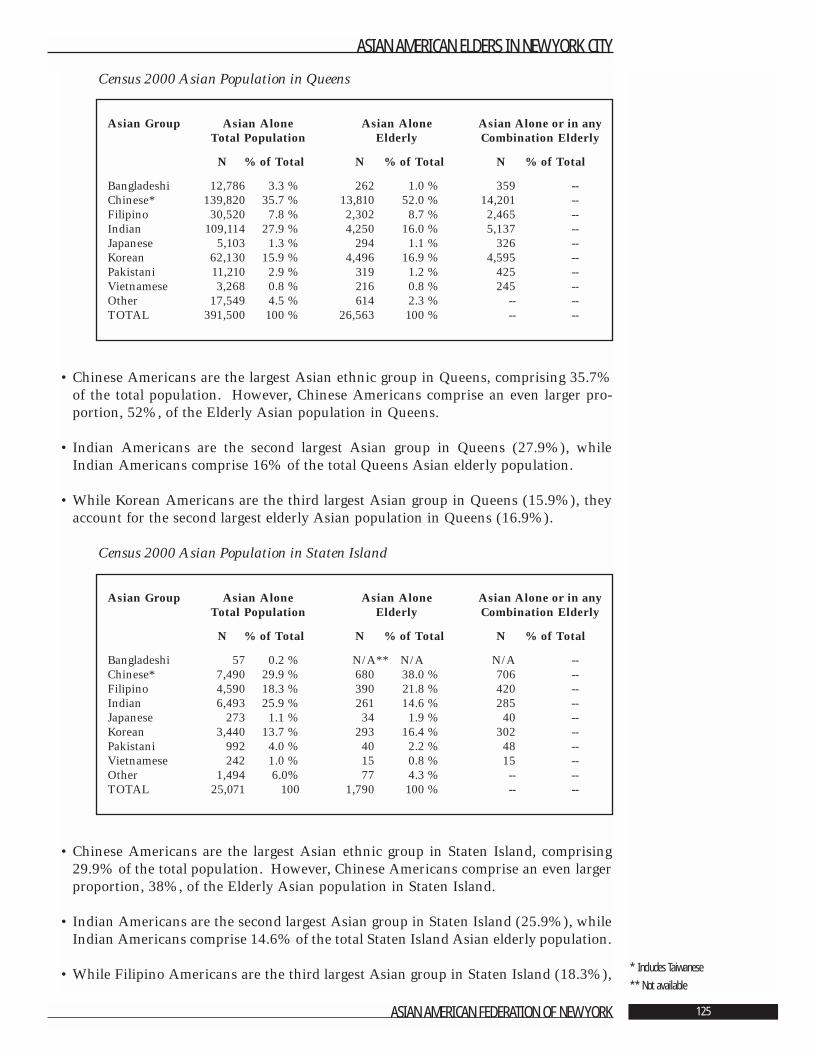
Census 2000 Asian Population in Queens
• Chinese Americans are the largest Asian ethnic group in Queens, comprising 35.7%of the total population. However, Chinese Americans comprise an even larger pro-portion, 52%, of the Elderly Asian population in Queens.
• Indian Americans are the second largest Asian group in Queens (27.9%), whileIndian Americans comprise 16% of the total Queens Asian elderly population.
• While Korean Americans are the third largest Asian group in Queens (15.9%), theyaccount for the second largest elderly Asian population in Queens (16.9%).
Census 2000 Asian Population in Staten Island
• Chinese Americans are the largest Asian ethnic group in Staten Island, comprising29.9% of the total population. However, Chinese Americans comprise an even largerproportion, 38%, of the Elderly Asian population in Staten Island.
• Indian Americans are the second largest Asian group in Staten Island (25.9%), whileIndian Americans comprise 14.6% of the total Staten Island Asian elderly population.
• While Filipino Americans are the third largest Asian group in Staten Island (18.3%),
ASIAN AMERICAN ELDERS IN NEW YORK CITY
ASIAN AMERICAN FEDERATION OF NEW YORK 125
* Includes Taiwanese
** Not available
Asian Group Asian Alone Asian Alone Asian Alone or in anyTotal Population Elderly Combination Elderly
N % of Total N % of Total N % of Total
Bangladeshi 57 0.2 % N/A** N/A N/A --Chinese* 7,490 29.9 % 680 38.0 % 706 --Filipino 4,590 18.3 % 390 21.8 % 420 --Indian 6,493 25.9 % 261 14.6 % 285 --Japanese 273 1.1 % 34 1.9 % 40 --Korean 3,440 13.7 % 293 16.4 % 302 --Pakistani 992 4.0 % 40 2.2 % 48 --Vietnamese 242 1.0 % 15 0.8 % 15 --Other 1,494 6.0% 77 4.3 % -- --TOTAL 25,071 100 1,790 100 % -- --
Asian Group Asian Alone Asian Alone Asian Alone or in anyTotal Population Elderly Combination Elderly
N % of Total N % of Total N % of Total
Bangladeshi 12,786 3.3 % 262 1.0 % 359 --Chinese* 139,820 35.7 % 13,810 52.0 % 14,201 --Filipino 30,520 7.8 % 2,302 8.7 % 2,465 --Indian 109,114 27.9 % 4,250 16.0 % 5,137 --Japanese 5,103 1.3 % 294 1.1 % 326 --Korean 62,130 15.9 % 4,496 16.9 % 4,595 --Pakistani 11,210 2.9 % 319 1.2 % 425 --Vietnamese 3,268 0.8 % 216 0.8 % 245 --Other 17,549 4.5 % 614 2.3 % -- --TOTAL 391,500 100 % 26,563 100 % -- --
they account for the second largest elderly Asian population in Staten Island (21.8%).
• Korean Americans are the fourth largest Asian group in Staten Island (13.7%), butaccount for the third largest elderly Asian population in Staten Island (16.4%).
ASIAN AMERICAN ELDERS IN NEW YORK CITY
ASIAN AMERICAN FEDERATION OF NEW YORK 126
About the Asian American Federation of New YorkFounded in 1989, the Asian American Federation of New York is a not-for-profit organiza-tion that provides public policy and community service leadership to identify and meet thecritical needs of Asian Americans in the New York metropolitan area. The Federationserves the entire Asian American community by analyzing issues and voicing common con-cerns, advocating for beneficial policies, offering financial and management assistance, coor-dinating service delivery, and creating and heading unified, community-wide initiatives.The Federation has a membership of 36 community agencies that provide health and humanservices to diverse populations.
Working toward an empowered Asian American community with full participation in thelarger society, the Federation is guided by the following priorities:
• Articulating Asian American concerns on public policy matters, and promoting under-standing and cooperation between communities.
• Strengthening the capacity of community institutions.
• Generating human and financial resources for enhanced effectiveness in meeting com-munity needs and aspirations.
The Federation’s public policy and research work focuses on issues related to resource allo-cation, community needs, service availability and accessibility, immigrant rights, and com-munity development.
In December 2001, the Federation spearheaded a comprehensive initiative: Relief, Recoveryand Rebuilding, aimed at addressing the needs of the Asian American community after thetragic events of September 11th. Out of the initiative came Chinatown After September11th: An Economic Impact Study, which documented the devastation of the Chinatowncommunity through the first year after the tragedy. This study was critical in bringing polit-ical attention to Chinatown. Other research projects underway include a study on the men-tal health needs of families and victims of Asian decent affected by the September 11th dis-aster, as well as vulnerable populations in Chinatown. In addition, the Federation is work-ing on an analysis of the September 11th Fund’s Health Care Initiative. The Federation is afounding member of the 9/11 United Services Group (USG), a 13-member consortiumformed to coordinate assistance to people affected by the September 11th events.
Asian American Elders in New York City is yet another aspect of the Federation’s efforts tobring the needs of the Asian American community into the radar of academic research andpublic policy formulation. Working in collaboration with the Brookdale Center on Aging ofHunter College, the Federation’s groundbreaking study is a comprehensive exploration onthe quality of life and care of New York City’s growing Asian American elderly population.
Among other pivotal leadership functions, the Federation is one of the only Asian Americanorganizations on the East Coast selected by the U.S. Census Bureau to operate a CensusInformation Center. The center was established in August 2001 to conduct data and policyanalysis and to encourage representation of the Asian American community in Census Bureaucensuses and surveys. The Census Bureau's designation recognized the Federation's success inleading the Asian American Task Force on Census 2000, a coalition of 65 organizations thatadvised the Census Bureau and ensured an accurate count of Asian Americans in Census 2000.
Other current Federation projects, in addition to extensive support of its member agencies,include a campaign to foster Asian American philanthropy, and the production of a film doc-umenting the Asian American experiences after the September 11th tragedies.
For more information on the Federation, visit www.aafny.org or call 212-344-5878.
ASIAN AMERICAN ELDERS IN NEW YORK CITY
ASIAN AMERICAN FEDERATION OF NEW YORK 127
ASIAN AMERICAN FEDERATIONBOARD OF DIRECTORS
Mr. Paul D.C. Huang, ChairpersonPresident, C.J. Huang Foundation
Dr. Yung Duk Kim, Vice ChairpersonExecutive Advisor, Hyundai Corporation (USA)
Mr. Jeffrey Chin, TreasurerPartner, Ernst & Young, LLP
Ms. Susan C. Dessel, Secretary
Muzaffar Chishti, Esq.Senior Policy Analyst, Migration Policy Institute
Ms. Midori Shimanouchi LedererPresident, Japanese American Social Services, Inc.
Dr. Jean Raymundo LobellSenior Consultant, Community Resource Exchange
Sylvester Mendoza, Jr., Esq. Director, Diversity Strategies, Quest Diagnostics
Dr. Setsuko Matsunaga NishiProfessor Emeritus, City University of New York
Mr. Dong Suk SuhPresident & CEO, D.S. Starr
Ms. Grace Lyu Volckhausen
HONORARY BOARD
U.S. Senator Daniel K. InouyeLoida Nicolas Lewis, Esq.Francis Y. Sogi, Esq.Oscar L. TangProcopio U. Yanong, MD
ASIAN AMERICAN ELDERS IN NEW YORK CITY
ASIAN AMERICAN FEDERATION OF NEW YORK 128

![Acts 20:17-36. elders bishops pastors Acts 20:27-36 elders bishops pastors elders Acts 20:17-36 - Paul called for the elders from Ephesus [v. 17] - Paul](https://img.pdfslide.net/doc/110x75/55151146550346a87d8b4ad2/acts-2017-36-elders-bishops-pastors-acts-2027-36-elders-bishops-pastors-elders-acts-2017-36-paul-called-for-the-elders-from-ephesus-v-17-paul.jpg)