Embed Size (px)
Citation preview
Volume 2, Issue 6 (June, 2012) ISSN: 2249‐7307
AJRBEM
Journal of Asian Research Consortium 218
http://w
ww.aijsh.org
A P e e r R e v i e w e d I n t e r n a t i o n a l J o u r n a l o f A s i a n R e s e a r c h C o n s o r t i u m
AJRBEM:
A S I A N J O U R N A L O F R E S E A R C H I N B U S I N E S S
E C O N O M I C S A N D M A N A G E M E N T
MANAGEMENT OF SUPPLY CHAIN DRIVERS IN KIRANA STORES
(A CASE STUDY OF BANGALORE CITY)
PANNEERSELVAM S*
*Associate Professor, Post Graduate Department of Management Studies,
Siddaganga Institute of Technology, Tumkur – 572103, Karnataka.
ABSTRACT Retail is an old phenomenon in India. Despite the emergence of organised food retail, the traditional kirana stores accounts for about 90% of the trade. At the same time, it is the fact that organised retail is gaining momentum in India and is being increasingly accepted and adopted by the people, especially younger generation. Meanwhile, the Government of India (GoI) is taking steps to open up the food retail for Foreign Direct Investment (FDI) which would turn the gate to organised retail and many have expressed their apprehension about its probable impact on the traditional trade. Organised Retail owes its success to the effective management of the supply chain. The goal of supply chain is to enhance end customer value. Hence a study to look into the aspects of supply chain at the traditional kirana stores however frugal it may, become important and was undertaken in Bangalore. The study brings about the information on how the kirana stores manage the modern supply chain drivers such as inventory, location, transportation, sourcing, pricing and information. The study also suggests the ways by which the kirana stores can improve their trade.
KEYWORDS: Indian Retail, Food Retail, kirana stores, retail supply chain, retail logistics.
______________________________________________________________________________
Volume 2, Issue 6 (June, 2012) ISSN: 2249‐7307
AJRBEM
Journal of Asian Research Consortium 219
http://w
ww.aijsh.org
INTRODUCTION
1.0 RETAILING IN INDIA
Retailing consists of all activities involved in selling goods and services to consumers for their personal, family, or household use. It covers sales of goods ranging from automobiles to apparel and food products, and services ranging from hair cutting to air travel and computer education (Chetan Bajaj, 2005).
Retailing is one of the largest sectors in the global economy. In India, for a long time the corner grocery store was the only choice available to the consumers. With the increasing demand of the customers spurred by changing trends, aspiring needs for variety, the traditional retail gave rise to modern retail format. The traditional food and grocery segment has seen the emergence of supermarkets/grocery chains, convenience stores and hypermarkets.
Traditionally, retailing has not been a structurally organized industry in India. Organized retail network was seen only in fabrics, with large mills building their own exclusive stores like Raymond’s, Bombay Dyeing etc.
The Indian Retail Industry on the whole is divided into organised and unorganised sectors. Unorganised/Traditional retailing refers to the traditional formats of low-cost retailing, for example, the local kirana shops, owner manned general stores, paan/beedi shops, convenience stores, hand cart and pavement vendors, etc (Corporate Catalyst India, 2006).
Modern Retail has seen a significant growth in the past few years with large scale investments made by Indian corporate houses primarily in Food and Grocery retailing. The total retail (organised and unorganised) industry in India is estimated to be Rs 20 lakh crore in 2010. This is expected to reach Rs 27 lakh crore by 2015. Organised retail, which is estimated to be Rs 1.0 lakh crore (5 per cent share) in 2010, is projected to reach Rs 3.0 lakh crore (11 per cent share) by 2015. This means a tripling of the current size and scale of organised retail in the next five years, i.e. 2010 - 2015. While organised retail will grow at a fast pace, it is important to note that a larger part of the Rs 7.0 lakh crore growth in total retail will come from unorganised retail. This segment (unorganised retail) is projected to grow by over Rs 4.5 lakh crore in the next five years (Raghav Gupta et al, 2010).
The retail market in India is about $410 billion in 2010 and may rise to $637 billion in 2015 (Figure 1), according to consultancy Technopak Advisors (Retail Biz, 2010). The Indian retail business employs nearly 21 million people, about 7% of total employment. There are about 15 million retail outlets, the largest number in the world.
AJRB
Journal of Asian Research Consortium 220
http://w
ww.aijsh.org
BEM
Source: C
1.1 FOO
Osmall welocal 'weretail outsmall kioof all rur
Itthriving.
2.0 LITE
Kparticularfrom genretail tradmany res
CII, 2007 an
OD AND GR
Organised fooestern-style et' market vetlets, almost osks (17 per al retail outl
t is needlessKirana store
ERATURE
Kirana storesr sect of peo
neration to gde. Till the search studie
Volu
FIGU
nd Technopak
ROCERY R
od retailing supermarketendors, roadseven milliocent), gener
lets) run by a
s to say that es that form
REVIEW
s are uniqueople in a staeneration. Trecent past,es on them.
ume 2, Issu
URE 1: SIZE
k Analysis, N
RETAIL
is relativelyts since the
dside pushcaon sell food ral provisiona single trade
Indian foodthe backbon
e business mate who run
Their learned, the inform With the a
ue 6 (June
E OF INDIA
November 2
y a new phen1990s. Mos
art sellers or and grocery
n stores (14 er and his fa
d retail is stine of shoppin
models in Indthe stores w
d business acation about
advent of org
, 2012)
AN RETAI
2010.
nomenon in st of the foo
small grocey products. T
percent) andamily (M. Bh
ill dominatedng in India a
dia. These swith native wcumen helpsthe stores i
ganised reta
ISS
IL
India, with tod products ery stores. OThe vast majd grocery sthasi).
d by the kirare here to st
stores are gewisdom ands them to be s rare to fin
ail, many sta
N: 2249‐7
the emergenare sold thr
Out of 15 mority of thes
tores (56 per
rana stores atay!
enerally run d are carried
successful ind. There arakeholders o
7307
nce of rough
million se are r cent
and is
by a d over in the re not of the
Volume 2, Issue 6 (June, 2012) ISSN: 2249‐7307
AJRBEM
Journal of Asian Research Consortium 221
http://w
ww.aijsh.org
society including the state and central governments are striving to collate information about the kirana stores. In this context, an attempt is made to bring forth the literature available about the stores.
Neeraj Thakur (2009) interviews with the customers show the reasons for customers purchasing the groceries from the traditional kirana stores in spite of supermarkets in the same locality. The article differentiates the stores from organised retail outlets on different factors.
The article highlights the unique features of kirana stores in terms of location, ownership, merchandise, pricing, customer-trust and other services.
The findings of a survey done under the aegis of ASSOCHAM Social Development Foundation during March-April 2010 conducted in 15 major cities is enumerated by Varun Jain (2010) in his paper. The findings show that the shoppers in India prefer the local kirana stores over malls. The shoppers love to hangout and shop from their local traditional stores because of the familiarity with ambiance, ease of access, emotional attachment, early opening and late closing times etc., which suits the local residents.
Shubhra Saini (2009) finds that the mushrooming of malls, departmental stores, hypermarkets and supermarkets have not affected the market of the kirana stores much.
According to Thomas Verghese, kirana stores with their own strength and proposition for the Indian consumers would keep them relevant in Indian markets even long after international players come in (Darlington Jose Hector, 2012).
According to Nielsen’s Shopper Trends – 2011 (Bhusan Ratna, 2010), the shoppers are not neglecting the local kirana stores. The rise of traditional grocery stores continues to be strong driven by convenience, availability of home delivery and trusted relationships between the shopper and local grocer.
Raghav Gupta (2009) identifies interesting things that kiranas do better namely: i. Customer Relationship Management ii. Dynamic Merchandising and iii. Efficient store operations.
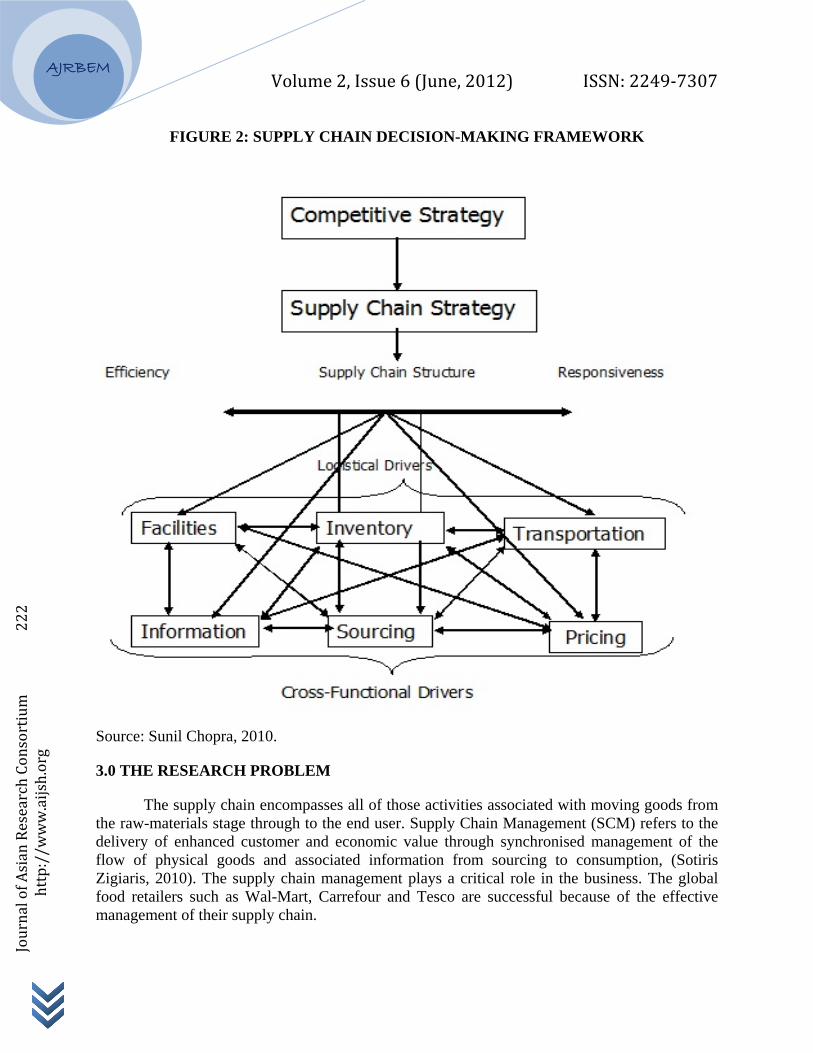
According to Sunil Chopra (2010), the strategic fit requires a company’s supply chain achieve the balance between responsiveness and efficiency that best meets the needs of the company’s competitive strategy. To understand how a company can improve supply chain performance in terms of responsiveness and efficiency, one must examine the logistical and cross functional drivers of supply chain performance: facilities, inventory, transportation, information, sourcing and pricing. These drivers interact with each other to determine the supply chain’s performance in terms of responsiveness and efficiency (Figure 2). Basically, this framework is used in the study.
Volume 2, Issue 6 (June, 2012) ISSN: 2249‐7307
AJRBEM
Journal of Asian Research Consortium 222
http://w
ww.aijsh.org
FIGURE 2: SUPPLY CHAIN DECISION-MAKING FRAMEWORK
Source: Sunil Chopra, 2010.
3.0 THE RESEARCH PROBLEM
The supply chain encompasses all of those activities associated with moving goods from the raw-materials stage through to the end user. Supply Chain Management (SCM) refers to the delivery of enhanced customer and economic value through synchronised management of the flow of physical goods and associated information from sourcing to consumption, (Sotiris Zigiaris, 2010). The supply chain management plays a critical role in the business. The global food retailers such as Wal-Mart, Carrefour and Tesco are successful because of the effective management of their supply chain.
Volume 2, Issue 6 (June, 2012) ISSN: 2249‐7307
AJRBEM
Journal of Asian Research Consortium 223
http://w
ww.aijsh.org
In India, in recent times, organised food retail is gaining momentum and many corporate houses have started investing in this business and opened up hundreds of outlets all over the cities in India. The organised food retailers have started adopting supply chain management in India. People in India with their changing life style, higher disposable income, education and better information have started adopting the organised retail. While adapting to the new modern retail for their planned purchases, the customers still visit their neighbourhood kirana stores for their immediate purchases. Organised food retail amounts to 7% only in India. Having said this, not much information is available to know about the management of modern concepts such as supply chain as practised by the traditional kirana stores.
As competition is picking up, there is a need to study how the kirana stores manage the supply chain drivers such as facilities, inventory, warehousing, information, sourcing and pricing (Sunil Chopra, 2010). Hence the present study, “Management of Supply Chain Drivers in kirana stores (A case study of Bangalore City)”.
3.1 OBJECTIVES OF THE STUDY
– To examine the management of logistics and cross-functional drivers in the kirana stores;
– To ascertain the practices adopted by the kirana stores;
– To suggest ways to improve the performance of the drivers.
3.2 RESEARCH METHODOLOGY
The Food and Grocery (F&G) retail segment in India is unique. F&G can be broadly categorised into organised and unorganised retail. The study is restricted to unorganised retail, i.e., kirana stores. Table 1 enlists the sources of information and sampling.
TABLE 1: SOURCES OF INFORMATION
Universe kirana stores in Bangalore.
Sampling unit kirana stores
Sampling Technique Purposive/Judgemental Sampling
Primary Sources a) Structured Questionnaire
b) Personal Interviews with kirana store owners
Secondary Sources Journals, Periodicals, Business Magazines, and Newspapers.
Volume 2, Issue 6 (June, 2012) ISSN: 2249‐7307
AJRBEM
Journal of Asian Research Consortium 224
http://w
ww.aijsh.org
3.3 DETERMINATION OF SAMPLE SIZE
An appropriate sample size has been arrived at after taking into account the confidence level of 95%, confidence interval of 7% and the population (number of kirana stores). The sample size determined is given in Table 2. Thus, the sample size of kirana stores considered for the study was 200.
TABLE 2: DETERMINATION OF SAMPLE SIZE (KIRANA STORES)
Confidence Level 95%
Confidence Interval 7%
Population (No. of stores – Estimated) 2,00,000
Sample size Required 196
Source: http://www.surveysystem.com/sscalc.htm.
3.4 PILOT SURVEY
A pilot survey was conducted at Banshankari II and III stage, Bangalore to ascertain the validity of the questionnaire. About 15 kirana stores were covered as part of the pilot survey. The objective of the survey was to understand from the respondents the relevance, usability, reliability, etc of the instrument. Based on the insights gained in the pilot survey, some of the questions were rephrased, some were redesigned, re-categorised and refined.
3.5 RESEARCH SURVEY
The survey is exploratory in nature. As part of the survey, the researcher has covered almost all major locations, about 75 places in the city of Bangalore. Though the sampling method adopted was convenience/judgemental sampling, only one store from a location is selected. This is to make sure that as many stores as possible may be covered from different locations and information collected is not biased or skewed.
3.6 RELIABILITY ANALYSIS
Reliability of the questionnaire was tested using Chronbach’s Alpha (also referred to as coefficient alpha) technique. The test showed a satisfactory index of 0.6 to 0.9 which is adequate for the analysis of the data.
3.7 DATA TABULATION AND ANALYSIS
1. Microsoft Access 2007 was used for database creation and data entry purposes.
2. Microsoft Access 2007 and Microsoft Excel 2007 were used for data filtering, sorting and drawing charts.
3. SPSS Ver 16.0 was used for descriptive analysis.
AJRB
Journal of Asian Research Consortium 225
http://w
ww.aijsh.org
BEM
4.0 DAT
Tand checcollected
4.1 PRO
Tshow the91% of tthe storewould ha
Ye
Source: F
Source: F
TA ANALYS
The questionncking for cod from 200 k
OFILE OF T
The year of ee year of estthe kirana stes are 10 yeave been shif
TABL
ear of Establi
Befor
1990
1996
2001
2006
Field Survey
FIG
Field Survey
Volu
SIS ON KIR
naire for kirnsistency, th
kirana stores
THE KIRAN
establishmentablishment tores were inar old. Theyfted from a d
LE 3: YEAR
ishment
re 1990
0-1995
6-2000
1-2005
6-2009
Total
y.
GURE 3: YE
y.
ume 2, Issu
RANA STO
rana stores whe number ois presented
NA STORE
nt helps to knof the kiran
n operation y were largdifferent pla
R OF ESTA
No
EAR OF EST
ue 6 (June
ORES
was administof questionn
d in this secti
ES
now the longna stores. Frranging fromely started bce to the pla
ABLISHME
o. of Stores
5
7
46
110
32
200
TABLISHM
, 2012)
tered on 230naires was pion.
gevity of therom the tablm 1999 – 20by the youn
ace of new ex
NT (KIRAN
MENT OF K
ISS
0 stores. Aftpruned to 20
e stores. Table, it may be009. In othenger generatxistence.
NA STORE
Percentage
KIRANA ST
N: 2249‐7
ter data clean00. The data
le 3 and Fige seen that aer words, motion or the s
ES)
e of Stores
2.5%
3.5%
23.0%
55.0%
16.0%
100.0%
TORES
7307
nsing a thus
gure 3 about ost of stores
Volume 2, Issue 6 (June, 2012) ISSN: 2249‐7307
AJRBEM
Journal of Asian Research Consortium 226
http://w
ww.aijsh.org
The analysis on logistics drivers and cross-functional drivers for kirana stores is as follows.
4.2 LOGISTICS DRIVERS
4.21 LOCATION OF STORES
The location of a store determines the accessibility to consumers’ convenience to them and the cost of operation. According to Sunil Chopra (2010) decisions regarding the role, location, capacity, and flexibility of facilities have a significant impact on supply chain’s performance.
The location details of the kirana stores (Table 4) shows that the stores were more or less equally distributed throughout the prominent geographical areas of Bangalore city. All the stores invariably are located at vantage points of the main road or bylanes. Almost all the stores were located on the main road, or street corners or important junction points.
TABLE 4: LOCATION OF KIRANA STORES
Location No. of Stores Percentage
Main Road 78 39%
Junction Points 74 37%
Street Corner 48 24%
Total 200 100%
Source: Field Survey.
4.22 SIZE OF THE STORES
The store size is an important factor in drawing the customers’ attention. Table 5 shows the size of the stores surveyed. Kirana stores are typically small in size as they are located in the residential area zones. The size of the stores revealed that about half of the stores were less than 200 sq. ft. and about one-fourth of the stores (28%) were of size greater than 400 sq. ft.
TABLE 5: SIZE OF THE STORES (SQ. FEET)
Size No. of Stores Percentage
1-100 21 10.5
101-200 89 44.5
201-300 18 9
301-400 16 8
401-500 15 7.5
Volume 2, Issue 6 (June, 2012) ISSN: 2249‐7307
AJRBEM
Journal of Asian Research Consortium 227
http://w
ww.aijsh.org
501-600 19 9.5
601-700 3 1.5
701-800 19 9.5
Total 200 100
Source: Field Survey.
4.23 INVENTORY
4.23.1 SKU CATEGORY MANAGEMENT
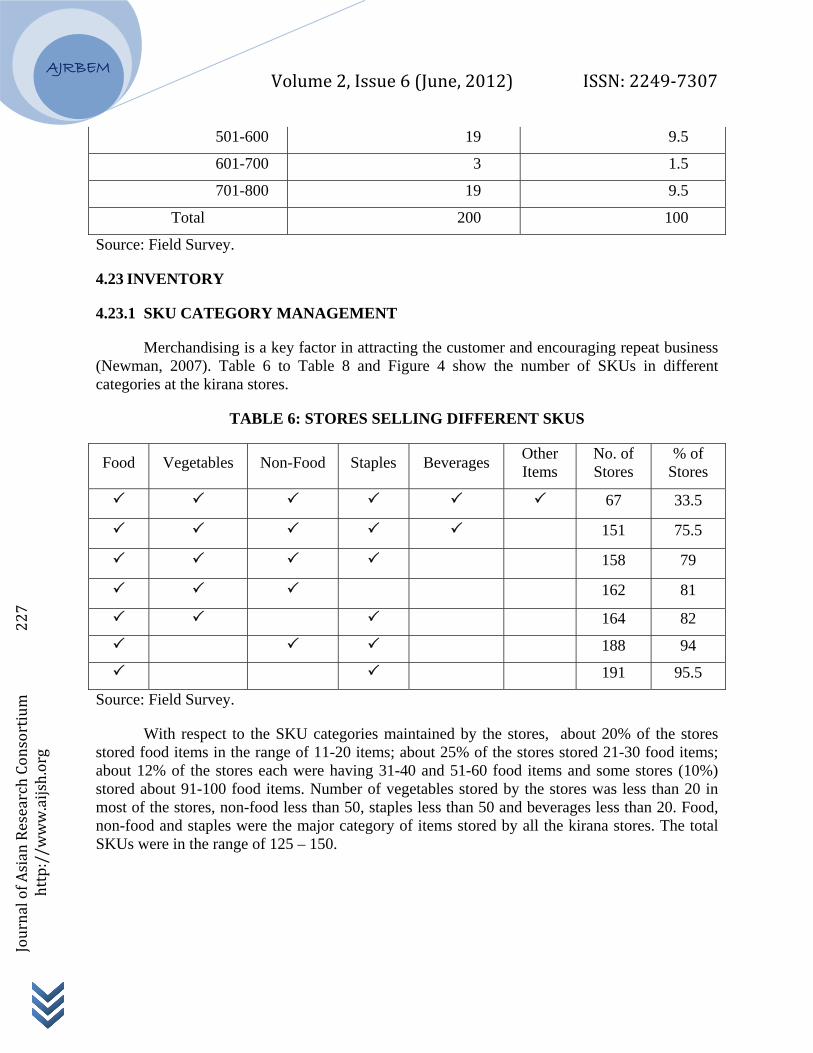
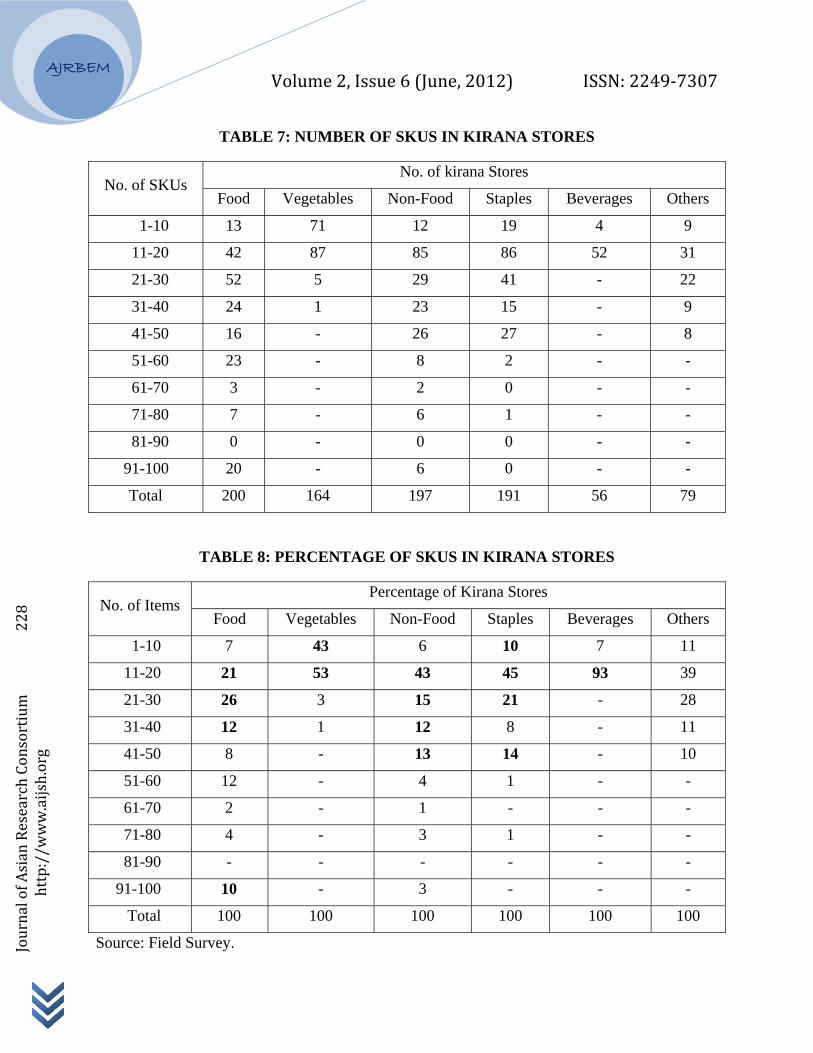
Merchandising is a key factor in attracting the customer and encouraging repeat business (Newman, 2007). Table 6 to Table 8 and Figure 4 show the number of SKUs in different categories at the kirana stores.
TABLE 6: STORES SELLING DIFFERENT SKUS
Food Vegetables Non-Food Staples Beverages Other Items
No. of Stores
% of Stores
67 33.5
151 75.5
158 79
162 81
164 82
188 94
191 95.5
Source: Field Survey.
With respect to the SKU categories maintained by the stores, about 20% of the stores stored food items in the range of 11-20 items; about 25% of the stores stored 21-30 food items; about 12% of the stores each were having 31-40 and 51-60 food items and some stores (10%) stored about 91-100 food items. Number of vegetables stored by the stores was less than 20 in most of the stores, non-food less than 50, staples less than 50 and beverages less than 20. Food, non-food and staples were the major category of items stored by all the kirana stores. The total SKUs were in the range of 125 – 150.
Volume 2, Issue 6 (June, 2012) ISSN: 2249‐7307
AJRBEM
Journal of Asian Research Consortium 228
http://w
ww.aijsh.org
TABLE 7: NUMBER OF SKUS IN KIRANA STORES
No. of SKUs No. of kirana Stores
Food Vegetables Non-Food Staples Beverages Others
1-10 13 71 12 19 4 9
11-20 42 87 85 86 52 31
21-30 52 5 29 41 - 22
31-40 24 1 23 15 - 9
41-50 16 - 26 27 - 8
51-60 23 - 8 2 - -
61-70 3 - 2 0 - -
71-80 7 - 6 1 - -
81-90 0 - 0 0 - -
91-100 20 - 6 0 - -
Total 200 164 197 191 56 79
TABLE 8: PERCENTAGE OF SKUS IN KIRANA STORES
No. of Items Percentage of Kirana Stores
Food Vegetables Non-Food Staples Beverages Others
1-10 7 43 6 10 7 11
11-20 21 53 43 45 93 39
21-30 26 3 15 21 - 28
31-40 12 1 12 8 - 11
41-50 8 - 13 14 - 10
51-60 12 - 4 1 - -
61-70 2 - 1 - - -
71-80 4 - 3 1 - -
81-90 - - - - - -
91-100 10 - 3 - - -
Total 100 100 100 100 100 100
Source: Field Survey.
AJRB
Journal of Asian Research Consortium 229
http://w
ww.aijsh.org
BEM
Source: F
4.23.2 N
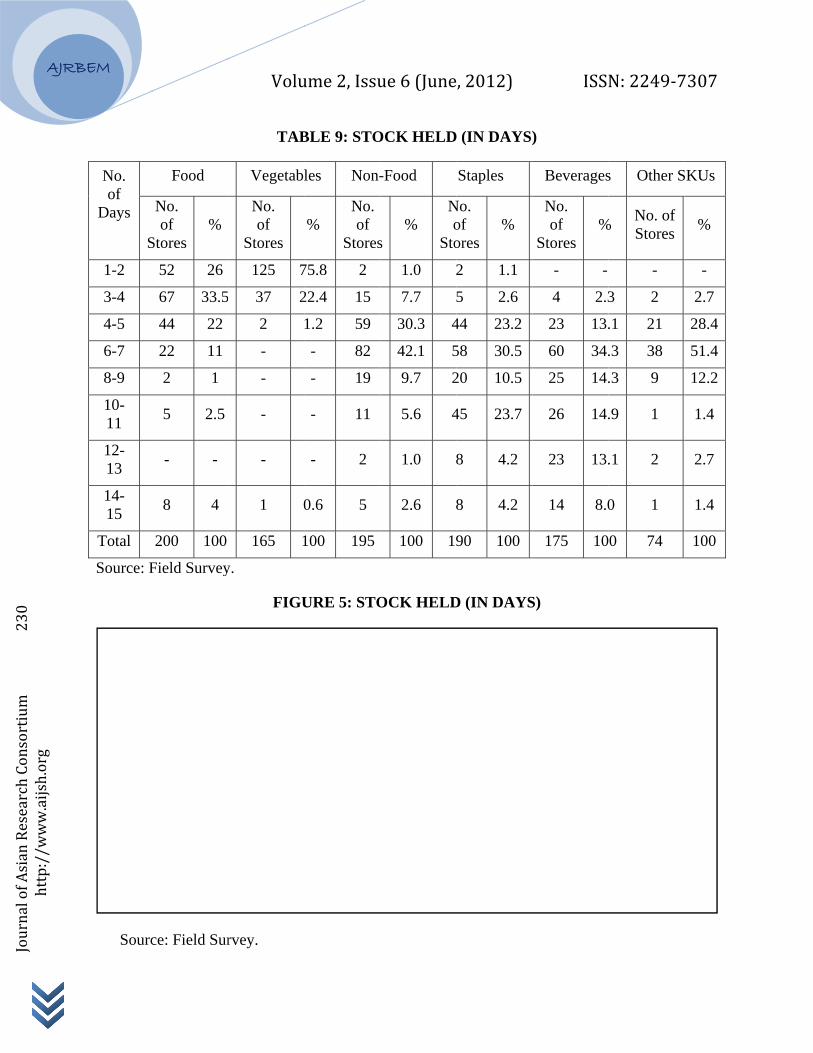
Tcarried in(26%) ofthree-quafor 4-7 d6-7 days be noted the stock
Odays, noninventory
F
Field Survey
NUMBER O
Tables 9, Tabn stores. It mf the stores aarter of the sdays. The sta
in one-thirdthat the ‘bev
k for a week
On an averagn-food, stapy turnover is
Volu
FIGURE 4:
y.
OF DAYS IN
ble 10 and Fmay be noteand for 3-5 stores. In thraple items wd (31%) of thverages’ wasand another
ge, the storesples and bevs high enabli
ume 2, Issu
CATEGOR
NVENTORY
Figure 5 showed that the fdays in 56%ree-fourth (7
were carried fhe stores ans carried for30% of the
s held the stverages for aing stores to
ue 6 (June
RY MANAG
Y CARRIE
w the numbefood items w
% of the stor72%) of the sfor less thand 10-11 day
r a longer dustores havin
tock of food about a weemanage the
, 2012)
GEMENT O
D
er of days, dwere carriedres. Vegetabstores, the ‘n
n 5 days in ays in anotherration with o
ng the stock f
items for abek. From thworking cap
ISS
OF SKUS
different SKUd for 1-2 daybles were carnon-food’ ita quarter (27r quarter of tone-third of for 8-11 day
bout 4 days,e data, it ispital effectiv
N: 2249‐7
U categoriesys in one-qurried for a dems were ca
7%) of the stthe stores. Itthe stores ha
ys.
, vegetables evident tha
vely.
7307
s was uarter day in arried tores, t may aving
for 2 at the
AJRB
Journal of Asian Research Consortium 230
http://w
ww.aijsh.org
BEM
No. of
Days
S
1-2
3-4
4-5
6-7
8-9
10-11
12-13
14-15
Total
Source: F
Sourc
Food
No. of
Stores %
52 26
67 33.5
44 22
22 11
2 1
5 2.5
- -
8 4
200 100
Field Survey
ce: Field Sur
Volu
TAB
Vegetabl
No. of
Stores
125 7
37 2
2
-
-
-
-
1 0
165 1
y.
FIGU
rvey.
ume 2, Issu
BLE 9: STO
les Non-
% No. of
Stores
75.8 2
22.4 15
1.2 59
- 82
- 19
- 11
- 2
0.6 5
100 195
URE 5: STO
ue 6 (June
OCK HELD
-Food
s%
No
Sto
1.0 2
7.7
30.3 4
42.1 5
9.7 2
5.6 4
1.0
2.6
100 19
OCK HELD
, 2012)
D (IN DAYS)
Staples
No. of ores
%
2 1.1
5 2.6
44 23.2
58 30.5
20 10.5
45 23.7
8 4.2
8 4.2
90 100
D (IN DAYS
ISS
)
Beverages
No. of
Stores %
- -
4 2.3
23 13.
60 34.
25 14.
26 14.
23 13.
14 8.0
175 10
S)
N: 2249‐7
s Other S
% No. of Stores
-
3 2
.1 21
.3 38
.3 9
.9 1
.1 2
0 1
0 74
7307
SKUs
%
-
2.7
28.4
51.4
12.2
1.4
2.7
1.4
100
Volume 2, Issue 6 (June, 2012) ISSN: 2249‐7307
AJRBEM
Journal of Asian Research Consortium 231
http://w
ww.aijsh.org
TABLE 10: CENTRAL TENDENCIES OF STOCK HELD (IN DAYS)
Food Vegetables Non-Food Staples Beverages Others
Mean 4 2 6 7 7 2
Median 3.5 1.5 6.5 6.5 6.5 0
Mode 3.5 1.5 6.5 6.5 6.5 0
Std. Deviation 3 1 3 3 4 3
Range 13 14.5 14.5 14.5 14.5 14.5
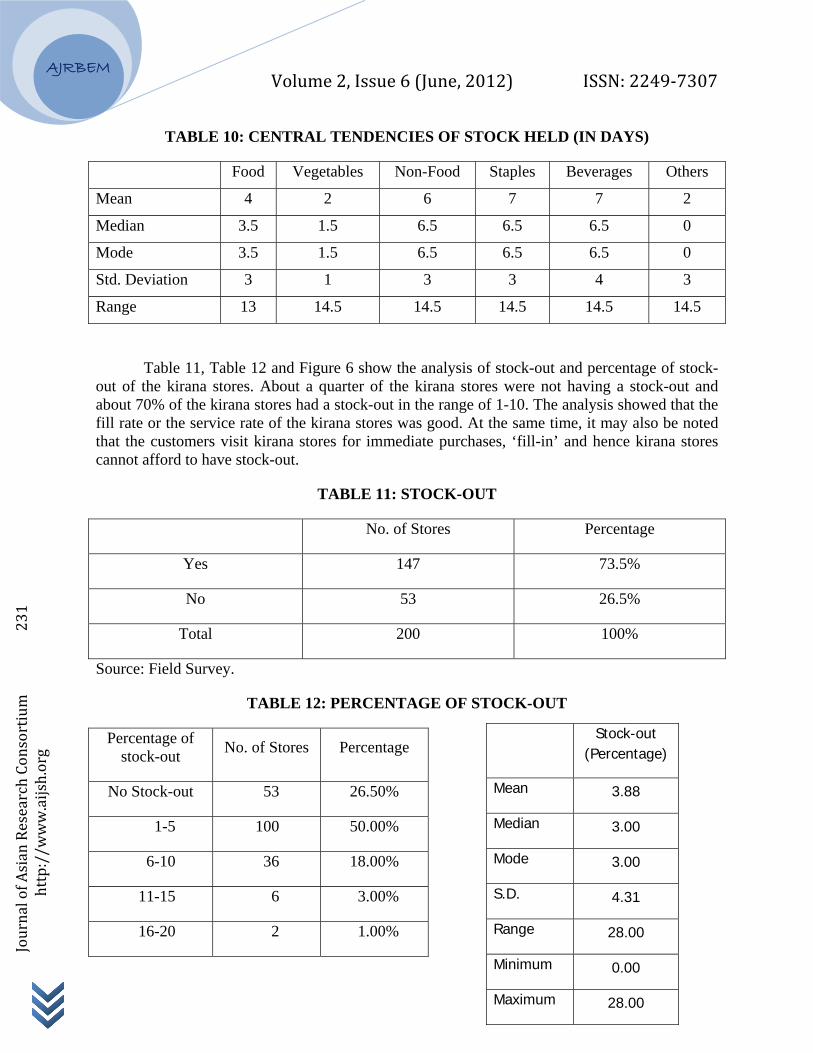
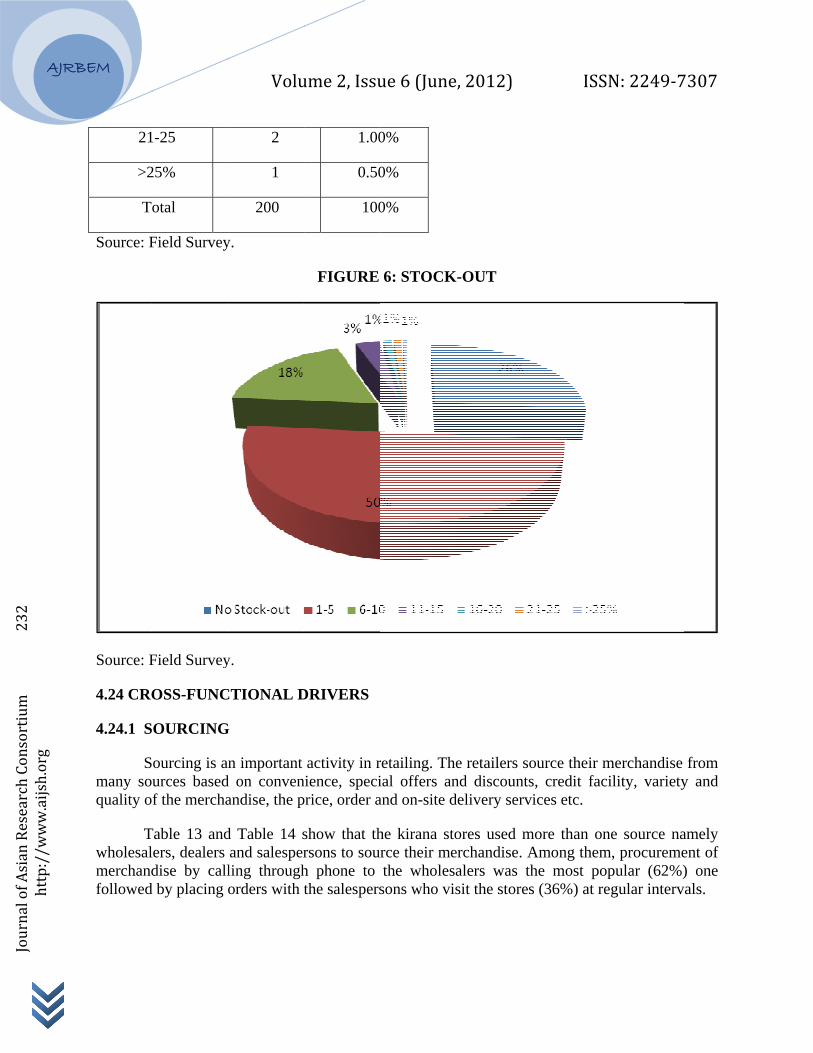
Table 11, Table 12 and Figure 6 show the analysis of stock-out and percentage of stock-out of the kirana stores. About a quarter of the kirana stores were not having a stock-out and about 70% of the kirana stores had a stock-out in the range of 1-10. The analysis showed that the fill rate or the service rate of the kirana stores was good. At the same time, it may also be noted that the customers visit kirana stores for immediate purchases, ‘fill-in’ and hence kirana stores cannot afford to have stock-out.
TABLE 11: STOCK-OUT
No. of Stores Percentage
Yes 147 73.5%
No 53 26.5%
Total 200 100%
Source: Field Survey.
TABLE 12: PERCENTAGE OF STOCK-OUT
Percentage of stock-out No. of Stores Percentage
No Stock-out 53 26.50%
1-5 100 50.00%
6-10 36 18.00%
11-15 6 3.00%
16-20 2 1.00%
Stock-out (Percentage)
Mean 3.88
Median 3.00
Mode 3.00
S.D. 4.31
Range 28.00
Minimum 0.00
Maximum 28.00
AJRB
Journal of Asian Research Consortium 232
http://w
ww.aijsh.org
BEM
21
>2
T
Source: F
Source: F
4.24 CRO
4.24.1 S
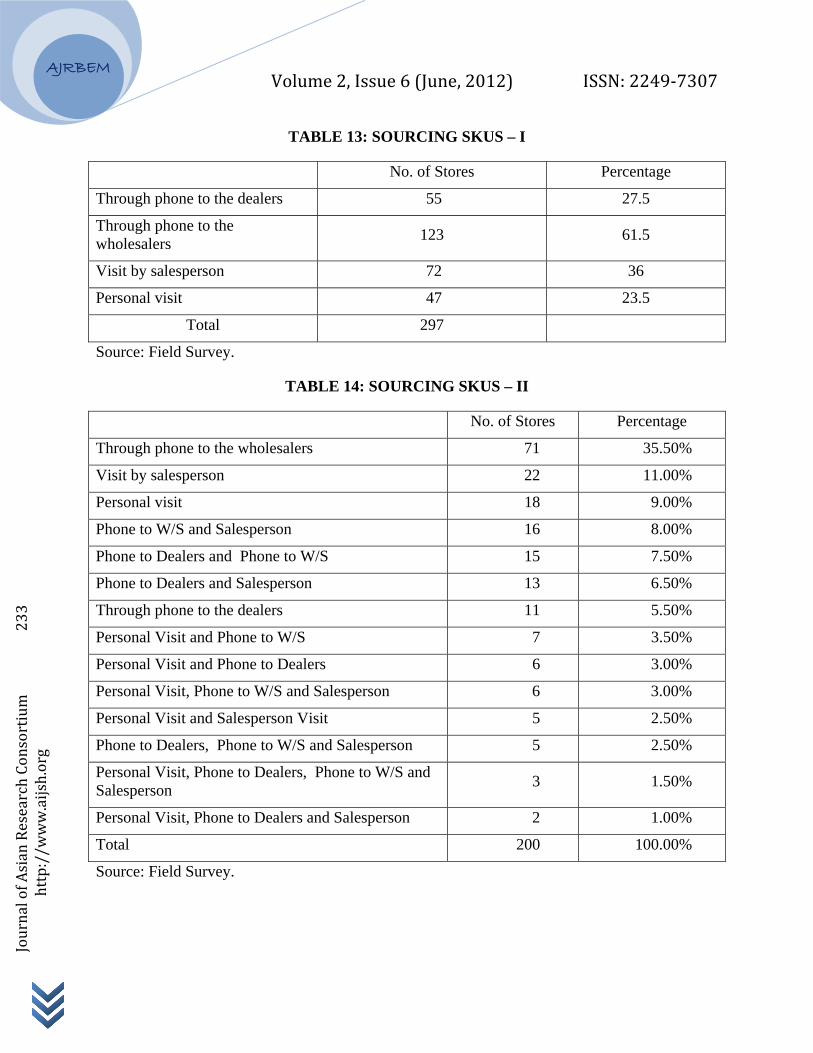
Smany soquality o
Twholesalmerchandfollowed
1-25
25%
otal
Field Survey
Field Survey
OSS-FUNC
OURCING
ourcing is anurces basedf the mercha
Table 13 andlers, dealers dise by call
d by placing o
Volu
2
1
200
y.
y.
CTIONAL D
G
n important d on convenandise, the p
d Table 14 sand salesperling throughorders with t
ume 2, Issu
1.00
0.50
100
FIGURE
DRIVERS
activity in rnience, speciprice, order a
show that thrsons to souh phone to the salespers
ue 6 (June
0%
0%
0%
6: STOCK
retailing. Theial offers anand on-site d
he kirana storce their methe wholesa
sons who vis
, 2012)
K-OUT
e retailers sond discountsdelivery serv
ores used merchandise. Aalers was thsit the stores
ISS
ource their ms, credit faciices etc.
more than onAmong themhe most pops (36%) at re
N: 2249‐7
merchandise ility, variety
ne source nam, procureme
pular (62%)egular interv
7307
from y and
amely ent of ) one als.
Volume 2, Issue 6 (June, 2012) ISSN: 2249‐7307
AJRBEM
Journal of Asian Research Consortium 233
http://w
ww.aijsh.org
TABLE 13: SOURCING SKUS – I
No. of Stores Percentage
Through phone to the dealers 55 27.5
Through phone to the wholesalers 123 61.5
Visit by salesperson 72 36
Personal visit 47 23.5
Total 297
Source: Field Survey.
TABLE 14: SOURCING SKUS – II
No. of Stores Percentage
Through phone to the wholesalers 71 35.50%
Visit by salesperson 22 11.00%
Personal visit 18 9.00%
Phone to W/S and Salesperson 16 8.00%
Phone to Dealers and Phone to W/S 15 7.50%
Phone to Dealers and Salesperson 13 6.50%
Through phone to the dealers 11 5.50%
Personal Visit and Phone to W/S 7 3.50%
Personal Visit and Phone to Dealers 6 3.00%
Personal Visit, Phone to W/S and Salesperson 6 3.00%
Personal Visit and Salesperson Visit 5 2.50%
Phone to Dealers, Phone to W/S and Salesperson 5 2.50%
Personal Visit, Phone to Dealers, Phone to W/S and Salesperson 3 1.50%
Personal Visit, Phone to Dealers and Salesperson 2 1.00%
Total 200 100.00%
Source: Field Survey.
Volume 2, Issue 6 (June, 2012) ISSN: 2249‐7307
AJRBEM
Journal of Asian Research Consortium 234
http://w
ww.aijsh.org
4.24.2 BENEFITS/INCENTIVES ON PURCHASES
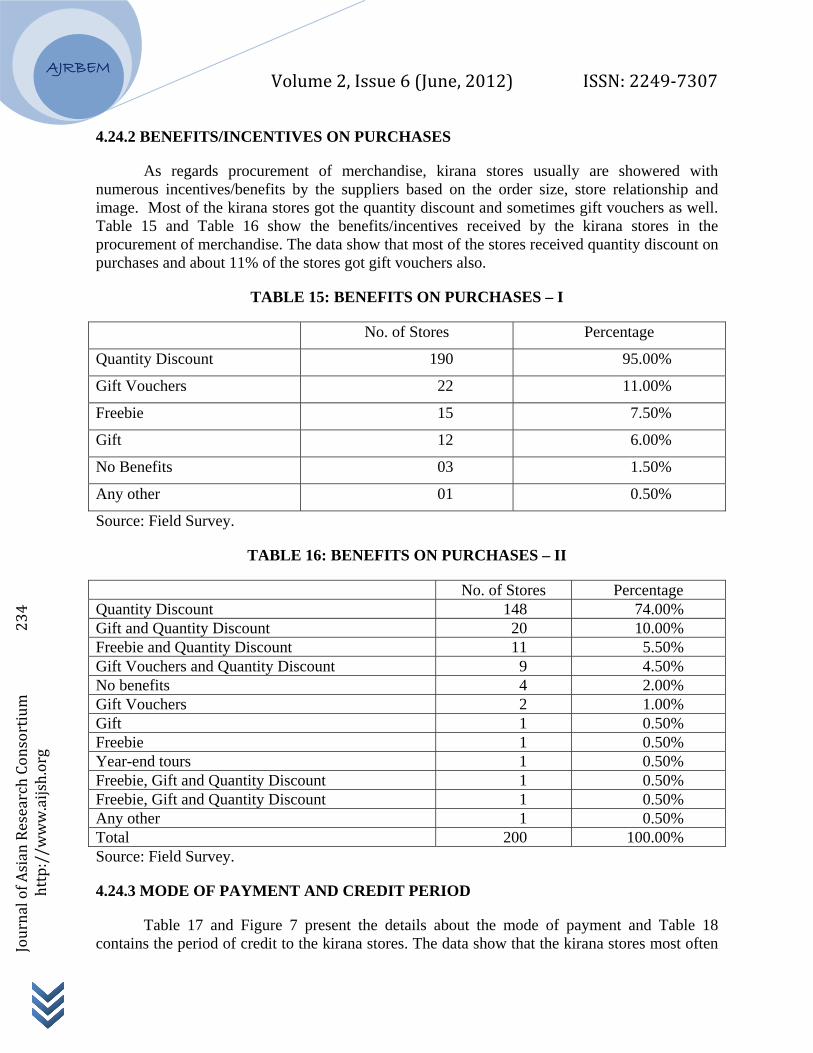
As regards procurement of merchandise, kirana stores usually are showered with numerous incentives/benefits by the suppliers based on the order size, store relationship and image. Most of the kirana stores got the quantity discount and sometimes gift vouchers as well. Table 15 and Table 16 show the benefits/incentives received by the kirana stores in the procurement of merchandise. The data show that most of the stores received quantity discount on purchases and about 11% of the stores got gift vouchers also.
TABLE 15: BENEFITS ON PURCHASES – I
No. of Stores Percentage
Quantity Discount 190 95.00%
Gift Vouchers 22 11.00%
Freebie 15 7.50%
Gift 12 6.00%
No Benefits 03 1.50%
Any other 01 0.50%
Source: Field Survey.
TABLE 16: BENEFITS ON PURCHASES – II
No. of Stores Percentage Quantity Discount 148 74.00% Gift and Quantity Discount 20 10.00% Freebie and Quantity Discount 11 5.50% Gift Vouchers and Quantity Discount 9 4.50% No benefits 4 2.00% Gift Vouchers 2 1.00% Gift 1 0.50% Freebie 1 0.50% Year-end tours 1 0.50% Freebie, Gift and Quantity Discount 1 0.50% Freebie, Gift and Quantity Discount 1 0.50% Any other 1 0.50% Total 200 100.00% Source: Field Survey.
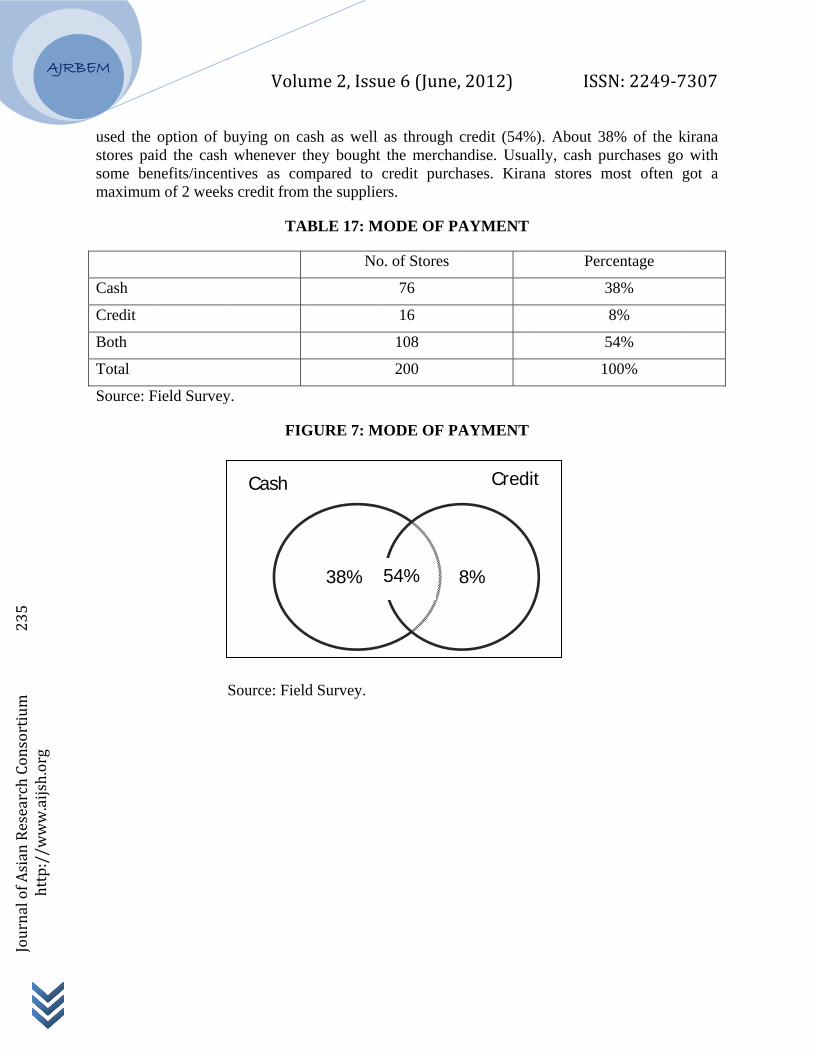
4.24.3 MODE OF PAYMENT AND CREDIT PERIOD
Table 17 and Figure 7 present the details about the mode of payment and Table 18 contains the period of credit to the kirana stores. The data show that the kirana stores most often
AJRB
Journal of Asian Research Consortium 235
http://w
ww.aijsh.org
BEM
used the stores pasome bemaximum
Cash
Credit
Both
Total
Source: F
option of baid the cash enefits/incentm of 2 week
Field Survey
Volu
Cash
buying on cawhenever t
tives as coms credit from
TA
y.
FIG
Source: Fiel
ume 2, Issu
ash as well they boughtmpared to
m the supplie
ABLE 17: M
No
GURE 7: M
ld Survey.
38%
ue 6 (June
as through t the merchacredit purch
ers.
MODE OF P
o. of Stores
76
16
108
200
MODE OF P
54%
, 2012)
credit (54%andise. Usuahases. Kiran
PAYMENT
PAYMENT
8%
Credi
ISS
%). About 38ally, cash puna stores m
Perc
3
5
1
it
N: 2249‐7
8% of the kurchases go
most often g
centage
38%
8%
54%
00%
7307
kirana with
got a
Volume 2, Issue 6 (June, 2012) ISSN: 2249‐7307
AJRBEM
Journal of Asian Research Consortium 236
http://w
ww.aijsh.org
TABLE 18: PERIOD OF CREDIT
Week(s) No. of Stores Percentage
One 36 29
Two 83 67
More than two 5 4
Total 124 100
Source: Field Survey.
4.24.4 PRICING
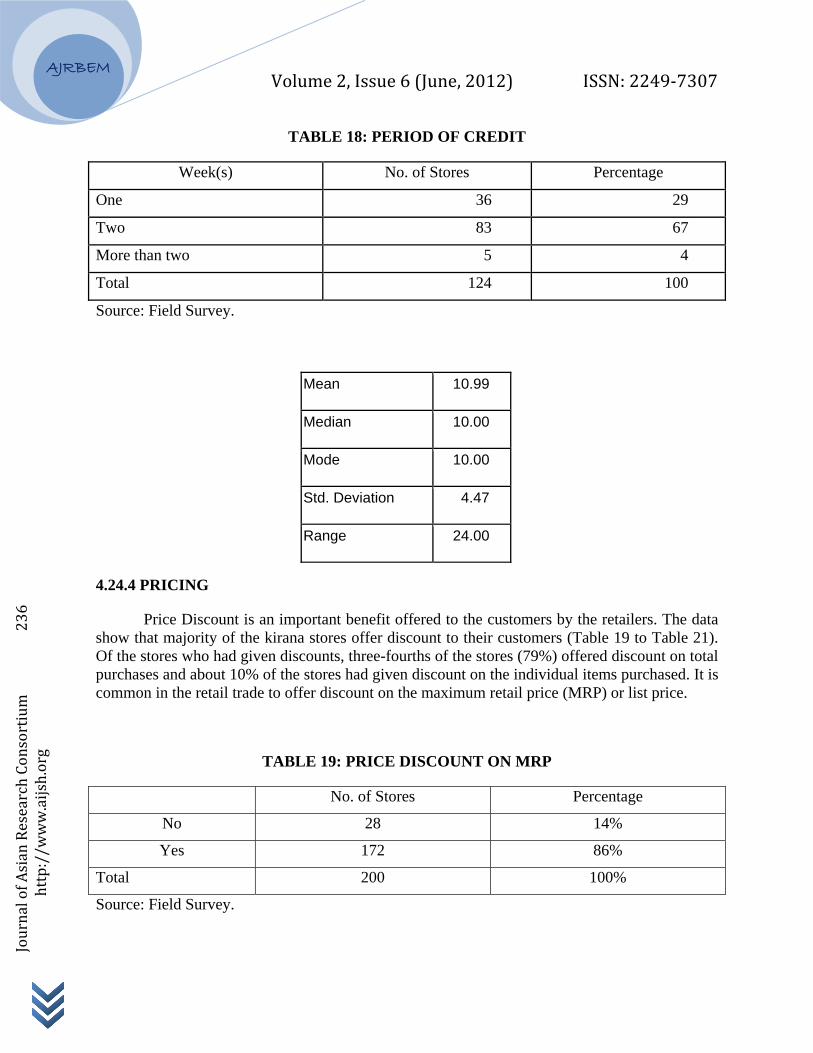
Price Discount is an important benefit offered to the customers by the retailers. The data show that majority of the kirana stores offer discount to their customers (Table 19 to Table 21). Of the stores who had given discounts, three-fourths of the stores (79%) offered discount on total purchases and about 10% of the stores had given discount on the individual items purchased. It is common in the retail trade to offer discount on the maximum retail price (MRP) or list price.
TABLE 19: PRICE DISCOUNT ON MRP
No. of Stores Percentage
No 28 14%
Yes 172 86%
Total 200 100%
Source: Field Survey.
Mean 10.99
Median 10.00
Mode 10.00
Std. Deviation 4.47
Range 24.00
Volume 2, Issue 6 (June, 2012) ISSN: 2249‐7307
AJRBEM
Journal of Asian Research Consortium 237
http://w
ww.aijsh.org
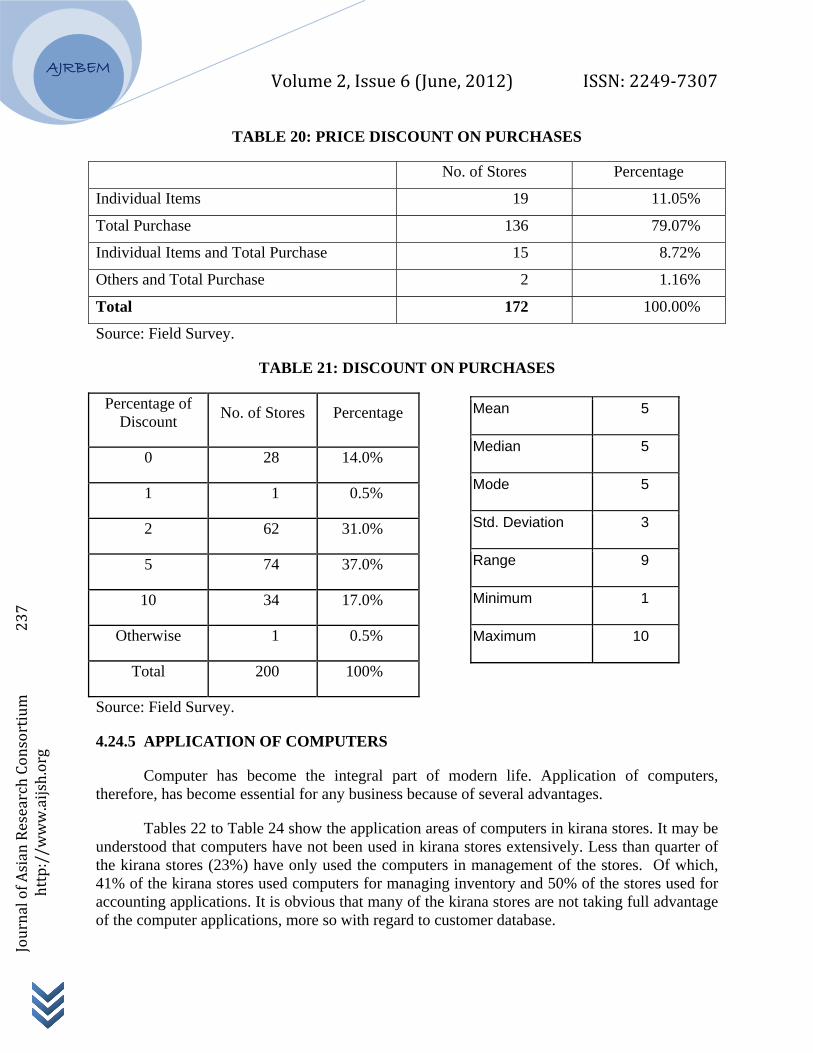
TABLE 20: PRICE DISCOUNT ON PURCHASES
No. of Stores Percentage
Individual Items 19 11.05%
Total Purchase 136 79.07%
Individual Items and Total Purchase 15 8.72%
Others and Total Purchase 2 1.16%
Total 172 100.00%
Source: Field Survey.
TABLE 21: DISCOUNT ON PURCHASES
Percentage of Discount No. of Stores Percentage
0 28 14.0%
1 1 0.5%
2 62 31.0%
5 74 37.0%
10 34 17.0%
Otherwise 1 0.5%
Total 200 100%
Source: Field Survey.
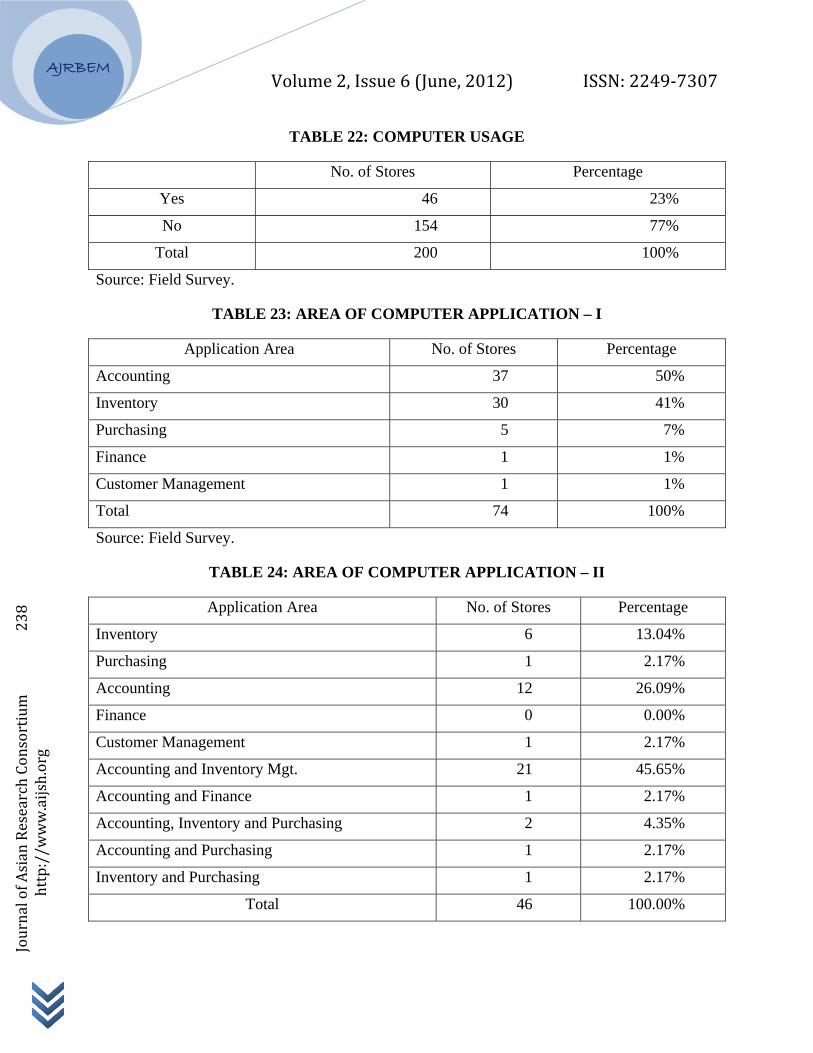
4.24.5 APPLICATION OF COMPUTERS
Computer has become the integral part of modern life. Application of computers, therefore, has become essential for any business because of several advantages.
Tables 22 to Table 24 show the application areas of computers in kirana stores. It may be understood that computers have not been used in kirana stores extensively. Less than quarter of the kirana stores (23%) have only used the computers in management of the stores. Of which, 41% of the kirana stores used computers for managing inventory and 50% of the stores used for accounting applications. It is obvious that many of the kirana stores are not taking full advantage of the computer applications, more so with regard to customer database.
Mean 5
Median 5
Mode 5
Std. Deviation 3
Range 9
Minimum 1
Maximum 10
Volume 2, Issue 6 (June, 2012) ISSN: 2249‐7307
AJRBEM
Journal of Asian Research Consortium 238
http://w
ww.aijsh.org
TABLE 22: COMPUTER USAGE
No. of Stores Percentage
Yes 46 23%
No 154 77%
Total 200 100%
Source: Field Survey.
TABLE 23: AREA OF COMPUTER APPLICATION – I
Application Area No. of Stores Percentage
Accounting 37 50%
Inventory 30 41%
Purchasing 5 7%
Finance 1 1%
Customer Management 1 1%
Total 74 100%
Source: Field Survey.
TABLE 24: AREA OF COMPUTER APPLICATION – II
Application Area No. of Stores Percentage
Inventory 6 13.04%
Purchasing 1 2.17%
Accounting 12 26.09%
Finance 0 0.00%
Customer Management 1 2.17%
Accounting and Inventory Mgt. 21 45.65%
Accounting and Finance 1 2.17%
Accounting, Inventory and Purchasing 2 4.35%
Accounting and Purchasing 1 2.17%
Inventory and Purchasing 1 2.17%
Total 46 100.00%
Volume 2, Issue 6 (June, 2012) ISSN: 2249‐7307
AJRBEM
Journal of Asian Research Consortium 239
http://w
ww.aijsh.org
Source: Field Survey.
5.0 FINDINGS
5.1 LOGISTICS DRIVERS
5.11 Location
The stores were more or less equally distributed throughout the prominent geographical areas of Bangalore city. All the stores invariably are located at vantage points of the main road or bylanes. Almost all the stores were located on the main road, or street corners or important junction points.
Kirana stores are typically small in size as they are located in the residential area zones. The size of the stores revealed that about half of the stores were less than 200 sq. feet. Some of them were relatively bigger.
5.12 MERCHANDISE MANAGEMENT (INVENTORY)
With respect to the SKU categories maintained by the stores, majority of the stores had food items in the range of 11- 60 items and some stores stored about 91-100 food items. The stores stored vegetables in the range of 1-20, non-food in the range of 11-50, staples in the range of 1-50 and beverages in the range of 11-20. Food, non-food and staples were the major category of items stored by all the kirana stores. The total SKUs were in the range of 125 – 150.
In kirana Stores, the food items were carried for about 1-7 days. Vegetables were carried for 1-4 days. The non-food items were carried for 4-7 days. The staple items were carried for 4-9 days. The beverages were carried for 4-13 days.
On an average, the stores held the stock of food items for about 4 days, vegetables for 2 days, non-food, staples and beverages for about a week. From the data, it is evident that the inventory turnover is high enabling stores to manage the working capital effectively.
5.12 TRANSPORTATION
Kirana store did not spend much on the inbound transportation as the SKUs were delivered to their stores by the suppliers. The suppliers were wholesalers, dealers and salespersons. In case, when they went personally to bring the merchandise, they used their own vehicles such as motorbikes and sometimes the auto rickshaws.
5.2 CROSS-FUNCTIONAL DRIVERS
5.21 SOURCING
Kirana stores used more than one source namely wholesalers, dealers and salesmen to source their merchandise. Among them, procurement of merchandise by calling through phone to
Volume 2, Issue 6 (June, 2012) ISSN: 2249‐7307
AJRBEM
Journal of Asian Research Consortium 240
http://w
ww.aijsh.org
the wholesalers was the most popular (62%) one followed by placing orders with the salesmen who visited the stores (36%) at regular intervals.
As regards procurement of merchandise, kirana stores are showered with numerous benefits by the suppliers based on the order size, store relationship and image. Most of the kirana stores got the quantity discount and sometimes gift vouchers as well.
The kirana stores most often used the option of buying on cash as well as through credit (54%). About 38% of the kirana stores paid the cash whenever they bought the merchandise. Usually, cash purchases go with some benefits/incentives as compared to credit purchases. kirana stores most often got a maximum of 2 weeks credit from the suppliers.
5.22 PRICING
Among the stores who had given discount on purchases, about three-fourth of the stores had given discount on total items purchased and about 10% of the stores had given discount on the individual items purchased.
The discount did not exceed 10% and majority of the stores gave a discount of 2% or 5% on the M.R.P.
5.23 INFORMATION
It may be understood that computers have not been used in kirana stores extensively. Less than quarter of the kirana stores (23%) have only used the computers in management of their stores. Of which, 41% of the kirana stores used computers for managing inventory and 50% of the stores used for accounting applications. It is obvious that many of the kirana stores are not taking full advantage of the computer applications, more so with regard to customer database.
6.0 SUGGESTIONS
Kirana stores were having less than 150 SKUs in their stores. Of course, by the nature of business they may not be able to manage more SKUs. At the same time, the modern customers want more choice. So efforts need to be taken to have more variety in their stores. This will attract more customers and also discourage the existing customers to shift away from their stores.
Most often, the kirana stores do not spend time on ‘display’ of the merchandise. But this is essential to induce the customers to visit their stores. Banners, displays are important component of food retail and these activities need to adopted by the stores to get more sales.
It has been inferred from the study that about three-fourth of the kirana stores are facing ‘stock-out’. Customers visit kirana stores for fill-in – immediate purchases. If the kirana stores are not in position to meet the demand of customers, they lose their goodwill and also the customers themselves. Therefore, adequate steps have to be taken to have sufficient stock to meet the demand.
Volume 2, Issue 6 (June, 2012) ISSN: 2249‐7307
AJRBEM
Journal of Asian Research Consortium 241
http://w
ww.aijsh.org
Traditionally, the kirana store owners buy their SKUs on cash. In this study also, it has been found that about two-fifth of the stores bought the SKUs only on cash. It has been suggested that they need to be encouraged to buy on credit. This would help them to manage the cash for buying more number of merchandise and in turn this would result in more number of customers and sales.
Over three-fourth of the kirana store are not using computers for the management of kirana stores. The stores are not taking full advantage of computer applications in the field of SKU management, accounting, etc. It is suggested that kirana stores start adopting computers for better management of the stores.
7.0 CONCLUSION
Food Retail is a big business in India. Till recently, the business model that successfully satisfied the needs of the customers was the Kirana stores. Kirana stores exists in India for many years. Kirana store owners, the small traders with their native intelligence, dynamic merchandising and personal relationship with the customers, were successful in their business satisfying the customers to a larger extent and at the same time earning a decent income. With the aspiring needs of the customers, young population, high disposable income and informed customers, slowly the organised retailing is gaining momentum.
With high market potential, the foreign food retail leaders such as Wal-Mart, Carrefour, Tesco and others are waiting on the wings to enter the market on their own. In this context, there will be shift in buying pattern of the customers i.e. from kirana stores to the organised retail. But at the same time, customers are not going to abandon the kirana stores. For immediate purchases, fill-ins, customers rely on the traditional stores and the business is going to stay forever. At the same time, the kirana stores would need to improve on their weaknesses such as unhygienic conditions of the stores, better shelving and displaying of merchandise and outlook of the stores. This would help them in sustenance and growth of the business. India is a country of contradictions and there is enough space for any business to survive and grow and kirana stores is not an exception!
REFERENCE
1. Andrew J Newman and Peter Cullen, "Retailing: Environment & Operations", Thomson Learning 2007.
2. Bhusan Ratna (2010), ‘Attractive deals and promotions help big retailers grow’, Economic Times, 5th July 2011.
3. Chetan Bajaj et al, Retail Management, Oxford Publishers, 2005.
4. Corporate Catalyst India, “A report on Indian Retail Industry”, 2006.
Volume 2, Issue 6 (June, 2012) ISSN: 2249‐7307
AJRBEM
Journal of Asian Research Consortium 242
http://w
ww.aijsh.org
5. Darlington Jose Hector (2012), ‘ Uniquenss of kirana stores will keep them relevant: Interview with Thomas Varghese, MD&CEO, Aditya Birla Retail’, The Financial Express, January 27, 2012.
6. Dr. M Bhasi, Retailing in Kerala, http://www.indianmba.com/Faculty_Column/ FC612/fc612.html.
7. http://www.chillibreeze.com/articles_various/Kirana-stores.asp
8. http://www.surveysystem.com/sscalc.htm.
9. Neeraj Thakur (2009), ‘Kirana stores back in fashion’, Business Standard, New Delhi Ed., January 26, 2009.
10. Raghav Gupta (2009),‘Can modern retail learn from the humble kirana?’, FICCI – Footfalls, March – April 2009.
11. Raghav Gupta, Rohit Bhatiani, and Pranay Gupta, “An Overview of India’s Consumer and Retail Sectors”, pp 27-32, Technopak Perspective, Volume 4, 2010.
12. Retail biz, January 2010.
13. Shubhra Saini (2009), ‘Kirana rules the retail pie’, http://retail.franchiseindia.com/articles/Retail-Business-Practice/New-Trends/Kirana-rules-the-retail-pie-51/, October 27, 2009.
14. Sotiris Zigiaris (2000), “Supply Chain Management”, http://www.urenio.org/tools/en/supply_chain_management.pdf
15. Sunil Chopra and Peter Meindl, Supply Chain Management Strategy, Planning & Operations, 4th Edition, 2010.
16. Varun Jain (2010), ‘Kiarna Stores: Difficult to Defy’, http://retail.franchiseindia.com/articles/Retail-Trends/Retail-Industry/Kirana-Stores-Difficult-to-Defy-264/, June 19, 2010.