Embed Size (px)
Citation preview
ASIAN-PACIFIC-AMERICAN HERITAGE MONTH 1996
PREFACE
Major Deane A. Corbett, USMC, Operations Officer, Ordnance Business Center, Marine Corps Logistics Base, Barstow, California, served as a participant in the Topical Research Intern Program at the Defense Equal Opportunity Management Institute (DEOMI) during the month of March 1996. He conducted the necessary research to prepare this report. The Institute thanks Major Corbett for his contributions to the research efforts of DEOMI.
SCOPE The Topical Research Intern Program provides the opportunity for Servicemembers and DoD civilian employees to work on diversity/equal opportunity projects while on a 30-day tour of duty at the Institute. During their tour, the interns use a variety of primary and secondary source materials to compile a review of data or research pertaining to an issue of importance to equal opportunity (EO) and equal employment opportunity (EEO) specialists, supervisors, and other leaders throughout the Services. The resulting publications (such as this one) are intended as resource and educational materials and do not represent official policy statements or endorsements by the DoD or any of its agencies. The publications are distributed to EO/EEO personnel and selected senior officials to aid them in their duties.
May 1996
The opinions expressed in this report are those of the author and should not be construed to represent the official position of DEOMI, the military services, or the Department of Defense.
LOCAL REPRODUCTION IS AUTHORIZED AND ENCOURAGED
INTRODUCTION The 1996 National Theme for Asian-Pacific-American Heritage Month is "Asian/Pacific Americans United - One Vision, One Mission, One Voice." While indeed spirited, it is a focus which represents immense challenges for Americans.
In the current literature, "Asian-Pacific-American" affixes a common label to a vast array of ethnic groups. The American way of perception tends to lump all Asians together into
one racial group, without distinct ethnic and cultural differences. (32:vii) In terms of cultural diversity however, Asian-Pacific-American immigration in the past three decades can be compared to that of European immigration in the early 1900's. There are as many differences in language, food, and religions among Asian-Pacific-Americans as among the Greeks, Irish, Italians, or Germans. (6:72)
Rather than a single homogeneous culture, the term "Asian-Pacific-American" actually identifies individuals from at least 29 different countries, each with a unique historical and cultural heritage of its own. (41:90) Asian Indians alone come from a nation of nearly a billion people from 25 different states. They speak at least 15 different languages. (35:36)
As a nation we face the test of assimilating an increasingly more diverse set of cultural resources in a way which maximizes contribution to society while minimizing inevitable friction. Regardless of our individual ethnic backgrounds, we can all play a part in creating a better future for America.
President Clinton offered the following comments during the 1995 Asian-Pacific-American Heritage Month; "Bringing new values and customs to these shores, Asian and Pacific Americans have immeasurably enriched the quality and character of this country. In every field of endeavor, in public and private sector alike, they have endowed our Nation with unparalleled energy and vision." (12:761)
Thus, the Asian-Pacific-American mix can serve to represent how cultural diversity may be viewed within the larger framework of society. In reference to typical conflict within Asian-Pacific-American ranks, University of California, Berkeley, Chancellor, Chang-Lin Tien aptly observed that, "Diversity is a handicap only if we allow it to be." (49:x) He advocates personal responsibility for ensuring that future generations know of the contributions of all people by telling the history of our multi-cultural nation.
PURPOSE Part of the Defense Equal Opportunity Management Institute (DEOMI) mission includes translating "... increased awareness of issues into improved leadership." Other responsibilities include "providing input to Defense Department leadership in formulating EO/EEO policy throughout the Armed Forces," as well as "collecting and disseminating information to assist EO/EEO professionals in performing their duties." Within these guidelines is an implicit obligation for DEOMI to encourage changes in the way the Department of Defense (DoD) personnel think about, act towards, and lead our diverse collection of cultural backgrounds.
Accordingly, the purpose of this report is twofold. First, it is to show why Asian-Pacific-Americans have been, are, and will continue to be important to the DoD team. Second, it is to provide information for DoD Asian-Pacific-Americans to share in proudly celebrating their rich and unique combination of heritages. General areas of information will include: Asian-Pacific-American population growth and its significance; a brief
history of Asian-Pacific-American immigration; the impact of Asian-Pacific-Americans on business, education, and the political process; and contributions of Asian-Pacific-Americans to DoD.
GROWTH OF THE ASIAN-PACIFIC-AMERICAN POPULATION It would be an understatement to say that the Asian-Pacific-American population has experienced dramatic growth in recent decades. Asian-Pacific-Americans are the fastest-growing ethnic minority group in the United States. (49:xi) In fact, this segment is growing ten times faster than the overall U.S. population and 70% of all Asian-Pacific-Americans are either first or second generation immigrants. (13:29)
More than half of all immigrants entering the United States are Asians. (45:254) According to the 1990 census, the number of persons of Asian and Pacific Islander descent almost doubled between 1980 and 1990, from 3.7 million to 7.2 million (Table 1). Almost three million of the 3.5 million increase was due to new immigrants, with the remainder being born in the United States. The Chinese (23%) represent the largest group of Asian-Pacific-Americans, followed by Filipinos (19%), Japanese (12%), Koreans (11%), and Asian Indians (11%) (Table 2). The Asian-Pacific-American population is projected to grow to over 40 million by the year 2050 (Table 3).
The total Asian-Pacific-American population estimate given by the Census Bureau as of March 1996 is 9,459 million. (30)
Throughout history Asian men have far outnumbered women. However, there has been a shift in gender of Asian-Pacific-American's immigrating. In 1992 there were 155 Filipino women for every 100 Filipino men immigrating. For Koreans and Japanese, women outnumbered men 145-100. For Chinese immigrants, women outnumbered men 122-100. The shift in gender can be explained due to new laws encouraging nurses to immigrate, marriages of Asian women to servicemen, and women finding easier access to low paying service jobs in hotels or nursing homes. (47:8A) Census Bureau projections (see Table 4) indicate that Asian-Pacific-American women will continue to emigrate to this country in higher numbers than men every year through at least 2050. (2:16)
With well over 400,000 in Honolulu alone, Asian-Pacific-Americans have constituted the majority of Hawaii's population for nearly a century (70% at last census). Three hundred thousand Chinese live in New York City--the largest Chinese community outside of China. About one-fourth of San Francisco's population is Asian. In California, Asian-Pacific-Americans (nearly a million in Los Angeles alone) represent nine percent of the state's population, surpassing the Black population. As of 1995, the five states with the most Asian-Pacific-Americans were California, New York, Hawaii, Texas, and Illinois. (See Table 5)
The above sampling of statistics relative to Asian-Pacific-American population represents more than just numbers. The continued influx of Asian-Pacific-Americans is very significant. For example, as part of the overall picture of population growth through
immigration, Asian-Pacific-Americans will play a vital role in helping to maintain economic growth for America. The average American is getting older and fertility rates have been declining, so immigration will become the prime source of population increases. If there were no immigration, population would decrease over the next 50 years, and a nation cannot experience a rising economy when the population is falling. (6:73)
Another significance of Asian-Pacific-American population growth through immigration is that these diverse cultures will necessarily require greater shares of common resources and will have greater input as to how wealth and capital are distributed. In addition, new domestic markets for goods and services must be satisfied as culturally based demand is generated. At just 2.9% of the total U.S. population in 1990, current growth rates will cause Asian-Pacific-Americans to account for over 7% by 2020 and over 10% by 2050. (37:2) Suffice it to say that assimilation and accommodation of Asian-Pacific-Americans will take on more and more importance in coming years. Likewise, their collective contribution to the demographic landscape of America will also be enormous.
HISTORY OF IMMIGRATION BY ASIAN-PACIFIC-AMERICANS America was created and shaped by successive waves of immigrants, and has often been regarded as the "melting pot" of the world. First, America experienced a great wave of European exploration and colonization. Colonists later brought shiploads of Africans to work on Southern plantations. Next, the Chinese were brought to work on the Pacific Railroad, and Japanese, Filipinos, and Koreans to work on Hawaiian sugar plantations. The New Immigration Act of 1965 abolished immigration quotas, bringing many different groups from around the world.
A last great wave of immigration saw Southeast Asian refugees arrive after the fall of Vietnam in 1975. Although they have different histories, cultures, languages, and identities, Chinese, Japanese, Filipinos, Asian Indians, Koreans, Southeast Asians, and Pacific Islanders are grouped together as Asian-Pacific-Americans. But just how people of diverse cultures, from many lands, occupations, environments, and religions could be "melted" together into one culture has been disputed. (10:3) Because of a predominantly English heritage in the colonial period, the United States often has evaluated its varied citizenries', neighborliness and social inclusion (assimilation) by a single standard: White, Anglo-Saxon, middle-class Protestantism. (17:3;38:viii)
Asian-Pacific-Americans have been here for over 150 years; however, little is known about their history. (42:6) "Pushed" out of their country by economic depression and "pulled" by hopes and dreams of fortune, emigration to America by Asians and Pacific Islanders was seen as an opportunity for a better life. Since the Immigration Act of 1965, there has been a huge influx of "brainpower" from Asian-Pacific regions. In India for example, a sluggish economy, unavailability of higher education, and lack of domestic jobs for a well-trained labor force were factors in the emigration of skilled professionals to the U.S.
Similar factors can be assigned to the emigration patterns of other Asian-Pacific nations as well. (37:38) Needed as an "industrial reserve army," they were viewed and treated as outsiders. That view must ultimately give way to a more enlightened perspective of a permanent Asian-Pacific-American presence that is becoming less and less of a minority in America.
For Asian-Pacific-Americans to be full contributors to society, they must first be understood and accepted by the rest of America. A complete review of the histories behind 29 different cultures is not possible here, but the following is a brief history of how many of the major Asian-Pacific-American groups came to call America home.
CHINESE IMMIGRATION
China is one of the oldest cultures in recorded history. A feudal society bound by traditional roles and responsibilities according to age, sex, birth order, and class within society, it was highly influenced by Confucianism. (33:361) Confucius (551-479 B.C.E.) was the greatest of the Chinese philosophers, and for nearly two centuries China was guided by his teachings. (43:18) Confucianism created an orderly society by regulating relationships within the family. The father or grandfather was responsible for teaching of values to the young and the care of parents in old age. (43:19)
Less than one hundred and fifty years ago, there was almost no contact between China and the Western world. The Chinese were forbidden to teach their language to a foreigner or to send books abroad. (40:66) The first Chinese arrived in 1847 when they were brought by a missionary for schooling in Massachusetts. (22:106)
With the push by America to open up China to trade, the year 1848 saw the arrival of silk merchants and the first true immigrants, two men and a woman, to work in mining areas. (22:106) When news of the gold rush reached economically depressed Canton in south China, tales of riches brought twenty-five thousand Chinese to California by 1851. The Chinese had developed mining throughout Southeast Asia (33:366), and they named America "Gam Saan," Gold Mountain. (42:31)
America also needed access to cheap labor for the Central Pacific Railroad, and the economic conditions in China made for a frail but mutual alliance between the two countries. Most of the Chinese who came were poor male villagers (33:363). Known as "sojourners," they left their wives and children with the idea of making enough money to return to China.
To Americans, the Chinese appeared alien, due more to cultural differences than racial. (33:366) Compounding the problem, Chinese sojourners maintained a psychological and social separateness from American society by maintaining the values, norms, and attitudes of their homeland, and men still dressed according to Chinese custom with queues (a long braid of hair at the back of the head), felt slippers, cotton blouses, and little round hats. (33:363)
Opposition began as Chinese gold miners made profitable mining locations Americans considered worthless. Because men far outnumbered women, Chinese seized opportunities as cooks, launderers, and household servants. Charges were made by Whites that the Chinese depressed wages and the standard of living. This backlash, along with the lawless setting of the frontier, resulted in violence against the Chinese.
Government intervention concerning hostility to Chinese immigration began with a treaty with China in 1868, giving Chinese in the United States the privileges of travel or residence as citizens of nations with most favored status, but excluded the right of naturalization. The Chinese Exclusion Act of 1882 barred any heavy immigration of Chinese. From 1908 to 1930, 72,796 Chinese departed while 48,482 arrived in America. (33:362)
Chinese Immigration to Hawaii
In 1865, Hawaii sent Dr. William Hillebrand, Royal Commissioner of Immigration, to bring back cheap labor for sugar plantations. Two vessels transported 500 workers, each with a five-year contract to work in Hawaii. The percentage of Chinese in Hawaii rose from one-tenth of one percent in 1853 to twenty-two percent in 1884. (40:73) The increased Chinese presence in Hawaii became a political issue, and during the 1880s, Japanese were substituted for Chinese. Later, the number of Japanese would be seen as a threat and they would be replaced with Filipinos.
During the early 1900s, the Chinese were able to move off the plantation by saving part of their net monthly wage of $14.60. (40:75) However, legal impediments were contrived to block the advance of Asians to middle occupations. In 1903, Hawaii implemented a law that stipulated only citizens or persons eligible to become citizens (not Asians) were to be employed as mechanics or laborers on work carried on "by this Territory." (40:76)
Chinese Reaction to Growing Hostility
Because of growing White dissention to the Chinese, sojourners in the United States either returned home or, for the vast majority of Chinese, withdrew residentially and economically, establishing "Chinatowns" in larger cities. Metropolitan areas afforded the anonymity the Chinese were looking for. (22:108) The "Chinatown" in San Francisco was for many years the most powerful network for Chinese in America. (33:369) This "Chinatown" was also the home for many activities, illegal in America, but acceptable in China. San Francisco was also headquarters for merchant associations known as "tongs." To some, the tongs served for the betterment of merchants and business people. To others, tongs were criminal organizations which exerted a tyrannical force over the Chinese. (22:109)
During the 1930s and 1940s there was an exodus from "Chinatown." (33:372) The younger and better educated landed positions in mainstream America. Many Chinese restaurants and laundries had to close their doors, and because the defense industry
needed manpower, Chinese were readily recruited. The barrier to employment opportunities was broken. (10:199)
Two important political changes in the 1960s have positively affected the Chinese in America. (10:203) First, the New Immigration Act of 1965 abolished immigration quotas. Second, the Equal Opportunity Act opened opportunities for Chinese beyond the traditional businesses, such as restaurants and laundries. Compared to the pre-1945 era, there has been great improvement in Chinese assimilation in America. Only since the mid-1960s has the integration of Chinese into American society begun to resemble that of immigrant groups of earlier generations. (10:7)
JAPANESE
Japanese have been in the continental United States for more than a century. Some Japanese, slaves held by several Indian tribes, were in the Northwest before the arrival of the first Whites. (22:122) From 1636 to around 1860, Japanese were forbidden to emigrate from Japan. (34:230) The Tokugawa shogunate imposed an embargo on emigration in the 17th century, and because of fear of the corrupting influence of the West, had effectively sealed off the borders. But the arrival of Admiral Perry in 1853, and the signing of a peace treaty between the United States and Japan, reversed for a short time Japan's emigration policy. Laws forbidding emigration were reinstated when Japan feared that the export of labor would lower their prestige among nations of the world. (22:131) Emigration laws were later relaxed again only because of severe economic conditions and crops failure in southern Japan. (22:131) From 1886 until 1924 there was considerable Japanese emigration to the Hawaii (238,758) and the United States (196,543). (33:382)
Japanese Arrive in Hawaii
Sugar is believed to have been first milled in Hawaii as early as 1802. However, it was not until the 1840s that sugar became a major crop. (29:4) Native Hawaiians were hired first to do the growing, harvesting, and milling of sugar, but there became an acute shortage of Hawaiian laborers. Compounding the problem was the Hawaiian emigration to California during the gold rush and thousands of Hawaiians dying from diseases brought to the Islands by foreigners. (29:5) Recognizing the need for cheap labor for sugar plantations, the Hawaiian ambassador to Japan persuaded the government to allow 180 contract laborers to sign up for work.
The Japanese found conditions on the sugar plantation harsh. They worked from dawn to dusk, unaccustomed to the scorching hot Hawaiian sun. Because they did not understand orders given in English, workers were often bullwhipped. (29:9) After the Japanese government learned of these conditions, Special Commissioner Katsunosuke Inouye was sent to Hawaii to investigate charges of cruelty to Japanese workers. Japan threatened to stop sending workers unless something was done to stop the abuse. Frightened by the possibility of termination of the labor source, and hoping to satisfy Japan's concern for Japanese workers in Hawaii, the Hawaiian government entered into an agreement with
Japan making Japanese immigrants wards of the Hawaiian government, and the planters its agents. Waiting to see if the agreement with Hawaii stopped Japanese worker abuse, Japan did not allow further emigration until 1886. Between 1886 and 1894 twenty-six sailings brought 29,069 Japanese immigrants. (29:22) Another 30,000 Japanese immigrants were brought in during the two years after Hawaii's annexation in 1898.
After the Organic Act was passed in 1900, giving Japanese laborers more freedom, there were many small strikes for increased wages and better working conditions. Dissatisfied and unhappy, over 40,000 left for employment in the continental United States. (29:27) This, and an outbreak of bubonic plague among the immigrants of Honolulu, caused a critical labor shortage. Sugar planters then turned to the Filipinos as a source of cheap labor.
Japanese in the United States
In 1880, two years before the passage of the Chinese Exclusion Act, fewer than 200 Japanese lived in the United States. A decade later, Japanese immigrated at an annual rate of 1,000. From 1899 to 1903, another 60,000 entered the United States, largely because of the acute labor shortage in California. (17:268) The exclusion of the Chinese had left many menial and unskilled jobs without takers.
The Japanese population at this time was concentrated largely on the Pacific Coast, with the center in San Francisco. (22:133) They were rural farmers from southern Honshu and Kyushu, and unlike the Chinese who migrated to urban living, the Japanese preferred rural farming. The early Japanese farmers and farm organizations laid the groundwork for future Japanese immigrants by providing capital and agriculture expertise. Like the Chinese, the Japanese received few loans from banks, so a Japanese rotating credit association, one of many variations, would accept subscriber deposits and give loans to the most needy Japanese workers who wanted to purchase land. The cooperation between the association and the workers was built on trust and honor, and the rate of default was rare.
As with the Chinese, the Japanese welcome began to fade as their numbers began to rise. Unlike the Chinese, the Japanese did not disperse. America began to stereotype Asians into two categories: the Chinese, humble and "inferior" who could be tolerated; and the Japanese who were cunning and aggressive who required domination to keep them in place. (33:382)
In 1907, President Theodore Roosevelt negotiated a "Gentlemen's Agreement" that called for Japan to issue passports to Japanese coming to the continental United States only if they were coming to join a parent, husband, child, or to return to a former home or farm. (33:383) This agreement greatly diminished Japanese emigration to America. Between 1930 and 1940 the number returning to Japan exceeded new immigrants to the United States. This trend continued up to the Japanese attack on Pearl Harbor. Many Japanese parents sent their children to Japan to be educated, and by 1942 it was estimated that more than 25,000 Asian-Americans had been educated in Japan. (33:388)
Japanese Internment During World War II
Up to World War II, both Chinese and Japanese were subject to discrimination under American Law. During World War II, employment opportunities opened up to Chinese-Americans, while Japanese-Americans were stereotyped as potential enemies of the United States. (40:81) Military officials reasoned that most Japanese were loyal, but felt that the task of screening the loyal from the disloyal presented too great a problem. Shortly after the start of the war, President Roosevelt signed legislation ordering the evacuation of everybody of Japanese ancestry.
At first the Japanese were given time to leave the West Coast. A few did leave, but found no acceptance in other areas of the United States. Eventually they were told to stay where they were pending relocation under a newly created federal agency, the War Relocation Authority (WRA). Across the Western United States, all those of Japanese descent were transferred to "relocation camps." These camps, located in Utah, Arizona, California, Idaho, Wyoming, Colorado, and Arkansas, resembled military barracks and privacy was minimum. More than 110,000 men, women, grandmothers, grandfathers, children, and babies were kept behind barbed wire and guarded by armed soldiers. The Supreme Court of the United States upheld the constitutionality of the Japanese evacuation by a six to three vote, after the dissenting justices gave sharp minority opinions. (38:257)
The situation in Hawaii was different, however. At the outbreak of World War II, Japanese comprised about one-third of Hawaii's population. (33:395) Seen as a source of needed labor, limited restrictions were imposed on the Japanese. However, the lack of evacuation of the Japanese may have been due more to the courageous efforts and deliberate bureaucratic foot-dragging by General Delos Emmons, military governor of Hawaii. As the war continued, only a few Japanese whose record before the war rendered them suspicious were interned.
The effect of the evacuation is summed up best by Charles F. Marden, in his book Minorities in American Society:
The whole process of evacuation, the operation of the centers, and the effort of the WRA to relocate the evacuees cost time, money, and energy which could have been used for more constructive purposes. (33:396)
Japanese After World War II
Most Japanese-Americans put into camps incurred considerable losses by the forced sale or destruction of property during their absence. The Japanese-American community disinte-grated during the war, and after the war much of it was never revived. (40:84) Instead of succumbing to bitterness and apathy, most lived up to the Japanese proverb, "Six times down, seven times up." (40:84)
In 1948 President Truman signed an evacuation claims bill authorizing the Attorney General to settle Japanese-American claims of losses incurred as a result of evacuation.
Estimates placed the value of Japanese-American losses from $200 million to $350 million (34:250), but the Attorney General was authorized to pay individual claims only up to $2,500. Awards higher than $2,500 had to have the approval of Congress. The fiscal year 1951 budget contained $450,000 for evacuation claims, but awards amounted to only $55 thousand and paid only $26 thousand for the first half of the year. (34:251) Many years later, President Carter created a special commission of inquiry that acknowledged the government's mistake and recommended financial compensation to each internee. (38:258)
Following World War II, the Japanese were free to go where they wanted, but news that the Japanese were coming back to the West Coast evoked the same racism that had caused their evacuation. However, White groups and individuals demanded "fair play" for Asians. (33:399) Court decisions invalidating discriminatory laws and practices against the Japanese and Chinese were handed down from 1948-1950. Immediately after the war, the status of the Japanese showed a rapid rise from hostility during World War II to friendly acceptance. (33:399)
The "nisei," first generation American-born and the "sansei," the second and later generations, reacted with ambivalence towards the disintegration during the war of Japanese culture brought by the "issei," or foreign born. The younger Japanese considered their parents "too Japanesy." (33:389) Kin links and community organizations, indispensable in earlier periods, were thought of as destructive after broader opportunities became available. If genuine gains in American society were to be achieved, younger Japanese-Americans could not be expected to take over their father's store or to continue in his trade. Some authors argue that Japanese-Americans were liberated by the destruction of their community during World War II. (40:85)
FILIPINOS IN THE UNITED STATES
Filipinos were the third group of Asians to come to America. After changes in immigration laws and the decline of Japanese labor, Filipinos were brought to California and Hawaii in 1907 as a source of cheap labor. After the Spanish-American War of 1898, Filipinos were classified as nationals, free to enter Hawaii. From 1920 until 1935, Filipino immigration increased until the Tydings-McDuffie Act of 1934 granted independence to the Philippines. (16:12) The legislation, supported by California politicians who opposed cheap labor, limited Filipino immigration to a quota of fifty a year.
Filipino immigrants had many of the same characteristics as the Chinese and Japanese. They were young men with a minimal level of education who filled low paying manual jobs such as bellboys, waiters, cooks, busboys, janitors, and hospital attendants. By 1930, 110,000 Filipinos had gone to Hawaii, and another 45,000 lived in California. (42:58;38:260)
Filipinos in Hawaii had different experiences from their counterparts in the United States. On the Islands, Filipinos did not face racism from the White working class, and through a
carefully regulated rivalry, Filipinos and Japanese managed to avoid violence. But in the States, as the Depression of the 1930s worsened, increased objections were made to the presence of Filipinos, and several riots erupted in California.
Unlike Chinese and Japanese men, Filipino men dated and attempted to marry White women, and their Spanish culture gave them romantic qualities that were attractive to women. White men were not impressed and several states passed laws prohibiting marriages between Filipinos and Caucasians, and so because of a lack of Filipino females, many Filipino males remained single. The Chinatown pool room, gambling house, and taxi-dance hall became their recreational outlet. (38:262) Because they lacked family ties, Filipinos did not establish the same types of formal institutions founded by the Chinese and Japanese.
Some Filipinos circumvented immigration quotas by enlisting in the Armed Forces. In 1942, with the Philippines a World War II ally, legislation was passed that allowed Filipino residents to become naturalized American citizens. Some Filipinos bought land in California, often from Japanese who were about to be interned.
The Catholic Church and social, cultural, and union organizations have provided a unifying network for Filipinos. In 1980, there were more than 400 social and cultural organizations in California, representing many Philippine provinces. (31:32)
Since the Immigration Act of 1965, which eliminated immigration quotas, Filipino immigration has been quite high. The Filipino population in the United States more than doubled in size between 1970 and 1980. (38:263) In 1990 a total of 1,406,770 lived in the United States--almost half recent arrivals--with 92 percent in urban areas. Hawaii has a high concentration of Filipinos, and on the continent Filipinos tend to settle on either the West or East Coast.
ASIAN-INDIANS IN THE UNITED STATES
A year after the first group of Filipinos landed in Hawaii, workers from India began arriving on the West Coast. Originally from the districts of Ludhiana, Jullunder, and Hoshiarpur, most of the immigrants were Sikhs. Sikh men never shaved their beards or cut their hair. They wore traditional clothing, headdress, sword or dagger, and were often described as "picturesque."
The emigration of Asian-Indians was conditioned by British colonialism in India. (42:63) A famine from 1899 to 1902, and the changed laws of land ownership by the British government sent hundreds of thousands of Asian-Indians to the British West Indies, Uganda, Mauritius, British Guiana, Canada, and the United States. Between 1820 and 1900, fewer than 800 immigrants came to the United States from India. (38:294) Between 1900 and 1920, 7,000 immigrants arrived at the West Coast and Canada.
Most Asian-Indian immigrants coming to Hawaii were farmers from the fertile plains of the Punjab (land of five rivers). (42:63) After arriving in Hawaii, they were organized
into labor gangs--3 to 50 workers in a group. The gang leader (the one most fluent in English) received a commission from the gang and was also paid a wage by the employer. The gang leader found employment for workers, negotiated terms of labor, and acted as a general supervisor. (42:303) Gangs traveled from farm to farm, offered companionship and security that became a substitution for families.
Like all other Asians, Asian-Indians experienced discrimination and aggression. On September 5, 1907, several hundred Whites raided the living quarters of Hindu workers near Bellingham, Washington, forcing about 700 workers to flee across the Canadian border (38:295), and the San Francisco-based Asiatic Exclusion League labeled Asian-Indians as a "menace." In 1910 and 1913, the courts held that Asian-Indians were Caucasians and eligible for citizenship under the 1790 naturalization act, but in 1923 the U.S. Supreme Court reversed previous lower court decisions (U.S. v. Bhagat Singh Thind), ruling that a "White person" meant an immigrant from northern or western Europe. (42:299) Under the new ruling, Asian-Indians, now considered non-Whites, were prevented from owning or leasing land because many states held laws against alien land-holding.
About 3,000 Asian-Indians returned home between 1920 and 1940. (38:296) The 2,405 remaining Asian-Indians, most of whom lived apart from society, congregated in Stockton, California. Over the years, because of a small amount of intermarriage and retention of Indian culture and society, the Asian-Indian community became stronger and more unified.
There has been a dramatic increase in recent Asian-Indian immigration to the United States. While only 15,513 entered the United States from 1901 to 1965, between 1966 and 1970 24,587 Asian-Indians immigrated, 66,650 from 1971 to 1975, and 97,484 from 1976 to 1980. (38:296) Between 1981 and 1990 another 261,841 came to the United States. (25:411) The number of Asian-Indians in this country in 1990 (815,447) was just behind the number of Japanese (847,000). (25:569)
Conditions in India were an important factor in the increase in immigration. India is the world's second most populous country (after mainland China), with 15 percent of the world's population on 2.5 percent of the world's land. With two-thirds of the population engaged in agriculture, India does not have much to offer in terms of economic security. This explains why most of the recent Asian-Indian immigrants are professional workers such as physicians, dentists, and teachers--the very people India needs to retain.
KOREANS IN THE UNITED STATES
The first group of 101 Korean immigrants arrived in Hawaii on January 13, 1903, to work on Hawaiian sugar plantations. (31:13) Economic and political forces pushed out about 8,000 Koreans between 1902 and 1905, and a severe famine struck the northern provinces of Korea in 1902, driving even more peasants from farmlands.
Unlike the Chinese, Korean immigrants came to Hawaii to stay. They had a high rate of literacy (40 percent), and were mainly Christian before they emigrated to Hawaii. (31:14) Korean immigrants quickly adapted to Hawaii's sugar plantations; however, they left the sugar plantations faster than any other group. (31:15) Village councils, acting as law enforcement, were organized on every sugar plantation that had ten or more Korean families.
The first wave of Korean immigration to Hawaii was halted by Japanese officials who were under pressure from Japanese immigrants who complained that Koreans were being used as strike-breakers. Japanese workers would go on strike demanding better working conditions and higher wages, only to see the Hawaiian Sugar Planters' Association replace the striking workers with Koreans.
Most Korean immigrants in the first wave who came to the United States settled in California. During a second wave of immigration, from 1906 to 1945, only a small number of Koreans came to the United States. By 1907, 1,000 Koreans had remigrated to work in the copper mines of Utah, coal mines in Colorado and Wyoming, and on the railroads in Arizona. (42:270)
Koreans were quick to establish churches as soon as they arrived. Most immigrants in the second wave were picture-brides (who came to America to marry Korean immigrant males), students, and political refugees. Picture-brides came from rural backgrounds, students were born and raised in urban areas in Korea and chose to go to small universities and colleges in America, and others immigrated who lived in urban areas and felt more comfortable with American urban life.
After Korea became a protectorate of Japan in 1905, anti-Japanese sentiments were pervasive in the Korean-immigrant community. (31:17) Koreans in America organized around the movement for Korean independence. Over twenty independence organizations were created by Koreans in America, most notably the Korea Nation Association, to work toward restoration of Korean independence, promote business development in the Korean community, and protect freedom and equality among Koreans.
A third wave of Korean immigration lasted from 1946 to 1964. Major reasons for immigration included: American economic and political influence in Korea, the Korean War (1950-1953), a strong desire among Koreans to study in the United States, and a large number of Korean women who married American soldiers. More than 10,000 Korean students came to study at American colleges, but only a few returned to Korea. Korean women saw marriage to American soldiers as their "ticket out of poverty." (31:18) Thousands of Korean children, either orphaned during the war or born of Korean women and American soldiers, were brought to the United States.
The current wave of Korean immigration began with the 1965 Immigration Act, signed into law by President Johnson on October 3, 1965, and every year since 1973 more than 20,000 Korean immigrants have come to the United States. (31:20)
SOUTHEAST ASIANS IN THE UNITED STATES
Refugees from Southeast Asia came to the United States in three waves. The first wave were Vietnamese, part of a United States evacuation, who came after the collapse of the government of Vietnam in 1975. In 1975 alone about 130,000 refugees entered the United States from Vietnam, Kampuchea (formerly Cambodia), and Laos (31:39), and between 1975 and 1977 about 1,800 refugees entered per month.
A second wave of "boat people" came to the United States after spending time in refugee camps in Thailand, Malaysia, Singapore, and Hong Kong. Not a part of the evacuation, they were Vietnamese who left because of their government's economic and rural resettlement programs, and Laotians and Kampucheans who fled from famine, civil war, and political repression of ethnic groups that worked for the CIA during the Vietnam War. A third wave, beginning in 1978, saw refugees come to United States as a result of the expulsion of ethnic Chinese from Vietnam.
America has struggled with its refugee policy. The United States only admitted a small number of the millions of people fleeing war and famine in Laos and Kampuchea. Nearly one million refugees remained in camps in Southeast Asia in 1982. (31:40) Since World War II there has been no single policy toward refugees. Policy toward refugee immigration and resettlement has been formulated on an ad hoc basis. (31:40) Refugees admitted before 1980 were "parolees," and in the month before the fall of Saigon, the United States government raised, lowered, and raised again the number of Vietnamese who would be allowed in the country. (31:40) It was not until the 1980 Refugee Act that refugees were given resident alien status, which meant they were eligible for citizenship.
Resettlement of Southeast Asians was accomplished through private voluntary agencies such as the United States Catholic Conference, the International Rescue Committee, the Lutheran Immigration and Refugee Service, and the Tolstoi Foundation. (31:42) The State Department contracted with each of the voluntary agencies to find sponsors who would be responsible for each individual refugee, and the federal government gave the voluntary agency a "resettlement grant" of $500 per refugee.
The federal government urged the agencies to disperse the refugees throughout the United States to prevent the development of large Southeast Asian communities that might create hostility and undue strain on local resources. However, within six months after resettlement of the first wave, refugees tended to relocate, often moving to urban areas in southern and western states. (31:42) By 1978 one-third of all refugees resided in California, and by 1983, 90 percent of refugees were located in ten states. A greater settlement of refugees in Southeast Asian communities was seen in the second and third wave because volunteer agencies were less willing to act as sponsors. In 1983 over 50 percent of refugees were sponsored by relatives and families. (31:43)
PACIFIC ISLANDERS
The Pacific Islands can be divided into three groups on the basis of physical and cultural identities. The first group, the Melanesian Islands, are in the Southwest Pacific, northeast of Australia, and include New Guinea, Fiji, and the Solomon Islands. First colonized by European countries, they are now independent nations or part of Indonesia.
The second group, the islands of Micronesia, are located in the middle western region of the Pacific Ocean, and are small land areas scattered over 3 million square miles. The largest island, Guam, was acquired by the United States from Spain in 1898. Guam's residents became citizens in 1952. Most of the other Micronesian islands were Trust Territories formed by the United Nations after World War II. Under the Nations Trust Territory of the Pacific Islands, the trustee of the territory was the United States. Recently, all of the Trust Territories have become either a commonwealth of the United States or independent island nations. They are now the U.S. Commonwealth of the Northern Marianas, the Republic of the Marshall Islands, the Federated States of Micronesia, and Palau. (9:7)
The third group, the larger Polynesian islands, in the central and eastern Pacific, have been colonized by Great Britain (New Zealand, Tonga), France (Marquesa, Tahiti), and the United States (Hawaii, Somoa). (31:33,34) Data from the 1990 census show 211,014 Hawaiians, 62,964 Samoans, 49,345 Guamanians, 17,606 Tongans, and 7,036 Fijians. (7:269)
Pacific Islander Immigration
Before 1941 immigration to the United States from the Pacific Islands was minimal. As with other immigration, that of the Pacific Islander was caused by political events, poor economic conditions, and an exploding rate of birth after World War II.
The largest migration has come from American Samoa. The United States and Germany divided Samoa into American Samoa and Western Samoa at the end of the nineteenth century, and persons born in American Samoa are United States nationals. The United States has controlled American Samoa continuously and New Zealand controlled Western Samoa from World War I until independence in 1962. From 1900 to 1951, the Navy administered American Samoa. The naval presence ended when the base moved to Hawaii in 1951, and Samoans connected with the naval base were allowed to migrate to Hawaii. Nearly 1,000 Samoans, five percent of the 20,000 residents, moved to Hawaii. (31:35)
Since then, immigration to Hawaii and to the West Coast of the United States has increased. Like other Asians, Samoan culture stresses the extended family and kinship system. (38:271) Original Samoan immigrants, who moved to the United States through military enlistment or assignment, became the first link in a chain that eventually saw entire family units migrate. When one family unit becomes too large, adult members move out and form other kin-connected residences. (38:36) Today, more Samoans live in the United States (62,964) (most in southern California), than was the entire American Samoa population in 1980. (31:35)
Migration from Guam is similar to that from American Samoa. Guamanians traveled to the United States for relatively high paying jobs in the armed forces. Little is known about the migration of other Pacific Islanders because the 1980 Census was the first actual count of Asian-Pacific-Americans by specific categories. (7:269)
NATIVE HAWAIIANS
While Hawaii may have been visited by a Spanish mariner, its existence was not generally known until the arrival of Captain Cook in 1778. (18:7) Captain Cook, flying the British flag, was on a 10-year expedition in the Pacific. While trying to reach the North American coast, by accident he discovered Kauai, the large island farthest to the northwest. After Cook's arrival, fur traders, sandalwood traders, and whalers of the North Pacific put in at "the Islands." (44:1) The majority of the world's whaling fleet operated in the Pacific, and the majority of the ships were from New England. The cultivation of sugar replaced whaling as the largest industry in Hawaii during the 1860s.
Until the middle 1800s, except for missionaries, few Americans came to Hawaii. However, when the Hawaiian sugar plantations began to grow and flourish, so did American influence and power. When they needed more labor, the Americans brought Chinese, Japanese, and Filipinos to work on the sugar plantations. Disease and conquest brought by the foreigners reduced the native Hawaiian population. Although disputed, some estimates of the native Hawaiian population were as high as 300,000 in the 1770s to less than 135,000 fifty years later, to about 70,000 at the time of the first formal census in 1853. (8:9)
Facing American expansion in the Pacific during the nineteenth century, Hawaiians found their islands gradually transformed, their sovereignty eroded, and their culture and social fabric undermined. (8:8) They believed their islands would soon be annexed after the passage of the Monroe Doctrine in the 1840s.
In the latter half of the 1800s, White people established a firm control over Hawaiian society. In 1893, when negative reactions by native Hawaiians arose concerning annexation to the United States, a small but powerful minority of Whites overthrew the government of Queen Liliuokalani, leading to a provisional government favorable to annexation. While historians argue who made the decision to land troops, the government was overthrown with the aid of 154 "bluejackets" from the USS Boston, who landed ashore and marched 250 yards past the Queen's palace. (44:178) It was indeed ironic that the White settlers, viewed with "awe and friendliness" by the natives, would later overthrow the government.
Five years later, against the backdrop of a war with Spain, the United States annexed Hawaii. The annexation of Hawaii was consistent with a "large policy," of a two-ocean fleet, with appropriate bases for it. (44:311) Before the war, a strategic argument for annexation of Hawaii had received little attention. If not for the Spanish-American War, Hawaii might not have been annexed for years. (44:311)
Sugar remained Hawaii's economic backbone through the 1930s. About one-third of the population lived on plantations and were dependent on the sugar crop for employment. Under United States tariff laws, after 1900 the sugar industry was afforded equal treatment with mainland sugar. However, in the 1930s, the Jones-Costigan Sugar Act seriously reduced Hawaii's sugar quotas. The Sugar Act outraged the community, and without Congressional representation, they felt they could not expect equality. In the view of native Hawaiians, the need for statehood was not just for political, but also economic, reasons. (8:61)
Statehood for Hawaii
There were arguments for and against statehood. One argument was limited to Hawaii's strategic importance. The New York Times reported in 1940 that the United States was the only Western power whose position in the Pacific was compromised. (8:75) The other argument resisted statehood since one-third of Hawaii's population was Japanese, and there were doubts about the loyalty of Japanese residents in Hawaii. It was felt that only some kind of crisis could indicate which view was the correct one. (8:75) The crisis occurred at Pearl Harbor on December 7, 1941.
After World War II, new energies and pressures faced statehood. Hawaii had previously been isolated from United States continental issues of the communist threat and civil rights for ethnic minorities. Hawaii's admission threatened to disrupt the conservative coalition of Republicans and Southern Democrats. In March 1947 the House Public Lands Committee recommended for the first time that the House of Representative approve statehood. For another twelve years, Hawaiian statehood would be an issue in every Congress. In 1959, Alaska's Senator Bartlett said "Everything that can be said...on the subject of Hawaii statehood, for or against, has been said." (8:271) In that same year, the Senate, 46 Democrats and 30 Republicans, voted for Hawaiian statehood. Fourteen Democrats and only 1 Republican voted against it. President Eisenhower signed the Hawaii statehood bill on March 18, 1959.
After generations of Americanization, it is difficult to assess the actual reward statehood brought to Hawaii. On the United States mainland no one had seriously contemplated giving Hawaii self-government as an independent nation. Hawaii is too integrated into America's economic, political, and ideological structure. However, on November 23, 1993, President Clinton signed the "Apology Resolution" acknowledging the historical significance of the 100th anniversary of the illegal overthrow of the Kingdom of Hawaii on January 17, 1893. The resolution also apologizes to native Hawaiians on behalf of the people of the United States and urges the President to support reconciliation efforts between the United States and the native Hawaiians. Opposition arose to the resolution when some Senators believed the resolution would give a legal basis for special treatment or for the return of land. (1:1)
IMMIGRATION TODAY
Modern transportation and communi-cations technology means immigrants from Asia and the Pacific Islands can get here easier and more quickly than ever before. It also means they can more easily maintain their connections to cultural and familial ties in their ancestral homelands. In many cases the availability of external support may make their assimilation struggles less painful. It remains to be seen how developing immigration policies will affect Asian-Pacific-American population growth and U.S.-Asia relations.
CONTRIBUTIONS OF ASIAN-PACIFIC-AMERICANS TO THE DEPARTMENT OF DEFENSE (PAST AND FUTURE) A review of past contributions provides clear evidence of Asian-Pacific-Americans' abilities and willingness to serve DoD honorably. Prior to World War II, there is little known, or at least documented, about the contributions of Asian-Pacific-Americans to DoD. A notable exception, however, was the Army's Philippine Scouts, formed after the Spanish-American War. Members of the Philippine Division fought in World War I and World War II, but the Philippine Scouts were decommissioned in 1947. (19:253)
WORLD WAR II
World War II would be a turning point for Whites and their relations with Asian-Pacific-Americans. Whites could not oppose the racist ideology of Nazism while at the same time practice racial discrimination. Formerly treated as strangers, Asian-Pacific-Americans would now be asked to support their country and serve in the armed forces. The war required immigrants and their children to determine, more than ever, their identities as Asians and as Americans. (42:357)
Chinese
The day after Pearl Harbor, the United States and the Republic of China declared war on Japan. During the war many Whites lumped all Asians together. Fearful of being targets of anti-Japanese violence, Chinese shopkeepers displayed signs "This is a Chinese shop." (42:371)
The Chinese-Americans were faithful in their support of the defense of their homeland against Japanese imperialism. Chinese-Americans could serve in the military if they had no dependents in the United States. Most were male, of draft age, and eager to fight. Chinese-American boys, too young for the armed forces, enlisted by giving their "Chinese age," usually a year or two older. (42:373) World War II was important to Chinese-Americans because it was the first opportunity to get out of Chinatown, make a contribution to American society, and receive the same treatment as European immigrants. The war also opened employment for Chinese-American women.
Pressure mounted for the repeal of Chinese exclusion legislation. Madame Chiang Kai-shek, while touring the United States, told congressmen that the repeal of Chinese exclusion laws would boost Chinese morale. Feeling the pressure, President Roosevelt
sent a message to Congress favoring the repeal of Chinese exclusion laws. Defeat of the legislation would mean ridicule of America by Japan,--the Japanese had already appealed to Asians to unite in a race war against White America. Congress did repeal the exclusion acts and provided an annual quota for Chinese immigration.
Japanese
At the beginning of the war Japanese-Americans were classified as 4-C enemy aliens, not eligible for military service. So some joined the Hawaii Territorial Guard, assigned to guard vital civilian installations. However, Japanese-American members of the Guard were discharged six weeks later without any explanation. Disappointed, Japanese-Americans turned to the military governor and offered themselves "for whatever service you may see fit to use us." (29:150) On February 25, 1942, the military governor authorized the formation of the Varsity Victory Volunteers (VVV), a group of 169 University of Hawaii students. They worked building roads and fences, stringing barbed wire, and maintaining military buildings. They lasted only a year; however, the hard work and dedication of the VVV had a significant positive impact on military officials.
At the time of Pearl Harbor, there were 1,432 Nisei volunteers in the Army. About 200 were members of the 1399th Engineering Construction Battalion, the rest in the 298th and 299th Infantry Regiments, who guarded the shorelines during the early days of the war. Six months after the attack on Pearl Harbor, the Army transferred all Nisei soldiers, except those from the 1399th, to Camp McCoy in Wisconsin. Because some military officials thought the Japanese-Americans would be difficult to distinguish from the men of the Japanese army, it was felt they should be used in combat only in the European Theater of Operations. They would be the first combat unit composed of only Japanese-Americans, the 100th Battalion.
The 100th Infantry Battalion and 442nd Regimental Combat Team
The 100th Infantry Battalion nicknamed themselves "one puka puka" (puka means "hole" in Hawaiian), and landed at Salerno Beach in southern Italy on September 22, 1943. Their success came at a very high price and they were named the "Purple Heart Battalion." Casualties were so high that 202 men and officers were sent from the 442nd Combat Team, and at Civitavecchia, Italy, the 100th Battalion became a part of the 442nd Regimental Combat Team. (29:152)
In 1943, the War Department had a change of attitude regarding military service by Japanese-Americans, and called for 1,500 volunteers. Within a month 9,507 Niseis volunteered, and 2,645 formed the nucleus of the 442nd. Among the volunteers were many members of the Varsity Victory Volunteers. The 442nd trained as a unit for one year before being shipped to Italy where whey caught up with the 100th at Civitavecchia. After service in Italy, they reached France, taking on the Germans in the Rhineland Campaign. According to the French, the 442nd did not just push the Germans out, they "wiped 'em slick." (23:25) Every few years, a reunion is alternately conducted in Hawaii or France commemorating the liberation of the Sain Die region by the 442nd.
One of the 442nd's best known exploits was the rescue of 275 men of the 141st Regiment of the 36th (Texas) Division. The "Lost Battalion" had been cut off in France and previous rescue attempts were unsuccessful. The 442nd, supported by artillery of the 36th Division, rescued the "Lost Battalion" in less than a week at a cost of 800 casualties. The "Lost Battalion" gave the 442nd a plaque which read:
With Deep Sincerity and Utmost Appreciation For the Gallant Fight to Effect Our Rescue After We Had Been isolated For Seven Days. (29:160,162)
In less than two years the 442nd distinguished themselves in seven major campaigns, receiving over 18,000 individual decorations (Table 6). Members of the 442nd were probably the most decorated unit in United States military history, while many of their parents and relatives were in detention camps. (42:402)
Although Japanese-American soldiers had been in the Pacific since Guadalcanal in early August 1942, there was little publicity about them. (29:164) Military authorities thought it was important to keep Japanese-American participation in the Pacific secret to be effective. Japanese-Americans contributed to the Battle of Midway by intercepting messages, and towards victory in the Battle of the Philippines by translating captured battle plans and sending them to Admiral Halsey, Admiral Nimitz, and General MacArthur. After the occupation of Japan, Japanese-Americans assisted with communication and administration of the occupation at all levels of government.
Filipino Contributions
Seven hours after the bombing of Pearl Harbor, Japanese forces invaded the Philippines. At the Battan Peninsula on the Philippines, thousands of Filipinos fought beside American soldiers. After the fall of the Philippines, Filipinos in America worried about loved ones still on the island. Filipinos wanted to get back to the Philippines to fight for the liberation of their homeland. After President Franklin Roosevelt changed the draft law in 1942, 40 percent of the California Filipino population registered for the draft. (42:359)
In 1942, the First Filipino Infantry Regiment and the Second Filipino Infantry Regiment were formed. As members of the armed forces, Filipinos were allowed to become citizens, and on February 20, 1943, 1,200 Filipino soldiers stood proudly in "V" formation at the parade ground of Camp Beale as citizenship was conferred on them.
Korean Contributions
Korean-Americans welcomed World War II, hoping it would lead to the destruction of Japan and restoration of Korean independence (Korea had become a protectorate of Japan in 1905). (42:364) At first, government policy failed to distinguish Koreans from the Japanese. In Hawaii, Koreans were classified as enemy aliens and had to wear badges with black borders. After protests, Korean-Americans were allowed to have printed on their badges "I am Korean." (42:366)
Koreans had an invaluable weapon in the war, they knew the Japanese language, and they were often employed as translators of Japanese secret documents. In Los Angeles, 109 Koreans formed the Tiger Brigade of the California National Guard. On August 29, 1943, Korean National Flag Day, the Los Angeles mayor raised the Korean flag to honor the men of the Tiger Brigade as they marched past City Hall. Korean women served in the Red Cross, and elderly Korean men volunteered as fire wardens.
Asian-Indians
The United States needed India's cooperation in the war against Japan. Japan could push westward, trying to join forces with Germany in the Near East. In an effort to build goodwill with India, in March 1944 Congress considered a bill that would provide a quota for immigrants from India and naturalization rights for Asian-Indians. It would not be until two years later that Congress permitted India to have a small immigration quota and granted Asian-Indians naturalization rights.
KOREAN WAR
The division of Korea between North and South at the 38th parallel was chosen as a convenient demarcation at which Russian and American forces could accept the surrender of the Japanese in 1945. (36:39) The 38th parallel was hardened by the inability of North Korea and South Korea to agree on the structure of a unified Korea. North of the 38th parallel lived about ten million people, about one-third of the Korean people. The ambition of the North Korean Workers Party, molded by the Communist Party of the Soviet Union, was to reunify Korea under Communist rule. South Korea, slightly smaller in land size than the North, was the home to over 25 million people. Under American occupation from 1945 to 1948, a variety of political parties were formed in South Korea, each representing faction support among the Korean elite. (36:42)
In 1949, the United States military forces withdrew from South Korea as part of a policy of military pull-back from Asia. Taking advantage of the American pull-back, assured of Stalin's continued support from the Soviet Union, North Korean forces moved across the 38th parallel on June 25, 1950.
Immediately after the invasion, America pledged its support to Korea, and quickly built forces there to 600,000 men. Peace had taken its toll on American soldiers, who were ill-prepared to meet the challenge. In 1950, skeletonized American units were hurriedly filled with South Koreans, termed KATUSAs (Korean Augmentation United States Army). (19:253) The achievements of Asian-Pacific-Americans during the Korean Conflict confirmed their loyalty and patriotism. (8:88) Asian-Pacific-American troops were not segregated into separate units in the Korean War; however, like other minority groups, Asian-Pacific-Americans suffered dispropor-tionately heavy casualties. (8:88) Despite extensive support from the Communist Chinese and the Soviet Union, the North Koreans were driven back. An armistice was signed in July 1953, and in October 1953 the United States signed a mutual defense treaty with South Korea. A military problem that remains today is that no peace treaty has ever been signed to end the Korean War.
The two sides talk to each other regularly around a table in a shed at the 38th parallel in the city of Panmunjom.
VIETNAM
During the Vietnam War era recruits represented a variety of class, race, and gender groups. Throughout the Korean War, and for several years after, about 70 percent of draft-age American men served in the military. However, those who fought and died in Vietnam were overwhelmingly drawn from the bottom half of the American social structure. For Asian-Pacific-Americans, even the most basic statistical information about their role in Vietnam remains unknown. (3:12) The 1990 Census reflects 88,118 Asian-Pacific-American Vietnam veterans or just over one percent of all Americans who served. Since DoD did not track Asian-Pacific-Americans during those years, there is no good count of the actual participation. However, one dimension of the Vietnam experience was unique to Asian-Pacific-Americans. They endured friction, and often abuse, not only from the American public, but also from within the ranks of the military itself due to their physical and cultural background similarities in the eyes of non-Asian-Americans. As a result, many of these veterans came home with not only war-induced stress, but also with race-related post traumatic stress disorder. (52:17) That Asian-Pacific-American veterans of Vietnam contributed so much as part of the DoD and still remained loyal to their country is a testament to their fortitude and character.
ASIAN-PACIFIC-AMERICAN SERVICE TODAY IN THE MILITARY As of September 1995, there were 44,272 Asian-Pacific- Americans on active duty. They comprised 2.3 percent of all officers, 1.9 percent of warrant officers, and 3 percent of the enlisted community. (15:1) As a percentage, the Asian-Pacific-American population within DoD (Table 7), is identical to the Asian-Pacific-American population of the United States, 2.9 percent according to the 1990 Census. The Navy has the largest percentage at 5 percent; followed by Army, 2.2 percent; Air Force, 2 percent; and Marine Corps, 1.7 percent. (15:2-5)
Within the enlisted community, Asian-Pacific-Americans have the largest percentage of representation at the senior level (E-8 and E-9). However, in officer distribution, Asian-Pacific-Americans have the greatest percentage of representation at the junior level (O-1 and O-2). As of March 1996 there were two Asian-Pacific-American active duty members at the rank of Brigadier General or higher, both Army.
The overall U.S. population trend towards more Asian-Pacific-American women than men is reflected in the percentages of Asian-Pacific-American women in DoD as well. From approximately 1.2 percent in 1982 the percentage steadily grew to approximately 3.4 percent in 1995. (14:18) Not surprisingly, the percentage of DoD civilian Asian-Pacific-American women is much higher at 4.9 percent. Asian-Pacific-Americans number 42,365, or 5.2 percent of total DoD civilians. Of these, 16 are currently holding Senior Executive Service (SES) positions. Asian-Pacific-American Reservists account for 2.2 percent of total Armed Forces Reserves. (15:19) An important, yet often overlooked,
segment of our total DoD family, is the dependent component. Asian-Pacific-Ameri-can presence and influence within DoD is certainly much larger when considering the population of dependents of U.S. military and civilian personnel.
ASIAN-PACIFIC-AMERICAN MEDAL OF HONOR WINNERS The following Asian-Pacific-Americans have received the Medal of Honor:
- 1911, PVT Jose B. Nisperos, Philippine Scouts.
- 1915, Fireman 1st Class Telesforo Tinidad, United States Navy.
- 1942, SGT Jose Calugas, Philippine Scouts.
- 1945, PFC Sadao S. Munemori, 100th Infantry Bn, 442nd Regimental Combat Team, United States Army.
- 1951, CPL Hiroshi H. Miyamura, United States Army.
- 1951, PFC Herbert K. Pililaau, United States Army.
- 1951, SGT Leroy A. Mendonca, United States Army.
- 1961, SFC Rodney J. T. Yano, United States Army.
- 1969, CPL Terry Teruo Kawamura, United States Army. (24:15)
ASIAN-PACIFIC-AMERICAN IMPACT ON BUSINESS AND EDUCATION With greater access to the job market since World War II Asian-Pacific-Americans have seen growth and upward mobility. Median household income for Asian-Pacific-American families in 1994 was $44,460 versus $41,110 for non-Hispanic White households. (51:10) However, because Asian-Pacific-Americans have bigger families, per capita income was $13,420 in 1990, compared with $15,270 for Whites. (21:1)
Average family size in 1994 was 3.6 versus 3.1 for non-Hispanic Whites. (46:15) In 1992, 35 percent of Asian-Pacific-Americans had household incomes of $50,000 or more, compared with 26 percent for Whites. (25:471) By 1994, 9 of 10 Asian-Pacific-American men and 8 of 10 women over age 25 had at least a high school diploma. Forty percent of Asian-Pacific-Americans had at least a bachelor's degree compared to 22 percent of all U.S. citizens over age 25. (46:14) Clearly, the combination of a growing Asian-Pacific-American labor pool, better education, and rising economic status will have significant impacts on American business and education for many years to come.
BUSINESS
Unfortunately, despite federal laws, Asian-Pacific-Americans still experience legal, social, and economic discrimination. Chinese find federal employment extremely difficult. (10:209) One reason is that China is a Communist country, and this presents barriers in matters of security for mid-level and top-level managers.
Like other minorities, Asian-Pacific-Americans often experience the "glass ceiling" phenomenon during their struggle to climb the ladder to success. While true at all levels, this problem is especially visible in managerial ranks and senior level professional positions. As a result, many have left companies to start their own businesses. This can be a continual source of costly employee turnover for companies.
Frustration with hierarchical limitations of the corporate world has also caused many Asian-Pacific-Americans to pursue additional higher education with the hope it will make them more competitive. (5:16) Economically, Asian-Americans are still in the ethnic niche composed of restaurants, laundries, grocery stores, and other Chinese-type businesses. (10:209)
In 1987 Asian-Pacific-Americans owned 355,000 businesses, a 328 percent increase in just ten years. (25:44) By starting their own businesses, Asian-Pacific-Americans are repeating their forefathers' immigrant success story. However, while earlier immigrants have gone on to bigger ventures, Korean entrepreneurs remain small in grocery and retail stores. When ready to expand, Koreans integrate their businesses by obtaining wholesale and distribution firms that supply their businesses. (39:2B) Especially in many urban areas, the positive impact of small Korean businesses has been profound. In New York for example, whole neighborhoods have been rescued from decay and schools and churches have been reinvigorated.
Innovative entrepreneurs have collectively created new retail industries. In 1995, approximately 85 percent of all produce stores in New York were Korean-owned, as well as 3,500 grocery stores, 2,000 dry cleaners, 800 seafood stores, and 1,300 nail salons. (26:45) Clearly, Korean business impact is huge in such areas.
Similarly, Asian-Indians are dominant in convenience and stationery stores and create competitive advantages by pooling resources and exercising buying leverage. In 1994, Asian-Indians owned and ran nearly 45 percent of America's budget motels/hotels. (35:35)
Chinese-Americans have also made a visible impact in business and industry. I. M. Pei is probably the world's most famous architect. He is the designer and architect of the Kennedy Memorial Library, and the new wing of the National Art Gallery in Washington. In 1957, China-born physicists, Yang Chen-ming and Lee Tsung Date, were the first Chinese to win the Nobel Prize. Dr. M. C. Chang, discovered the birth control pill. An Wang was the creator of the memory chip and has a multi-million dollar electronics business (43:89) and Rocky Aoki founded the Benihana restaurant chain.
Filipinos have been active in labor. Carl Damsco served as president of the Hawaii branch of the International Longshoremen's and Warehousemen's Union. Important leaders of the farm workers movement were Larry D. Itilong, Philip Vera Cruz, Pete Velasco, and Andrew Imutan. (31:32)
Worth mentioning is the expected future composition of American labor. Asian-Pacific-Americans are quickly becoming a critical part of the workforce. For example, Southeast Asia refugees have entered the work force at rates comparable to, if not higher than, the American population. In 1975, the employment rate of Vietnamese refugees was 68.2 percent among men and 50.9 percent among women. Within three years, 94.9 percent of all first-wave Vietnamese refugees over the age of sixteen were employed, as compared to 94.5 percent of all Americans. (31:44)
Expert projections show that the 3.2 million Asian-Pacific-American U.S. workers in 1990 will more than triple to 10.2 million by 2020. Moreover, it is doubtful that the rest of the workforce will increase so dramatically. (37:29) Obviously then, Asian-Pacific-Americans will continue to have a significantly expanding impact on the labor market and business in general.
EDUCATION Although Asian-Pacific-Americans make up a small fraction of America's students, they have achieved a disproportionate share of academic success. Some of the keys to this success have been attributed to high standards of parents and peers, strong belief in the effects of effort, positive attitudes about achievement, diligent study habits, and less schoolwork interference from jobs and peer social distraction. (11:1215)
Opportunity for learning in the world's leading universities has long been a primary factor behind Asian-Pacific-American immigration. For example, children of Korean immigrants often describe their parents' obsession with the Ivy League. Leaders at these schools estimate that nearly five percent of their student bodies are Korean-Americans, while this group constitutes less than one percent of the total U.S. population. (26:50)
Asian-Pacific-Americans have been called "the reigning stars of academia." (27:B1) The 1990 census reflected that two of five Americans with roots in Asia and the Pacific have completed 4 years of college or more, twice the rate for all Whites. (41:90) While they comprise 2.9 percent of the population, Asian-Pacific-American representation at prestigious colleges and universities is much greater. In 1990 at Harvard, Asian-Pacific-Americans represented about 12 percent of students; at Stanford, 20 percent; and at the University of California at Berkeley, 30 percent. (27:B1)
The increase in Asian-Pacific-American population since then has raised those percentages even higher. Asian-Pacific-American students now account for between 25-50 percent of students at America's well known colleges and universities. As of 1995 Asian-Pacific-American enrollment at the University of California, Los Angeles, is 40 percent of the total, as is the enrollment at UC Berkeley. (48:14;41:90) In 1990, 1,282
Asian-Pacific-Americans received doctorates, and another 3,336 received their first professional degree (physician, lawyer, etc.). (25:169)
Regardless at what point in the education process, Asian-Pacific-Americans have made the most of their opportunity to learn. Thirty-six percent of Asian-Pacific-Americans are in the top one-third of their fourth grade class, 43 percent in the top one-third of their eighth grade class, and 46 percent in the top one-third of their twelfth grade class. (25:149)
ASIAN-PACIFIC-AMERICANS IN THE POLITICAL PROCESS Among the many factors which will help give Asian-Pacific-Americans increasing access to the political arena is their changing image. Asians have long been characterized as distrustful scapegoats in myths created by American films, television, and cartoons. As Asian-Pacific-American visibility in the arts, media, sports, business, education, etc., continues to become a normal and positive part of the mainstream, such stereotypes will yield.
Another factor will be the growing familiarity of Asian-Pacific-Americans with political processes. Their lifelong experiences in the U.S., combined with expanding opportunities, will yield bumper crops of Americans with both the skills and the vested interests to become political leaders at all levels.
In 1992 there were over 5200 private and public organizations concerned with Asian-Pacific-Americans according to the Asian Americans Information Directory. This growing base of advocate groups can be expected to increasingly influence public policy and perceptions via lobbying efforts and by helping to increase public awareness of Asian-Pacific-Americans. A recent example is the Congressional Asian-Pacific-American Caucus Institute (CAPACI) formed in 1995. CAPACI goals include "being a national umbrella for grassroots Asian-Pacific-American organiza-tions throughout the country." (28:3) At its inaugural fundraiser dinner in late May 1995, President Clinton's presence as guest speaker helped Asian-Pacific-Americans take a "huge step toward mainstream political empowerment" and brought their political visibility to a much higher level. (28:3)
Until recently, Asian-Pacific-Americans have not been a powerful electoral force. However, in the 1990s, Asian-Pacific-Americans have become viable political candidates at all political levels. In 1993, 731 Asian-Pacific-Americans held elected or appointed positions in state, county, and local government. (25:724-725)
Asian-Pacific-American elected political influence is greatest in Hawaii, where Asians are a majority of the population. Soon after Hawaii gained statehood in 1959, Hiram Fong and Daniel Inouye became the first Asian-Pacific-Americans to be elected to the Congress. (20:70) In 1990, Hawaii's governor, lieutenant governor, and 54 state senators and representatives were Asian-Pacific-Americans.
In the 1980s, Asian-Pacific-Americans rarely won federal or state elections on the continental United States. (20:70) No Asian-Pacific-Americans were elected to the House of Representatives or Senate in the 1980s. (25:723) Table 8 lists all Asian-Pacific-Americans elected to the United States Congress from 1956 to 1996. While a detailed profile of incumbents is not possible here, suffice it to say that in the 1990s, Asian-Pacific-Americans are more often being elected to federal, state, and local offices.
Prior to 1976, there were few Asian-Pacific-American political appointments. From 1976 to 1980, more Asian-Americans were appointed to presidential commissions, advisory councils, and federal judgeships than in all other previous administrations combined. In 1988, President Reagan appointed the first Asian-Pacific-American, Sherwin Chan, to the United States Commission on Civil Rights. In 1989, President Bush appointed Elaine Chao as Deputy Secretary of Transportation, the highest office ever reached by an Asian-Pacific-American in the executive branch. President Bush appointed 124 Asian-Pacific-Americans to federal positions. (25:723) In the Clinton administration, unprecedented Asian-Pacific-American involvement in key positions has occurred. Three percent each of appointees requiring Senate confirmation, of non-career Senior Executive Service, and of presidential appointment positions are held by Asian-Pacific-Americans. (4:10) This percentage is consistent with the percentage that Asian-Pacific-Americans represent in the total U.S. population.
At the state and local levels, Asian-Pacific-American appointed officials are concentrated in California and Hawaii. In areas such as San Francisco where Asian-Pacific-American population represents a large constituency, political representation through appointments to local posts is roughly equivalent to population ratios. During his acceptance speech in February 1996, newly appointed San Francisco supervisor, Michael Yaki, pointed out the personal challenge he felt to use his background, experiences, and race to influence government policy. He sees government as an asset, versus a hindrance, to society's social and economic advancement. (50:7) His obser-vations seem to sum up the significance of Asian-Pacific-American involvement in politics at both the personal as well as national, state, and local levels.
CONCLUSION The purpose of this report is to show why Asian-Pacific-Americans have been, are, and will continue to be important to DoD and to provide information for DoD Asian-Pacific-Americans to share in proudly celebrating their rich and unique combination of heritages. The positive impacts of this diverse collection of capable Americans will undoubtedly continue to be recognized in all areas of American life.
Although this paper was limited to thoughts on DoD, business, education, and politics, other realms are being impacted just as much. Entertainment, sports, and the arts are examples worthy of mention as well.
In short, a study of Asian-Pacific-Americans must not be restricted only in terms of statistics and what history shows has been done to them. They must be viewed as men
and women with minds, wills, and voices. (42:7) To better understand the variety of backgrounds, traditions, and paradigms of these vital members of our society is to better understand what makes America itself great as a nation of immigrants.
BIBLIOGRAPHY 1. "After 100 years, U.S. Apologizes to Hawaiians." (January 1994). Ka Wai Ola O Oha, p. 1.
2. Anderson, P. "Growing into the 21st Century." Asian Week, (January 19, 1996) pp. 16-17.
3. Appy, C. G. (1993). Working-Class War. Chapel Hill, NC: The University of North Carolina Press.
4. "Asian Americans in Key Government Jobs, a US Record: Haley Leads 17 Fil-Ams in Clinton Administration." Filipino Reporter (October 27, 1994), p. 10.
5. "The Asian American Dream." A. Magazine, (October 31, 1993) p.16.
6. "Asian Immigrants." Education Digest, (February 1995), pp. 72-73.
7. Barringer, H. G., R. W. Gardner., & M. J. Levin. (1993). Asians and Pacific Islanders in the United States. New York: Russell Sage Foundation.
8. Bell, R. (1984). Last Among Equals. Honolulu: The University of Hawaii Press.
9. Blomquist, E. (1993, December). "Chair of South Pacific Commission Speaks to Hawaiian Self-Determination." Ka Wai Ola O Oha, p. 7.
10. Buenker, J. D. & L. A. Ratner. (1992). Multiculturalism in the United States. New York: Greenwood Press.
11. Cheng, C. & H. Stevenson. "Motivation and Mathematics Achievement: A Comparative Study." Child Development (August 1995), pp. 1215-1234.
12. Clinton, B. "Proclamation 6795 - Asian/Pacific American Heritage Month, 1995." Administration of William J. Clinton, 1995. Washington, DC (1995) pp. 761-762.
13. Cox, T. Jr. Cultural Diversity In Organizations. San Francisco: Berrett-Koehler Publishers Inc, 1994.
14. Defense Equal Opportunity Management Institute. Representation of Minorities and Women in the Armed Forces 1975-1995. Patrick AFB, Florida, 1996.
15. -----. Semi-Annual Race/Ethnic/Gender Profile of DoD Forces and Civilians. Patrick AFB, Florida, 1995.
16. DeWitt, H. A. (1976). Anti-Filipino Movements in California: A History Bibliography and Study Guide. San Francisco: R and E Research Associates.
17. Dinnerstein, L. & F. C. Jaher. (1970). The Aliens. New Jersey: Prentice-Hall, Inc.
18. Du Puy, W. A. (1932). Hawaii and Its Race Problem. Washington: United States Printing Office.
19. Elting, J. (1982). American Army Life. New York: Charles Scribner's Sons.
20. Espiritu, Y. L. (1992). Asian American Panethnicity. Philadelphia: Temple University Press.
21. "Family Ties Are a Boom for Asian-Americans." (September 28, 1992) The Wall Street Journal.
22. Fellows, D. K. (1972). A Mosaic of America's Ethnic Minorities. New York: John Wiley & Sons, Inc.
23. Foggo, III, J. G. "Stranger in a Strange Land Recalls the 'Purple Heart Battalion.'" Reflections (1993) p.25.
24. ----- (1993). A Review of Data on the Asian-American Population. PAFB FL: Defense Equal Opportunity Management Institute. p. 15.
25. Gall, S. B & T. L. Gall (1993). Statistical Record of Asian Americans. Cleveland, OH: Eastwood Publications Development, Inc.
26. Goldberg, J. "The Overachievers." New York (April 10, 1995) pp. 43-50.
27. Goleman, D. "Probing School Success of Asian-Americans." New York Times (September 11, 1990), p.B1.
28. Guillermo, E. "President Clinton to Asian-Pacific-Americans: Help Lead US." Filipino Express (June 4, 1995), p.3.
29. Hazama, D. O. & Komeiji, J. O. (1986). Okaga Sama de: The Japanese in Hawaii. Honolulu, Hawaii: Bess Press, Inc.
30. Jones, K. Personal communication, March 4, 1996
31. Kim, H. (1986). Dictionary of Asian American History. Westport, CT: Greenwood Press, Inc.
32. Lee, J.F.J. Asian American Experiences in the United States. Jefferson, NC: McFarland & Company Inc., 1991.
33. Marden, C. F. & G. Meyer. (1973). Minorities in American Society. New York: D. Van Nostrand Company.
34. McDonagh, E. C. & E. S. Richards. (1972). Ethnic Relations in the United States. Westport, CT: Negro Universities Press.
35. Mogelonsky, M. "Asian American Indians." American Demographics, (August 1995) pp. 32-39.
36. Morley, J. W. (1965). Japan and Korea: America's Allies in the Pacific. New York: Walker and Company.
37. Ong, P. Economic Diversity, Issues & Policies. LEAP Asian Pacific American Public Policy Institute & UCLA Asian American Studies Center, 1994.
38. Parrillo, V. N. (1985). Strangers to These Shores (2nd ed.). New York: John Wiley & Sons.
39. Richards, R. (May 12, 1992). "Koreans Find Success Can Stir Problems." USA Today, pp. 1B-2B.
40. Sowell, T. (1978). American Ethnic Groups. The Urban Institute.
41. Straight, A. "Fighting Misconceptions About Asian Americans." Educational Record, (Spring/Summer 1995) pp. 90-91.
42. Takaki, R. (1989). Strangers from a Different Shore. Boston: Little, Brown and Company.
43. Tan, T. T. (1987). Your Chinese Roots. Union City, CA: Heian International, Inc.
44. Tate, M. (1980). The United States and the Hawaiian Kingdom. Westport, CT: Greenwood Press.
45. Tsai, S.H. "Review of, Marginal Sights: Staging the Chinese in America." American Historical Review, (February 1995) pp. 254-255.
46. U.S. Census Bureau. "The APA Population Report: A Special Statistical Supplement." Asian Week, (January 19, 1996) pp. 13-19.
47. Usdansky, M. L. (October 12, 1993). "For Women, Land of Opportunity." USA Today, p. 8A.
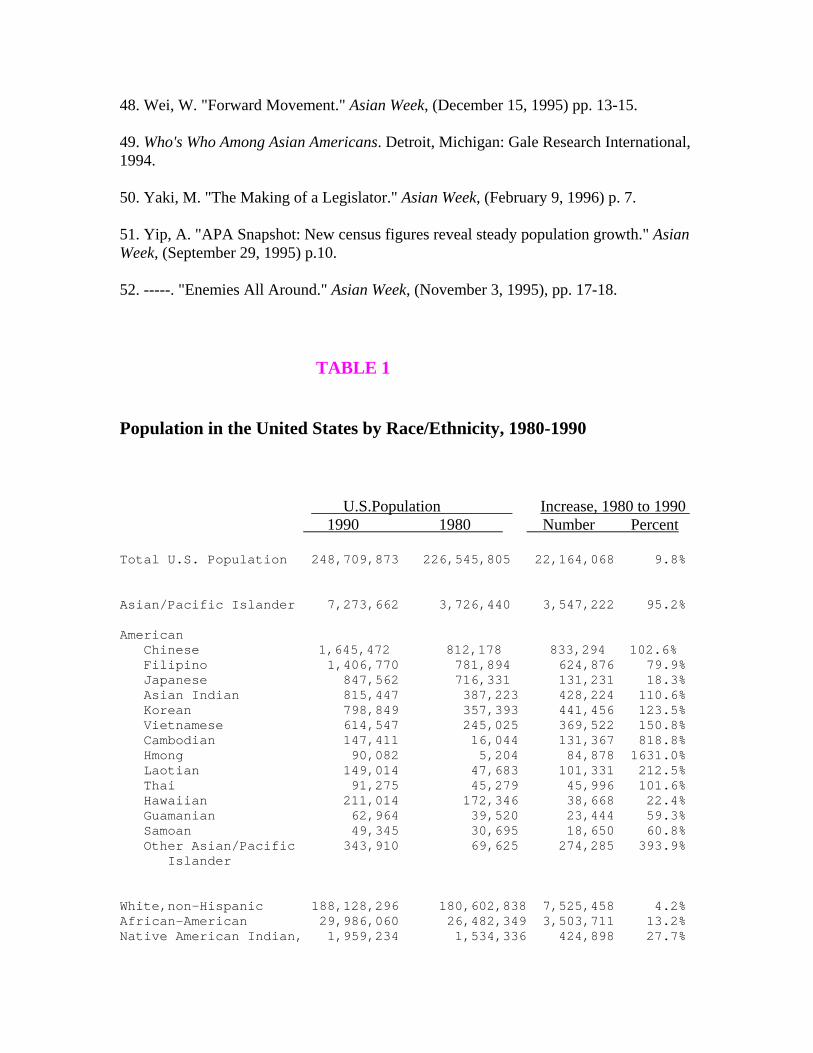
48. Wei, W. "Forward Movement." Asian Week, (December 15, 1995) pp. 13-15.
49. Who's Who Among Asian Americans. Detroit, Michigan: Gale Research International, 1994.
50. Yaki, M. "The Making of a Legislator." Asian Week, (February 9, 1996) p. 7.
51. Yip, A. "APA Snapshot: New census figures reveal steady population growth." Asian Week, (September 29, 1995) p.10.
52. -----. "Enemies All Around." Asian Week, (November 3, 1995), pp. 17-18.
TABLE 1
Population in the United States by Race/Ethnicity, 1980-1990
U.S.Population Increase, 1980 to 1990 1990 1980 Number Percent
Total U.S. Population 248,709,873 226,545,805 22,164,068 9.8% Asian/Pacific Islander 7,273,662 3,726,440 3,547,222 95.2% American Chinese 1,645,472 812,178 833,294 102.6% Filipino 1,406,770 781,894 624,876 79.9% Japanese 847,562 716,331 131,231 18.3% Asian Indian 815,447 387,223 428,224 110.6% Korean 798,849 357,393 441,456 123.5% Vietnamese 614,547 245,025 369,522 150.8% Cambodian 147,411 16,044 131,367 818.8% Hmong 90,082 5,204 84,878 1631.0% Laotian 149,014 47,683 101,331 212.5% Thai 91,275 45,279 45,996 101.6% Hawaiian 211,014 172,346 38,668 22.4% Guamanian 62,964 39,520 23,444 59.3% Samoan 49,345 30,695 18,650 60.8% Other Asian/Pacific 343,910 69,625 274,285 393.9% Islander White,non-Hispanic 188,128,296 180,602,838 7,525,458 4.2% African-American 29,986,060 26,482,349 3,503,711 13.2% Native American Indian, 1,959,234 1,534,336 424,898 27.7%
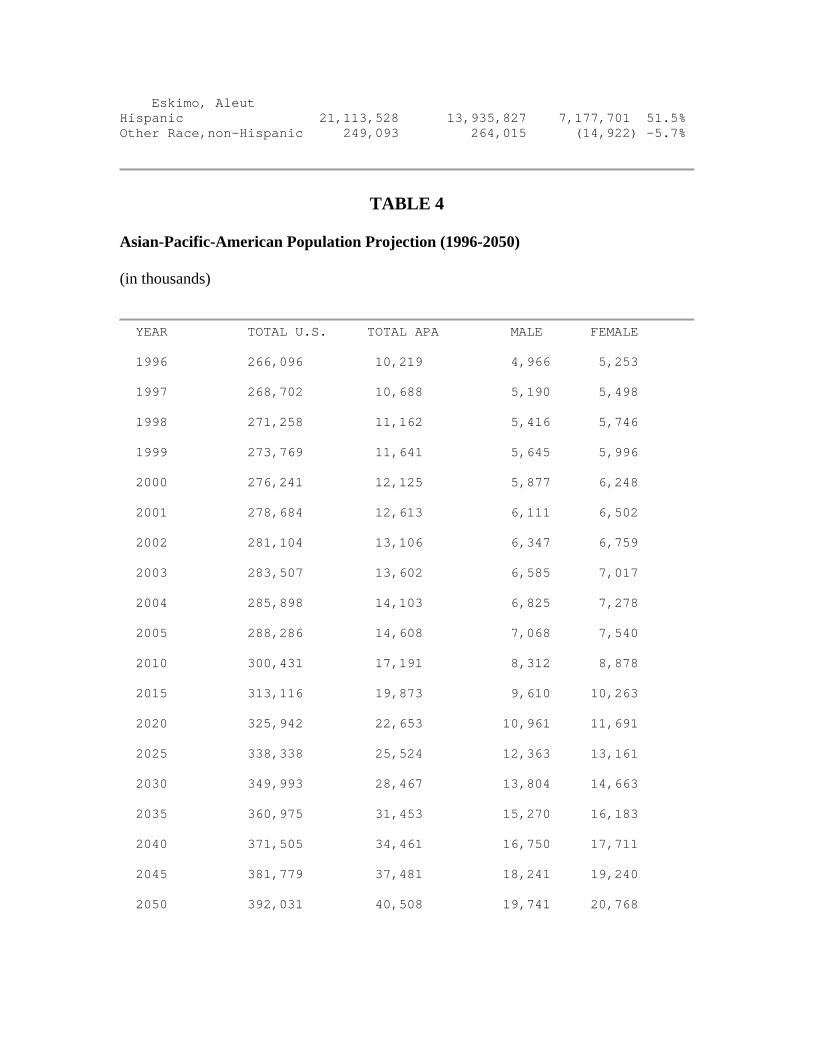
Eskimo, Aleut Hispanic 21,113,528 13,935,827 7,177,701 51.5% Other Race,non-Hispanic 249,093 264,015 (14,922) -5.7%
TABLE 4 Asian-Pacific-American Population Projection (1996-2050)
(in thousands)
YEAR TOTAL U.S. TOTAL APA MALE FEMALE 1996 266,096 10,219 4,966 5,253 1997 268,702 10,688 5,190 5,498 1998 271,258 11,162 5,416 5,746 1999 273,769 11,641 5,645 5,996 2000 276,241 12,125 5,877 6,248 2001 278,684 12,613 6,111 6,502 2002 281,104 13,106 6,347 6,759 2003 283,507 13,602 6,585 7,017 2004 285,898 14,103 6,825 7,278 2005 288,286 14,608 7,068 7,540 2010 300,431 17,191 8,312 8,878 2015 313,116 19,873 9,610 10,263 2020 325,942 22,653 10,961 11,691 2025 338,338 25,524 12,363 13,161 2030 349,993 28,467 13,804 14,663 2035 360,975 31,453 15,270 16,183 2040 371,505 34,461 16,750 17,711 2045 381,779 37,481 18,241 19,240 2050 392,031 40,508 19,741 20,768
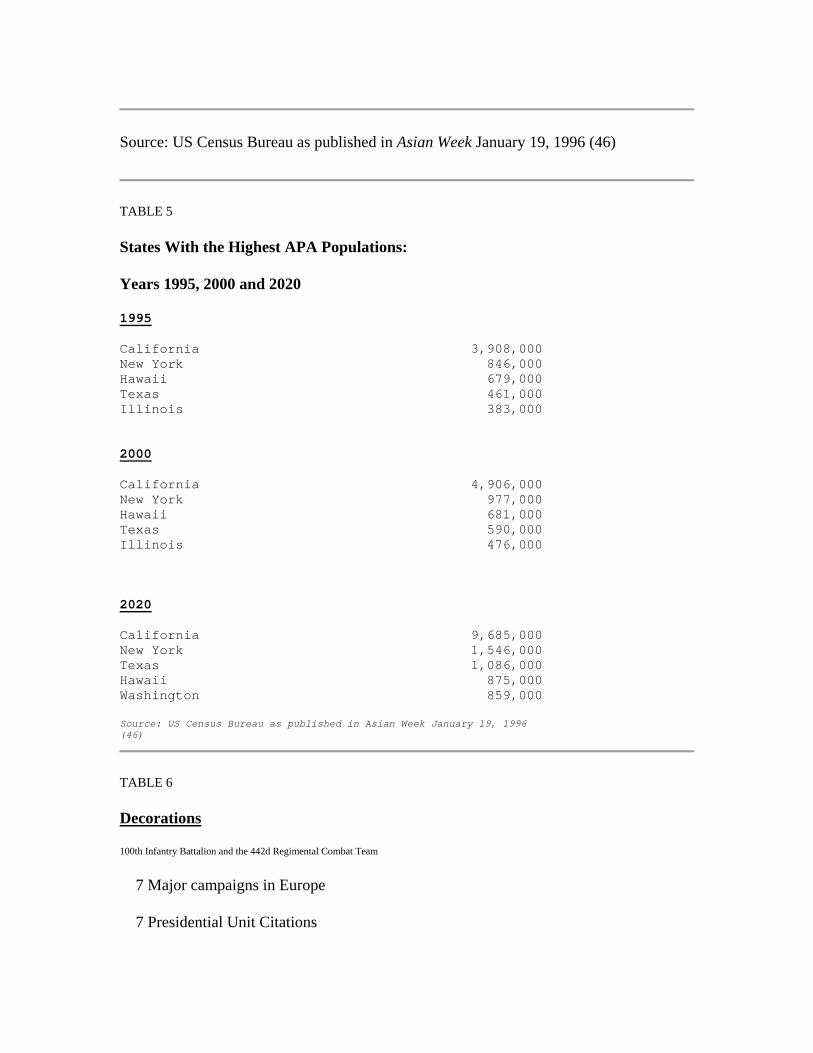
Source: US Census Bureau as published in Asian Week January 19, 1996 (46)
TABLE 5
States With the Highest APA Populations:
Years 1995, 2000 and 2020
1995 California 3,908,000 New York 846,000 Hawaii 679,000 Texas 461,000 Illinois 383,000 2000 California 4,906,000 New York 977,000 Hawaii 681,000 Texas 590,000 Illinois 476,000 2020 California 9,685,000 New York 1,546,000 Texas 1,086,000 Hawaii 875,000 Washington 859,000 Source: US Census Bureau as published in Asian Week January 19, 1996 (46)
TABLE 6
Decorations 100th Infantry Battalion and the 442d Regimental Combat Team
7 Major campaigns in Europe
7 Presidential Unit Citations
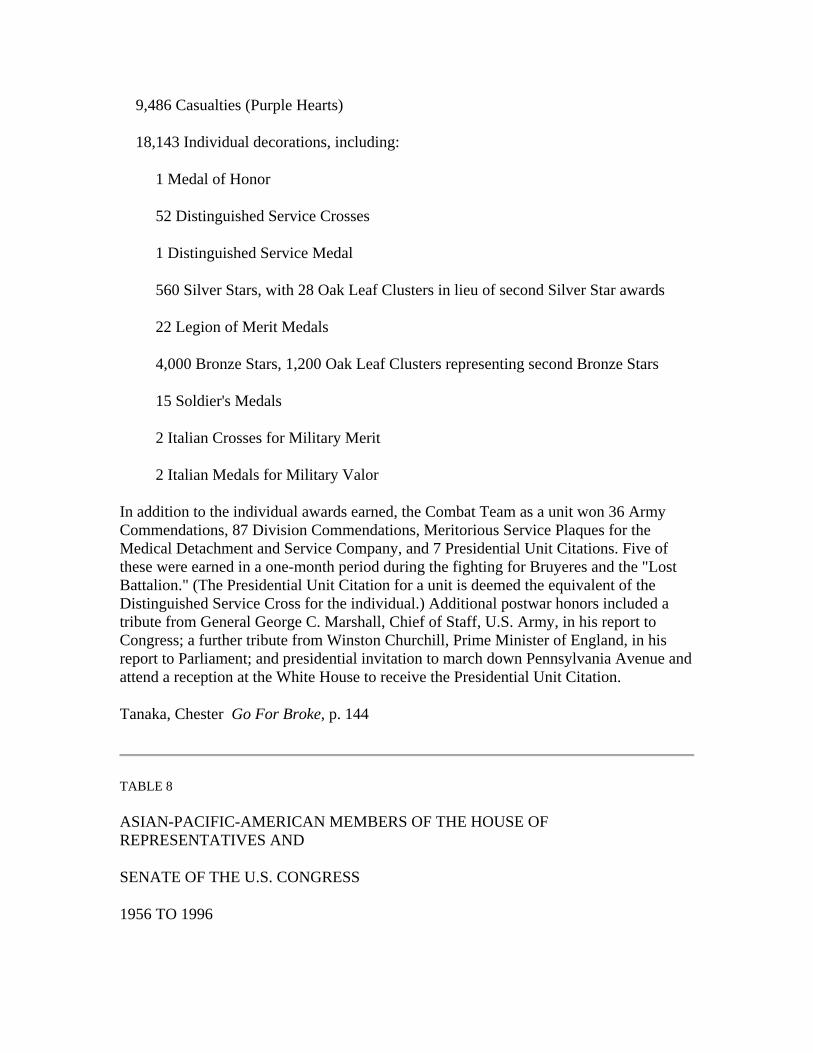
9,486 Casualties (Purple Hearts)
18,143 Individual decorations, including:
1 Medal of Honor
52 Distinguished Service Crosses
1 Distinguished Service Medal
560 Silver Stars, with 28 Oak Leaf Clusters in lieu of second Silver Star awards
22 Legion of Merit Medals
4,000 Bronze Stars, 1,200 Oak Leaf Clusters representing second Bronze Stars
15 Soldier's Medals
2 Italian Crosses for Military Merit
2 Italian Medals for Military Valor
In addition to the individual awards earned, the Combat Team as a unit won 36 Army Commendations, 87 Division Commendations, Meritorious Service Plaques for the Medical Detachment and Service Company, and 7 Presidential Unit Citations. Five of these were earned in a one-month period during the fighting for Bruyeres and the "Lost Battalion." (The Presidential Unit Citation for a unit is deemed the equivalent of the Distinguished Service Cross for the individual.) Additional postwar honors included a tribute from General George C. Marshall, Chief of Staff, U.S. Army, in his report to Congress; a further tribute from Winston Churchill, Prime Minister of England, in his report to Parliament; and presidential invitation to march down Pennsylvania Avenue and attend a reception at the White House to receive the Presidential Unit Citation.
Tanaka, Chester Go For Broke, p. 144
TABLE 8
ASIAN-PACIFIC-AMERICAN MEMBERS OF THE HOUSE OF REPRESENTATIVES AND
SENATE OF THE U.S. CONGRESS
1956 TO 1996
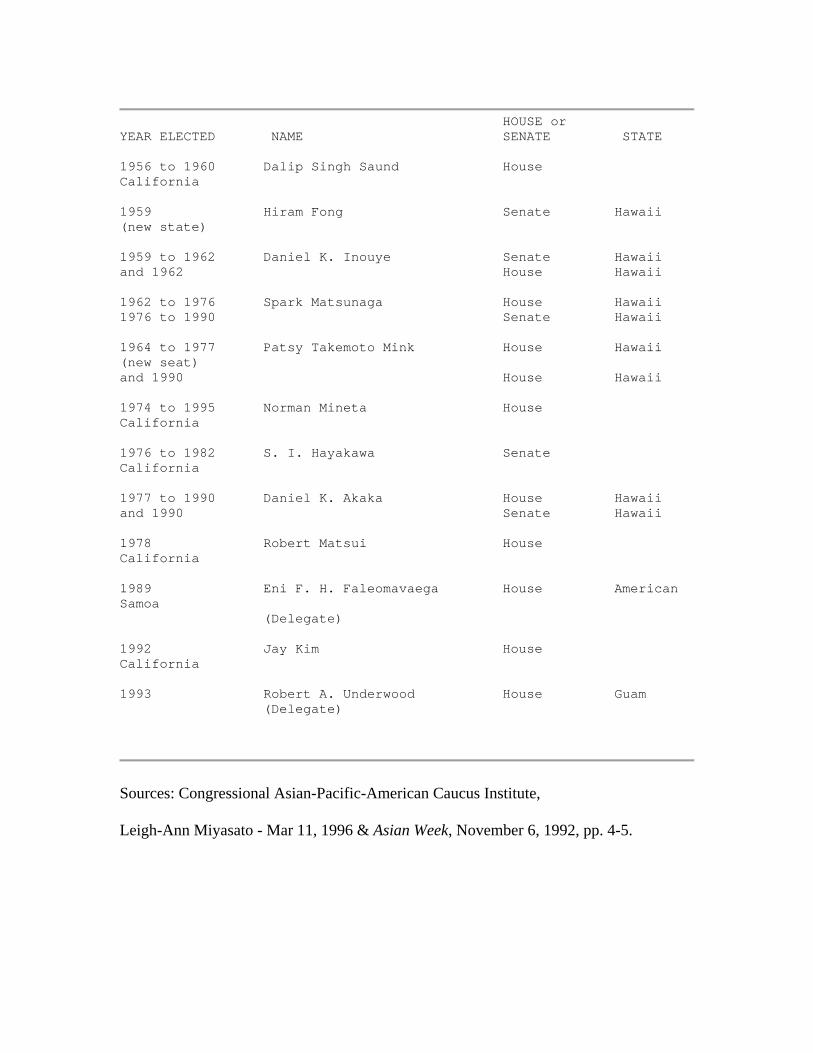
HOUSE or YEAR ELECTED NAME SENATE STATE 1956 to 1960 Dalip Singh Saund House California 1959 Hiram Fong Senate Hawaii (new state) 1959 to 1962 Daniel K. Inouye Senate Hawaii and 1962 House Hawaii 1962 to 1976 Spark Matsunaga House Hawaii 1976 to 1990 Senate Hawaii 1964 to 1977 Patsy Takemoto Mink House Hawaii (new seat) and 1990 House Hawaii 1974 to 1995 Norman Mineta House California 1976 to 1982 S. I. Hayakawa Senate California 1977 to 1990 Daniel K. Akaka House Hawaii and 1990 Senate Hawaii 1978 Robert Matsui House California 1989 Eni F. H. Faleomavaega House American Samoa (Delegate) 1992 Jay Kim House California 1993 Robert A. Underwood House Guam (Delegate)
Sources: Congressional Asian-Pacific-American Caucus Institute,
Leigh-Ann Miyasato - Mar 11, 1996 & Asian Week, November 6, 1992, pp. 4-5.