Embed Size (px)
Citation preview
Portfolio Strategy Published by Raymond James & Associates
Please read domestic and foreign disclosure/risk information beginning on page 4 and Analyst Certification on page 5.
© 2018 Raymond James & Associates, Inc., member New York Stock Exchange/SIPC. All rights reserved.
International Headquarters: The Raymond James Financial Center | 880 Carillon Parkway | St. Petersburg, Florida 33716 | 800-248-8863
Michael Gibbs, Director of Equity Portfolio & Technical Strategy, (901) 579-4346, [email protected]
Joey Madere, (901) 529-5331, [email protected]
Richard Sewell, CFA, (901) 524-4194, [email protected]
August 16, 2018
Afternoon Comment ____________________________________________________________________________________________
Equity Market Recap
U.S equities rebounded across the board though closed off the highs for the day and within 1% of the all-time record on the S&P
500. The DJIA was the top performer today, up 1.58% on strong earnings reports from WMT (+9.33%) and CSCO (+2.96%).
Additionally, improved trade sentiment with China drove strength in the industrial space, the second best performing segment of
the DJIA, behind Consumer Staples, which includes WMT. In earnings, with only 38 companies left to report, approximately 92.5%
are reporting an average EPS Growth rate of 24.84%, which is on track for the 2nd highest average EPS growth rate since 3Q10,
according to FactSet. On the macro front, July Building Permits reported higher than expected at 1,311K vs 1,306K est., up from
1,292K prior. July Housing Starts missed, reporting 1,168K vs 1,270k est., and Initial Claims reported 212.0K vs 215K est. Treasuries
were weaker and the 10 yr yield settled higher at 2.87%. WTI Crude finished up 0.70%, Gold settled lower 0.1%, and the USD was
stronger vs yen and weaker vs the euro and pound. The Dow Jones Industrials closed +1.58%, the S&P 500 +0.79%, NASDAQ +0.42%,
and Russell 2000 +0.90%.
Despite both being positive, Value +1.11% outperformed Growth +0.53%. All GICS sectors were higher on the day.
Telecommunications was the best performing sector up +2.01%. Although positive, Information Technology +0.25% was the weakest
sector today.
For the S&P 500 overall, breadth was positive with 437 advancing issues and 66 decliners, and volume today was 2% above its 30-
day average rate. Over on the NASDAQ, volume was 2% above its 30-day average rate, and its breadth was positive with 1,695
advancing issues to 733 decliners.
Looking at the broader markets, advancing volume as a percentage of total volume was 74% on the NYSE and 59% on the NASDAQ.
There were 90 stocks on the NYSE that made 52-week highs and 48 stocks that made 52-week lows. On the NASDAQ, there were 82
stocks that made 52-week highs and 61 stocks that made 52-week lows.
The strongest S&P 500 stocks today were: Walmart Inc. (WMT) +9.33%, Symantec Corporation (SYMC) +4.64%, Boeing Company (BA) +4.29%, CenturyLink, Inc. (CTL) +3.83%, and NRG Energy, Inc. (NRG) +3.62%. The weakest S&P 500 stocks today were: Chipotle Mexican Grill, Inc. (CMG) -4.41%, NetApp, Inc. (NTAP) -3.59%, Constellation Brands, Inc. Class A (STZ) -2.78%, Facebook, Inc. Class A (FB) -2.69%, and Viacom Inc. Class B (VIAB) -2.27%. Overseas, Asian markets were lower, and European markets were higher. Recapping the Asian markets, Japan's Nikkei 225 was -0.05%, Hong Kong's Hang Seng was -0.82%, China's Shanghai Composite was -0.46%, and Australia market -0.01%; and in Europe, EURO STOXX 50 ended +0.55%, London's FTSE 100 +0.78%, German DAX +0.61%, and the French CAC 40 +0.83%.
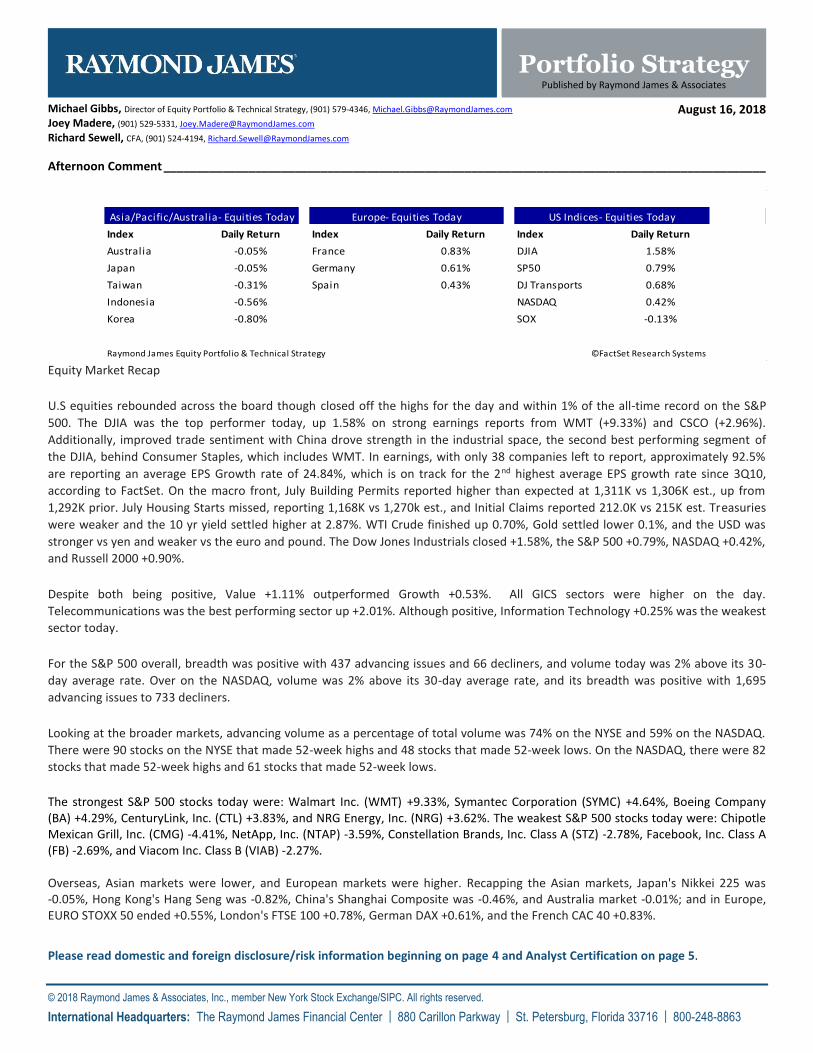
Index Daily Return Index Daily Return Index Daily Return
Australia -0.05% France 0.83% DJIA 1.58%
Japan -0.05% Germany 0.61% SP50 0.79%
Taiwan -0.31% Spain 0.43% DJ Transports 0.68%
Indonesia -0.56% NASDAQ 0.42%
Korea -0.80% SOX -0.13%
Raymond James Equity Portfolio & Technical Strategy
Asia/Pacific/Australia- Equities Today Europe- Equities Today US Indices- Equities Today
©FactSet Research Systems

Raymond James Afternoon Comment
© 2018 Raymond James & Associates, Inc., member New York Stock Exchange/SIPC. All rights reserved.
International Headquarters: The Raymond James Financial Center | 880 Carillon Parkway | St. Petersburg, Florida 33716 | 800-248-8863 2
+ 9.33 %
+ 4.64 %+ 4.29 %+ 3.83 %+ 3.62 %
- 2.27 %- 2.69 %- 2.78 %
- 3.59 %- 4.41 %
WMT SYMC BA CTL NRG VIAB FB STZ NTAP CMG
S&P 500 - Today's Biggest Gainers & Losers
-0.13%
0.42%
0.68%
0.79%
0.90%
1.58%
PHLX / Semiconductor
NASDAQ Composite Index
DJ Transportation
S&P 500
Russell 2000
DJ Industrial Average
US Index Current % Change Today
Raymond James FactSet Research Systems
0.25%
0.45%
0.62%
0.62%
0.71%
0.92%
1.12%
1.16%
1.25%
1.52%
2.01%
Information Technology
Consumer Discretionary
Energy
Materials
Real Estate
Healthcare
Utilities
Industrials
Financials
Consumer Staples
Telecommunications
S&P GICS Sectors Today
Raymond James FactSet ResearchSystems
Raymond James Afternoon Comment
© 2018 Raymond James & Associates, Inc., member New York Stock Exchange/SIPC. All rights reserved.
International Headquarters: The Raymond James Financial Center | 880 Carillon Parkway | St. Petersburg, Florida 33716 | 800-248-8863 3
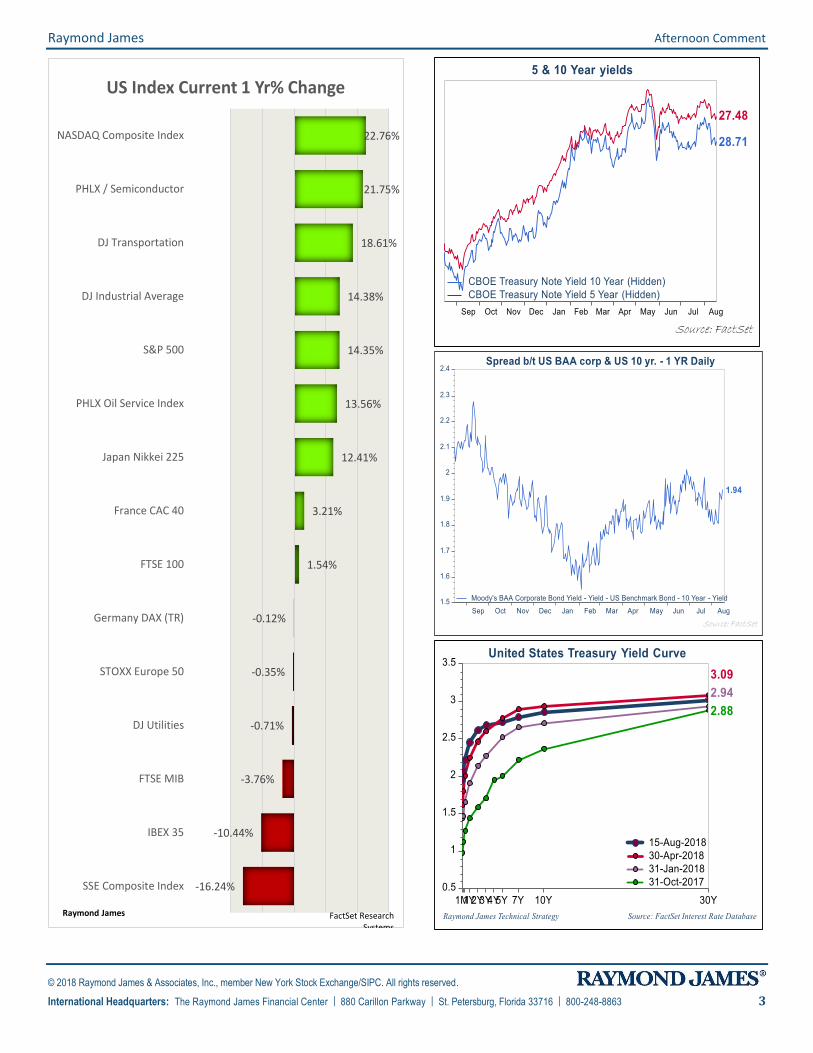
-16.24%
-10.44%
-3.76%
-0.71%
-0.35%
-0.12%
1.54%
3.21%
12.41%
13.56%
14.35%
14.38%
18.61%
21.75%
22.76%
SSE Composite Index
IBEX 35
FTSE MIB
DJ Utilities
STOXX Europe 50
Germany DAX (TR)
FTSE 100
France CAC 40
Japan Nikkei 225
PHLX Oil Service Index
S&P 500
DJ Industrial Average
DJ Transportation
PHLX / Semiconductor
NASDAQ Composite Index
US Index Current 1 Yr% Change
Raymond James FactSet ResearchSystems

Raymond James Afternoon Comment
© 2018 Raymond James & Associates, Inc., member New York Stock Exchange/SIPC. All rights reserved.
International Headquarters: The Raymond James Financial Center | 880 Carillon Parkway | St. Petersburg, Florida 33716 | 800-248-8863 4
Important Investor Disclosures Raymond James & Associates (RJA) is a FINRA member firm and is responsible for the preparation and distribution of research created in the United States. Raymond James & Associates is located at The Raymond James Financial Center, 880 Carillon Parkway, St. Petersburg, FL 33716, (727) 567-1000. Non-U.S. affiliates, which are not FINRA member firms, include the following entities that are responsible for the creation and distribution of research in their respective areas: in Canada, Raymond James Ltd. (RJL), Suite 2100, 925 West Georgia Street, Vancouver, BC V6C 3L2, (604) 659-8200; in Europe, Raymond James Euro Equities SAS (also trading as Raymond James International), 40, rue La Boetie, 75008, Paris, France, +33 1 45 64 0500, and Raymond James Financial International Ltd., Broadwalk House, 5 Appold Street, London, England EC2A 2AG, +44 203 798 5600.
This document is not directed to, or intended for distribution to or use by, any person or entity that is a citizen or resident of or located in any locality, state, country, or other jurisdiction where such distribution, publication, availability or use would be contrary to law or regulation. The securities discussed in this document may not be eligible for sale in some jurisdictions. This research is not an offer to sell or the solicitation of an offer to buy any security in any jurisdiction where such an offer or solicitation would be illegal. It does not constitute a personal recommendation or take into account the particular investment objectives, financial situations, or needs of individual clients. Past performance is not a guide to future performance, future returns are not guaranteed, and a loss of original capital may occur. Investors should consider this report as only a single factor in making their investment decision.
For clients in the United States: Any foreign securities discussed in this report are generally not eligible for sale in the U.S. unless they are listed on a U.S. exchange. This report is being provided to you for informational purposes only and does not represent a solicitation for the purchase or sale of a security in any state where such a solicitation would be illegal. Investing in securities of issuers organized outside of the U.S., including ADRs, may entail certain risks. The securities of non-U.S. issuers may not be registered with, nor be subject to the reporting requirements of, the U.S. Securities and Exchange Commission. There may be limited information available on such securities. Investors who have received this report may be prohibited in certain states or other jurisdictions from purchasing the securities mentioned in this report. Please ask your Financial Advisor for additional details and to determine if a particular security is eligible for purchase in your state.
The information provided is as of the date above and subject to change, and it should not be deemed a recommendation to buy or sell any security. Certain information has been obtained from third-party sources we consider reliable, but we do not guarantee that such information is accurate or complete. Persons within the Raymond James family of companies may have information that is not available to the contributors of the information contained in this publication. Raymond James, including affiliates and employees, may execute transactions in the securities listed in this publication that may not be consistent with the ratings appearing in this publication.
Raymond James (“RJ”) research reports are disseminated and available to RJ’s retail and institutional clients simultaneously via electronic publication to RJ's internal proprietary websites (RJ Investor Access & RJ Capital Markets). Not all research reports are directly distributed to clients or third-party aggregators. Certain research reports may only be disseminated on RJ's internal proprietary websites; however such research reports will not contain estimates or changes to earnings forecasts, target price, valuation, or investment or suitability rating. Individual Research Analysts may also opt to circulate published research to one or more clients electronically. This electronic communication distribution is discretionary and is done only after the research has been publically disseminated via RJ’s internal proprietary websites. The level and types of communications provided by Research Analysts to clients may vary depending on various factors including, but not limited to, the client’s individual preference as to the frequency and manner of receiving communications from Research Analysts. For research reports, models, or other data available on a particular security, please contact your RJ Sales Representative or visit RJ Investor Access or RJ Capital Markets.
Links to third-party websites are being provided for information purposes only. Raymond James is not affiliated with and does not endorse, authorize, or sponsor any of the listed websites or their respective sponsors. Raymond James is not responsible for the content of any third-party website or the collection or use of information regarding any website’s users and/or members.
Additional information is available on request.
Analyst Information
Registration of Non-U.S. Analysts: The analysts listed on the front of this report who are not employees of Raymond James & Associates, Inc., are not registered/qualified as research analysts under FINRA rules, are not associated persons of Raymond James & Associates, Inc., and are not subject to FINRA Rule 2241 restrictions on communications with covered companies, public companies, and trading securities held by a research analyst account.
Analyst Holdings and Compensation: Equity analysts and their staffs at Raymond James are compensated based on a salary and bonus system. Several factors enter into the bonus determination including quality and performance of research product, the analyst's success in rating stocks versus an industry index, and support effectiveness to trading and the retail and institutional sales forces. Other factors may include but are not limited to: overall ratings from internal (other than investment banking) or external parties and the general productivity and revenue generated in covered stocks.

Raymond James Afternoon Comment
© 2018 Raymond James & Associates, Inc., member New York Stock Exchange/SIPC. All rights reserved.
International Headquarters: The Raymond James Financial Center | 880 Carillon Parkway | St. Petersburg, Florida 33716 | 800-248-8863 5
The views expressed in this report accurately reflect the personal views of the analyst(s) covering the subject securities. No part of said person's compensation was, is, or will be directly or indirectly related to the specific recommendations or views contained in this research report. In addition, said analyst has not received compensation from any subject company in the last 12 months.
Ratings and Definitions
Raymond James & Associates (U.S.) definitions
Strong Buy (SB1) Expected to appreciate, produce a total return of at least 15%, and outperform the S&P 500 over the next six to 12 months. For higher yielding and more conservative equities, such as REITs and certain MLPs, a total return of at least 15% is expected to be realized over the next 12 months. Outperform (MO2) Expected to appreciate and outperform the S&P 500 over the next 12-18 months. For higher yielding and more conservative equities, such as REITs and certain MLPs, an Outperform rating is used for securities where we are comfortable with the relative safety of the dividend and expect a total return modestly exceeding the dividend yield over the next 12-18 months. Market Perform (MP3) Expected to perform generally in line with the S&P 500 over the next 12 months. Underperform (MU4) Expected to underperform the S&P 500 or its sector over the next six to 12 months and should be sold. Suspended (S) The rating and price target have been suspended temporarily. This action may be due to market events that made coverage impracticable, or to comply with applicable regulations or firm policies in certain circumstances, including when Raymond James may be providing investment banking services to the company. The previous rating and price target are no longer in effect for this security and should not be relied upon. Raymond James Ltd. (Canada) definitions
Strong Buy (SB1) The stock is expected to appreciate and produce a total return of at least 15% and outperform the S&P/TSX Composite Index over the next six months. Outperform (MO2) The stock is expected to appreciate and outperform the S&P/TSX Composite Index over the next twelve months. Market Perform (MP3) The stock is expected to perform generally in line with the S&P/TSX Composite Index over the next twelve months and is potentially a source of funds for more highly rated securities. Underperform (MU4) The stock is expected to underperform the S&P/TSX Composite Index or its sector over the next six to twelve months and should be sold. Raymond James Europe (Raymond James Euro Equities SAS & Raymond James Financial International Limited) rating definitions
Strong Buy (1) Expected to appreciate, produce a total return of at least 15%, and outperform the Stoxx 600 over the next 6 to 12 months. Outperform (2) Expected to appreciate and outperform the Stoxx 600 over the next 12 months. Market Perform (3) Expected to perform generally in line with the Stoxx 600 over the next 12 months. Underperform (4) Expected to underperform the Stoxx 600 or its sector over the next 6 to 12 months. Suspended (S) The rating and target price have been suspended temporarily. This action may be due to market events that made coverage impracticable, or to comply with applicable regulations or firm policies in certain circumstances, including when Raymond James may be providing investment banking services to the company. The previous rating and target price are no longer in effect for this security and should not be relied upon. In transacting in any security, investors should be aware that other securities in the Raymond James research coverage universe might carry a higher or lower rating. Investors should feel free to contact their Financial Advisor to discuss the merits of other available investments.
Rating Distributions
Coverage Universe Rating Distribution* Investment Banking Distribution
RJA RJL RJEE/RJFI RJA RJL RJEE/RJFI
Strong Buy and Outperform (Buy) 56% 70% 52% 23% 33% 0%
Market Perform (Hold) 39% 26% 34% 11% 11% 0%
Underperform (Sell) 5% 4% 15% 5% 22% 0%
* Columns may not add to 100% due to rounding.
Suitability Ratings (SR)
Medium Risk/Income (M/INC) Lower to average risk equities of companies with sound financials, consistent earnings, and dividend yields above that of the S&P 500. Many securities in this category are structured with a focus on providing a consistent dividend or return of capital.

Raymond James Afternoon Comment
© 2018 Raymond James & Associates, Inc., member New York Stock Exchange/SIPC. All rights reserved.
International Headquarters: The Raymond James Financial Center | 880 Carillon Parkway | St. Petersburg, Florida 33716 | 800-248-8863 6
Medium Risk/Growth (M/GRW) Lower to average risk equities of companies with sound financials, consistent earnings growth, the potential for long-term price appreciation, a potential dividend yield, and/or share repurchase program.
High Risk/Income (H/INC) Medium to higher risk equities of companies that are structured with a focus on providing a meaningful dividend but may face less predictable earnings (or losses), more leveraged balance sheets, rapidly changing market dynamics, financial and competitive issues, higher price volatility (beta), and potential risk of principal. Securities of companies in this category may have a less predictable income stream from dividends or distributions of capital.
High Risk/Growth (H/GRW) Medium to higher risk equities of companies in fast growing and competitive industries, with less predictable earnings (or losses), more leveraged balance sheets, rapidly changing market dynamics, financial or legal issues, higher price volatility (beta), and potential risk of principal.
High Risk/Speculation (H/SPEC) High risk equities of companies with a short or unprofitable operating history, limited or less predictable revenues, very high risk associated with success, significant financial or legal issues, or a substantial risk/loss of principal.
Raymond James Relationship Disclosures
Raymond James expects to receive or intends to seek compensation for investment banking services from the subject companies in the next three months.
Stock Charts, Target Prices, and Valuation Methodologies
Valuation Methodology: The Raymond James methodology for assigning ratings and target prices includes a number of qualitative and quantitative factors including an assessment of industry size, structure, business trends and overall attractiveness; management effectiveness; competition; visibility; financial condition, and expected total return, among other factors. These factors are subject to change depending on overall economic conditions or industry- or company-specific occurrences.
Risk Factors
General Risk Factors: Following are some general risk factors that pertain to the businesses of the subject companies and the projected target prices and recommendations included on Raymond James research: (1) Industry fundamentals with respect to customer demand or product / service pricing could change and adversely impact expected revenues and earnings; (2) Issues relating to major competitors or market shares or new product expectations could change investor attitudes toward the sector or this stock; (3) Unforeseen developments with respect to the management, financial condition or accounting policies or practices could alter the prospective valuation; or (4) External factors that affect the U.S. economy, interest rates, the U.S. dollar or major segments of the economy could alter investor confidence and investment prospects. International investments involve additional risks such as currency fluctuations, differing financial accounting standards, and possible political and economic instability.
Additional Risk and Disclosure information, as well as more information on the Raymond James rating system and suitability categories, is available at rjcapitalmarkets.com/Disclosures/index. Copies of research or Raymond James’ summary policies relating to research analyst independence can be obtained by contacting any Raymond James & Associates or Raymond James Financial Services office (please see raymondjames.com for office locations) or by calling 727-567-1000, toll free 800-237-5643 or sending a written request to the Equity Research Library, Raymond James & Associates, Inc., Tower 3, 6th Floor, 880 Carillon Parkway, St. Petersburg, FL 33716.
Simple Moving Average (SMA) - A simple, or arithmetic, moving average is calculated by adding the closing price of the security for a number of time periods and then dividing this total by the number of time periods. Exponential Moving Average (EMA) - A type of moving average that is similar to a simple moving average, except that more weight is given to the latest data. Relative Strength Index (RSI) - The Relative Strength Index is a technical momentum indicator that compares the magnitude of recent gains to recent losses in an attempt to determine overbought and oversold conditions of an asset.
International securities involve additional risks such as currency fluctuations, differing financial accounting standards, and possible political and economic instability. These risks are greater in emerging markets.
Small-cap stocks generally involve greater risks. Dividends are not guaranteed and will fluctuate. Past performance may not be indicative of future results.

Raymond James Afternoon Comment
© 2018 Raymond James & Associates, Inc., member New York Stock Exchange/SIPC. All rights reserved.
International Headquarters: The Raymond James Financial Center | 880 Carillon Parkway | St. Petersburg, Florida 33716 | 800-248-8863 7
Investors should consider the investment objectives, risks, and charges and expenses of mutual funds and exchange-traded funds carefully before investing. The prospectus contains this and other information about mutual funds and exchange –traded funds. The prospectus is available from your financial advisor and should be read carefully before investing.
Not approved for rollover solicitations.
For clients in the United Kingdom:
For clients of Raymond James Financial International Limited (RJFI): This document and any investment to which this document relates is intended for the sole use of the persons to whom it is addressed, being persons who are Eligible Counterparties or Professional Clients as described in the FCA rules or persons described in Articles 19(5) (Investment professionals) or 49(2) (High net worth companies, unincorporated associations etc) of the Financial Services and Markets Act 2000 (Financial Promotion) Order 2005 (as amended) or any other person to whom this promotion may lawfully be directed. It is not intended to be distributed or passed on, directly or indirectly, to any other class of persons and may not be relied upon by such persons and is therefore not intended for private individuals or those who would be classified as Retail Clients.
For clients of Raymond James Investment Services, Ltd.: This report is for the use of professional investment advisers and managers and is not intended for use by clients.
For purposes of the Financial Conduct Authority requirements, this research report is classified as independent with respect to conflict of interest management. RJFI, and Raymond James Investment Services, Ltd. are authorised and regulated by the Financial Conduct Authority in the United Kingdom.
For clients in France:
This document and any investment to which this document relates is intended for the sole use of the persons to whom it is addressed, being persons who are Eligible Counterparties or Professional Clients as described in “Code Monétaire et Financier” and Règlement Général de l’Autorité des Marchés Financiers. It is not intended to be distributed or passed on, directly or indirectly, to any other class of persons and may not be relied upon by such persons and is therefore not intended for private individuals or those who would be classified as Retail Clients.
For clients of Raymond James Euro Equities: Raymond James Euro Equities is authorised and regulated by the Autorité de Contrôle Prudentiel et de Résolution and the Autorité des Marchés Financiers.
For institutional clients in the European Economic Area (EEA) outside of the United Kingdom:
This document (and any attachments or exhibits hereto) is intended only for EEA institutional clients or others to whom it may lawfully be submitted.
For Canadian clients:
This report is not prepared subject to Canadian disclosure requirements, unless a Canadian analyst has contributed to the content of the report. In the case where there is Canadian analyst contribution, the report meets all applicable IIROC disclosure requirements.
Proprietary Rights Notice: By accepting a copy of this report, you acknowledge and agree as follows:
This report is provided to clients of Raymond James only for your personal, noncommercial use. Except as expressly authorized by Raymond James, you may not copy, reproduce, transmit, sell, display, distribute, publish, broadcast, circulate, modify, disseminate or commercially exploit the information contained in this report, in printed, electronic or any other form, in any manner, without the prior express written consent of Raymond James. You also agree not to use the information provided in this report for any unlawful purpose. This is RJA client
releasable resear ch
This report and its contents are the property of Raymond James and are protected by applicable copyright, trade secret or other intellectual property laws (of the United States and other countries). United States law, 17 U.S.C. Sec.501 et seq, provides for civil and criminal penalties for copyright infringement. No copyright claimed in incorporated U.S. government works.


![MakoLab raport kwartalny I 2018 final final^ } v î Ì í ô ^ ] ] /e&kzd : k ^wmb ï e ^wmb](https://img.pdfslide.net/doc/110x75/5e5fe81f22217025700564ef/makolab-raport-kwartalny-i-2018-final-final-v-oe-ekzd-.jpg)