Embed Size (px)
Citation preview
ASL Digital Video Quality 1
This DRAFT copy is provided only for reference. The definitive final version of this paper is available on the publisher’s site.
Running head: ASL DIGITAL VIDEO QUALITY
The Effects of Digital Video Quality on Learner Comprehension in an
American Sign Language Assessment Environment
Simon Hooper, Charles Miller, Susan Rose, George Veletsianos
University of Minnesota
Hooper, S., Miller, C., Rose, S., & Veletsianos, G. (2007). The Effects of Digital Video Quality
on Learner Comprehension in an American Sign Language Assessment Environment.
Sign Language Studies, 8(1), 42-58.
ASL Digital Video Quality 2
This DRAFT copy is provided only for reference. The definitive final version of this paper is available on the publisher’s site.
Abstract
The effects of digital video framerate and size on American Sign Language (ASL) learner
comprehension were investigated. Fifty-one students were randomly assigned to one of three
video size treatment groups: 480x360, 320x240, and 240x180 pixels. Within each treatment,
students were presented three 30-second videos of signed narratives at framerates of 6, 12, and
18 frames per second. Participants used ASL to retell each story and performances were captured
by a digital video camera and archived for evaluation. Three ASL experts evaluated the video
performances and generated a fluency score for each student. The results indicate that framerate
and the interaction between framerate and ASL level had significant effects on learner
comprehension, but video size did not significantly affect learner comprehension. These results
are used to generate framerate and video-size recommendations for displaying and recording
student performance and instructor feedback videos in an ASL performance assessment software
environment.
ASL Digital Video Quality 3
This DRAFT copy is provided only for reference. The definitive final version of this paper is available on the publisher’s site.
The Effects of Digital Video Quality on Learner Comprehension in an
American Sign Language Assessment Environment
Advancements in computer processing power coupled with the widespread availability of
high bandwidth have increased use of video-based media over the Internet. However, technical
factors continue to limit the quality of transmitted video files with the result that designers often
sacrifice media quality to create smaller file sizes that increase download speed.
Questions concerning the importance of video quality are generally subsumed within the
category of image clarity. Several factors may affect video clarity including image size,
framerate (i.e. the number of frames displayed per second), the number of colors associated with
an image (i.e. bit depth), use of codecs (i.e. application of different video compression-
decompression algorithms), dynamic range (i.e. fixed vs. variable bit rates), and the form of
frame scan (i.e. interlaced vs. progressive scan) (Library of Congress, 2005).
Although video quality may have little impact on some uses of digital video (e.g.,
streamed cybercasts, brief animations used to illustrate a web page, etc.) (Library of Congress,
2005), reduced video quality may create significant barriers in other applications. Video quality
is especially important for tasks involving detailed visual communication such as American Sign
Language (ASL). Reducing quality may obstruct learner comprehension or influence
performance assessment by instructors.
For more than fifty years, ASL has been accepted as a world language and valued as an
approach to encourage cultural diversity (Wilbers, 1987). During this period, ASL has become
the third most widely used language in the United States preceded only by English and Spanish.
As a result, more than 500 colleges and universities in the United States now offer ASL
ASL Digital Video Quality 4
This DRAFT copy is provided only for reference. The definitive final version of this paper is available on the publisher’s site.
instruction (Laurent, 2003; Wilcox, 2004): Enrolment in higher education ASL classes has
increased 433% nationally over the last 4 years (Welles, 2004).
The increasing demand for ASL instruction and linguistic study has created diverse
instructional challenges including assessment and measurement of learner progress (Deno, 1985;
Kemp, 1998). This creates a considerable need for efficient, effective, and technically valid
systems to assess student performance and monitor student progress (Schick & Williams, 2005).
The most widespread practice for assessing ASL fluency involves evaluating video recordings of
interviews with individual students (Newell & Caccamise, 1992). To record such an exam, a
student locates a video camera, captures a self-performance on videotape, and submits the tape
for evaluation. An instructor then reviews the video, evaluates the student’s performance, assigns
a score, and writes brief comments for each student in his/her class. The evaluation process often
delays feedback to the students for an average of two to three weeks, thereby causing the loss of
valuable opportunities for students to reflect on their performances and detracting from the
instructor’s ability to modify classroom instruction based on learners’ current performance
needs. In addition to being time consuming and unreliable, the process fails to improve student
learning.
We are presently developing a computer-based software environment to resolve and
extend ASL assessment. The environment includes an application for students to capture, submit,
and archive ASL performances, an application for instructors to evaluate and report student
performance, and an electronic portfolio where students can monitor personal progress and
practice. Our goals are to enhance the efficiency of the traditional assessment process and to
improve learning.
ASL Digital Video Quality 5
This DRAFT copy is provided only for reference. The definitive final version of this paper is available on the publisher’s site.
We realized early in the design process that it was important to establish a set of
standards (i.e. video size and framerate) for capturing and presenting digital video. Instructional
designers often face the problem of maintaining a balance between manageable file size and
suitable quality when using videos into a software environment (Schwier & Misanchuk, 1998).
Although widely accepted standards have yet to be established, the online video deployment
software used in the present study (i.e. Macromedia Flash) supports a standard video size of
320x240 pixels and 12 to 15 frames per second (FPS) for web delivery (Macromedia, 2003).
Schwier and Misanchuk (1998) examined the effects of framerate and video size on the
perceived quality of digital video and images among an adult population. They hypothesized that
lowering the video size and FPS may reduce the perceived quality of the movie. However, their
results indicate that recordings made at lower framerates (i.e. 10 FPS and 15 FPS) were preferred
to higher framerate videos (i.e. 30 FPS). Participants also favored larger movie windows (320 x
240 pixels) over smaller windows (160 x 120 pixels).
Schwier and Misanchuk’s research presents important findings for multimedia developers
concerned with optimizing the perceived quality of digital video capture and deployment.
However, their finding were not intended for capturing or displaying ASL video performances.
Research examining the effects of video quality on ASL learners is scarce and tends to focus on
the surface-level characteristics of ASL learning (e.g., vocabulary recognition), as opposed to
context-based learner comprehension (i.e. fluency, linguistics, and expression).
One study explored whether reductions in framerate affect the perceptual recognition
abilities of ASL novice learners (Johnson & Caird, 1996). Participants were asked to match ten
signs with their English equivalents. The signs were presented using a video size of 320 x 240
pixels and framerates of 1, 5, 15, 30 FPS. It was suggested that ASL novices are more likely than
ASL Digital Video Quality 6
This DRAFT copy is provided only for reference. The definitive final version of this paper is available on the publisher’s site.
ASL experts to be affected by framerate changes because novices lack the mental schemata to
recognize ill-formed signs. Although empirical results suggest that sign-performance recognition
decreases at lower framerates, no significant effect was found for framerate. For recognition
tasks, the authors claimed “lower framerates, specifically 1 and 5 FPS, appear to be sufficient to
learn ASL in a multimedia application” (Johnson & Caird, p. 122).
Although the effects of video size and framerate on sign recognition and general
perceived video quality have been examined, little research has investigated the effects of video
quality on ASL learners’ comprehension. Johnson and Caird’s (1996) claim concerning low
framerate sufficiency may be relevant for ASL recognition tasks, but may not accommodate the
intricacies needed for ASL communication or assessment. Keating and Mirus (2003) explain that
sign language communication is more than a manual system of hand orientations and movements
that symbolize words and ideas. ASL communication involves the transmission of imperative
grammatical and affective information through essential non-manual expressions (e.g., head
movement, eye movement, and specific facial expressions) in addition to the manual
communication of words through fingerspelling. With an average speed of five to seven letters
per second (Reed et. al, 1990), fingerspelling can add further complexity to signed transmission.
Higher quality video is needed to capture and represent subtle kinesthetic details of signed
communication in a software assessment environment. The primary goal of this study was to
examine the effects of framerate and video size on ASL learners’ comprehension. Specifically,
we asked the following primary research questions:
1. Will students provided with a larger video size to display ASL testing media demonstrate
higher levels of fluency than participants who are presented with smaller video sizes?
ASL Digital Video Quality 7
This DRAFT copy is provided only for reference. The definitive final version of this paper is available on the publisher’s site.
2. Will students provided with a faster framerate to display ASL testing media demonstrate
higher levels of fluency than participants who are presented with slower framerates?
3. Will intermediate level ASL students demonstrate higher levels of fluency than beginner
level participants on video-based assessments?
Method
Participants
A sample of 85 students enrolled in one of four ASL courses at a large Midwestern
university participated voluntarily. Each course covered a different level of ASL instruction (i.e.
ASL 1-4). Although 85 students participated in this experiment, a server failure on the second
day of testing partially corrupted 34 instances of participant data. Therefore, complete data from
only 51 participants were used for analyses.
Materials
The materials used in the study consisted of three ASL story-retell tests, ASL assessment
software, and a curriculum-based measures (CBM) rating system.
ASL story-retell tests. The story-retell tests required participants to watch an ASL video
narrative and sign back the story to a video camera. Each retell test consisted of a short story
(approximately 30 seconds in length) signed by an expert ASL actor. The script for each
narrative was developed by the authors to include a broad selection of current vocabulary and
grammar instructed throughout the four ASL courses. A transcription of each story-retell video is
included in Appendix A. All tests and students’ responses were stored on a computer server.
ASL assessment software. The story-retell test was delivered to participants using a
prototype software program designed to help instructors assess students’ ASL performances
efficiently and reliably. Participants were presented with instructions outlining the tasks to be
ASL Digital Video Quality 8
This DRAFT copy is provided only for reference. The definitive final version of this paper is available on the publisher’s site.
completed during the study. The software displayed each story-retell video (video size and
framerate determined randomly). After the video finished playing, the software provided 5
seconds for participants to align in front of the video camera (i.e. each participant was instructed
to align her/his head, chest, and arms with a human figure outline to ensure the full signing space
was captured by the video camera). Finally, participants were given 60 seconds to retell the story
in ASL to the camera before moving onto the next video. Upon completion of the three story-
retell tests, participants logged out of the software.
ASL-CBM rating system. Fluency, as defined in this study, was determined by assessing
the participant’s movement from one sign to the next, ease of use with the language, connected
thoughts and patterns of signs used, and accurate placement of signs. An ASL-CBM fluency
scoring paradigm was given to each ASL evaluator prior to scoring the participant video
performances. The ASL-CBM rating scale used for this study, a Likert Scale ranging from a
score of 1 to 10, was adapted from the Sign Communication Proficiency Inventory (SCPI)
developed by Newell and Caccamise (1992). For example, a low fluency rating of 1 or 2 was
assigned to participants who demonstrated very limited sign vocabulary, used no grammatical
structure, demonstrated great difficulty comprehending signed communication, lacked prosody,
and had frequent errors in production, resulting in almost incomprehensible performance. A high
fluency rating of 9 or 10 was assigned to participants who demonstrated a broad and fluent use of
vocabulary with strategies for creating and communicating new words, used complex
grammatical constructions with ease, and exhibited correct prosody for grammatical, non-verbal
markers and affective purposes. Participants who received a high fluency rating also
communicated all details of the original message in the story-retell narrative. See Appendix B for
a complete description of the fluency ratings used in this study.
ASL Digital Video Quality 9
This DRAFT copy is provided only for reference. The definitive final version of this paper is available on the publisher’s site.
Experimental design and treatments
The study employed a 2x3x3 mixed factorial design. The three experimental factors were
participant ASL Level, Video Size, and Framerate. The first factor, ASL Level, signified the
participant’s current placement in the four-course ASL progression (i.e. 1, 2, 3, or 4). Due to
corrupt data from groups 1 and 3, ASL Level was reduced into two categories to maintain a
balanced design: Beginner (i.e. Level 1 and 2 students) and Intermediate (i.e. Level 3 and 4
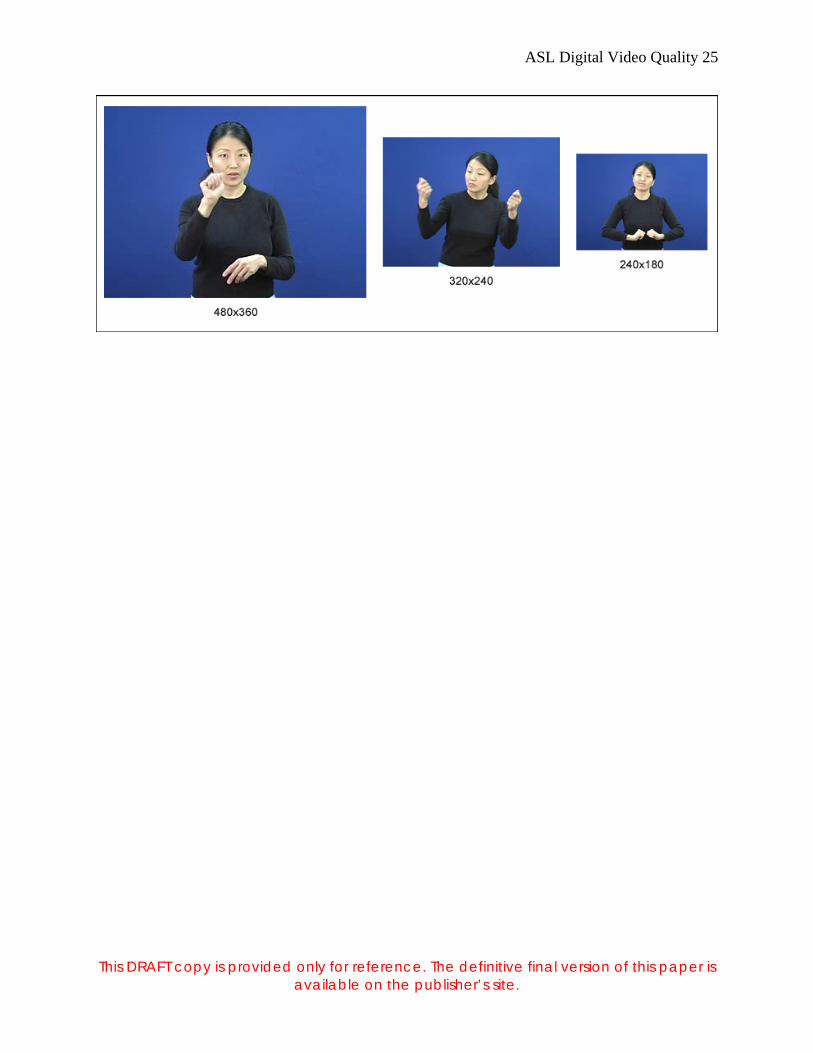
students). ASL Level was a between-subjects factor. The second factor, Video Size (i.e. the
horizontal by vertical pixel count of the displayed video), consisted of three levels (i.e. 240x180,
320x240, or 480x360 pixels). Since each participant received only one video size throughout the
experiment, Video Size was a between-subjects factor. The relative dimensions for each video
size are displayed in Figure 1. The third factor, Framerate (i.e. the number of video frames
played per second), was composed of three levels (i.e. 6 FPS, 12 FPS, and 18 FPS). Framerate
was a within-subjects variable.
Insert Figure 1 about here
The bitrate for each video was held constant at 700 kbps to produce fewer compression
artifacts (i.e. higher bitrates increase the number of encoding bits/ pixel which improves image
quality) and to avoid the risk of introducing potentially confounding effects of variable image
quality.
Dependent measures
The quantitative measure used in this study was learner comprehension, which was
measured through a score of ASL fluency. Two external evaluators and one internal evaluator
viewed and rated each participant’s video performance and provided a fluency score using the
ASL Digital Video Quality 10
This DRAFT copy is provided only for reference. The definitive final version of this paper is available on the publisher’s site.
ASL-CBM rating system. The mean of the three evaluators’ scores provided an overall fluency
rating for each story-retell test. The evaluators, all ASL communication specialists, received
training prior to conducting evaluations of the student performances. Training continued until
inter-rater reliability of .90 was reached on 5 sample video performances.
Data analysis
A three-way mixed analysis of variance (ANOVA) was used to analyze the learner
comprehension scores from each story-retell test. Estimated marginal means and Tukey tests
were used for follow-up analysis. For all quantitative analyses, alpha was set at .05.
Procedures
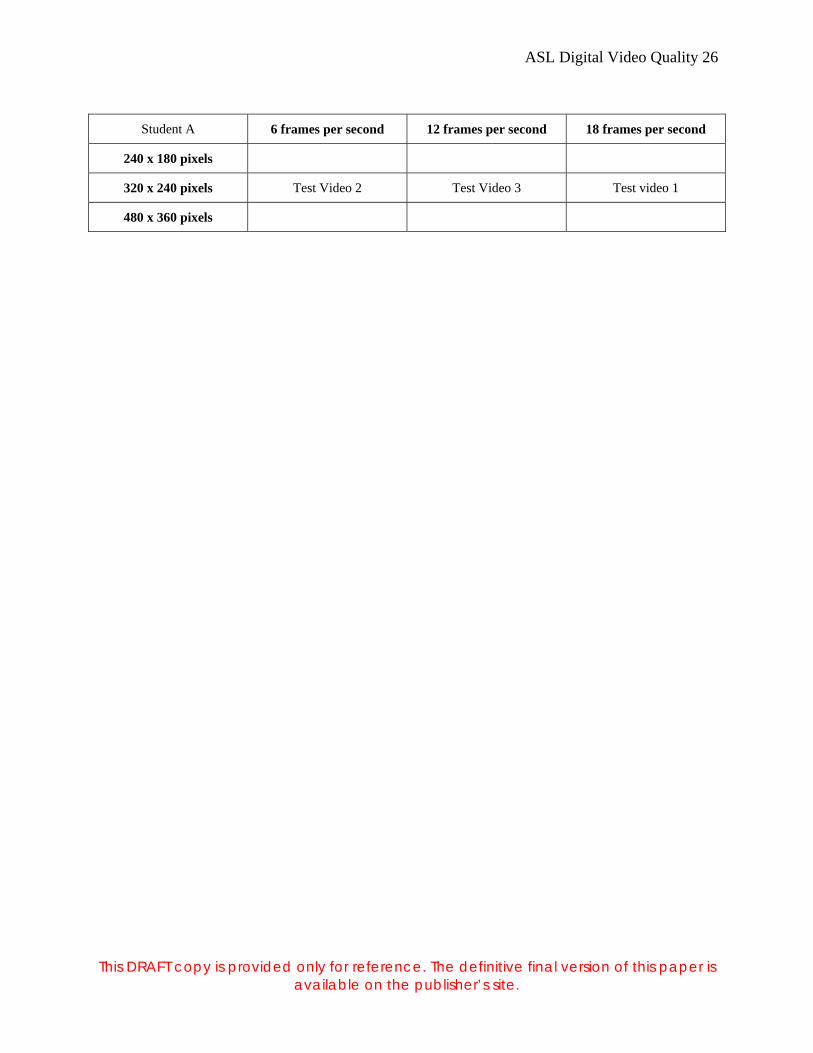
Participants were assigned randomly to one of the three video size treatments for the
entirety of the test. Participants completed three story-retell tests using the ASL assessment
software. The testing software generated a random order in which the three test videos were
played (i.e. at each of the three framerate treatments) (see Figure 2) and students’ performances
were captured and archived for evaluation.
Insert Figure 2 about here
Results
In this section, we report the results of the learner comprehension scores generated within
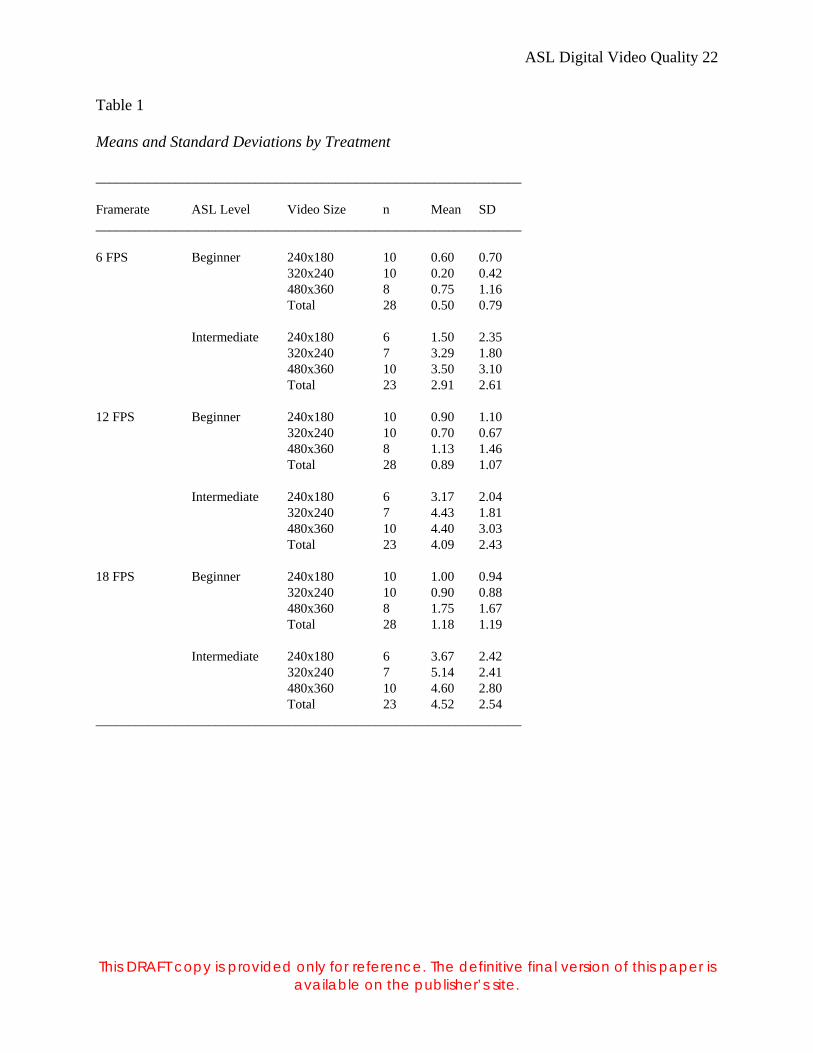
each treatment. Table 1 presents the means and standard deviations for each of the video size and
framerate treatment groups.
Insert Table 1 about here
Main Effects
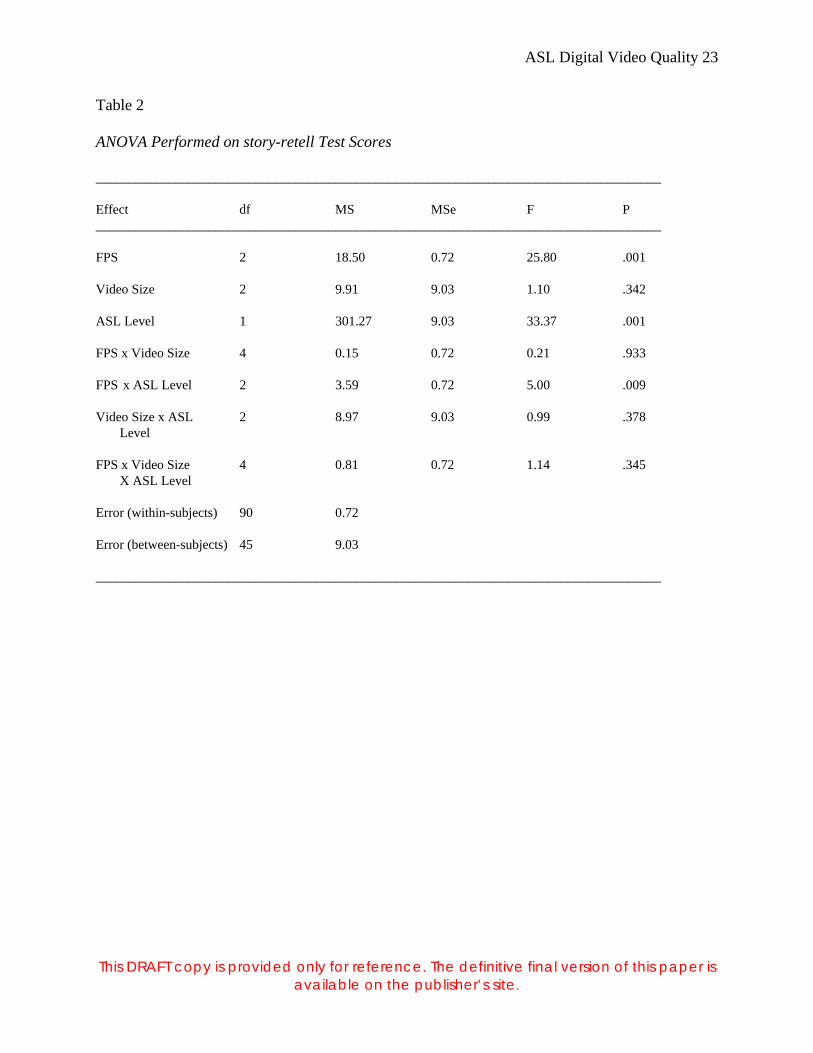
ANOVA indicated a significant effect for Framerate F (2, 90) = 25.80, MS = 18.50, MSe
= 0.72, p < .01. Follow-up contrasts (i.e. paired t-tests) comparing the means of Treatment 1 (6
ASL Digital Video Quality 11
This DRAFT copy is provided only for reference. The definitive final version of this paper is available on the publisher’s site.
FPS) and Treatment 2 (12 FPS), the means of Treatment 1 and Treatment 3 (18 FPS), and the
means of Treatment 2 and Treatment 3 were all significantly different. Participants scored higher
at 18 FPS (M =2.69) than at 12 FPS (M =2.33) and participants scored higher at 12 FPS than at 6
FPS (M =1.59).
A significant effect was found for ASL Level F (1, 45) = 33.37, MS = 301.27, MSe =
9.03, p < .01. Participants scored higher in the Intermediate (M =2.91) than in the Beginner level
(M =0.5). No significant difference was found for Video Size F (2, 45) = 1.10, MS = 9.91, MSe =
9.03, p = .34.
Interaction effects
The interaction between Framerate and ASL level was also significant F (2, 90) = 5.00,
MS = 3.59, MSe = 0.72, p < .01. On both Intermediate and Beginner levels, participants scored
higher at 12 FPS than 6 FPS and at 18 FPS than at 6 FPS, however, the contrasts between 12 and
18 FPS were not significant. The interaction between Video Size and Framerate F (4, 90) = 0.21,
MS = 0.15, MSe = 0.72, p = .93 and the interaction between Video Size and ASL Level F (2, 45)
= 0.99, MS = 8.97, MSe = 9.03, p = .38 were not significant. The three-way interaction between
Framerate, Video Size, and ASL Level F (4, 90) = 1.14, MS = 0.81, MSe = 0.72, p = .35 was not
significant.
Insert Tables 2 & 3 about here
Discussion
In this section we summarize the primary findings from the study, consider the
implications for designing and developing ASL assessment environments, and recommend future
research of digital-video quality standards for ASL assessment and communication.
ASL Digital Video Quality 12
This DRAFT copy is provided only for reference. The definitive final version of this paper is available on the publisher’s site.
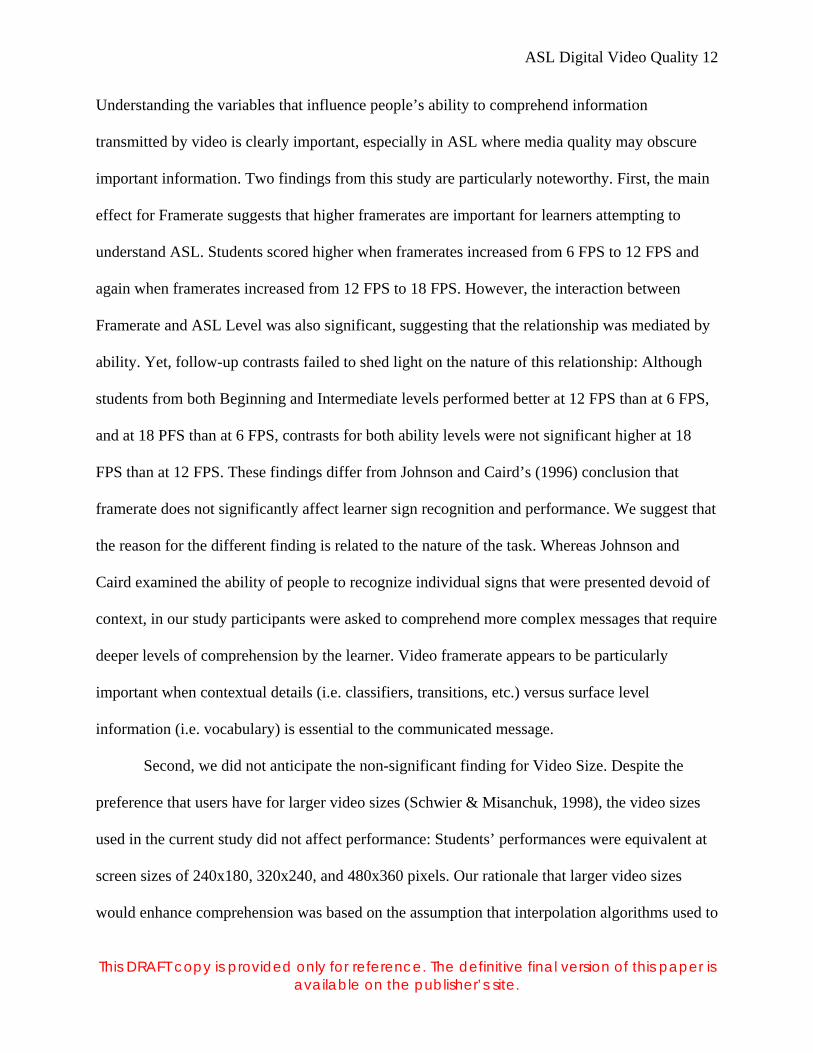
Understanding the variables that influence people’s ability to comprehend information
transmitted by video is clearly important, especially in ASL where media quality may obscure
important information. Two findings from this study are particularly noteworthy. First, the main
effect for Framerate suggests that higher framerates are important for learners attempting to
understand ASL. Students scored higher when framerates increased from 6 FPS to 12 FPS and
again when framerates increased from 12 FPS to 18 FPS. However, the interaction between
Framerate and ASL Level was also significant, suggesting that the relationship was mediated by
ability. Yet, follow-up contrasts failed to shed light on the nature of this relationship: Although
students from both Beginning and Intermediate levels performed better at 12 FPS than at 6 FPS,
and at 18 PFS than at 6 FPS, contrasts for both ability levels were not significant higher at 18
FPS than at 12 FPS. These findings differ from Johnson and Caird’s (1996) conclusion that
framerate does not significantly affect learner sign recognition and performance. We suggest that
the reason for the different finding is related to the nature of the task. Whereas Johnson and
Caird examined the ability of people to recognize individual signs that were presented devoid of
context, in our study participants were asked to comprehend more complex messages that require
deeper levels of comprehension by the learner. Video framerate appears to be particularly
important when contextual details (i.e. classifiers, transitions, etc.) versus surface level
information (i.e. vocabulary) is essential to the communicated message.
Second, we did not anticipate the non-significant finding for Video Size. Despite the
preference that users have for larger video sizes (Schwier & Misanchuk, 1998), the video sizes
used in the current study did not affect performance: Students’ performances were equivalent at
screen sizes of 240x180, 320x240, and 480x360 pixels. Our rationale that larger video sizes
would enhance comprehension was based on the assumption that interpolation algorithms used to
ASL Digital Video Quality 13
This DRAFT copy is provided only for reference. The definitive final version of this paper is available on the publisher’s site.
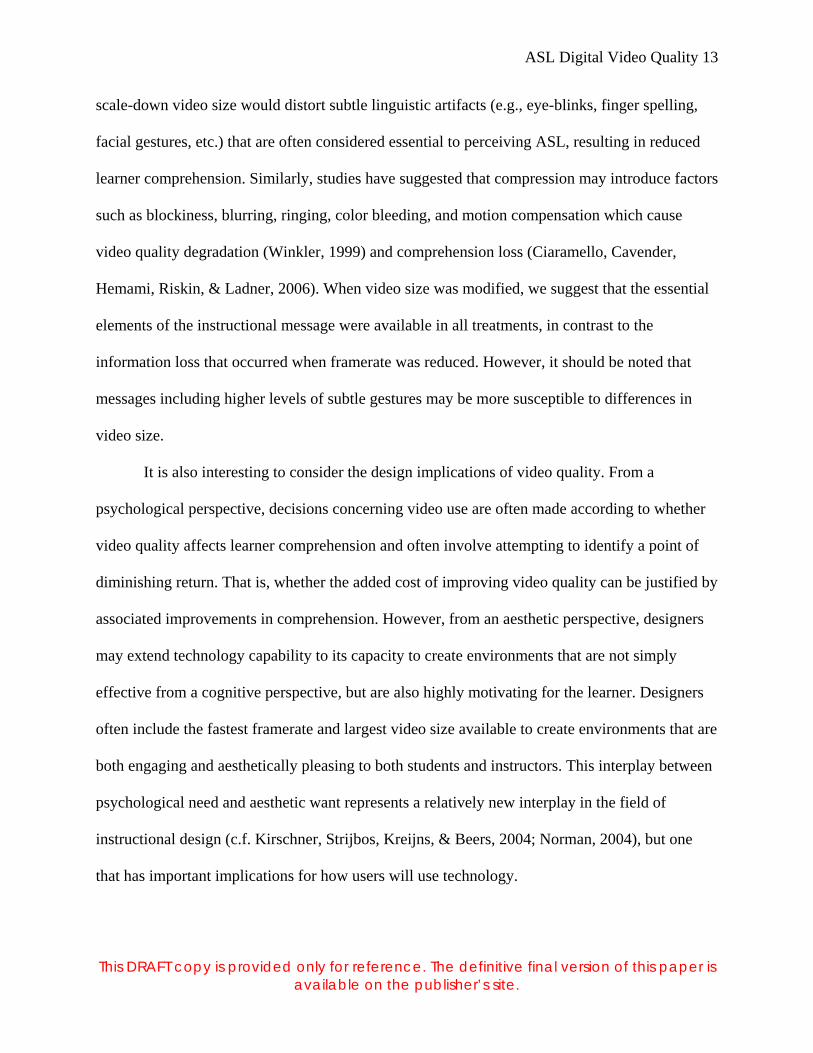
scale-down video size would distort subtle linguistic artifacts (e.g., eye-blinks, finger spelling,
facial gestures, etc.) that are often considered essential to perceiving ASL, resulting in reduced
learner comprehension. Similarly, studies have suggested that compression may introduce factors
such as blockiness, blurring, ringing, color bleeding, and motion compensation which cause
video quality degradation (Winkler, 1999) and comprehension loss (Ciaramello, Cavender,
Hemami, Riskin, & Ladner, 2006). When video size was modified, we suggest that the essential
elements of the instructional message were available in all treatments, in contrast to the
information loss that occurred when framerate was reduced. However, it should be noted that
messages including higher levels of subtle gestures may be more susceptible to differences in
video size.
It is also interesting to consider the design implications of video quality. From a
psychological perspective, decisions concerning video use are often made according to whether
video quality affects learner comprehension and often involve attempting to identify a point of
diminishing return. That is, whether the added cost of improving video quality can be justified by
associated improvements in comprehension. However, from an aesthetic perspective, designers
may extend technology capability to its capacity to create environments that are not simply
effective from a cognitive perspective, but are also highly motivating for the learner. Designers
often include the fastest framerate and largest video size available to create environments that are
both engaging and aesthetically pleasing to both students and instructors. This interplay between
psychological need and aesthetic want represents a relatively new interplay in the field of
instructional design (c.f. Kirschner, Strijbos, Kreijns, & Beers, 2004; Norman, 2004), but one
that has important implications for how users will use technology.
ASL Digital Video Quality 14
This DRAFT copy is provided only for reference. The definitive final version of this paper is available on the publisher’s site.
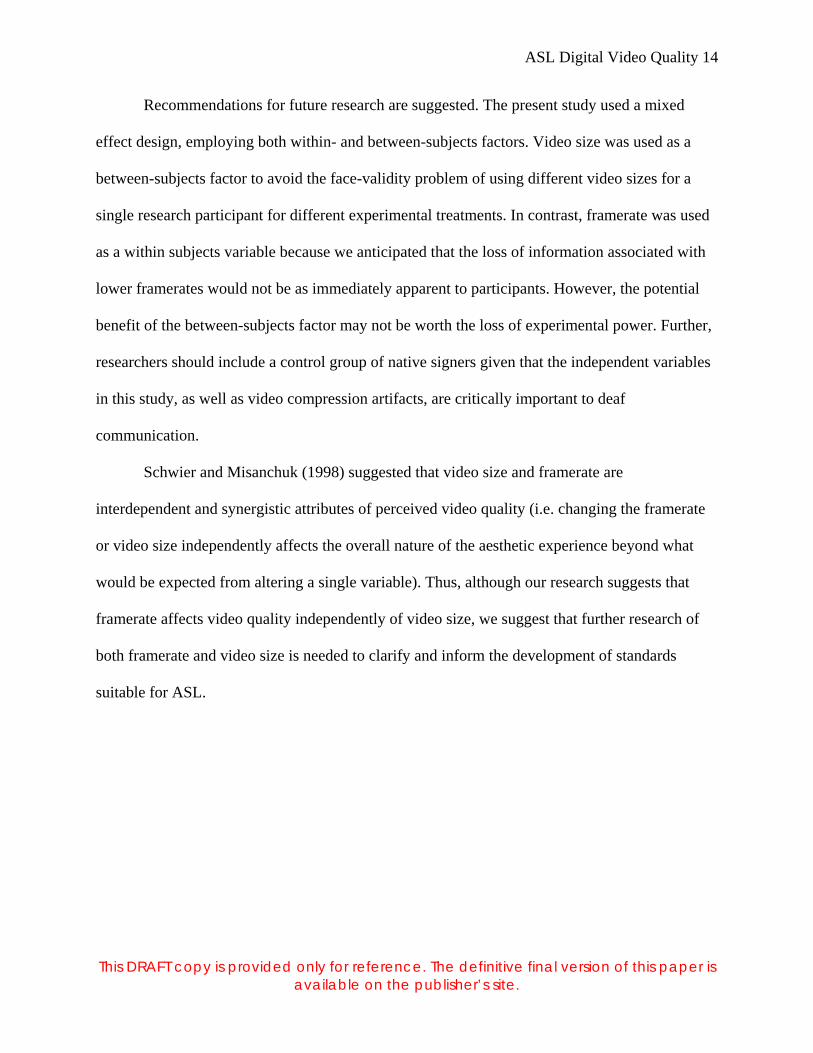
Recommendations for future research are suggested. The present study used a mixed
effect design, employing both within- and between-subjects factors. Video size was used as a
between-subjects factor to avoid the face-validity problem of using different video sizes for a
single research participant for different experimental treatments. In contrast, framerate was used
as a within subjects variable because we anticipated that the loss of information associated with
lower framerates would not be as immediately apparent to participants. However, the potential
benefit of the between-subjects factor may not be worth the loss of experimental power. Further,
researchers should include a control group of native signers given that the independent variables
in this study, as well as video compression artifacts, are critically important to deaf
communication.
Schwier and Misanchuk (1998) suggested that video size and framerate are
interdependent and synergistic attributes of perceived video quality (i.e. changing the framerate
or video size independently affects the overall nature of the aesthetic experience beyond what
would be expected from altering a single variable). Thus, although our research suggests that
framerate affects video quality independently of video size, we suggest that further research of
both framerate and video size is needed to clarify and inform the development of standards
suitable for ASL.
ASL Digital Video Quality 15
This DRAFT copy is provided only for reference. The definitive final version of this paper is available on the publisher’s site.
References
Ciaramello, F., Cavender, A., Hemami, S., Riskin, E., & Ladner, R. 2006, January. Predicting
intelligibility of compressed American Sign Language video with objective quality
metrics. International Workshop on Video Processing and Quality Metrics for Consumer
Electronics, USA.
Deno, S. 1985. Curriculum-based measurement: The emerging alternative. Exceptional Children,
52(3), 219-232.
Johnson, B., & Caird, J. 1996. The effect of frame rate and video information redundancy on the
perceptual learning of American Sign Language gestures. Proceedings of the Conference
on Human Factors in Computing Systems, British Columbia, Canada,
121-122.
Keating, E., and Mirus, G. 2003. American Sign Language in virtual space: Interactions between
deaf users of computer-mediated video communication and the impact of technology on
language practices, Language in Society, 32(5), 693-714.
Kemp, M. 1998. Why is learning American Sign Language a challenge? American Annals of the
Deaf, 143(3), 255-259.
Kirschner, P., Strijbos, J.-W., Kreijns, K., and Beers, P. J. In press. Designing electronic
collaborative learning environments. Educational Technology Research & Development,
52(3), 47-66.
Library of Congress. 2005. Sustainability of digital formats. Retrieved February 3, 2006 from
http://www.digitalpreservation.gov/formats/content/video_curator.shtml
ASL Digital Video Quality 16
This DRAFT copy is provided only for reference. The definitive final version of this paper is available on the publisher’s site.
Macromedia. 2003. Video strategies for Macromedia Flash websites. Flash Technotes. Retrieved
January 3, 2006 from
http://www.macromedia.com/cfusion/knowledgebase/index.cfm?id=tn_14571
Newell, W., and Caccamise, F. 1992. Sign Communication Proficiency Interview (SCPI)
manual: Rating scale. Faribault, MN: Minnesota Resource Center for the Deaf and Hard
of Hearing.
Norman, D. 2004. Emotional design: Why we love (or hate) everyday things. New York: Basic
Books.
Reed, C., Delhorne, L., Durlach, N., and Fischer, S. 1990. A study of tactual and visual reception
of fingerspelling, Journal of Speech and Hearing Research, 33(4), 786-797.
Schick, B., and Williams, K. 2005. Classroom Interpreting. The Educational Interpreters
Performance Assessment. Retrieved January 3, 2006 from
http://www.classroominterpreting.org/EIPA/performance/rating.asp
Schwier, R., and Misanchuk, E. 1998. An investigation of the perceived quality of digital media:
Research and research design issues. Canadian Journal of Educational Communication,
26(2), 87-106.
Welles, E. 2004. Foreign language enrollments in United States institutions of higher education,
ADFL Bulletin, 35(3), 7-26.
Wilbers, S. 1987. The case for recognizing American Sign Language, The College Board
Review, 145, 6-30.
Wilcox, S. 2004. American Sign Language as a foreign language. Retrieved January 3, 2006
from http://www.unm.edu/~wilcox/ASLFL/aslfl.html

ASL Digital Video Quality 17
This DRAFT copy is provided only for reference. The definitive final version of this paper is available on the publisher’s site.
Winkler, S. 1999. Issues in Vision Modeling for Perceptual Video Quality Assessment. Signal
Processing, 78(2), 231–252.
ASL Digital Video Quality 18
This DRAFT copy is provided only for reference. The definitive final version of this paper is available on the publisher’s site.
Author Note
This research was supported in part by grants from the Fund for the Improvement of
Postsecondary Education (FIPSE), U.S. Department of Education. However, these contents do
not necessarily represent the policy of the Department of Education, and you should not assume
endorsement by the Federal Government.
The authors would like to thank Diane F. Holte and Rania J. Johnson for their assistance
in conducting this study.
Correspondence concerning this article should be addressed to Simon Hooper,
Department of Curriculum and Instruction, University of Minnesota, 130B Peik Hall, 157
Pillsbury Drive SE, Minneapolis, MN, 55455. E-mail: [email protected].
ASL Digital Video Quality 19
This DRAFT copy is provided only for reference. The definitive final version of this paper is available on the publisher’s site.
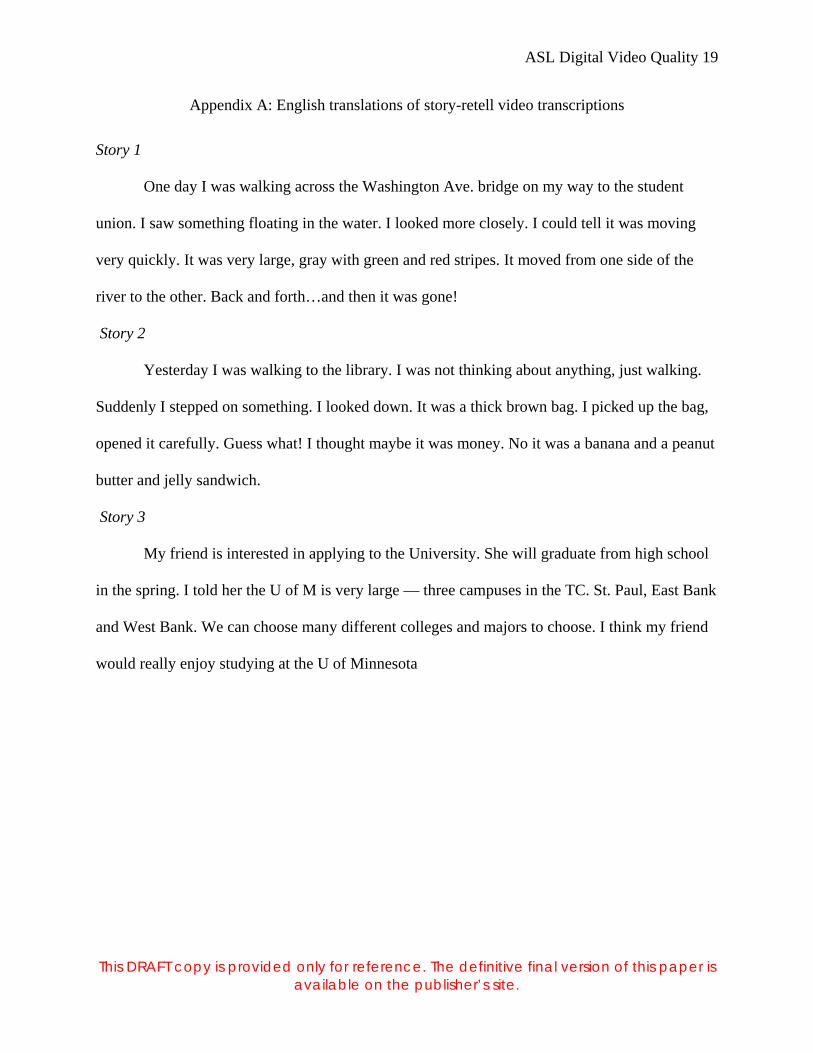
Appendix A: English translations of story-retell video transcriptions
Story 1
One day I was walking across the Washington Ave. bridge on my way to the student
union. I saw something floating in the water. I looked more closely. I could tell it was moving
very quickly. It was very large, gray with green and red stripes. It moved from one side of the
river to the other. Back and forth…and then it was gone!
Story 2
Yesterday I was walking to the library. I was not thinking about anything, just walking.
Suddenly I stepped on something. I looked down. It was a thick brown bag. I picked up the bag,
opened it carefully. Guess what! I thought maybe it was money. No it was a banana and a peanut
butter and jelly sandwich.
Story 3
My friend is interested in applying to the University. She will graduate from high school
in the spring. I told her the U of M is very large — three campuses in the TC. St. Paul, East Bank
and West Bank. We can choose many different colleges and majors to choose. I think my friend
would really enjoy studying at the U of Minnesota
ASL Digital Video Quality 20
This DRAFT copy is provided only for reference. The definitive final version of this paper is available on the publisher’s site.
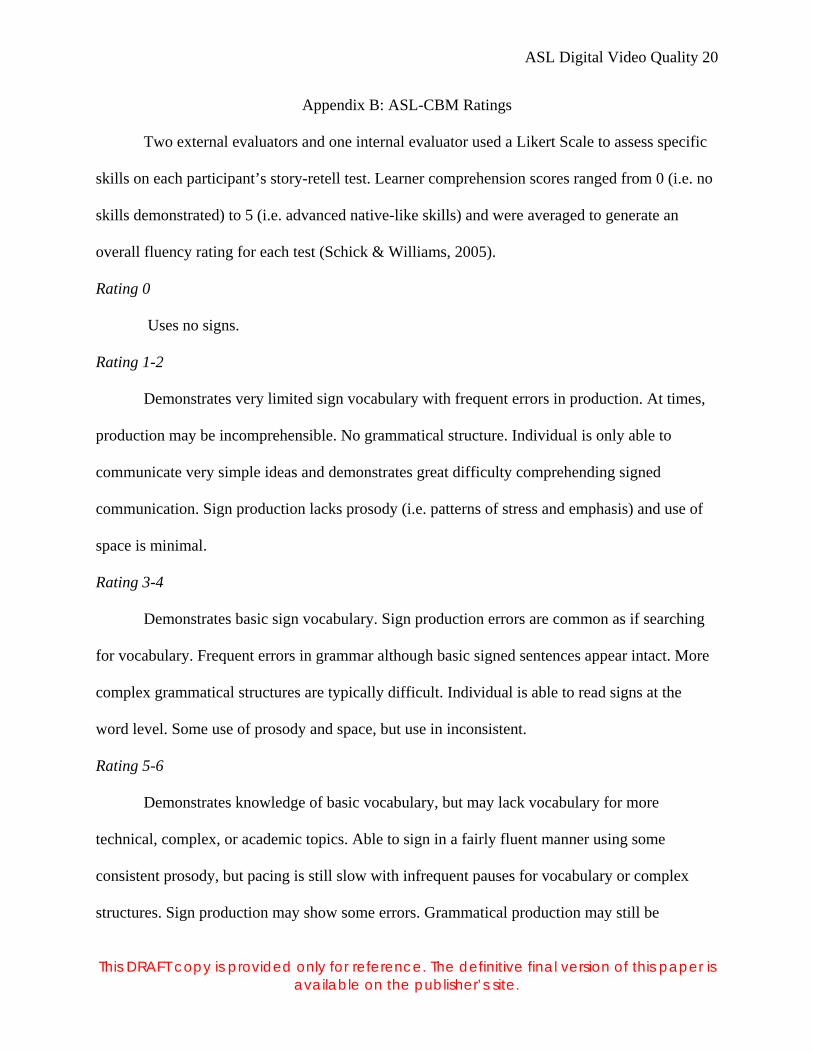
Appendix B: ASL-CBM Ratings
Two external evaluators and one internal evaluator used a Likert Scale to assess specific
skills on each participant’s story-retell test. Learner comprehension scores ranged from 0 (i.e. no
skills demonstrated) to 5 (i.e. advanced native-like skills) and were averaged to generate an
overall fluency rating for each test (Schick & Williams, 2005).
Rating 0
Uses no signs.
Rating 1-2
Demonstrates very limited sign vocabulary with frequent errors in production. At times,
production may be incomprehensible. No grammatical structure. Individual is only able to
communicate very simple ideas and demonstrates great difficulty comprehending signed
communication. Sign production lacks prosody (i.e. patterns of stress and emphasis) and use of
space is minimal.
Rating 3-4
Demonstrates basic sign vocabulary. Sign production errors are common as if searching
for vocabulary. Frequent errors in grammar although basic signed sentences appear intact. More
complex grammatical structures are typically difficult. Individual is able to read signs at the
word level. Some use of prosody and space, but use in inconsistent.
Rating 5-6
Demonstrates knowledge of basic vocabulary, but may lack vocabulary for more
technical, complex, or academic topics. Able to sign in a fairly fluent manner using some
consistent prosody, but pacing is still slow with infrequent pauses for vocabulary or complex
structures. Sign production may show some errors. Grammatical production may still be
ASL Digital Video Quality 21
This DRAFT copy is provided only for reference. The definitive final version of this paper is available on the publisher’s site.
incorrect, especially for complex structures, but is in general, intact for routine and simple
language. Comprehends signed messages but may lack the original message.
Rating 7-8
Demonstrates broad use of vocabulary with sign production generally correct.
Demonstrates good strategies for conveying information when a specific sign is not in their
vocabulary. Grammatical constructions are generally clear and consistent, but complex
information may still pose occasional problems. Prosody is good, with appropriate facial
expression most of the time. Fluency may deteriorate when rate or complexity of communication
increases. Uses space consistently most of the time, but complex constructions or extended use
of discourse comprehension may still pose problems. Comprehension of most signed messages at
a normal rate is good but translation may lack some complexity of the original message.
Rating 9-10
Demonstrates broad and fluent use of vocabulary, with strategies for creating and
communicating new words. Sign production errors are minimal and never interfere with
comprehension. Prosody is correct for grammatical, non-verbal markers, and affective purposes.
Complex grammatical constructions are typically not a problem. Comprehension of signed
messages is very good, communicating all details of the original message.
ASL Digital Video Quality 22
This DRAFT copy is provided only for reference. The definitive final version of this paper is available on the publisher’s site.
Table 1
Means and Standard Deviations by Treatment
________________________________________________________________ Framerate ASL Level Video Size n Mean SD ________________________________________________________________ 6 FPS Beginner 240x180 10 0.60 0.70 320x240 10 0.20 0.42 480x360 8 0.75 1.16 Total 28 0.50 0.79 Intermediate 240x180 6 1.50 2.35 320x240 7 3.29 1.80 480x360 10 3.50 3.10 Total 23 2.91 2.61 12 FPS Beginner 240x180 10 0.90 1.10 320x240 10 0.70 0.67 480x360 8 1.13 1.46 Total 28 0.89 1.07 Intermediate 240x180 6 3.17 2.04 320x240 7 4.43 1.81 480x360 10 4.40 3.03 Total 23 4.09 2.43 18 FPS Beginner 240x180 10 1.00 0.94 320x240 10 0.90 0.88 480x360 8 1.75 1.67 Total 28 1.18 1.19 Intermediate 240x180 6 3.67 2.42 320x240 7 5.14 2.41 480x360 10 4.60 2.80 Total 23 4.52 2.54 ________________________________________________________________
ASL Digital Video Quality 23
This DRAFT copy is provided only for reference. The definitive final version of this paper is available on the publisher’s site.
Table 2
ANOVA Performed on story-retell Test Scores
_____________________________________________________________________________________ Effect df MS MSe F P _____________________________________________________________________________________ FPS 2 18.50 0.72 25.80 .001 Video Size 2 9.91 9.03 1.10 .342 ASL Level 1 301.27 9.03 33.37 .001 FPS x Video Size 4 0.15 0.72 0.21 .933 FPS x ASL Level 2 3.59 0.72 5.00 .009 Video Size x ASL 2 8.97 9.03 0.99 .378 Level FPS x Video Size 4 0.81 0.72 1.14 .345 X ASL Level Error (within-subjects) 90 0.72 Error (between-subjects) 45 9.03 _____________________________________________________________________________________
ASL Digital Video Quality 24
This DRAFT copy is provided only for reference. The definitive final version of this paper is available on the publisher’s site.
Figure Captions
Figure 1. A comparison of video size treatments (dimensions relative to 480x360 size).
Figure 2. Story-retell treatment example for sample student A.
ASL Digital Video Quality 25
This DRAFT copy is provided only for reference. The definitive final version of this paper is available on the publisher’s site.
ASL Digital Video Quality 26
This DRAFT copy is provided only for reference. The definitive final version of this paper is available on the publisher’s site.
Student A 6 frames per second 12 frames per second 18 frames per second
240 x 180 pixels
320 x 240 pixels Test Video 2 Test Video 3 Test video 1
480 x 360 pixels