Embed Size (px)
Citation preview
1
Asphaltene Adsorption on Quartz Sand in the Presence of Pre-
adsorbed Water
Valeska Gonzalez, Spencer E. Taylor*
Centre for Petroleum and Surface Chemistry, Department of Chemistry, University of Surrey,
Guildford, Surrey GU2 7XH, UK
Abstract
Background and hypothesis. In the oil industry, asphaltenes are known for their tendency to
aggregate in solution and to deposit on surfaces, with both properties being connected with
operational problems associated with recovery, production and refining. Interactions
involving asphaltenes and other crude oil components have been a major aspect of
investigation in attempting to understand the full nature of these problems. Water is
implicated in asphaltene behaviour in solution, for example, where it has been found to delay
the deposition of asphaltene aggregates. At interfaces, there is evidence that water-in-crude
oil emulsion stability is enhanced through asphaltene-water interactions, and there have been
a few reports that asphaltene adsorption on mineral surfaces is reduced in the presence of
water. We consider the latter aspect, because the instances of reduced adsorption to date have
not attempted to quantify the effect. Previous studies showed that vapor-phase adsorption of
organic molecules is reduced in the presence of pre-adsorbed water and we were interested to
determine whether the same is true for liquid-phase adsorption of asphaltenes.
Experiments. The surface of quartz sand was controlled by pre-adsorption of water from
different relative humidity (RH) environments as the water adsorption isotherm is known
from previous studies. These pre-conditioned sand samples were used as substrates for the

2
adsorption from toluene solutions of n-heptane-precipitated asphaltenes (C7A) from an
Athabasca oil sands bitumen. To supplement the adsorption behavior, atomic force
microscopy (AFM) images were taken of the resultant sand grains at 0 and 80% RH, and
low-field NMR was used to estimate the sand wettability.
Findings. Asphaltene adsorption on sand is sensitive to surface-adsorbed water, with 4-fold
reduction in adsorption when increasing the RH from 0 to 100%. This is in general agreement
with previous vapor-phase adsorption of small organic molecules, and is therefore believed to
be the first demonstration of the effect of pre-adsorbed water on adsorption from solution.
Asphaltene adsorption as a function of RH is the converse of literature water adsorption
isotherm data. Three asphaltene adsorption regions have been tentatively identified based on
water adsorption behavior and the literature interpretation of water structure on quartz: the
highest asphaltene adsorption occurs at very low RH, decreasing to a near-constant value in
the range 40-80% RH, followed by a rapid decrease beyond 80% RH. Further analysis
strongly suggests that asphaltene adsorption decreases linearly with the thickness of the
adsorbed water film. The effects of RH on asphaltene adsorption are also reflected in AFM
images and NMR wettability results.
Keywords: Adsorption isotherms; AFM; asphaltene; oil sand; NMR; quartz sand; relative
humidity

3
1. Introduction
Asphaltenes are separated from crude and residual oils by precipitation with alkane solvents.
They are a heterogeneous class of molecules which contrast sharply in polarity and structure
from the majority of the crude oil components, which accounts for their predisposition to
self-aggregation and adsorption at surfaces. In practice, this leads to undesirable
consequences, amongst which are deposition and wettability modification during crude oil
extraction, production and refining.
A typical chemical analysis of a petroleum asphaltene is 80% C, 8% H and 12%
heteroatoms (O, N and S), with minor contributions from coordinated heavy metals. The
asphaltene skeleton consists of a planar polycyclic aromatic ‘nucleus’ with varying degrees of
aliphatic and alicyclic hydrocarbon substitution. The heteroatoms are variously distributed
throughout the structure depending on the crude oil source and provide an intrinsic degree of
surface activity.
Although asphaltenes are not surface-active to the same extent as classical surfactants, they
do share the properties of self-aggregation and adsorption at different surfaces, including
water [1].
Since water is known to be an integral part of all crude oil reservoirs, it cannot be ignored
when considering surface and colloid chemical aspects of crude oil recovery and processing.
Workers in this field will be particularly familiar with the presence of water as a discrete
phase in water-in-crude oil emulsions, owing to the necessity to dehydrate the oil before it
can be exported or refined. For this reason, systems containing water dispersed as
microscopic droplets in crude oil are now relatively well understood, and adsorption of
asphaltenes at the oil/water interface is considered to be an important emulsion stabilization
mechanism, since despite only a modest reduction in oil/water interfacial tension, strong

4
interfacial films develop over time [2-4]. It is possible that water plays an active role during
asphaltene stabilization of macroscopic w/o interfaces, promoting the formation of asphaltene
networks [5]. Irreversibly-adsorbed films of this type produce viscoelastic barriers which
enhance the kinetic stability of water-in-crude oil emulsions [6] and are seen at aqueous
interfaces of retracted pendant drops of crude oil [7] and asphaltene solutions in toluene [6,8].
Self-aggregation, whether at interfaces or in solution, is understood to result from -
stacking of the asphaltene polycyclic aromatic regions [9], although electrostatic and H-
bonding contributions involving water have also been identified in model asphaltene systems
[10-12]. This latter view supports other results from simulation and experiment, that low
water concentrations promote asphaltene nanoaggregation in toluene solution [13], which is
suggested to involve intermolecular H-bonded water bridges and asphaltene heteroatoms, e.g.
[A1O····H-O-H····NA2] or similar (the subscripts denoting different asphaltene molecules).
Likewise, solubilization of water in toluene increases in the presence of dissolved
asphaltenes [14,15]. However, the counterintuitive finding that the adsorption capacity
decreases with increasing asphaltene concentration has been explained by Andersen and
coworkers as indicative of water binding to polar sites on the exterior of asphaltene
nanoaggregates [15].
From the foregoing it appears that there are a number of examples where asphaltene/water
interactions are implicated in the behavior of crude oils, and for which further understanding
at the molecular or nano-scale is required. The present work considers a particular example of
this, namely the effect of water on asphaltene adsorption on quartz sand. Although our
interest stemmed originally from the structure of oil sands, it will be relevant to sandstone
reservoirs in general. In the case of oil sands, however, the structure has long been thought of

5
as consisting of bitumen separated from the sand surface by a thin (few nm) layer of water
[16-19].
In such systems, it is important to understand how the presence of water might affect the
adsorption behavior of crude oil components, such as asphaltenes. It is generally considered
[20,21] that deposition of asphaltenes on mineral surfaces is an important mechanism to
explain wettability changes occurring in the reservoir [22-24], with the most polar asphaltene
fractions showing the greatest effects [25]. This is significant, since understanding the
factors that affect reservoir wettability, including the effect of water, should aid efforts to
improve crude oil recovery.
Asphaltenes adsorb at solid surfaces [1], essentially to produce monolayers of
nanoaggregates, the latter comprising stacks of 6 asphaltene molecules, according to the
Yen-Mullins aggregation model [26]; further aggregation of nanoaggregates to form clusters
at sufficiently high concentrations leads to thicker adsorbed layers [27,28]. According to
Adams’ comprehensive review on asphaltene adsorption, by assuming 3 nm asphaltene
(nano)aggregates with a density of 1200 kg/m3, the maximum surface coverage for an
asphaltene monolayer is calculated to be 3.6 mg/m2 [1]. The same review included a brief
discussion of the effects of water on asphaltene adsorption on mineral surfaces, with the
conclusion that water reduced adsorption due to competition for surface sites.
Here, we focus on this aspect in particular. Collins and Melrose were the first to question
whether the presence of water on mineral surfaces would modify asphaltene adsorption [17].
They found that for kaolinite, asphaltene adsorption decreased from 30 mg/g (dry clay) to 22
and 13 mg/g after the pre-addition of 2.3 and 6.6% water, respectively [17]. Saada et al. [29]
concluded that asphaltene adsorption from water-saturated toluene onto the clays kaolinite
and illite is related to differences in clay hydrophilicity – the more hydrophilic the clay

6
(illite), the lower was asphaltene adsorption. Previously, Menon and Wasan [30] reached a
similar conclusion for sodium montmorillonite, for which asphaltene adsorption was reduced
significantly on this hydrophilic clay in the presence of pre-adsorbed water. Alipour Tabrizy
et al. [31] found that the effects of humidity (‘dry’ versus ‘wet’) on asphaltene adsorption
were different for calcite, quartz and kaolinite. Adsorption increased by 60% for calcite,
whereas quartz and kaolinite showed decreases of 23% and 16%, respectively.
Similar effects were found by Daughney [32] who found that adsorption of crude oil from
toluene/heptane mixtures on powdered quartz was reduced in the presence of excess aqueous
phases (each with a different pH).
In the present paper, our main aim is to determine the role of pre-adsorbed water on
asphaltene adsorption on quartz sand, the surface hydration of which is controlled by
conditioning to different relative humidity (RH) conditions. Goss determined the adsorption
isotherm for water on quartz sand as a function of RH [33]. In a subsequent study [34], the
presence of adsorbed water films was shown to reduce the adsorption of small organic
molecules from the vapor phase. An “exponential decrease” in adsorption on hydrophilic
mineral surfaces was found to occur between 40 and 97% RH, coinciding with growth of the
adsorbed water film [34]. It was therefore of interest to establish whether the adsorption of n-
heptane-precipitated asphaltene (designated C7A) from toluene solution is affected in a
similar way. We also include AFM imaging and NMR wettability measurements on the
treated sand to complement the adsorption results.
7
2. Experimental
2.1 Materials
The source of n-heptane precipitated asphaltenes (C7A) was a sample of preserved (frozen)
oil sands core from the Terre de Grace lease area in Alberta, Canada, kindly supplied by BP
Canada. Solvents used (n-heptane, toluene) were AnalaR Grade from Fisher Scientific, UK.
Toluene for adsorption experiments was dried to < 5 ppm water (Mettler-Toledo C-20
Coulometric Karl-Fisher titrator) using a PureSolv Micro solvent purification system (Inert
Technology Inc. MA, USA) which employs dry nitrogen to push toluene at room temperature
through a 304 type stainless steel column containing alumina. The quartz sand used for the
adsorption experiments, herein referred to as “ambient sand”, was from Sigma-Aldrich, UK.
This product was identified for study on the basis of its similar size distribution (particle size
50-70#, mean particle diameter 250 m) as the original core (see later), but without
potential interference from surface contamination from bitumen components remaining from
cleaning procedures. BET surface area analysis was made using a Belsorp-Mini II (Bel Japan
Inc.) using nitrogen as the sorption gas. The sample was degassed using a Belprep II at
150 C for 8 hours, with negligible moisture being removed. The salts used to generate the
RH environments from saturated aqueous solutions, (NH4)2SO4, Mg(NO3)2, and MgCl2, were
obtained from Sigma-Aldrich, UK.
2.2 Methods
2.2.1 Preparation of n-heptane-precipitated asphaltene

8
Initially, samples of freshly thawed core were dried for several days to constant weight at a
moderate temperature (60 C) to remove water. Bitumen was then extracted from a weighed
sample by Soxhlet extraction using toluene as solvent. Once extraction was complete and the
toluene ran clear from the Soxhlet thimble, the apparatus was disassembled, the thimble
removed and the small amount of solvent remaining was removed in a stream of dry nitrogen.
The particle size distribution of the solids was then determined by micro-sieve analysis. The
bitumen solution was filtered (Whatman #1 filter paper) into a glass beaker, and after the
majority of the solvent had been removed by evaporation, approximately 40 volumes of n-
heptane added to the remaining toluene/bitumen mixture, which was stirred thoroughly for
12 h to allow complete destabilization of the asphaltenes (C7A). The mixture was then
vacuum-filtered (Whatman #1 filter paper) to produce solid C7A and the corresponding
maltene fraction (C7M), which was recovered after rotary evaporation of the solvent. The
C7A was then re-dissolved in toluene and centrifuged (at 10,000 rpm) to sediment any
toluene-insoluble (mainly inorganic) material, and the supernatant removed for toluene
evaporation. Table 1 contains indicative compositional details of the oil sands sample used in
this study, with the corresponding particle size distribution indicating the most abundant size
fraction of the solid components shown in Fig. 1.
Table 1.
Indicative composition of the oil sand sample and extracted asphaltenes.
Component %w/w of oil sand*
Solids 87.0 0.3
Bitumen
(n-Heptane insolubles, C7A)
13.7 1.0
(10.9 0.8)**
* Analyses based on dry samples. Three replicate determinations were found to be within the
indicated limits.
** %w/w based on bitumen; asphaltene analysis: %C = 78.1; %H = 7.97; %N = 1.07.

9
Fig. 1. Particle size distribution from sieve analysis of extracted solids from the BP oil sand
sample showing the most abundant (sand) fraction.
2.2.2. Asphaltene adsorption on sand
Batch adsorption experiments were carried out by weighing the required masses of the clean
commercial sand into 50 mL polypropylene centrifuge tubes. Initially, an adsorption isotherm
was constructed under ambient conditions (22 2C and 60% RH) using untreated clean
sand in order to evaluate the form of the isotherm, and typical adsorption levels on this
substrate. Appropriate masses (0.5-5 g) of the quartz sand were weighed into the centrifuge
tubes and typically 10 mL of known concentration asphaltene solutions in as-received toluene

10
(containing 50 ppm water), prepared on a mass/volume basis was added to each. After
capping the tubes, they were equilibrated on a Stuart roller mixer for 24 hours, after which
asphaltene depletion in the centrifuged solution (Hettich Lab Technology Rotina 380
centrifuge at 10,000 rpm) was determined by UV-visible spectroscopy (Thermo Scientific
Evolution 200) from absorbance measurements at 500 nm with reference to the original
solution. We had established that the concentration-absorbance plot is linear over the working
concentration range. Experiments conducted at shorter times indicated that adsorption was
complete within the indicated equilibration period. The adsorbed amount of asphaltene ( in
mg/g) was then determined from the equation
( )
(1)
where A0 and A are the initial and final absorbances at the measurement wavelength, C0 is the
original asphaltene concentration in mg/L and V is the volume (in mL) of the asphaltene
solution equilibrated with ms g of sand.
The experimental procedure was modified for determining adsorption under the different RH
conditions. In these cases, pre-weighed aliquots of sand were equilibrated for four weeks at
22 2C in the atmosphere above saturated RH solutions contained in sealed 2-L glass jars.
Table 2 shows the salts used and the corresponding RH values of their saturated solutions.
Prior to the adsorption experiments, the asphaltene solutions were also placed in the
corresponding RH atmospheres and left overnight. Nominally ‘dry’ sand (i.e. 0% RH) was a
sample maintained in an oven at 130 C for four weeks and placed together with its
corresponding asphaltene solution in a desiccator containing silica gel desiccant 12 hours
before the start of the experiments. The sand was not subjected to higher temperatures to

11
avoid any changes to the sand structure. Water concentrations in the toluene solutions
following the pre-equilibration processes were not determined.
The adsorption experiments involved rapidly adding each asphaltene solution to the
respective vials containing the pre-equilibrated sand and immediately capping the centrifuge
tube. The tubes were then rolled for the same equilibration period as before, after which the
solutions were separated and analyzed. In these cases, the sand was retained for further
analysis.
Table 2.
Relative humidity values of the saturated salt solutions used in this study. Values are
interpolated to 22.5 C from data given by Greenspan at 20 and 25 C [35].
Salt RH (%)
None (water) 100
(NH4)2SO4 81.2 0.3
Mg(NO3)2
MgCl2
None (dry sample)
53.6 0.2
32.9 0.2
0
2.2.3 Low-field NMR wettability measurements
We were interested to assess the extent to which asphaltene adsorption had changed the
wettability of each sand sample, and to this end we used a low-field NMR approach to
quantify the distribution of water between the bulk phase and sand surface, as described
elsewhere [36].
Aliquots (0.3 g) of sand removed at the end of the adsorption experiments and dried, were
placed in separate 8 mm NMR tubes, and deionized water (0.1 g) was added to each. The

12
addition of this quantity of water ensures that the sand remains under-saturated, in order to
maximize the proportion of bound (surface) water compared to unbound (free) water.
Untreated ambient sand (i.e. sand before adsorption and expected to be naturally hydrophilic)
was also used for comparison.
Transverse relaxation time (T2) measurements were then made at ambient temperature using a
20 MHz bench-top NMR magnet (Oxford Instruments, UK) controlled by a Kea-2
spectrometer (Magritek, New Zealand). A CPMG pulse sequence [37,38] was used to
measure T2 relaxation times at regular intervals using the acquisition parameters given in
Table 3. The acquired datasets were then inverted using an ‘inverse Laplace transform’ (ILT)
algorithm in order to generate the T2 distributions. The ILT Matlab code was provided by
Victoria University (Wellington, New Zealand) [39].
Table 3.
Acquisition parameters for CPMG pulse sequence.
Parameter Value
Number of echoes 256
Echo time 20 ms
Number of scans 64
P90 6 µs (at -6.6 dB)
P180 6 µs (at -3.3 dB)
Dwell time 1 µs
Number of echo points 16

13
2.2.4 Atomic force microscopy (AFM) imaging
AFM is a technique used to produce high-resolution surface images which has been used
widely in the study of asphaltenes, e.g. [40-42]. In this study, the surfaces of sand grains
taken from post-adsorption at 0% and 81% RH were imaged using a Brüker diInnova
instrument (Brüker Corp. Santa Barbara, CA, USA) in tapping mode. A clean, ambient sand
grain was included for comparison. As is usual, the raw AFM images were imported into
Brüker’s NanoScope software for further processing.
3. Results
3.1 C7A adsorption isotherm on quartz sand
In the adsorption experiments described herein we have deliberately maintained relatively
low asphaltene concentrations, i.e. at or below the critical nanoaggregate concentration [26],
in order to avoid involvement from larger aggregates (clusters). For concentrations below the
Langmuir plateau region, the predominant species in toluene solution will be individual
asphaltene molecules or dimers [1]. Acevedo et al. [43] report that aggregation of asphaltenes
in toluene occurs at 50 mg/L and that the formation and adsorption of aggregates on the
sand surface might occur at higher concentrations.
Fig. 2 shows the adsorption isotherm for the C7A asphaltene on as-received Sigma-Aldrich
quartz sand under ambient conditions. For the asphaltene concentration range studied, the
data are satisfactorily fitted to the Langmuir isotherm,
( ) (2)
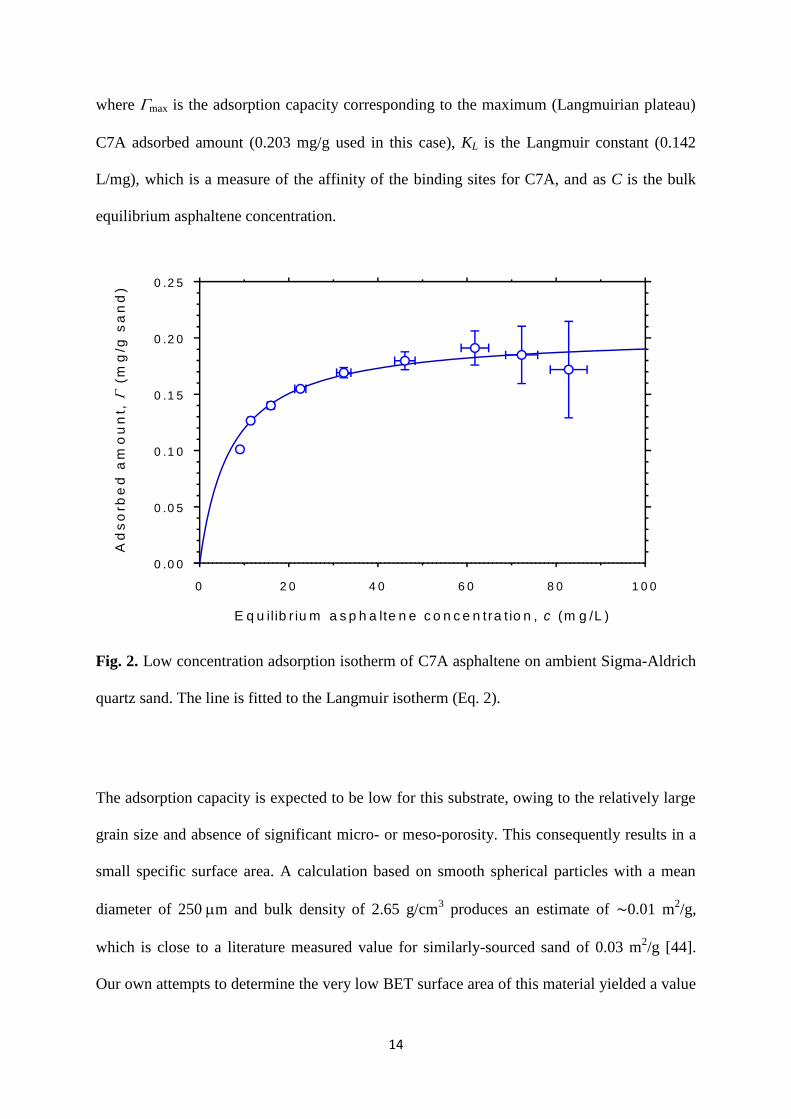
14
where max is the adsorption capacity corresponding to the maximum (Langmuirian plateau)
C7A adsorbed amount (0.203 mg/g used in this case), KL is the Langmuir constant (0.142
L/mg), which is a measure of the affinity of the binding sites for C7A, and as C is the bulk
equilibrium asphaltene concentration.
0 2 0 4 0 6 0 8 0 1 0 0
0 .0 0
0 .0 5
0 .1 0
0 .1 5
0 .2 0
0 .2 5
E q u ilib r iu m a s p h a lte n e c o n c e n tra t io n , c (m g /L )
Ad
so
rbe
d a
mo
un
t,
(m
g/g
sa
nd
)
Fig. 2. Low concentration adsorption isotherm of C7A asphaltene on ambient Sigma-Aldrich
quartz sand. The line is fitted to the Langmuir isotherm (Eq. 2).
The adsorption capacity is expected to be low for this substrate, owing to the relatively large
grain size and absence of significant micro- or meso-porosity. This consequently results in a
small specific surface area. A calculation based on smooth spherical particles with a mean
diameter of 250 m and bulk density of 2.65 g/cm3 produces an estimate of ∼0.01 m
2/g,
which is close to a literature measured value for similarly-sourced sand of 0.03 m2/g [44].
Our own attempts to determine the very low BET surface area of this material yielded a value

15
of 0.09 0.02 m2/g. Higher BET surface areas for other commercial sand samples from the
same supplier have been reported for a sieved (<200 m) size fraction (0.34 m2/g) [33], and
for an unspecified particle size (0.65 m2/g) [31], although the latter is more consistent with a
Sigma-Aldrich product with a 1-5 μm diameter range.
Therefore, by using the specific surface area for our sand fraction of 0.09 m2/g the plateau
adsorption capacity (from Fig. 2) corresponds to 2.2 mg/m2. In Adams’ survey, literature
adsorption capacity values for quartz/silica were in the range 1-7 mg/m2 depending on the
asphaltene and mineral sources as well as the method of determination [1].
By assuming an asphaltene molecular mass of 750 [26], the plateau adsorption capacity of
2.2 mg/m2 corresponds to a low average adsorbed area of 57 Å
2/molecule. However,
assuming the same asphaltene density (1200 kg/m3) as used by Adams [1], indicates an
adsorbed layer thickness of 1.8 nm. Thus, these dimensions are more consistent with
adsorption of nanoaggregates which, according to the Yen-Mullins model have sizes in the
range of 2-5 nm [1,26], rather than single molecules.
3.2 Effect of RH on C7A adsorption
Initial asphaltene concentrations in the range 135-140 mg/L were selected for the RH
experiments to allow depletion through adsorption to result in bulk concentrations which
were approximately comparable with the Langmuir plateau region in Fig. 2 determined for
ambient sand. Thus, in Fig. 3 are shown duplicate C7A asphaltene adsorption data as a
function of RH. These results show that asphaltene adsorption decreases approximately four-
fold as RH increases between 0 and 100%, which spans the highest vale region shown in Fig.

16
2. The decrease over the RH range is not uniform, however, but indicates a region, between
40-80% RH, in which adsorption remains near-constant at 0.3 mg/g.
0 5 0 1 0 0
0 .0
0 .1
0 .2
0 .3
0 .4
0 .5
0 .6
R e la t iv e h u m id ity (% )
Ad
so
rbe
d a
mo
un
t (m
g/g
sa
nd
)
Fig. 3. Plot showing adsorbed amounts of asphaltene on quartz sand as a function of RH for
two different sets of experiments. The drawn line is to guide the eye.
3.3 NMR wettability measurements
Proton T2 NMR relaxation measurements are sensitive to local proton environments. In
aqueous systems, the relaxation spectra enable the distribution of water protons in different
environments to be determined; these range from mobile bulk water, exhibiting long
relaxation times, to more restricted conditions, such as bound surface water, with shorter
relaxation times. In the present study, hydrophobic (oil-wet) surfaces with little affinity for
water would be expected to exhibit longer T2 relaxation times. Conversely, water-wet

17
hydrophilic surfaces would be expected to produce shorter relaxation times. Thus, by
measuring relaxation spectra over time, fluid-solid interactions can be monitored, thereby
enabling wettability or wettability changes to be inferred [36].
In Fig. 4 are shown T2 relaxation spectra for deionized water in contact with sand after
asphaltene adsorption at 0% and 100% RH for illustrative purposes, together with the
corresponding results for clean sand.
0 .0 1 0 .1 1 1 0
0 .0 0
0 .0 2
0 .0 4
0 .0 6
0 .0 8
R e la x a t io n t im e (s )
Am
pli
tud
e
0 % R H
1 0 0 % R HBulk water
Interfacial water
F re s h s a n d
Fig. 4. T2 relaxation spectra for deionized water in contact with asphaltene-coated sand
produced at 0% RH (dashed line) and 100% RH (dot-dashed line). For comparison, deionized
water in contact with fresh sand is also shown (continuous line).
It can be seen that for the hydrophilic fresh sand, the relaxation spectrum contains a large
peak at 0.1 s, consistent with surface-bound water. Excess bulk water is responsible for the
longer relaxation time components. In contrast to this, the sand sample that had been
subjected to asphaltene adsorption under 0% RH conditions shows a much smaller short

18
relaxation time component, with the majority of the response comprising a longer relaxation
time, typical of a predominantly hydrophobic sand sample [36]. For the sand produced at
100% RH, however, the spectrum is seen to indicate mixed wettability characteristics.
The complexity of these spectra is often reduced by calculating the geometric mean T2 values
(T2gm) using Eq. 3, where Ai is the amplitude of each T2i value, i.e. [36]
(∑
∑
). (3)
Thus, in Fig. 5 are the resultant plots of T2gm against time for sand obtained under four of the
five RH adsorption conditions, together with an untreated ambient sand sample. For each
asphaltene-treated sand it is seen that T2gm decreases with time, in contrast with the fresh
ambient sand, which is time-invariant. For the 100% RH sand sample, T2gm is seen to
decrease very rapidly to a value which is close to that found for ambient sand. This is
consistent with comparatively low asphaltene adsorption causing the surface to become
weakly hydrophobic, as evidenced by a high initial T2gm value, but which then easily reverts
back to its natural hydrophilic state when contacted by water.
On the other hand, for sand samples which have undergone asphaltene adsorption at 0%, 33%
and 81% RH, the original state of the sand surface is less-easily recovered, as shown by T2gm
decreasing more gradually with time. This is consistent with the adsorbed asphaltene layer
being thicker or more firmly bound to the surface, thereby preventing its displacement and
presenting a stronger hydrophobic barrier against the added water contacting the sand
surface. The T2gm time dependence is very similar for these three RH values, although the
initial T2gm values are different, and consistent with the amounts of adsorbed asphaltene (Fig.
3).

19
0 1 0 0 2 0 0 3 0 0 4 0 0
0
5 0 0
1 0 0 0
1 5 0 0
T im e (m in )
T2
gm
(m
s)
Fig. 5. Plots of T2gm against time for deionized water in contact with asphaltene-coated sand:
0% RH (filled circles); 32.8% RH (open circles); 81.0% RH (open triangles); and 100% RH
(open squares). Data are also shown for untreated sand (open inverted triangles).
3.3 AFM analysis
AFM has been used to confirm differences in asphaltene adsorption at two contrasting RH
conditions (0% and 81%). Images were obtained for sand grains recovered from the
adsorption experiments. These were compared with an untreated, ambient sand grain. Thus,
Fig. 6 shows the respective images, each representing an area of 0.5 m 0.5 m, which
shows that a thicker, more uniform and possibly smoother layer is formed on sand at 0% RH,
compared with that produced at 81% RH.

20
At this scale, the thickness of the layers are 6 nm for asphaltene adsorbed at 0% RH and
4 nm at 81% RH, compared with a baseline value of 0.5 nm for untreated sand. The
adsorbed layer at 0% RH is therefore directionally as expected based on the adsorption data.
Unsurprisingly, images produced over larger areas (e.g. 1 m 1 m and 3 m 3 m) are
subject to a greater influence from the uneven sand grain surfaces and are therefore not
shown.
Fig. 6. 0.5 m 0.5 m AFM images for (a) plain sand, and sand with asphaltene adsorbed
at (b) 0% RH, and (c) 81% RH. The measurements were all made under ambient conditions
using a set point of 2 V, 256 samples/lines, and a scan rate of 4 Hz.
4. Discussion
In order to compare asphaltene adsorption with corresponding literature water adsorption
isotherm data for a similar sand sample [33], results from Fig. 3 are re-plotted in Fig. 7 on a
molar basis. Whilst accepting that the two sand samples are not likely to be identical, it is
apparent that the two isotherms are fundamentally complementary, such that when water
adsorption is high, asphaltene adsorption is low, and vice versa (but note the different y-axis
scales).
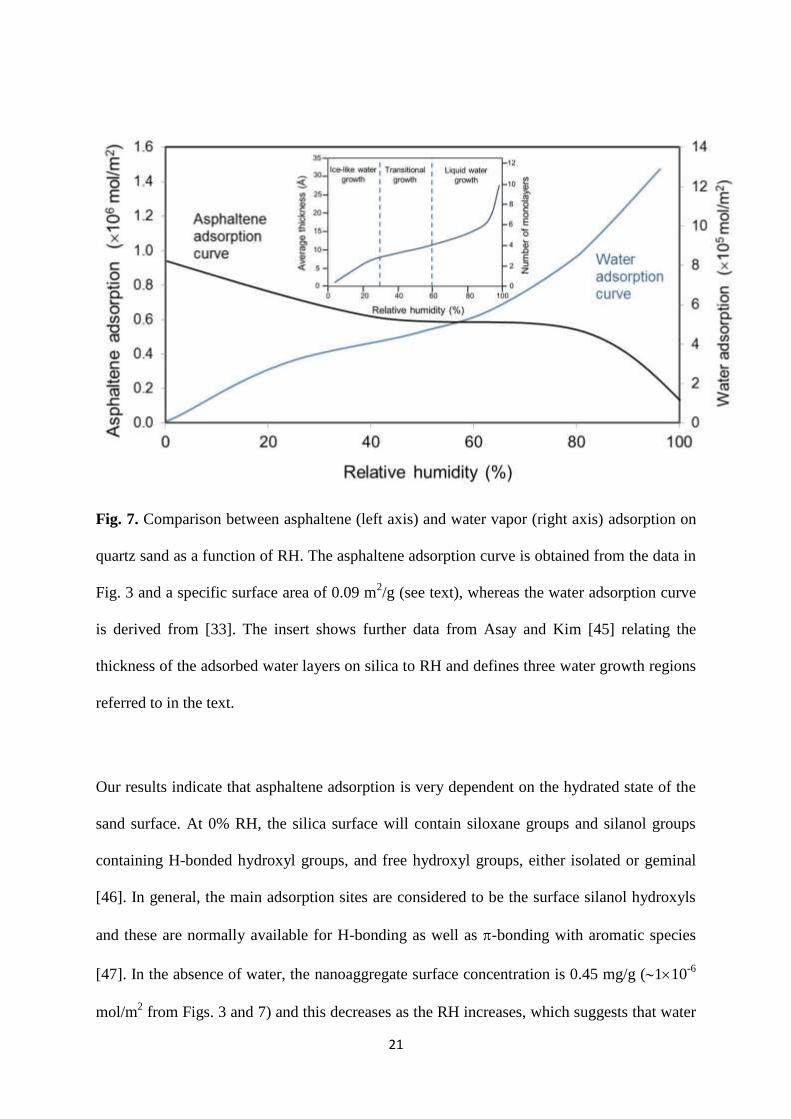
21
Fig. 7. Comparison between asphaltene (left axis) and water vapor (right axis) adsorption on
quartz sand as a function of RH. The asphaltene adsorption curve is obtained from the data in
Fig. 3 and a specific surface area of 0.09 m2/g (see text), whereas the water adsorption curve
is derived from [33]. The insert shows further data from Asay and Kim [45] relating the
thickness of the adsorbed water layers on silica to RH and defines three water growth regions
referred to in the text.
Our results indicate that asphaltene adsorption is very dependent on the hydrated state of the
sand surface. At 0% RH, the silica surface will contain siloxane groups and silanol groups
containing H-bonded hydroxyl groups, and free hydroxyl groups, either isolated or geminal
[46]. In general, the main adsorption sites are considered to be the surface silanol hydroxyls
and these are normally available for H-bonding as well as -bonding with aromatic species
[47]. In the absence of water, the nanoaggregate surface concentration is 0.45 mg/g (110-6
mol/m2 from Figs. 3 and 7) and this decreases as the RH increases, which suggests that water

22
competes for the surface sites. Water adsorption increases relatively rapidly up to 30% RH
[33], and thereafter asphaltene adsorption is seen to be relatively constant as far as 80% RH.
In this range, water adsorption continues to increase, albeit more slowly until 60% RH.
Above this RH value, however, water multilayers begin to form rapidly [33] at which stage
asphaltene adsorption decreases, although, as also observed previously by Collins and
Melrose for adsorption on kaolinite, it is not prevented completely [17]. As shown in Fig. 7
(insert), three regions were identified and described by Asay and Kim [45] as ice-like growth
in the low RH range, which corresponds to a build-up of 3 monolayers (with a thickness of
6 Å), followed by a transition region with the addition of a further monolayer in the mid-RH
range, and finally liquid water (multilayer) growth at high RH.
As we show in Fig. 8, the remarkably linear dependence of asphaltene adsorption on the
thickness of the adsorbed water film is very evident. Here, we have plotted our asphaltene
adsorption data as a function of the thickness of the adsorbed water layer taken from Asay
and Kim [45].

23
0 1 0 2 0 3 0
0 .0
0 .2
0 .4
T h ic k n e s s o f w a te r la y e r (Å )
Ad
so
rbe
d a
sp
ha
lte
ne
(m
g/g
sa
nd
)
Fig. 8. Plot showing the effect of the thickness of the adsorbed water layer on asphaltene
adsorption. The asphaltene adsorption data are from the present study, and water thickness
data are from Asay and Kim [45]. The dashed line is the least squares fit to the data (R2 =
0.920).
In the mid-range RH region, where liquid water growth occurs on the silica surface [45], the
asphaltene surface concentration is 0.610-6
mol/m2. This is almost double that of the lowest
surface hydration condition, which will contain more adsorption (silanol) sites. The effect of
this will be effectively to reduce the area per nanoaggregate and increase the density of the
adsorbed layer when compared with the presence of surface water. The increased thicknesses
shown in the AFM images suggest that some further aggregation may also occur on the
dehydrated sand surface. The thickness based on the AFM images shown in Fig. 6 is found to
be consistent with the trend seen in the adsorption experiments.
24
In the ‘dry’ (0% RH) condition, the surface will contain the maximum number of available
silanol adsorption sites. Asphaltene adsorption can therefore potentially undergo hydrogen
and -bonding to the silanol groups through hetero-groups and aromatic centers, respectively.
However, an additional adsorption mode at the silica-toluene interface, most appropriately
operative in the absence of water, has been reported as arising through electric field effects
[48]. It was proposed that observations of increased surface precipitation of dispersed
asphaltenes at a silica surface are explained by electrostatic attraction [48]. Asphaltenes
dispersed in non-polar media are known to be electrically charged [49-54], and depending on
the method of preparation and the type and concentration of solvent, electrodeposition
experiments, in particular, have shown that asphaltene particles carry either positive or
negative charges [52,54]. However, in pure solvents, and specifically when indigenous resins
or added surface-active species are absent, dispersed asphaltenes (which will comprise
clusters and larger aggregates derived from nanoaggregates) are positively charged [53,55].
In contrast to this, the charge on bare acidic silica surfaces in non-aqueous solvents is almost
exclusively negative as a result of dissociation of surface silanol groups [56,57]. Thus,
without offering a definitive explanation here, it is possible that electrical effects may
contribute to the adsorption behavior, particularly in the absence of water.
However, as the RH increases to 30%, adsorbed water will become increasingly involved in
hydrogen bonding with the surface silanol groups resulting in the H-bonded ice-like structure
[45]. Water will therefore compete with the asphaltene for H-bonding sites and reduce the
electrostatic contributions to adsorption through charge dissipation. It is seen from Fig. 7 that
within the ice-like and transitional growth regions, asphaltene adsorption remains
approximately constant.

25
Upon exceeding 60% RH, however, the influence of the silica surface becomes further
reduced due to adsorption occurring at an increasingly water-like interface, where the
adsorbed water film increases in thickness beyond 5-10 molecular layers at 90% RH [34].
We summarize the foregoing with reference to the schematic representation of the hydrated
silica surface shown in Fig. 9. Here, we show the relationship between asphaltene adsorption
and the three water growth regions of Asay and Kim. From this analysis it is apparent that
any effects due to water structure can only be subtle, with the water layer thickness dictating
asphaltene adsorption.

26
Fig. 9. Schematic representation of the adsorbed water structure profile at a silica surface and
its relation to the present RH asphaltene adsorption data. The water structure regions are from
ref. [45], with the hatched area representing the transitional growth region.

27
Since the asphaltene adsorption is strongly influenced by the presence of pre-adsorbed water,
we were also interested to determine whether there is a consequent effect on sand wettability,
and to this end, we have used water proton T2 relaxation as a measure. As described above,
the T2 relaxation spectrum reflects the different water environments in the sample, and in
particular distinguishes interfacial (short T2) from bulk water (longer T2). Thus, hydrophilic
surfaces with a comparatively high water affinity will have a shorter relaxation time
compared with hydrophobic surfaces. Asphaltene coatings on surfaces are expected to be
hydrophobic, and characterized by higher relaxation times, which we present as geometric
mean T2gm values to reflect the complete spectrum of relaxation times. Thus, Fig. 5 shows
that for all the samples tested, T2gm decreases with time indicating that the surfaces become
more hydrophilic as water penetrates (and/or displaces [58]) the adsorbed asphaltene film
[36]. For the 100% RH sample, which has the lowest asphaltene adsorption, T2gm is seen to
decrease within minutes, almost reaching the baseline value for ambient sand. However, for
the other samples, the decrease in T2gm occurred over a period of hours, consistent with the
presence of thicker or possibly more complete adsorbed asphaltene layers on these samples.
5. Conclusions and implications
There is considerable interest in quartz sand (silica) surfaces, particularly in the oil industry,
where this mineral is the geological basis for a large proportion of oil reservoirs. Indeed, oil
sands make up a significant proportion of global unconventional heavy oil and bitumen
reserves, especially in Canada. Understanding silica/water/oil interfacial chemistry is an
important aspect in improving recovery techniques, and the role of water is one of its key
influences.
28
The aim of the present work was to investigate previous observations in the literature which
suggested that the presence of water reduces asphaltene adsorption on different mineral
surfaces. Thus, by controlling the RH environments to which the sand was exposed, we have
demonstrated a direct link between water and asphaltene adsorption, possibly for the first
time. We have identified complementarity between the two isotherms, such that the highest
asphaltene adsorption is observed in the absence of a water film, and this decreases linearly
as the thickness of the adsorbed surface water increases (with increasing RH). Not only does
this suggest the possibility that asphaltene and water compete for the same (silanol) surface
sites, but the adsorbed water may present a barrier to asphaltene adsorption, as the silica
surface structure of the silica changes due to hydration [45]. In the absence of water,
formation of thicker adsorbed films may also be influenced by electric field effects as
described recently by Acevedo et al. [48].
The present findings are in general agreement with extensive work carried out by Goss and
coworkers in which the presence of water films on hydrophilic mineral surfaces were shown
to inhibit adsorption of a range of organic compounds from the vapor-phase [33,34]. The
discontinuity of the RH dependence of sorption (at 26% RH) was considered to be due to
incomplete coverage of the quartz surface (<26%), leaving some sites unoccupied, or by
competition with water molecules that are preferentially adsorbed [33]. Our results have also
demonstrated, possibly for the first time, similar effects in a liquid-phase adsorption process.
AFM imaging has provided further evidence (Fig. 6) that the adsorbed asphaltene layer is
thicker (6 nm) on the 0% RH sample compared with the 81% sample (4 nm). Even
allowing for the non-ideal nature of the sand grain surface, these adsorbed layer thicknesses
are consistent with values obtained on more ideal planar surfaces, summarized by Adams [1].

29
Low-field NMR has provided additional evidence for asphaltene adsorption on sand by
means of T2 relaxation time wettability measurements. The increased thickness of the
asphaltene film is indicated by higher initial T2 values, and reinforced by slower rates of
change of T2gm. The rapid decrease of T2gm with time for the 100% RH condition is also
consistent with the lowest adsorbed amount of asphaltene.
The present results could add support for the existence of water films separating bitumen
from solid surfaces in natural oil sands [16-19], and may also serve to explain differences
between asphaltene adsorption data reported in the literature. Finally, the experimental
approach adopted here could be used to complement recent modeling studies on the
adsorption of oil components in the presence of water, e.g. [59,60].
Acknowledgements
We are grateful to Allan Peats of BP Canada, for supplying the oil sands core used to derive
the n-heptane-precipitated asphaltene and sand particle size distribution, and to BP America
for establishing the Centre for Petroleum and Surface Chemistry and the award of a PhD
studentship to VG. We appreciate the valuable contributions to the experimental work made
by Aristeidis Tsiamis (ambient RH adsorption data), Rifat Shaikh (AFM) and Richard Fields
(BET analysis), while Dr. Huang Zeng (BP America) is thanked for his support, interest and
valuable discussions throughout the course of our work on asphaltene chemistry. Finally, we
are grateful to reviewers who raised several constructive and interesting points which greatly
improved the paper.

30
References
[1] J.J. Adams, Energy Fuels 28 (2014) 2831-2856.
[2] D.M. Grist, E.L. Neustadter, K.P. Whittingham, J. Can. Pet. Tech. 20 (1981) 74-78.
[3] R.A. Mohammed, A.I. Bailey, P.F. Luckham, S.E. Taylor, Colloids Surf. A 80 (1993)
223-235.
[4] C. Dicharry, D. Arla, A. Sinquin, A. Graciaa, P. Bouriat, J. Colloid Interface Sci. 297
(2006) 785–791.
[5] J. Czarnecki, P. Tchoukov, T. Dabros, Z. Xu, Can. J. Chem. Eng. 91 (2013) 1365-
1371.
[6] V. Pauchard, J.P. Rane, S. Banerjee, Langmuir 30 (2014) 12795−12803.
[7] S.E. Taylor, Chem. Ind. (20) (1992) 770-773.
[8] E.M. Freer, C.J. Radke, J. Adhesion, 80 (2004) 481-496.
[9] M. Sedghi, L. Goual, W. Welch, J. Kubelka, J. Phys. Chem. B 117 (2013)
5765−5776.
[10] X. Tan, H. Fenniri, M.R. Gray, Energy Fuels 23 (2009) 3687–3693.
[11] M.R. Gray, R.R. Tykwinski, J.M. Stryker, X. Tan, Energy Fuels 25 (2011) 3125–
3134.
[12] L.M. da Costa, S.R. Stoyanov, S. Gusarov, X. Tan, M.R. Gray, J.M. Stryker, R.
Tykwinski, J. W. de M. Carneiro, P.R. Seidl, A. Kovalenko, Energy Fuels 26 (2012)
2727−2735.
[13] J. Murgich, D. Merino-Garcia, S.I. Andersen, J.M. del Rio, C.L. Galeana, Langmuir
18 (2002) 9080-9086.
[14] S.I. Andersen, J.M. del Rio, D. Khvostitchenko, S.Shakir, C. Lira-Galeana, Langmuir,
17 (2001) 307-313.
[15] D.S. Khvostichenko, S.I. Andersen, Energy Fuels 22 (2008) 3096–3103.
[16] K. Takamura, Can. J. Chem. Eng. 60 (1982) 538-545.
[17] S.H. Collins, J.C. Melrose, SPE J. 23 (1983) 249-258.
[18] J. Masliyah, Z. Zhou, Z. Xu, J. Czarnecki, H. Hamza, Can. J. Chem. Eng. 82 (2004)
628-654.
[19] J. Czarnecki, B. Radoev, L.L. Schramm, R. Slavchev, Adv. Colloid Interface Sci.
114-115 (2005) 53-60.

31
[20] S.T. Dubey, M.H. Waxman, SPE Res. Eng. (1991) 391-395. doi.org/10.2118/18462-
PA
[21] M. Chacon-Patino, C. Blanco-Tirado, J. Orrego-Ruiz, A. Gomez-Escudero, Energy
Fuels 29 (2015) 1323-1331.
[22] W. Anderson, J. Pet. Tech. 38 (1986) 1125-1144.
[23] S.T. Kim, M.-E. Boudh-Hir. M-E., G.A. Mansoori, Paper SPE 20700 presented at 65th
Annual Technical Conference and Exhibition of the Society of Petroleum Engineers,
New Orleans, LA, September 23-26, 1990.
[24] C. Drummond, J. Israelachvili, J. Pet. Sci. Eng. 45 (2004) 61-68.
[25] K.L. Gawrys, M. Spiecker, P.K. Kilpatrick, Pet. Sci. Tech. 21 (2003) 461-489.
[26] . . ullins, H. Sabbah, . yssautier, A. . omerant , L. Barr , A.B. Andrews, Y.
Ruiz-Morales, F. Mostowfi, R. McFarlane, L. Goual, R. Lepkowicz, T. Cooper, J.
Orbulescu, R.M. Leblanc, J. Edwards, R.N. Zare, nergy Fuels 26 (2012) 3986−4003.
[27] M. Szymula, A.W. Marczewski, Appl. Surface Sci. 196 (2002) 301–311.
[28] A.W. Marczewski, M. Szymula, Colloids Surf. A 208 (2002) 259–266.
[29] A. Saada, B. Siffert, E. Papirer, J. Colloid Interface Sci. 174 (1995)185-190.
[30] V.B. Menon, D.T. Wasan, Colloids Surf. 19 (1986) 107-122.
[31] V. Alipour Tabrizy, R. Denoyel, A.A. Hamouda, Colloids Surf. A 384 (2011) 98–
108.
[32] C.J. Daughney, Org. Geochem. 31 (2000) 147-158.
[33] K.-U. Goss, Environ. Sci. Technol. 26 (1992) 2267-2294.
[34] K.-U. Goss, R.P. Schwarzenbach, J. Colloid Interface Sci. 252 (2002) 31–41.
[35] L. Greenspan, J. Res. Nat. Bur. Stand. (US) 81 (1977) 89-96.
[36] V. Gonzalez, M. Jones, S.E. Taylor, Energy Fuels 30 (2016) 844−853.
[37] H.Y. Carr, E.M. Purcell, Phys. Rev. 94 (1954) 630-638.
[38] S. Meiboom, D. Gil, Rev. Sci. Instr. 29 (1959) 688-961.
[39] Y.-Q. Song, L. Venkataramanan, M.D. Hurlimann, M. Flaum, P. Frulla, C. Straley, J.
Magn. Reson. 154 (2002) 261-268.
[40] A. Hannisdal, M.-H. Ese, P.V. Hemmingsen, J. Sjöblom, Colloids Surf. A 276 (2006)
45-58.

32
[41] S. Simon, J. Jestin, T. Palermo, L. Barre, Energy Fuels 23 (2009) 306-313.
[42] L. Goual, A. Abudu, Energy Fuels 24 (2010) 469–474.
[43] S. Acevedo, M.A. Ranaudo, J.C. Pereira, J. Castillo, A. Fernandez, P. Perez, M.
Caetano, Fuel 78 (1999) 997.
[44] A. Pitois, L.G. Abrahamsen, P.I. Ivanov, N.D. Bryan, J. Colloid Interface Sci. 325
(2008) 93–100.
[45] D.B. Asay, S.H. Kim, J. Phys. Chem. B 109 (2005) 16760-16763.
[46] M.L. Hair and W. Hertl, J. Phys. Chem. 73 (1969) 4269-4276.
[47] M.L. Hair, J. Non-Cryst. Solids, 19 (1975) 199-209.
[48] S. Acevedo, . astillo, .H. Del arpio, nergy Fuels 28 (2014) 4905−4910.
[49] S.M. Hashmi, A. Firoozabadi, Soft Matter 7 (2011) 8384-8391.
[50] S.M. Hashmi, A. Firoozabadi, Soft Matter 8 (2012) 1878-1883.
[51] R. Gaikwad, A. Hande, S. Das, S.K. itra, T. Thundat, Langmuir 31 (2015) 679−684.
[52] D.S. Khvostichenko, S.I. Andersen, Energy Fuels 23 (2009) 811–819.
[53] D.S. Khvostichenko, S.I. Andersen, Energy Fuels 24 (2010) 2327–2336.
[54] S.E. Taylor, Fuel, 77 (1998) 821-828.
[55] W.Th. Kok, A.J. Tudos, M. Grutters, A.G. Shepherd, Energy Fuels 25 (201) 208–214.
[56] M.E. Labib, R. Williams. J. Colloid Interface Sci. 97 (1984) 356-366.
[57] M.E. Labib, Colloids Surf. 29 (1988) 293-304.
[58] U. Farooq, J. Sjöblom, G. Øye, J. Disp. Sci. Tech. 32 (2011) 1388-1395.
[59] J. Zhong, P. Wang, Y. Zhang, Y. Yan, S. Hu, J. Zhang, Energy 59 (2013) 295-300.
[60] G. Wu, X. Zhu, H. Ji, D. Chen, Chemosphere 119 (2015) 242–249.