Embed Size (px)
Citation preview

An Economic Evaluation of the Assessment of Service Promoting
Independence and Recovery in Elders (ASPIRE)
Final Report
31 October 2006
Auckland UniServices Limited
Economic Evaluation of ASPIRE 31 October 2006
Final Report Page i
TABLE OF CONTENTS
1. EXECUTIVE SUMMARY ........................................................................................... 1
2. INTRODUCTION........................................................................................................ 6
3. METHODOLOGY AND RESULTS............................................................................. 7
3.1. BACKGROUND TO COST EFFECTIVENESS ANALYSIS .........................................................7 3.2. ASPIRE CEA METHODOLOGY .......................................................................................7 3.3. RESULTS .....................................................................................................................10
4. SENSITIVITY TESTING........................................................................................... 13
4.1. TESTING UNIT COST SENSITIVITY..................................................................................13 4.2. TESTING AVERAGE RESOURCE USE SENSITIVITY...........................................................14 4.3. TESTING OUTCOME SENSITIVITY ...................................................................................15 4.4. TESTING CHRISTCHURCH 18 MONTH SENSITIVITY .........................................................17
5. CONCLUSIONS AND CAVEATS ............................................................................ 19
APPENDIX A: DETAILED DESCRIPTION OF DATA, METHODOLOGY AND RESULTS ............................................................................................................................... 21
A.1 DATA...........................................................................................................................21 A.2 METHODOLOGY............................................................................................................22
A.2.1 Sample Size ............................................................................................................... 22 A.2.2 Calculation of Costs ................................................................................................... 24 A.2.3 Calculation of Benefits................................................................................................ 45
A.3 RESULTS .....................................................................................................................46

Economic Evaluation of ASPIRE 31 October 2006
Final Report 1
1. EXECUTIVE SUMMARY
The Assessment of Services Promoting Independence and Recovery in Elders (ASPIRE) was a prospective meta-analysis 1 of three initiatives designed to promote independence and continued living in the community for elderly people (ageing-in-place). The three initiatives are:
• The Community Flexible Integrated Restorative Support Team (Community FIRST) initiative in Hamilton; a restorative home support model of care;
• The Promoting Independence Programme (PIP) in Lower Hutt; a rehabilitation services model of care; and
• The Coordinator of Services for Elderly (COSE) initiative in Christchurch; an individual case-management model of care.
This report presents the results of a cost effectiveness analysis of each of the three ageing-in-place initiatives to assess their cost effectiveness relative to the elderly receiving conventional health care services (usual care) in each region.
The study design was based around 3 randomised controlled trials with a total sample size for analysis of 564 older people assessed as having high or very high needs, across the 3 centres; Christchurch had a much larger sample size with 350 participants compared with 111 in Hamilton and 103 in Lower Hutt.
Table 1 presents the incremental, costs and benefits for each of the 3 ageing-in-place initiatives compared with usual care. Costs are measured in terms of the health care resources used by the elderly participants involved in the assessment over the two-year study period, and include community costs incurred by either the DHB or elderly person, and the residential costs associated with permanent entry into either a rest home or hospital. Benefits are measured in terms of extra days in community care gained under the 3 ageing-in-place initiatives, which can be broken down into 2 other benefit measures which are days of residential care avoided, and days of life gained or equivalently days deceased avoided.
Dividing the incremental cost of the initiative by the incremental benefit produces an Incremental Cost Effectiveness Ratio (ICER). The ICER is the key cost-effectiveness measure to be used to contrast the study findings in terms of the cost and benefit outcomes of the 3 ageing-in-place initiatives.
The key findings can be summarised as follows:
1 In statistics, a meta-analysis combines the results of several studies that address a set of related research hypotheses.

Economic Evaluation of ASPIRE 31 October 2006
Final Report 2
Community First Cost Effectiveness Results
• The Community FIRST initiative cost an estimated $46,256, on average per person over a 12 month period. This compares with the estimated cost for usual care of $32,413, on average per person over a 12 month period.
• The Community FIRST initiative resulted in, on average per person, 246 days in community care, 75 days in residential care, and 43 days deceased over a 12 month period. Usual care resulted in, on average per person, 195 days in community care, 91 days in residential care, and 79 days deceased over a 12 month period.
• The Community FIRST initiative, therefore, cost an estimated additional $13,843, on average per person over a 12 month period compared to usual care, and resulted in an additional 51 days spent in the community (of which 16 were avoided residential care and 35 were avoided death).
• The ICER for Community FIRST compared with usual care amounts to a cost of $271 per person for each additional day in the community gained over a 12 month period. The ICER for Community FIRST expressed in terms of the 2 other benefit measures of days of residential care avoided, and days deceased avoided are set out in Table 1 below.
PIP Cost Effectiveness Results
• The PIP initiative cost an estimated $40,560, on average per person over a 12 month period. This compares with the estimated cost for usual care of $32,732, on average per person over a 12 month period.
• The PIP initiative resulted in, on average per person, 278 days in community care, 60 days in residential care, and 28 days deceased over a 12 month period. Usual care resulted in, on average per person, 255 days in community care, 81 days in residential care, and 29 days deceased over a 12 month period.
• The PIP initiative, therefore, cost an estimated additional $7,828, on average per person over a 12 month period compared to usual care, and resulted in an additional 23 days spent in the community (of which 22 were avoided residential care and 1 was avoided death).
• The ICER for PIP compared with usual care amounts to a cost of $340 per person for each additional day in the community gained over a 12 month period. The ICER for PIP expressed in terms of the 2 other benefit measures of days of residential care avoided, and days deceased avoided are set out in Table 1 below.
Economic Evaluation of ASPIRE 31 October 2006
Final Report 3
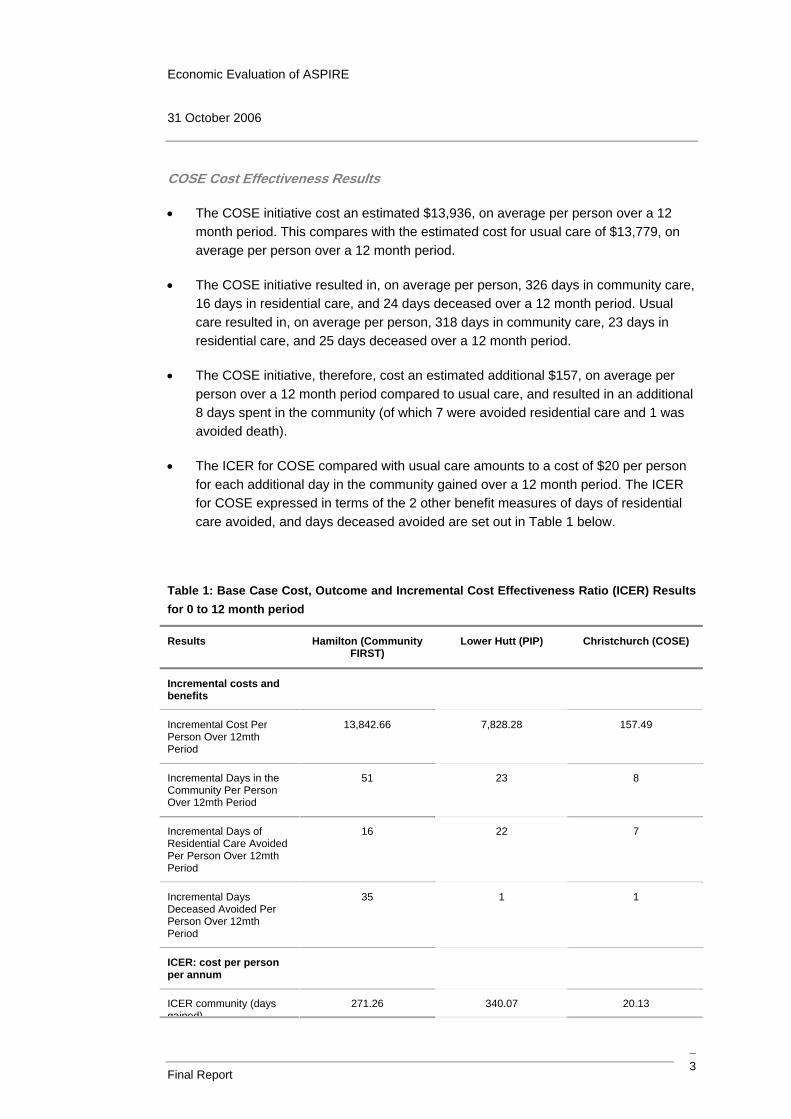
COSE Cost Effectiveness Results
• The COSE initiative cost an estimated $13,936, on average per person over a 12 month period. This compares with the estimated cost for usual care of $13,779, on average per person over a 12 month period.
• The COSE initiative resulted in, on average per person, 326 days in community care, 16 days in residential care, and 24 days deceased over a 12 month period. Usual care resulted in, on average per person, 318 days in community care, 23 days in residential care, and 25 days deceased over a 12 month period.
• The COSE initiative, therefore, cost an estimated additional $157, on average per person over a 12 month period compared to usual care, and resulted in an additional 8 days spent in the community (of which 7 were avoided residential care and 1 was avoided death).
• The ICER for COSE compared with usual care amounts to a cost of $20 per person for each additional day in the community gained over a 12 month period. The ICER for COSE expressed in terms of the 2 other benefit measures of days of residential care avoided, and days deceased avoided are set out in Table 1 below.
Table 1: Base Case Cost, Outcome and Incremental Cost Effectiveness Ratio (ICER) Results for 0 to 12 month period
Results Hamilton (Community FIRST)
Lower Hutt (PIP) Christchurch (COSE)
Incremental costs and benefits
Incremental Cost Per Person Over 12mth Period
13,842.66 7,828.28 157.49
Incremental Days in the Community Per Person Over 12mth Period
51 23 8
Incremental Days of Residential Care Avoided Per Person Over 12mth Period
16 22 7
Incremental Days Deceased Avoided Per Person Over 12mth Period
35 1 1
ICER: cost per person per annum
ICER community (days gained)
271.26 340.07 20.13

Economic Evaluation of ASPIRE 31 October 2006
Final Report 4
Results Hamilton (Community FIRST)
Lower Hutt (PIP) Christchurch (COSE)
gained)
ICER residential (days avoided)
880.57 361.96 22.84
ICER deceased (days avoided)
392.27 5,545.03 190.74
ASPIRE Cost Effectiveness Results Discussion
The approach taken to evaluate the cost effectiveness of ASPIRE is consistent with that used in comparable studies internationally2. It centres around a key outcome of keeping elderly people in the last year or so of their life , in the community for longer, by both avoiding residential home admission and prolonging life.
The cost effectiveness analysis results for ASPIRE shows that, on the basis of the ICERs calculated, that the Christchurch COSE initiative is the most cost effective per additional day spent in the community, as it only cost an additional $20 more than usual care per person per annum, compared with corresponding figures for Hamilton Community FIRST of $271 and for Lower Hutt PIP of $340.
All 3 ageing-in-place initiatives, however, despite costing more relative to usual care, all had the result of increasing the time spent in the community over a 12 month period by decreasing time in residential care and deceased.
While Christchurch COSE has the lowest incremental cost on average per person compared with usual care, it also has the lowest incremental benefit. On the days in the community gained measure, Hamilton Community FIRST clearly achieves the best outcomes with 51 days gained, contrasting with 23 for PIP and only 8 for COSE. On the days deceased avoided measure, Hamilton Community FIRST achieves the highest gain in days of life compared with usual care with an extra 35 days contrasting with only 1 day for PIP and COSE. On the days of residential care avoided measure, PIP achieves the highest gain with 22 days avoided, followed by Community FIRST with 16 days avoided and COSE with only 7 days avoided.
However, the results should be interpreted with some caution for a number of reasons. These are covered in detail in the report but some of the key ones are set out below.
2 For example, the Wanless Social Care Review, Securing Good Care for Older People, Derek Wanless, 2006: specifically cites the example in the paper by Davies et al 2000, which shows that spending on home care and day care services ‘buys’ additional days for people in the community before a residential care solution becomes the only option for them.

Economic Evaluation of ASPIRE 31 October 2006
Final Report 5
ASPIRE Cost Effectiveness Results Caveats
i. Questionnaires were administered to the elderly participants at 3 months, 12 months, and 18 months over the course of the two-year study period (ending 11 November 2005). The questionnaires were used to determine the community costs for each time period. The number of participants still in community care in Hamilton and Lower Hutt at 18 months was too small for a statistically valid analysis for the 12 to 18 month period 3, hence, the analysis focuses on a 12 month period instead.
ii. Sensitivity analysis is required to allow for uncertainty surrounding the unit cost, resource use, outcomes variables, time period, and assumptions used to calculate the ICERs; while the best estimate of the values for these variables was used to construct the ICERs for the elderly study participants, the data represents a statistical sample only; and results could be different to those that would be observed for an entire population or for a different time period of study.
iii. Sensitivity analysis carried out shows that the results can be quite sensitive to changes in the average resource use; also the sensitivity analysis shows for Christchurch that the ICER results change when constructed based on 12 months verses 18 months data; using the 18 month data, the COSE programme costs $120 less than usual care for each additional day spent in the community. This appears to be due to the proportion of time spent in residential care in the usual care group increasing in the 12 to 18 month period by a lot more than in the initiative group.
iv. Finally, the sample for the Hamilton Community FIRST initiative had much higher levels of mean physical and cognitive disability at entry into the ASPIRE trials than the sample for the Christchurch COSE initiative, with the Lower Hutt PIP initiative having a mean level of disability between the two other initiatives4. These differences, which were not adjusted for in the cost effectiveness analysis, may influence the final results, as Community FIRST may appear much more expensive for the outcome it achieves, but this is because it faced greater challenges with its sample participants.
3 Questionnaires could only be administered to those still in the community at 18 months and so the 18 month sample excludes participants who had died, entered residential care, or were recruited after the first 6 months of the 2 year study period. The sample size of participants administered a questionnaire at 18 months for Hamilton, Lower Hutt, and Christchurch at 18 months was 12 , 13 , and 108 respectively.
4 Refer to page 64 of: ASPIRE Assessment of Services Promoting Independence & Recovery in Elders, ASPIRE Report 1, Auckland UniServices Limited, Dr Matthew Parsons et al, 2006.

Economic Evaluation of ASPIRE 31 October 2006
Final Report 6
2. INTRODUCTION
The Assessment of Services Promoting Independence and Recovery in Elders (ASPIRE) was a meta-analysis of three initiatives designed to promote independence and continued living in the community for elderly people (ageing-in-place). The three initiatives are:
• The Community Flexible Integrated Restorative Support Team (Community FIRST) initiative in Hamilton;
• The Promoting Independence Programme (PIP) in Lower Hutt; and
• The Coordinator of Services for Elderly (COSE) initiative in Christchurch.
Each initiative had different approaches to promoting ageing-in-place, such as individual case-management (COSE), provision of rehabilitation services (PIP) and provision of home support services (Community FIRST). A more complete description of the initiatives can be found in Parsons et al (2006).5
The ASPIRE analysis firstly involved selection of a random sample of elderly from each of the three initiatives, along with a random sample from elderly receiving conventional health care services (usual care) in each of the three regions. Each sample was tracked over a two-year period (from 10 November 2003 to 11 November 2005), with questionnaires administered to sample participants and other data collected (such as the date a person died or entered a residential care facility).
One aspect of ASPIRE is to perform a cost effectiveness analysis (CEA) of each of the three ageing-in-place initiatives to assess their cost effectiveness relative to usual care. This report sets out the results of this analysis.
5 Parsons, M., C. Anderson, H. Senior, X. Chen, N. Kerse, D. Jorgensen, P. Brown, S. Jacobs, S. Vanderhoorn and J. Kilpatrick (2006). ASPIRE: Assessment of Services Promoting Independence and Recovery in Elders, Report to Ministry of Health.
Economic Evaluation of ASPIRE 31 October 2006
Final Report 7
3. METHODOLOGY AND RESULTS
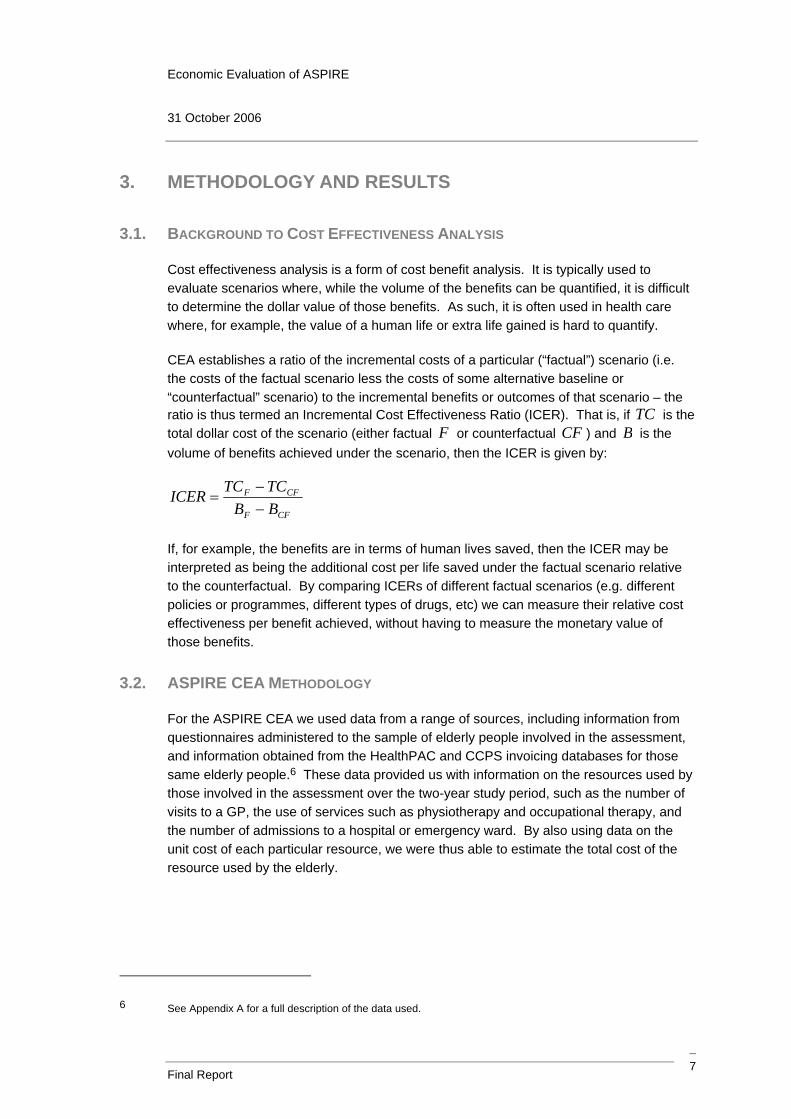
3.1. BACKGROUND TO COST EFFECTIVENESS ANALYSIS
Cost effectiveness analysis is a form of cost benefit analysis. It is typically used to evaluate scenarios where, while the volume of the benefits can be quantified, it is difficult to determine the dollar value of those benefits. As such, it is often used in health care where, for example, the value of a human life or extra life gained is hard to quantify.
CEA establishes a ratio of the incremental costs of a particular (“factual”) scenario (i.e. the costs of the factual scenario less the costs of some alternative baseline or “counterfactual” scenario) to the incremental benefits or outcomes of that scenario – the ratio is thus termed an Incremental Cost Effectiveness Ratio (ICER). That is, if TC is the total dollar cost of the scenario (either factual F or counterfactual CF ) and B is the volume of benefits achieved under the scenario, then the ICER is given by:
CFF
CFF
BBTCTCICER
−−
=
If, for example, the benefits are in terms of human lives saved, then the ICER may be interpreted as being the additional cost per life saved under the factual scenario relative to the counterfactual. By comparing ICERs of different factual scenarios (e.g. different policies or programmes, different types of drugs, etc) we can measure their relative cost effectiveness per benefit achieved, without having to measure the monetary value of those benefits.
3.2. ASPIRE CEA METHODOLOGY
For the ASPIRE CEA we used data from a range of sources, including information from questionnaires administered to the sample of elderly people involved in the assessment, and information obtained from the HealthPAC and CCPS invoicing databases for those same elderly people.6 These data provided us with information on the resources used by those involved in the assessment over the two-year study period, such as the number of visits to a GP, the use of services such as physiotherapy and occupational therapy, and the number of admissions to a hospital or emergency ward. By also using data on the unit cost of each particular resource, we were thus able to estimate the total cost of the resource used by the elderly.
6 See Appendix A for a full description of the data used.

Economic Evaluation of ASPIRE 31 October 2006
Final Report 8
In each region, we calculated the total cost per person for both the ageing-in-place initiative and usual care. Appendix A provides full details of how this was calculated, but we provide a brief summary here. We firstly split the costs of the initiative/usual care into community related costs and the costs of being in a residential care facility. Community costs are those incurred by either the DHB or elderly person whilst in the community, and include the examples listed above such as GP visits and occupational therapy. Residential costs are the costs associated with permanent entry into either a rest home or hospital.
As the ASPIRE analysis involved administering questionnaires to those still in the community at intervals of 3 months, 12 months and 18 months from when an individual entered the sample, we calculated community costs over each of the 0 to 3 month, 4 to 12 month and 13 to 18 month periods. This was done by determining the average resource use for each of the community resources in each period, multiplying by the unit cost of each resource and summing over all resources.
While we therefore had 18 months of data available for each region and initiative/usual care, not all of this was considered statistically reliable. In particular, the number of questionnaires administered in the Hamilton and Lower Hutt regions at the 18 month assessment date was very low, with sample sizes of less than 7 across the regions and initiatives/usual care (due to individuals dying or moving into residential care, and thus not being in the community to receive a questionnaire). We therefore did not include the 18 month data in our calculation of total community costs for Hamilton and Lower Hutt. While Christchurch had larger sample sizes at the 18 month assessment, we have used only the data up to 12 months in order to ensure comparability with Hamilton and Lower Hutt.7
Total community costs are therefore calculated by summing the 0 to 3 month community costs and the 4 to 12 month community costs for each region and initiative/usual care to get the total community costs over the 12-month period.
7 Note, however, that we do include the 18 month Christchurch data as a sensitivity test.
Economic Evaluation of ASPIRE 31 October 2006
Final Report 9
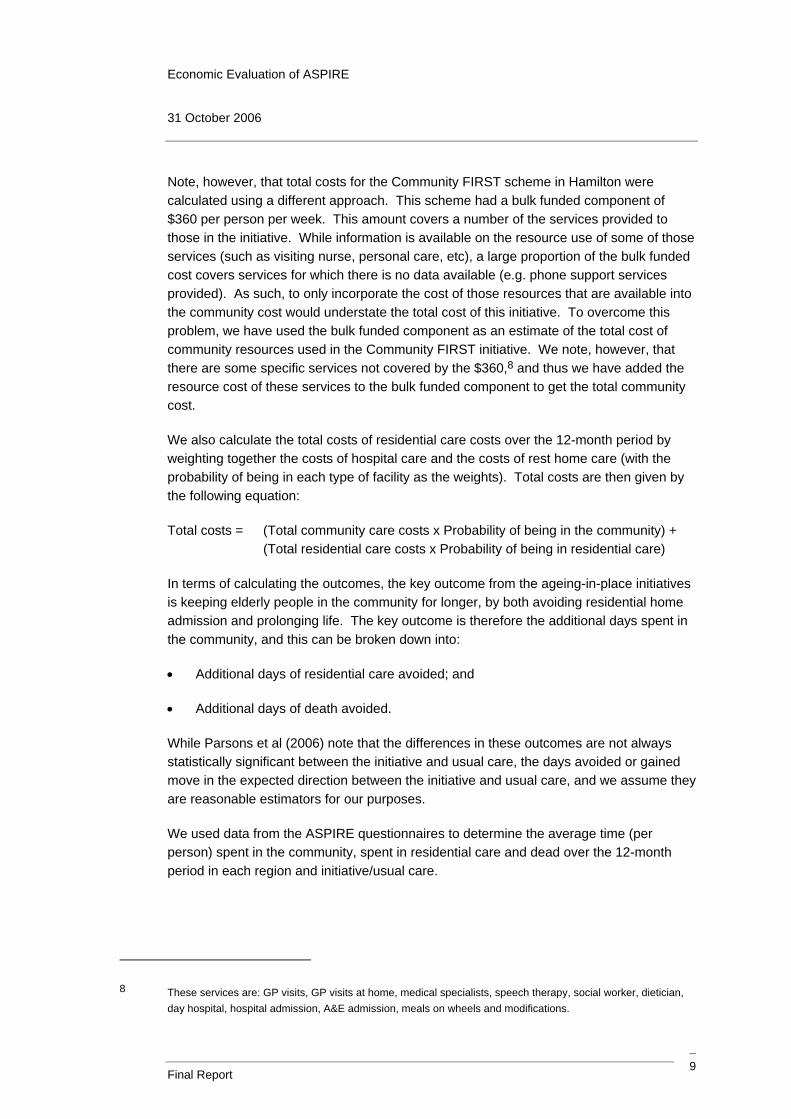
Note, however, that total costs for the Community FIRST scheme in Hamilton were calculated using a different approach. This scheme had a bulk funded component of $360 per person per week. This amount covers a number of the services provided to those in the initiative. While information is available on the resource use of some of those services (such as visiting nurse, personal care, etc), a large proportion of the bulk funded cost covers services for which there is no data available (e.g. phone support services provided). As such, to only incorporate the cost of those resources that are available into the community cost would understate the total cost of this initiative. To overcome this problem, we have used the bulk funded component as an estimate of the total cost of community resources used in the Community FIRST initiative. We note, however, that there are some specific services not covered by the $360,8 and thus we have added the resource cost of these services to the bulk funded component to get the total community cost.
We also calculate the total costs of residential care costs over the 12-month period by weighting together the costs of hospital care and the costs of rest home care (with the probability of being in each type of facility as the weights). Total costs are then given by the following equation:
Total costs = (Total community care costs x Probability of being in the community) + (Total residential care costs x Probability of being in residential care)
In terms of calculating the outcomes, the key outcome from the ageing-in-place initiatives is keeping elderly people in the community for longer, by both avoiding residential home admission and prolonging life. The key outcome is therefore the additional days spent in the community, and this can be broken down into:
• Additional days of residential care avoided; and
• Additional days of death avoided.
While Parsons et al (2006) note that the differences in these outcomes are not always statistically significant between the initiative and usual care, the days avoided or gained move in the expected direction between the initiative and usual care, and we assume they are reasonable estimators for our purposes.
We used data from the ASPIRE questionnaires to determine the average time (per person) spent in the community, spent in residential care and dead over the 12-month period in each region and initiative/usual care.
8 These services are: GP visits, GP visits at home, medical specialists, speech therapy, social worker, dietician, day hospital, hospital admission, A&E admission, meals on wheels and modifications.

Economic Evaluation of ASPIRE 31 October 2006
Final Report 10
3.3. RESULTS
As noted above, the ICER compares the incremental costs with the incremental benefits. For the ASPIRE CEA, we compared the incremental average total cost per person TC (that is, average total cost for initiative I less average total cost for usual care U ) with the incremental benefit per person. As noted above, the benefit is one of days in the community (Com ), days in residential care ( RC ) or days deceased ( D ). That is, for each region and initiative/usual care we can calculate three ICERs:
|| UI
UICom ComCom
TCTCICER−−
=
||ReUI
UIs RCRC
TCTCICER−−
=
|| UI
UID DD
TCTCICER−−
=
Each ICER represents, respectively, the incremental cost per person per day of community care gained, per day of residential care avoided, and per day deceased avoided.
We have calculated each ICER on the basis of the cost per person per annum. The results are shown in Table 2. The first part of the table shows the incremental costs and outcome days underlying the ICER calculations. The other two parts of this table show the incremental cost for each region calculated on the basis of cost per person per annum.
Table 2: Base Case Cost, Outcome and ICER Results for 0 to 12 month period
Results Hamilton (Community FIRST)
Lower Hutt (PIP) Christchurch (COSE)
Incremental costs and outcomes
Incremental Cost Per Person Over 12mth Period
13,842.66 7,828.28 157.49
Incremental Days in the Community Per Person Over 12mth Period
51 23 8
Incremental Days of Residential Care Avoided Per Person Over 12mth Period
16 22 7
Incremental Days Deceased Avoided Per
35 1 1

Economic Evaluation of ASPIRE 31 October 2006
Final Report 11
Results Hamilton (Community FIRST)
Lower Hutt (PIP) Christchurch (COSE)
Person Over 12mth Period
ICER: cost per person per annum
ICER community (days gained)
271.26 340.07 20.13
ICER residential (days avoided)
880.57 361.96 22.84
ICER deceased (days avoided)
392.27 5,545.03 190.74
The first part of these results show, for example, that while it cost an additional $13,843 per person for the Community FIRST scheme in Hamilton over one year, the average person in this initiative gained 51 additional days in the community, which is made up of avoiding 16 additional days in residential care, and avoiding 35 days deceased relative to the average person in usual care in Hamilton.
To interpret the ICER results, consider again the Hamilton ICER for the community. This implies that the Community FIRST scheme in Hamilton costs an additional $271 per person per annum for each additional day spent in the community. On this basis, the ICERs can be compared across regions. For example, the Christchurch COSE initiative is the most cost effective per additional day spent in the community, as it only cost an additional $20 more than usual care per person per annum compared with $271 more for Hamilton and $340 more for Lower Hutt. Similarly, the COSE initiative is also more cost effective in terms of residential care days avoided and death days avoided, costing an extra $23 per person per annum for each residential care day avoided and $191 per person per annum for each additional day deceased avoided.
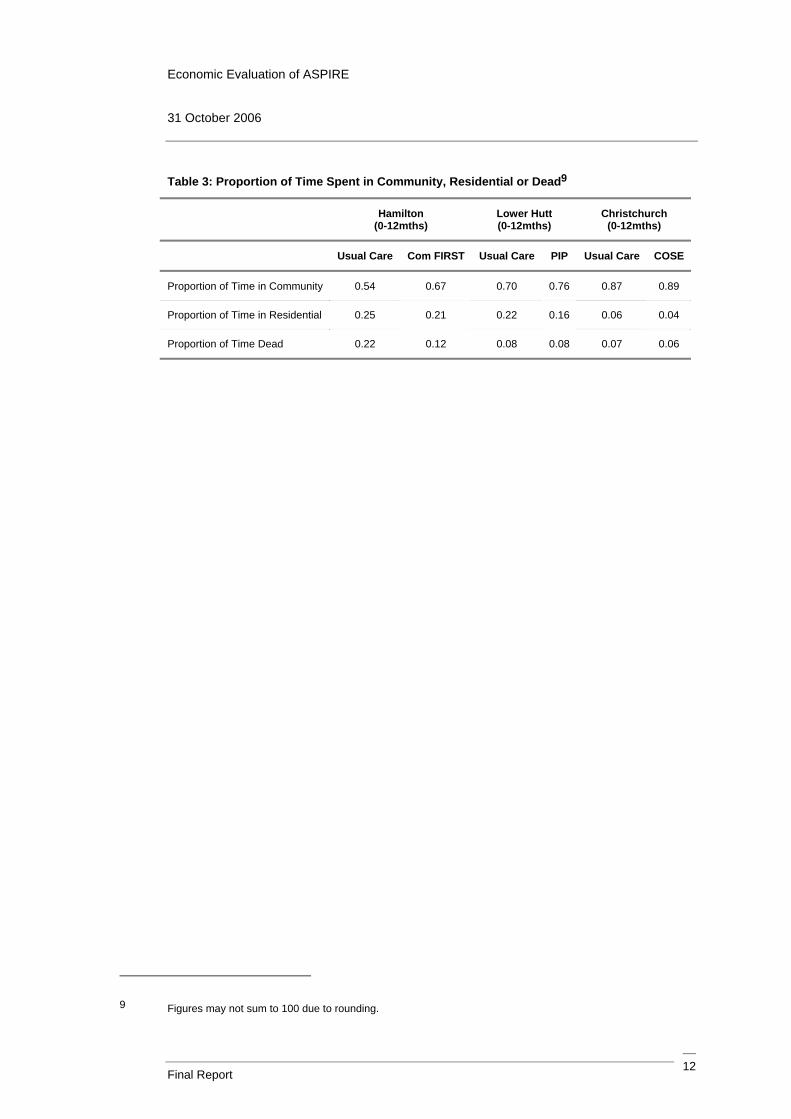
It is also informative to look at the average (per person) proportion of time spent in the community, in a residential home or deceased over the 12 month period. This information is shown in Table 3. It is clear from this that each initiative has the effect of increasing the time spent in the community, while decreasing the time spent in residential care or dead.
Economic Evaluation of ASPIRE 31 October 2006
Final Report 12
Table 3: Proportion of Time Spent in Community, Residential or Dead9
Hamilton (0-12mths)
Lower Hutt (0-12mths)
Christchurch (0-12mths)
Usual Care Com FIRST Usual Care PIP Usual Care COSE
Proportion of Time in Community 0.54 0.67 0.70 0.76 0.87 0.89
Proportion of Time in Residential 0.25 0.21 0.22 0.16 0.06 0.04
Proportion of Time Dead 0.22 0.12 0.08 0.08 0.07 0.06
9 Figures may not sum to 100 due to rounding.
Economic Evaluation of ASPIRE 31 October 2006
Final Report 13
4. SENSITIVITY TESTING
We ran the following sensitivity tests on our base case ICER results:
• Unit costs: we tested the impact of increasing/decreasing the unit costs of resources by 10%;
• Resource use: as the average resource use comes from sample data, it is possible to construct 95 percent confidence intervals around these averages, such that the true population has a 95 percent chance of lying in this confidence interval. Thus, we tested the impact of increasing/decreasing the average resource use for each resource to the upper/lower bound of its 95 percent confidence interval;
• Outcomes: similarly, the outcomes (days in the community, etc) are based on sampled data. We therefore tested the impact of increasing/decreasing the average days and probabilities for each outcome to the upper/lower bound of its 95 percent confidence interval; and
• Christchurch 18 month data: as noted earlier, we have statistically reliable data out to 18 months for the Christchurch initiative and usual care. Thus we calculated the ICER for Christchurch using this additional data, and converted it to an annual result, as a comparison with the 12 month ICER presented earlier.
The following sections provide the results from each of these sensitivity tests.
4.1. TESTING UNIT COST SENSITIVITY
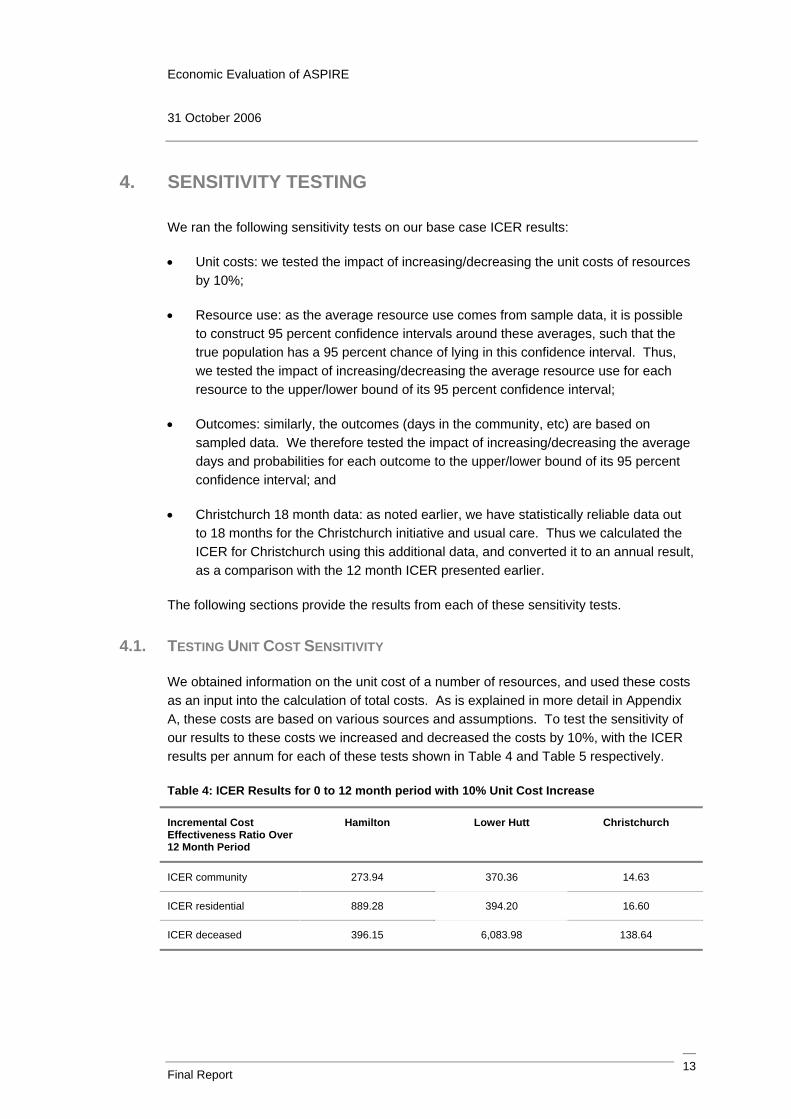
We obtained information on the unit cost of a number of resources, and used these costs as an input into the calculation of total costs. As is explained in more detail in Appendix A, these costs are based on various sources and assumptions. To test the sensitivity of our results to these costs we increased and decreased the costs by 10%, with the ICER results per annum for each of these tests shown in Table 4 and Table 5 respectively.
Table 4: ICER Results for 0 to 12 month period with 10% Unit Cost Increase
Incremental Cost Effectiveness Ratio Over 12 Month Period
Hamilton Lower Hutt Christchurch
ICER community 273.94 370.36 14.63
ICER residential 889.28 394.20 16.60
ICER deceased 396.15 6,083.98 138.64

Economic Evaluation of ASPIRE 31 October 2006
Final Report 14
Table 5: ICER Results for 0 to 12 month period with 10% Unit Cost Decrease
Incremental Cost Effectiveness Ratio Over 12 Month Period
Hamilton Lower Hutt Christchurch
ICER community 268.58 309.78 25.63
ICER residential 871.87 329.72 29.08
ICER deceased 388.39 5,051.59 242.85
In comparison with the 12 month results of Table 2, the ICERs are not overly sensitive to changes in the unit costs. While the degree to which the ICERs change with changes in the unit costs varies by region and ICER, the results are still of a similar magnitude to the base case results and the relative cost effectiveness of each region remains unchanged.
4.2. TESTING AVERAGE RESOURCE USE SENSITIVITY
As noted above, for each resource used we multiplied the unit cost for each resource by the average amount of each resource used. As these averages are drawn from a sample, we can use the standard deviation and sample size to construct 95 percent confidence intervals around the average. In Table 6 and Table 7 respectively we test the impact on our results of increase and decreasing the average resource use for each resource to the upper and lower bound of that confidence interval. Note that, in some instances the lower bound of the confidence interval is a negative number. In these cases we have assumed the average resource use is zero units.
Table 6: ICER Results for 0 to 12 month period with Average Resource Use Increase to Upper Bound on 95% Confidence Interval
Incremental Cost Effectiveness Ratio Over 12 Month Period
Hamilton Lower Hutt Christchurch
ICER community 232.79 378.11 135.77
ICER residential 755.68 402.45 154.02
ICER deceased 336.64 6,165.30 1,286.35

Economic Evaluation of ASPIRE 31 October 2006
Final Report 15
Table 7: ICER Results for 0 to 12 month period with Average Resource Use Decrease to Lower Bound on 95% Confidence Interval
Incremental Cost Effectiveness Ratio Over 12 Month Period
Hamilton Lower Hutt Christchurch
ICER community 321.96 317.26 -80.66
ICER residential 1,045.15 337.68 91.50
ICER deceased 465.59 5,137.04 764.19
The ICER results here are clearly quite sensitive to changes in the average amount of resource used. An increase to the upper bound of the confidence interval changes the relative cost effectiveness of the regions for the residential and survival ICERs, making Hamilton the least cost effective for the former and the most cost effective for the latter. The Christchurch ICER also changes substantially from its base case results, while there is less of a change in the ICERs for Hamilton and Lower Hutt relative to the base case.
For a decrease in the average resource use to the lower bound of the confidence interval, there are also considerable changes for Christchurch. Moreover, the signs on the Christchurch ICERs also change, as the total cost of the COSE initiative is less than the total cost of usual care under this test. In other words, it is possible that the COSE initiative could result in a net cost saving.
4.3. TESTING OUTCOME SENSITIVITY
The outcomes (days in community, residential care and dead) enter the analysis in two ways: as the denominator in the ICER calculations; and as probabilities for weighting community and residential costs. We tested the sensitivity of our results to changes in these outcomes by both increasing and decreasing the outcomes (as both days and probabilities) to the upper and lower bound of their 95 percent confidence interval.
It is not possible to change all three outcomes simultaneously, as to do so would result in the outcomes no longer summing to 365 days or a probability of 1. Thus we changed each outcome individually, and adjusted the remaining two outcomes to ensure they stay in the same relative proportion to the base case. The results for increasing the days and probabilities in the community, residential care and deceased are shown respectively in Table 8, Table 9 and Table 10. Similarly the results for decreasing the outcomes are shown in Table 11, Table 12 and Table 13.

Economic Evaluation of ASPIRE 31 October 2006
Final Report 16
Table 8: ICER Results for 0 to 12 month period with Community Outcomes Increased to Upper Bound on 95% Confidence Interval
Incremental Cost Effectiveness Ratio Over 12 Month Period
Hamilton Lower Hutt Christchurch
ICER community 240.29 173.80 40.57
ICER residential 662.20 202.00 54.52
ICER deceased 377.20 1,235.19 162.46
Table 9: ICER Results for 0 to 12 month period with Residential Outcomes Increased to Upper Bound on 95% Confidence Interval
Incremental Cost Effectiveness Ratio Over 12 Month Period
Hamilton Lower Hutt Christchurch
ICER community 340.79 514.79 16.14
ICER residential 953.21 531.14 17.77
ICER deceased 530.81 16,405.04 201.30
Table 10: ICER Results for 0 to 12 month period with Deceased Outcomes Increased to Upper Bound on 95% Confidence Interval
Incremental Cost Effectiveness Ratio Over 12 Month Period
Hamilton Lower Hutt Christchurch
ICER community 256.51 346.18 16.52
ICER residential 1,284.91 354.85 15.97
ICER deceased 320.69 13,670.39 337.07
Table 11: ICER Results for 0 to 12 month period with Community Outcomes Decreased to Lower Bound on 95% Confidence Interval
Incremental Cost Effectiveness Ratio Over 12 Month Period
Hamilton Lower Hutt Christchurch
ICER community 298.81 500.46 0.19
ICER residential 1,152.44 492.64 0.19
ICER deceased 403.82 32,848.63 5.55

Economic Evaluation of ASPIRE 31 October 2006
Final Report 17
Table 12: ICER Results for 0 to 12 month period with Residential Outcomes Decreased to Lower Bound on 95% Confidence Interval
Incremental Cost Effectiveness Ratio Over 12 Month Period
Hamilton Lower Hutt Christchurch
ICER community 209.60 131.78 25.35
ICER residential 793.41 145.75 29.95
ICER deceased 285.02 1,358.10 182.76
Table 13: ICER Results for 0 to 12 month period with Deceased Outcomes Decreased to Lower Bound on 95% Confidence Interval
Incremental Cost Effectiveness Ratio Over 12 Month Period
Hamilton Lower Hutt Christchurch
ICER community 288.44 334.96 22.71
ICER residential 664.05 368.34 29.38
ICER deceased 510.29 3,663.29 105.30
These results suggest the ICERs are sensitive to changes in the outcomes within a 95 percent confidence interval. However, in many cases the changes are not substantially different from the base case results. In addition, the COSE initiative in Christchurch generally remains the most cost effective of the three initiatives, with the relative cost effectiveness of the Community FIRST and PIP initiatives changing depending on the particular sensitivity tested.
4.4. TESTING CHRISTCHURCH 18 MONTH SENSITIVITY
We have data available for the Christchurch initiative and usual care that is derived from a relatively large sample size and is thus likely to be statistically reliable. We calculated our ICER results for Christchurch using this 18 month data, although we have converted our results to a per annum basis for comparison with the base case per annum results. Results from this are shown in Table 14.
Table 14: ICER Results for 0 – 12 month period for all regions and 0 – 18 month period for Christchurch
Incremental Cost Effectiveness Ratio Over 12 Month Period
Hamilton 0 -12 months
Lower Hutt 0 – 12 months
Christchurch 0 – 12 months
Christchurch 0 – 18 months
ICER community 271.26 340.07 20.13 -120.18

Economic Evaluation of ASPIRE 31 October 2006
Final Report 18
Incremental Cost Effectiveness Ratio Over 12 Month Period
Hamilton 0 -12 months
Lower Hutt 0 – 12 months
Christchurch 0 – 12 months
Christchurch 0 – 18 months
ICER residential 880.57 361.96 22.84 -177.74
ICER deceased 392.27 5,545.03 190.74 -372.50
While the 18 month results for Christchurch do not change the position of the COSE programme as the most cost effective, the signs on the ICERs do change. For example, when we include the 18 month data for Christchurch, the COSE programme costs $120 less than usual care for each additional day spent in the community. In contrast, the 12 month data for Christchurch shows that the COSE programme costs $20 more than usual care for each additional day in the community. This appears to be the result of changes in the proportion of time spent in residential care in the last 6 months of the 0 to 18 month period, particularly for the usual care scenario – that is, the proportion of time spent in residential care in the usual care increases from the 12 to 18 month period by a lot more in the usual care scenario than it does in the initiative, thus increasing the costs in usual care.
Economic Evaluation of ASPIRE 31 October 2006
Final Report 19
5. CONCLUSIONS AND CAVEATS
In this report, we have analysed the cost effectiveness of three ageing-in-place initiatives in Hamilton (the Community FIRST initiative), Lower Hutt (the PIP initiative) and Christchurch (the COSE initiative), relative to usual care. While the cost of each initiative was more than the cost for usual care, the three initiatives all had the result of increasing the amount of time spent in the community relative to usual care over a 12 month period, by decreasing the time spent in residential care and the time spent deceased.
In terms of the relative cost effectiveness of each initiative, the COSE initiative in Christchurch is generally the most cost effective of the three. Our base case results suggest that COSE costs an additional $20 per person over a 12 month period for each extra day spent in the community relative to usual care, while for an extra day in the community the Community FIRST initiative costs an additional $271 per person and PIP costs an additional $340 per person.
Our results are subject to a number of caveats. Firstly, the data is taken from a number of different sources that may not necessarily be consistent with each other. Moreover, the data sources also have individual problems. Some of the data has been taken from questionnaires administered to survey participants. However, this is likely to be unreliable due to problems associated with poor recall of elderly participants. While we have replaced these data to the extent possible with invoicing data from the HealthPAC and CCPS databases, these sources may not pick up all resources used over the period (due to discrepancies between the date of invoicing and date of actual resource use) and do not provide a breakdown of resource use into the same 3 month, 12 month and 18 month assessment periods of the questionnaire data.
The data was also subject to low sample sizes at the 18 month collection period in Hamilton and Lower Hutt. While we have not used the data for these two regions, the sensitivity testing shows that including the Christchurch 18 month data gives some substantial changes to the ICER results. Accordingly, it is possible that a larger sample size for Hamilton and Lower Hutt at the 18 month period, or even a longer time period of analysis across all three regions, would give significant changes in results.
Our sensitivity analysis also suggests that the results can be quite sensitive to changes in average resource use. Even within the bounds of a 95 percent confidence interval, the ICER results can change quite considerably. This suggests that if a different sample were chosen then the results may be quite different.

Economic Evaluation of ASPIRE 31 October 2006
Final Report 20
Caution should also be exercised in interpreting the results of the Community FIRST intervention in Hamilton. As noted above, we used the $360 per person per week bulk funded cost as the community cost of this intervention, plus resource costs not covered by this amount. This $360 covers a range of resources, only some of which we have information on. We have assumed that the $360 accurately reflects the cost of all resources used in the initiative, however it is possible that this may underestimate or overestimate the cost of the actual resource use, and this is something we have not been able to account for.
It should also be noted that the sample for the Community FIRST initiative had much higher levels of disability than the samples for the PIP and COSE initiatives (see p.64 of Parsons et al, 2006). This difference may influence the final results, as Community FIRST may appear much more expensive for the outcome it achieves, but this is because it faced greater challenges with its sampled participants. While adjusting for this difference may be conceptually possible, it is not clear to us how this could be done from the data we had available.10 Moreover, adjusted and unadjusted figures reported by Parsons et al (2006, p.71) for Christchurch show very little difference. While we cannot be certain of the differences in making an adjustment to the other regions, the sensitivity testing we have conducted should capture this variability.
10 In terms of converting the unadjusted and adjusted hazard ratios of Parsons et al (2006) into changes in the probabilities entering the cost effectiveness analysis.

Economic Evaluation of ASPIRE 31 October 2006
Final Report Page 21
APPENDIX A: DETAILED DESCRIPTION OF DATA, METHODOLOGY AND RESULTS
A.1 DATA
The data sources we used for the CEA are as follows:
• ASPIRE study questionnaires: questionnaires were administered to participants in the study at the time they were recruited into the study and at 3, 12 and 18 month intervals after recruitment. The questionnaires were only administered to participants in the community at the date of their assessment, so this excludes those who had moved permanently into a residential home or who were not in the study long enough to receive a questionnaire (see notes below on “censored” observations);
• HealthPAC and CCPS data: we used invoicing data from HealthPAC and the Client Claims Processing System (CCPS). These data were in the form of units and costs invoiced to the DHB for services provided to ASPIRE study participants over the study period; and
• The initial draft economic evaluation: we utilised information from an initial draft of an economic analysis by Brown (2006).11
The ASPIRE questionnaires were based on self-reported resource use by elderly, which is likely to be unreliable due to poor recall. As such, we used as little of this data as possible, and have replaced it with the HealthPAC and CCPS data, where such replacement data were available. We set out the specific data used in our analysis and its source in Table 15.
Table 15: Data Used in CEA
Data Used Data Source
Resource use for the following resources: GP visits, GP visits at home, day centre, day hospital, hospital admission, A&E admission, meals on wheels, transport, pharmacy visits and modifications.12
ASPIRE questionnaires
Resource use of the following resources: medical specialist, visiting nurse, volunteer services,
HealthPAC data
11 Brown, P. (2006), “Economic Evaluation of the Assessment of Service Promoting Independence and Recovery in Elders (ASPIRE)”, Centre for Health Services Research and Policy, University of Auckland.
12 These data were not available from the HealthPAC or CCPS datasets. The questionnaire data for GP visits and GP visits at home are relatively reliable, as they were verified by caregivers and family members of the elderly person.

Economic Evaluation of ASPIRE 31 October 2006
Final Report Page 22
Data Used Data Source
physiotherapy, occupational therapy, speech therapy, day care, social worker and dietician.
Resource use of the following resources: personal care, household management, carer support, respite and day activities.
CCPS data
Days (and probabilities) in community, residential and dead over the period
ASPIRE questionnaires
Distribution of residential home placements (rest home or hospital)
CCPS data
Unit cost of resources Brown (2006)
These data sources were not all in a consistent and usable format. Thus, we cleansed these datasets in the following ways:
• For the ASPIRE questionnaire data, the questionnaires asked for resource use over a recent time period, which for the data we used was typically two weeks, one month or three months. Thus, the questionnaire does not always provide an indication of the resource use over the entire period. Nonetheless, we assumed that the resource use over the time period given in the questionnaire is representative of the resource use over the entire assessment period, and made an adjustment to reflect this. For example, if a participant’s questionnaire at the 3 month assessment gives 2 visits to the GP in the last month, then we assumed that there were 6 visits (2 per month) over the entire 0 to 3 month assessment period;
• For the HealthPAC and CCPS data, the resource use was invoiced over a time period that did not necessarily match up with the particular assessment period (0-3 months, 4-12 months or 13-18 months). To adjust for this we took the time period on the invoice and allocated a proportion of that to the assessment period on a pro rata basis, thus giving the resource use over that entire time period.
A.2 METHODOLOGY
A.2.1 Sample Size
The study of the three ageing-in-place initiatives was undertaken over a 24 month period (from 10 November 2003 to 11 November 2005). Recruitment in to the study sample was staggered (with participants entering the sample throughout the assessment period) and the ASPIRE questionnaires were administered to those in the community at the date of recruitment and 3, 12 and 18 month intervals from their date of recruitment. As such, those participants who had moved into a residential home or had died at one of their assessment dates did not receive a questionnaire, and thus the sample size for which there is questionnaire data decreases over time.

Economic Evaluation of ASPIRE 31 October 2006
Final Report Page 23
Furthermore, as a result of the staggered recruitment, a number of participants that were recruited late in the study period were not in the study long enough to receive the later questionnaires (which we refer to as “censored” observations). In the COSE and PIP initiatives, the sample was recruited over 12 months, and thus participants recruited after the first 6 months of the study period would not receive their 18 month questionnaire as the study would have ended. For the Community FIRST initiative the sample was recruited over 18 months and thus some participants recruited after the first year of the study period would not receive their 12 or 18 month questionnaires before the end of the study. Thus, the sample size also decreased over time because of this effect.
Table 16 shows the changes in the number of participants receiving questionnaires at each of the 3, 12 and 18 month assessment dates, by region and initiative/usual care. It is obvious that there is a clear fall in the sample sizes over time. In addition, the samples in Hamilton and Lower Hutt are very small at the 18 month assessment. Accordingly, we have not used the 18 month data for Hamilton and Lower Hutt, as the results will lack statistical power. We use both the sample up to 12 months and the entire sample for Christchurch, but convert our results for the latter to an annual basis to allow meaningful comparisons.
Table 16: Sample Size from ASPIRE Questionnaires
Hamilton Lower Hutt Christchurch
Assessment Date
Usual Care Com FIRST Usual Care PIP Usual Care COSE
Baseline 57 54 53 50 181 169
3 months 34 45 35 37 160 151
12 months 12 15 19 26 117 116
18 months 5 7 6 7 46 62
A further issue regarding the sample is whether to include the data points of censored observations, where they exist. For example, if a participant did not receive a 12 month survey due to being a censored observation, but did receive a 3 month survey, should that participant’s 3 month survey be removed from the sample to be analysed? Our approach has been to include censored observations where they exist, as this ensures the sample size is not reduced and thus improves the accuracy of the results. So in this example, the participant’s 3 month survey would be included in the analysis of the 0 to 3 month period.
Economic Evaluation of ASPIRE 31 October 2006
Final Report Page 24
Note also that there is no measure of resource use available for those who spent some time in the community over an assessment period, but were not in the community at the date of the assessment (and so did not receive a questionnaire). However our calculations implicitly assume that the average of the data for those who were in the community at the assessment date is representative of those who were only in the community for a portion of the assessment period.
A.2.2 Calculation of Costs
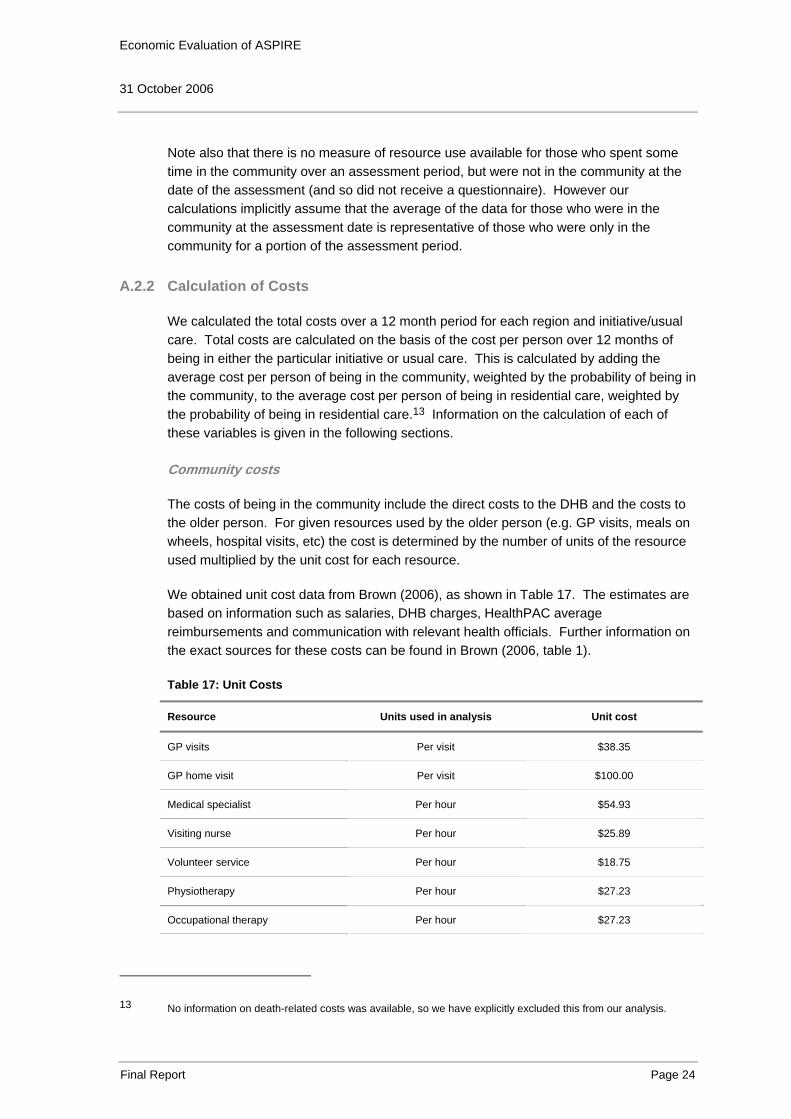
We calculated the total costs over a 12 month period for each region and initiative/usual care. Total costs are calculated on the basis of the cost per person over 12 months of being in either the particular initiative or usual care. This is calculated by adding the average cost per person of being in the community, weighted by the probability of being in the community, to the average cost per person of being in residential care, weighted by the probability of being in residential care.13 Information on the calculation of each of these variables is given in the following sections.
Community costs
The costs of being in the community include the direct costs to the DHB and the costs to the older person. For given resources used by the older person (e.g. GP visits, meals on wheels, hospital visits, etc) the cost is determined by the number of units of the resource used multiplied by the unit cost for each resource.
We obtained unit cost data from Brown (2006), as shown in Table 17. The estimates are based on information such as salaries, DHB charges, HealthPAC average reimbursements and communication with relevant health officials. Further information on the exact sources for these costs can be found in Brown (2006, table 1).
Table 17: Unit Costs
Resource Units used in analysis Unit cost
GP visits Per visit $38.35
GP home visit Per visit $100.00
Medical specialist Per hour $54.93
Visiting nurse Per hour $25.89
Volunteer service Per hour $18.75
Physiotherapy Per hour $27.23
Occupational therapy Per hour $27.23
13 No information on death-related costs was available, so we have explicitly excluded this from our analysis.

Economic Evaluation of ASPIRE 31 October 2006
Final Report Page 25
Resource Units used in analysis Unit cost
Speech therapy Per hour $27.23
Day care Per hour $5.8314
Social worker Per hour $27.23
Dietician Per hour $27.23
Day centre Per day $46.6615
Day hospital Per day $185.05
Hospital stay Per visit $3410.0016
A&E visit Per visit $457
Meals on wheels Per meal $7.16
Pharmacy visit Per visit $15.00
Transport Per trip $15.50
Personal care Per hour $20.14
Household management Per hour $18.87
Carer support Per hour $3.0217
Respite Per hour $4.8318
Day activity Per hour $5.8319
14 We have converted the unit cost for day care from $46.66 per day in Brown (2006) to per hourly on the basis of an 8 hour day.
15 We have used the unit cost for day care (per day) given in Brown (2006) as the unit cost for a day centre.
16 We have used the unit cost for a hospital admission of $682 per day given in Brown (2006), and multiplied by the average length of stay (5 days) as noted in Brown (2006) to obtain the unit cost per visit.
17 We have converted the unit cost for carer support from $72.59 per day in Brown (2006) to per hourly on the basis of a 24 hour day.
18 We have converted the unit cost for respite from $115.93 per day in Brown (2006) to per hourly on the basis of a 24 hour day.
19 Brown (2006) does not give the unit cost for day activities, and thus we have assumed the hourly cost is the same as that for day care.

Economic Evaluation of ASPIRE 31 October 2006
Final Report Page 26
We also incorporated cost information on the upfront assessment costs for each ageing-in-place initiative or usual care. This was again sourced from Brown (2006), where we have used the following costs:
• Hamilton: the cost of the needs assessment and service coordination for usual care in Hamilton is given as $225. For the Community FIRST scheme, we used the bulk funded cost of $360 per person per week, as explained earlier;
• Lower Hutt: the usual care cost for the needs assessment and service coordination in Lower Hutt is $66.21. The initial assessment cost for entry into the PIP initiative is $595; and
• Christchurch: the usual care cost for the needs assessment and service coordination is $314.99. The initial assessment cost for entry into the COSE initiative is $380.
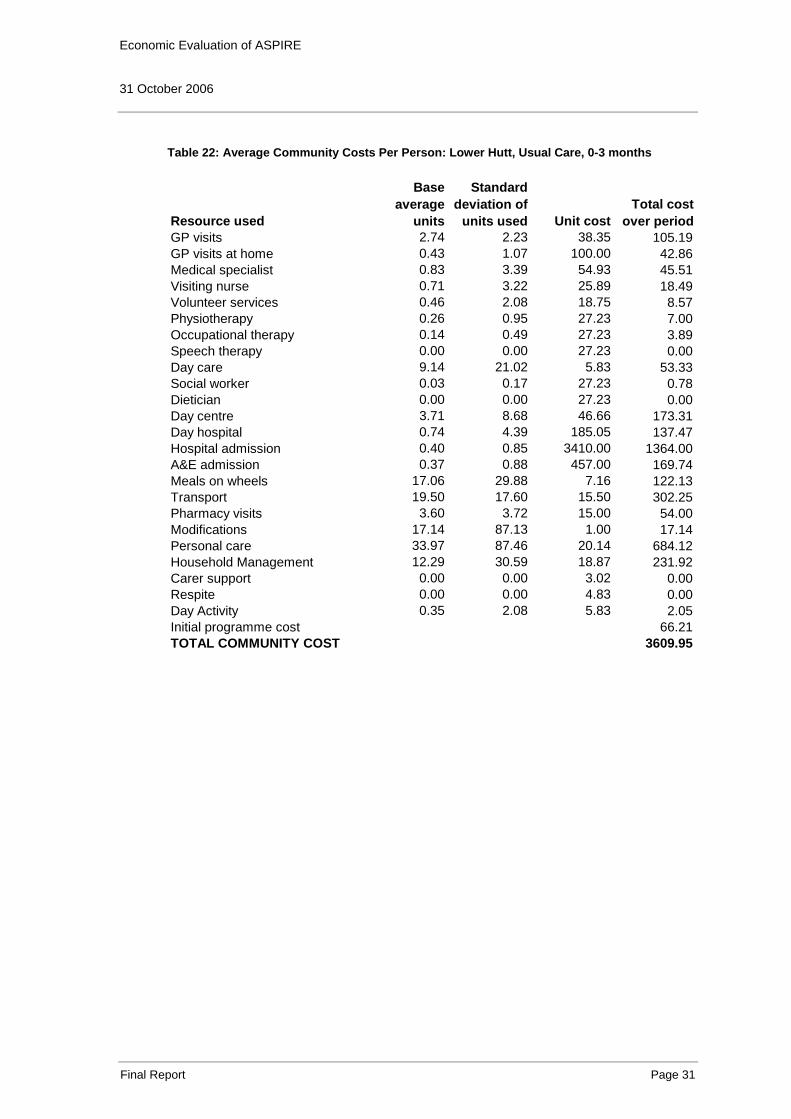
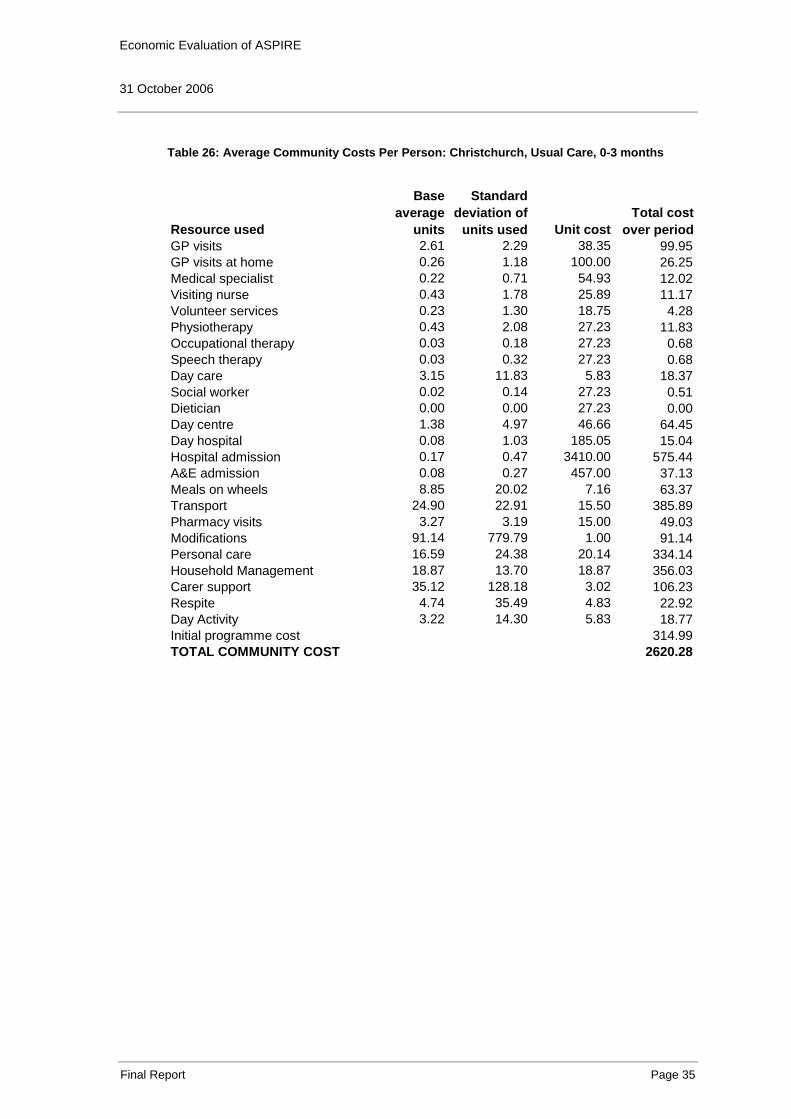
Using the data on resource use from the various sources noted above, we calculated the average use of each resource per person for each region and initiative/usual care, over the 0-3 month, 4-12 month and 12-18 month (for Christchurch only) periods. These averages, along with the standard deviation, for each resource are shown in the first two columns of Table 18 through to Table 31 below. These tables also show the calculation of the total community cost. Note that for the Community FIRST initiative in Hamilton, the actual community cost per person is given by $360 per week multiplied by the number of weeks in the particular time period, plus the cost of other resources for which we have data on that are not covered by the $360. Nonetheless, for completeness we include the individual resource costs for all those resources that we have data available for.

Economic Evaluation of ASPIRE 31 October 2006
Final Report Page 27
Table 18: Average Community Costs Per Person: Hamilton, Usual Care, 0-3 months
Resource used
Base average
units
Standard deviation of
units used Unit costTotal cost
over periodGP visits 1.59 1.84 38.35 60.91GP visits at home 0.44 1.67 100.00 44.12Medical specialist 0.30 0.79 54.93 16.69Visiting nurse 0.83 2.51 25.89 21.58Volunteer services 1.62 4.79 18.75 30.33Physiotherapy 0.39 0.95 27.23 10.68Occupational therapy 0.50 1.48 27.23 13.48Speech therapy 0.00 0.00 27.23 0.00Day care 3.35 6.14 5.83 19.56Social worker 0.14 0.45 27.23 3.74Dietician 0.00 0.00 27.23 0.00Day centre 3.63 7.01 46.66 169.49Day hospital 0.00 0.00 185.05 0.00Hospital admission 0.26 0.62 3410.00 902.65A&E admission 0.12 0.33 457.00 53.76Meals on wheels 9.26 22.33 7.16 66.34Transport 26.00 29.25 15.50 403.00Pharmacy visits 10.88 32.82 15.00 163.24Modifications 45.88 177.89 1.00 45.88Personal care 56.62 74.72 20.14 1140.31Household Management 7.64 9.37 18.87 144.08Carer support 34.17 78.64 3.02 103.36Respite 0.00 0.00 4.83 0.00Day Activity 0.00 0.00 5.83 0.00Initial programme cost 225.00TOTAL COMMUNITY COST 3638.18

Economic Evaluation of ASPIRE 31 October 2006
Final Report Page 28
Table 19: Average Community Costs Per Person: Hamilton, Community FIRST, 0-3 months
Resource used
Base average
units
Standard deviation of
units used Unit costTotal cost
over periodGP visits 2.40 2.76 38.35 92.04GP visits at home 0.53 1.47 100.00 53.33Medical specialist 0.41 0.73 54.93 22.58Visiting nurse 0.18 0.39 25.89 4.60Volunteer services 0.18 0.78 18.75 3.33Physiotherapy 0.34 0.90 27.23 9.28Occupational therapy 0.08 0.45 27.23 2.12Speech therapy 0.02 0.15 27.23 0.61Day care 5.42 12.37 5.83 31.63Social worker 0.00 0.00 27.23 0.00Dietician 0.02 0.15 27.23 0.61Day centre 7.94 14.79 46.66 370.69Day hospital 0.29 1.35 185.05 53.46Hospital admission 0.18 0.49 3410.00 606.22A&E admission 0.13 0.34 457.00 60.93Meals on wheels 20.53 29.57 7.16 147.02Transport 34.86 38.83 15.50 540.39Pharmacy visits 5.56 5.18 15.00 83.33Modifications 137.29 724.58 1.00 137.29Personal care 7.17 23.90 20.14 144.47Household Management 1.88 7.52 18.87 35.50Carer support 0.00 0.00 3.02 0.00Respite 0.00 0.00 4.83 0.00Day Activity 0.00 0.00 5.83 0.00Community cost using known resources 2399.43TOTAL COMMUNITY COST (bulk funded + resources not covered) 5854.09

Economic Evaluation of ASPIRE 31 October 2006
Final Report Page 29
Table 20: Average Community Costs Per Person: Hamilton, Usual Care, 4-12 months
Resource used
Base average
units
Standard deviation of
units used Unit costTotal cost
over periodGP visits 6.00 8.86 38.35 230.10GP visits at home 0.00 0.00 100.00 0.00Medical specialist 0.00 0.00 54.93 0.00Visiting nurse 0.43 0.79 25.89 11.15Volunteer services 0.67 1.78 18.75 12.50Physiotherapy 0.00 0.00 27.23 0.00Occupational therapy 0.17 0.39 27.23 4.54Speech therapy 0.04 0.14 27.23 1.13Day care 6.67 10.70 5.83 38.88Social worker 0.00 0.00 27.23 0.00Dietician 0.00 0.00 27.23 0.00Day centre 32.50 52.15 46.66 1516.45Day hospital 0.00 0.00 185.05 0.00Hospital admission 0.00 0.00 3410.00 0.00A&E admission 0.00 0.00 457.00 0.00Meals on wheels 15.00 51.96 7.16 107.40Transport 87.75 70.80 15.50 1360.13Pharmacy visits 10.75 12.23 15.00 161.25Modifications 458.33 1495.73 1.00 458.33Personal care 164.62 216.42 20.14 3315.52Household Management 35.29 35.28 18.87 665.90Carer support 151.12 289.82 3.02 457.08Respite 0.00 0.00 4.83 0.00Day Activity 0.00 0.00 5.83 0.00Initial programme cost 0.00TOTAL COMMUNITY COST 8340.37

Economic Evaluation of ASPIRE 31 October 2006
Final Report Page 30
Table 21: Average Community Costs Per Person: Hamilton, Community FIRST, 4-12 months
Resource used
Base average
units
Standard deviation of
units used Unit costTotal cost
over periodGP visits 9.60 9.90 38.35 368.16GP visits at home 0.00 0.00 100.00 0.00Medical specialist 0.67 1.19 54.93 36.62Visiting nurse 0.02 0.09 25.89 0.58Volunteer services 0.00 0.00 18.75 0.00Physiotherapy 0.13 0.52 27.23 3.63Occupational therapy 0.00 0.00 27.23 0.00Speech therapy 0.07 0.26 27.23 1.82Day care 25.00 51.29 5.83 145.81Social worker 0.27 1.03 27.23 7.26Dietician 0.00 0.00 27.23 0.00Day centre 50.70 62.45 46.66 2365.66Day hospital 0.00 0.00 185.05 0.00Hospital admission 0.40 1.06 3410.00 1364.00A&E admission 0.60 1.68 457.00 274.20Meals on wheels 60.00 87.83 7.16 429.60Transport 153.40 171.57 15.50 2377.70Pharmacy visits 18.00 15.38 15.00 270.00Modifications 205.33 795.25 1.00 205.33Personal care 22.50 72.92 20.14 453.25Household Management 1.67 6.45 18.87 31.44Carer support 0.00 0.00 3.02 0.00Respite 0.00 0.00 4.83 0.00Day Activity 0.00 0.00 5.83 0.00Community cost using known resources 8335.06TOTAL COMMUNITY COST (bulk funded + resources not covered) 16726.99
Economic Evaluation of ASPIRE 31 October 2006
Final Report Page 31
Table 22: Average Community Costs Per Person: Lower Hutt, Usual Care, 0-3 months
Resource used
Base average
units
Standard deviation of
units used Unit costTotal cost
over periodGP visits 2.74 2.23 38.35 105.19GP visits at home 0.43 1.07 100.00 42.86Medical specialist 0.83 3.39 54.93 45.51Visiting nurse 0.71 3.22 25.89 18.49Volunteer services 0.46 2.08 18.75 8.57Physiotherapy 0.26 0.95 27.23 7.00Occupational therapy 0.14 0.49 27.23 3.89Speech therapy 0.00 0.00 27.23 0.00Day care 9.14 21.02 5.83 53.33Social worker 0.03 0.17 27.23 0.78Dietician 0.00 0.00 27.23 0.00Day centre 3.71 8.68 46.66 173.31Day hospital 0.74 4.39 185.05 137.47Hospital admission 0.40 0.85 3410.00 1364.00A&E admission 0.37 0.88 457.00 169.74Meals on wheels 17.06 29.88 7.16 122.13Transport 19.50 17.60 15.50 302.25Pharmacy visits 3.60 3.72 15.00 54.00Modifications 17.14 87.13 1.00 17.14Personal care 33.97 87.46 20.14 684.12Household Management 12.29 30.59 18.87 231.92Carer support 0.00 0.00 3.02 0.00Respite 0.00 0.00 4.83 0.00Day Activity 0.35 2.08 5.83 2.05Initial programme cost 66.21TOTAL COMMUNITY COST 3609.95

Economic Evaluation of ASPIRE 31 October 2006
Final Report Page 32
Table 23: Average Community Costs Per Person: Lower Hutt, PIP, 0-3 months
Resource used
Base average
units
Standard deviation of
units used Unit costTotal cost
over periodGP visits 2.76 2.59 38.35 105.72GP visits at home 0.89 1.85 100.00 89.19Medical specialist 0.38 0.72 54.93 20.78Visiting nurse 6.46 36.77 25.89 167.24Volunteer services 0.03 0.16 18.75 0.51Physiotherapy 1.99 3.08 27.23 54.21Occupational therapy 0.05 0.33 27.23 1.47Speech therapy 0.00 0.00 27.23 0.00Day care 5.81 17.75 5.83 33.89Social worker 0.00 0.00 27.23 0.00Dietician 0.00 0.00 27.23 0.00Day centre 4.74 12.69 46.66 221.32Day hospital 0.00 0.00 185.05 0.00Hospital admission 0.30 0.46 3410.00 1013.78A&E admission 0.30 0.46 457.00 135.86Meals on wheels 17.84 31.70 7.16 127.72Transport 27.49 22.47 15.50 426.03Pharmacy visits 4.03 4.84 15.00 60.41Modifications 599.27 3283.82 1.00 599.27Personal care 42.22 68.21 20.14 850.29Household Management 27.11 73.48 18.87 511.54Carer support 0.00 0.00 3.02 0.00Respite 0.00 0.00 4.83 0.00Day Activity 0.00 0.00 5.83 0.00Initial programme cost 595.00TOTAL COMMUNITY COST 5014.23

Economic Evaluation of ASPIRE 31 October 2006
Final Report Page 33
Table 24: Average Community Costs Per Person: Lower Hutt, Usual Care, 4-12 months
Resource used
Base average
units
Standard deviation of
units used Unit costTotal cost
over periodGP visits 7.11 7.69 38.35 272.49GP visits at home 0.95 2.84 100.00 94.74Medical specialist 0.05 0.23 54.93 2.89Visiting nurse 0.45 1.12 25.89 11.58Volunteer services 0.00 0.00 18.75 0.00Physiotherapy 0.16 0.50 27.23 4.30Occupational therapy 0.00 0.00 27.23 0.00Speech therapy 0.00 0.00 27.23 0.00Day care 1.89 4.69 5.83 11.05Social worker 0.00 0.00 27.23 0.00Dietician 0.11 0.46 27.23 2.87Day centre 12.32 26.17 46.66 574.65Day hospital 0.00 0.00 185.05 0.00Hospital admission 0.79 1.69 3410.00 2692.11A&E admission 0.16 0.69 457.00 72.16Meals on wheels 21.32 56.86 7.16 152.62Transport 69.33 76.33 15.50 1074.67Pharmacy visits 12.79 10.81 15.00 191.84Modifications 2.11 9.18 1.00 2.11Personal care 35.25 70.99 20.14 710.03Household Management 13.29 32.18 18.87 250.78Carer support 0.00 0.00 3.02 0.00Respite 0.41 1.78 4.83 1.98Day Activity 9.60 30.62 5.83 55.99Initial programme cost 0.00TOTAL COMMUNITY COST 6178.84

Economic Evaluation of ASPIRE 31 October 2006
Final Report Page 34
Table 25: Average Community Costs Per Person: Lower Hutt, PIP, 4-12 months
Resource used
Base average
units
Standard deviation of
units used Unit costTotal cost
over periodGP visits 6.58 5.43 38.35 252.23GP visits at home 1.38 3.31 100.00 138.46Medical specialist 0.01 0.07 54.93 0.70Visiting nurse 0.27 0.86 25.89 6.97Volunteer services 0.77 3.92 18.75 14.42Physiotherapy 0.29 1.18 27.23 7.85Occupational therapy 0.02 0.10 27.23 0.52Speech therapy 0.00 0.00 27.23 0.00Day care 1.62 5.77 5.83 9.42Social worker 0.00 0.00 27.23 0.00Dietician 0.00 0.00 27.23 0.00Day centre 22.50 40.04 46.66 1049.85Day hospital 0.00 0.00 185.05 0.00Hospital admission 0.35 0.98 3410.00 1180.38A&E admission 0.46 1.10 457.00 210.92Meals on wheels 40.50 80.95 7.16 289.98Transport 61.50 55.34 15.50 953.25Pharmacy visits 9.23 5.81 15.00 138.46Modifications 7.38 37.65 1.00 7.38Personal care 105.57 135.37 20.14 2126.12Household Management 39.07 83.09 18.87 737.27Carer support 24.68 87.26 3.02 74.64Respite 23.65 83.79 4.83 114.24Day Activity 36.14 80.61 5.83 210.80Initial programme cost 0.00TOTAL COMMUNITY COST 7523.89
Economic Evaluation of ASPIRE 31 October 2006
Final Report Page 35
Table 26: Average Community Costs Per Person: Christchurch, Usual Care, 0-3 months
Resource used
Base average
units
Standard deviation of
units used Unit costTotal cost
over periodGP visits 2.61 2.29 38.35 99.95GP visits at home 0.26 1.18 100.00 26.25Medical specialist 0.22 0.71 54.93 12.02Visiting nurse 0.43 1.78 25.89 11.17Volunteer services 0.23 1.30 18.75 4.28Physiotherapy 0.43 2.08 27.23 11.83Occupational therapy 0.03 0.18 27.23 0.68Speech therapy 0.03 0.32 27.23 0.68Day care 3.15 11.83 5.83 18.37Social worker 0.02 0.14 27.23 0.51Dietician 0.00 0.00 27.23 0.00Day centre 1.38 4.97 46.66 64.45Day hospital 0.08 1.03 185.05 15.04Hospital admission 0.17 0.47 3410.00 575.44A&E admission 0.08 0.27 457.00 37.13Meals on wheels 8.85 20.02 7.16 63.37Transport 24.90 22.91 15.50 385.89Pharmacy visits 3.27 3.19 15.00 49.03Modifications 91.14 779.79 1.00 91.14Personal care 16.59 24.38 20.14 334.14Household Management 18.87 13.70 18.87 356.03Carer support 35.12 128.18 3.02 106.23Respite 4.74 35.49 4.83 22.92Day Activity 3.22 14.30 5.83 18.77Initial programme cost 314.99TOTAL COMMUNITY COST 2620.28

Economic Evaluation of ASPIRE 31 October 2006
Final Report Page 36
Table 27: Average Community Costs Per Person: Christchurch, COSE, 0-3 months
Resource used
Base average
units
Standard deviation of
units used Unit costTotal cost
over periodGP visits 2.30 2.48 38.35 88.38GP visits at home 0.34 1.12 100.00 33.77Medical specialist 0.28 1.39 54.93 15.22Visiting nurse 0.69 2.42 25.89 17.92Volunteer services 0.34 1.96 18.75 6.46Physiotherapy 0.61 2.62 27.23 16.50Occupational therapy 0.25 2.02 27.23 6.85Speech therapy 0.00 0.00 27.23 0.00Day care 6.75 26.75 5.83 39.40Social worker 0.05 0.32 27.23 1.41Dietician 0.00 0.00 27.23 0.00Day centre 2.54 9.87 46.66 118.50Day hospital 0.00 0.00 185.05 0.00Hospital admission 0.18 0.48 3410.00 609.74A&E admission 0.04 0.20 457.00 18.16Meals on wheels 11.19 22.75 7.16 80.09Transport 24.98 23.68 15.50 387.23Pharmacy visits 3.15 3.00 15.00 47.19Modifications 257.68 1848.07 1.00 257.68Personal care 19.26 32.94 20.14 387.92Household Management 20.69 18.81 18.87 390.41Carer support 37.82 127.05 3.02 114.40Respite 13.21 65.98 4.83 63.80Day Activity 2.98 14.16 5.83 17.37Initial programme cost 380.00TOTAL COMMUNITY COST 3098.40

Economic Evaluation of ASPIRE 31 October 2006
Final Report Page 37
Table 28: Average Community Costs Per Person: Christchurch, Usual Care, 4-12 months
Resource used
Base average
units
Standard deviation of
units used Unit costTotal cost
over periodGP visits 6.62 6.73 38.35 253.70GP visits at home 0.62 3.06 100.00 61.54Medical specialist 1.59 14.78 54.93 87.32Visiting nurse 0.64 2.86 25.89 16.56Volunteer services 0.49 3.34 18.75 9.13Physiotherapy 0.20 1.01 27.23 5.35Occupational therapy 0.09 0.79 27.23 2.56Speech therapy 0.03 0.26 27.23 0.93Day care 4.24 15.17 5.83 24.73Social worker 0.01 0.10 27.23 0.35Dietician 0.00 0.05 27.23 0.12Day centre 4.67 16.52 46.66 217.75Day hospital 0.50 4.02 185.05 92.53Hospital admission 0.38 1.28 3410.00 1311.54A&E admission 0.15 0.77 457.00 70.31Meals on wheels 27.31 57.24 7.16 195.52Transport 77.51 67.98 15.50 1201.35Pharmacy visits 9.26 8.78 15.00 138.85Modifications 68.63 739.58 1.00 68.63Personal care 50.31 70.62 20.14 1013.14Household Management 60.25 38.66 18.87 1136.86Carer support 85.65 234.35 3.02 259.05Respite 12.25 64.75 4.83 59.16Day Activity 10.70 48.70 5.83 62.41Initial programme cost 0.00TOTAL COMMUNITY COST 6289.39

Economic Evaluation of ASPIRE 31 October 2006
Final Report Page 38
Table 29: Average Community Costs Per Person: Christchurch, COSE, 4-12 months
Resource used
Base average
units
Standard deviation of
units used Unit costTotal cost
over periodGP visits 6.28 6.42 38.35 241.01GP visits at home 1.24 4.09 100.00 124.14Medical specialist 0.59 3.40 54.93 32.67Visiting nurse 0.54 2.54 25.89 13.95Volunteer services 0.07 0.39 18.75 1.29Physiotherapy 0.50 2.52 27.23 13.62Occupational therapy 0.15 1.11 27.23 3.99Speech therapy 0.03 0.28 27.23 0.70Day care 6.76 23.51 5.83 39.42Social worker 0.05 0.29 27.23 1.45Dietician 0.00 0.00 27.23 0.00Day centre 7.56 27.91 46.66 352.97Day hospital 0.34 3.62 185.05 62.22Hospital admission 0.44 1.14 3410.00 1499.22A&E admission 0.16 0.67 457.00 70.91Meals on wheels 43.60 75.22 7.16 312.20Transport 69.77 66.01 15.50 1081.38Pharmacy visits 9.12 8.35 15.00 136.75Modifications 485.26 3987.73 1.00 485.26Personal care 59.63 99.40 20.14 1201.02Household Management 61.59 40.65 18.87 1162.29Carer support 64.26 194.38 3.02 194.37Respite 19.22 103.73 4.83 92.85Day Activity 9.20 39.87 5.83 53.68Initial programme cost 0.00TOTAL COMMUNITY COST 7177.36

Economic Evaluation of ASPIRE 31 October 2006
Final Report Page 39
Table 30: Average Community Costs Per Person: Christchurch, Usual Care, 13-18 months
Resource used
Base average
units
Standard deviation of
units used Unit cost
Total cost over
periodGP visits 5.48 6.67 38.35 210.09GP visits at home 0.52 1.71 100.00 52.17Medical specialist 0.40 1.25 54.93 21.89Visiting nurse 0.70 3.08 25.89 18.01Volunteer services 0.09 0.59 18.75 1.63Physiotherapy 0.09 0.35 27.23 2.37Occupational therapy 0.00 0.00 27.23 0.00Speech therapy 0.00 0.00 27.23 0.00Day care 2.96 9.14 5.83 17.24Social worker 0.00 0.00 27.23 0.00Dietician 0.00 0.00 27.23 0.00Day centre 2.26 7.41 46.66 105.49Day hospital 0.28 1.92 185.05 52.30Hospital admission 0.35 0.87 3410.00 1186.09A&E admission 0.13 0.50 457.00 59.61Meals on wheels 18.65 39.80 7.16 133.55Transport 47.67 32.09 15.50 738.83Pharmacy visits 7.00 6.24 15.00 105.00Modifications 44.57 294.81 1.00 44.57Personal care 26.26 39.22 20.14 528.83Household Management 43.54 25.50 18.87 821.54Carer support 35.80 123.76 3.02 108.27Respite 8.09 54.86 4.83 39.07Day Activity 1.69 10.80 5.83 9.85Initial programme cost 0.00TOTAL COMMUNITY COST 4256.42

Economic Evaluation of ASPIRE 31 October 2006
Final Report Page 40
Table 31: Average Community Costs Per Person: Christchurch, COSE, 13-18 months
Resource used
Base average
units
Standard deviation of
units used Unit cost
Total cost over
periodGP visits 5.03 5.45 38.35 192.99GP visits at home 0.48 2.25 100.00 48.39Medical specialist 0.18 0.68 54.93 9.89Visiting nurse 0.85 3.31 25.89 21.92Volunteer services 0.00 0.00 18.75 0.00Physiotherapy 0.25 0.90 27.23 6.81Occupational therapy 0.10 0.56 27.23 2.64Speech therapy 0.02 0.13 27.23 0.44Day care 10.84 30.08 5.83 63.22Social worker 0.05 0.28 27.23 1.32Dietician 0.00 0.00 27.23 0.00Day centre 8.39 24.36 46.66 391.34Day hospital 0.42 3.30 185.05 77.60Hospital admission 0.35 1.17 3410.00 1210.00A&E admission 0.00 0.00 457.00 0.00Meals on wheels 26.13 48.07 7.16 187.08Transport 43.33 40.96 15.50 671.67Pharmacy visits 6.58 6.55 15.00 98.71Modifications 403.39 1928.69 1.00 403.39Personal care 45.68 78.51 20.14 920.09Household Management 38.56 28.00 18.87 727.65Carer support 49.38 130.29 3.02 149.36Respite 33.91 123.18 4.83 163.78Day Activity 9.48 35.99 5.83 55.30Initial programme cost 0.00TOTAL COMMUNITY COST 5403.56
Residential Costs
The costs of residential home placement are the costs associated with permanent entry into either a rest home or hospital. From the CCPS data, we determined the number of study participants who had entered each type of residential care facility (rest home or hospital) for each region and initiative/usual care. As the sample size in the CCPS data for those entering a residential care facility in each assessment period was relatively small, we determined these numbers over the aggregated periods of 0 to 12 months and 0 to 18 months (for Christchurch only). From this we determined the probability of being in either type of facility, and used this information to weight the costs of each facility.
Cost information for being in a residential care facility was obtained from Brown (2006). In particular, we used the following unit costs:
• For hospitals, we used a cost of $682 per day; and
• For rest homes, we used the average of the cost per day across the four different level facilities noted in Brown (2006), which equals $87.50.

Economic Evaluation of ASPIRE 31 October 2006
Final Report Page 41
These costs were multiplied by the number of days over the time period considered (0 to 12 months or 0 to 18 months) and weighted by the probabilities mentioned above to determine the total residential cost over each assessment period. These results are shown in Table 32 to Table 39 below.
Table 32: Average Residential Cost Per Person: Hamilton, Usual Care, 0-12 Months
Residential facility Probability Cost over period Weighted cost over periodResidential care: hospital cost 0.33 248,930 82,977Residential care: resthome cost 0.67 31,938 21,292TOTAL RESIDENTIAL COST 104,268
Table 33: Average Residential Cost Per Person: Hamilton, Community FIRST, 0-12 Months
Residential facility Probability Cost over period Weighted cost over periodResidential care: hospital cost 0.55 248,930 135,780Residential care: resthome cost 0.45 31,938 14,517TOTAL RESIDENTIAL COST 150,297
Table 34: Average Residential Cost Per Person: Lower Hutt, Usual Care, 0-12 Months
Residential facility Probability Cost over period Weighted cost over periodResidential care: hospital cost 0.39 248,930 96,806Residential care: resthome cost 0.61 31,938 19,517TOTAL RESIDENTIAL COST 116,323
Table 35: Average Residential Cost Per Person: Lower Hutt, PIP, 0-12 Months
Residential facility Probability Cost over period Weighted cost over periodResidential care: hospital cost 0.73 248,930 181,040Residential care: resthome cost 0.27 31,938 8,710TOTAL RESIDENTIAL COST 189,750
Table 36: Average Residential Cost Per Person: Christchurch, Usual Care, 0-12 Months
Residential facility Probability Cost over period Weighted cost over periodResidential care: hospital cost 0.29 248,930 73,215Residential care: resthome cost 0.71 31,938 22,544TOTAL RESIDENTIAL COST 95,759
Table 37: Average Residential Cost Per Person: Christchurch, COSE, 0-12 Months
Residential facility Probability Cost over period Weighted cost over periodResidential care: hospital cost 0.35 248,930 87,858Residential care: resthome cost 0.65 31,938 20,665TOTAL RESIDENTIAL COST 108,523
Table 38: Average Residential Cost Per Person: Christchurch, Usual Care, 0-18 Months
Residential facility Probability Cost over period Weighted cost over periodResidential care: hospital cost 0.39 373,736 146,245Residential care: resthome cost 0.61 47,950 29,187TOTAL RESIDENTIAL COST 175,431

Economic Evaluation of ASPIRE 31 October 2006
Final Report Page 42
Table 39: Average Residential Cost Per Person: Christchurch, COSE, 0-18 Months
Residential facility Probability Cost over period Weighted cost over periodResidential care: hospital cost 0.35 373,736 130,808Residential care: resthome cost 0.65 47,950 31,168TOTAL RESIDENTIAL COST 161,975
Probabilities
We have calculated the average probability per person of being in the community and of being in a residential home over the 0 to 12 month period for all regions, and 0 to 18 months for Christchurch. This is calculated from the ASPIRE questionnaire data on the basis of the number of days spent in either the community or residential home. That is, for each study participant we calculated the number of days they spent in the community or residential home as a proportion of the number of days in the period. Censored observations for which we did not have information on their status (community or residential home) over the period were excluded from this calculation. We then averaged these proportions to determine the average proportion of time per person.
Table 40 shows the results from calculating the proportions over the 0 to 12 month period (and 0 to 18 months for Christchurch). These results can be interpreted as follows, using the example of the Community FIRST scheme in Hamilton: the average person in the Community FIRST scheme spent 67% of the 12 months in the community, 21% in a residential home, and 12% dead.
Table 40: Proportion of Time Spent in Community, Residential or Dead20
Hamilton (0-12mths)
Lower Hutt (0-12mths)
Christchurch (0-12mths)
Christchurch (0-18mths)
Usual Care
Com FIRST
Usual Care
PIP Usual Care
COSE Usual Care
COSE
Proportion of Time in Community
0.54 0.67 0.70 0.76 0.87 0.89 0.68 0.78
Proportion of Time in Residential
0.25 0.21 0.22 0.16 0.06 0.04 0.17 0.10
Proportion of Time Dead
0.22 0.12 0.08 0.08 0.07 0.06 0.15 0.12
20 Figures may not sum to 100 due to rounding.

Economic Evaluation of ASPIRE 31 October 2006
Final Report Page 43
Total costs
Total costs are calculated by first summing the 0 to 3 month community costs and the 4 to 12 month community costs for each region and initiative/usual care to get the total community costs over the 12-month period. For Christchurch, we also sum the community costs over the 13 to 18 month period. We also use the total residential care costs over the 0-12 month period and 13 to 18 month period (for Christchurch only). Total costs are then given by the following equation:
Total costs = (Total community care costs x Probability of being in the community) + (Total residential care costs x Probability of being in residential care)
Calculation of the costs in this way is shown in Table 41 for usual care in each region and Table 42 for the ageing-in-place initiative in each region. Also shown in these two tables is the number of days in the community, in a residential home and dead over the relevant periods. Note that the costs for the 0 to 18 month period for Christchurch have been converted to an annual basis (by multiplying by 12/18) in order to assist in comparability with the other calculations. Note also that, as explained earlier, the community costs in Hamilton are based on the bulk funded amount of $360 per person per week plus the cost for resources not covered by this amount (GP visits, GP visits at home, medical specialist, speech therapy, social worker, dietician, day hospital, hospital admission, A&E admission, meals on wheels and modifications).

Economic Evaluation of ASPIRE 31 October 2006
Final Report Page 44
Table 41: Calculation of Total Costs for Usual Care in Each Region
Usual CareHamilton 0-12 months
Lower Hutt 0-12 months
Christchurch 0-12 months
Christchurch 0-18 months
COMMUNITY COSTS 11,978.55 9,788.79 8,909.67 8,882.39Prob in community 0-12m 0.54 0.70 0.87 0.68GP visits 291.01 377.68 353.65 375.83GP visits at home 44.12 137.59 87.79 93.31Medical specialist 16.69 48.40 99.34 80.82Visiting nurse 32.72 30.08 27.72 30.49Volunteer services 42.83 8.57 13.41 10.03Physiotherapy 10.68 11.30 17.18 13.03Occupational therapy 18.02 3.89 3.24 2.16Speech therapy 1.13 0.00 1.61 1.07Day care 58.44 64.38 43.10 40.23Social worker 3.74 0.78 0.86 0.57Dietician 0.00 2.87 0.12 0.08Day centre 1,685.94 747.96 282.20 258.46Day hospital 0.00 137.47 107.56 106.57Hospital admission 902.65 4,056.11 1,886.98 2048.71A&E admission 53.76 241.90 107.44 111.37Meals on wheels 173.74 274.75 258.89 261.63Transport 1,763.13 1,376.92 1,587.24 1550.72Pharmacy visits 324.49 245.84 187.88 195.25Modifications 504.22 19.25 159.77 136.22Personal care 4,455.84 1,394.14 1,347.28 1250.74Household Management 809.99 482.69 1,492.89 1542.96Carer support 560.44 0.00 365.28 315.70Respite 0.00 1.98 82.08 80.77Day Activity 0.00 58.04 81.18 60.69Initial programme cost 225.00 66.21 314.99 314.99RESIDENTIAL COSTS 104,268.33 116,323.47 95,758.82 116,954Prob in residential 0-12m 0.25 0.22 0.06 0.17TOTAL COST 32,413.00 32,731.50 13,778.74 25,535.48Days in community 0-12m 195.43 254.88 317.81 374.19Days in residential 0-12m 91.07 81.31 22.99 91.18Days dead 0-12m 78.67 28.96 24.52 82.33

Economic Evaluation of ASPIRE 31 October 2006
Final Report Page 45
Table 42: Calculation of Total Costs for the Ageing-in-Place Initiative in Each Region
InterventionHamilton 0-12 months
Lower Hutt 0-12 months
Christchurch 0-12 months
Christchurch 0-18 months
COMMUNITY COSTS 22,581.08 12,538.12 10,275.76 10,579.55Prob in community 0-12m 0.67 0.76 0.89 0.78GP visits 460.20 357.95 329.39 348.25GP visits at home 53.33 227.65 157.91 137.53Medical specialist 59.20 21.49 47.89 38.52Visiting nurse 174.21 31.87 35.86Volunteer services 14.93 7.75 5.17Physiotherapy 62.07 30.12 24.62Occupational therapy 2.00 10.84 8.99Speech therapy 2.42 0.00 0.70 0.76Day care 43.31 78.82 94.69Social worker 7.26 0.00 2.86 2.79Dietician 0.61 0.00 0.00 0.00Day centre 1271.17 471.47 575.21Day hospital 53.46 0.00 62.22 93.21Hospital admission 1970.22 2194.17 2108.96 2212.64A&E admission 335.13 346.79 89.07 59.38Meals on wheels 576.62 417.70 392.29 386.25Transport 1379.28 1468.61 1426.85Pharmacy visits 198.87 183.93 188.43Modifications 342.62 606.65 742.94 764.22Personal care 2976.40 1588.93 1672.68Household Management 1248.81 1552.71 1520.24Carer support 74.64 308.77 305.42Respite 114.24 156.64 213.61Day Activity 210.80 71.06 84.24Initial programme cost 595.00 380.00 380.00RESIDENTIAL COSTS 150,297.05 189,750.23 108,523.09 107983.40Prob in residential 0-12m 0.21 0.16 0.04 0.10TOTAL COST 46,255.66 40,559.78 13,936.23 19,147.03Days in community 0-12m 246.46 277.90 325.63 427.35Days in residential 0-12m 75.35 59.69 16.09 55.23Days dead 0-12m 43.38 27.55 23.69 65.18
A.2.3 Calculation of Benefits
The key outcome from the ageing-in-place initiatives is keeping elderly people in the community for longer, by both avoiding residential home admission and prolonging life. The key outcome is therefore the additional days spent in the community, and this can be broken down into:
• Additional days of residential care avoided; and
• Additional days of death avoided.
Given that the time spent in each of the community, residential home or dead has already been calculated to determine the proportions in Table 40 above, calculating these benefits is straightforward. Each is simply a measure of the average number of days per person spent in each state over the 0 to 12 month period for each region and initiative/usual care (and 0 to 18 month period for Christchurch).

Economic Evaluation of ASPIRE 31 October 2006
Final Report Page 46
A.3 RESULTS
We calculate the ICER over the 0 to 12 month timeframe (and 0 to 18 months for Christchurch) by comparing the incremental average total cost per person TC (that is, average total cost for initiative I less average total cost for usual care U ) with the incremental benefit per person. As noted above, the benefit is one of days in the community (Com ), days in residential care ( RC ) or days deceased ( D ). That is, for each region and initiative/usual care we can calculate three ICERs:
UI
UICom ComCom
TCTCICER−−
=
UI
UIs RCRC
TCTCICER−−
=Re
UI
UID DD
TCTCICER−−
=
Each ICER represents, respectively, the incremental cost per person per day of community care gained, per day of residential care avoided, and per day of death avoided.
We have calculated each ICER on the basis of the cost per person per annum. The results are shown in Table 43.
Table 43: ICER Results
Incremental Cost Effectiveness Ratio
Hamilton 0 -12 months
Lower Hutt 0 – 12 months
Christchurch 0 – 12 months
Christchurch 0 – 18 months
ICER: cost per person per annum
ICER community (days gained)
271.26 340.07 20.13 -120.18
ICER residential (days avoided)
880.57 361.96 22.84 177.74
ICER deceased (days avoided)
392.27 5,545.03 190.74 372.50