Embed Size (px)
Citation preview

Quality and
Risk Management by
John J. Flaig, Ph.D. Fellow of the American Society for Quality
Email: [email protected] www.e-AT-USA.com
1 Copyright © 2016, by Applied Technology, All Rights Reserved

What’s Old is New Again • If you think risk management is new to the world
of Quality, then be prepared for a trip down memory lane. – What was the name of Dr. Shewhart’s 1931 book? – When was the Failure Modes and Effects Analysis
procedure first published? – When was acceptance sampling first deployed?
• Some people claim that Risk Management is the Future of Quality, but it is also an important part of its Past.
2 Copyright © 2016, by Applied Technology, All Rights Reserved

Risk Management Goes Way Back
Copyright © 2016, by Applied Technology, All Rights Reserved 3

What is Risk?
• Risk is the possibility of events or activities impeding the achievement of an organization’s strategic and operational objectives.
• Risk is the volatility of potential outcomes. • Risk is the probability of an event occurring and the
impact it can be expected to have. • Economic Risk is E(x) = P(x) * C(x), where P(x) is
the probability and C(x) is the cost. • Decision Risks α and β are the probabilities of
making the wrong decision. 4 Copyright © 2016, by Applied Technology, All Rights Reserved

Risk versus Reward
Copyright © 2016, by Applied Technology, All Rights Reserved 5

ISO 9001:2015 Risk & Opportunities
• In clause 4 the organization is required to determine the risks which can affect its ability to meet these objectives
• In clause 5 top management are required to commit to ensuring clause 4 is followed
• In clause 6 the organization is required to take action to address risks and opportunities
6 Copyright © 2016, by Applied Technology, All Rights Reserved
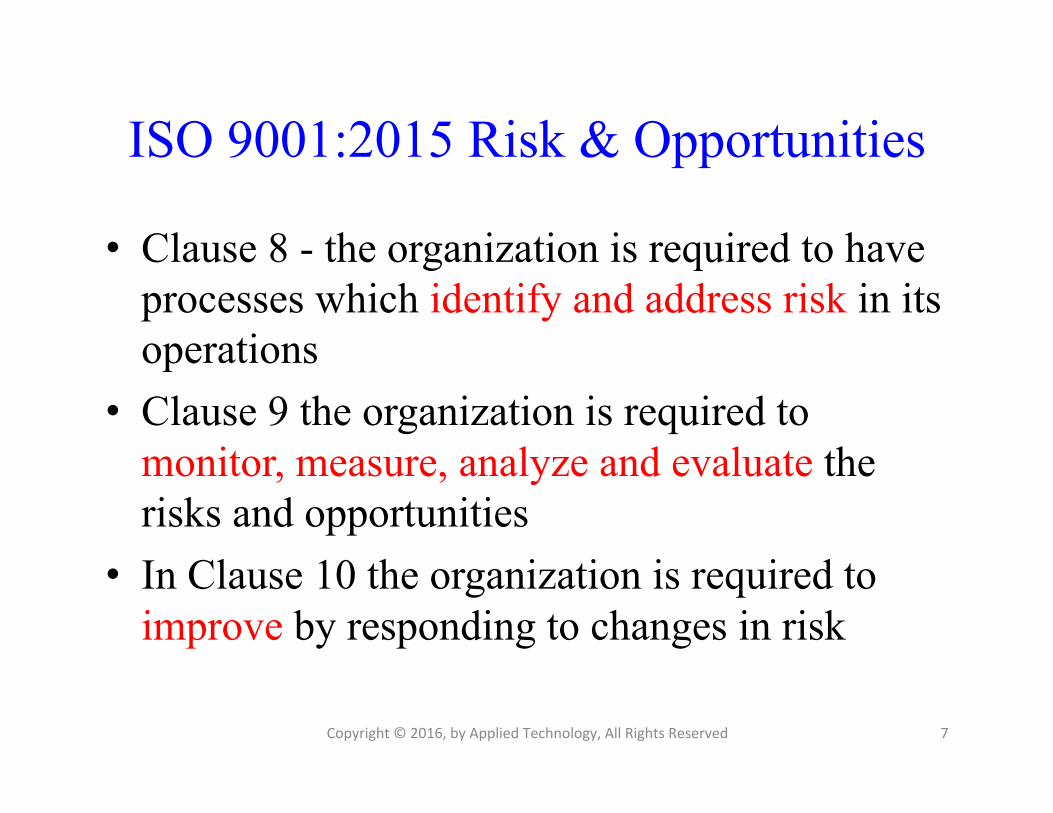
ISO 9001:2015 Risk & Opportunities
• Clause 8 - the organization is required to have processes which identify and address risk in its operations
• Clause 9 the organization is required to monitor, measure, analyze and evaluate the risks and opportunities
• In Clause 10 the organization is required to improve by responding to changes in risk
Copyright © 2016, by Applied Technology, All Rights Reserved 7

The Objectives of International Standards
• To provide confidence in the organization’s ability to consistently provide customers with conforming goods and services. • To enhance customer satisfaction. The concept of “risk” in the context of the international standards relates to the uncertainty in achieving these objectives.
8 Copyright © 2016, by Applied Technology, All Rights Reserved

What Should You Do?
Identify what the risks and opportunities are in your organization – it depends on context.
– ISO 9001:2015 will not automatically require you to carry out a full, formal risk assessment, or to maintain a “risk register”. – ISO 31000 (“Risk management - Principles and guidelines”) will be a useful reference (but not mandated).
9 Copyright © 2016, by Applied Technology, All Rights Reserved

What to Do?
Copyright © 2016, by Applied Technology, All Rights Reserved 10
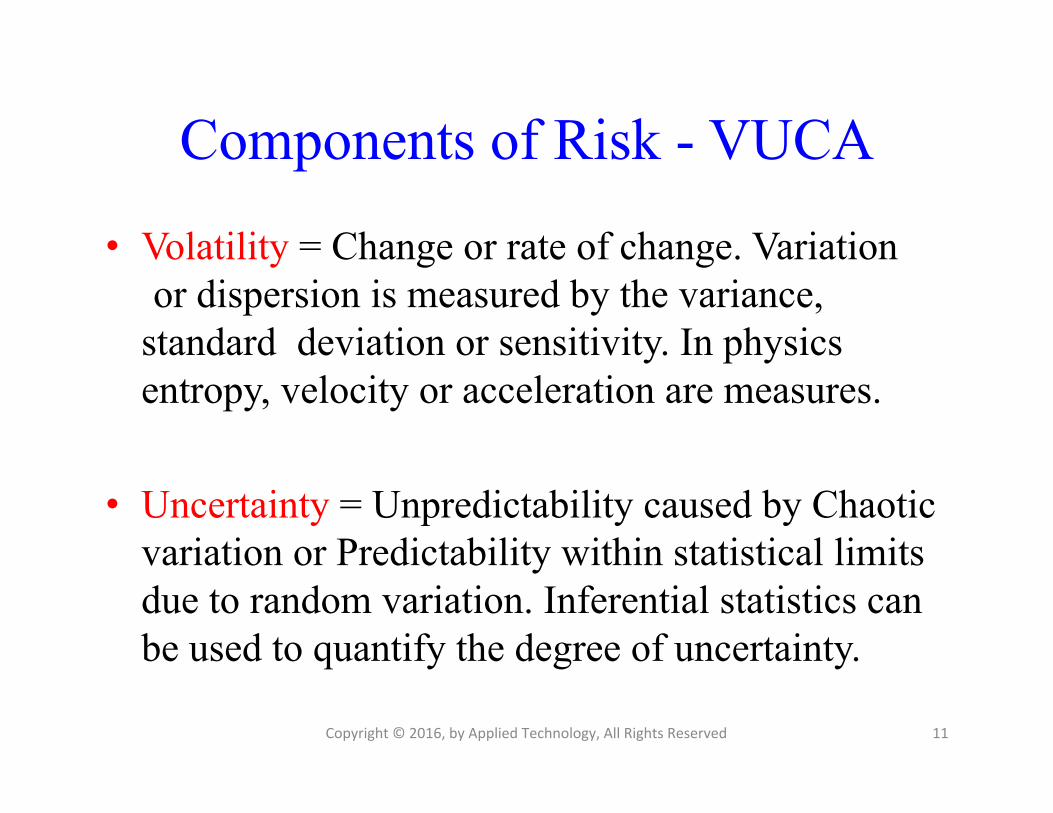
Components of Risk - VUCA
• Volatility = Change or rate of change. Variation or dispersion is measured by the variance, standard deviation or sensitivity. In physics entropy, velocity or acceleration are measures.
• Uncertainty = Unpredictability caused by Chaotic variation or Predictability within statistical limits due to random variation. Inferential statistics can be used to quantify the degree of uncertainty.
11 Copyright © 2016, by Applied Technology, All Rights Reserved

Risk Types - VUCA
• Complexity = The process is multivariate, factors may be nonlinear, possibly confounded, possibly correlated and there may be a very large amount of data.
• Ambiguity = Miscommunication (send and receive errors). Confusion, then No action, cause and effect confused. Lack of clarity.
12 Copyright © 2016, by Applied Technology, All Rights Reserved

Risk Definitions
Risk can be defined by two parameters: – Severity • This is the Seriousness of the harm – Probability • This is the Probability that the harm will occur
13 Copyright © 2016, by Applied Technology, All Rights Reserved

Risk Assessment - Qualitative
Copyright © 2016, by Applied Technology, All Rights Reserved 14

Risk Register – Example 1
15 Copyright © 2016, by Applied Technology, All Rights Reserved

Risk Register – Example 2
16
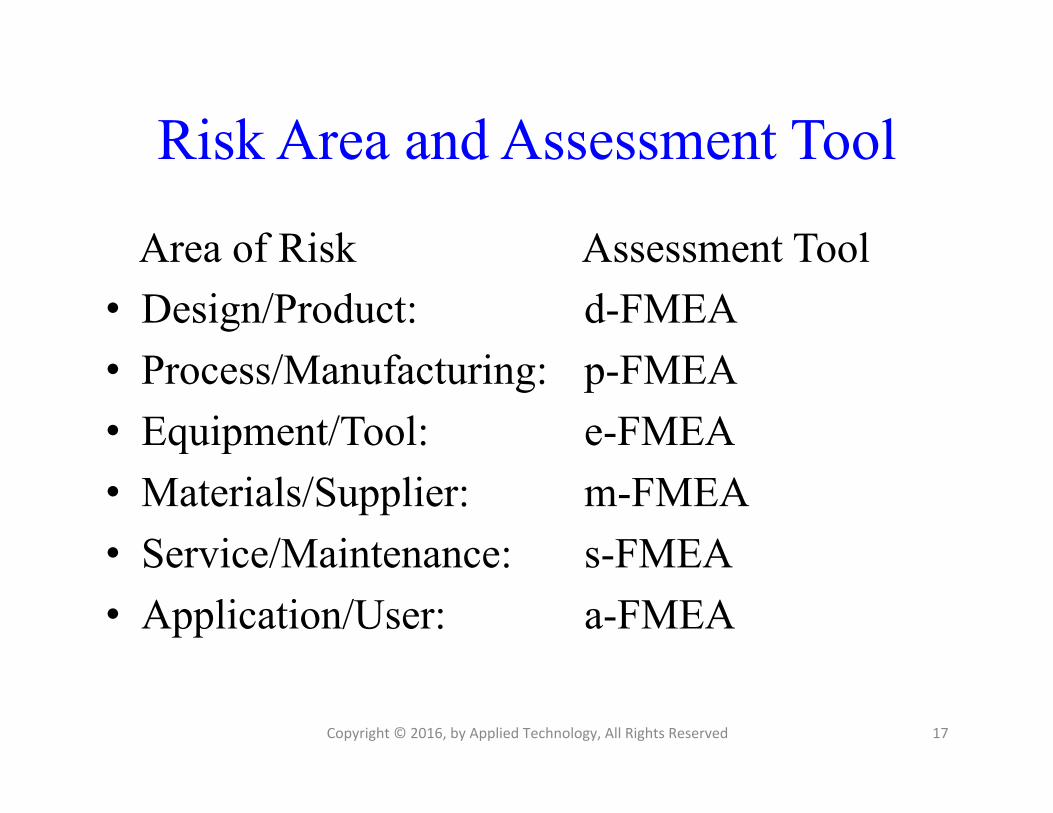
Risk Area and Assessment Tool
Area of Risk Assessment Tool • Design/Product: d-FMEA • Process/Manufacturing: p-FMEA • Equipment/Tool: e-FMEA • Materials/Supplier: m-FMEA • Service/Maintenance: s-FMEA • Application/User: a-FMEA
Copyright © 2016, by Applied Technology, All Rights Reserved 17
Improving the Classical Risk Analysis approach used in FMEA
Copyright © 2016, by Applied Technology, All Rights Reserved 18

Noah Forgot Something
Copyright © 2016, by Applied Technology, All Rights Reserved 19

Classical FMEA
• The traditional risk metric used in FMEA is called the “Risk Priority Number” or RPN. The RPN is generated by multiplying the category rank scores for failure Severity, Occurrence, and Detection together where each category is assigned a rank score from 1 to 10. The resulting product is called the RPN and is a number between 1 and 1000.
• RPN = S x O x D 20 Copyright © 2016, by Applied Technology, All Rights Reserved

Bad Math
• The rank scores used in FMEA as measures of Severity (S), Occurrence (O), and Detection (D) are subjectively generated scores. The data has an order relationship defined on it but differences between values are meaningless because there is no fixed distance between values. So performing operations like addition, subtraction, multiplication and division are invalid. This means that the resultant S x O x D RPN score is purely subjective.
21 Copyright © 2016, by Applied Technology, All Rights Reserved

RPN Ambiguity • When analyzing a system you can get several
failure modes with exactly the same RPNs but your common sense tells you that they should have different corrective action priorities. For example, RPN (10, 1, 9) = RPN (1, 10, 9) = 90, but are they of equal priority? Hence, there are serious concerns by some people that one factor may be more important than another. Usually (10, 1, 9) is given higher priority than (1, 10, 9) because it is felt by some people that Severity is more important than Occurrence.
22 Copyright © 2016, by Applied Technology, All Rights Reserved
The Weakness of Detection
• Detection is really composed of two components Control (C1) and Containment (C2). Controls are tools and techniques to prevent the failure from being created and Containment are tools and techniques to identify and prevent the failure from going down stream or out to the customer. However, the meaning of Detection in the language of common discourse seems to be linked more to Inspection and Test (i.e., Containment) than to Prevention (i.e., Control).
23 Copyright © 2016, by Applied Technology, All Rights Reserved
Lack of Independence
• The factors in the RPN model should be independent. However when we examine the model we find that D = f1(S), O = f2(D), and D = f3(C1, C2).
For example; 1. A very severe scratch is easier to detect than a light one. 2. The performance of the Detection tools and techniques
determines our estimate of the Occurrence frequency. 3. The level of Control and Containment activity establishes
the Detection capability.
24 Copyright © 2016, by Applied Technology, All Rights Reserved

Model Problems
• The RPN model claims to estimate Risk, but the form of the equation does not appear to do so. The unmodified Criticality of the failure is given by S x O, and then to get the RPN it is multiply by D to estimate engineering “Risk”. This does not seem to make sense because we should actually be dividing by the complement of D, denoted DC (i.e., DC = 11 - D). The actual Risk estimation equation should be S x O / DC.
25 Copyright © 2016, by Applied Technology, All Rights Reserved

Economic Risk • As indicated above there are many issues with the
classic RPN approach to risk assessment including the fact that the formula just does not seem to make mathematical and intuitive sense.
• There are several factors that generate our personal sense of risk and an important one is the possibility of economic loss. However, as we have seen the RPN risk metric does not include this component in its formulation. So it is probably time to consider how FMEA and Risk analysis can be improved.
26 Copyright © 2016, by Applied Technology, All Rights Reserved

Economic Risk • The expected cost of failure is estimated by
multiplying the Cost of failure by the Probability of failure occurrence. Then the economic Risk metric is defined by C x P / DC, where C = cost of failure, P = the estimated probability of failure, D = detection, and the Detection Compliment DC = (11 – D). Recall that the Engineering risk (RPN) will be an integer between 1 and 1000, whereas the Economic Risk is the expected cost of failure and can be any real number greater than or equal to $0 dollars.
27 Copyright © 2016, by Applied Technology, All Rights Reserved

Economic Risk vs. Engineering Risk
• There are two good reasons for switching from the Engineering rank score for Severity to the Economic estimate of failure cost.
• First, it essentially eliminates the issues of Bad Math and prioritization Ambiguity.
• Second, management will be able to appreciate the value of FMEA much better if it is presented in a language they understand i.e., the language of finance.
28 Copyright © 2016, by Applied Technology, All Rights Reserved

The Econometric FMEA Model
• Expected Cost (EC) = C x P • Adj. Expected Cost (AEC) = C x P / DC • From this equation it can be seen that adding
controls and containment reduces the expected economic cost of failure, but it does not reduce the total production system cost to zero because adding control and containment tools and techniques adds cost to the system.
29 Copyright © 2016, by Applied Technology, All Rights Reserved
Model Adjustments
• In addition our FMEA model adjusts the AEC prioritization results to reflect estimated project cost, time required to complete, and the percentage of the problem fixed to arrive at the economic priority number or EPN.
• These are exactly the additional items that management wants to know and understand in order to make a sound decision regarding project prioritization.
30 Copyright © 2016, by Applied Technology, All Rights Reserved

More Possible Adjustments
• Of course, the first order cost model approximation can be improved by adjusting the part failure rates that are assumed to be constants to age-specific rates and the cost of failure could be discounted to present value. In any case, the economic risk model seems to be a more accurate platform on which to build our FMEA analysis than the classic RPN model.
31 Copyright © 2016, by Applied Technology, All Rights Reserved

The New FMEA Template
32
Copyright © 2002-2011 by John J. Flaig, Ph.D., All Rights Reserved, Rev: 17 Jul 11
Title: FMEA Team :
FMEA Number: Originator:
FMEA Type: Initial Release Date:
FMEA Level: Current Author:
Product Name: Revision Letter and Date: Project Name: Revision Notes: Note: When you finish entering the information, remove all blank rows from the template.
Function Process Step Possible Possible Possible Current Current Recommended Owner Due Action(s)
or or Failure Failure Failure Control(s) Containment Action(s) Date Taken
Sub-function Component ID Mode Effect(s) Cause(s) in Place in Place
Block 1 10 10 0 0 #DIV/0! 9 0 10 10 0 0 0% 0%
Block 1 10 10 0 0 #DIV/0! 0 0 10 10 0 0 0% 0%
Block 1 10 10 0 0 #DIV/0! 0 0 10 10 0 0 0% 0%
Block 2 10 10 0 0 #DIV/0! 0 0 10 10 0 0 0% 0%
Block 2 10 10 0 0 #DIV/0! 0 0 10 10 0 0 0% 0%
Block 2 10 10 0 0 #DIV/0! 0 0 10 10 0 0 0% 0%
Block 3 10 10 0 0 #DIV/0! 0 0 10 10 0 0 0% 0%
Block 3 10 10 0 0 #DIV/0! 0 0 10 10 0 0 0% 0%
Block 3 10 10 0 0 #DIV/0! 0 0 10 10 0 0 0% 0%
EPN
Cos
t 2
Pro
babi
lity
2
Exp
ecte
d C
ost 2
Adj
Exp
ecte
d C
ost 2
Results
Sev
erity
2
Occ
urre
nce
2
Con
tain
men
t 2
Con
trol
2
Adj
Exp
Cos
t Red
uctio
n
Actions
Mon
ey R
equi
red
Tim
e R
equi
red
Exp
Cos
t Red
uctio
n
Per
cent
age
Fixe
d
Failure Mode and Effects Analysis (FMEA)
Sev
erity
1
Occ
urre
nce
1
Con
tain
men
t 1
Con
trol
1
Exp
ecte
d C
ost 1
Cos
t 1
Pro
babi
lity
1
Analysis
Adj
Exp
ecte
d C
ost 1
Copyright © 2016, by Applied Technology, All Rights Reserved

The New Analysis Section
33
Function Process Step Possible Possible Possible Current Current
or or Failure Failure Failure Control(s) Containment
Sub-function Component ID Mode Effect(s) Cause(s) in Place in Place
Blank Row None 10 None 10
Con
tain
men
t 1
Adj
Exp
ecte
d C
ost 1
Occ
urre
nce
1
Con
trol
1
Exp
ecte
d C
ost 1
Cos
t 1 (D
olla
rs)
Pro
babi
lity
1
Analysis
Sev
erity
1
Copyright © 2016, by Applied Technology, All Rights Reserved
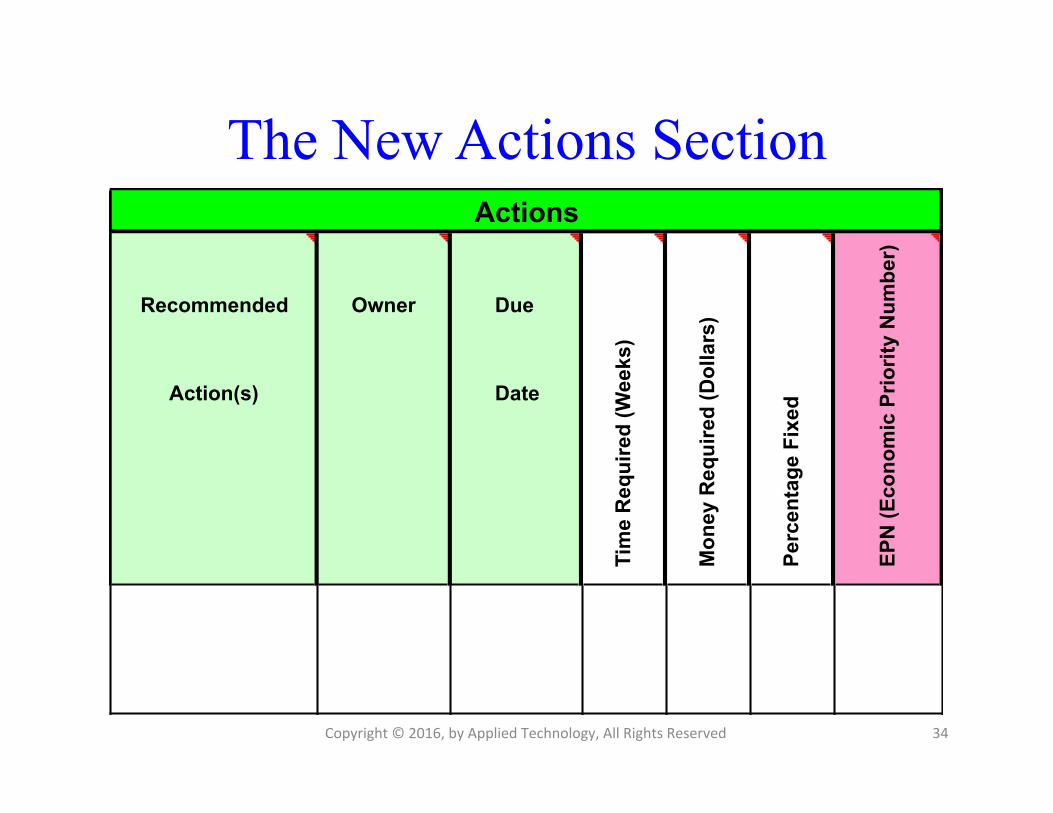
The New Actions Section
Recommended Owner Due
Action(s) Date
Per
cent
age
Fixe
d
EPN
(Eco
nom
ic P
riorit
y N
umbe
r)
Actions
Mon
ey R
equi
red
(Dol
lars
)
Tim
e R
equi
red
(Wee
ks)
34 Copyright © 2016, by Applied Technology, All Rights Reserved

The New Results Section
Action(s)
Taken
10 10
Results
Con
tain
men
t 2
Con
trol
2
Sev
erity
2
Occ
urre
nce
2
Cos
t 2
Pro
babi
lity
2
###### ###### ######
Est
imat
ed S
avin
gs
Results
Exp
ecte
d C
ost 2
Adj
Exp
ecte
d C
ost 2
Adj
Exp
Cos
t Red
uctio
n
Exp
Cos
t Red
uctio
n
35 Copyright © 2016, by Applied Technology, All Rights Reserved

The AT Risk Register • The Applied Technology Risk Register Template
provides a far more useful tool for assessing and monitoring mitigating actions to reduce risk than just a log book to document compliance to the ISO standards.
• The Applied Technology Risk Analysis Template provides management with the answers that they are looking for to track and properly manage risk reduction project prioritization and the effect time and expense considerations have on these decisions.
• If you are interested, Applied Technology offers training and implementation support.
Copyright © 2016, by Applied Technology, All Rights Reserved 36

When the Reward is Large the Risk is Often Forgotten
Copyright © 2016, by Applied Technology, All Rights Reserved 37

Are there any questions?
Copyright © 2016, by Applied Technology, All Rights Reserved 38