Embed Size (px)
Citation preview
HAL Id: hal-00868822https://hal.inria.fr/hal-00868822
Submitted on 2 Oct 2013
HAL is a multi-disciplinary open accessarchive for the deposit and dissemination of sci-entific research documents, whether they are pub-lished or not. The documents may come fromteaching and research institutions in France orabroad, or from public or private research centers.
L’archive ouverte pluridisciplinaire HAL, estdestinée au dépôt et à la diffusion de documentsscientifiques de niveau recherche, publiés ou non,émanant des établissements d’enseignement et derecherche français ou étrangers, des laboratoirespublics ou privés.
Assemblathon 2: evaluating de novo methods of genomeassembly in three vertebrate species
Keith Bradnam, Joseph Fass, Anton Alexandrov, Paul Baranay, MichaelBechner, Inanç Birol, Sébastien Boisvert, Jarrod Chapman, Guillaume
Chapuis, Rayan Chikhi, et al.
To cite this version:Keith Bradnam, Joseph Fass, Anton Alexandrov, Paul Baranay, Michael Bechner, et al.. Assemblathon2: evaluating de novo methods of genome assembly in three vertebrate species. GigaScience, BioMedCentral, 2013, 2 (1), pp.10. <http://www.gigasciencejournal.com/content/2/1/10>. <10.1186/2047-217X-2-10 >. <hal-00868822>

Bradnam et al. GigaScience 2013, 2:10http://www.gigasciencejournal.com/content/2/1/10
RESEARCH Open Access
Assemblathon 2: evaluating de novo methods ofgenome assembly in three vertebrate speciesKeith R Bradnam1*†, Joseph N Fass1†, Anton Alexandrov36, Paul Baranay2, Michael Bechner39, Inanç Birol33,Sébastien Boisvert10,11, Jarrod A Chapman20, Guillaume Chapuis7,9, Rayan Chikhi7,9, Hamidreza Chitsaz6,Wen-Chi Chou14,16, Jacques Corbeil10,13, Cristian Del Fabbro17, T Roderick Docking33, Richard Durbin34, Dent Earl40,Scott Emrich3, Pavel Fedotov36, Nuno A Fonseca30,35, Ganeshkumar Ganapathy38, Richard A Gibbs32,Sante Gnerre22, Élénie Godzaridis11, Steve Goldstein39, Matthias Haimel30, Giles Hall22, David Haussler40,Joseph B Hiatt41, Isaac Y Ho20, Jason Howard38, Martin Hunt34, Shaun D Jackman33, David B Jaffe22, Erich D Jarvis38,Huaiyang Jiang32, Sergey Kazakov36, Paul J Kersey30, Jacob O Kitzman41, James R Knight37, Sergey Koren24,25,Tak-Wah Lam29, Dominique Lavenier7,8,9, François Laviolette12, Yingrui Li28,29, Zhenyu Li28, Binghang Liu28,Yue Liu32, Ruibang Luo28,29, Iain MacCallum22, Matthew D MacManes5, Nicolas Maillet8,9, Sergey Melnikov36,Delphine Naquin8,9, Zemin Ning34, Thomas D Otto34, Benedict Paten40, Octávio S Paulo31, Adam M Phillippy24,25,Francisco Pina-Martins31, Michael Place39, Dariusz Przybylski22, Xiang Qin32, Carson Qu32, Filipe J Ribeiro23,Stephen Richards32, Daniel S Rokhsar20,21, J Graham Ruby26,27, Simone Scalabrin17, Michael C Schatz4,David C Schwartz39, Alexey Sergushichev36, Ted Sharpe22, Timothy I Shaw14,15, Jay Shendure41, Yujian Shi28,Jared T Simpson34, Henry Song32, Fedor Tsarev36, Francesco Vezzi19, Riccardo Vicedomini17,18, Bruno M Vieira31,Jun Wang28, Kim C Worley32, Shuangye Yin22, Siu-Ming Yiu29, Jianying Yuan28, Guojie Zhang28, Hao Zhang28,Shiguo Zhou39 and Ian F Korf1*
Abstract
Background: The process of generating raw genome sequence data continues to become cheaper, faster, andmore accurate. However, assembly of such data into high-quality, finished genome sequences remains challenging.Many genome assembly tools are available, but they differ greatly in terms of their performance (speed, scalability,hardware requirements, acceptance of newer read technologies) and in their final output (composition ofassembled sequence). More importantly, it remains largely unclear how to best assess the quality of assembledgenome sequences. The Assemblathon competitions are intended to assess current state-of-the-art methods ingenome assembly.
Results: In Assemblathon 2, we provided a variety of sequence data to be assembled for three vertebrate species(a bird, a fish, and snake). This resulted in a total of 43 submitted assemblies from 21 participating teams. We evaluatedthese assemblies using a combination of optical map data, Fosmid sequences, and several statistical methods. Fromover 100 different metrics, we chose ten key measures by which to assess the overall quality of the assemblies.(Continued on next page)
* Correspondence: [email protected]; [email protected]†Equal contributors1Genome Center, UC, Davis, CA 95616, USAFull list of author information is available at the end of the article
© 2013 Bradnam et al.; licensee BioMed Central Ltd. This is an Open Access article distributed under the terms of the CreativeCommons Attribution License (http://creativecommons.org/licenses/by/2.0), which permits unrestricted use, distribution, andreproduction in any medium, provided the original work is properly cited.
Bradnam et al. GigaScience 2013, 2:10 Page 2 of 31http://www.gigasciencejournal.com/content/2/1/10
(Continued from previous page)
Conclusions: Many current genome assemblers produced useful assemblies, containing a significant representation oftheir genes and overall genome structure. However, the high degree of variability between the entries suggests thatthere is still much room for improvement in the field of genome assembly and that approaches which work well inassembling the genome of one species may not necessarily work well for another.
Keywords: Genome assembly, N50, Scaffolds, Assessment, Heterozygosity, COMPASS
BackgroundContinued advances in next-generation sequencing (NGS)technologies have meant that genome sequence data canbe produced faster, easier, and more accurately than everbefore. Read lengths that started out at 25 bp on theSolexa/Illumina platform [1] have increased by an order ofmagnitude in just over half a decade. Such improvementshave made possible the creation of ambitious multi-speciesgenome sequencing projects such as Genome 10K (forvertebrates), i5k (for insects), and 959 Nematode Genomes[2-4], among others. A bottleneck for these projects isoften the step that needs to convert the raw sequencingdata into a high-quality, finished genome sequence. Thisprocess of genome assembly is complicated by the differentread lengths, read counts, and error profiles that areproduced by different NGS technologies. A further chal-lenge is that NGS data for any given genome project some-times exists as a mixture of reads produced by differenttechnologies.The need to assemble genomes from NGS data has
led to an explosion of novel assembly software. A newgeneration of assemblers such as EULER [5], ALLPATHS[6], Velvet [7] and ABySS [8] have utilized de Bruijngraphs to attack the problem. The de Bruijn approach wasalso used by the SOAPdenovo assembler [9] in generatingthe first wholly de novo assembly of a large eukaryotic gen-ome sequence (the giant panda, Ailuropoda melanoleuca[10]). More recent assemblers such as SGA [11] and fermi[12] have capitalized on the increasing length of sequencereads, and utilize string graph approaches, recalling theprevious generation of overlap-layout-consensus assem-blers. For an overview of these different assembly ap-proaches see [13-16].Even though de novo genome assembly strategies are
now capable of tackling the assembly of large vertebrategenomes, the results warrant careful inspection. A com-parison of de novo assemblies from Han Chinese andYoruban individuals to the human reference sequencefound a range of problems in the de novo assemblies[17]. Notably, these assemblies were depleted in segmen-tal duplications and larger repeats leading to assembliesthat were shorter than the reference genome. Several re-cent commentaries that address many of the problemsinherent in de novo genome assembly [14,18-22], havealso identified a range of solutions to help tackle these
issues. These include using complementary sequencingresources to validate assemblies (transcript data, BACsetc.), improving the accuracy of insert-size estimationof mate-pair libraries, and trying to combine differentassemblies for any genome. There are also a growingnumber of tools that are designed to help validateexisting assemblies, or produce assemblies that try toaddress specific issues that can arise with de novo as-semblies. These approaches have included: assemblersthat deal with highly repetitive regions [23]; assemblersthat use orthologous proteins to improve low qualitygenome assemblies [24]; and tools that can correct falsesegmental duplications in existing assemblies [25].The growing need to objectively benchmark assembly
tools has led to several new efforts in this area. Projectssuch as dnGASP (de novo Genome Assembly Project;[26]), GAGE (Genome Assembly Gold-standard Evalua-tions; [27]), and the Assemblathon [28] have all soughtto evaluate the performance of a range of assembly pipe-lines, using standardized data sets. Both dnGASP andthe Assemblathon used simulated genome sequencesand simulated Illumina reads, while the GAGE competi-tion used existing Illumina reads from a range of organ-isms (bacterial, insect, and one human chromosome).To better reflect the ‘real world’ usage scenario of
genome assemblers, we have organized Assemblathon2, a genome assembly exercise that uses real sequencingreads from a mixture of NGS technologies. Assemblathon2 made sequence data available (see Data descriptionsection) for three vertebrate species: a budgerigar (Melop-sittacus undulatus), a Lake Malawi cichlid (Maylandiazebra, also referred to as Metriaclima zebra), and a boaconstrictor (Boa constrictor constrictor). These specieswere chosen in order to represent a diverse selection ofnon-mammalian vertebrates, and also because of the avail-ability of suitable sequencing data. For the sake of brevity,these species will henceforth be referred to as simply ‘bird’,‘fish’, and ‘snake’. Teams were invited to participate in thecontest by submitting assemblies for any or all of thesespecies; in many cases, participating teams were them-selves the authors of the assembly tools that they used.As in the first Assemblathon contest (henceforth,
Assemblathon 1) we have attempted to assess the per-formance of each of each the participating teams byusing a variety of metrics. Unlike Assemblathon 1, we do

Bradnam et al. GigaScience 2013, 2:10 Page 3 of 31http://www.gigasciencejournal.com/content/2/1/10
not know what the correct genome sequence shouldlook like for any of the three species. Because of this wemake use of various experimental datasets, such asFosmid sequences and optical maps by which to validatethe assemblies. A secondary goal of the Assemblathon isto assess the suitability of different metrics by which toassess genome assembly quality, and we employ somenovel statistical methods for assessing each assemblyOverall, we find that while many assemblers perform
well when looking at a single metric, very few assemblersperform consistently when measured by a set of metricsthat assess different aspects of an assembly’s quality.Furthermore, we find that assemblers that work wellwith data from one species may not necessarily work aswell with others.
Data descriptionParticipating teams (Table 1) had four months in which toassemble genome sequences from a variety of NGS se-quence data (Table 2 and Additional file 1) that was madeavailable via the Assemblathon website [29]. Each teamwas allowed to submit one competitive entry for each ofthe three species (bird, fish, and snake). Additionally,teams were allowed to submit a number of ‘evaluation’ as-semblies for each species. These would be analyzed in thesame way as competitive entries, but would not be eligibleto be declared as ‘winning’ entries. Results from the smallnumber of evaluation entries (3, 4 and 0 for bird, fish, andsnake respectively) are mostly excluded from the Analysessections below, but are referenced in the Discussion.Assemblies were generated using a wide variety of soft-
ware (Table 1), with greatly varying hardware and time re-quirements. Details of specific version numbers, softwareavailability, and usage instructions are available for mostentries (Additional file 2: Tables S2 and S3), as are com-prehensive assembly instructions (Additional file 3).Assemblies were excluded from detailed analysis if their
total size was less than 25% of the expected genome sizefor the species in question. Entries from the CoBig2 andPRICE teams did not meet this criterion; their results areincluded in Additional file 4, but are not featured in thispaper (however see Discussion for information regardingthe genic content of the PRICE assembly). Most teamssubmitted a single file of scaffold sequences, to be splitinto contigs for contig-based analyses. However, a smallnumber of teams (ABL, CSHL, CTD, and PRICE) submit-ted one or more entries that consisted only of contigsequences that had not undergone scaffolding.The submitted assemblies for Assemblathon 2 are avail-
able from the Assemblathon website [29] and also fromGigaDB [30]. All input reads have been deposited insequence read archives under the accessions ERP002324(bird), SRA026860 (fish), and ERP002294 (snake); seeAdditional file 5 for a detailed list of all associated
sequence accessions. Details of the bird sequence data,as well as gene annotations, have also been describedseparately (manuscript in preparation, and data inGigaDB [31]). The assembled Fosmid sequences forbird and snake that were used to help validate assem-blies are also available in GigaDB [32].Further, source code for scripts used in the analysis are
available from a Github repository [33]. Results for all of thedifferent assembly statistics are available as a spreadsheet(Additional file 4) or as a CSV text file (Additional file 6).For details on additional files see ‘Availability of supportingdata’ section.
AnalysesStatistical description of assembliesA wide range of basic statistics were calculated for bothcontigs and scaffold sequences of each assembly (seeAdditional file 4), including the N50 length. N50 iscalculated by summing all sequence lengths, startingwith the longest, and observing the length that takes thesum length past 50% of the total assembly length. Arelated metric, which we adopted for Asssemblathon 1[28], is the NG50 length. This normalizes for differencesin the sizes of the genome assemblies being compared. Itis calculated in the same way as N50, except the totalassembly size is replaced with the estimated genome sizewhen making the calculation.The N50 metric is based on using a 50% threshold,
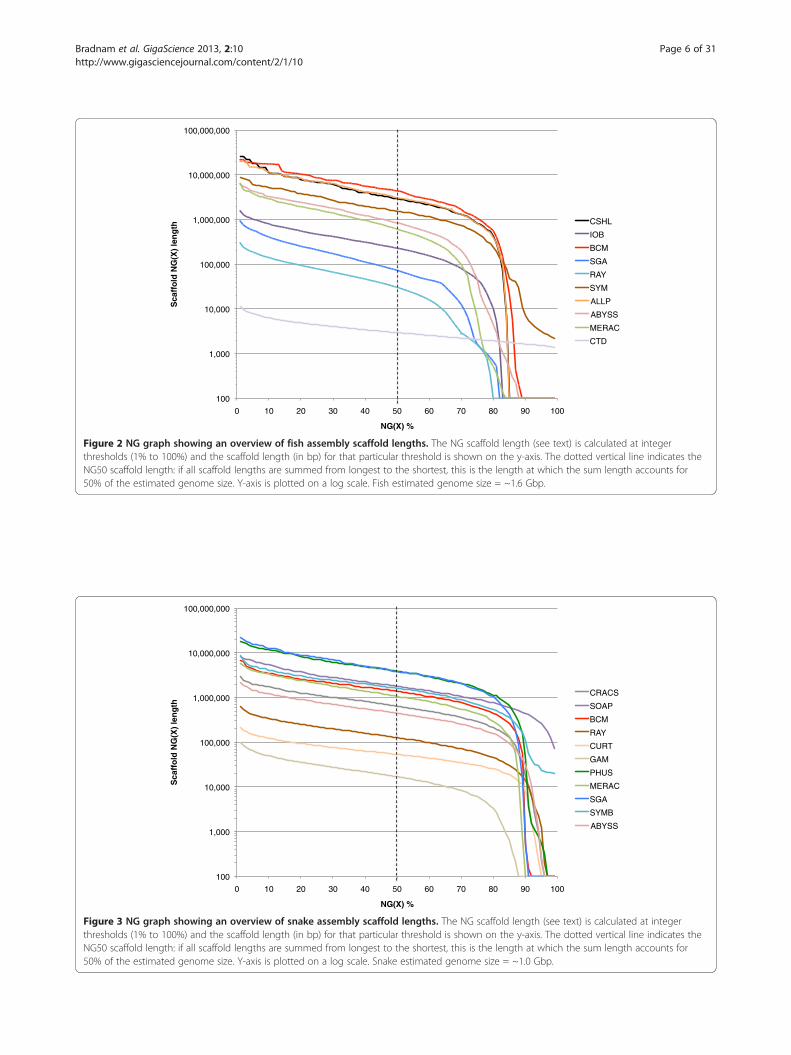
but others have sometimes reported this length incombination with other thresholds such as N25 and N75(e.g., [34]). By extension, if NG values are calculated forall integer thresholds (1–100%), an ‘NG graph’ can beconstructed for all genome assemblies from the samespecies. The NG graph has several useful properties;first, it allows one to visually compare differences inscaffold lengths for all assemblies. Secondly, the initialdata point in any series indicates the size of the longestscaffold for that series. Finally, if a series touches the x-axis (where scaffold NG(X) length = 0), then it indicatesthat the assembly in question is smaller than the esti-mated genome size.Within each species, we observed that assemblies
displayed a great deal of variation in their total assemblysize, and in their contig and scaffold lengths (Figures 1,2 and 3, Additional file 2: Figure S1, Additional file 4).There is only a modest correlation between scaffoldNG50 length and contig NG50 length in bird and snake(r = 0.50 and 0.55 respectively, N.S.), but a strongercorrelation in fish (r = 0.78, P < 0.01; Additional file 2:Figure S2). The snake assemblies from the Phusion andSGA teams have similar scaffold NG50 lengths (3.8 Mbpeach) but very different contig NG50 lengths (68 and 25Kbp respectively). Conversely, the bird assemblies fromthe MLK and Meraculous teams have similar contig
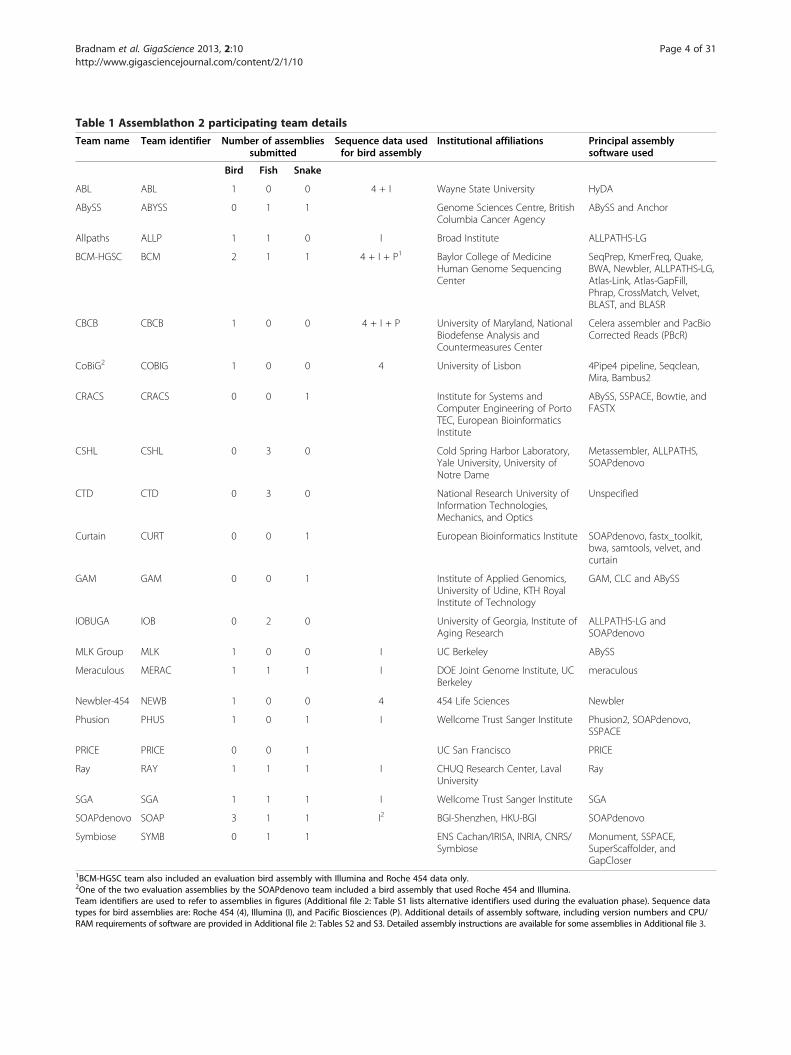
Table 1 Assemblathon 2 participating team details
Team name Team identifier Number of assembliessubmitted
Sequence data usedfor bird assembly
Institutional affiliations Principal assemblysoftware used
Bird Fish Snake
ABL ABL 1 0 0 4 + I Wayne State University HyDA
ABySS ABYSS 0 1 1 Genome Sciences Centre, BritishColumbia Cancer Agency
ABySS and Anchor
Allpaths ALLP 1 1 0 I Broad Institute ALLPATHS-LG
BCM-HGSC BCM 2 1 1 4 + I + P1 Baylor College of MedicineHuman Genome SequencingCenter
SeqPrep, KmerFreq, Quake,BWA, Newbler, ALLPATHS-LG,Atlas-Link, Atlas-GapFill,Phrap, CrossMatch, Velvet,BLAST, and BLASR
CBCB CBCB 1 0 0 4 + I + P University of Maryland, NationalBiodefense Analysis andCountermeasures Center
Celera assembler and PacBioCorrected Reads (PBcR)
CoBiG2 COBIG 1 0 0 4 University of Lisbon 4Pipe4 pipeline, Seqclean,Mira, Bambus2
CRACS CRACS 0 0 1 Institute for Systems andComputer Engineering of PortoTEC, European BioinformaticsInstitute
ABySS, SSPACE, Bowtie, andFASTX
CSHL CSHL 0 3 0 Cold Spring Harbor Laboratory,Yale University, University ofNotre Dame
Metassembler, ALLPATHS,SOAPdenovo
CTD CTD 0 3 0 National Research University ofInformation Technologies,Mechanics, and Optics
Unspecified
Curtain CURT 0 0 1 European Bioinformatics Institute SOAPdenovo, fastx_toolkit,bwa, samtools, velvet, andcurtain
GAM GAM 0 0 1 Institute of Applied Genomics,University of Udine, KTH RoyalInstitute of Technology
GAM, CLC and ABySS
IOBUGA IOB 0 2 0 University of Georgia, Institute ofAging Research
ALLPATHS-LG andSOAPdenovo
MLK Group MLK 1 0 0 I UC Berkeley ABySS
Meraculous MERAC 1 1 1 I DOE Joint Genome Institute, UCBerkeley
meraculous
Newbler-454 NEWB 1 0 0 4 454 Life Sciences Newbler
Phusion PHUS 1 0 1 I Wellcome Trust Sanger Institute Phusion2, SOAPdenovo,SSPACE
PRICE PRICE 0 0 1 UC San Francisco PRICE
Ray RAY 1 1 1 I CHUQ Research Center, LavalUniversity
Ray
SGA SGA 1 1 1 I Wellcome Trust Sanger Institute SGA
SOAPdenovo SOAP 3 1 1 I2 BGI-Shenzhen, HKU-BGI SOAPdenovo
Symbiose SYMB 0 1 1 ENS Cachan/IRISA, INRIA, CNRS/Symbiose
Monument, SSPACE,SuperScaffolder, andGapCloser
1BCM-HGSC team also included an evaluation bird assembly with Illumina and Roche 454 data only.2One of the two evaluation assemblies by the SOAPdenovo team included a bird assembly that used Roche 454 and Illumina.Team identifiers are used to refer to assemblies in figures (Additional file 2: Table S1 lists alternative identifiers used during the evaluation phase). Sequence datatypes for bird assemblies are: Roche 454 (4), Illumina (I), and Pacific Biosciences (P). Additional details of assembly software, including version numbers and CPU/RAM requirements of software are provided in Additional file 2: Tables S2 and S3. Detailed assembly instructions are available for some assemblies in Additional file 3.
Bradnam et al. GigaScience 2013, 2:10 Page 4 of 31http://www.gigasciencejournal.com/content/2/1/10

Table 2 Overview of sequencing data provided for Assemblathon 2 participants
Species Estimatedgenome size
Illumina Roche 454 Pacific biosciences
Bird (Melopsittacus undulatus) 1.2 Gbp 285x coverage from 14 libraries(mate pair and paired-end)
16x coverage from 3 library types(single end and paired-end)
10x coverage from 2 libraries
Fish (Maylandia zebra)* 1.0 Gbp 192x coverage from 8 libraries(mate pair and paired-end)
NA NA
Snake (Boa constrictor constrictor) 1.6 Gbp 125x coverage from 4 libraries(mate pair and paired-end)
NA NA
*Also described as Metriaclima zebra and Pseudotropheus zebra.See Additional file 1 for a full description of all sequence data.
Bradnam et al. GigaScience 2013, 2:10 Page 5 of 31http://www.gigasciencejournal.com/content/2/1/10
NG50 lengths (36 and 32 Kbp respectively), but extremelydifferent scaffold NG50 lengths (114 and 7,539 Kbp).When assessing how large each assembly was in relation
to the estimated genome size, the MLK bird assembly wasobserved to be the largest competitive assembly (containing167% of the 1.2 Gbp estimated amount of sequence). How-ever, a fish evaluation assembly by the IOBUGA teamcontained almost 2.5 times as much DNA as expected(246% of the estimated 1.0 Gbp). Such large assemblies mayrepresent errors in the assembly process, but they may alsorepresent situations where an assembler has successfully re-solved regions of the genome with high heterozygosity intomultiple contigs/scaffolds (see Discussion). Among com-petitive entries, 5 of the 11 bird assemblies were largerthan the expected genome size (average ratio = 106.3%;Additional file 4). In contrast, fish and snake assemblies
100
1,000
10,000
100,000
1,000,000
10,000,000
100,000,000
0 10 20 30 40 50
Sca
ffo
ld N
G(X
) le
ng
th
NG(X)
Figure 1 NG graph showing an overview of bird assembly scaffold lethresholds (1% to 100%) and the scaffold length (in bp) for that particular tNG50 scaffold length: if all scaffold lengths are summed from longest to th50% of the estimated genome size. Y-axis is plotted on a log scale. Bird est
tended to be smaller with only 2 out of 10 (fish) and 2 outof 11 (snake) entries being larger than the expected gen-ome size (average ratios 92.5% and 96.7% respectively forfish and snake).Ranking assemblies by their total size or N50/NG50
length can be very misleading if the sequence lengths ofthe majority of scaffolds are short. In an extreme case, anassembly with the highest N50/NG50 length and largesttotal size could comprise of, one extremely long scaffoldand thousands of very short scaffolds. Following comple-tion of a genome assembly, the primary goal of mostgenome projects is to find genes, typically using ab initioor de novo methods of gene prediction [35,36]. It has beennoted that an assembly with a ‘gene-sized’ scaffold N50length may be a good target for annotation [37]. Moregenerally, we might consider a ‘useful’ assembly to be one
60 70 80 90 100
%
SGA
ALLP
SOAP
ABL
PHUS
BCM
RAY
MLK
MERAC
NEWB
CBCB
ngths. The NG scaffold length (see text) is calculated at integerhreshold is shown on the y-axis. The dotted vertical line indicates thee shortest, this is the length at which the sum length accounts forimated genome size = ~1.2 Gbp.
100
1,000
10,000
100,000
1,000,000
10,000,000
100,000,000
0 10 20 30 40 50 60 70 80 90 100
Sca
ffo
ld N
G(X
) le
ng
th
NG(X) %
CSHL
IOB
BCM
SGA
RAY
SYM
ALLP
ABYSS
MERAC
CTD
Figure 2 NG graph showing an overview of fish assembly scaffold lengths. The NG scaffold length (see text) is calculated at integerthresholds (1% to 100%) and the scaffold length (in bp) for that particular threshold is shown on the y-axis. The dotted vertical line indicates theNG50 scaffold length: if all scaffold lengths are summed from longest to the shortest, this is the length at which the sum length accounts for50% of the estimated genome size. Y-axis is plotted on a log scale. Fish estimated genome size = ~1.6 Gbp.
100
1,000
10,000
100,000
1,000,000
10,000,000
100,000,000
0 10 20 30 40 50 60 70 80 90 100
Sca
ffo
ld N
G(X
) le
ng
th
NG(X) %
CRACS
SOAP
BCM
RAY
CURT
GAM
PHUS
MERAC
SGA
SYMB
ABYSS
Figure 3 NG graph showing an overview of snake assembly scaffold lengths. The NG scaffold length (see text) is calculated at integerthresholds (1% to 100%) and the scaffold length (in bp) for that particular threshold is shown on the y-axis. The dotted vertical line indicates theNG50 scaffold length: if all scaffold lengths are summed from longest to the shortest, this is the length at which the sum length accounts for50% of the estimated genome size. Y-axis is plotted on a log scale. Snake estimated genome size = ~1.0 Gbp.
Bradnam et al. GigaScience 2013, 2:10 Page 6 of 31http://www.gigasciencejournal.com/content/2/1/10

Bradnam et al. GigaScience 2013, 2:10 Page 7 of 31http://www.gigasciencejournal.com/content/2/1/10
that has the highest number of scaffolds that are greaterthan the length of an average gene.Using 25 Kbp as the approximate length of an average
vertebrate gene (see Methods), we calculated whatpercentage of the estimated genome size in each speciesconsisted of scaffolds that equaled or exceeded thislength. This approach suggests that NG50 and N50 canbe poor predictors of the suitability of an assembly forgene-finding purposes. For instance, when consideringNG50 scaffold length, the Ray bird assembly is the thirdlowest ranked assembly. However, it comprises 99.2% ofthe estimated genome size in scaffolds that are at least25 Kbp (Figure 4). This is not simply because the assem-bly is larger in size than others (there are four other birdassemblies which are larger in size). Many other assem-blies with relatively low NG50 lengths also have highnumbers of scaffolds that are over 25 Kbp in length(Figure 4, Additional file 2: Figures S3 and S4). Thesnake Curtain assembly has the second lowest NG50scaffold length (53,529 bp) yet still comprises 80.3% ofthe estimated genome size in gene-sized length scaffolds.This suggests that someone who is looking to use agenome assembly for gene finding, may not need to beoverly concerned by low N50 or NG50 values.
Presence of core genesThe completeness and correctness of genic sequences inassemblies is of paramount importance for diverse appli-cations. For many assembled genomes, transcriptome
0
2,000,000
4,000,000
6,000,000
8,000,000
10,000,000
12,000,000
14,000,000
16,000,000
18,000,000
BCM ALLP SOAP NEWB MERAC S
NG
50 s
caff
old
len
gth
(b
p)
Bird a
Figure 4 NG50 scaffold length distribution in bird assemblies and thescaffolds. Primary Y-axis (red) shows NG50 scaffold length for bird assembsize (~1.2 Gbp). Secondary Y-axis (blue) shows percentage of estimated gelength of a vertebrate gene).
data has been acquired in parallel, and such data couldbe mapped back to the assemblies to directly assess thepresence of genes. However for the three species in thisstudy, very little full-length cDNA or RefSeq data wereavailable (Additional file 2: Table S4).Therefore we restricted our attention to measuring the
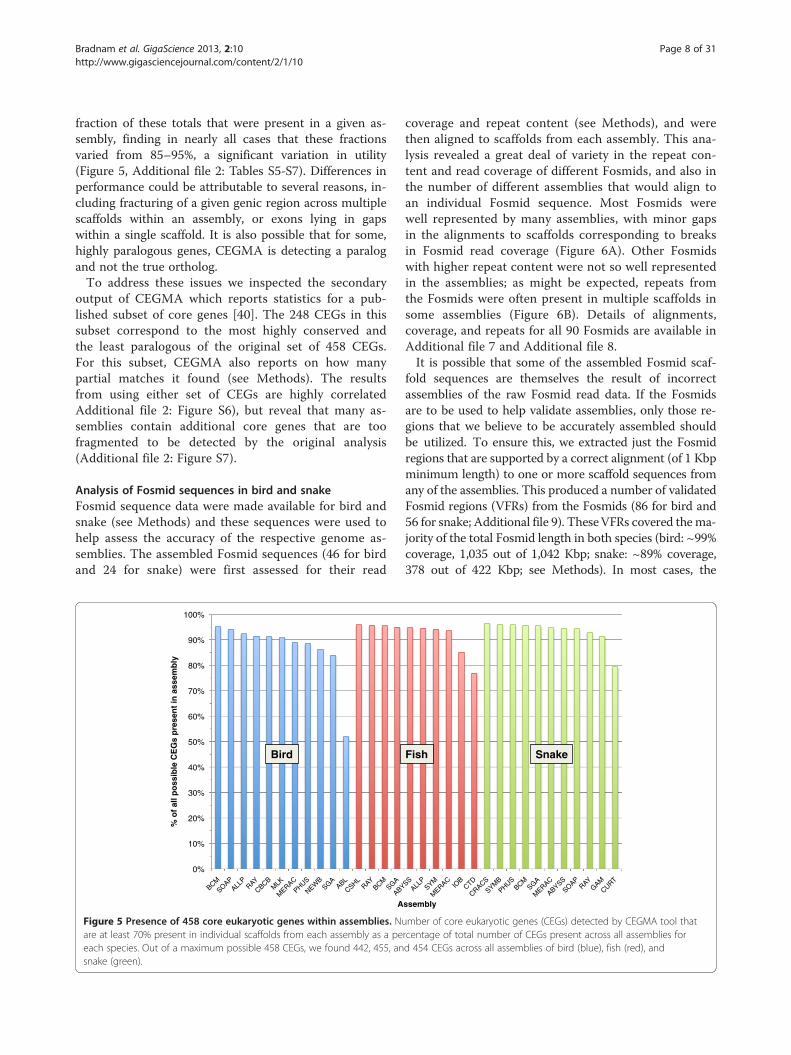
presence of highly conserved genes that should be presentin nearly all eukaryotic genomes and which should behighly similar to orthologs in 'known' genomes. For thispurpose we used a set of 458 ‘core eukaryotic genes’(CEGs) [38], and assessed their presence by testing for70% or greater presence of each gene within a single scaf-fold, as compared to a hidden Markov model (HMM) forthe gene. This analysis was carried out using CEGMA([38], see Methods). The analysis could thus assess pres-ence, but not accuracy of the given genes within the as-semblies. However, CEGMA outputs a predicted proteinsequence for each gene, and we note that for a givenspecies and a given gene, the protein sequences derivedfrom different assemblies capturing the gene were largelyidentical, suggesting that most genes were 100% presentand accurate (Additional file 2: Figure S5). Differencesbetween captured genes could be attributable to poly-morphism, assembly defects, or limitations of CEGMAin distinguishing between paralogous genes.Nearly all of the 458 CEGs were found in at least one
assembly (442, 455, 454 for bird, fish, and snake; CEGMA gene predictions have been submitted to GigaDB[39]). We evaluated the assemblies by computing the
0
10
20
30
40
50
60
70
80
90
100
110
GA CBCB PHUS RAY MLK ABL
% o
f es
tim
ated
gen
om
e si
ze p
rese
nt
in s
caff
old
s >=
25
Kb
p
ssembly
fraction of the bird genome represented by gene-sizedlies: the scaffold length that captures 50% of the estimated genomenome size that is represented by scaffolds ≥25 Kbp (the average
Bradnam et al. GigaScience 2013, 2:10 Page 8 of 31http://www.gigasciencejournal.com/content/2/1/10
fraction of these totals that were present in a given as-sembly, finding in nearly all cases that these fractionsvaried from 85–95%, a significant variation in utility(Figure 5, Additional file 2: Tables S5-S7). Differences inperformance could be attributable to several reasons, in-cluding fracturing of a given genic region across multiplescaffolds within an assembly, or exons lying in gapswithin a single scaffold. It is also possible that for some,highly paralogous genes, CEGMA is detecting a paralogand not the true ortholog.To address these issues we inspected the secondary
output of CEGMA which reports statistics for a pub-lished subset of core genes [40]. The 248 CEGs in thissubset correspond to the most highly conserved andthe least paralogous of the original set of 458 CEGs.For this subset, CEGMA also reports on how manypartial matches it found (see Methods). The resultsfrom using either set of CEGs are highly correlatedAdditional file 2: Figure S6), but reveal that many as-semblies contain additional core genes that are toofragmented to be detected by the original analysis(Additional file 2: Figure S7).
Analysis of Fosmid sequences in bird and snakeFosmid sequence data were made available for bird andsnake (see Methods) and these sequences were used tohelp assess the accuracy of the respective genome as-semblies. The assembled Fosmid sequences (46 for birdand 24 for snake) were first assessed for their read
0%
10%
20%
30%
40%
50%
60%
70%
80%
90%
100%
BCM
SOAP
ALLP
RAY
CBCB
MLK
MERAC
PHUS
NEWB
SGA ABL
CSHL RAY
BCM
SGA
AB
% o
f al
l po
ssib
le C
EG
s p
rese
nt
in a
ssem
bly
A
Bird
Figure 5 Presence of 458 core eukaryotic genes within assemblies. Nuare at least 70% present in individual scaffolds from each assembly as a peeach species. Out of a maximum possible 458 CEGs, we found 442, 455, ansnake (green).
coverage and repeat content (see Methods), and werethen aligned to scaffolds from each assembly. This ana-lysis revealed a great deal of variety in the repeat con-tent and read coverage of different Fosmids, and also inthe number of different assemblies that would align toan individual Fosmid sequence. Most Fosmids werewell represented by many assemblies, with minor gapsin the alignments to scaffolds corresponding to breaksin Fosmid read coverage (Figure 6A). Other Fosmidswith higher repeat content were not so well representedin the assemblies; as might be expected, repeats fromthe Fosmids were often present in multiple scaffolds insome assemblies (Figure 6B). Details of alignments,coverage, and repeats for all 90 Fosmids are available inAdditional file 7 and Additional file 8.It is possible that some of the assembled Fosmid scaf-
fold sequences are themselves the result of incorrectassemblies of the raw Fosmid read data. If the Fosmidsare to be used to help validate assemblies, only those re-gions that we believe to be accurately assembled shouldbe utilized. To ensure this, we extracted just the Fosmidregions that are supported by a correct alignment (of 1 Kbpminimum length) to one or more scaffold sequences fromany of the assemblies. This produced a number of validatedFosmid regions (VFRs) from the Fosmids (86 for bird and56 for snake; Additional file 9). TheseVFRs covered the ma-jority of the total Fosmid length in both species (bird: ~99%coverage, 1,035 out of 1,042 Kbp; snake: ~89% coverage,378 out of 422 Kbp; see Methods). In most cases, the
YSS
ALLP
SYM
MERAC
IOB
CTD
CRACS
SYMB
PHUS
BCM
SGA
MERAC
ABYSS
SOAP RAY
GAM
CURT
ssembly
Fish Snake
mber of core eukaryotic genes (CEGs) detected by CEGMA tool thatrcentage of total number of CEGs present across all assemblies ford 454 CEGs across all assemblies of bird (blue), fish (red), and
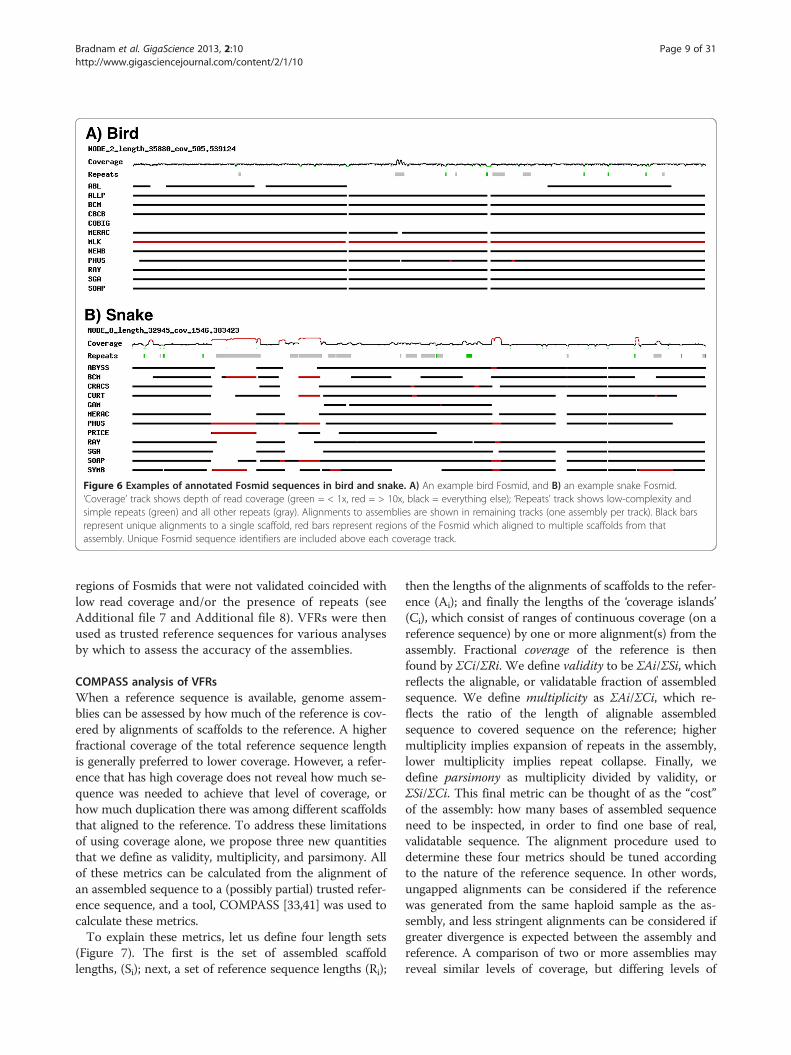
Figure 6 Examples of annotated Fosmid sequences in bird and snake. A) An example bird Fosmid, and B) an example snake Fosmid.‘Coverage’ track shows depth of read coverage (green = < 1x, red = > 10x, black = everything else); ‘Repeats’ track shows low-complexity andsimple repeats (green) and all other repeats (gray). Alignments to assemblies are shown in remaining tracks (one assembly per track). Black barsrepresent unique alignments to a single scaffold, red bars represent regions of the Fosmid which aligned to multiple scaffolds from thatassembly. Unique Fosmid sequence identifiers are included above each coverage track.
Bradnam et al. GigaScience 2013, 2:10 Page 9 of 31http://www.gigasciencejournal.com/content/2/1/10
regions of Fosmids that were not validated coincided withlow read coverage and/or the presence of repeats (seeAdditional file 7 and Additional file 8). VFRs were thenused as trusted reference sequences for various analysesby which to assess the accuracy of the assemblies.
COMPASS analysis of VFRsWhen a reference sequence is available, genome assem-blies can be assessed by how much of the reference is cov-ered by alignments of scaffolds to the reference. A higherfractional coverage of the total reference sequence lengthis generally preferred to lower coverage. However, a refer-ence that has high coverage does not reveal how much se-quence was needed to achieve that level of coverage, orhow much duplication there was among different scaffoldsthat aligned to the reference. To address these limitationsof using coverage alone, we propose three new quantitiesthat we define as validity, multiplicity, and parsimony. Allof these metrics can be calculated from the alignment ofan assembled sequence to a (possibly partial) trusted refer-ence sequence, and a tool, COMPASS [33,41] was used tocalculate these metrics.To explain these metrics, let us define four length sets
(Figure 7). The first is the set of assembled scaffoldlengths, (Si); next, a set of reference sequence lengths (Ri);
then the lengths of the alignments of scaffolds to the refer-ence (Ai); and finally the lengths of the ‘coverage islands’(Ci), which consist of ranges of continuous coverage (on areference sequence) by one or more alignment(s) from theassembly. Fractional coverage of the reference is thenfound by ΣCi/ΣRi. We define validity to be ΣAi/ΣSi, whichreflects the alignable, or validatable fraction of assembledsequence. We define multiplicity as ΣAi/ΣCi, which re-flects the ratio of the length of alignable assembledsequence to covered sequence on the reference; highermultiplicity implies expansion of repeats in the assembly,lower multiplicity implies repeat collapse. Finally, wedefine parsimony as multiplicity divided by validity, orΣSi/ΣCi. This final metric can be thought of as the “cost”of the assembly: how many bases of assembled sequenceneed to be inspected, in order to find one base of real,validatable sequence. The alignment procedure used todetermine these four metrics should be tuned accordingto the nature of the reference sequence. In other words,ungapped alignments can be considered if the referencewas generated from the same haploid sample as the as-sembly, and less stringent alignments can be considered ifgreater divergence is expected between the assembly andreference. A comparison of two or more assemblies mayreveal similar levels of coverage, but differing levels of
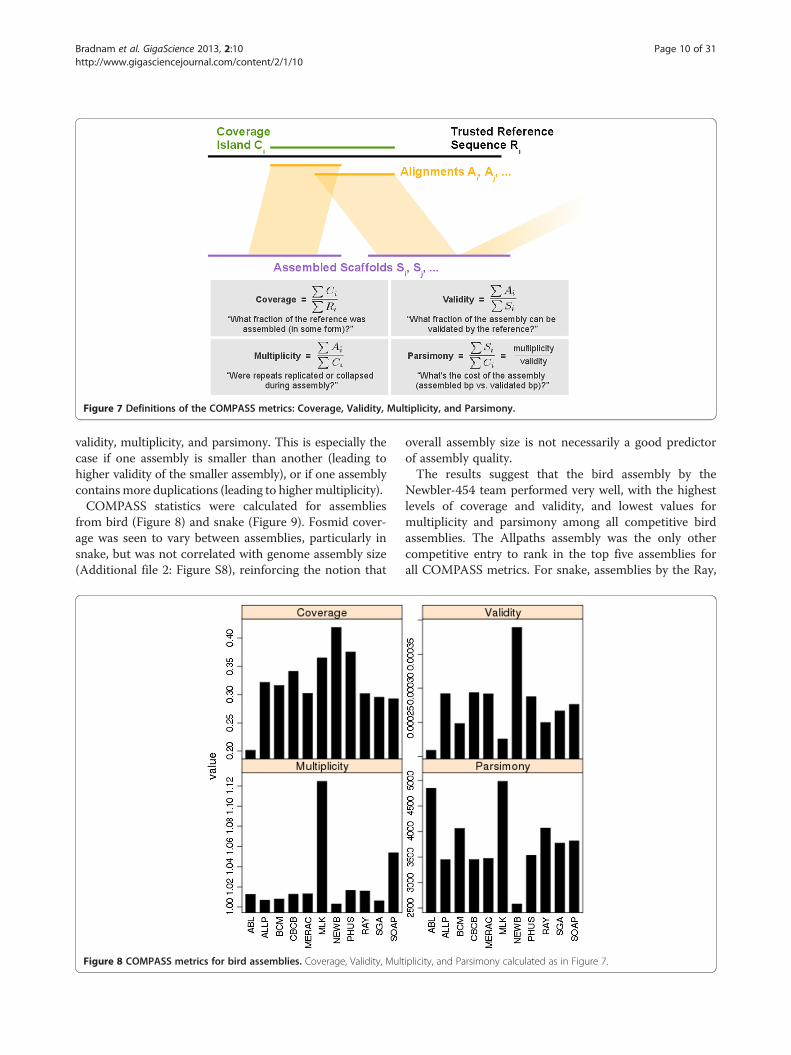
Figure 7 Definitions of the COMPASS metrics: Coverage, Validity, Multiplicity, and Parsimony.
Bradnam et al. GigaScience 2013, 2:10 Page 10 of 31http://www.gigasciencejournal.com/content/2/1/10
validity, multiplicity, and parsimony. This is especially thecase if one assembly is smaller than another (leading tohigher validity of the smaller assembly), or if one assemblycontainsmore duplications (leading to highermultiplicity).COMPASS statistics were calculated for assemblies
from bird (Figure 8) and snake (Figure 9). Fosmid cover-age was seen to vary between assemblies, particularly insnake, but was not correlated with genome assembly size(Additional file 2: Figure S8), reinforcing the notion that
Figure 8 COMPASS metrics for bird assemblies. Coverage, Validity, Mult
overall assembly size is not necessarily a good predictorof assembly quality.The results suggest that the bird assembly by the
Newbler-454 team performed very well, with the highestlevels of coverage and validity, and lowest values formultiplicity and parsimony among all competitive birdassemblies. The Allpaths assembly was the only othercompetitive entry to rank in the top five assemblies forall COMPASS metrics. For snake, assemblies by the Ray,
iplicity, and Parsimony calculated as in Figure 7.
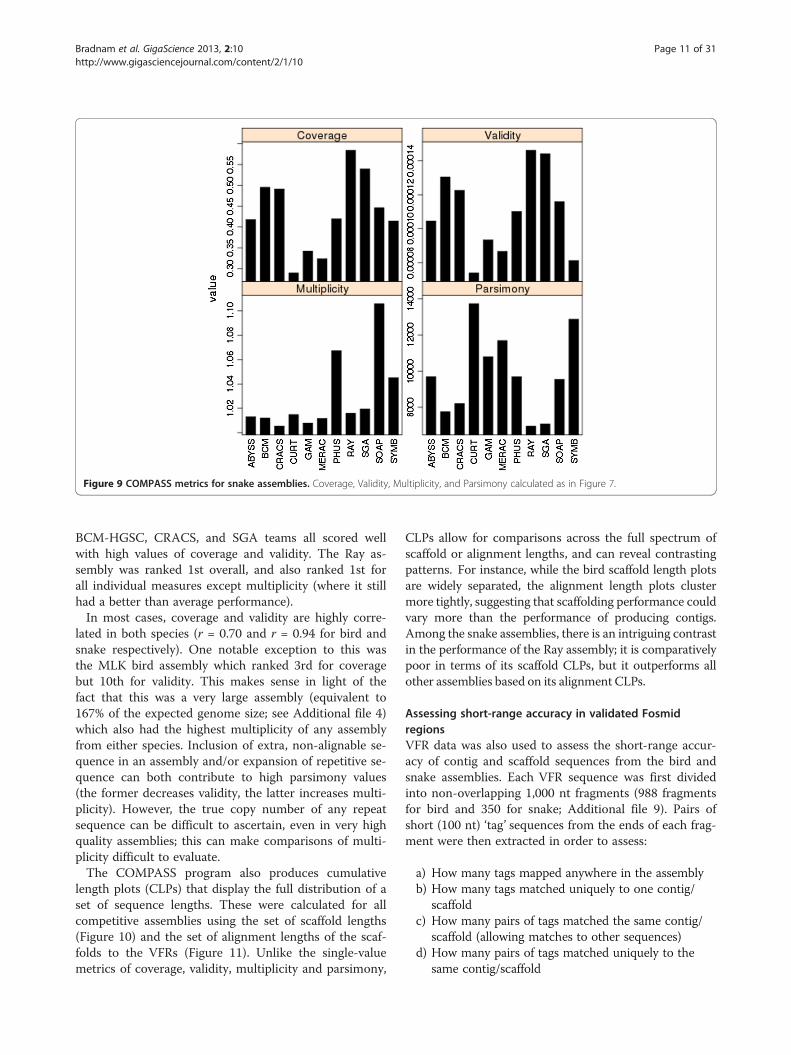
Figure 9 COMPASS metrics for snake assemblies. Coverage, Validity, Multiplicity, and Parsimony calculated as in Figure 7.
Bradnam et al. GigaScience 2013, 2:10 Page 11 of 31http://www.gigasciencejournal.com/content/2/1/10
BCM-HGSC, CRACS, and SGA teams all scored wellwith high values of coverage and validity. The Ray as-sembly was ranked 1st overall, and also ranked 1st forall individual measures except multiplicity (where it stillhad a better than average performance).In most cases, coverage and validity are highly corre-
lated in both species (r = 0.70 and r = 0.94 for bird andsnake respectively). One notable exception to this wasthe MLK bird assembly which ranked 3rd for coveragebut 10th for validity. This makes sense in light of thefact that this was a very large assembly (equivalent to167% of the expected genome size; see Additional file 4)which also had the highest multiplicity of any assemblyfrom either species. Inclusion of extra, non-alignable se-quence in an assembly and/or expansion of repetitive se-quence can both contribute to high parsimony values(the former decreases validity, the latter increases multi-plicity). However, the true copy number of any repeatsequence can be difficult to ascertain, even in very highquality assemblies; this can make comparisons of multi-plicity difficult to evaluate.The COMPASS program also produces cumulative
length plots (CLPs) that display the full distribution of aset of sequence lengths. These were calculated for allcompetitive assemblies using the set of scaffold lengths(Figure 10) and the set of alignment lengths of the scaf-folds to the VFRs (Figure 11). Unlike the single-valuemetrics of coverage, validity, multiplicity and parsimony,
CLPs allow for comparisons across the full spectrum ofscaffold or alignment lengths, and can reveal contrastingpatterns. For instance, while the bird scaffold length plotsare widely separated, the alignment length plots clustermore tightly, suggesting that scaffolding performance couldvary more than the performance of producing contigs.Among the snake assemblies, there is an intriguing contrastin the performance of the Ray assembly; it is comparativelypoor in terms of its scaffold CLPs, but it outperforms allother assemblies based on its alignment CLPs.
Assessing short-range accuracy in validated FosmidregionsVFR data was also used to assess the short-range accur-acy of contig and scaffold sequences from the bird andsnake assemblies. Each VFR sequence was first dividedinto non-overlapping 1,000 nt fragments (988 fragmentsfor bird and 350 for snake; Additional file 9). Pairs ofshort (100 nt) ‘tag’ sequences from the ends of each frag-ment were then extracted in order to assess:
a) How many tags mapped anywhere in the assemblyb) How many tags matched uniquely to one contig/
scaffoldc) How many pairs of tags matched the same contig/
scaffold (allowing matches to other sequences)d) How many pairs of tags matched uniquely to the
same contig/scaffold
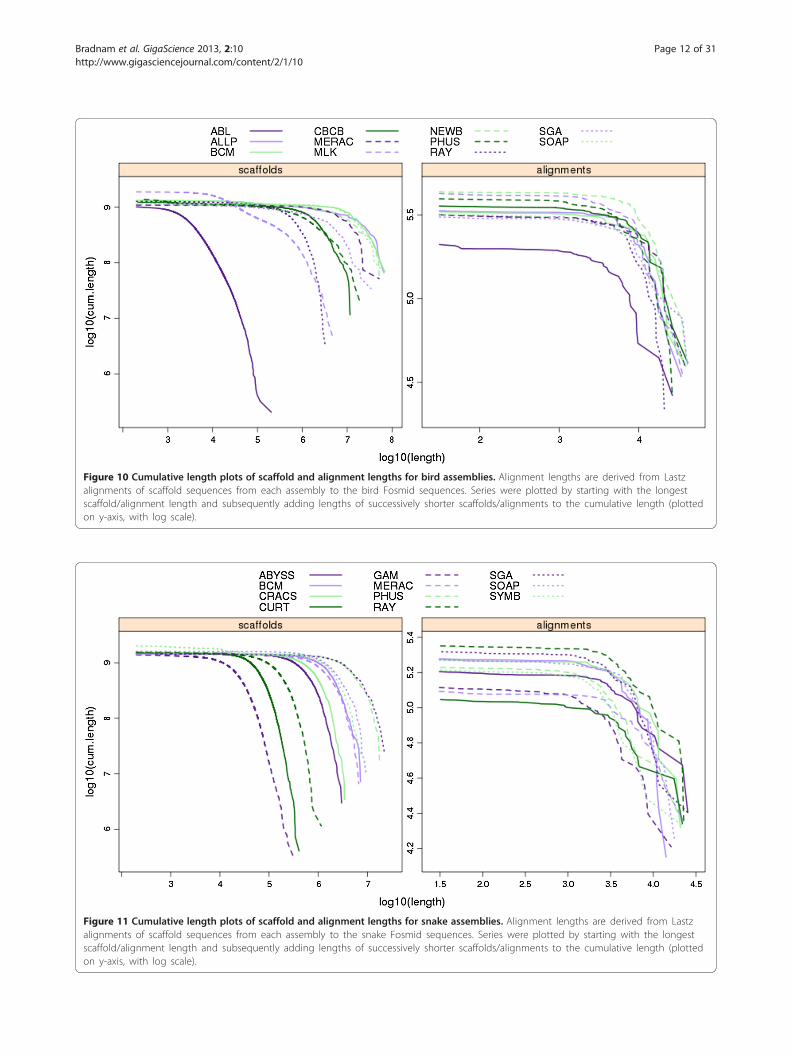
Figure 10 Cumulative length plots of scaffold and alignment lengths for bird assemblies. Alignment lengths are derived from Lastzalignments of scaffold sequences from each assembly to the bird Fosmid sequences. Series were plotted by starting with the longestscaffold/alignment length and subsequently adding lengths of successively shorter scaffolds/alignments to the cumulative length (plottedon y-axis, with log scale).
Figure 11 Cumulative length plots of scaffold and alignment lengths for snake assemblies. Alignment lengths are derived from Lastzalignments of scaffold sequences from each assembly to the snake Fosmid sequences. Series were plotted by starting with the longestscaffold/alignment length and subsequently adding lengths of successively shorter scaffolds/alignments to the cumulative length (plottedon y-axis, with log scale).
Bradnam et al. GigaScience 2013, 2:10 Page 12 of 31http://www.gigasciencejournal.com/content/2/1/10

Bradnam et al. GigaScience 2013, 2:10 Page 13 of 31http://www.gigasciencejournal.com/content/2/1/10
e) How many pairs of tags matched uniquely to thesame contig/scaffold at the expected distance apart(900 ± 2 nt, to allow for short indels in the assemblyand/or Fosmids)
Failure to map uniquely to a single contig or scaffoldsequence might be expected when VFR tag sequencesare derived from repetitive regions of the Fosmids, or ifa Fosmid was incompletely assembled. To address this, afinal summary statistic by which to evaluate the assem-blies was calculated. This summary score is the productof the number of tag pairs that matched the samecontig/scaffold (uniquely or otherwise) and the percent-age of the uniquely matched tag pairs that map at theexpected distance (i.e., c * (e / d)). This measure rewardsassemblies that have produced sequences that containboth tags from a pair (at any distance) and which have ahigh proportion of uniquely mapped tag pairs that aremapped the correct distance apart.Overall, assemblies were broadly comparable when
being assessed by this metric, and produced similarsummary scores for contigs (Additional file 4) and scaf-folds (Figure 12, Additional file 2: Tables S8 and S9). Inbird, the CBCB assembly had the 8th lowest accuracy(91.8%) for placing uniquely mapped tag pairs at thecorrect distance apart in a scaffold, but had the highestnumber of tag pairs that mapped correctly to the samescaffold (910 out of 988). This helped contribute to the
0
100
200
300
400
500
600
700
800
900
CBCB RAY
BCM
ALLP
MLK
SOAP
NEWB
MERAC
PHUS
SGA ABL
ABYS
Bir
d V
FR
Tag
Su
mm
ary
Sco
re
Assem
Figure 12 Short-range scaffold accuracy assessment via Validated Fos(86 in bird and 56 in snake, see text). Then VFRs were divided into non-ovefrom ends of each fragment and searched (using BLAST) against all scaffoldcalculated as the product of a) the number of pairs of tags that both matcthe percentage of only the uniquely matching tag pairs that matched at thassume that all tag-pairs would map uniquely to a single scaffold, are indic
highest overall VFR tag summary score. In snake, theABYSS assembly produced the highest summary score,but this was only slightly higher than the 2nd-placedMERAC assembly (305.8 vs 305.0). The vast majority oftags that were mapped at incorrect distances were usu-ally mapped within 10 nt of the correct distance. Suchmismappings might reflect instances of small-indelheterozygosity in the underlying genomes. However, asmall number of mismappings were over much greatdistances (Additional file 2: Tables S8 and S9).
Optical map analysisThe Optical Mapping System [42,43] creates restrictionmaps from individual genomic DNA molecules that areassembled, de novo, into physical maps spanning entiregenomes. Such maps have been successfully applied tomany large-scale sequencing projects [44-48] and to thediscernment of human structural variation [49]. Recentwork has centered on approaches that integrate mapand sequence data at an early stage of the assemblyprocess [50].Optical maps were constructed for all three species and
were used to validate the long- and short-range accuracyof the scaffold sequences (see Methods). Because the map-ping process requires scaffolds to be at least 300 Kbp inlength, with nine restriction sites present, a number ofassemblies had no sequence that could be used. In con-trast, some assemblies could use nearly all of their input
0
50
100
150
200
250
300
350
S
MERAC
SGA
PHUS RAY
SOAP
CRACS
SYMB
BCM
CURT
GAM
Sn
ake
VF
R T
ag S
um
mar
y S
core
bly
Bird
Snake
mid Regions. First, validated Fosmid regions (VFRs) were identifiedrlapping 1,000 nt fragments and pairs of 100 nt ‘tags’ were extracteds from each assembly. A summary score for each assembly washed the same scaffold in an assembly (at any distance apart) and b)e expected distance (± 2 nt). Theoretical maximum scores, whichated by red dashed line (988 for bird and 350 for snake).

Bradnam et al. GigaScience 2013, 2:10 Page 14 of 31http://www.gigasciencejournal.com/content/2/1/10
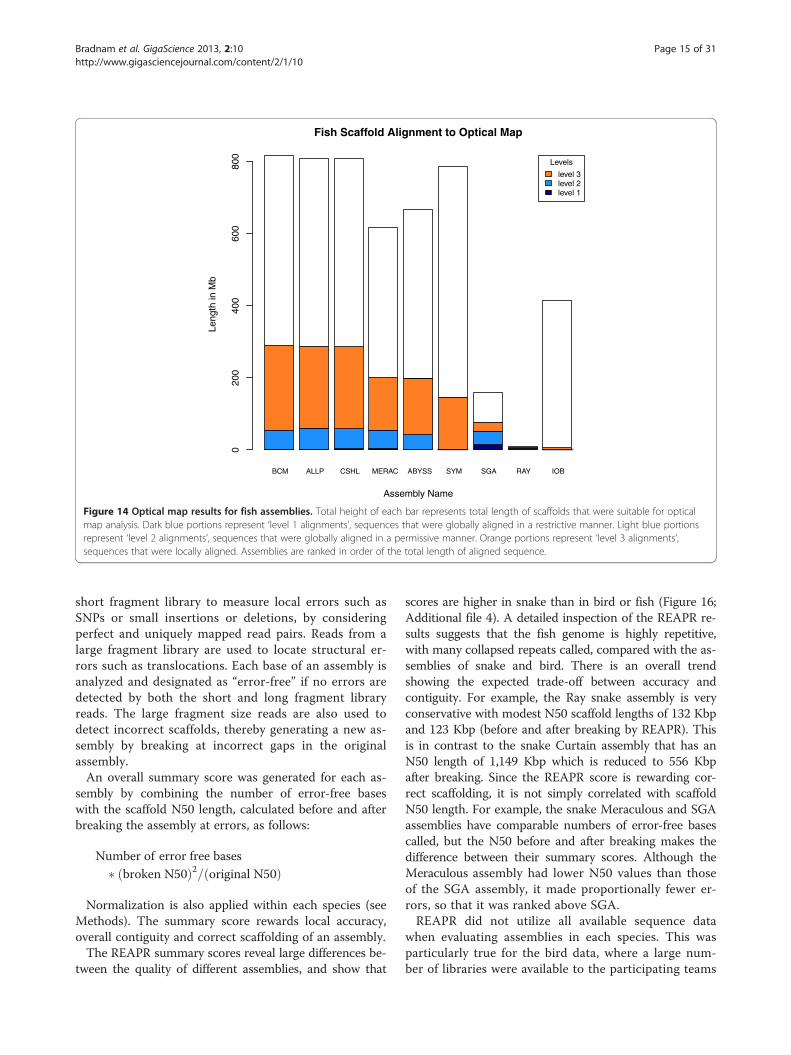
sequence (e.g., 95.8% of the CSHL fish assembly was used,see Additional file 4).The optical map results describe two categories of
global alignments, either ‘restrictive’ (level 1) or ‘permis-sive’ (level 2), and one category of local alignment (level3). High coverage at level 1 suggests that the optical mapand the scaffold sequences are concordant. Level 2 cover-age reveals cases where there are minor problems in thescaffolds, and coverage at level 3 represents regions of thescaffolds that may reflect bad joins or chimeric sequences.The results for bird (Figure 13) show many assemblies
with high amounts of level 1 coverage, with relatively smalldifferences in the total amount of alignable sequence. Thebird SGA assembly was notable for having the secondhighest amount of level 1 coverage, but ranked 8th overalldue to fewer alignments at levels 2 and 3. Among the as-semblies that could be subjected to optical map analysis,the MLK bird assembly ranked last in terms of the totallength of usable scaffold sequence. However, it ranks 2ndbased on the percentage of input sequence that can bealigned to the optical map (see Additional file 4).For the fish assemblies, the optical mapping results show
very low proportions of alignable sequence (Figure 14),and alignable sequence is predominantly in the level 3category, reflecting local alignments. As with bird, ranking
SOAP MERAC ALLP BCM NE
Bird Scaffold Alig
Asse
Leng
th in
Mb
020
040
060
080
010
00
Figure 13 Optical map results for bird assemblies. Total height of eachmap analysis. Dark blue portions represent ‘level 1 alignments’, sequencesrepresent ‘level 2 alignments’, sequences that were globally aligned in a pesequences that were locally aligned. Assemblies are ranked in order of the
assemblies by their total length of alignable sequence maynot paint the most accurate picture of how the assembliesperform. The SGA assembly, which ranks 7th overall bythis measure, had the most level 1 coverage of any assem-bly, and the Ray assembly, which ranked 8th by this meas-ure, had the highest proportion of input sequence that wasalignable.The results for the snake assemblies (Figure 15) were
somewhat intermediate to those for bird and fish.Many snake assemblies showed patterns of alignmentto the optical map that were predominantly in the level2 coverage category. The SOAPdenovo assembly hadthe most input sequence (1.5 Gbp) of any assembly(across all three species) that was suitable for align-ment to the optical map. However, this assemblyranked third from last with only 13.6% of the sequencebeing aligned at any coverage level (see Discussion andAdditional file 3 for reasons which might have causedthis result).
REAPR analysisREAPR [51] is a software tool that analyses the qualityof an assembly, using the information in remappedpaired-end reads to produce a range of metrics at eachbase of the assembly. It uses Illumina reads from a
WB CBCB SGA PHUS RAY MLK
Levels
level 3level 2level 1
nment to Optical Map
mbly Name
bar represents total length of scaffolds that were suitable for opticalthat were globally aligned in a restrictive manner. Light blue portionsrmissive manner. Orange portions represent ‘level 3 alignments’,total length of aligned sequence.
BCM ALLP CSHL MERAC ABYSS SYM SGA RAY IOB
Levels
level 3level 2level 1
Fish Scaffold Alignment to Optical Map
Assembly Name
Leng
th in
Mb
020
040
060
080
0
Figure 14 Optical map results for fish assemblies. Total height of each bar represents total length of scaffolds that were suitable for opticalmap analysis. Dark blue portions represent ‘level 1 alignments’, sequences that were globally aligned in a restrictive manner. Light blue portionsrepresent ‘level 2 alignments’, sequences that were globally aligned in a permissive manner. Orange portions represent ‘level 3 alignments’,sequences that were locally aligned. Assemblies are ranked in order of the total length of aligned sequence.
Bradnam et al. GigaScience 2013, 2:10 Page 15 of 31http://www.gigasciencejournal.com/content/2/1/10
short fragment library to measure local errors such asSNPs or small insertions or deletions, by consideringperfect and uniquely mapped read pairs. Reads from alarge fragment library are used to locate structural er-rors such as translocations. Each base of an assembly isanalyzed and designated as “error-free” if no errors aredetected by both the short and long fragment libraryreads. The large fragment size reads are also used todetect incorrect scaffolds, thereby generating a new as-sembly by breaking at incorrect gaps in the originalassembly.An overall summary score was generated for each as-
sembly by combining the number of error-free baseswith the scaffold N50 length, calculated before and afterbreaking the assembly at errors, as follows:
Number of error free bases� broken N50ð Þ2= original N50ð Þ
Normalization is also applied within each species (seeMethods). The summary score rewards local accuracy,overall contiguity and correct scaffolding of an assembly.The REAPR summary scores reveal large differences be-
tween the quality of different assemblies, and show that
scores are higher in snake than in bird or fish (Figure 16;Additional file 4). A detailed inspection of the REAPR re-sults suggests that the fish genome is highly repetitive,with many collapsed repeats called, compared with the as-semblies of snake and bird. There is an overall trendshowing the expected trade-off between accuracy andcontiguity. For example, the Ray snake assembly is veryconservative with modest N50 scaffold lengths of 132 Kbpand 123 Kbp (before and after breaking by REAPR). Thisis in contrast to the snake Curtain assembly that has anN50 length of 1,149 Kbp which is reduced to 556 Kbpafter breaking. Since the REAPR score is rewarding cor-rect scaffolding, it is not simply correlated with scaffoldN50 length. For example, the snake Meraculous and SGAassemblies have comparable numbers of error-free basescalled, but the N50 before and after breaking makes thedifference between their summary scores. Although theMeraculous assembly had lower N50 values than thoseof the SGA assembly, it made proportionally fewer er-rors, so that it was ranked above SGA.REAPR did not utilize all available sequence data
when evaluating assemblies in each species. This wasparticularly true for the bird data, where a large num-ber of libraries were available to the participating teams

1.E+00
1.E+03
1.E+06
1.E+09
1.E+12
1.E+15
ME
RA
C
ALL
P
SG
A
CB
CB
RA
Y
BC
M
NE
WB
PH
US
SO
AP
MLK
AB
L
SY
M
SG
A
RA
Y
CS
HL
BC
M
ALL
P
ME
RA
C
AB
YS
S
IOB
CT
D
ME
RA
C
SG
A
SY
MB
AB
YS
S
PH
US
RA
Y
SO
AP
BC
M
CR
AC
S
CU
RT
GA
M
RE
AP
R s
um
mar
y sc
ore
Assembly
Bird Snake Fish
Figure 16 REAPR summary scores for all assemblies. This score is calculated as the product of i) the number of error free bases and ii) thesquared scaffold N50 length after breaking assemblies at scaffolding errors divided by the original scaffold N50 length. Data shown for assembliesof bird (blue), fish (red), and snake (green). Results for bird assemblies MLK and ABL and fish assembly CTD are not shown as it was not possibleto run REAPR on these assemblies (see Methods). REAPR summary score is plotted on a log axis.
SGA PHUS MERAC SYMB BCM ABYSS CRACS SOAP RAY GAM
Levels
level 3level 2level 1
Snake Scaffold Alignment to Optical Map
Assembly Name
Leng
th in
Mb
020
040
060
080
010
0012
0014
00
Figure 15 Optical map results for snake assemblies. Total height of each bar represents total length of scaffolds that were suitable for opticalmap analysis. Dark blue portions represent ‘level 1 alignments’, sequences that were globally aligned in a restrictive manner. Light blue portionsrepresent ‘level 2 alignments’, sequences that were globally aligned in a permissive manner. Orange portions represent ‘level 3 alignments’,sequences that were locally aligned. Assemblies are ranked in order of the total length of aligned sequence. Note: the SOAP assembly issub-optimal due to use of mistakenly labeled 4 Kbp and 10 Kbp libraries (see Discussion).
Bradnam et al. GigaScience 2013, 2:10 Page 16 of 31http://www.gigasciencejournal.com/content/2/1/10
Bradnam et al. GigaScience 2013, 2:10 Page 17 of 31http://www.gigasciencejournal.com/content/2/1/10
(see Methods). Assemblies that were optimized to workwith sequences from a particular library may have beenpenalized if REAPR used sequences from a different li-brary to evaluate the assembly quality.
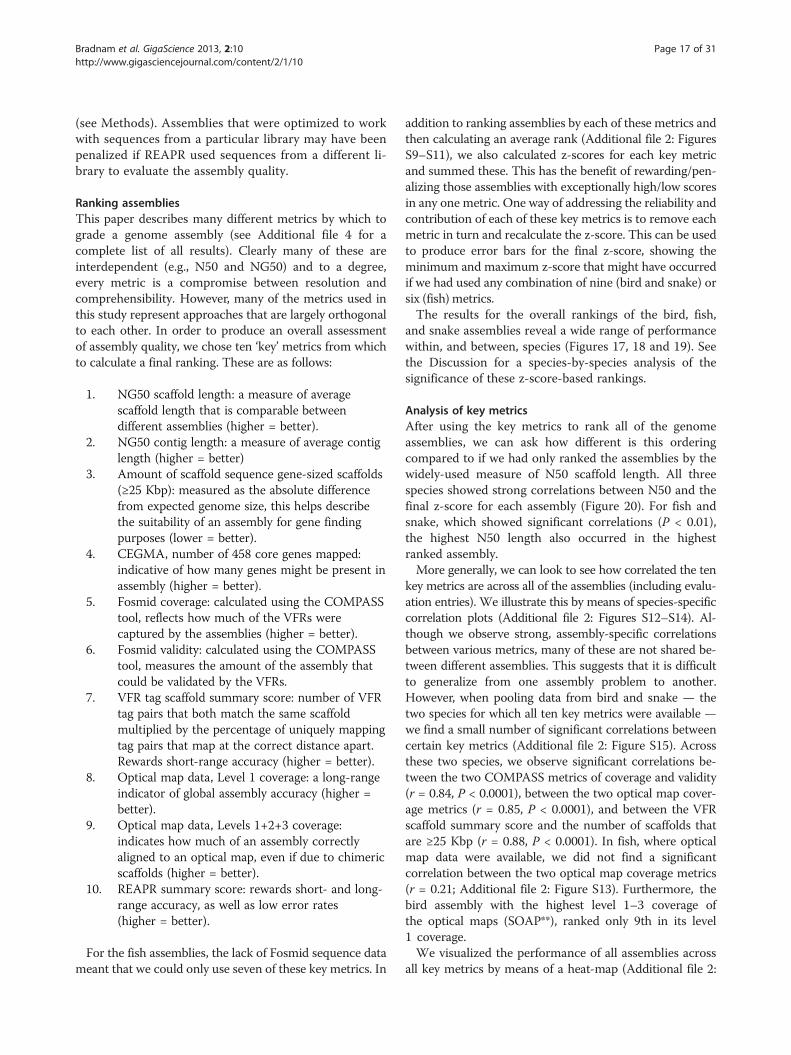
Ranking assembliesThis paper describes many different metrics by which tograde a genome assembly (see Additional file 4 for acomplete list of all results). Clearly many of these areinterdependent (e.g., N50 and NG50) and to a degree,every metric is a compromise between resolution andcomprehensibility. However, many of the metrics used inthis study represent approaches that are largely orthogonalto each other. In order to produce an overall assessmentof assembly quality, we chose ten ‘key’ metrics from whichto calculate a final ranking. These are as follows:
1. NG50 scaffold length: a measure of averagescaffold length that is comparable betweendifferent assemblies (higher = better).
2. NG50 contig length: a measure of average contiglength (higher = better)
3. Amount of scaffold sequence gene-sized scaffolds(≥25 Kbp): measured as the absolute differencefrom expected genome size, this helps describethe suitability of an assembly for gene findingpurposes (lower = better).
4. CEGMA, number of 458 core genes mapped:indicative of how many genes might be present inassembly (higher = better).
5. Fosmid coverage: calculated using the COMPASStool, reflects how much of the VFRs werecaptured by the assemblies (higher = better).
6. Fosmid validity: calculated using the COMPASStool, measures the amount of the assembly thatcould be validated by the VFRs.
7. VFR tag scaffold summary score: number of VFRtag pairs that both match the same scaffoldmultiplied by the percentage of uniquely mappingtag pairs that map at the correct distance apart.Rewards short-range accuracy (higher = better).
8. Optical map data, Level 1 coverage: a long-rangeindicator of global assembly accuracy (higher =better).
9. Optical map data, Levels 1+2+3 coverage:indicates how much of an assembly correctlyaligned to an optical map, even if due to chimericscaffolds (higher = better).
10. REAPR summary score: rewards short- and long-range accuracy, as well as low error rates(higher = better).
For the fish assemblies, the lack of Fosmid sequence datameant that we could only use seven of these key metrics. In
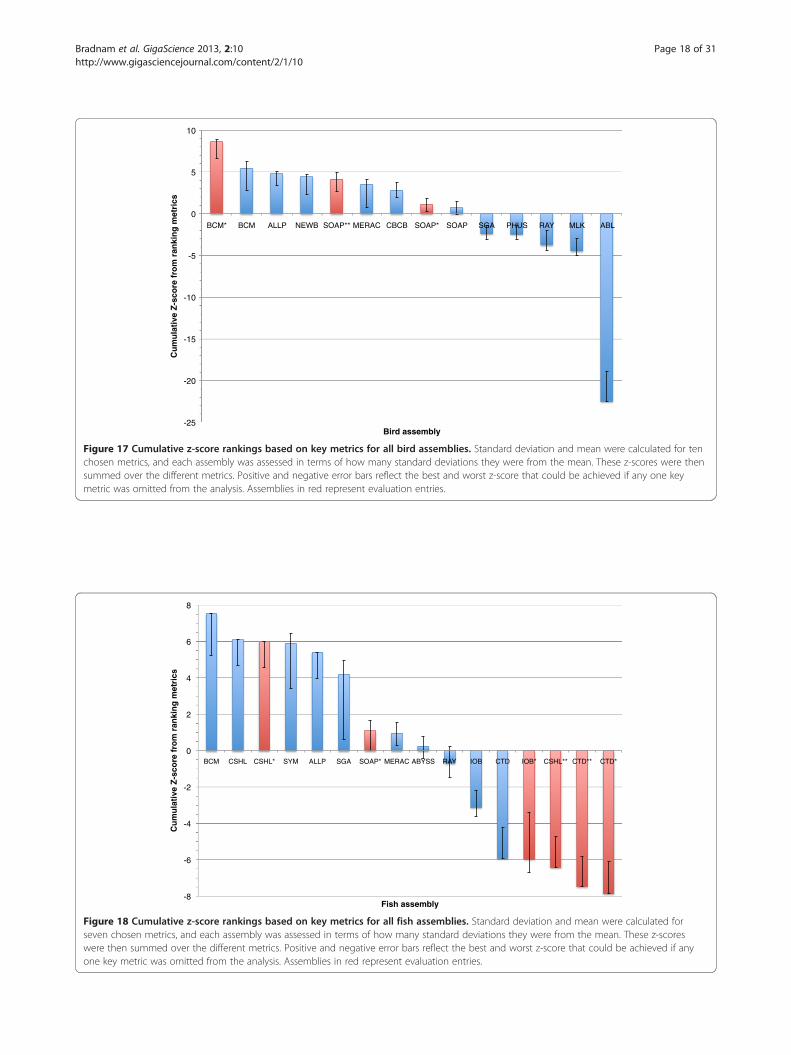
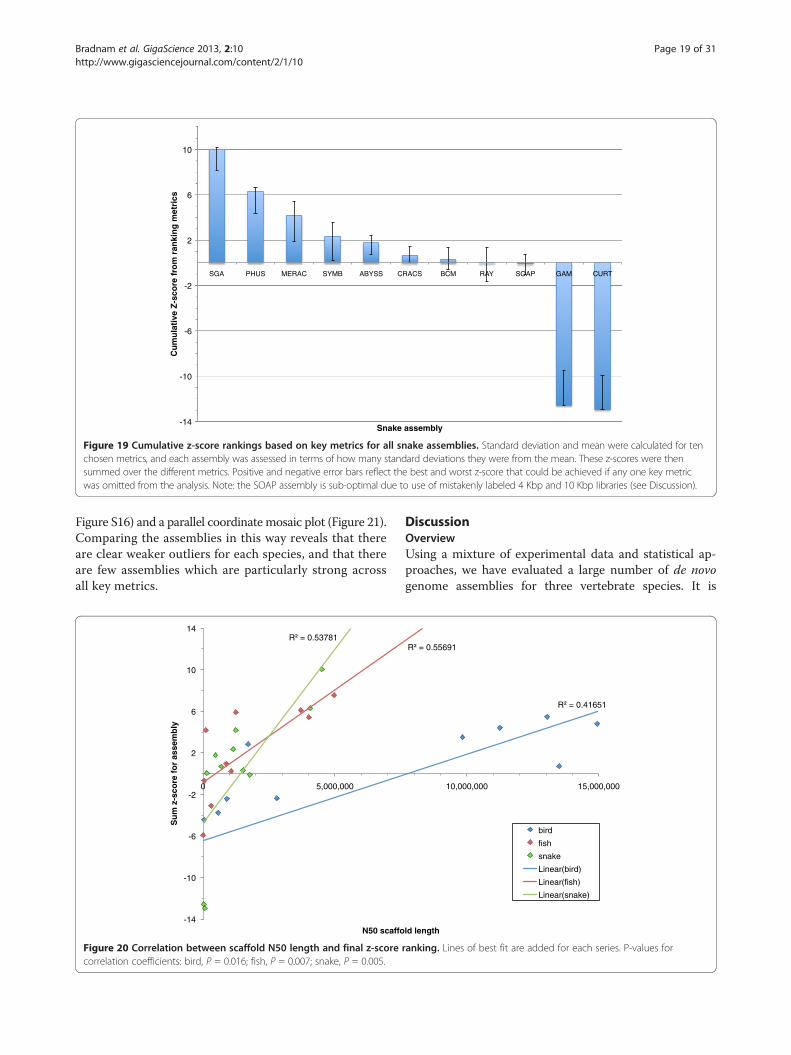
addition to ranking assemblies by each of these metrics andthen calculating an average rank (Additional file 2: FiguresS9–S11), we also calculated z-scores for each key metricand summed these. This has the benefit of rewarding/pen-alizing those assemblies with exceptionally high/low scoresin any one metric. One way of addressing the reliability andcontribution of each of these key metrics is to remove eachmetric in turn and recalculate the z-score. This can be usedto produce error bars for the final z-score, showing theminimum and maximum z-score that might have occurredif we had used any combination of nine (bird and snake) orsix (fish) metrics.The results for the overall rankings of the bird, fish,
and snake assemblies reveal a wide range of performancewithin, and between, species (Figures 17, 18 and 19). Seethe Discussion for a species-by-species analysis of thesignificance of these z-score-based rankings.
Analysis of key metricsAfter using the key metrics to rank all of the genomeassemblies, we can ask how different is this orderingcompared to if we had only ranked the assemblies by thewidely-used measure of N50 scaffold length. All threespecies showed strong correlations between N50 and thefinal z-score for each assembly (Figure 20). For fish andsnake, which showed significant correlations (P < 0.01),the highest N50 length also occurred in the highestranked assembly.More generally, we can look to see how correlated the ten
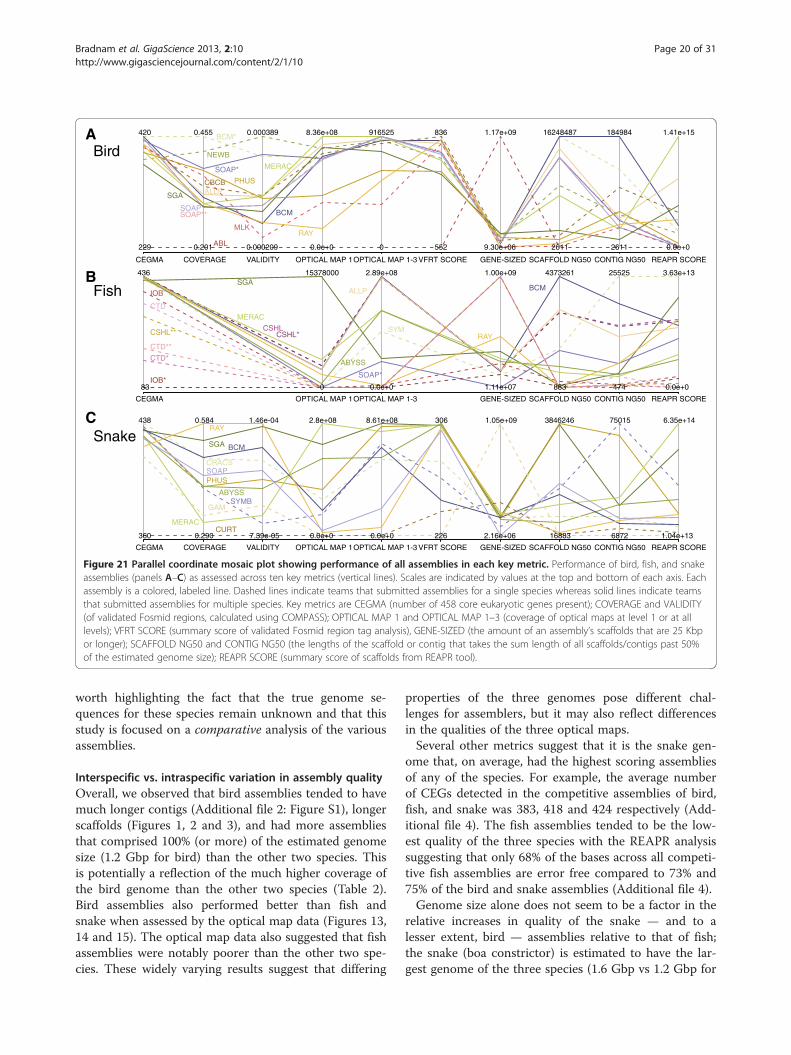
key metrics are across all of the assemblies (including evalu-ation entries). We illustrate this by means of species-specificcorrelation plots (Additional file 2: Figures S12–S14). Al-though we observe strong, assembly-specific correlationsbetween various metrics, many of these are not shared be-tween different assemblies. This suggests that it is difficultto generalize from one assembly problem to another.However, when pooling data from bird and snake — thetwo species for which all ten key metrics were available —we find a small number of significant correlations betweencertain key metrics (Additional file 2: Figure S15). Acrossthese two species, we observe significant correlations be-tween the two COMPASS metrics of coverage and validity(r = 0.84, P < 0.0001), between the two optical map cover-age metrics (r = 0.85, P < 0.0001), and between the VFRscaffold summary score and the number of scaffolds thatare ≥25 Kbp (r = 0.88, P < 0.0001). In fish, where opticalmap data were available, we did not find a significantcorrelation between the two optical map coverage metrics(r = 0.21; Additional file 2: Figure S13). Furthermore, thebird assembly with the highest level 1–3 coverage ofthe optical maps (SOAP**), ranked only 9th in its level1 coverage.We visualized the performance of all assemblies across
all key metrics by means of a heat-map (Additional file 2:
-25
-20
-15
-10
-5
0
5
10
BCM* BCM ALLP NEWB SOAP** MERAC CBCB SOAP* SOAP SGA PHUS RAY MLK ABL
Cu
mu
lati
ve Z
-sco
re f
rom
ran
kin
g m
etri
cs
Bird assembly
Figure 17 Cumulative z-score rankings based on key metrics for all bird assemblies. Standard deviation and mean were calculated for tenchosen metrics, and each assembly was assessed in terms of how many standard deviations they were from the mean. These z-scores were thensummed over the different metrics. Positive and negative error bars reflect the best and worst z-score that could be achieved if any one keymetric was omitted from the analysis. Assemblies in red represent evaluation entries.
-8
-6
-4
-2
0
2
4
6
8
BCM CSHL CSHL* SYM ALLP SGA SOAP* MERAC ABYSS RAY IOB CTD IOB* CSHL** CTD** CTD*
Cu
mu
lati
ve Z
-sco
re f
rom
ran
kin
g m
etri
cs
Fish assembly
Figure 18 Cumulative z-score rankings based on key metrics for all fish assemblies. Standard deviation and mean were calculated forseven chosen metrics, and each assembly was assessed in terms of how many standard deviations they were from the mean. These z-scoreswere then summed over the different metrics. Positive and negative error bars reflect the best and worst z-score that could be achieved if anyone key metric was omitted from the analysis. Assemblies in red represent evaluation entries.
Bradnam et al. GigaScience 2013, 2:10 Page 18 of 31http://www.gigasciencejournal.com/content/2/1/10
-14
-10
-6
-2
2
6
10
SGA PHUS MERAC SYMB ABYSS CRACS BCM RAY SOAP GAM CURT
Cu
mu
lati
ve Z
-sco
re f
rom
ran
kin
g m
etri
cs
Snake assembly
Figure 19 Cumulative z-score rankings based on key metrics for all snake assemblies. Standard deviation and mean were calculated for tenchosen metrics, and each assembly was assessed in terms of how many standard deviations they were from the mean. These z-scores were thensummed over the different metrics. Positive and negative error bars reflect the best and worst z-score that could be achieved if any one key metricwas omitted from the analysis. Note: the SOAP assembly is sub-optimal due to use of mistakenly labeled 4 Kbp and 10 Kbp libraries (see Discussion).
Bradnam et al. GigaScience 2013, 2:10 Page 19 of 31http://www.gigasciencejournal.com/content/2/1/10
Figure S16) and a parallel coordinate mosaic plot (Figure 21).Comparing the assemblies in this way reveals that thereare clear weaker outliers for each species, and that thereare few assemblies which are particularly strong acrossall key metrics.
R = 0.53781
-14
-10
-6
-2
2
6
10
14
0 5,000,000
Su
m z
-sco
re f
or
asse
mb
ly
N50 scaffo
Figure 20 Correlation between scaffold N50 length and final z-scorecorrelation coefficients: bird, P = 0.016; fish, P = 0.007; snake, P = 0.005.
DiscussionOverviewUsing a mixture of experimental data and statistical ap-proaches, we have evaluated a large number of de novogenome assemblies for three vertebrate species. It is
R = 0.41651
R = 0.55691
10,000,000 15,000,000
ld length
bird
fish
snake
Linear(bird)
Linear(fish)
Linear(snake)
ranking. Lines of best fit are added for each series. P-values for
A
B
C
Fish
Bird
Snake
SGA
MERAC
CSHL*
ABYSS
SOAP*
SYM
BCM
RAY
ALLP
CSHL
IOB*
CTD*
CTD**
CSHL**
CTD
IOB
83
436 15378000 2.89e+08 1.00e+09 4373261 25525 3.63e+13
0 0.0e+0 1.11e+07 883 474 0.0e+0
CEGMA OPTICAL MAP 1OPTICAL MAP 1-3 GENE-SIZED SCAFFOLD NG50 CONTIG NG50 REAPR SCORE
ABL
MLKRAY
SOAPSOAP**
SGA ALLPPHUSCBCB
BCM
MERACSOAP*
NEWB
BCM*
229
420 0.455 0.000389 8.36e+08 916525 836 1.17e+09 16248487 184984 1.41e+15
0.201 0.000209 0.0e+0 0 552 9.30e+06 2611 2611 0.0e+0
CEGMA COVERAGE VALIDITY OPTICAL MAP 1OPTICAL MAP 1-3 VFRT SCORE GENE-SIZED SCAFFOLD NG50 CONTIG NG50 REAPR SCORE
CURTMERAC
GAMSYMB
ABYSS
SOAPCRACS
PHUS
RAY
SGA BCM
360
438 0.584 1.46e-04 2.8e+08 8.61e+08 306 1.05e+09 3846246 75015 6.35e+14
0.290 7.39e-05 0.0e+0 0.0e+0 226 2.16e+06 16883 6872 1.04e+13
CEGMA COVERAGE VALIDITY OPTICAL MAP 1OPTICAL MAP 1-3 VFRT SCORE GENE-SIZED SCAFFOLD NG50 CONTIG NG50 REAPR SCORE
Figure 21 Parallel coordinate mosaic plot showing performance of all assemblies in each key metric. Performance of bird, fish, and snakeassemblies (panels A–C) as assessed across ten key metrics (vertical lines). Scales are indicated by values at the top and bottom of each axis. Eachassembly is a colored, labeled line. Dashed lines indicate teams that submitted assemblies for a single species whereas solid lines indicate teamsthat submitted assemblies for multiple species. Key metrics are CEGMA (number of 458 core eukaryotic genes present); COVERAGE and VALIDITY(of validated Fosmid regions, calculated using COMPASS); OPTICAL MAP 1 and OPTICAL MAP 1–3 (coverage of optical maps at level 1 or at alllevels); VFRT SCORE (summary score of validated Fosmid region tag analysis), GENE-SIZED (the amount of an assembly’s scaffolds that are 25 Kbpor longer); SCAFFOLD NG50 and CONTIG NG50 (the lengths of the scaffold or contig that takes the sum length of all scaffolds/contigs past 50%of the estimated genome size); REAPR SCORE (summary score of scaffolds from REAPR tool).
Bradnam et al. GigaScience 2013, 2:10 Page 20 of 31http://www.gigasciencejournal.com/content/2/1/10
worth highlighting the fact that the true genome se-quences for these species remain unknown and that thisstudy is focused on a comparative analysis of the variousassemblies.
Interspecific vs. intraspecific variation in assembly qualityOverall, we observed that bird assemblies tended to havemuch longer contigs (Additional file 2: Figure S1), longerscaffolds (Figures 1, 2 and 3), and had more assembliesthat comprised 100% (or more) of the estimated genomesize (1.2 Gbp for bird) than the other two species. Thisis potentially a reflection of the much higher coverage ofthe bird genome than the other two species (Table 2).Bird assemblies also performed better than fish andsnake when assessed by the optical map data (Figures 13,14 and 15). The optical map data also suggested that fishassemblies were notably poorer than the other two spe-cies. These widely varying results suggest that differing
properties of the three genomes pose different chal-lenges for assemblers, but it may also reflect differencesin the qualities of the three optical maps.Several other metrics suggest that it is the snake gen-
ome that, on average, had the highest scoring assembliesof any of the species. For example, the average numberof CEGs detected in the competitive assemblies of bird,fish, and snake was 383, 418 and 424 respectively (Add-itional file 4). The fish assemblies tended to be the low-est quality of the three species with the REAPR analysissuggesting that only 68% of the bases across all competi-tive fish assemblies are error free compared to 73% and75% of the bird and snake assemblies (Additional file 4).Genome size alone does not seem to be a factor in the
relative increases in quality of the snake — and to alesser extent, bird — assemblies relative to that of fish;the snake (boa constrictor) is estimated to have the lar-gest genome of the three species (1.6 Gbp vs 1.2 Gbp for

Bradnam et al. GigaScience 2013, 2:10 Page 21 of 31http://www.gigasciencejournal.com/content/2/1/10
bird and 1.0 Gbp for fish). The most likely factors thataccount for these interspecific differences would be thediffering levels of heterozygosity and/or repeat contentin the three genomes. In agreement with this hypothesis,Lake Malawi cichlids are known to be highly geneticallydiverse, resulting from extensive hybridization that leadsto high levels of heterozygosity [52,53]. The REAPR ana-lysis also suggests that repeats in the fish genome mightpose more of an issue for assemblers than the bird andsnake genomes. The extent to which repeat content andheterozygosity made it harder to assemble the bird andsnake genomes is less clear. The RepeatMasker analysisof the Fosmid sequences revealed there to be more re-peats in snake than bird (13.2% of total Fosmid sequencelength vs 8.6%). Observed heterozygosity for boa con-strictors has been shown to be in the range of 0.36–0.42[54] whereas a much wider range (0.1–0.8) has beendescribed for budgerigars (Zhang and Jarvis, personalcommunication).Aside from possible differences in the genomes of the
three species, it should also be noted that there are in-terspecific differences with regards to the sequencingdata that was available for each species. For example, allof the short-insert Illumina libraries in fish had overlap-ping paired reads, whereas in snake they were all non-overlapping (see Additional file 1). These differencesmean that assemblers that were well-suited for workingwith the fish data may not be as suited for working withthe snake data, and vice versa. The bird genome was dif-ferent to the other species in having many more librariesavailable with many different insert sizes (see Additionalfile 1) and also in having sequencing data availablefrom three different platforms (discussed below, see‘The effects of combining different data types’).
Bird assembly overviewFor the budgerigar genome, we found the BCM-HGSCassembly to be the highest ranked competitive assemblywhen using the sum z-score approach (Figure 17).However, if evaluation assemblies are included then theBCM-HGSC evaluation entry (BCM*) produces a not-ably higher sum z-score; the reasons for the differencesbetween these two BCM-HGSC assemblies are dis-cussed below (see ‘The effects of combining differentdata types’). The two evaluation assemblies from theSOAPdenovo team (SOAP* and SOAP**) also rankhigher than the competitive SOAP entry.Among the competitive assemblies, the Allpaths and
Newbler entries rank closely behind the assembly fromthe BCM-HGSC team in terms of overall z-score. Whilethe competitive BCM-HGSC entry performs well acrossmany of the key metrics, it would not be ranked 1st overallif any one of three different key metrics (CEGMA, scaffoldNG50, and contig NG50) had been excluded from the
calculation of the z-score. The overall heterogeneity of thebird assemblies is further underlined by the fact that 6 ofthe 14 entries (including evaluation assemblies) wouldrank 1st (or joint 1st) when ranked separately by each ofthe ten key metrics.Ordering the assemblies by their average rank rather
than by z-score produces a slightly different result(Additional file 2: Figure S9). Assemblies from BCM-HGSC and Allpaths switch 1st and 2nd places, but bothare still placed behind the BCM* assembly. The CBCBentry ranks higher using this method, moving to 3rdplace among competitive entries.It should be noted that the top three-ranked competi-
tive bird assemblies each used a very different combin-ation of sequencing data: BCM-HGSC used Illumina +Roche 454 + PacBio, Allpaths only used Illumina, andNewbler only used Roche 454. Therefore, the similarityin overall assembly rankings should be weighed againstthe different costs that each strategy would require.
Fish assembly overviewThe lack of Fosmid sequence data for the Lake Malawicichlid removed three of the key metrics that were usedfor the other two species. Overall, the fish assembliescould broadly be divided into three groups with the firstgroup consisting of the most highly ranked assembliesgenerated by the teams BCM-HGSC, CSHL, Symbioseand Allpaths (Figure 18). The BCM-HGSC assemblyscored highly in most key metrics, and excelled in themeasure of scaffold N50 length. This is the only keymetric which, if excluded, would remove the BCM-HGSC assembly from 1st place when using a z-scoreranking system. An ordering of assemblies based on theiraverage rank provides only minor differences to that of thez-score ranking (Additional file 2: Figure S10).The CSHL team submitted two additional evaluation
assemblies for fish. Their competitive assembly ranked2nd overall, and was produced by the Metassembler tool[55] which combined the results of two separate assem-blies (CSHL* and CSHL**, that were made using theAllpaths and SOAPdenovo assemblers respectively).Both of these CSHL evaluation assemblies were pro-duced using the default parameters for the assemblysoftware in question (though for the SOAPdenovoassembly, CSHL team also used Quake [56] to error cor-rect the reads before assembly). The CSHL Allpaths as-sembly ranked slightly higher than the competitive entryfrom the Allpaths team, though this is only apparent inthe z-score rankings (they produce the same average rank,Additional file 2: Figure S10). In contrast, the CSHLSOAPdenovo entry ranked much lower than the eva-luation assembly from the SOAPdenovo team entry(SOAP*).
Bradnam et al. GigaScience 2013, 2:10 Page 22 of 31http://www.gigasciencejournal.com/content/2/1/10
Snake assembly overviewThe snake assemblies provided the clearest situationwhere one competitive assembly outperformed all of theothers. The SGA assembly scored highly in eight of theten key metrics, producing a final z-score that was not-ably higher than that of the Phusion assembly thatranked 2nd (Figure 19). If any one of the ten key metricswere removed from the analysis, the SGA assemblywould still rank 1st by either ranking method. Orderingthe assemblies by their average rank produced a nearidentical ranking when compared to using z-scores(Additional file 2: Figure S11).It should be noted that the SOAPdenovo entry was
generated at a time when some of the Illumina mate-pairlibraries were temporarily mislabelled in the data instruc-tion file (details of 4 Kbp and 10 Kbp libraries weremistakenly switched). The fact that their assembly wasproduced with incorrectly labeled data was not noticeduntil all assemblies had been evaluated, and this maytherefore have unfairly penalized their entry. A correctedassembly has subsequently been made available [57] whichprovides an approximate 6-fold increase in the scaffoldNG50 length compared to the original entry.Despite the apparent pre-eminence of the SGA assem-
bler it should still be noted that this assembly only ranked1st in one of the ten key metrics that was used and ranked7th in another (the amount of gene-sized scaffolds).Furthermore, seven different assemblies would rank 1stif assessed by individual metrics from the set of ten.This reinforces the challenges of assessing the overallquality of a genome assembly when using multiplemetrics.
Assembler performance across all three speciesSGA, BCM-HGSC, Meraculous, and Ray were the onlyteams to provide competitive assemblies for all threespecies (SOAPdenovo provided entries for all species,but only included an evaluation assembly for fish). How-ever, other teams included assemblies for at least two ofthe species so it is possible to ask how many times didan assembler rank 1st for any of the key metrics thatwere evaluated. Theoretically, an assembler could beranked 1st in 27 different key metrics (ten each for birdand snake, and seven for fish).Excluding the evaluation entries, we observed that as-
semblies produced by the BCM-HGSC team achievedmore 1st place rankings (five) than any other team. Be-hind the BCM-HGSC team were Meraculous and Sym-biose (four 1st place rankings each), and the Ray team(three 1st place rankings). The Meraculous assemblerwas notably consistent in its performance in the samemetric across different species, ranking 1st, 2nd, and 1stin the level 1 coverage of the optical maps (for bird, fish,and snake respectively). The result for Ray is somewhat
surprising as the three Ray assemblies only ranked 7th,7th and 9th overall among competitive entries (for bird,fish, and snake respectively).These analyses reveal that — at least in this competi-
tion — it is very hard to make an assembly that performsconsistently when assessed by different metrics within aspecies, or when assessed by the same metrics in differ-ent species.
The effects of combining different data types in birdFor the bird genome, we provided three different typesof sequencing data: Illumina, Roche 454, and Pacific Bio-sciences (PacBio). However, only four teams attemptedto combine sequence data from these different platformsin their final assemblies.The BCM-HGSC team used all three types of sequence
data in their competitive entry (BCM), but did not use thePacBio data in their evaluation entry (BCM*). For theircompetitive assembly, PacBio data were used to fill scaf-folding gaps (runs of Ns), but otherwise this assembly wasgenerated in the same way as the evaluation entry. Al-though gap-filling in this manner led to longer contigs(Additional file 2: Figure S1), the overall effect was to pro-duce a lower-ranked assembly (Figure 17). This is becauseinclusion of the higher error-rate PacBio data led to amarked decrease in the coverage and validity measuresproduced by COMPASS. This, in turn, was because theLastz tool [58] that was used for alignment was run with azero penalty for ambiguous characters (Ns), rather thanthe default penalty score. Consequently, errors in PacBiosequence used in the scaffolding gaps caused breaks inalignments and exclusion of shorter alignments betweengaps. If this setting were changed to penalize matches toambiguous bases in the same way as mismatched unam-biguous bases, then it would likely reverse the rankings ofthese two assemblies.In addition to a competitive entry, the SOAPdenovo
team included two evaluation assemblies for bird whichboth ranked higher than their competitive entry. Theevaluation entries differed in using only Illumina (SOAP*)or Illumina plus Roche 454 (SOAP**) data. Inclusion ofthe Roche 454 data contributed to a markedly better as-sembly (Figure 18), but again this was mostly achievedthrough increased coverage and validity when comparedto the SOAP* assembly.The other teams that combined sequencing data were
the CBCB team that used all three types of data and theABL team which used Illumina plus Roche 454 data.Both of these teams only submitted one assembly so it isnot possible to accurately evaluate the effect of combin-ing data sets compared to an assembly which only usedone set of sequence data. The CBCB team have separ-ately reported on the generation of their entry, as well asadditional budgerigar assemblies, and have described the

Bradnam et al. GigaScience 2013, 2:10 Page 23 of 31http://www.gigasciencejournal.com/content/2/1/10
effects of correcting PacBio reads using shorter Illuminaand 454 reads[59]. Their assembly performed compe-tently when assessed by most metrics, but was penalizedby much lower NG50 scaffold lengths compared to otherbird assemblies. It should also be noted that the Ray as-sembler [60] that was used for the Ray fish assembly,was designed to work with Illumina and Roche 454reads, but this team chose to only use the Illumina datain their assembly.Overall, the bird assemblies that attempted to combine
multiple types of sequencing data ranked 1st, 2nd, 5th,7th, and 14th when assessed by all key metrics. The twoassemblies that included PacBio data (BCM and CBCB)had the highest and second-highest contig NG50 lengthsamong all competitive bird assemblies (Additional file 2:Figure S1), suggesting that inclusion of PacBio data maybe particularly useful in this regard. However, it may bedesirable to correct the PacBio reads using other sequen-cing data as was done by the CBCB team, a process thatmay have been responsible for the higher values ofcoverage and validity in this assembly compared to theBCM-HGSC entry.Aside from differences in assembly quality, it should
also be noted that the generation of raw sequence datafrom multiple platforms will typically lead to an increasein sequencing costs. This was not an aspect factored intothis evaluation, but should be an important consider-ation for those considering mixing different data types.It should also be pointed out that not all assemblers aredesigned to work with data from multiple sequencingplatforms.
Size isn’t everythingAssemblies varied considerably in size, with some beingmuch bigger or smaller than the estimated genome size forthe species in question. However, very large or small as-semblies may still rank highly across many key metrics. Forexample, among competitive entries, the Ray team gener-ated the smallest fish assembly (~80% of estimated genomesize), but this had the second highest REAPR summaryscore (Additional file 4). The PRICE snake assembly wasexcluded from detailed analysis because it accounted forless than 25% of the estimated snake genome size. Thisteam used their own assembler [61] and implemented adifferent strategy to that used by other teams, focusing onlyon assembling the likely genic regions of the snake gen-ome. They did this by looking for matches from the inputread data to the gene annotations from the green lizard(Anolis carolinensis); this being the closest species to snakethat has a full set of genome annotations. While their as-sembly only comprises ~10% of the estimated genome sizefor the snake, it contains almost three-quarters (332 out of438) of the core eukaryotic genes that are present across allsnake assemblies (see Additional file 4). While this is still
fewer than any other snake assembly, it would be rankedhighest if evaluating assemblies in terms of ‘number ofcore genes per Mbp of assembly (Additional file 2:Figure S17).
Lessons learned from assemblathon 2The clear take-home message from this exercise is thelack of consistency between assemblies in terms of inter-specific as well as intraspecific comparisons. An assemblermay produce an excellent assembly when judged by oneapproach, but a much poorer assembly when judged byanother. The SGA snake assembly ranked 1st overall, butonly ranked 1st in one individual key metric, and ranked5th and 7th in others. Even when an assembler performswell across a range of metrics in one species, it is no guar-antee that this assembler will work as well with a differentgenome. The BCM-HGSC team produced the top rankingassembly for bird and fish, but a much lower-ranked as-sembly for snake. Comparisons between the performanceof the same assembler in different species are confoundedby the different nature of the input sequence data that wasprovided for each species.By many metrics, the best assemblies that were pro-
duced were for the snake, a species that had a largergenome than the other two species, but which hadfewer repeats than the bird genome (as assessed byRepeatMasker analysis). The snake dataset also had thelowest read coverage of all three species, with less thanhalf the coverage of the bird (Table 2). Higher levels ofheterozygosity in the two other genomes are likely tobe responsible for these differences.We used ten ‘key metrics’ which each capture a
slightly different facet of assembly quality. It is apparentthat using a slightly different set of metrics could haveproduced a very different ranking for many of the as-semblies (Figures 17, 18 and 19, Additional file 2: FiguresS9–S11). Two of these key metrics are based on align-ments of scaffolds to optical maps and these metricssometimes revealed very different pictures of assemblyquality. For example, the SGA fish assembly had very highlevel 1 coverage of the optical map, reflecting global align-ments that indicate scaffolds lacking assembly problems.In contrast, this assembly ranked below average for thetotal coverage (levels 1–3) of the optical maps. This sug-gests that many other assemblies were better at producingshorter regions of scaffolds that were accurate, even ifthose scaffolds were chimeric.N50 scaffold length — a measure that came to promin-
ence in the analysis of the draft human genome sequence[62]— remains a popular metric. Although it was designedto measure the contiguity of an assembly, it is frequentlyused as a proxy by which to gauge the quality of a genomeassembly. Continued reliance on this measure has attractedcriticism (e.g., [15]) and others have proposed alternative
Bradnam et al. GigaScience 2013, 2:10 Page 24 of 31http://www.gigasciencejournal.com/content/2/1/10
metrics, such as ‘normalized N50’ [63] to address some ofthe criticisms. As in Assemblathon 1 [28], we find thatN50 remains highly correlated with our overall rankings(Figure 20). However, it may be misleading to rely solely onthis metric when assessing an assembly’s quality. For ex-ample, the SOAP bird assembly has the 2nd highest N50length but ranked 6th among competitive assemblies basedon the overall z-score. Conversely, assemblies with lowscaffold N50 lengths may excel in one or more specificmeasures of assembly quality; for example, the Ray snakeassembly ranked 9th for N50 scaffold length but ranked 1stin the two COMPASSmetrics of coverage and validity.Recently, another assembly quality metric has been
proposed that uses alignments of paired-end and mate-pair reads to an assembly to generate Feature-ResponseCurves (FRC) [15,64]. This approach attempts to capturea trade-off between accuracy and continuity, and has re-cently been used to assess a number of publicly availablegenome assembly datasets including the snake assem-blies that were submitted for Assemblathon 2 [65]. Theauthors used the read alignments to generate a numberof features which can be evaluated separately or com-bined for an overall view of assembly accuracy. Theyidentified SGA and Meraculous as producing the highestranking assemblies, results which agree with our findings(SGA and Meraculous ranked 1st and 3rd). They alsoechoed our conclusions that focusing on individual met-rics can often produce different rankings for assemblers.Combining multiple assemblies from different assem-
bly pipelines in order to produce an improved assemblywas an approach used in the assembly of the rhesus ma-caque genome [66]. It might therefore be expected thatan improved assembly could be made for each of thethree species in this study. The results from the CEGMAanalysis (Figure 5) indicate that this may be possible, atleast in terms of the genic content of an assembly. Threefish assemblies (CSHL, CSHL*, and SOAP*) were allfound to contain the most core genes (436 out of 458CEGs), but 455 CEGs were present across all assemblies.Combining assemblies is the approach that the GenomicAssemblies Merger (GAM) team used for their snakeassembly. The GAM program) [67] combined separateassemblies produced by the CLC and ABySS assemblers[8,68]. However, the resulting assembly scored poorly inmost metrics. In contrast, the metassembler entry fromthe CSHL team produced a high-ranking assembly, butone that was only marginally better than the two sourceassemblies that it was based on.One important limitation of this study is that we did
not assess the degree to which different assemblers re-solved heterozygous regions of the genome into separatehaplotypes. Therefore we do not know whether thelarger-than-expected assemblies may simply reflect situ-ations where an assembler successfully resolved a highly
heterozygous region into two separate contigs. Some as-semblers are known to combine such contigs into onescaffold where the heterozygous region appears as aspurious segmental duplication [25]. Many assemblersonly produce only a haploid consensus version of a targetdiploid genome. This is partly a limitation of the FASTAfile format and a current effort to propose a new assemblyfile format is ongoing. This FASTG format [69] is intendedto allow representation of heterozygous regions (and otheruncertainties) and could lead to more accurate assess-ments of genome assembly quality in future.A final, but important, point to note is that many of the
assemblies entered into this competition were submittedby the authors of the software that was used to create theassembly. These entries might therefore be considered torepresent the best possible assemblies that could be createdwith these tools; third-party users may not be able to pro-duce as good results without first gaining considerable fa-miliarity with the software. Related to this point are theissues of: ‘ease of installation’, ‘quality of documentation’and ‘ease of use’ of each assembly tool. These might alsobe considered important metrics to many end users ofsuch software. We did not assess these qualities and pro-spective users of such software should be reminded that itmight not be straightforward to reproduce any of the as-semblies described in this study.
Practical considerations for de novo genome assemblyBased on the findings of Assemblathon 2, we make a fewbroad suggestions to someone looking to perform a denovo assembly of a large eukaryotic genome:
1. Don’t trust the results of a single assembly. Ifpossible, generate several assemblies (with differentassemblers and/or different assembler parameters).Some of the best assemblies entered forAssemblathon 2 were the evaluation assembliesrather than the competition entries.
2. Do not place too much faith in a single metric. It isunlikely that we would have considered SGA to haveproduced the highest ranked snake assembly if wehad only considered a single metric.
3. Potentially choose an assembler that excels in thearea you are interested in (e.g., coverage, continuity,or number of error free bases).
4. If you are interested in generating a genomeassembly for the purpose of genic analysis (e.g.,training a gene finder, studying codon usage bias,looking for intron-specific motifs), then it may notbe necessary to be concerned by low N50/NG50values or by a small assembly size.
5. Assess the levels of heterozygosity in your targetgenome before you assemble (or sequence) it and setyour expectations accordingly.

Bradnam et al. GigaScience 2013, 2:10 Page 25 of 31http://www.gigasciencejournal.com/content/2/1/10
MethodsAssembly file formatEach assembly was submitted as a single file of FASTA-formatted scaffold sequences which were allowed to con-tain Ns or other nucleotide ambiguity characters. Submis-sions were renamed for anonymity and checked for minorerrors (e.g., duplicate FASTA headers). Participants wereasked to use runs of 25 or more N characters to denotecontig boundaries without scaffolds.
Basic assembly statisticsBasic statistical descriptions of each assembly were gene-rated using a Perl script (assemblathon_stats.pl [33]). Thestatistics calculated by this script were generated for scaf-fold and contig sequences (contigs resulted from splittingscaffolds on runs of 25 or more Ns).
Calculating average vertebrate gene lengthUsing the Ensembl 68 Genes dataset [70], we extractedthe latest protein-coding annotations for human (Homosapiens), chicken (Gallus gallus), zebrafish (Danio rerio),a frog (Xenopus laevis), and a lizard (Anolis carolinensis).From these datasets, we calculated the size of an averagevertebrate gene to be 25 Kbp.
CEGMA analysisThe CEGMA tool [38,40], was used to assess the genecomplement of each assembly. Version 2.3 of CEGMAwas run, using the --vrt option to allow for longer (ver-tebrate-sized) introns to be detected.CEGMA produces additional output for a subset of
the 248 most highly conserved, and least paralogousCEGs. For these CEGs, additional information is givenas to whether they are present as a full-length gene oronly partially. CEGMA scores predicted proteins byaligning them to a HMMER profile built for each coregene family. The fraction of the alignment of a predictedprotein to the HMMER profile can range from 20–100%. If this fraction exceeds 70% the protein is classedas a full-length CEG, otherwise it is classified as partial.In both cases, the predicted protein must also exceed apredetermined cut-off score (see [40]).
Fosmid dataIn order to provide an independent reference for assem-blies, panels of pooled Fosmid clone Illumina paired-endlibraries (~35 Kbp inserts) were made from the bird andsnake samples using methods described in [71]. In eachcase, 10 pools were sequenced at various different poolinglevels, from mostly non-overlapping sets of Fosmids (1, 1,1, 1, 2, 4, 8, 16, 32, and 48 — 96 or 114 clones sequencedin total), generating Illumina 100 × 100 bp paired-endsequences, with a predicted insert size of 350 ± 50 bp(observed insert size of 275 ± 50 bp). After adapter and
quality trimming using Scythe and Sickle [72], Fosmidreads were aligned using BWA (ver. 0.5.9rc1-2; [73]) tothe cloning vector for removal of vector-contaminatedread pairs. The Velvet assembler (ver. 1.1.06; [7]) was thenused to assemble pools up to 16, at k-mer lengths rangingfrom ~55 to ~79. Coverage cutoff and expected coverageparameters were set manually after inspecting k-mercoverage distributions, as described in the Velvet manual.Assemblies from higher order pools (those containingreads from more than 16 clones) were highly fragmented,and thus not used in the current work.
Fosmid analysisRepeats in Fosmid sequences were identified using versionopen-3.3.0 (RMLib 20110920) of the online RepeatMaskersoftware [74]. Reads were aligned to Fosmids using BLASTNwith parameters tuned for shorter alignments with someerrors (WU-BLASTN [04-May-2006] W=11 M=1 N=−1Q=2 R=2 kap S=50 S2=50 gapS2=50 filter=dust B=1000000V=1000000). For snake, 8 lanes of short-read Illumina se-quence were used (flowcell ID: 110210_EAS56_0249_FC62W0CAAXX). For bird, we used the 5 lanes of short-insertIllumina data from Duke University (see Additional file 1for details). Finally, Fosmid sequences were aligned to as-sembly scaffold sequences using BLASTN with parameterstuned for long, nearly identical alignments (WU-BLASTN[04-May-2006] W=13 M=1 N=−3 Q=3 R=3 kap S=1000S2=1000).
VFR COMPASS analysisCOMPASS [41] is a Perl script that uses Lastz [58] to alignassembly scaffolds to a reference, after which the alignmentis parsed (using SAMTools [75]) to calculate alignment andcoverage island lengths (see Figure 7), which are used tocreate cumulative length plots (e.g., Figure 10), as well as tocalculate coverage, validity, multiplicity, and parsimonymetrics. COMPASS was run with a minimum contiglength of 200 bp for all submitted assemblies, and with thefollowing lastz command:
lastz reference[multiple] assembly[multiple] --ambiguous=n --ambiguous=iupac \ --notransition --step=20 --match=1,5 --chain --identity=98 --format=sam > out.sam
Note the options specifying a minimum 98% identitycutoff for alignments and treatment of ‘N’ characters asambiguous (receiving scores of zero, rather than a pen-alty for mismatch); these and other options may not beappropriate for all cases.
VFR distance analysisA Perl script (vfr_blast.pl [33]) was used to loop oversuccessive 1,000 nt regions from the VFR sequencesfor bird and snake. Pairs of 100 nt ‘tag’ sequences
Bradnam et al. GigaScience 2013, 2:10 Page 26 of 31http://www.gigasciencejournal.com/content/2/1/10
were then extracted from the ends of each of theseregions. All pairs of tag sequences were then searchedagainst all scaffolds for that particular species usingBLAST [76]. Matches were only retained if at least 95nt of each tag sequence aligned to the scaffolds. Theresulting BLAST output was processed to determinewhether both tag sequences from a pair, matcheduniquely to a single scaffold, and if so, at how farapart (expected distance between start coordinates ofeach tag in a pair is 900 nt).
Optical mapsScaffolds from each assembly were aligned to optical mapsthat had been generated for each species. Only scaffoldsequences from the assemblies that were at least 300 Kbpand possessed at least 9 restriction sites were used foralignment to the optical map supercontigs. The totallength of all uniquely aligned sequence was recorded andthe resulting alignments were classified into three levels:
Level 1: global alignment, do not allow gaps, strictthreshold for scoreLevel 2: global alignment, allow gaps, permissivethreshold for scoreLevel 3: local alignment, permissive threshold.
Coverage at level 1 reflects situations where the scaf-fold and optical map are concordant. The second levelof coverage (level 2, but not level 1) also reflects situa-tions where the scaffold and optical map are concord-ant, but where gap sizing or minor differences mightlead to lower scores or make it necessary to insert a gapin the alignment. Finally, level 3 coverage (which ex-cludes coverage at levels 1 and 2) represent situationswhere the global alignment fails, but where the localalignment succeeds. These situations are suggestive ofpotential chimeric assemblies or a bad join in either thesequence scaffold or optical map. Nonetheless, the re-gions of the optical maps and sequence that do align areconcordant.
REAPRAll reads were mapped using SMALT version 0.6.2[77]. All assemblies were indexed using a k-merlength of 13 (−k 13) and step length of 2 (−s 2).Reads were mapped repetitively using the option -r 1.Each read within a pair was mapped independentlyusing the -x flag, so that each read is mapped to theposition in the assembly with the best alignmentscore (regardless of where its mate was mapped). Thisis critical to the REAPR pipeline, since reads in a pairshould not be artificially forced to map as a properpair when a higher scoring alignment exists elsewherein the assembly. For short- and long-insert size
libraries, the options -y 0.9 and -y 0.5 were used torequire 90% and 50% of the reads to align perfectly.The only parameter that was varied when mappingwas the -i option to specify the maximum insert size.All BAM files had duplicates marked using theMarkDuplicates function of Picard [78] version 1.67,so that such reads could be ignored by REAPR.All reads from the two short insert Illumina GAII
runs were used for the snake assemblies, with -i1500. All reads from the 10 Kbp insert library weremapped, using -i 15000. For the fish assemblies, allreads from the fragment and 11 Kbp insert size li-braries were mapped using -i 600 and -i 15000 re-spectively. All reads from the bird BGI short insertIllumina libraries were mapped using -i 1500. Finally,the 20 Kbp insert size Illumina reads were mappedto the bird assemblies with -i 50000.REAPR version 1.0.12 was used to analyze the as-
semblies. Perfect and uniquely mapping read coveragewas generated by REAPR’s perfectfrombam function,for input into the REAPR analysis pipeline. This fil-ters the BAM file by only including reads mapped ina proper pair, within the specified insert size range,with at least the given minimum Smith-Watermanalignment score and mapping quality score. Filteringby alignment score ensures that only reads with per-fect alignments to the genome were included. Theminimum alignment score was chosen to be the readlength, since SMALT scores 1 for a match. SMALTassigns a mapping quality score of 3 or below toreads that map repetitively, therefore a minimumscore of 4 was used to filter out repetitive reads. Theparameters used when running the functionperfectfrombam for snake, fish and bird were 200 5003 4 121, 50 250 3 4 101 and 100 900 3 4 150 re-spectively. Finally, the REAPR pipeline was run oneach assembly using the default settings. Due to alack of coverage of large insert size proper read pairs,it was not possible to run REAPR on the MLK andABL assemblies in bird and the CTD, CTD*, andCTD** assemblies in fish.To generate the final summary score for each
assembly, within each species the count of error freebases, N50 and broken N50 were normalized asfollows. For each of the statistics, the assembly withlargest value was given 1 and the remaining valueswere reported as a fraction of that largest value. Forexample, if the highest number of error free basesfor a particular species was 1,000,000, then all valuesof error-free bases for that species were be dividedby 1,000,000 (so that the best assembly would get ascore of 1 for this metric). The same method wasapplied to the N50 before and after breaking beforeapplying the following formula to calculate a
Bradnam et al. GigaScience 2013, 2:10 Page 27 of 31http://www.gigasciencejournal.com/content/2/1/10
summary score for each assembly:
REAPR Summary Score¼ Number of error free bases
� broken N50ð Þ2= original N50ð Þ
Availability of supporting dataAdditional filesAdditional file 1File format: Microsoft Word (.docx)Title: Supplementary Data DescriptionDescription: Full details of the Illumina, Roche 454,
and Pacific Biosciences sequencing data that were madeavailable to participating teams.
Additional file 2File format: Microsoft Word (.docx)Title: Supplementary ResultsDescription: Additional figures and tables to accom-
pany the main text.
Additional file 3File format: Microsoft Word (.docx)Title: Assembly InstructionsDescription: Details provided by participating teams
on how to use software to recreate their assemblies. Allteams were asked to provide this information.
Additional file 4File format: Microsoft Excel (.xlsx) spreadsheetTitle: Master spreadsheet containing all resultsDescription: Details of 102 different metrics for every
assembly. First sheet contains a detailed READMEexplaining all columns. Second sheet contains the data.Third sheet shows z-score values for 10 key metrics forall assemblies. Fourth sheet shows average rankings forall 10 key metrics.
Additional file 5File format: Microsoft Excel (.xlsx) spreadsheetTitle: Details of all SRA/ENA/DDBJ accessions for
input read dataDescription: This spreadsheet contains identifiers for all
Project, Study, Sample, Experiment, and Run accessionsfor bird, fish, and snake input read data.
Additional file 6File format: comma-separated values (.csv)Title: All resultsDescription: This file contains the same information as
in sheet 2 of the master spreadsheet (Additional file 4), butin a format more suitable for parsing by computer scripts.
Additional file 7File format: PDFTitle: Bird scaffolds mapped to bird FosmidsDescription: Results of using BLAST to align 46 as-
sembled Fosmid sequences to bird scaffold sequences.Each figure represents an assembled Fosmid sequencewith tracks showing read coverage, presence of repeats,and alignments to each assembly.
Additional file 8File format: PDFTitle: Snake scaffolds mapped to snake FosmidsDescription: Results of using BLAST to align 24 assem-
bled Fosmid sequences to snake scaffold sequences. Eachfigure represents an assembled Fosmid sequence withtracks showing read coverage, presence of repeats, andalignments to each assembly.
Additional file 9File format: tarred, gzipped archiveTitle: Bird and snake Validated Fosmid Region (VFR)
dataDescription: The validated regions of the bird and
snake Fosmids are available as two FASTA-formattedfiles. This dataset also includes two FASTA files thatrepresent the 100 nt 'tag' sequences that were extractedfrom the VFRs.
Additional files
Additional file 1: Supplementary Data Description. Full details of theIllumina, Roche 454, and Pacific Biosciences sequencing data that weremade available to participating teams.
Additional file 2: Supplementary Results. Additional figures andtables to accompany the main text.
Additional file 3: Assembly Instructions. Details provided byparticipating teams on how to use software to recreate their assemblies.All teams were asked to provide this information.
Additional file 4: Master spreadsheet containing all results. Detailsof 102 different metrics for every assembly. First sheet contains adetailed README explaining all columns. Second sheet contains thedata. Third sheet shows z-score values for 10 key metrics for allassemblies. Fourth sheet shows average rankings for all 10 keymetrics.
Additional file 5: Details of all SRA/ENA/DDBJ accessions for inputread data. This spreadsheet contains identifiers for all Project, Study,Sample, Experiment, and Run accessions for bird, fish, and snake inputread data.
Additional file 6: All results. This file contains the same information asin sheet 2 of the master spreadsheet (Additional file 4), but in a formatmore suitable for parsing by computer scripts.
Additional file 7: Bird scaffolds mapped to bird Fosmids. Results ofusing BLAST to align 46 assembled Fosmid sequences to bird scaffoldsequences. Each figure represents an assembled Fosmid sequence withtracks showing read coverage, presence of repeats, and alignments toeach assembly.
Bradnam et al. GigaScience 2013, 2:10 Page 28 of 31http://www.gigasciencejournal.com/content/2/1/10
Additional file 8: Snake scaffolds mapped to snake Fosmids. Resultsof using BLAST to align 24 assembled Fosmid sequences to snakescaffold sequences. Each figure represents an assembled Fosmidsequence with tracks showing read coverage, presence of repeats, andalignments to each assembly.
Additional file 9: Bird and snake Validated Fosmid Region (VFR)data. The validated regions of the bird and snake Fosmids areavailable as two FASTA-formatted files. This dataset also includes twoFASTA files that represent the 100 nt 'tag' sequences that wereextracted from the VFRs.
AbbreviationsBp: Base pair; CEG: Core eukaryotic genes; CLP: Cumulative length plot;dnGASP: De novo genome assembly project; FRC: Feature-response curves;GAGE: Genome assembly gold-standard evaluations; GAM: Genomicassemblies merger; NGS: Next generation sequencing; Nt: Nucleotide;VFR: Validated fosmid region.
Competing interestsThe authors declare that they have no competing interests.
Authors’ contributionsSurnames are provided because initials alone were not specific enoughgiven the large number of co-authors.
Participating teamsThe following teams were responsible for submitting one or moreassemblies to the Assemblathon 2 contest. Teams were responsible fordownloading input read data, and using various software packages togenerate a genome assembly from input data (optionally involving variousdata pre-processing and quality control steps).CSHL team: P Baranay, S Emrich, MC Schatz; MLK team: MD MacManes; ABLteam: H Chitsaz; Symbiose team: R Chikhi, D Lavenier, G Chapuis, D Naquin,N Maillet; Ray team: S Boisvert, J Corbeil, F Laviolette, E Godzaridis; IOBUGAteam: TI Shaw, W Chou; GAM team: S Scalabrin, R Vicedomini, F Vezzi, C DelFabbro; Meraculous team: JA Chapman, IY Ho, DS Rokhsar; Allpaths team: SGnerre, G Hall, DB Jaffe, I MacCallum, D Przybylski, FJ Ribeiro, T Sharpe, S Yin;CBCB team: S Koren, AM Phillippy; PRICE team: JG Ruby; SOAPdenovoteam: R Luo, B Liu, Z Li, Y Shi, J Yuan, H Zhang, S Yiu, T Lam, Y Li, J Wang;Curtain team: M Haimel, PJ Kersey; CoBiG2 team; Bruno Miguel Vieira,Francisco Pina-Martins, Octávio S. Paulo; BCM-HGSC team: Y Liu, X Song, XQin, H Jiang, J Qu, S Richards, KC Worley, RA Gibbs; ABySS team: I Birol, TRDocking, SD Jackman; Phusion team: Z Ning; CRACS team: NA Fonseca;SGA team: JT Simpson, R Durbin; Computer Technologies Department(CTD) team: A Alexandrov, P Fedotov, S Melnikov, S Kazakov, ASergushichev, F Tsarev: Newber-454 team: JR Knight.
Other contributionsS Zhou, S Goldstein, M Place, DC Schwartz, and M Bechner generated opticalmaps for each species, performed analysis of each assembly against theoptical maps, and contributed to the corresponding sections of themanuscript (including figures). J Shendure, J Kitzman, and J Hiatt providedFosmid sequence data for bird and snake. M Hunt and T Otto performed ananalysis of each assembly using the REAPR tool and contributed to thecorresponding sections of the manuscript (including figures). D Earl and BPaten provided analysis of correlation between all key metrics, contributedto the corresponding sections of the manuscript (including figures), andprovided additional valuable feedback on the manuscript. D Haussler helpedorganize the contest, liaised with various groups to facilitate participation,and assisted with the analysis of correlation between all key metrics. JHoward, G Ganapathy, and G Zhang provided bird (budgerigar) sequencedata. D Jaffe, K Worley, J Chapman, S Goldstein, M Schatz, D Rokhsar, SScalabrin, I MacCallum, M MacManes, and S Boisvert provided valuablefeedback on the manuscript. E Jarvis provided bird (budgerigar) sequencedata, negotiated with Illumina, BGI, Pacific Biosciences, and Roche 454 toprovide additional sequence data, helped organize the contest, liaised withvarious groups to facilitate participation, and provided valuable feedback onthe manuscript. I Korf helped organize the contest and liaised with variousgroups to facilitate participation, helped design and coordinate experiments,processed Fosmid sequences to generate Validated Fosmid Regions (VFRs),
assessed Fosmids for repeat content and coverage, and provided valuablefeedback on the manuscript. J Fass helped design and coordinateexperiments, assembled Fosmid sequences, performed COMPASS analysis ofall assemblies using VFR data, and assisted in writing of the manuscript. KBradnam helped organize the contest and liaised with various groups tofacilitate participation; coordinated submission of entries; made anonymousversions of assemblies available to all third-party groups performingevaluations; helped design and coordinate experiments; calculated andcollated all basic statistics for each assembly; ran CEGMA against allassemblies; collected datasets to calculate ‘average size of vertebrate gene’;looked for available transcript data; performed distance analysis on VFRsequences; integrated all analyses from other groups; herded goats;performed z-score analyses of assemblies; made heat map from finalrankings; drafted, wrote, and edited the manuscript. All authors read andapproved the final manuscript.
AcknowledgementsThe Assemblathon 2 organizers would like to thank all groups and peopleinvolved in generating the datasets used for this project. Specifically wethank:• BGI, Roche 454, Pacific Biosciences, and Erich Jarvis (NIH pioneer award andHHMI funds) for providing the budgerigar (Melopsittacus undulatus)sequence data.• NHGRI for providing funds to sequence Fosmids and produce optical maps.• The Broad Institute Genomics Platform and Genome Sequencing andAnalysis Program, Federica Di Palma, and Kerstin Lindblad-Toh for makingthe sequence data for the Lake Malawi cichlid (Metriaclima zebra) available;and Thomas Kocher at the University of Maryland for providing bloodsamples for the cichlid.• Illumina (and Ole Schulz-Trieglaff in particular) for providing the red-tailedboa constrictor (Boa constrictor constrictor) sequence data, Matthew M. Himsand Niall A. Gormley for preparing and QC-ing the Illumina mate-pairlibraries, and Freeland Dunker at the California Academy of Sciences fortaking the snake blood samples.We would also like to thank the assistance of Amazon Web Services (AWS)and Pittsburgh Supercomputing Center (PSC) for help with the initialdistribution of Assemblathon 2 datasets. We also thank the help and supportof the UC Davis Bioinformatics Core in providing resources to help finish theanalysis of the data.
Acknowledgements from optical mapping groupDavid Schwartz and the optical mapping team at University of Madison-Wisconsin would like to thank NHGRI for funding for this project.
Acknowledgements from Fosmid sequencing groupThis work was supported by National Institutes of Health / National HumanGenome Research Institute award R01 HG006283. We thank Alexandra P.Lewis and Ruolan Qiu for assistance with Fosmid library construction.
Acknowledgements from the REAPR analysis groupM. Hunt and T. Otto were supported by the European Union 7th frameworkEVIMalaR.
Acknowledgements from Allpaths teamThis work has been funded in part by the National Human GenomeResearch Institute, National Institutes of Health, Department of Health andHuman Services, under grants R01HG003474 and U54HG003067, and in partby the National Institute of Allergy and Infectious Diseases, National Institutesof Health, Department of Health and Human Services, under Contract No.HHSN272200900018C.
Acknowledgements from BCM-HGSC teamWe gratefully acknowledge funding support from a grant U54 HG003273 toRAG from the National Human Genome Research Institute, National Institutesof Health; computational resources provided by National Center ForResearch Resources, National Institute of Health through a grant to JeffreyGordon Reid (1 S10 RR026605) for a massive RAM computer cluster atBCM-HGSC; access to the IBM POWER 7 bioscience computing coreBlueBioU machine at Rice University; and an IBM Faculty Award to KCW.We thank Adam English for mapping the PacBio budgerigar data to thepreliminary budgerigar assembly.

Bradnam et al. GigaScience 2013, 2:10 Page 29 of 31http://www.gigasciencejournal.com/content/2/1/10
Acknowledgements from CRACS teamThe work has been partially supported by European Community'sFP7/2011-2015, EurocanPlatform under grant agreement no 260791,PTDC/EIA-EIA/121686/2010, and funds granted to CRACS & INESC TecLA through the Programa de Financiamento Plurianual, Fundacao paraa Ciencia e Tecnologia and Programa POSI.
Acknowledgements from CSHL teamNational Institutes of Health award (R01-HG006677-12), and National ScienceFoundation award (IIS-0844494) to MCS.
Acknowledgement for MLK teamMatthew MacManes was supported by a National Institutes of Health NRSAPost-Doctoral fellowship (1F32DK093227). Computational resources weresupported by the Extreme Science and Engineering Discovery Environment(XSEDE) PSC-Blacklight, which is supported by National Science Foundationgrant number OCI-1053575
Acknowledgements from Meraculous teamWork conducted at the US Department of Energy Joint Genome Institute issupported by the Office of Science of the US Department of Energy undercontract numbers DE-AC02-05CH11231.
Acknowledgements from Ray teamComputations were performed on the Colosse supercomputer at UniversitéLaval and the Guillimin supercomputer at McGill University (nne-790-ab),under the auspices of Calcul Québec and Compute Canada. The operationsof Guillimin and Colosse are funded by the Canada Foundation forInnovation (CFI), the National Science and Engineering Research Council(NSERC), NanoQuébec, and the Fonds Québécois de Recherche sur la Natureet les Technologies (FQRNT). JC is the Canada Research Chair in MedicalGenomics. SB is recipient of a Frederick Banting and Charles Best CanadaGraduate Scholarship Doctoral Award (200910GSD-226209-172830) from theCanadian Institutes for Health Research (CIHR).FL was supported in part by the Natural Sciences and Engineering ResearchCouncil of Canada (grant 262067).
Acknowledgements from SGA teamThis work was supported by Wellcome Trust grant WT098051.
Acknowledgements from SOAPdenovo teamWe would like to thank the users of SOAPdenovo who tested the program,reported bugs, and proposed improvements to make it more powerful anduser-friendly. Thanks to TianHe research and development team of NationalUniversity of Defense Technology to have tested, optimized and deployedthe software on TianHe series supercomputers. The project was supportedby the State Key Development Program for Basic Research of China-973Program (2011CB809203); National High Technology Research andDevelopment Program of China-863 program (2012AA02A201); the NationalNatural Science Foundation of China (90612019); the Shenzhen KeyLaboratory of Trans-omics Biotechnologies (CXB201108250096A); and theShenzhen Municipal Government of China (JC201005260191A andCXB201108250096A). Tak-Wah Lam was partially supported by RGC GeneralResearch Fund 10612042.
Author details1Genome Center, UC, Davis, CA 95616, USA. 2Computational Biology andBioinformatics, Yale University, New Haven, CT 06511, USA. 3Department ofComputer Science and Engineering, University of Notre Dame, South Bend,IN 46556, USA. 4Simons Center for Quantitative Biology, Cold Spring HarborLaboratory, Cold Spring Harbor, NY 11724, USA. 5Berkeley California Institutefor Quantitative Biosciences, University of California, Berkeley, CA 94720, USA.6Department of Computer Science, Wayne State University, Detroit, MI 48202,USA. 7Computer Science department, ENS Cachan/IRISA, 35042 Rennes,France. 8INRIA, Rennes Bretagne Atlantique, 35042 Rennes, France. 9CNRS/Symbiose, IRISA, 35042 Rennes, France. 10Infectious Diseases Research Center,Université Laval, Québec, QC G1V 4G2, Canada. 11Faculty of Medicine,Université Laval, Québec, QC G1V 4G2, Canada. 12Department of ComputerScience and Software Engineering, Faculty of Science and Engineering,Université Laval, Québec, QC G1V 4G2, Canada. 13Department of MolecularMedicine, Faculty of Medicine, Université Laval, Québec, QC G1V 4G2,
Canada. 14Institute of Bioinformatics, University of Georgia, Athens, GA 30602,USA. 15Department of Epidemiology and Biostatistics, College of PublicHealth, University of Georgia, Athens, GA 30602, USA. 16Institute of AgingResearch, Hebrew SeniorLife, Boston, MA 02131, USA. 17IGA, Institute ofApplied Genomics, 33100 Udine, Italy. 18Department of Mathematics andComputer Science, University of Udine, 33100 Udine, Italy. 19Science for LifeLaboratory, KTH Royal Institute of Technology, 17121 Solna, Sweden. 20DOEJoint Genome Institute, Walnut Creek, CA 94598, USA. 21Department ofMolecular and Cell Biology, UC Berkeley, Berkeley, CA 94720, USA. 22BroadInstitute, Cambridge, MA 02142, USA. 23New York Genome Center, New York,NY 10022, USA. 24National Biodefense Analysis and Countermeasures Center,Frederick, MD 21702, USA. 25Center for Bioinformatics and ComputationalBiology, University of Maryland, College Park, MD 20742, USA. 26Departmentof Biochemistry and Biophysics, University of California, San Francisco, CA94143, USA. 27Howard Hughes Medical Institute, Bethesda, MD 20814, USA.28BGI-Shenzhen, Shenzhen, Guangdong 518083, China. 29HKU-BGIBioinformatics Algorithms and Core Technology Research Laboratory, TheUniversity of Hong Kong, Pok Fu Lam Rd, Hong Kong, Hong Kong.30EMBL-European Bioinformatics Institute, Wellcome Trust Genome Campus,Hinxton, Cambridge CB10 1SD, UK. 31Computational Biology & PopulationGenomics Group, Centre for Environmental Biology, Department of AnimalBiology, Faculty of Sciences of the University of Lisbon, Campo Grande,P-1749-016 Lisbon, Portugal. 32Human Genome Sequencing Center andDepartment of Molecular and Human Genetics, Baylor College of Medicine,Houston, TX 77030, USA. 33Genome Sciences Centre, British Columbia CancerAgency, Vancouver, British Columbia V5Z 4E6, Canada. 34The Wellcome TrustSanger Institute, Wellcome Trust Genome Campus, Hinxton, Cambridge CB101SA, UK. 35CRACS - INESC TEC, 4200-465 Porto, Portugal. 36National ResearchUniversity of Information Technology, Mechanics and Optics (UniversityITMO), St. Petersburg 197101, Russia. 37454 Life Sciences, 15 CommercialStreet, Branford, CT 06405, USA. 38Duke University Medical Center, Durham,NC 27710 USA. 39Laboratory for Molecular and Computational Genomics,Departments of Chemistry and Genetics, UW-Biotechnology Center, 425Henry Mall, Madison, WI 53706, USA. 40Howard Hughes Medical Institute,Center for Biomolecular Science & Engineering, University of California,Santa Cruz, CA 95064 USA. 41Department of Genome Sciences, School of Medicine,University of Washington, Seattle, WA 98195, USA.
Received: 23 January 2013 Accepted: 15 July 2013Published: 22 July 2013
References1. Bentley DR: Whole-genome re-sequencing. Curr Opin Genet Dev 2006,
16:545–552.2. Haussler D, O'Brien SJ, Ryder OA, Barker FK, Clamp M, Crawford AJ, Hanner
R, Hanotte O, Johnson WE, McGuire JA: Genome 10K: a proposal to obtainwhole-genome sequence for 10 000 vertebrate species. J Hered 2009,100:659–674.
3. i5K - ArthropodBase wiki. http://www.arthropodgenomes.org/wiki/i5K4. Kumar S, Schiffer PH, Blaxter M: 959 Nematode Genomes: a semantic wiki for
coordinating sequencing projects. Nucleic Acids Res 2012, 40:D1295–D1300.5. Pevzner PA, Tang H, Waterman MS: An Eulerian path approach to DNA
fragment assembly. Proc Natl Acad Sci 2001, 98:9748–9753.6. Butler J, MacCallum I, Kleber M, Shlyakhter IA, Belmonte MK, Lander ES,
Nusbaum C, Jaffe DB: ALLPATHS: De novo assembly of whole-genomeshotgun microreads. Genome Res 2008, 18:810–820.
7. Zerbino DR, Birney E: Velvet: algorithms for de novo short read assemblyusing de Bruijn graphs. Genome Res 2008, 18:821–829.
8. Simpson JT, Wong K, Jackman SD, Schein JE, Jones SJM, Birol I: ABySS: aparallel assembler for short read sequence data. Genome Res 2009,19:1117–1123.
9. Luo R, Liu B, Xie Y, Li Z, Huang W, Yuan J, He G, Chen Y, Pan Q, Liu Y:SOAPdenovo2: an empirically improved memory-efficient short-read denovo assembler. GigaScience 2012, 1:18.
10. Li R, Fan W, Tian G, Zhu H, He L, Cai J, Huang Q, Cai Q, Li B, Bai Y, Zhang Z,Zhang Y, Wang W, Li J, Wei F, Li H, Jian M, Li J, Zhang Z, Nielsen R, Li D, GuW, Yang Z, Xuan Z, Ryder OA, Leung FC-C, Zhou Y, Cao J, Sun X, Fu Y, et al:The sequence and de novo assembly of the giant panda genome.Nature 2010, 463:311–317.
11. Simpson JT, Durbin R: Efficient de novo assembly of large genomes usingcompressed data structures. Genome Res 2011, 22(3):549–556.
Bradnam et al. GigaScience 2013, 2:10 Page 30 of 31http://www.gigasciencejournal.com/content/2/1/10
12. Li H: Exploring single-sample SNP and INDEL calling with whole-genomede novo assembly. Bioinformatics 2012, 28:1838–1844.
13. Miller JR, Koren S, Sutton G: Assembly algorithms for next-generationsequencing data. Genomics 2010, 95:315.
14. Henson J, Tischler G, Ning Z: Next-generation sequencing and largegenome assemblies. Pharmacogenomics 2012, 13:901–915.
15. Narzisi GAM, Bud M: Comparing de novo genome assembly: the long andshort of it. PLoS One 2011, 6:e19175.
16. Paszkiewicz K, Studholme DJ: De novo assembly of short sequence reads.Brief Bioinform 2010, 11:457–472.
17. Alkan C, Sajjadian S, Eichler EE: Limitations of next-generation genomesequence assembly. Nat Methods 2011, 8:61–65.
18. Baker M: De novo genome assembly: what every biologist should know.Nat Methods 2012, 9:333–337.
19. Birney E: Assemblies: the good, the bad, the ugly. Nat Methods 2011, 8:59–60.20. Claros MG, Bautista R, Guerrero-Fernández D, Benzerki H, Seoane P,
Fernández-Pozo N: Why assembling plant genome sequences is sochallenging. Biology 2012, 1:439–459.
21. Schatz MC, Witkowski J, McCombie WR: Current challenges in de novoplant genome sequencing and assembly. Genome Biol 2012, 13:1–7.
22. Schlebusch S, Illing N: Next generation shotgun sequencing and thechallenges of de novo genome assembly. South African Journal of Science2012, 108:8.
23. Bresler M, Sheehan S, Chan AH, Song YS: Telescoper: de novo assembly ofhighly repetitive regions. Bioinformatics 2012, 28:i311–i317.
24. Li YI: Copley. Scaffolding low quality genomes using orthologous proteinsequences. Bioinformatics: RR; 2012.
25. Kelley D, Salzberg S: Detection and correction of false segmentalduplications caused by genome mis-assembly. Genome Biol 2010, 11:R28.
26. dnGASP. [http://cnag.bsc.es/]27. Salzberg SL, Phillippy AM, Zimin A, Puiu D, Magoc T, Koren S, Treangen TJ,
Schatz MC, Delcher AL, Roberts M, Marçais G, Pop M, Yorke JA: GAGE: acritical evaluation of genome assemblies and assembly algorithms.Genome Res 2012, 22:557–67.
28. Earl D, Bradnam K, St John J, Darling A, Lin D, Fass J, Yu HO, Buffalo V,Zerbino DR, Diekhans M, Nguyen N, Ariyaratne PN, Sung WK, Ning Z,Haimel M, Simpson JT, Fonseca NA, Birol İ, Docking TR, Ho IY, RokhsarDS, Chikhi R, Lavenier D, Chapuis G, Naquin D, Maillet N, Schatz MC,Kelley DR, Phillippy AM, Koren S, et al: Assemblathon 1: a competitiveassessment of de novo short read assembly methods. Genome Res2011, 21:2224–41.
29. The Assemblathon. [http://assemblathon.org/]30. Bradnam KR, Fass JN, Alexandrov A, Baranay P, Bechner M, Birol I, Boisvert S,
Chapman JA, Chapuis G, Chikhi R, Chitsaz H, Corbeil J, Del Fabbro C,Docking TR, Durbin R, Earl D, Emrich S, Fedotov P, Fonseca NA, GanapathyG, Gibbs RA, Gnerre S, Godzaridis E, Goldstein S, Haimel M, Hall G, HausslerD, Hiatt JB, Ho IY, Howard J, et al: Assemblathon 2 assemblies. GigaScienceDatabase 2013: [http://dx.doi.org/10.5524/100060]
31. Howard JT, Koren S, Phillippy A, Zhou S, Schwartz D, Schatz M, Aboukhalil R,Ward JM, Li J, Li B, Fedrigo O, Bukovnik L, Wang T, Wray G, Rasolonjatovo I,Winer R, Knight JR, Warren W, Zhang G, Jarvis ED: De novo high-coveragesequencing and annotated assemblies of the budgerigar genome.GigaScience Database 2013: [http://dx.doi.org/10.5524/100059]
32. Fass JN, Korf IK, Bradnam KR, Jarvis ED, Shendure J, Hiatt J, Kitzman JO:Assembled Fosmid sequences used for assessment of Assemblathon 2entries. GigaScience Database 2013: [http://dx.doi.org/10.5524/100062]
33. Assemblathon 2 - GitHub analysis code. [https://github.com/ucdavis-bioinformatics/assemblathon2-analysis]
34. Reinhardt JA, Baltrus DA, Nishimura MT, Jeck WR, Jones CD, Dangl JL: De novoassembly using low-coverage short read sequence data from the ricepathogen Pseudomonas syringae pv. oryzae. Genome Res 2009, 19:294–305.
35. Brent MR, Guigó R: Recent advances in gene structure prediction.Curr Opin Struct Biol 2004, 14:264–272.
36. Sleator RD: An overview of the current status of eukaryote geneprediction strategies. Gene 2010, 461:1–4.
37. Yandell M, Ence D: A beginner's guide to eukaryotic genome annotation.Nat Rev Genet 2012, 13:329–342.
38. Parra G, Bradnam K, Korf I: CEGMA: a pipeline to accurately annotate coregenes in eukaryotic genomes. Bioinformatics 2007, 23:1061–1067.
39. Bradnam KR, Fass JN, Korf IF: CEGMA gene predictions for Assemblathon2 entries. GigaScience Database 2013: [http://dx.doi.org/10.5524/100061]
40. Parra G, Bradnam K, Ning Z, Keane T, Korf I: Assessing the gene space indraft genomes. Nucleic Acids Res 2009, 37:289–297.
41. COMPASS - scripts to COMpare a DNA sequence ASSembly to a trustedreference sequence. [https://github.com/jfass/compass]
42. Dimalanta ET, Lim A, Runnheim R, Lamers C, Churas C, Forrest DK, dePablo JJ, Graham MD, Coppersmith SN, Goldstein S, Schwartz DC: Amicrofluidic system for large DNA molecule arrays. Anal Chem 2004,76:5293–5301.
43. Valouev A, Li L, Liu YC, Schwartz DC, Yang Y, Zhang Y, Waterman MS:Alignment of optical maps. J Comput Biol 2006, 13:442–462.
44. Church DM, Goodstadt L, Hillier LDW, Zody MC, Goldstein S, She X, Bult CJ,Agarwala R, Cherry JL, DiCuccio M: Lineage-specific biology revealed by afinished genome assembly of the mouse. PLoS Biol 2009, 7:e1000112.
45. Schnable PS, Ware D, Fulton RS, Stein JC, Wei F, Pasternak S, Liang C, ZhangJ, Fulton L, Graves TA: The B73 maize genome: complexity, diversity, anddynamics. Science 2009, 326:1112–1115.
46. Young ND, Debellé F, Oldroyd GED, Geurts R, Cannon SB, Udvardi MK,Benedito VA, Mayer KFX, Gouzy J, Schoof H: The Medicago genome providesinsight into the evolution of rhizobial symbioses. Nature 2011, 480:520–524.
47. Zhou S, Bechner MC, Place M, Churas CP, Pape L, Leong SA, Runnheim R,Forrest DK, Goldstein S, Livny M: Validation of rice genome sequence byoptical mapping. BMC Genomics 2007, 8:278.
48. Zhou S, Wei F, Nguyen J, Bechner M, Potamousis K, Goldstein S, Pape L,Mehan MR, Churas C, Pasternak S: A single molecule scaffold for themaize genome. PLoS Genet 2009, 5:e1000711.
49. Teague B, Waterman MS, Goldstein S, Potamousis K, Zhou S, Reslewic S, SarkarD, Valouev A, Churas C, Kidd JM: High-resolution human genome structureby single-molecule analysis. Proc Natl Acad Sci 2010, 107:10848–10853.
50. Lin H, Pop M: On using optical maps for genome assembly. Genome Biol2011, 12:1–27.
51. Hunt M, Kikuchi T, Sanders M, Newbold C, Berriman M, Otto TD: REAPR: auniversal tool for genome assembly evaluation. Genome Biol 2013, 14:R47.
52. Rico C, Turner GF: Extreme microallopatric divergence in a cichlid speciesfrom Lake Malawi. Mol Ecol 2002, 11:1585–1590.
53. Smith PF, Konings AD, Kornfield IRV: Hybrid origin of a cichlid populationin Lake Malawi: implications for genetic variation and species diversity.Mol Ecol 2003, 12:2497–2504.
54. King RB: Population and conservation genetics. In Snakes: ecology andconservation. 1st edition. Edited by Mullin SJ, Seigel RA. Ithaca: CornellUniversity Press; 2009.
55. Metassembler. [http://sourceforge.net/apps/mediawiki/metassembler/index.php?title=Metassembler]
56. Kelley DR, Schatz MC, Salzberg SL: Quake: quality-aware detection andcorrection of sequencing errors. Genome Biol 2010, 11:R116.
57. Alternative SOAPdenovo snake assembly. [ftp://assemblathon2:[email protected]/from_BGISZ/20121220_Boa_constrictor]
58. Harris RS: Improved pairwise alignment of genomic DNA. PhD thesis.Pennsylvania State University; 2007.
59. Koren S, Schatz MC, Walenz BP, Martin J, Howard JT, Ganapathy G, Wang Z,Rasko DA, McCombie WR, Jarvis ED, Phillippy AM: Hybrid error correctionand de novo assembly of single-molecule sequencing reads.Nat Biotechnol 2012, 30:693–700.
60. Boisvert S, Laviolette F, Corbeil J: Ray: simultaneous assembly of readsfrom a mix of high-throughput sequencing technologies. J Comput Biol2010, 17:1519–1533.
61. PRICE Genome Assembler. [http://derisilab.ucsf.edu/software/price/index.html]62. Lander ES, Linton LM, Birren B, Nusbaum C, Zody MC, Baldwin J, Devon K,
Dewar K, Doyle M, FitzHugh W, Funke R, Gage D, Harris K, Heaford A,Howland J, Kann L, Lehoczky J, LeVine R, McEwan P, McKernan K, Meldrim J,Mesirov JP, Miranda C, Morris W, Naylor J, Raymond C, Rosetti M, Santos R,Sheridan A, Sougnez C, et al: Initial sequencing and analysis of the humangenome. Nature 2001, 409:860–921.
63. Mäkinen V, Salmela L, Ylinen J: Normalized N50 assembly metric usinggap-restricted co-linear chaining. BMC Bioinformatics 2012, 13:255.
64. Vezzi F, Narzisi G, Mishra B: Feature-by-feature–evaluating de novosequence assembly. PLoS One 2012, 7:e31002.
65. Vezzi F, Narzisi G, Mishra B: Reevaluating assembly evaluations with featureresponse curves: GAGE and assemblathons. PLoS One 2012, 7:e52210.
66. Gibbs RA, Rogers J, Katze MG, Bumgarner R, Weinstock GM, Mardis ER,Remington KA, Strausberg RL, Venter JC, Wilson RK, Batzer MA, BustamanteCD, Eichler EE, Hahn MW, Hardison RC, Makova KD, Miller W, Milosavljevic A,
Bradnam et al. GigaScience 2013, 2:10 Page 31 of 31http://www.gigasciencejournal.com/content/2/1/10
Palermo RE, Siepel A, Sikela JM, Attaway T, Bell S, Bernard KE, Buhay CJ,Chandrabose MN, Dao M, Davis C, Delehaunty KD, Ding Y, et al:Evolutionary and Biomedical Insights from the Rhesus MacaqueGenome. Science 2007, 316:222–234.
67. Casagrande A, Del Fabbro C, Scalabrin S, Policriti A: GAM: genomicassemblies merger: a graph based method to integrate differentassemblies. In Bioinformatics and Biomedicine, 2009. BIBM'09. IEEEInternational Conference on; 2009:321–326. [http://ieeexplore.ieee.org/xpl/mostRecentIssue.jsp?punumber=5341720]
68. CLC bio. [http://www.clcbio.com/]69. FASTG: An expressive representation for genome assemblies. [http://fastg.
sourceforge.net]70. Flicek P, Amode MR, Barrell D, Beal K, Brent S, Carvalho-Silva D, Clapham P,
Coates G, Fairley S, Fitzgerald S: Ensembl 2012. Nucleic Acids Res 2012,40:D84–D90.
71. Kitzman JO, MacKenzie AP, Adey A, Hiatt JB, Patwardhan RP, Sudmant PH,Ng SB, Alkan C, Qiu R, Eichler EE, Shendure J: Haplotype-resolved genomesequencing of a Gujarati Indian individual. Nat Biotechnol 2010, 29:59.
72. Sickle and Scythe. [https://github.com/ucdavis-bioinformatics]73. Li H, Durbin R: Fast and accurate short read alignment with
Burrows–Wheeler transform. Bioinformatics 2009, 25:1754–1760.74. RepeatMasker web server. [http://repeatmasker.org/cgi-bin/WEBRepeatMasker]75. Li H, Handsaker B, Wysoker A, Fennell T, Ruan J, Homer N, Marth G, Abecasis
G, Durbin R: The sequence alignment/map format and SAMtools.Bioinformatics 2009, 25:2078–2079.
76. Altschul SF, Gish W, Miller W, Myers EW, Lipman DJ: Basic local alignmentsearch tool. J Mol Biol 1990, 215:403–410.
77. SMALT - efficiently aligns DNA sequencing reads with a reference genome.[http://www.sanger.ac.uk/resources/software/smalt/]
78. Picard. [http://picard.sourceforge.net/]
doi:10.1186/2047-217X-2-10Cite this article as: Bradnam et al.: Assemblathon 2: evaluating de novomethods of genome assembly in three vertebrate species. GigaScience2013 2:10.
Submit your next manuscript to BioMed Centraland take full advantage of:
• Convenient online submission
• Thorough peer review
• No space constraints or color figure charges
• Immediate publication on acceptance
• Inclusion in PubMed, CAS, Scopus and Google Scholar
• Research which is freely available for redistribution
Submit your manuscript at www.biomedcentral.com/submit