Embed Size (px)
DESCRIPTION
Assesment of saw dust in waste water treatment
Citation preview
i
CERTIFICATION
The undersigned certify that they have read and hereby recommend for acceptance by the Ardhi
University as a dissertation entitled “Optimization of Sawdust for the Treatment of Dye-rich
Wastewater in upflow bio-filter units ’’ in partial fulfillment of the requirements for the award
of the degree of BSc. in Environmental Engineering of Ardhi University.
...............................................
Prof. Msafiri Jackson
Ph.D. (I.I.T-Chicago)
M.Sc. Engineering (Leeds)
B.Sc. Engineering (Dar)
HEAD of Environmental Engineering Department
Date……………................
……………………………
Dr. Stephen E. Mbuligwe
PhD (Louisiana State University, USA)
M.Sc.Eng. (UDSM, TZ)
Adv.Dipl (ARI, TZ)
Date………………………
Supervisor
.............................................
Prof. Gabriel R. Kassenga
PhD (Louisiana State University, USA)
M.Sc. (Oldenburg (University, Germany)
Adv.Dipl (ARI, TZ)
Date……………………
Supervisor
ii
DECLARATION AND COPYRIGHT
I, Franella Halla, declare that, the contents of this dissertation are the results of my own original
work obtained through studies and experiments done using the best of my knowledge and
understanding. They have never been presented anywhere as a thesis for an Award of a Diploma,
Degree or any Academic/Professional Award at any Higher Learning Institution.
.....................
Franella Halla
BSc. Environmental Engineering Candidate
Environmental Engineering Department
School of Environmental Science and Technology
Ardhi University
COPYRIGHT
This dissertation is a copyright material protected under Berne Convention, the Copyright Act
1999 and other International and National enactments in that behalf, on intellectual property. It
may not be reproduced by any means in full or in part, except for extracts in fair dealing, for
research or private study, critical scholarly review or discourse with an acknowledgement,
without written permission of the Directorate of Undergraduate Studies, on behalf of both the
Author and the Ardhi University.
iii
DEDICATION
To my beloved late father (Francos F. Halla), who through his long lived wise words, guidance
and love made me reach where I am today. Thank you dad, we love you and for you we will
never give up. Rest in peace.
iv
AKNOWLEDGEMENT
I would like to give my sincere gratitude to all individuals behind the scene, who in one way or
another made it possible for me not only complete my dissertation but also who made my four
years of bachelor degree worth fighting for.
The honors go first to my supervisors Dr. Mbuligwe and Professor Kassenga for their constant
supervision and encouragement throughout the last semester of my study but yet the challenging
semester of all.
Secondly, to Mr. Ndimbo and Mr. Ramadhani who made my laboratory work quite smooth.
Thirdly, to all other SEST and non- SEST staff members from ARU who in one way or another
have made my study at ARU quite memorable.
Fourthly, to my classmates and other ARU students who made my four years of study a quite
enjoyable roller coaster.
At last, my most treasurable gratitude goes to my beloved mother, Nelly Halla for her constant
prayers and support in every possible ways, and to my younger brother, Nefra Halla for his
appreciation and trust in me which made each day offer another chance for me to go a step
ahead, thank you all.
v
ABSTRACT
Continuous upflow bio-filter units packed with different media were investigated on their
capability to treat dye-rich wastewater. The bio-filter units used were columns (60 cm long with
internal diameter of 15 cm) and perforated at multiple ports along the height for sampling. The
media under test included hardwood and softwood sawdust from common timber species
bloodwood (Pterocarpus angolensis) and cypress (Cupressus lusitanica) respectively,
categorized according to size yielding four different media under test which were softwood fine
(SWF), softwood coarse (SWC), hardwood fine (HWF) and hardwood coarse (HWC). Sand was
used as a control medium. The media were used directly without further grinding and grading.
These media were characterized based on their basis physical and chemical properties such as
moisture content, porosity, organic content, pH, carbon content, bulk densities and geotechnical
properties.
The study aimed at optimizing the sawdust media for the treatment of dye-rich wastewater,
whereas parameters monitored included colour and COD at interval durations. Data for COD and
colour concentrations were analyzed to obtain information on variation of colour and COD
removal at the effluent with height, whereas removal increased with height and variation of
treatment performance with maturity of the bio-filter unit showed to increase with maturity
suggesting bio-degradation was a controlling removal mechanism leave along sorption.
Comparing the data for colour and COD, dye molecules were completely mineralized and not
simply decolourization of the dye molecules due to an increase in COD removal with duration.
First order kinetic reaction model was used to best fit these results with R2
>0.7 for COD and
R2>0.5 for colour.
From the analysis based on the results of the last day of measurement, bio-filter packed with
SWF showed to perform better than other media (91%) and other media showed relative
efficiencies such as SWC (89%) and sand (88%) followed by HWC (79%) and HWF (80%). For
COD removal sand out run the other (75%) followed by SWF (69%) and SWC (68%) followed
by HWC (51%) and HWF (46%).These results are opt to change with maturity of the bio-filter if
the study was carried on beyond the 19th
day.

vi
TABLE OF CONTENTS
CERTIFICATION ......................................................................................................................................... i
DECLARATION AND COPYRIGHT ......................................................................................................... ii
DEDICATION ............................................................................................................................................. iii
AKNOWLEDGEMENT .............................................................................................................................. iv
ABSTRACT .................................................................................................................................................. v
LIST OF FIGURES ................................................................................................................................... viii
LIST OF TABLES ....................................................................................................................................... ix
ACRONYMS ................................................................................................................................................ x
CHAPTER ONE ........................................................................................................................................... 1
1.0 INTRODUCTION .............................................................................................................................. 1
1.1 GENERAL INTRODUCTION AND BACKGROUND ................................................................ 1
1.2 PROBLEM STATEMENT ............................................................................................................. 2
1.3 MOTIVATION ............................................................................................................................... 3
1.4 OBJECTIVES ................................................................................................................................. 4
CHAPTER TWO .......................................................................................................................................... 5
2.0 LITERATURE REVIEW ................................................................................................................... 5
2.1 Dye .................................................................................................................................................. 5
2.2 Dye molecule .................................................................................................................................. 6
2.3 The general theory of dyeing .......................................................................................................... 7
2.4 Classification systems for dyes ....................................................................................................... 8
2.5 Disadvantages of dyes ................................................................................................................... 11
2.6 Toxicity Considerations of dyes ................................................................................................... 12
2.7 Treatment technologies for dye removal ....................................................................................... 12
CHAPTER THREE .................................................................................................................................... 17
3.0 MATERIALS AND METHODS ...................................................................................................... 17
3.1 Introduction ................................................................................................................................... 17
3.2 Raw materials ................................................................................................................................ 17
3.3 Reagents ........................................................................................................................................ 17
3.4 Experimental set-up ...................................................................................................................... 17
3.5 Experimental methods and procedures ......................................................................................... 21
vii
3.6 Sampling and laboratory analysis ................................................................................................. 26
CHAPTER FOUR ....................................................................................................................................... 27
4.0 RESULTS AND DISCUSSION ....................................................................................................... 27
4.1 Basis characterization of the media............................................................................................... 27
4.2 Decrease of colour concentration with flushing ............................................................................ 33
4.3 Performance of the bio-filter units with respect to dye-removal .................................................. 35
4.4 Performance of the bio-filter units with respect to COD removal ................................................ 44
CHAPTER FIVE ........................................................................................................................................ 52
5.0 CONCLUSION AND RECOMMENDATIONS .............................................................................. 52
5.1 CONCLUSION ............................................................................................................................. 52
5.2 RECOMMENDATIONS .............................................................................................................. 53
REFERENCES ........................................................................................................................................... 54
APPENDICES ............................................................................................................................................ 56
viii
LIST OF FIGURES
Figure 2.1 Structural formula of a dye molecule (C.I Acid blue) (Source: Gohl, 1983) ................ 7
Figure 2.2 Dyeing process at Morocco (Source: http://en.wikipedia.org/wiki) ............................. 8
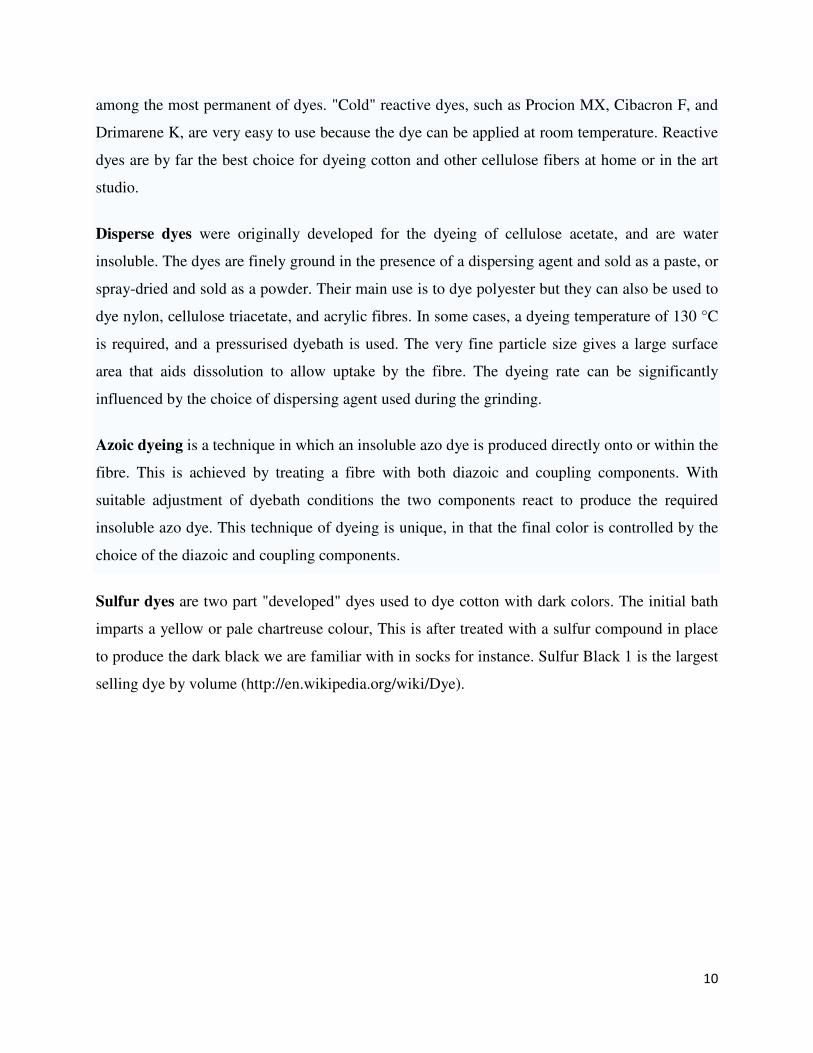
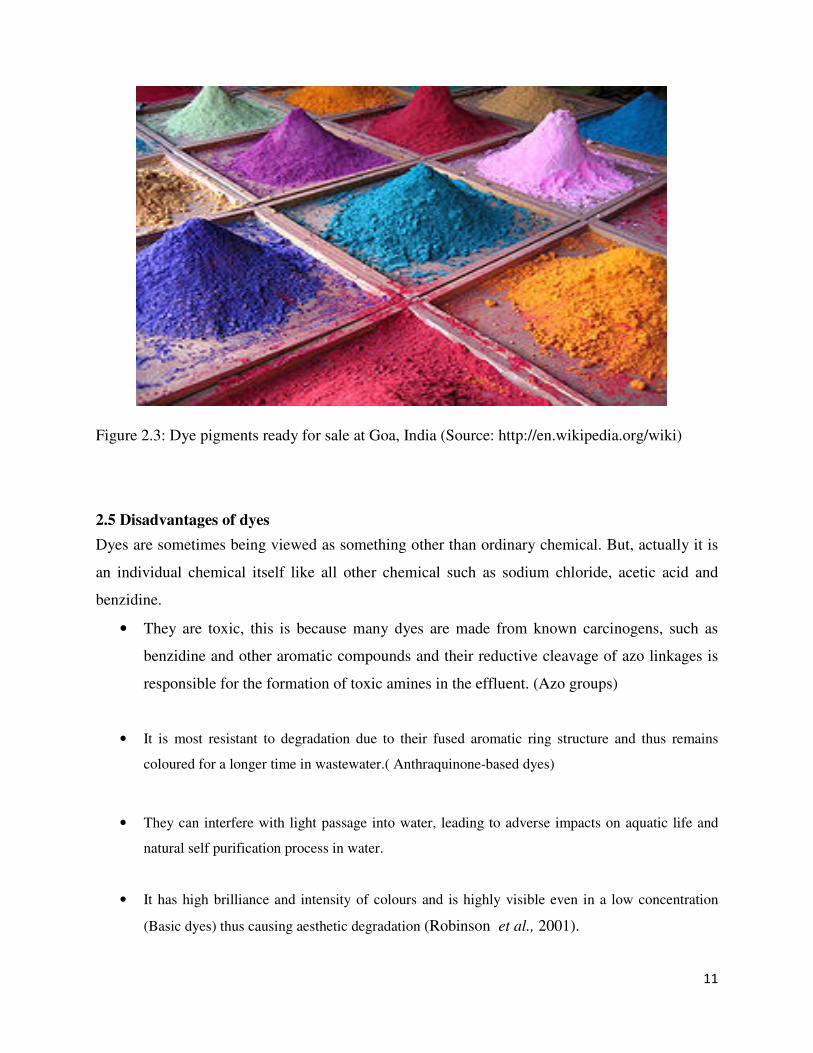
Figure 2.3: Dye pigments ready for sale at Goa, India (Source: http://en.wikipedia.org/wiki) .... 11
Figure 3.1: Pilot scale upflow bio-filter units experimental set-up layout plan ............................ 19
(WW = Wastewater) ..................................................................................................................... 19
Figure 3.2: Pilot scale upflow bio-filter units experimental set-up longitudinal .......................... 20
Section A-A and pictorial representation. ..................................................................................... 20
Figure 3.3: pH reading of the media using pH meter ................................................................... 22
Figure 3.4: Porosity testing of the media ...................................................................................... 24
Figure 3.5: Sieve analysis exercise and masses retained on the sieves ........................................ 25
Figure 4.1: pH readings of different media ................................................................................... 27
Figure 4.2: Dry and Saturated bulk densities of the media ........................................................... 28
Figure 4.3: Porosity of the media .................................................................................................. 29
Figure 4.4: Moisture Content of the Media .................................................................................. 30
Figure 4.5: Organic Content of the Media .................................................................................... 31
Figure 4.6: Carbon Content of the Media ..................................................................................... 31
Figure 4.7: Decrease of colour concentration with flushing for HWF ......................................... 33
Figure 4.8: Decrease of colour concentration with flushing for HWC ......................................... 34
Figure 4.9: Variation of colour removal with height during day 1 ............................................... 36
Figure 4.10: Variation of colour removal with height during day 4 ............................................. 36
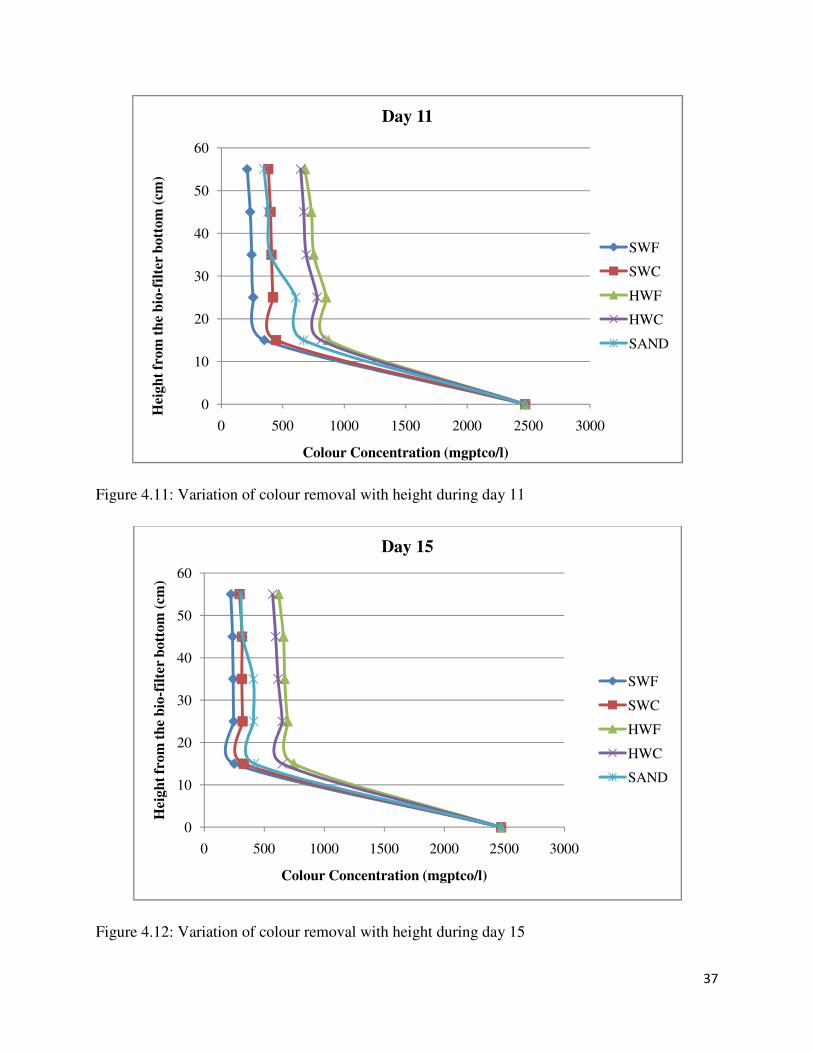
Figure 4.11: Variation of colour removal with height during day 11 ........................................... 37
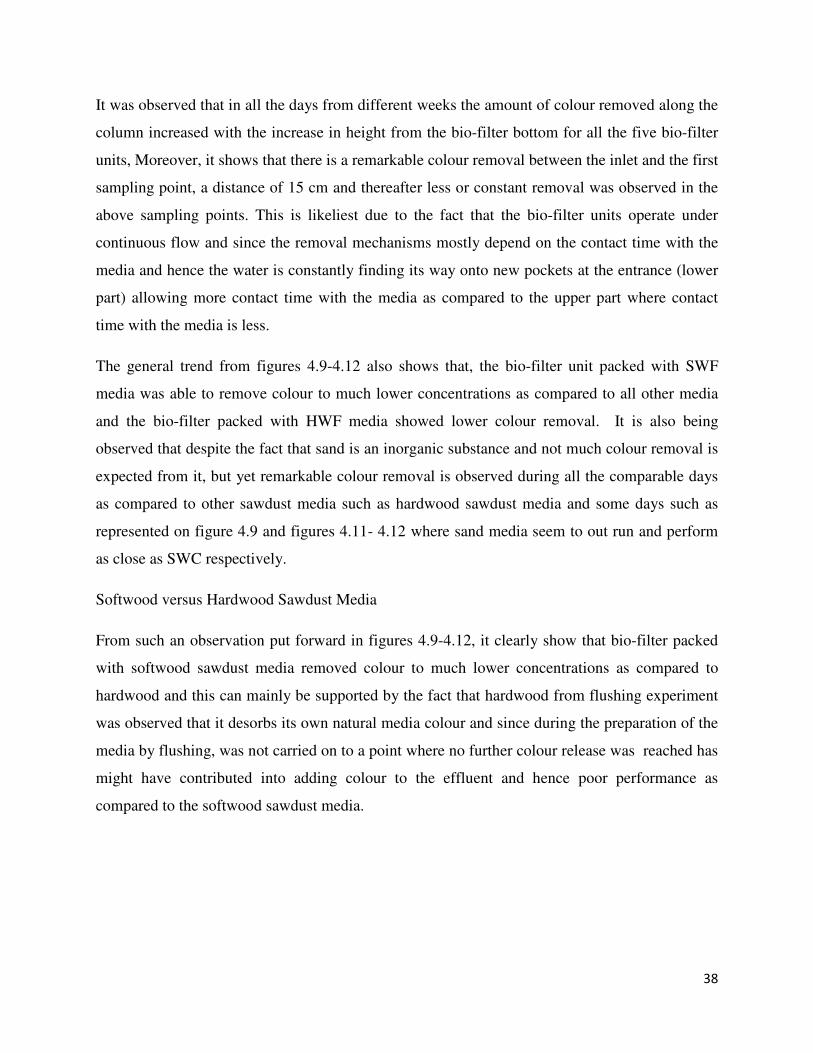
Figure 4.12: Variation of colour removal with height during day 15 ........................................... 37
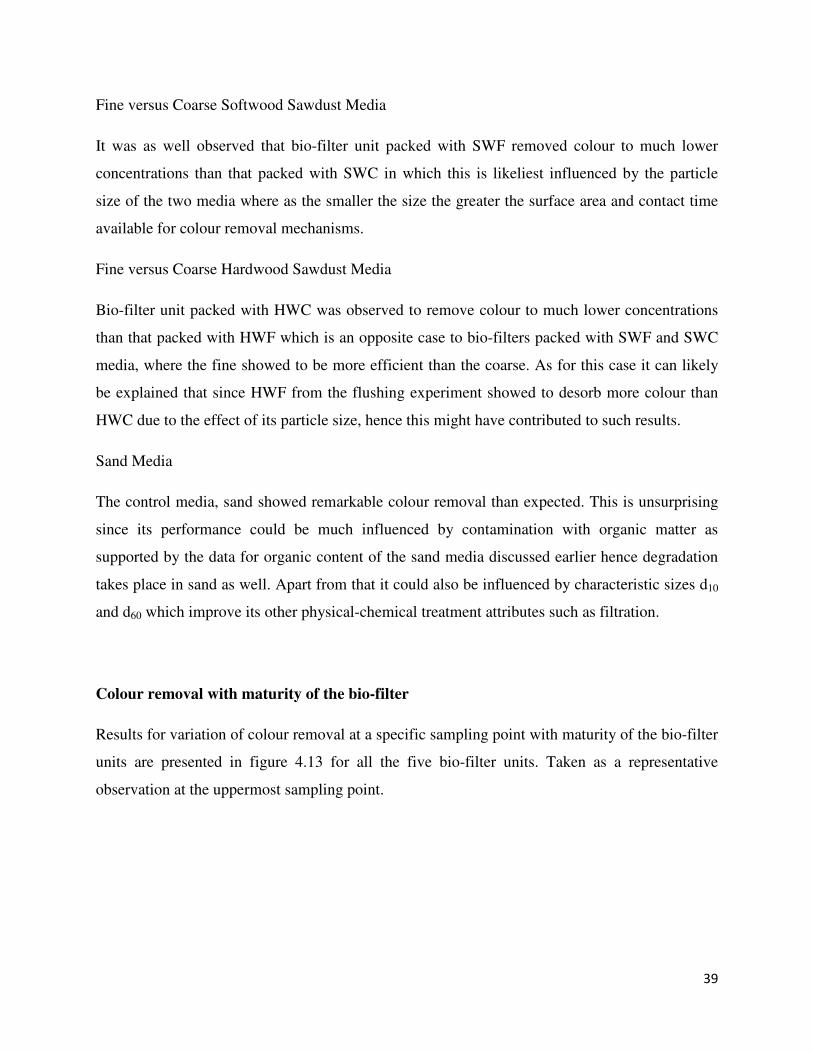
Figure 4.13: Variation of colour concentration in the treated effluent at the uppermost sampling
point with maturity of the bio-filter. ............................................................................................. 40
Figure 4.14: Variation of spatial k-values for colour removal with maturity of the bio-filter ..... 41
Figure 4.15: Variation of temporal k-values for colour removal with maturity of the bio-filter .. 42
Figure 4.16: Colour removal efficiency during day 1 ................................................................... 43
Figure 4.17: Colour removal efficiency during day 7 ................................................................... 43
Figure 4.18: Colour removal efficiency during day 19 ................................................................. 44
Figure 4.19: Variation of COD removal with height during day 4 ............................................... 45
Figure 4.20: Variation of COD removal with height during day 11 ............................................. 45
Figure 4.21: Variation of COD removal with height during day 19 ............................................. 46
Figure 4.22: Variation of spatial k-values for COD removal with maturity of the bio-filter ....... 48
Figure 4.23: Variation of temporal k-values for COD removal with maturity of the bio-filter ... 48
Figure 4.24: COD removal efficiency during day 1 ..................................................................... 49
Figure 4.25: COD removal efficiency during day 11 ................................................................... 50
Figure 4.26: COD removal efficiency during day 19 ................................................................... 50
ix
LIST OF TABLES
Table 3.1: Bio-filter units’ column characteristics ……………………………………………21
Table 4.1: Summary of the geotechnical properties of the media ………………………….....32
Table 4.2: Temporal natural colour release rate constants for Hardwood media ……………35
x
ACRONYMS
COD- Chemical Oxygen Demand
SWF- Softwood Fine sawdust
SWC- Softwood Coarse sawdust
HWF- Hardwood Fine sawdust
HWC- Hardwood Coarse sawdust
1
CHAPTER ONE
1.0 INTRODUCTION
1.1 GENERAL INTRODUCTION AND BACKGROUND
A dye can simply be described as a colored substance that has an affinity to the substrate to
which it is being applied. The dye is generally applied in an aqueous solution, and may require a
mordant to improve the fastness of the dye on the fiber (Gohl, 1983).
The textile industry consumes considerable amounts of water during dyeing, printing and
finishing operations (Ong et al, 2006). Mbuligwe (2004) contend that in Dar-es-Salaam City
there are more than a thousand tie-and –dye (TAD) small scale industries (SSIs) that discharge
dye-rich waste water indiscriminately with resultant water pollution. Dye-rich discharges from
the TAD SSIs flow into surface and ground water sources where they cause pollution. It is
noteworthy that, apart from their other adverse chemical, biological and physical effects, dyes in
water are an eyesore (Nigam et al, 2000); they cause aesthetic degradation. Additionally, they
can interfere with the light passage into water, leading to adverse impacts on aquatic life and
natural purification process in water (Mbuligwe, 2004).
The characteristic structure of dye and particularly reactive dye is very complex and difficult to
degrade or eliminate. Reactive dye can dissolve in water as it is highly soluble compound, and
the resultant change in the water color is unattractive to the public. Color can be the conditional
indicator indicating the need to reduce dye in waste water to an acceptable level (Nilratnisakorn
et al., 2007).
Investigations on methods of decolourisationof dyes have been reported by a number of
researchers. For example, satisfactory decolorisation (60-91%) of textile wastewater by
ozonation and Fenton’s process has been reported by Sevimli and Kinaci (2002). Orhon et al.,
(2002) reported that pre-ozonation of textile wastewater prior to biological waste water treatment
2
achieved 85% colour removal, but only 19% COD removal. In a study reported by Spinoza and
Isik (2002) a combination of an upflow anaerobic sludge blanket (UASB) and completely stirred
tank reactor (CSTR) achieved appreciable colour (78-92%) and COD (27-56%) removals.
Granular activated carbon (GAC) is a common colour removal medium. Use of GAC and natural
zeolites to remove dyes from aqueous phase has also been reported by Meshko et al. (2002).
An examination of the characteristics and requirements of the dye treatment methods and studies
outlined above suggest that are not feasible for treating dye-rich wastewater in most of the
developing countries. This is because of the following undesirable attributes: technology
intensiveness, a need for reliable supply of power, complex components and design, unproven
treatment effectiveness; demanding operational and maintenance needs, hence unsustainable;
expensive to acquire and maintain; and have residuals that require further elaborate handling
(Mbuligwe, 2004). Engineered wetland systems (EWSs) efficacy as a wastewater treatment
technology is increasingly being recognized. Notably, EWSs do remove not organics, nutrients,
and suspended solids but also colour (Mbuligwe, 2004).
This study is based on the fact that softwood sawdust and wood shavings under batch mode was
viable in treating dye-rich wastewater as according to (Mtimbaru, 2009), hence it was
hypothesized bio-filter units with different media used for adsorption such as hardwood and
softwood sawdust under upflow mode would perform with different treatment efficiencies for the
purpose of optimization in the treatment of dye-rich wastewater.
1.2 PROBLEM STATEMENT
Research is currently focusing on the use of low cost commercially available organic materials as
viable substitutes for activated carbon; in fact sawdust, a relatively abundant and inexpensive
material, has been extensively investigated as an adsorbent for removing contaminants from
water. Thus the use of sawdust will as well help in the management of solid waste and air
pollution prevention from the sawdust itself when abandoned and thus solving the growing
problem of waste management in developing countries such as Tanzania.

3
1.3 MOTIVATION
It has been shown recently that sawdust has affinity for different biologically active compounds
such as enzymes. Also different organic compounds such as acid and basic dyes and oils and
heavy metal ions (Yu et al., 2001) were efficiently adsorbed on different types of sawdust.
Sawdust and wood shavings posses attribute that make them leading cost effective candidate
media for treating dye-rich wastewater. These attributes are:
• High potential sorption capacity
• Possession of large surface area which is suitable for microbial colonization and
as sorption site
• Possession of good structural properties including strength, appropriate shape and
size, and adequate porosity, hydraulic conductivity and density
• Good bio-chemical and hydrodynamic properties, including strength
• Relative recalcitrance to microbial action and high organic content
• Easy availability and accessibility
• Low acquisition cost (including transport cost) (Mbuligwe, 2004)
According to (Mtimbaru, 2009), the adsorption material used that is sawdust (Fine Softwood
Sawdust adsorbent) for the three type of dye used has shown excellent performance by attaining
the colour removal efficiency of 77% in vat red, 74% in vat green and 52% in vat blue dye
solution and from another research by (Ong et al., 2005) for example stated that, azo dyes, sixty
to seventy percent of dyes used in the textile industry, are mineralized aerobically only after the
azo-linkage is broken anaerobically. Thus to treat such pollutants a vertical upflow bio-filoter in
which anaerobic and aerobic processes take place sequentially is the most promising options for
this purpose.
4
1.4 OBJECTIVES
General Objective
The main objective of this research is to evaluate the effectiveness of various potential bio-filter
media in the treatment of dye-rich wastewater with a view to optimize the performance of the
bio-filter units.
Specific Objectives
• To characterize bio-filter media on the basis of their physical, chemical and geotechnical
properties.
• To assess commissioning needs of the media (flushing of the media).
• To assess the performance of the bio-filter media in the removal of dye.
• To assess the performance of the bio-filter media in the removal of COD.
• To assess whether the dye removal performance is simply decolourization or complete
destruction of the dye molecules.
5
CHAPTER TWO
2.0 LITERATURE REVIEW
2.1 Dye
A dye can generally be described as coloured, ionising, aromatic organic compounds. It must be
appreciated that they are individual chemicals, and like all chemicals, they are similar in their
reactions to some other chemicals, and distinctly different from others.
Colour in dyes is invariably explained as a consequence of the presence of a Chromophore.
Since, by definition, dyes are aromatic compounds their structure includes aryl rings which have
delocalised electron systems. These are responsible for the absorption of electromagnetic
radiation of varying wavelengths, depending on the energy of the electron clouds. For this
reason, chromophores do not make dyes coloured in the sense that they confer on them the
ability to absorb radiation. Rather, chromophores function by altering the energy in the
delocalised electron cloud of the dye, and this alteration results in the compound absorbing
radiation from within the visible range instead of outside it. Our eyes detect that absorption, and
respond to the lack of a complete range of wavelengths by seeing colour (Fessenden &
Fessenden, 1990).
Archaeological evidence shows that, particularly in India and Phoenicia, dyeing has been
extensively carried out for over 5000 years. The dyes were obtained from animal, vegetable or
mineral origin, with no or very little processing. By far the greatest source of dyes has been from
the plant kingdom, notably roots, berries, bark, leaves and wood, but only a few have ever been
used on a commercial scale.
Nowadays, dyes are not only made from the natural sources but also there are synthetic dyes. Synthetic
dyes quickly replaced the traditional natural dyes. They cost less, they offered a vast range of
new colors, and they imparted better properties to the dyed materials. They are widely used in
many industries such as textile, paper, leather, food and mineral processing industries to colour their
product.
6
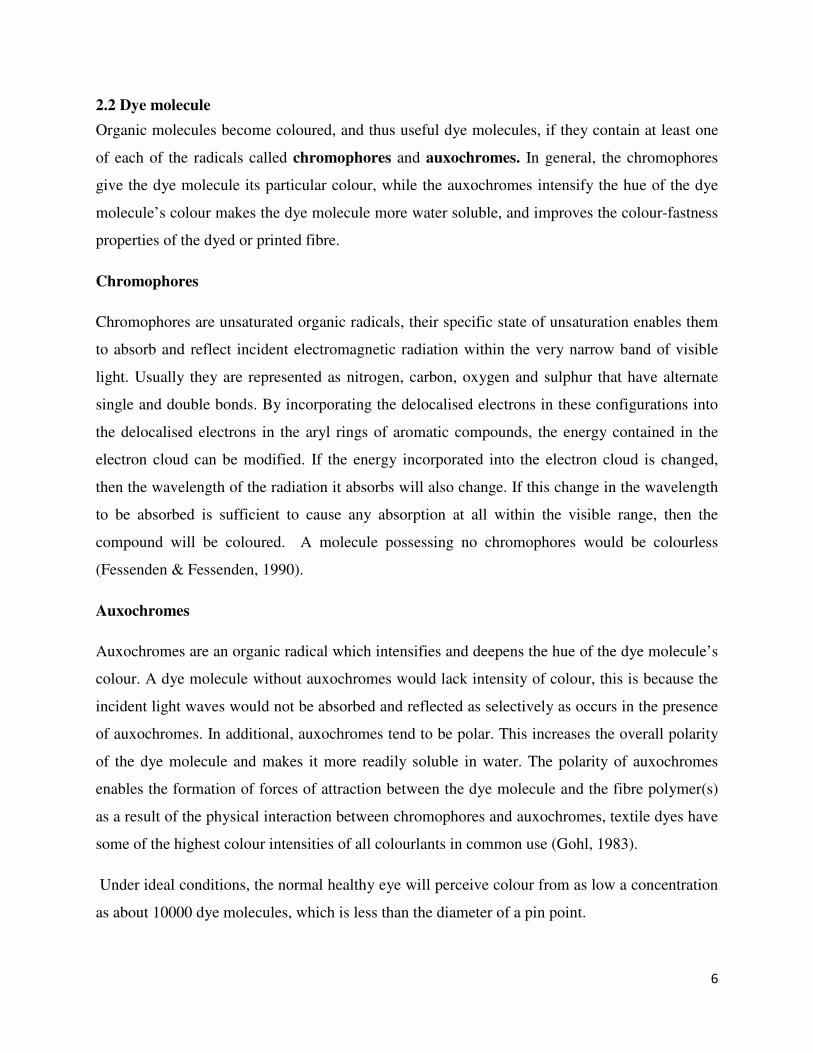
2.2 Dye molecule
Organic molecules become coloured, and thus useful dye molecules, if they contain at least one
of each of the radicals called chromophores and auxochromes. In general, the chromophores
give the dye molecule its particular colour, while the auxochromes intensify the hue of the dye
molecule’s colour makes the dye molecule more water soluble, and improves the colour-fastness
properties of the dyed or printed fibre.
Chromophores
Chromophores are unsaturated organic radicals, their specific state of unsaturation enables them
to absorb and reflect incident electromagnetic radiation within the very narrow band of visible
light. Usually they are represented as nitrogen, carbon, oxygen and sulphur that have alternate
single and double bonds. By incorporating the delocalised electrons in these configurations into
the delocalised electrons in the aryl rings of aromatic compounds, the energy contained in the
electron cloud can be modified. If the energy incorporated into the electron cloud is changed,
then the wavelength of the radiation it absorbs will also change. If this change in the wavelength
to be absorbed is sufficient to cause any absorption at all within the visible range, then the
compound will be coloured. A molecule possessing no chromophores would be colourless
(Fessenden & Fessenden, 1990).
Auxochromes
Auxochromes are an organic radical which intensifies and deepens the hue of the dye molecule’s
colour. A dye molecule without auxochromes would lack intensity of colour, this is because the
incident light waves would not be absorbed and reflected as selectively as occurs in the presence
of auxochromes. In additional, auxochromes tend to be polar. This increases the overall polarity
of the dye molecule and makes it more readily soluble in water. The polarity of auxochromes
enables the formation of forces of attraction between the dye molecule and the fibre polymer(s)
as a result of the physical interaction between chromophores and auxochromes, textile dyes have
some of the highest colour intensities of all colourlants in common use (Gohl, 1983).
Under ideal conditions, the normal healthy eye will perceive colour from as low a concentration
as about 10000 dye molecules, which is less than the diameter of a pin point.
7
Figure 2.1 Structural formula of a dye molecule (C.I Acid blue) (Source: Gohl, 1983)
2.3 The general theory of dyeing
Dyeing is the process of colouring textile materials by immersing them in an aqueous solution of
dye, called dye liquor. Normally the dye liquor consists of dye, water and an auxiliary. To
improve the effectiveness of dyeing, heat is usually applied to the dye liquor. The theory of
aqueous dyeing is modified when an organic solvent is substituted for water. The general theory
of dyeing explains the interaction between dye, fibre, water and dye auxiliary. More specifically
it explains: forces of repulsion which are developed between the dye molecule and water and
forces of attraction which are developed between the dye molecules and fibres. These forces are
responsible for the dye molecules leaving the aqueous dye liquor and entering and attaching
themselves to the polymers of the fibres (Gohl, 1983).
8
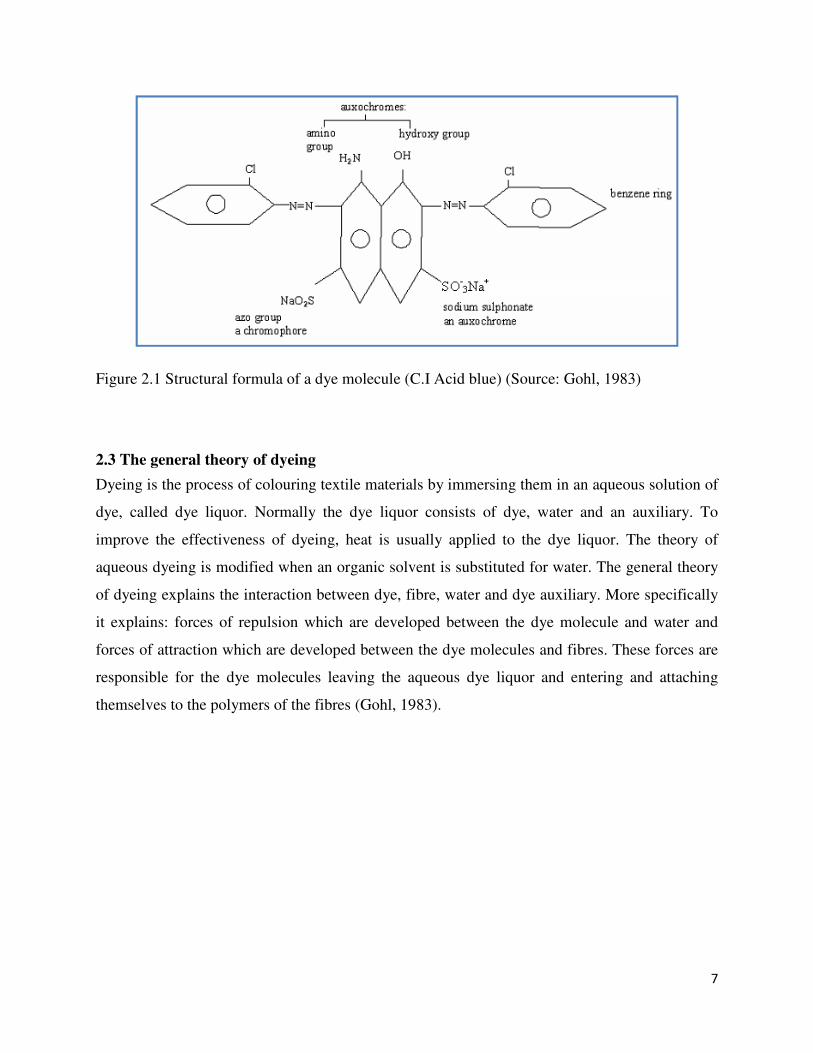
Figure 2.2 Dyeing process at Morocco (Source: http://en.wikipedia.org/wiki)
2.4 Classification systems for dyes
Dyes can be grouped in accordance with two different principles:
• Chemical structure (chemical classification)
• Dyeing methods areas of application (colouristic classification)
A review of the whole field of technical dyes shows that the two classifications overlap that there
is hardly a chemical class of dye, which occurs solely in one colouristic group, and vice versa.
When classified according to the dyeing method, they may be anionic, direct or disperse dyes,
depending on whether they are intended for use on protein, cellulose or polyamide fibers.
Moreover, certain reactive dyes with a particular type of chemical structure can be used for
several substrates, whilst others with the same type of structure are suitable for only a single
substrate.
9
Classification according to the method of application
Acid dyes are water-soluble anionic dyes that are applied to fibers such as silk, wool, nylon and
modified acrylic fibers using neutral to acid dyebaths. Attachment to the fiber is attributed, at
least partly, to salt formation between anionic groups in the dyes and cationic groups in the fiber.
Acid dyes are not substantive to cellulosic fibers. Most synthetic food colors fall in this category.
Basic dyes are water-soluble cationic dyes that are mainly applied to acrylic fibers, but find
some use for wool and silk. Usually acetic acid is added to the dyebath to help the uptake of the
dye onto the fiber. Basic dyes are also used in the coloration of paper.
Direct or substantive dyeing is normally carried out in a neutral or slightly alkaline dyebath, at
or near boiling point, with the addition of either sodium chloride (NaCl) or sodium sulfate
(Na2SO4). Direct dyes are used on cotton, paper, leather, wool, silk and nylon. They are also used
as pH indicators and as biological stains.
Mordant dyes require a mordant, which improves the fastness of the dye against water, light and
perspiration. The choice of mordant is very important as different mordants can change the final
color significantly. Most natural dyes are mordant dyes and there is therefore a large literature
base describing dyeing techniques. The most important mordant dyes are the synthetic mordant
dyes, or chrome dyes, used for wool; these comprise some 30% of dyes used for wool, and are
especially useful for black and navy shades. The mordant, potassium dichromate, is applied as an
after-treatment. It is important to note that many mordants, particularly those in the heavy metal
category, can be hazardous to health and extreme care must be taken in using them.
Vat dyes are essentially insoluble in water and incapable of dyeing fibres directly. However,
reduction in alkaline liquor produces the water soluble alkali metal salt of the dye, which, in this
leuco form, has an affinity for the textile fibre. Subsequent oxidation reforms the original
insoluble dye. The color of denim is due to indigo, the original vat dye.
Reactive dyes utilize a chromophore attached to a substituent that is capable of directly reacting
with the fibre substrate. The covalent bonds that attach reactive dye to natural fibers make them
10
among the most permanent of dyes. "Cold" reactive dyes, such as Procion MX, Cibacron F, and
Drimarene K, are very easy to use because the dye can be applied at room temperature. Reactive
dyes are by far the best choice for dyeing cotton and other cellulose fibers at home or in the art
studio.
Disperse dyes were originally developed for the dyeing of cellulose acetate, and are water
insoluble. The dyes are finely ground in the presence of a dispersing agent and sold as a paste, or
spray-dried and sold as a powder. Their main use is to dye polyester but they can also be used to
dye nylon, cellulose triacetate, and acrylic fibres. In some cases, a dyeing temperature of 130 °C
is required, and a pressurised dyebath is used. The very fine particle size gives a large surface
area that aids dissolution to allow uptake by the fibre. The dyeing rate can be significantly
influenced by the choice of dispersing agent used during the grinding.
Azoic dyeing is a technique in which an insoluble azo dye is produced directly onto or within the
fibre. This is achieved by treating a fibre with both diazoic and coupling components. With
suitable adjustment of dyebath conditions the two components react to produce the required
insoluble azo dye. This technique of dyeing is unique, in that the final color is controlled by the
choice of the diazoic and coupling components.
Sulfur dyes are two part "developed" dyes used to dye cotton with dark colors. The initial bath
imparts a yellow or pale chartreuse colour, This is after treated with a sulfur compound in place
to produce the dark black we are familiar with in socks for instance. Sulfur Black 1 is the largest
selling dye by volume (http://en.wikipedia.org/wiki/Dye).
11
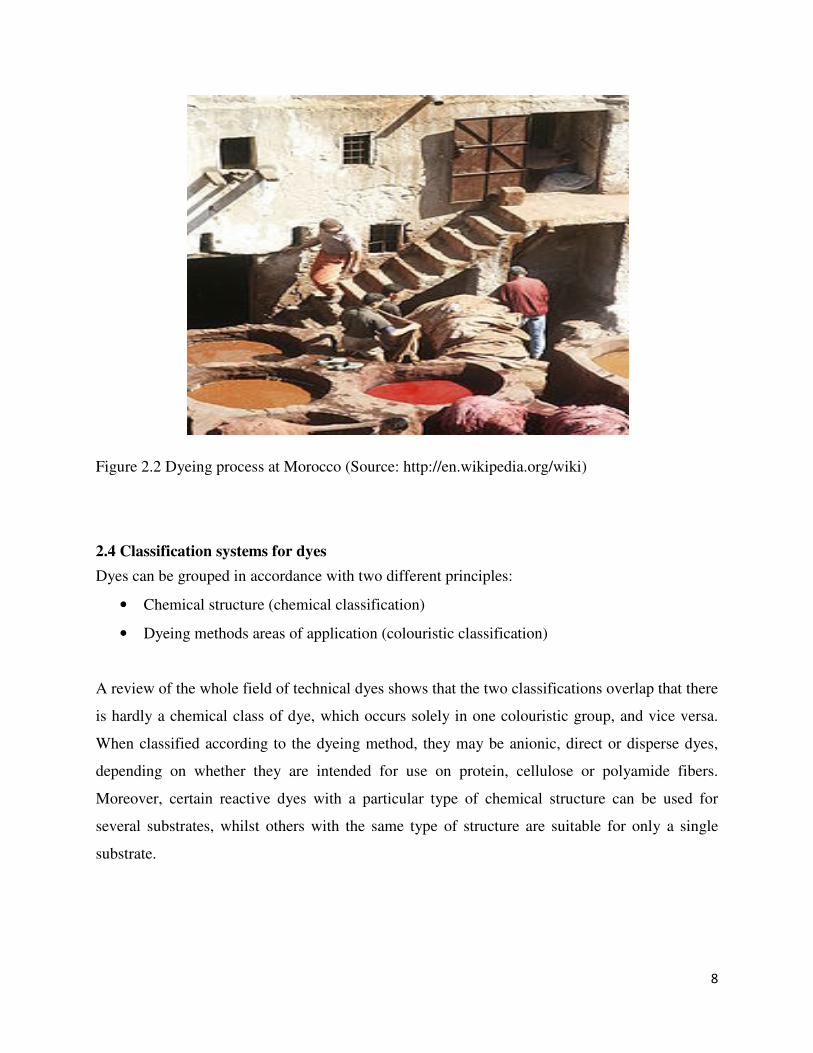
Figure 2.3: Dye pigments ready for sale at Goa, India (Source: http://en.wikipedia.org/wiki)
2.5 Disadvantages of dyes
Dyes are sometimes being viewed as something other than ordinary chemical. But, actually it is
an individual chemical itself like all other chemical such as sodium chloride, acetic acid and
benzidine.
• They are toxic, this is because many dyes are made from known carcinogens, such as
benzidine and other aromatic compounds and their reductive cleavage of azo linkages is
responsible for the formation of toxic amines in the effluent. (Azo groups)
• It is most resistant to degradation due to their fused aromatic ring structure and thus remains
coloured for a longer time in wastewater.( Anthraquinone-based dyes)
• They can interfere with light passage into water, leading to adverse impacts on aquatic life and
natural self purification process in water.
• It has high brilliance and intensity of colours and is highly visible even in a low concentration
(Basic dyes) thus causing aesthetic degradation (Robinson et al., 2001).
12
2.6 Toxicity Considerations of dyes
While this study does not directly address the problem of toxicity created by the release and
degradation of azo dyes, consideration of this problem is still warranted. The potential for
toxic effects to the environment and humans, resulting from the exposure to dyes and dye
metabolites, is not a new concern. As early as 1895 increased rates in bladder cancer were
observed in workers involved in dye manufacturing. Since that time, many studies have been
conducted showing the toxic potential of azo dyes. As mentioned previously, azo dyes are
primarily composed of aromatic amines. Substituted benzene and naphthalene rings are
common constituents of azo dyes, and have been identified as potentially carcinogenic
agents. While most azo dyes themselves are non-toxic a significantly larger portion of their
metabolites are. An investigation of several hundred commercial textile samples revealed that
nearly 10 percent were mutagenic in the Ames test. Another study conducted on 45
combined effluents from textile finishing plants showed that 27 percent of the wastewater
samples were mutagenic in the Ames test.
Most dyes that have been shown to be carcinogenic are no longer used; however, a complete
investigation of all dyestuffs is impossible. Other concerns are the impurities within
commercial dye products and the additives used during the dyeing process. Many textile
effluents contain heavy metals that are complexed in the dyes. High concentrations of salt are
often used to force fiber-reactive dyes out of solution and onto substrates. These compounds
can cause high electrolyte and conductivity concentrations in the dye wastewater, leading to
acute and chronic toxicity problems.
Understanding the dye structures and how they are degraded is crucial to understanding how
toxic by-products are created (Nigam et al., 2000).
2.7 Treatment technologies for dye removal
There are over 100,000 commercially available dyes with a production of over 7 x 10⁵
metric
tons per year are produced worldwide (Robinson et al., 2001). From all the industrial
wastewater, the effluent from textile industry and dyestuff industry are the one, which is very
difficult to treat. This is due to a synthetic origin and complex aromatic molecular structures,
13
which make them more stable and more difficult to be biodegraded. Therefore removal of dyes
from the industrial effluents in an economic fashion remains a major problem.
The conventional treatment of dye wastewater includes adsorption, coagulation, flocculation,
advanced oxidation and biological treatment. These methods face serious difficulties to comply
with the environmental discharge limits due to high variable characteristic of textile wastewater
(Ong et al., 2006).
In a nut shell the methods for the treatment have been categorized in three categories, which are
chemical, biological, and physical.
Chemical method
(a) Oxidative processes
This is the most commonly used method of decolourisation by chemical means. This is mainly
due to its simplicity of application. It was stated that there is a need for more powerful oxidizing
methods, such as chlorine, ozone, Fenton’s reagent (peroxide and fermous sulfate), UV/peroxide,
UV/ozone, or other oxidizing techniques or combination. This is because modern dyes are
resistant to mild oxidation condition, such as exist in biological treatment system. According to
(Robinson et al., 2001) the main oxidizing agent is usually hydrogen peroxide (H2O2). This agent
needs to be activated by some means, for example, ultra violet light.
Fenton’s reagent and UV assisted peroxide techniques have also been evaluated. The limited
penetration of UV light into dye solutions in the case of UV/peroxide methods, the cost of the
Fenton’s reagent approach, and the process complexity in the general have limited the
development of these methods.
(b) Ozonation
The use of ozone was first pioneer in the early 1970s, and it is a very good oxidizing agent due to
its high instability compared to chlorine, another oxidizing agent. Oxidation by ozone is capable
of degrading chlorinated hydrocarbons, phenols, pesticides and aromatic hydrocarbons, the
dosage applied to the dye-containing effluent is dependent on the total colour and residual COD
14
to be removed with no residue or sludge formation and no toxic metabolites. Ozonation leaves
the effluent with no colour suitable for discharge into environmental waterways. A disadvantage
of ozonation is its short half-life, typically being 20 min. One of the major drawbacks with
ozonation is cost, continues ozonation is required due to its short half-life (Sevimli & Kinaci,
2002)
(c) Electrochemical destruction
This is a relatively new technique, which was developed in the mid 1990s. It has some
significant advantages for use as an effective method for dye removal. There is little or no
consumption of chemicals and no sludge build up. The breakdown metabolites are generally not
hazardous leaving it safe for treated wastewaters to be released back into waterways. It shows
efficient and economical removal of dyes.
(d) Sodium hypochloride (NaOCl)
This method attacks at the amino group of the dye molecule by the Cl+. It initiates and
accelerates azo-bond cleavage. An increase in decolouration is seen with an increase in Cl
concentration. The use of Cl for dye removal is becoming less frequent due to the negative
effects it has when released into waterways and the release of aromatic amines which are
carcinogenic, or otherwise toxic molecules.
(e) Photochemical
This method degrades dye molecules to CO2 and H2O by UV treatment in the presence of H2O2.
Degradation is caused by the production of high concentration of hydroxyl radicals. UV light
may be used to activate chemicals, such as H2O2, and the rate of dye removal is influenced by the
intensity of UV.
15
Physical method
(a) Adsorption
Adsorption techniques have gained favour recently due to their efficiency in the removal
pollutants too stable for conventional methods. Adsorption produces a high quality product, and
is a process, which is economically feasible also; adsorption process provides an attractive
alternative treatment, especially if the adsorbent is inexpensive and readily available.
Furthermore this process has the edge on the other method due to its sludge free clean operation
and complete removal of dyes even from dilute solution (Gohl, 1983). Therefore one of the
powerful treatment processes for the removal of dyes from water with a low cost is adsorption.
Several adsorbents are eligible for such a purpose, activated carbon, this is the most commonly
used method of dye removal by adsorption, widely used adsorbent for dye removal because of its
extended surface area, micro porous structure, high adsorption capacity and high degree of
surface reactivity. Others include fly ash, clay, peat, sawdust and agricultural residues (Eli-latif
& Ibrahim, 2009).
Biological method
(a) Decolourisation by white-rot fungi
White-rot fungi are those organisms that are able to degrade lignin, the structural polymer
found in woody plants .The most widely studied white-rot fungus, this fungus is capable of
degrading dioxins, polychlorinated biphenyls (PCBs) and other chloro-organics, also showed the
potential of using P. 15ordid to treat creosote-contaminated soil has also reported that
P.chrysosporium had the ability to decolourise artificial textile effluent by up to 99% within 7
days.
16
(b) Other microbial cultures
Mixed bacterial cultures from a wide variety of habitats have also been shown to decolourise the
diazolinked chromophore of dye molecules in 15 days (Nigam et al., 2000). They demonstrated
that a mixture of dyes was decolorized by anaerobic bacteria in 24-30 hrs, using free growing
cells or in the form of biofilms on various support materials.
c) Adsorption by living/dead microbial biomass
The uptake or accumulation of chemicals by microbial mass has been termed biosorption
(Kumar et al., 1998). Dead bacteria; yeast and fungi have all been used for the purpose of
decolourising dye-containing effluents. Textile dyes vary greatly in their chemistries, and
therefore their interactions with micro-organisms depend on the chemistry of a particular dye and
the specific chemistry of the microbial biomass. Depending on the dye and the species of micro-
organism used different binding rates and capacities will be observed. It can be said that certain
dyes have a particular affinity for binding with microbial species.
17
CHAPTER THREE
3.0 MATERIALS AND METHODS
3.1 Introduction
Biodegradation of less-degradable pollutants generally requires combination of anaerobic and
aerobic processes. For example, azo dyes, sixty to seventy percent of dyes used in the textile
industry, are mineralized aerobically only after the azo-linkage is broken anaerobically (Ong
et al., 2005). To treat such pollutants a vertical upflow bio-filter in which anaerobic and aerobic
processes take place sequentially is the most promising options for this purpose. Apart from that
the use of sawdust as the media is expected to serve the purpose of adsorption which is also an
effective method for removal of dye as reported by other researchers.
3.2 Raw materials
• Synthetic dye that is vat blue, vat dyes are commonly used in Tanzania by SSIs
manufactured from India.
• Sawdust from softwood commonly known as cypress with scientific name Cupressus
lusitanica and hardwood commonly known as bloodwood with scientific name
Pterocarpus angolensis media subjected for test, from dominant timber species and sand
shall be used as a control medium.
3.3 Reagents
Various reagents were used, these are Potassium dichromate and concentrated sulphuric acid for
COD measurements, caustic soda, sodium hydrosulphate and dye powder of the colour desired (
blue) for blending dye rich wastewater.
3.4 Experimental set-up
The experimental bio-filter units were located in the Department of Environmental Engineering
research site at ARU along Makongo Road. The experimental set-up comprises the components
illustrated in the Figures 3.1 and 3.2. Different sizes of softwood and hardwood sawdust were
used as bio-filter media and for one set up sand is used as a control medium.
18
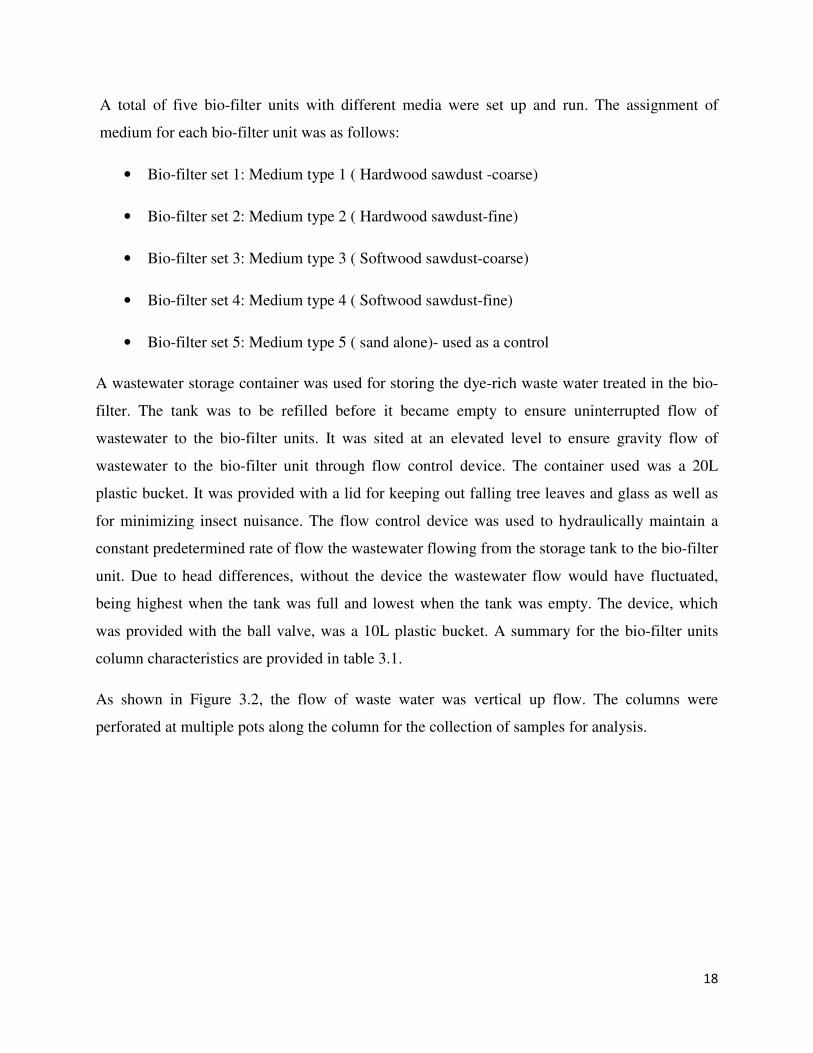
A total of five bio-filter units with different media were set up and run. The assignment of
medium for each bio-filter unit was as follows:
• Bio-filter set 1: Medium type 1 ( Hardwood sawdust -coarse)
• Bio-filter set 2: Medium type 2 ( Hardwood sawdust-fine)
• Bio-filter set 3: Medium type 3 ( Softwood sawdust-coarse)
• Bio-filter set 4: Medium type 4 ( Softwood sawdust-fine)
• Bio-filter set 5: Medium type 5 ( sand alone)- used as a control
A wastewater storage container was used for storing the dye-rich waste water treated in the bio-
filter. The tank was to be refilled before it became empty to ensure uninterrupted flow of
wastewater to the bio-filter units. It was sited at an elevated level to ensure gravity flow of
wastewater to the bio-filter unit through flow control device. The container used was a 20L
plastic bucket. It was provided with a lid for keeping out falling tree leaves and glass as well as
for minimizing insect nuisance. The flow control device was used to hydraulically maintain a
constant predetermined rate of flow the wastewater flowing from the storage tank to the bio-filter
unit. Due to head differences, without the device the wastewater flow would have fluctuated,
being highest when the tank was full and lowest when the tank was empty. The device, which
was provided with the ball valve, was a 10L plastic bucket. A summary for the bio-filter units
column characteristics are provided in table 3.1.
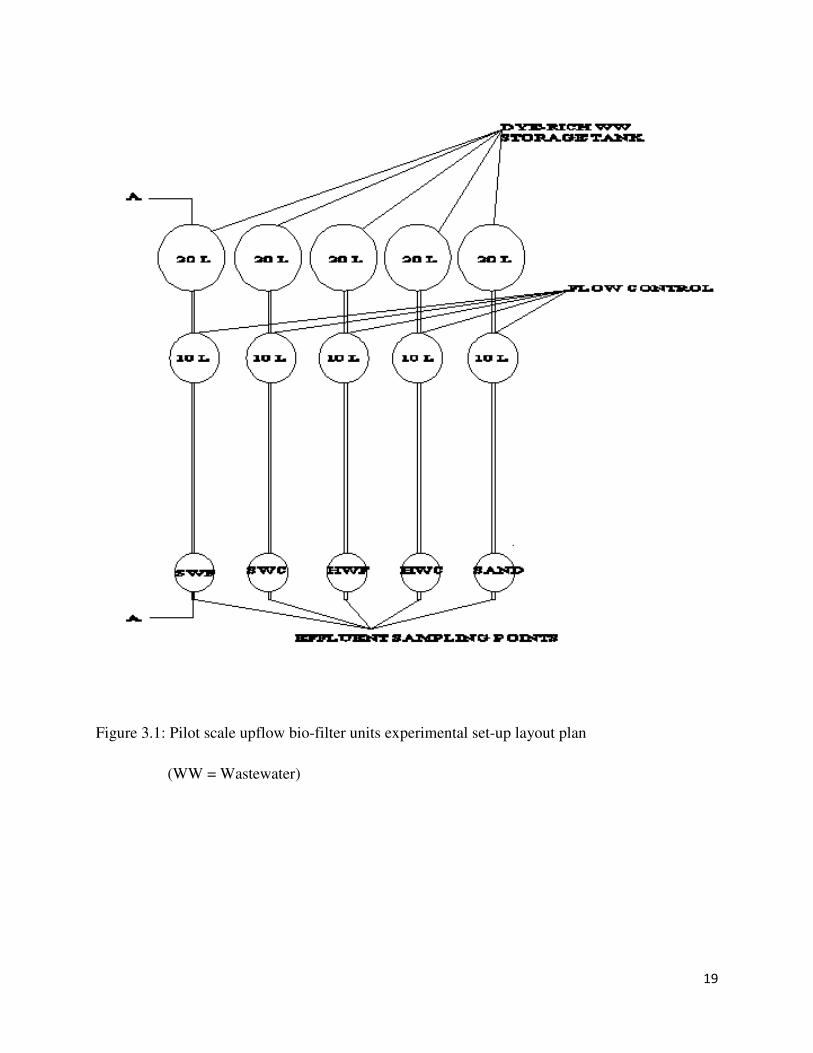
As shown in Figure 3.2, the flow of waste water was vertical up flow. The columns were
perforated at multiple pots along the column for the collection of samples for analysis.
19
Figure 3.1: Pilot scale upflow bio-filter units experimental set-up layout plan
(WW = Wastewater)
20
Figure 3.2: Pilot scale upflow bio-filter units experimental set-up longitudinal
Section A-A and pictorial representation.
21
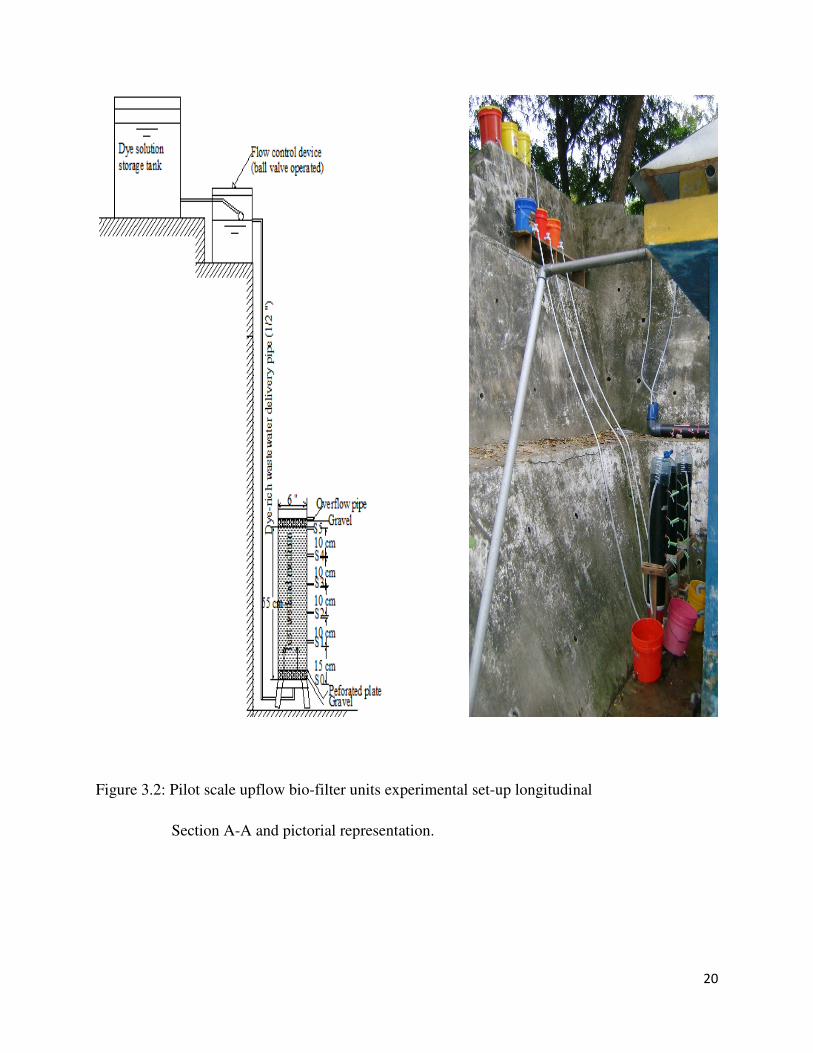
Table 3.1: Bio-filter units’ column characteristics
Column Characteristics
Columns
SWF SWC HWF HWC SAND
Total length (cm) 60 60 60 60 60
Diameter (i.d) (cm) 15 15 15 15 15
Total Volume (cm3) 10603 10603 10603 10603 10603
Bulk density (g/cm3) 1.049 0.8106 1.1247 0.495 2.2046
Media density (g/cm3) 0.1905 0.1722 0.2326 0.1509 1.6133
Media Porosity 0.82 0.88 0.79 0.86 0.38
Effective Volume (cm3) 8694 9331 8376 9119 4029
Volume of dye-rich wastewater
treated(L) 20 20 20 20 20
Initial Colour Concentration of dye-rich
wastewater (mgptco/l) 2473 2473 2473 2473 2473
Initial COD Concentration of dye-rich
wastewater (mg/l) 398 398 398 398 398
Flow data
Hydraulic residence time (τ ) (hr) 20 21 17 19 12
Measured flow rate Q (cm3/min) 7.25 7.92 8.2 7.5 5.59
3.5 Experimental methods and procedures
Basis characterization of the media
This includes physical and chemical characteristics of the media. Whereas for each type of media
to be used the following were analyzed;-
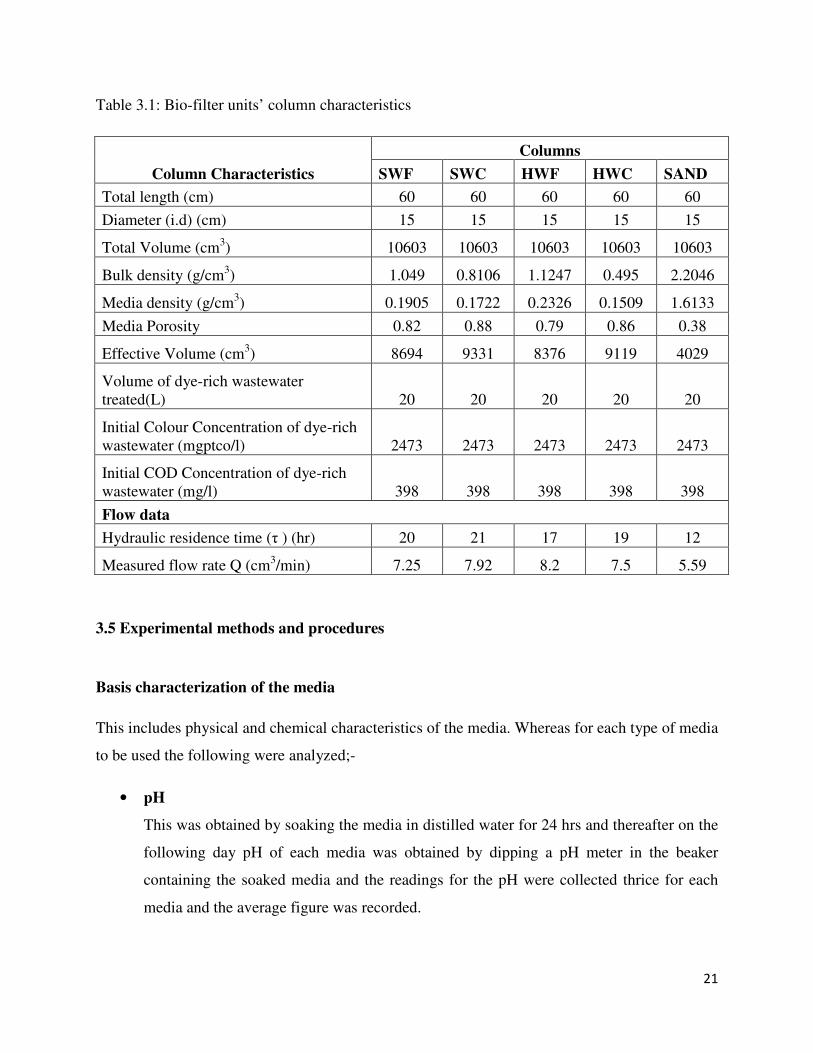
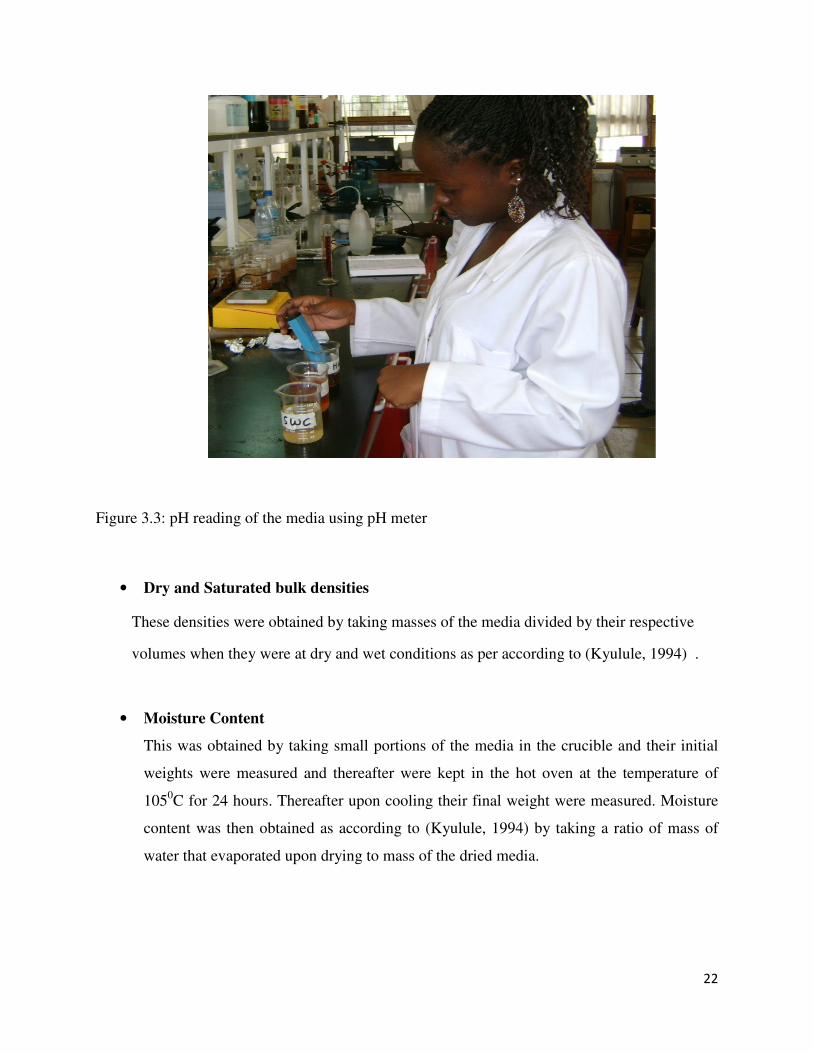
• pH
This was obtained by soaking the media in distilled water for 24 hrs and thereafter on the
following day pH of each media was obtained by dipping a pH meter in the beaker
containing the soaked media and the readings for the pH were collected thrice for each
media and the average figure was recorded.
22
Figure 3.3: pH reading of the media using pH meter
• Dry and Saturated bulk densities
These densities were obtained by taking masses of the media divided by their respective
volumes when they were at dry and wet conditions as per according to (Kyulule, 1994) .
• Moisture Content
This was obtained by taking small portions of the media in the crucible and their initial
weights were measured and thereafter were kept in the hot oven at the temperature of
1050C for 24 hours. Thereafter upon cooling their final weight were measured. Moisture
content was then obtained as according to (Kyulule, 1994) by taking a ratio of mass of
water that evaporated upon drying to mass of the dried media.
23
• Organic Content
This was obtained by taking the difference between the dried masses of the media and the
final masses of the media after being dried in the muffle furnance.
• Carbon Content
This was estimated based on the measured volatile solids (VS) content. Whereas the same
samples from the oven after having cooled and weighed they were transferred to the
muffle furnace at a temperature of 5500C for 2 hours and their final masses after cooling
were measured to obtain VS content. According to Adams et al. (1951), for most
biological materials, the carbon content is between 45 to 60 percent of the volatile solids
fraction. Assuming 55 percent, the formula for estimating carbon content is (Adam et
al.,1951):
% Carbon = (% VS)/1.8
• Porosity
This was obtained by filling the media in the beaker of a known volume, and then known
water volume was added via a perforated cover which was used to hold the media in
position to avoid expansion. The water filled is expected to fill the pore spaces in the
media. Porosity thereafter was obtained by taking the ratio of the volume of the voids to
the volume of the media as according to (Kyulule, 1994).

24
Figure 3.4: Porosity testing of the media
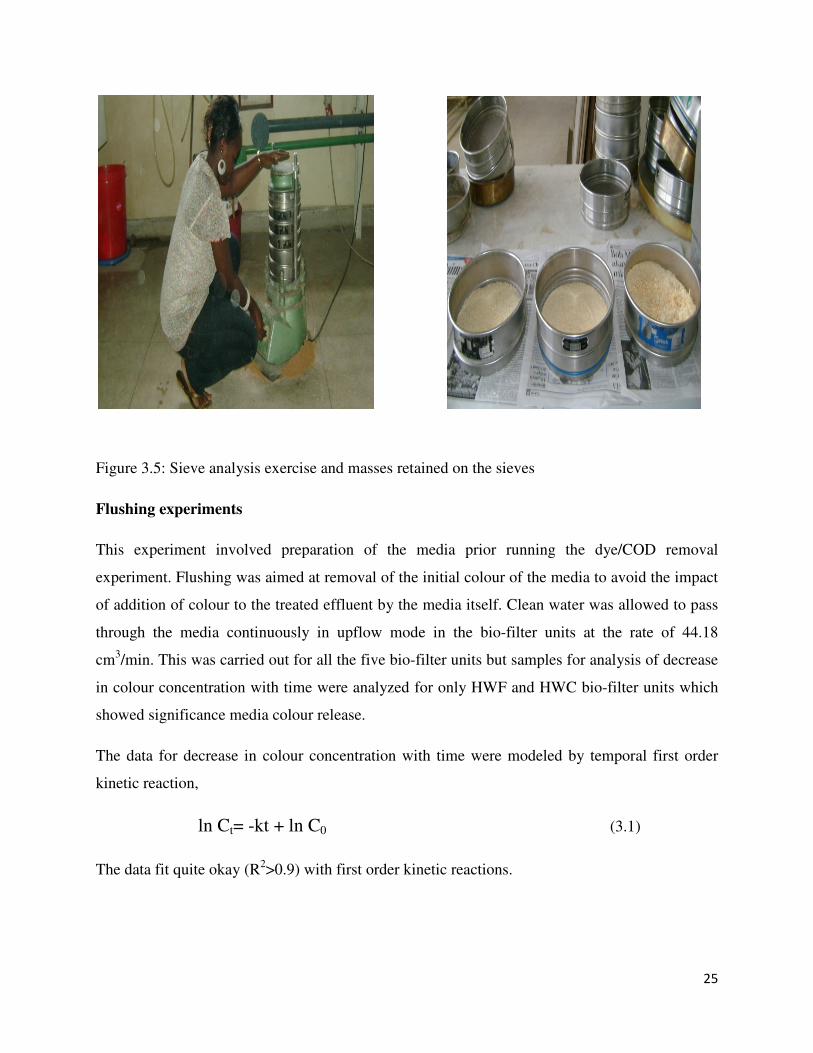
• Geotechnical properties analysis
This was done for each media to be used in this research which included determining
characteristic size d10, d60, and coefficient of uniformity Uc as according to (Kyulule,
1994). In this experiment sieve analysis exercise was carried out at COET laboratory at
UDSM as shown in Figure 3.10. Thereafter masses retained on each sieve for each
medium were recorded and calculation tables for obtaining data for particle-size
distribution curves were prepared and results are found in appendix I together with their
respective particle-size distribution curves used to obtain characteristic sizes d10, d60.
Coefficient of uniformity was obtained by taking the ratio of characteristic size d60 to
characteristic size d10.
25
Figure 3.5: Sieve analysis exercise and masses retained on the sieves
Flushing experiments
This experiment involved preparation of the media prior running the dye/COD removal
experiment. Flushing was aimed at removal of the initial colour of the media to avoid the impact
of addition of colour to the treated effluent by the media itself. Clean water was allowed to pass
through the media continuously in upflow mode in the bio-filter units at the rate of 44.18
cm3/min. This was carried out for all the five bio-filter units but samples for analysis of decrease
in colour concentration with time were analyzed for only HWF and HWC bio-filter units which
showed significance media colour release.
The data for decrease in colour concentration with time were modeled by temporal first order
kinetic reaction,
ln Ct= -kt + ln C0 (3.1)
The data fit quite okay (R2>0.9) with first order kinetic reactions.
26
Dye-rich wastewater preparation
Dye-rich wastewater treated was prepared using the exact specifications used by the practitioners
of the tie-and-dye (batik) technology in the TAD SSIs in Dar es Salaam City as reported by
Mbuligwe (2004). It was prepared using the following ingredients and procedures:
• Addition of 40 g of caustic soda
• Addition of 60 g of sodium hydrosulphate
• Addition of 40 g of blue dye powder, and
• Mixing thoroughly all the ingredients, adding distilled water to make 1 L dye solution.
• Taking 100 ml of the dye solution, adding clean water (tap water) to make 20 L dye
solution which is added in each of the five set-ups.
Experimental procedure
Each of the five media was filled in the bio-filter column to fill up a depth of 55 cm. Synthetic
dye solution of the same colour and COD concentrations and volume was allowed to flow in the
columns at a constant flow rate regulated by a flow control device in a vertical upflow mode and
samples for analysis of true colour and COD were collected at five different sampling pots along
the column.
The data collected on treated effluent for colour and COD concentrations were modeled by first
order kinetic reaction,
ln Cx= -kx + ln C0 (3.2)
The data fit quite well (R2>0.7) with first order kinetic reaction for effluent COD data compared
to colour data (R2>0.5). The results for coefficient of correlation are found in appendix II for
both COD and colour.
3.6 Sampling and laboratory analysis
Samples for analysis were collected in small volumes in the plastic bottles (500 ml) and were
analyzed for colour and COD concentrations in the Environmental Engineering Department
laboratory at Ardhi University according to Standard Methods for Water and Wastewater
Analysis (1992)

4.0 RESULTS AND DISCUSSION
4.1 Basis characterization of the media
Figures 4.1-4.6 and Table 4.1 present basic characterization data for the media used in this study.
The data are pH, density, porosity,
size gradation.
Figure 4.1: pH readings of different media
It is observed from the results presented in figure 4.1, pH of the media range from being slightly
acidic to slightly neutral. Generally, wood since it
which contains weak acid groups in its chain it suggest t
as well posses lower pH (acidic). The fact that from the data obtained
appeared to be slightly neutral could be as a result of mineral plant up
the timber or sawdust itself during preparation and protection against pesticides.
like all natural soils has various components
neutral pH of 7, but since natural sand has a healthy dose of salt and some organic matter as
0
1
2
3
4
5
6
7
HWF
pH 6.5
CHAPTER FOUR
4.0 RESULTS AND DISCUSSION
4.1 Basis characterization of the media
4.6 and Table 4.1 present basic characterization data for the media used in this study.
porosity, moisture content, organic content, carbon content, and media
of different media
It is observed from the results presented in figure 4.1, pH of the media range from being slightly
acidic to slightly neutral. Generally, wood since it comprise of mainly cellulose live along lignin
groups in its chain it suggest that sawdust obtained from these woods
as well posses lower pH (acidic). The fact that from the data obtained, pH of HWF and SWC
utral could be as a result of mineral plant up-take or contamination of
uring preparation and protection against pesticides.
like all natural soils has various components but pure sand is mostly silica and would have
neutral pH of 7, but since natural sand has a healthy dose of salt and some organic matter as
HWC SWF SWC SAND
5.8 5.7 6.5 5.2
pH
27
4.6 and Table 4.1 present basic characterization data for the media used in this study.
content, organic content, carbon content, and media
It is observed from the results presented in figure 4.1, pH of the media range from being slightly
comprise of mainly cellulose live along lignin
hat sawdust obtained from these woods
pH of HWF and SWC
take or contamination of
uring preparation and protection against pesticides. Likewise SAND
but pure sand is mostly silica and would have
neutral pH of 7, but since natural sand has a healthy dose of salt and some organic matter as
supported by the data for organic and carbon content in figures 4.4 and 4.5, these impurities of
sand would give it a different pH from neutral as supported by the results for sand pH in figure
4.1, which showed that the sand pH is slightly acidic.
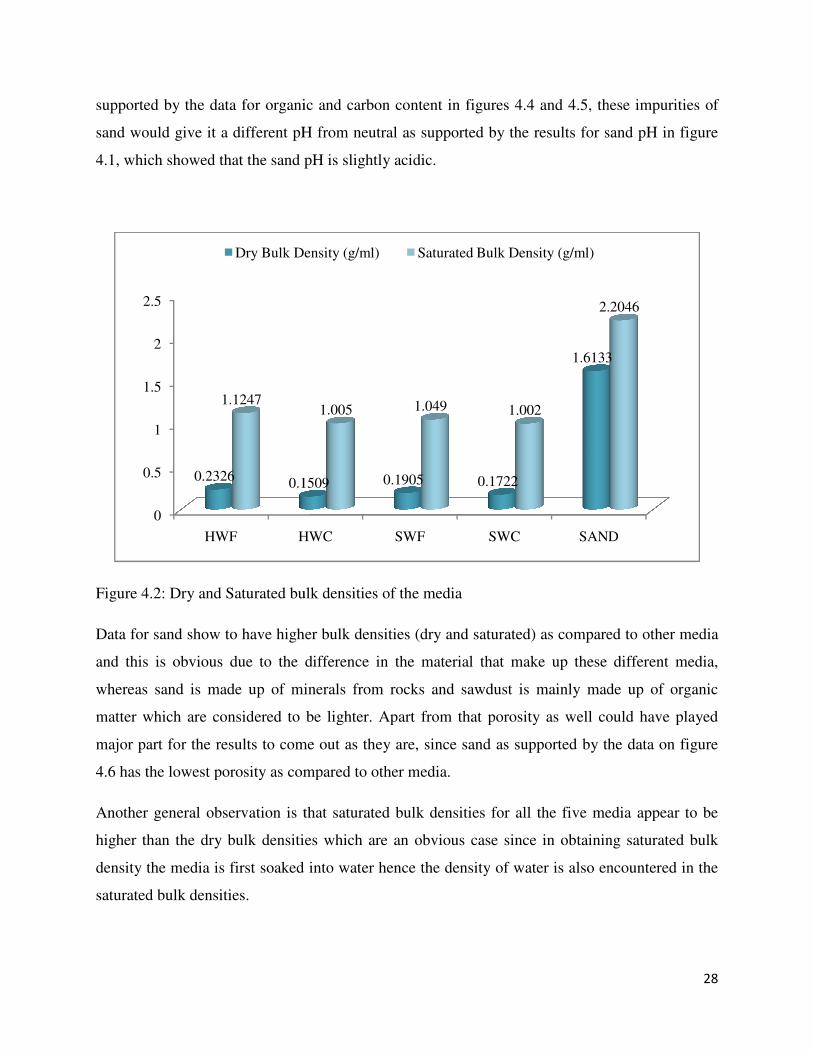
Figure 4.2: Dry and Saturated bulk densities of the media
Data for sand show to have higher bulk densities (dry and saturated) as compared to other media
and this is obvious due to the difference in the material that make up these different media,
whereas sand is made up of minerals from rocks and sawdust is mainly made up of organic
matter which are considered to be lighter. Apart from that porosity as well could have played
major part for the results to come out as they are, since sand as supported by the dat
4.6 has the lowest porosity as compared to other media.
Another general observation is that
higher than the dry bulk densities which are an obvious case since in obtaining saturated b
density the media is first soaked into water hence the density of water is also encountered in the
saturated bulk densities.
0
0.5
1
1.5
2
2.5
HWF HWC
0.23260.1509
1.1247
Dry Bulk Density (g/ml)
ported by the data for organic and carbon content in figures 4.4 and 4.5, these impurities of
sand would give it a different pH from neutral as supported by the results for sand pH in figure
4.1, which showed that the sand pH is slightly acidic.
: Dry and Saturated bulk densities of the media
Data for sand show to have higher bulk densities (dry and saturated) as compared to other media
and this is obvious due to the difference in the material that make up these different media,
is made up of minerals from rocks and sawdust is mainly made up of organic
matter which are considered to be lighter. Apart from that porosity as well could have played
major part for the results to come out as they are, since sand as supported by the dat
4.6 has the lowest porosity as compared to other media.
Another general observation is that saturated bulk densities for all the five media appear to be
higher than the dry bulk densities which are an obvious case since in obtaining saturated b
density the media is first soaked into water hence the density of water is also encountered in the
HWC SWF SWC SAND
0.1509 0.1905 0.1722
1.6133
1.005 1.049 1.002
2.2046
Dry Bulk Density (g/ml) Saturated Bulk Density (g/ml)
28
ported by the data for organic and carbon content in figures 4.4 and 4.5, these impurities of
sand would give it a different pH from neutral as supported by the results for sand pH in figure
Data for sand show to have higher bulk densities (dry and saturated) as compared to other media
and this is obvious due to the difference in the material that make up these different media,
is made up of minerals from rocks and sawdust is mainly made up of organic
matter which are considered to be lighter. Apart from that porosity as well could have played
major part for the results to come out as they are, since sand as supported by the data on figure
saturated bulk densities for all the five media appear to be
higher than the dry bulk densities which are an obvious case since in obtaining saturated bulk
density the media is first soaked into water hence the density of water is also encountered in the
SAND
1.6133
2.2046
Densities between HWF and HWC
greater the density of the respective media. It is clear also
greater than that of SWF which is opposite to coarser media, whereas densities for SWC seemed
to be greater than that for HWC.
two common species encountered in this study is an obvious case since as their name suggest
hardwood is harder than softwood hence denser than softwood although this is not always th
case since there are some hardwood that are softer than softwoods and there are as well other
softwood that are harder than hardwoods as supported by (Hoadley, 2000). Thus for the fact that
SWC appeared to be greater than that for HWC could be due t
HWC media in the vessels during measurement.
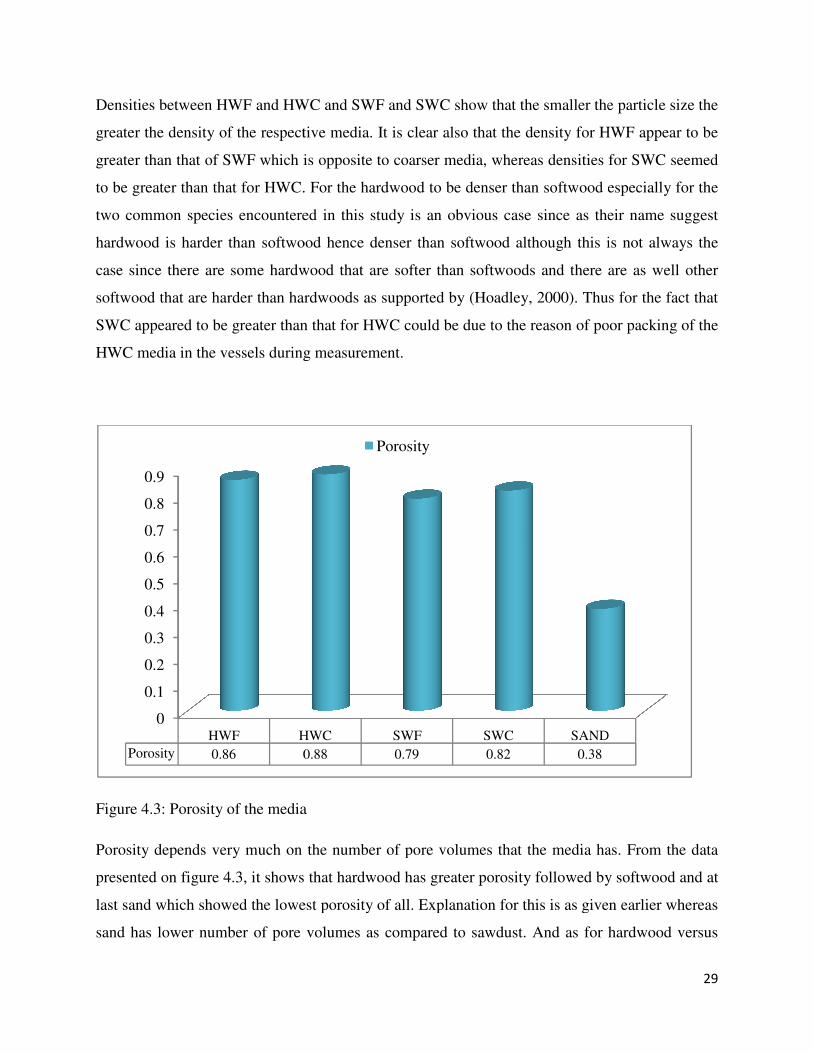
Figure 4.3: Porosity of the media
Porosity depends very much on the number of pore volumes that the media has. From the data
presented on figure 4.3, it shows that hardwood
last sand which showed the lowest porosity of all. Explanation for this is as given earlier whereas
sand has lower number of pore volumes as compared to sawdust. And as for hardwood versus
0
0.1
0.2
0.3
0.4
0.5
0.6
0.7
0.8
0.9
HWF HWC
Porosity 0.86 0.88
HWF and HWC and SWF and SWC show that the smaller the particle size the
greater the density of the respective media. It is clear also that the density for HWF
greater than that of SWF which is opposite to coarser media, whereas densities for SWC seemed
WC. For the hardwood to be denser than softwood especially for the
two common species encountered in this study is an obvious case since as their name suggest
hardwood is harder than softwood hence denser than softwood although this is not always th
hardwood that are softer than softwoods and there are as well other
softwood that are harder than hardwoods as supported by (Hoadley, 2000). Thus for the fact that
SWC appeared to be greater than that for HWC could be due to the reason of poor packing of the
HWC media in the vessels during measurement.
: Porosity of the media
Porosity depends very much on the number of pore volumes that the media has. From the data
presented on figure 4.3, it shows that hardwood has greater porosity followed by softwood and at
last sand which showed the lowest porosity of all. Explanation for this is as given earlier whereas
sand has lower number of pore volumes as compared to sawdust. And as for hardwood versus
HWC SWF SWC SAND
0.88 0.79 0.82 0.38
Porosity
29
that the smaller the particle size the
density for HWF appear to be
greater than that of SWF which is opposite to coarser media, whereas densities for SWC seemed
For the hardwood to be denser than softwood especially for the
two common species encountered in this study is an obvious case since as their name suggest
hardwood is harder than softwood hence denser than softwood although this is not always the
hardwood that are softer than softwoods and there are as well other
softwood that are harder than hardwoods as supported by (Hoadley, 2000). Thus for the fact that
reason of poor packing of the
Porosity depends very much on the number of pore volumes that the media has. From the data
has greater porosity followed by softwood and at
last sand which showed the lowest porosity of all. Explanation for this is as given earlier whereas
sand has lower number of pore volumes as compared to sawdust. And as for hardwood versus
SAND
softwood, softwood lack vessel elements for water transport that hardwood has thus these vessels
manifest in hardwoods as pores
than softwood.
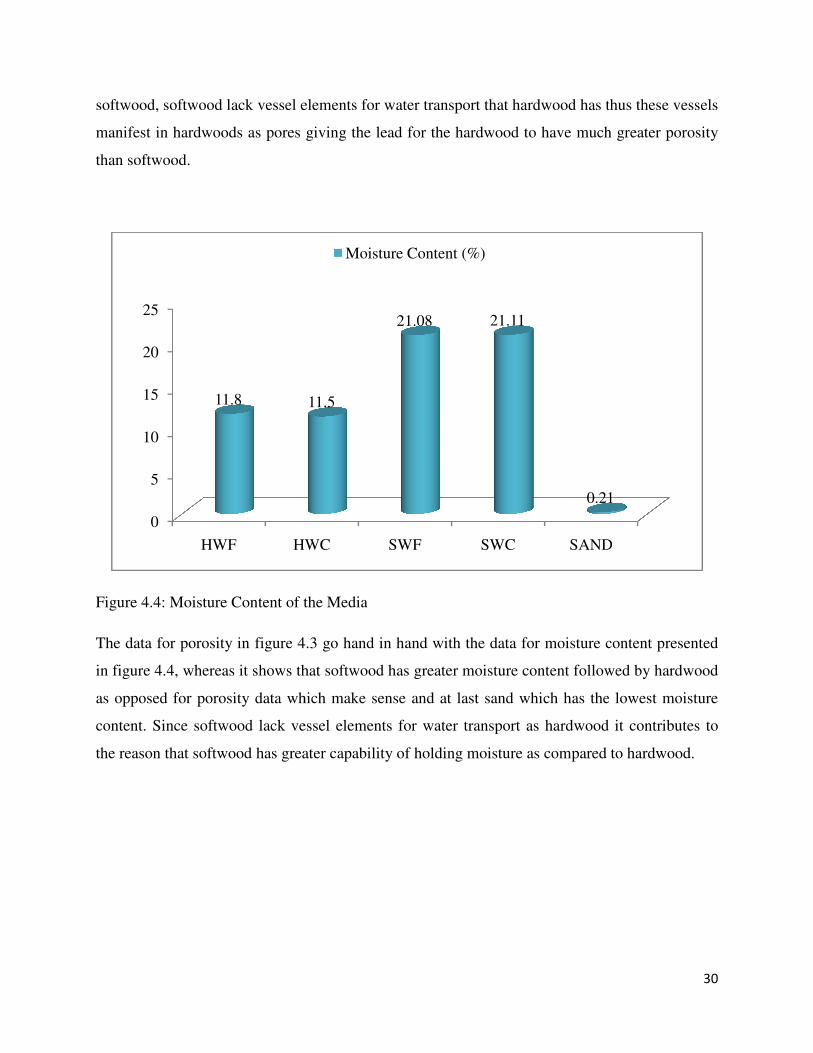
Figure 4.4: Moisture Content of the Media
The data for porosity in figure 4.3 go hand in hand with the data for moisture content presented
in figure 4.4, whereas it shows that softwood has greater moisture content followed by hardwood
as opposed for porosity data which make sense
content. Since softwood lack vessel elements for water transport as hardwood it contributes to
the reason that softwood has greater capability of holding moisture as compared to
0
5
10
15
20
25
HWF HWC
11.8
d lack vessel elements for water transport that hardwood has thus these vessels
giving the lead for the hardwood to have much greater porosity
: Moisture Content of the Media
porosity in figure 4.3 go hand in hand with the data for moisture content presented
in figure 4.4, whereas it shows that softwood has greater moisture content followed by hardwood
which make sense and at last sand which has the
Since softwood lack vessel elements for water transport as hardwood it contributes to
the reason that softwood has greater capability of holding moisture as compared to
HWC SWF SWC SAND
11.5
21.08 21.11
0.21
Moisture Content (%)
30
d lack vessel elements for water transport that hardwood has thus these vessels
giving the lead for the hardwood to have much greater porosity
porosity in figure 4.3 go hand in hand with the data for moisture content presented
in figure 4.4, whereas it shows that softwood has greater moisture content followed by hardwood
and at last sand which has the lowest moisture
Since softwood lack vessel elements for water transport as hardwood it contributes to
the reason that softwood has greater capability of holding moisture as compared to hardwood.
SAND
0.21

Figure 4.5: Organic Content of the Media
Figure 4.6: Carbon Content of the Media
0
20
40
60
80
100
HWF HWC
99.108
0
10
20
30
40
50
60
HWF HWC
55.06 55.11
: Organic Content of the Media
Content of the Media
HWC SWF SWC SAND
99.198 99.612 98.748
0.306
Organic Content (%)
HWC SWF SWC SAND
55.11 55.34 54.86
0.17
Carbon Content (%)
31
SAND
0.306
SAND
0.17
32
The data for Organic content presented in figure 4.5 go hand in hand with the data for carbon
content presented in figure 4.6 since carbon content depends on organic content. Thus it is
observed that sawdust has greater organic and carbon content compared to sand. Sand is an
inorganic substance and hence it is not expected to have organic content but small organic
content obtained could be due to contamination of the sand from dead plants and animals found
in the river where it was collected from. On the other hand sawdust which originate from wood is
expected to have greater organic/carbon content since wood is an organic material made of
cellulose, hemicelluloses and lignin.
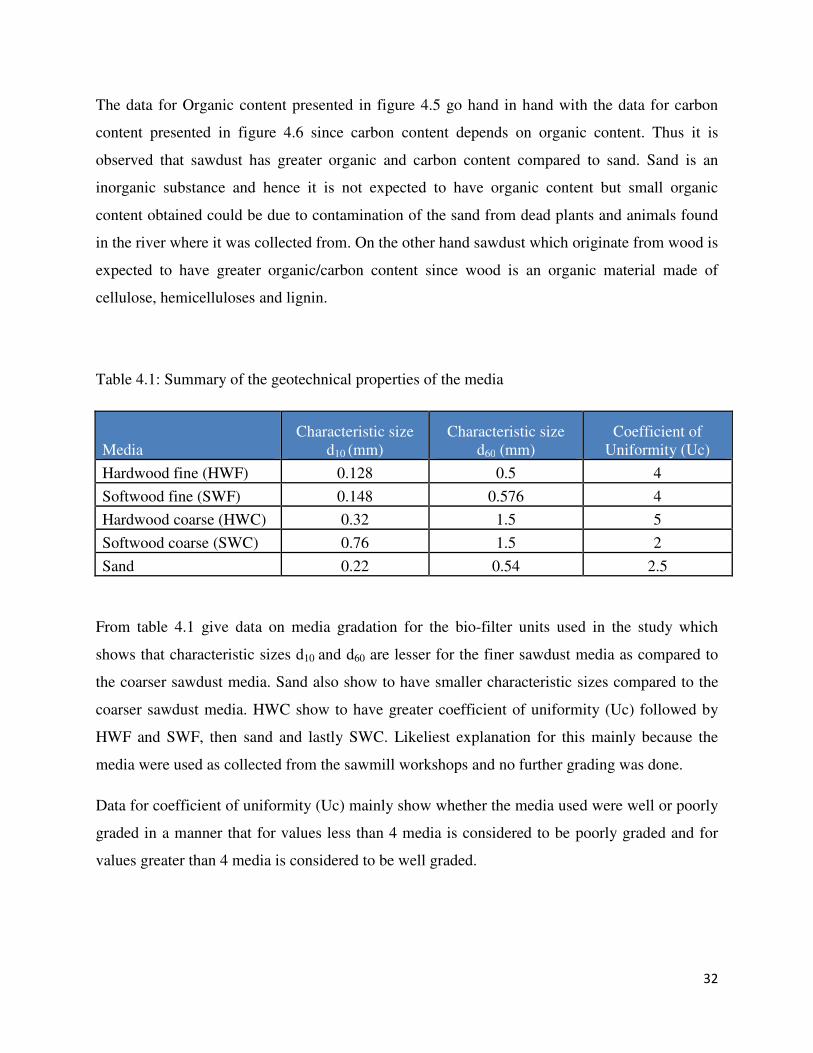
Table 4.1: Summary of the geotechnical properties of the media
Media
Characteristic size
d10 (mm)
Characteristic size
d60 (mm)
Coefficient of
Uniformity (Uc)
Hardwood fine (HWF) 0.128 0.5 4
Softwood fine (SWF) 0.148 0.576 4
Hardwood coarse (HWC) 0.32 1.5 5
Softwood coarse (SWC) 0.76 1.5 2
Sand 0.22 0.54 2.5
From table 4.1 give data on media gradation for the bio-filter units used in the study which
shows that characteristic sizes d10 and d60 are lesser for the finer sawdust media as compared to
the coarser sawdust media. Sand also show to have smaller characteristic sizes compared to the
coarser sawdust media. HWC show to have greater coefficient of uniformity (Uc) followed by
HWF and SWF, then sand and lastly SWC. Likeliest explanation for this mainly because the
media were used as collected from the sawmill workshops and no further grading was done.
Data for coefficient of uniformity (Uc) mainly show whether the media used were well or poorly
graded in a manner that for values less than 4 media is considered to be poorly graded and for
values greater than 4 media is considered to be well graded.
33
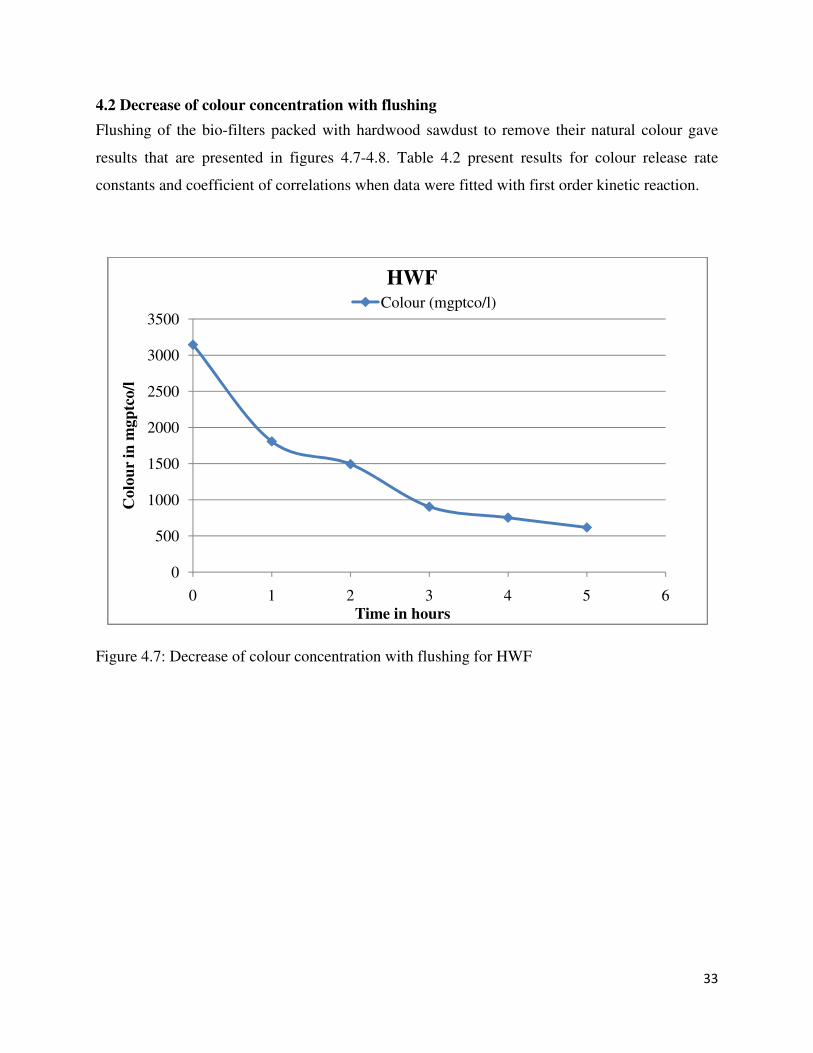
4.2 Decrease of colour concentration with flushing
Flushing of the bio-filters packed with hardwood sawdust to remove their natural colour gave
results that are presented in figures 4.7-4.8. Table 4.2 present results for colour release rate
constants and coefficient of correlations when data were fitted with first order kinetic reaction.
Figure 4.7: Decrease of colour concentration with flushing for HWF
0
500
1000
1500
2000
2500
3000
3500
0 1 2 3 4 5 6
Colo
ur
in m
gp
tco/l
Time in hours
HWFColour (mgptco/l)
34
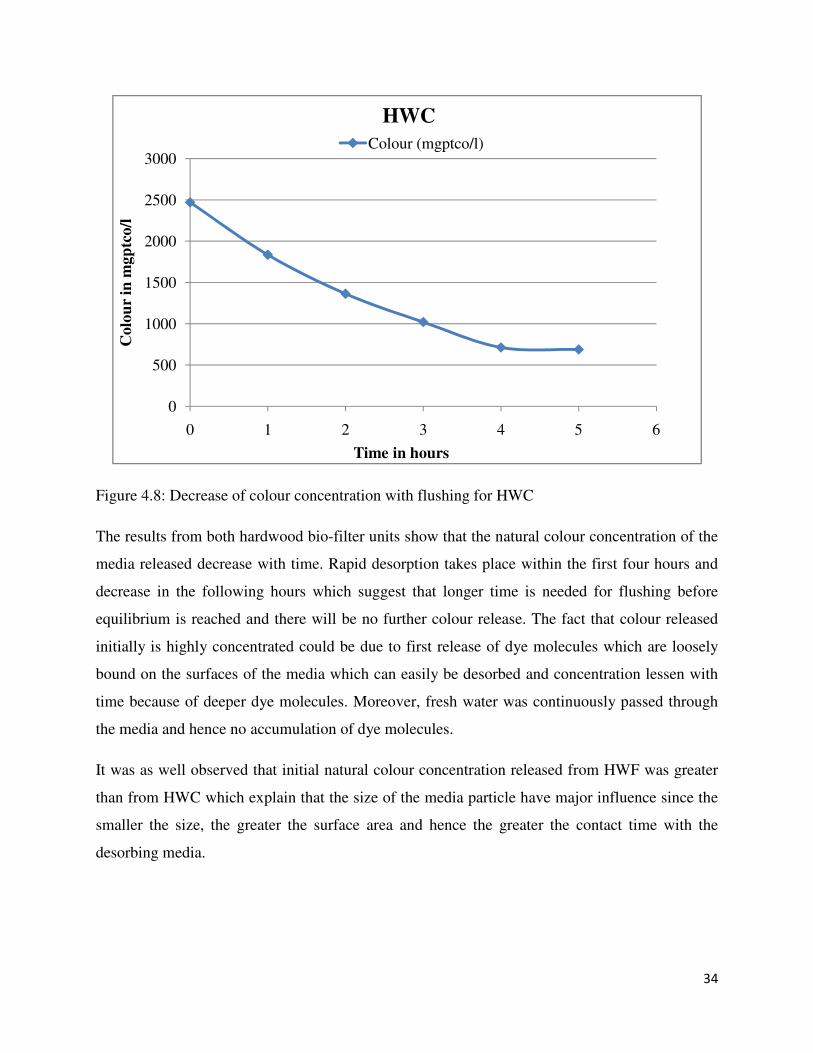
Figure 4.8: Decrease of colour concentration with flushing for HWC
The results from both hardwood bio-filter units show that the natural colour concentration of the
media released decrease with time. Rapid desorption takes place within the first four hours and
decrease in the following hours which suggest that longer time is needed for flushing before
equilibrium is reached and there will be no further colour release. The fact that colour released
initially is highly concentrated could be due to first release of dye molecules which are loosely
bound on the surfaces of the media which can easily be desorbed and concentration lessen with
time because of deeper dye molecules. Moreover, fresh water was continuously passed through
the media and hence no accumulation of dye molecules.
It was as well observed that initial natural colour concentration released from HWF was greater
than from HWC which explain that the size of the media particle have major influence since the
smaller the size, the greater the surface area and hence the greater the contact time with the
desorbing media.
0
500
1000
1500
2000
2500
3000
0 1 2 3 4 5 6
Colo
ur
in m
gp
tco/l
Time in hours
HWC
Colour (mgptco/l)
35
Table 4.2: Temporal natural colour release rate constants for Hardwood media
Media k (hr-1
) R2
HWF 0.3218 0.9662
HWC 0.2719 0.9769
Temporal colour release rate constants obtained from the flushing experiment for hardwood as
presented in table 4.2 shows that HWF has higher colour release rate constant as compared to
HWC. This signifies the reason mentioned earlier that the smaller the particle size the greater the
surface area and hence the greater the contact time with the desorbing media. This supports the
observation that HWF although having greater initial colour released than HWC but still it was
able to be reduced to the concentration lower than that of HWC.
4.3 Performance of the bio-filter units with respect to dye-removal
Colour Removal Variation along the Bio-filter Column
Figures 4.9 - 4.12 present results for colour removal with height from the bio-filter bottom. The
variation was observed on different days, day 1, day 4, day 7, day 11 and day 15.
36
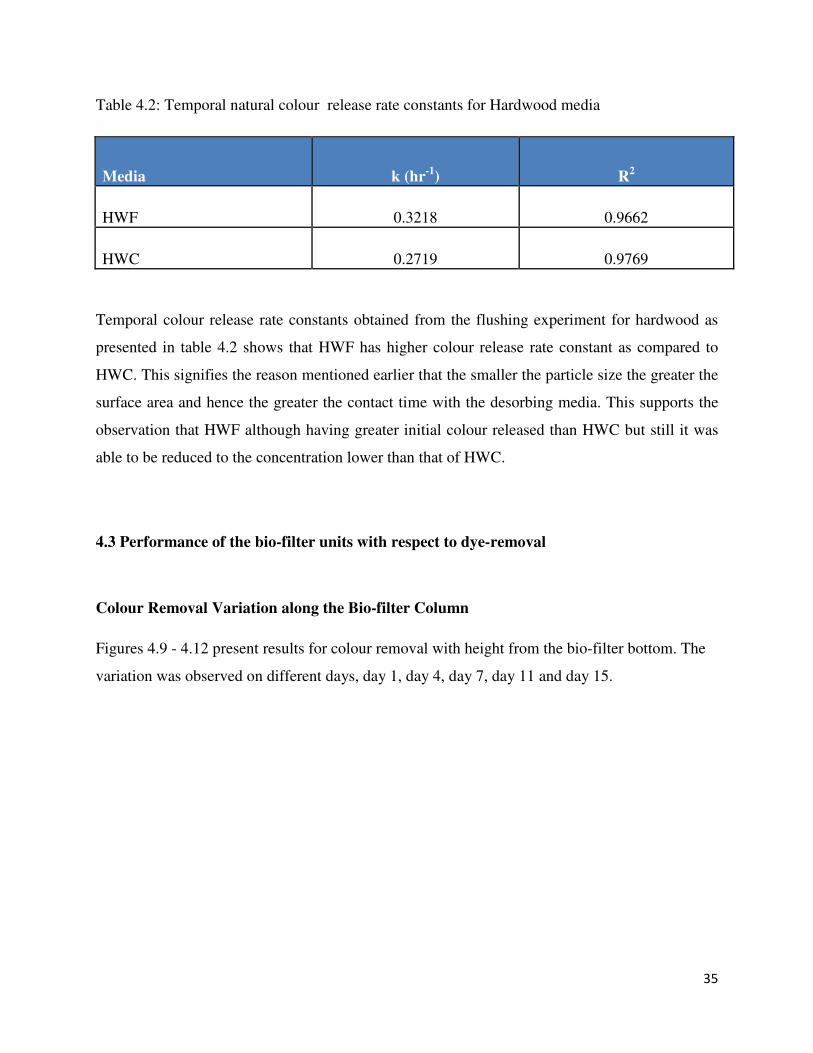
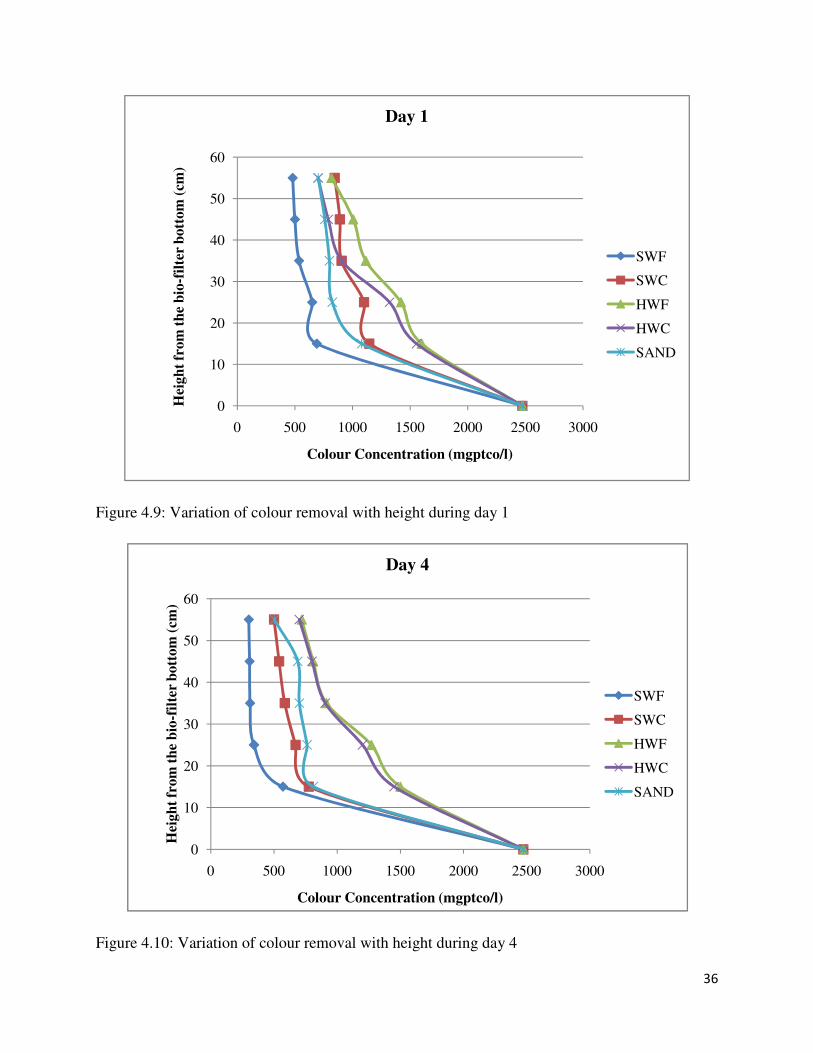
Figure 4.9: Variation of colour removal with height during day 1
Figure 4.10: Variation of colour removal with height during day 4
0
10
20
30
40
50
60
0 500 1000 1500 2000 2500 3000
Hei
gh
t fr
om
th
e b
io-f
ilte
r b
ott
om
(cm
)
Colour Concentration (mgptco/l)
Day 1
SWF
SWC
HWF
HWC
SAND
0
10
20
30
40
50
60
0 500 1000 1500 2000 2500 3000
Hei
gh
t fr
om
th
e b
io-f
ilte
r b
ott
om
(cm
)
Colour Concentration (mgptco/l)
Day 4
SWF
SWC
HWF
HWC
SAND
37
Figure 4.11: Variation of colour removal with height during day 11
Figure 4.12: Variation of colour removal with height during day 15
0
10
20
30
40
50
60
0 500 1000 1500 2000 2500 3000
Hei
gh
t fr
om
th
e b
io-f
ilte
r b
ott
om
(cm
)
Colour Concentration (mgptco/l)
Day 11
SWF
SWC
HWF
HWC
SAND
0
10
20
30
40
50
60
0 500 1000 1500 2000 2500 3000
Hei
gh
t fr
om
th
e b
io-f
ilte
r b
ott
om
(cm
)
Colour Concentration (mgptco/l)
Day 15
SWF
SWC
HWF
HWC
SAND
38
It was observed that in all the days from different weeks the amount of colour removed along the
column increased with the increase in height from the bio-filter bottom for all the five bio-filter
units, Moreover, it shows that there is a remarkable colour removal between the inlet and the first
sampling point, a distance of 15 cm and thereafter less or constant removal was observed in the
above sampling points. This is likeliest due to the fact that the bio-filter units operate under
continuous flow and since the removal mechanisms mostly depend on the contact time with the
media and hence the water is constantly finding its way onto new pockets at the entrance (lower
part) allowing more contact time with the media as compared to the upper part where contact
time with the media is less.
The general trend from figures 4.9-4.12 also shows that, the bio-filter unit packed with SWF
media was able to remove colour to much lower concentrations as compared to all other media
and the bio-filter packed with HWF media showed lower colour removal. It is also being
observed that despite the fact that sand is an inorganic substance and not much colour removal is
expected from it, but yet remarkable colour removal is observed during all the comparable days
as compared to other sawdust media such as hardwood sawdust media and some days such as
represented on figure 4.9 and figures 4.11- 4.12 where sand media seem to out run and perform
as close as SWC respectively.
Softwood versus Hardwood Sawdust Media
From such an observation put forward in figures 4.9-4.12, it clearly show that bio-filter packed
with softwood sawdust media removed colour to much lower concentrations as compared to
hardwood and this can mainly be supported by the fact that hardwood from flushing experiment
was observed that it desorbs its own natural media colour and since during the preparation of the
media by flushing, was not carried on to a point where no further colour release was reached has
might have contributed into adding colour to the effluent and hence poor performance as
compared to the softwood sawdust media.
39
Fine versus Coarse Softwood Sawdust Media
It was as well observed that bio-filter unit packed with SWF removed colour to much lower
concentrations than that packed with SWC in which this is likeliest influenced by the particle
size of the two media where as the smaller the size the greater the surface area and contact time
available for colour removal mechanisms.
Fine versus Coarse Hardwood Sawdust Media
Bio-filter unit packed with HWC was observed to remove colour to much lower concentrations
than that packed with HWF which is an opposite case to bio-filters packed with SWF and SWC
media, where the fine showed to be more efficient than the coarse. As for this case it can likely
be explained that since HWF from the flushing experiment showed to desorb more colour than
HWC due to the effect of its particle size, hence this might have contributed to such results.
Sand Media
The control media, sand showed remarkable colour removal than expected. This is unsurprising
since its performance could be much influenced by contamination with organic matter as
supported by the data for organic content of the sand media discussed earlier hence degradation
takes place in sand as well. Apart from that it could also be influenced by characteristic sizes d10
and d60 which improve its other physical-chemical treatment attributes such as filtration.
Colour removal with maturity of the bio-filter
Results for variation of colour removal at a specific sampling point with maturity of the bio-filter
units are presented in figure 4.13 for all the five bio-filter units. Taken as a representative
observation at the uppermost sampling point.
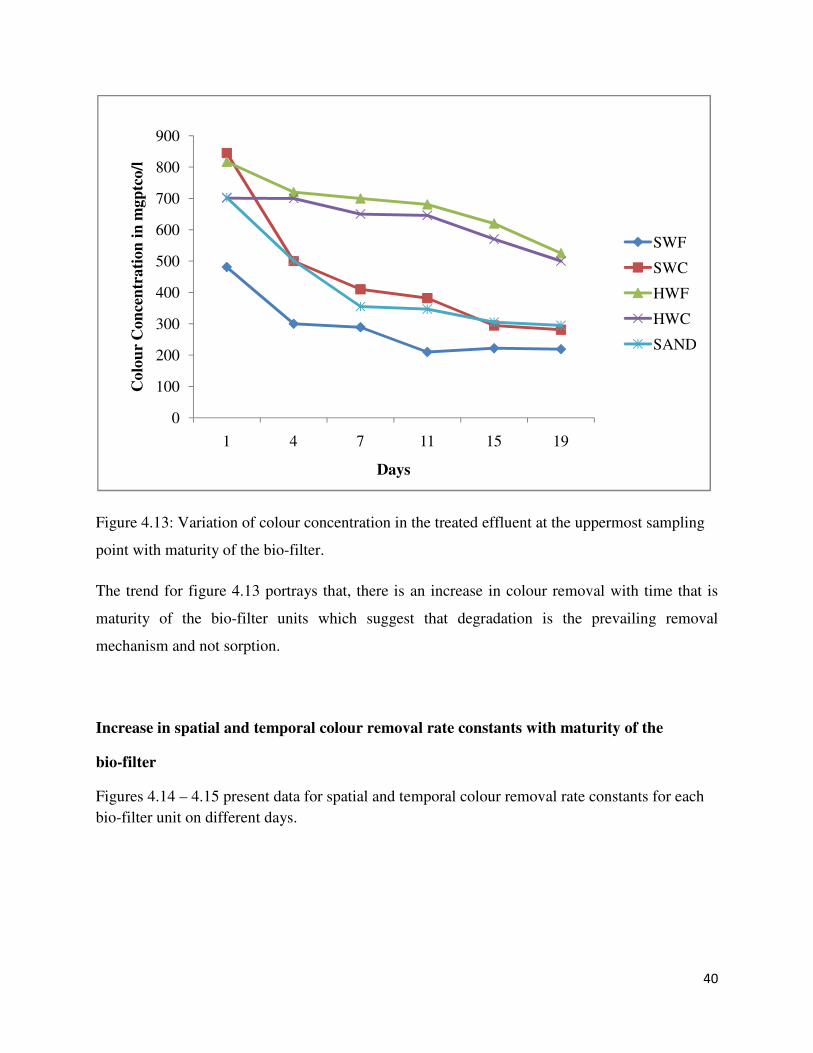
40
Figure 4.13: Variation of colour concentration in the treated effluent at the uppermost sampling
point with maturity of the bio-filter.
The trend for figure 4.13 portrays that, there is an increase in colour removal with time that is
maturity of the bio-filter units which suggest that degradation is the prevailing removal
mechanism and not sorption.
Increase in spatial and temporal colour removal rate constants with maturity of the
bio-filter
Figures 4.14 – 4.15 present data for spatial and temporal colour removal rate constants for each
bio-filter unit on different days.
0
100
200
300
400
500
600
700
800
900
1 4 7 11 15 19
Colo
ur
Con
cen
trati
on
in
mgp
tco/l
Days
SWF
SWC
HWF
HWC
SAND
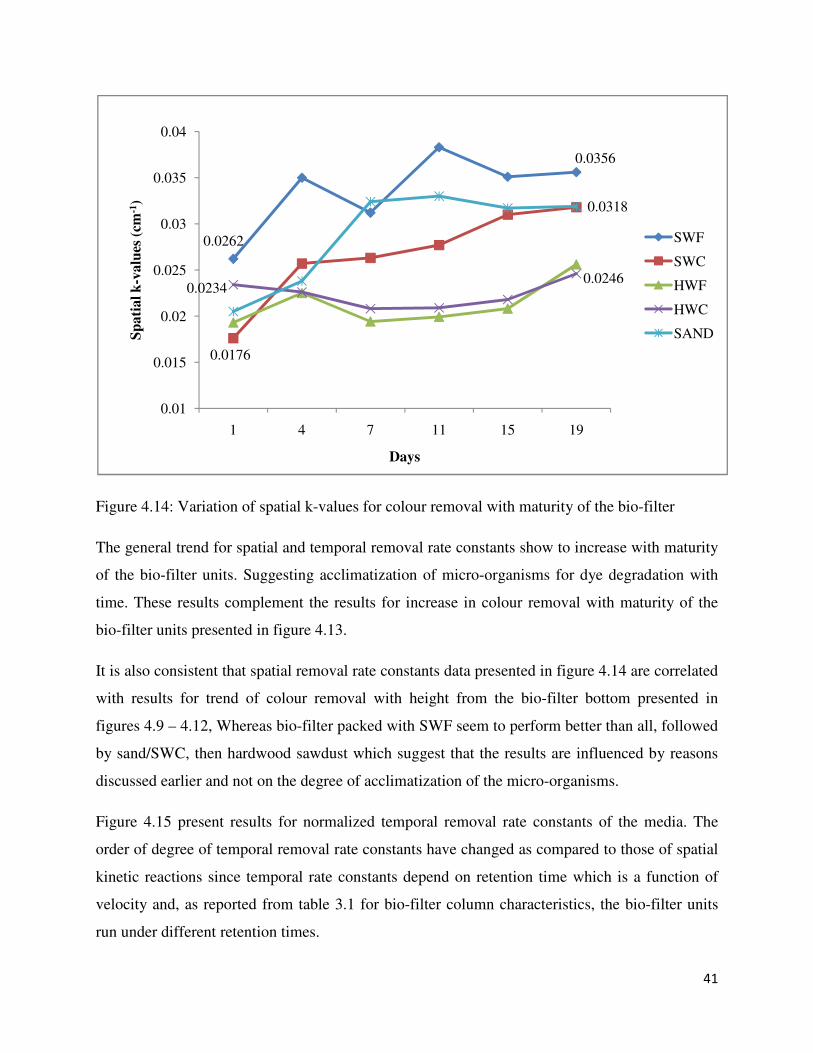
41
Figure 4.14: Variation of spatial k-values for colour removal with maturity of the bio-filter
The general trend for spatial and temporal removal rate constants show to increase with maturity
of the bio-filter units. Suggesting acclimatization of micro-organisms for dye degradation with
time. These results complement the results for increase in colour removal with maturity of the
bio-filter units presented in figure 4.13.
It is also consistent that spatial removal rate constants data presented in figure 4.14 are correlated
with results for trend of colour removal with height from the bio-filter bottom presented in
figures 4.9 – 4.12, Whereas bio-filter packed with SWF seem to perform better than all, followed
by sand/SWC, then hardwood sawdust which suggest that the results are influenced by reasons
discussed earlier and not on the degree of acclimatization of the micro-organisms.
Figure 4.15 present results for normalized temporal removal rate constants of the media. The
order of degree of temporal removal rate constants have changed as compared to those of spatial
kinetic reactions since temporal rate constants depend on retention time which is a function of
velocity and, as reported from table 3.1 for bio-filter column characteristics, the bio-filter units
run under different retention times.
0.0262
0.0356
0.0176
0.0318
0.02340.0246
0.01
0.015
0.02
0.025
0.03
0.035
0.04
1 4 7 11 15 19
Sp
ati
al k
-va
lues
(cm
-1)
Days
SWF
SWC
HWF
HWC
SAND
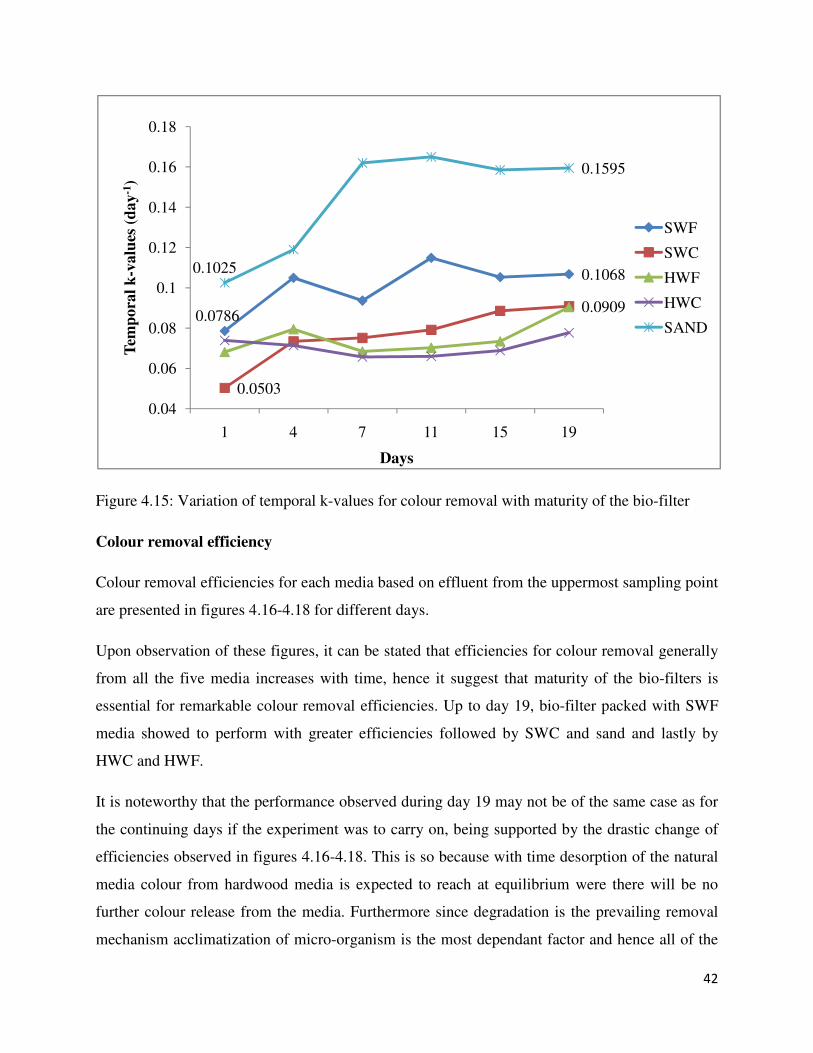
42
Figure 4.15: Variation of temporal k-values for colour removal with maturity of the bio-filter
Colour removal efficiency
Colour removal efficiencies for each media based on effluent from the uppermost sampling point
are presented in figures 4.16-4.18 for different days.
Upon observation of these figures, it can be stated that efficiencies for colour removal generally
from all the five media increases with time, hence it suggest that maturity of the bio-filters is
essential for remarkable colour removal efficiencies. Up to day 19, bio-filter packed with SWF
media showed to perform with greater efficiencies followed by SWC and sand and lastly by
HWC and HWF.
It is noteworthy that the performance observed during day 19 may not be of the same case as for
the continuing days if the experiment was to carry on, being supported by the drastic change of
efficiencies observed in figures 4.16-4.18. This is so because with time desorption of the natural
media colour from hardwood media is expected to reach at equilibrium were there will be no
further colour release from the media. Furthermore since degradation is the prevailing removal
mechanism acclimatization of micro-organism is the most dependant factor and hence all of the
0.0786
0.1068
0.0503
0.0909
0.1025
0.1595
0.04
0.06
0.08
0.1
0.12
0.14
0.16
0.18
1 4 7 11 15 19
Tem
pora
l k
-valu
es (
day
-1)
Days
SWF
SWC
HWF
HWC
SAND
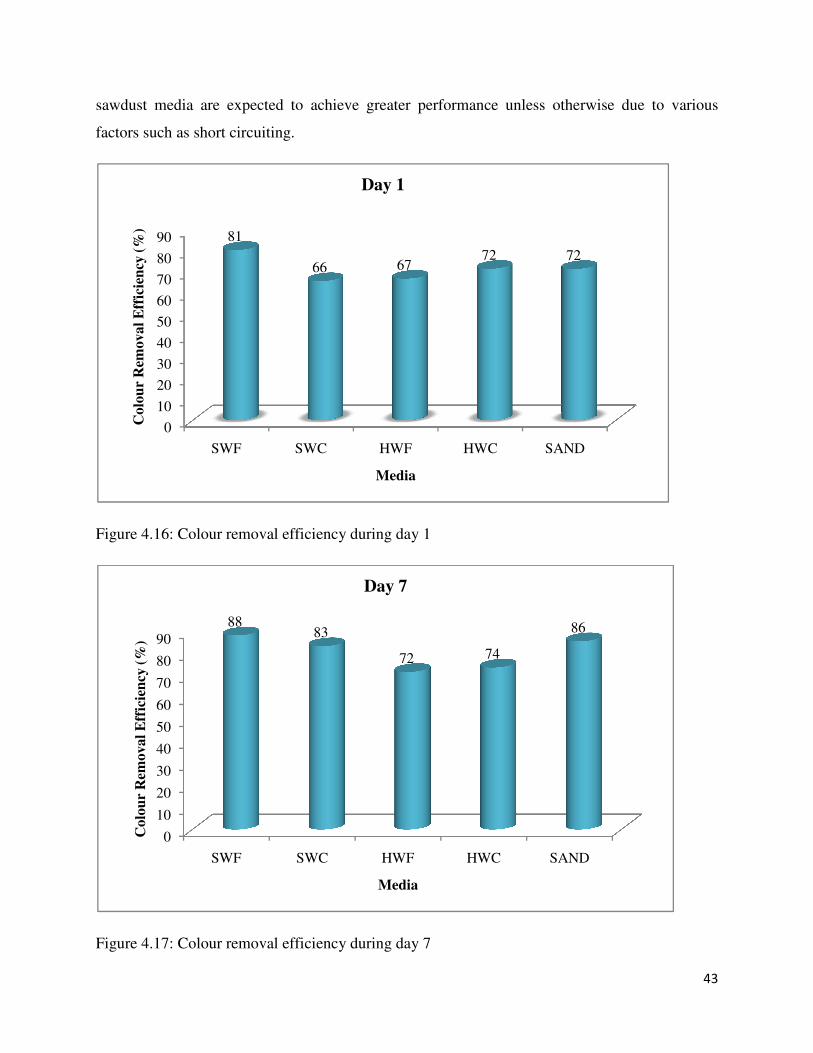
sawdust media are expected to achieve greater performance unless otherwise due to various
factors such as short circuiting.
Figure 4.16: Colour removal efficiency during day 1
Figure 4.17: Colour removal efficiency during day
0
10
20
30
40
50
60
70
80
90
SWF SWC
81
Colo
ur
Rem
ov
al
Eff
icie
ncy
(%
)
0
10
20
30
40
50
60
70
80
90
SWF SWC
88
Co
lou
r R
emo
va
l E
ffic
ien
cy (
%)
sawdust media are expected to achieve greater performance unless otherwise due to various
: Colour removal efficiency during day 1
Colour removal efficiency during day 7
SWC HWF HWC SAND
66 6772 72
Media
Day 1
SWC HWF HWC SAND
83
72 74
86
Media
Day 7
43
sawdust media are expected to achieve greater performance unless otherwise due to various
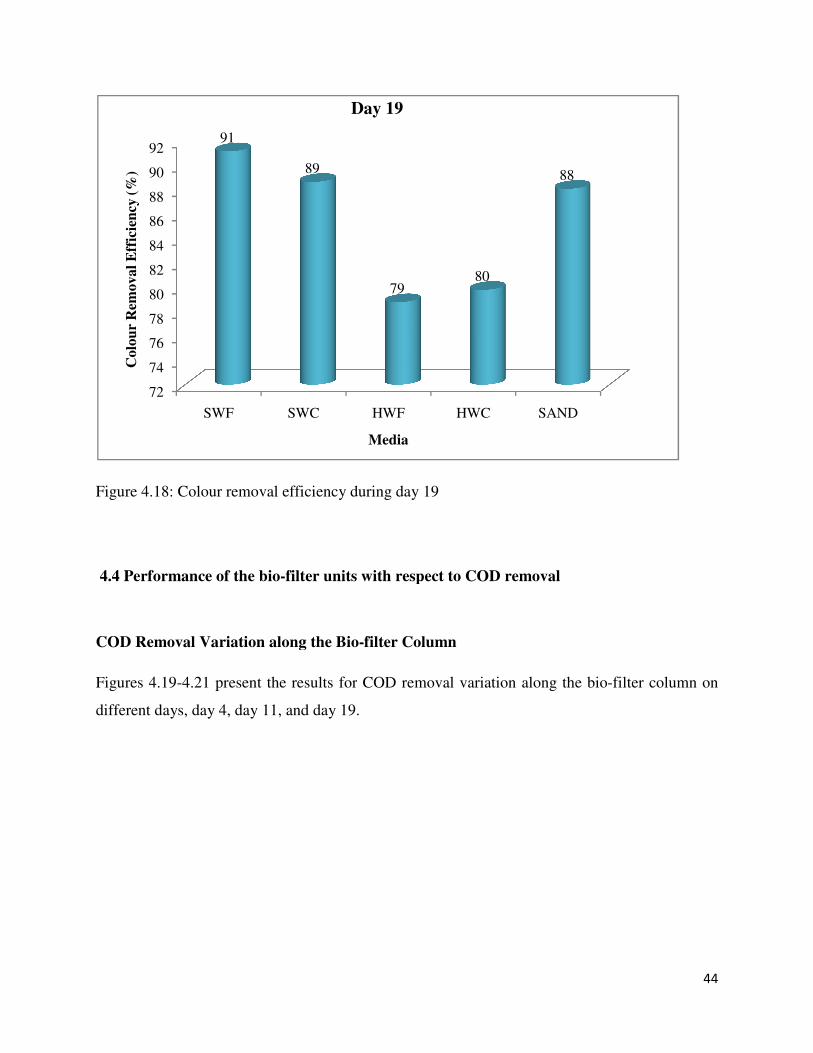
Figure 4.18: Colour removal efficiency during day 19
4.4 Performance of the bio-filter units with respect to COD removal
COD Removal Variation along the Bio
Figures 4.19-4.21 present the results for
different days, day 4, day 11, and day 19.
72
74
76
78
80
82
84
86
88
90
92
SWF SWC
91C
olo
ur
Rem
ov
al
Eff
icie
ncy
(%
)
: Colour removal efficiency during day 19
filter units with respect to COD removal
COD Removal Variation along the Bio-filter Column
4.21 present the results for COD removal variation along the bio-
different days, day 4, day 11, and day 19.
SWC HWF HWC SAND
89
7980
88
Media
Day 19
44
-filter column on
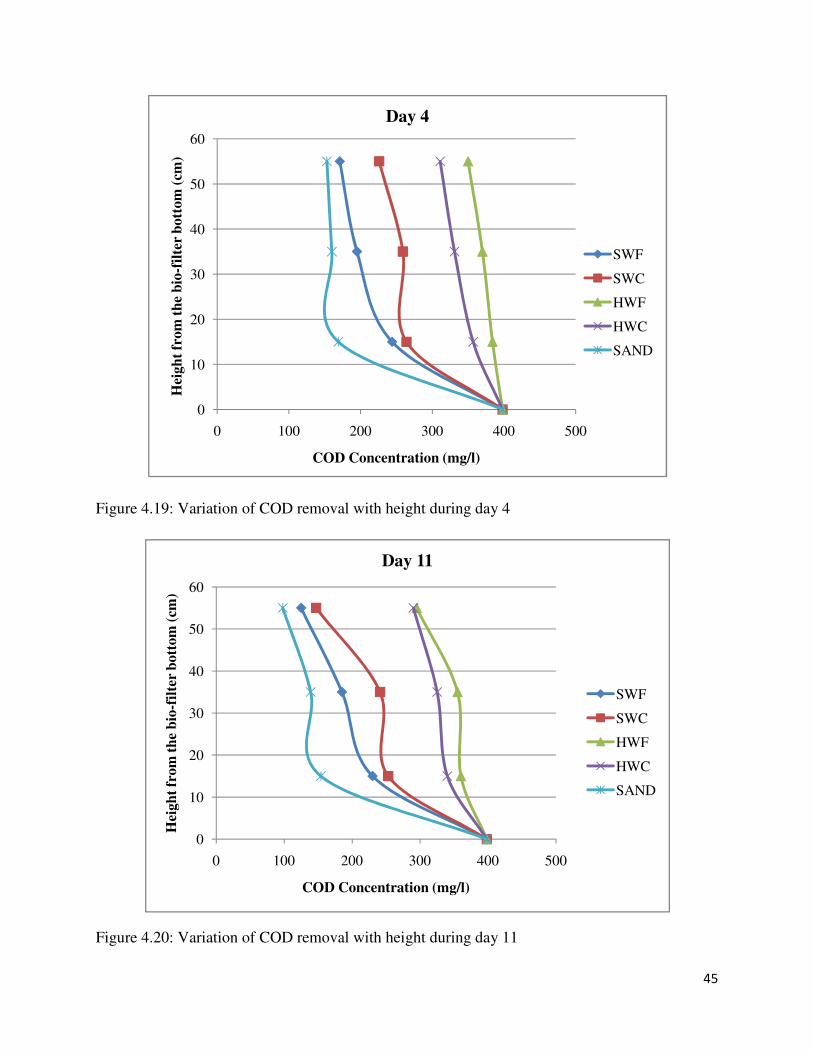
45
Figure 4.19: Variation of COD removal with height during day 4
Figure 4.20: Variation of COD removal with height during day 11
0
10
20
30
40
50
60
0 100 200 300 400 500
Hei
gh
t fr
om
th
e b
io-f
ilte
r b
ott
om
(cm
)
COD Concentration (mg/l)
Day 4
SWF
SWC
HWF
HWC
SAND
0
10
20
30
40
50
60
0 100 200 300 400 500
Hei
gh
t fr
om
th
e b
io-f
ilte
r b
ott
om
(cm
)
COD Concentration (mg/l)
Day 11
SWF
SWC
HWF
HWC
SAND
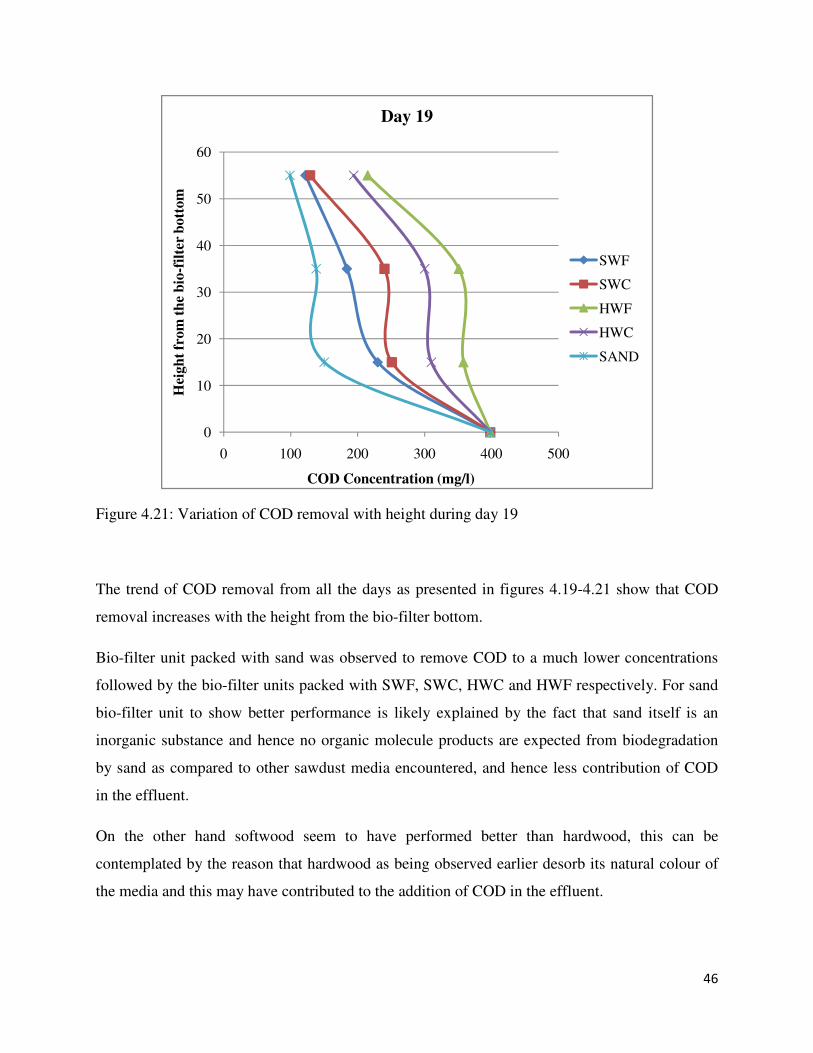
46
Figure 4.21: Variation of COD removal with height during day 19
The trend of COD removal from all the days as presented in figures 4.19-4.21 show that COD
removal increases with the height from the bio-filter bottom.
Bio-filter unit packed with sand was observed to remove COD to a much lower concentrations
followed by the bio-filter units packed with SWF, SWC, HWC and HWF respectively. For sand
bio-filter unit to show better performance is likely explained by the fact that sand itself is an
inorganic substance and hence no organic molecule products are expected from biodegradation
by sand as compared to other sawdust media encountered, and hence less contribution of COD
in the effluent.
On the other hand softwood seem to have performed better than hardwood, this can be
contemplated by the reason that hardwood as being observed earlier desorb its natural colour of
the media and this may have contributed to the addition of COD in the effluent.
0
10
20
30
40
50
60
0 100 200 300 400 500
Hei
gh
t fr
om
th
e b
io-f
ilte
r b
ott
om
COD Concentration (mg/l)
Day 19
SWF
SWC
HWF
HWC
SAND
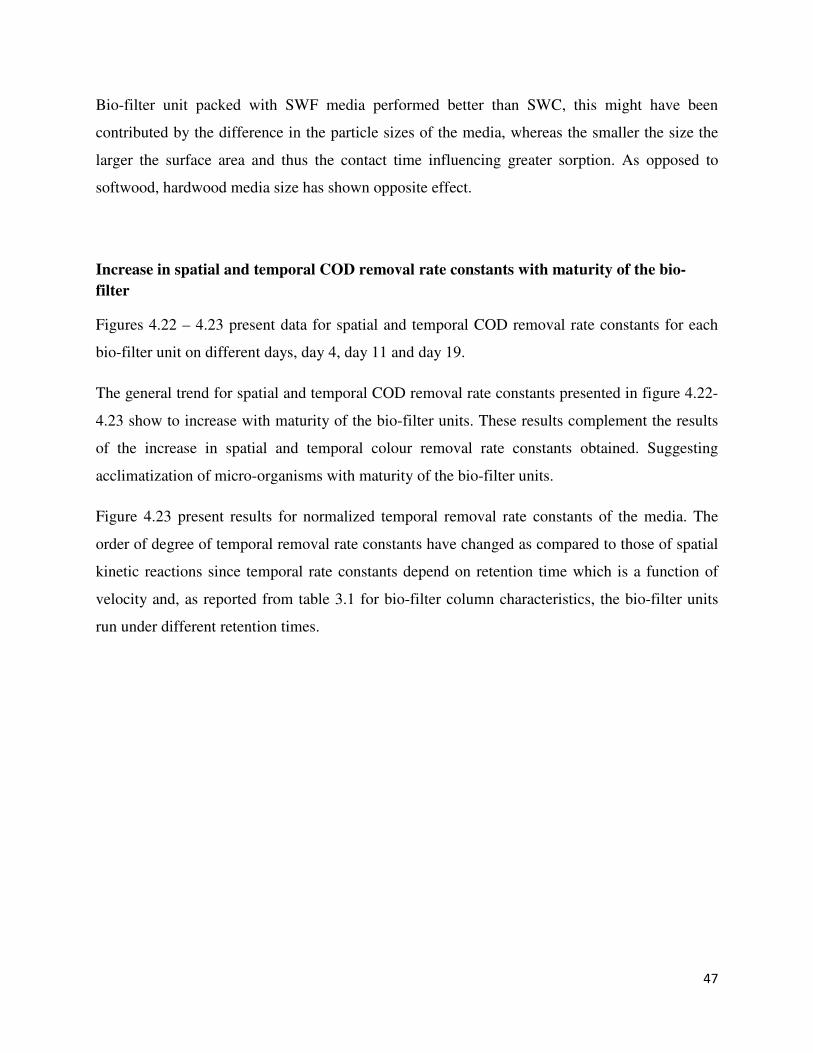
47
Bio-filter unit packed with SWF media performed better than SWC, this might have been
contributed by the difference in the particle sizes of the media, whereas the smaller the size the
larger the surface area and thus the contact time influencing greater sorption. As opposed to
softwood, hardwood media size has shown opposite effect.
Increase in spatial and temporal COD removal rate constants with maturity of the bio-
filter
Figures 4.22 – 4.23 present data for spatial and temporal COD removal rate constants for each
bio-filter unit on different days, day 4, day 11 and day 19.
The general trend for spatial and temporal COD removal rate constants presented in figure 4.22-
4.23 show to increase with maturity of the bio-filter units. These results complement the results
of the increase in spatial and temporal colour removal rate constants obtained. Suggesting
acclimatization of micro-organisms with maturity of the bio-filter units.
Figure 4.23 present results for normalized temporal removal rate constants of the media. The
order of degree of temporal removal rate constants have changed as compared to those of spatial
kinetic reactions since temporal rate constants depend on retention time which is a function of
velocity and, as reported from table 3.1 for bio-filter column characteristics, the bio-filter units
run under different retention times.
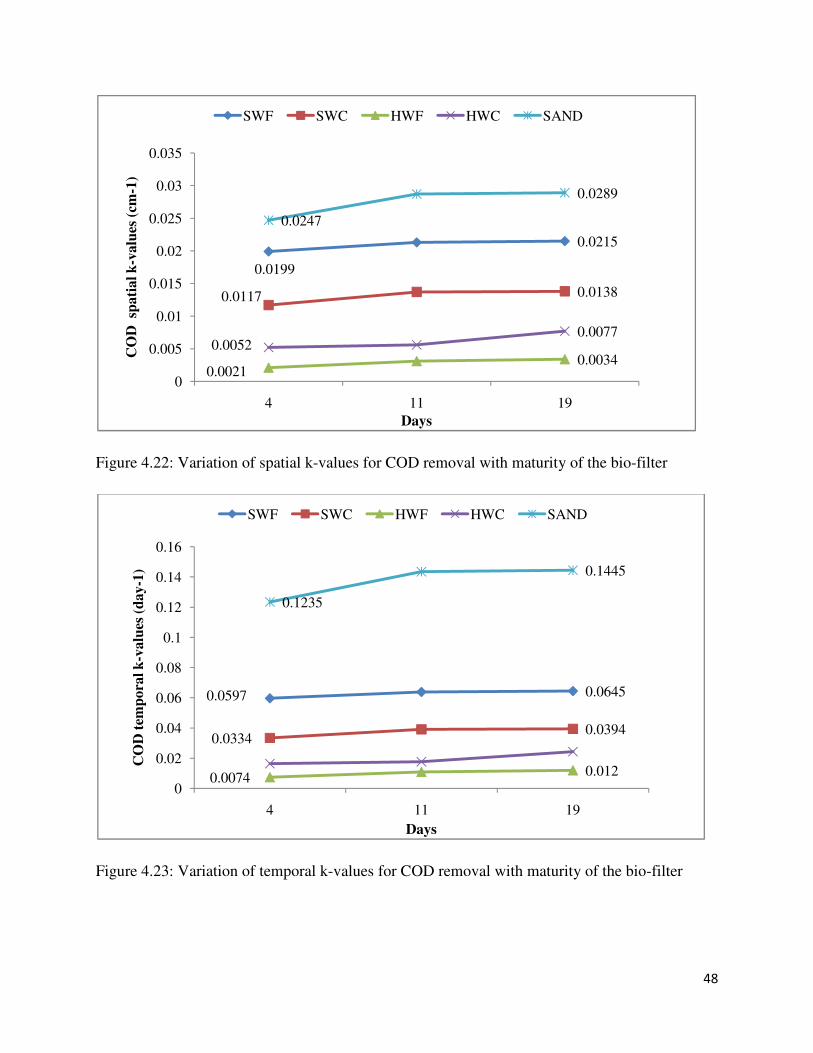
48
Figure 4.22: Variation of spatial k-values for COD removal with maturity of the bio-filter
Figure 4.23: Variation of temporal k-values for COD removal with maturity of the bio-filter
0.0199
0.0215
0.0117 0.0138
0.00210.0034
0.00520.0077
0.0247
0.0289
0
0.005
0.01
0.015
0.02
0.025
0.03
0.035
4 11 19
CO
D sp
ati
al k
-va
lues
(cm
-1)
Days
SWF SWC HWF HWC SAND
0.0597 0.0645
0.03340.0394
0.00740.012
0.1235
0.1445
0
0.02
0.04
0.06
0.08
0.1
0.12
0.14
0.16
4 11 19
CO
D t
emp
ora
l k
-valu
es (
day-1
)
Days
SWF SWC HWF HWC SAND
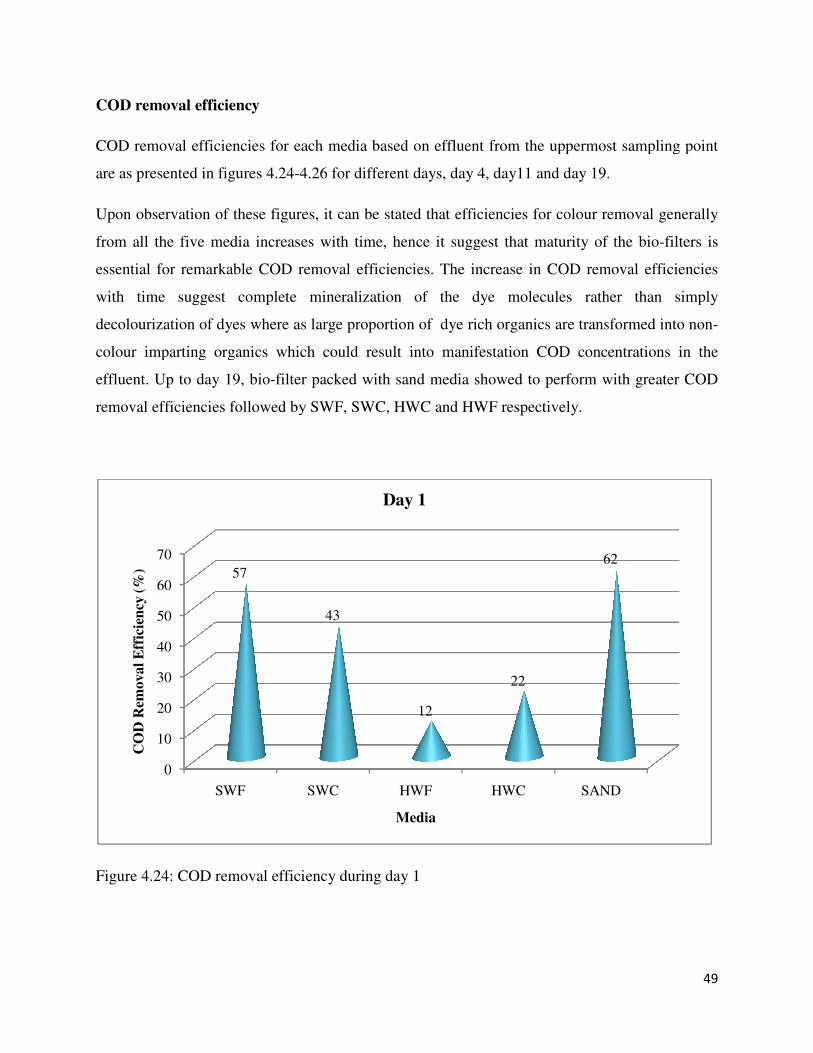
COD removal efficiency
COD removal efficiencies for each media based on effluent from the uppermost sampling point
are as presented in figures 4.24-4.26 for differ
Upon observation of these figures, it can be stated that efficiencies for colour removal generally
from all the five media increases with time, hence it suggest that maturity of the bio
essential for remarkable COD removal
with time suggest complete mineralization of the dye molecules rather than simply
decolourization of dyes where as large proportion of dye rich organics are transformed into non
colour imparting organics which could result
effluent. Up to day 19, bio-filter packed with
removal efficiencies followed by SW
Figure 4.24: COD removal efficiency during d
0
10
20
30
40
50
60
70
SWF
57
CO
D R
emoval
Eff
icie
ncy
(%
)removal efficiencies for each media based on effluent from the uppermost sampling point
4.26 for different days, day 4, day11 and day 19.
Upon observation of these figures, it can be stated that efficiencies for colour removal generally
from all the five media increases with time, hence it suggest that maturity of the bio
COD removal efficiencies. The increase in COD removal efficiencies
with time suggest complete mineralization of the dye molecules rather than simply
decolourization of dyes where as large proportion of dye rich organics are transformed into non
colour imparting organics which could result into manifestation COD concentrations in the
filter packed with sand media showed to perform with greater
efficiencies followed by SWF, SWC, HWC and HWF respectively.
: COD removal efficiency during day 1
SWC HWF HWC SAND
43
12
22
62
Media
Day 1
49
removal efficiencies for each media based on effluent from the uppermost sampling point
ent days, day 4, day11 and day 19.
Upon observation of these figures, it can be stated that efficiencies for colour removal generally
from all the five media increases with time, hence it suggest that maturity of the bio-filters is
ease in COD removal efficiencies
with time suggest complete mineralization of the dye molecules rather than simply
decolourization of dyes where as large proportion of dye rich organics are transformed into non-
into manifestation COD concentrations in the
media showed to perform with greater COD
SAND
62
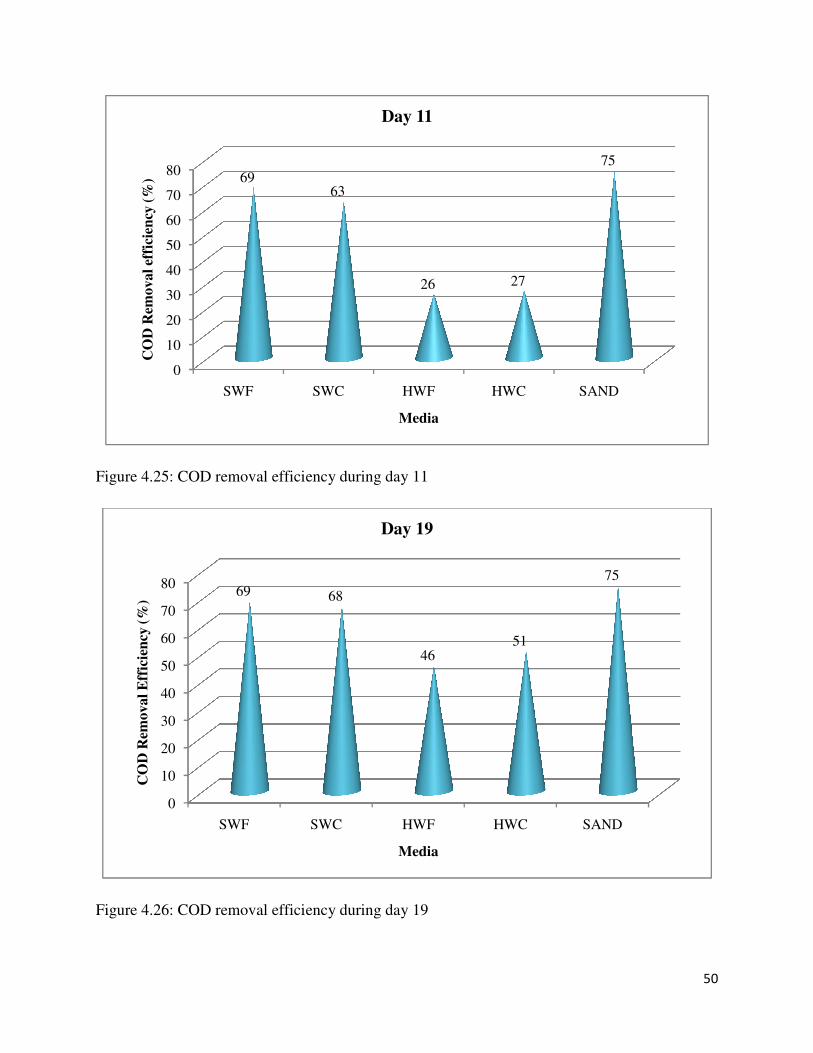
Figure 4.25: COD removal efficiency during day 11
Figure 4.26: COD removal efficiency during day 19
0
10
20
30
40
50
60
70
80
SWF
69
CO
D R
emo
va
l ef
fici
ency
(%
)
0
10
20
30
40
50
60
70
80
SWF
69
CO
D R
emo
val
Eff
icie
ncy
(%
)
emoval efficiency during day 11
: COD removal efficiency during day 19
SWC HWF HWC SAND
63
26 27
75
Media
Day 11
SWC HWF HWC SAND
68
4651
75
Media
Day 19
50
SAND
75
SAND
75
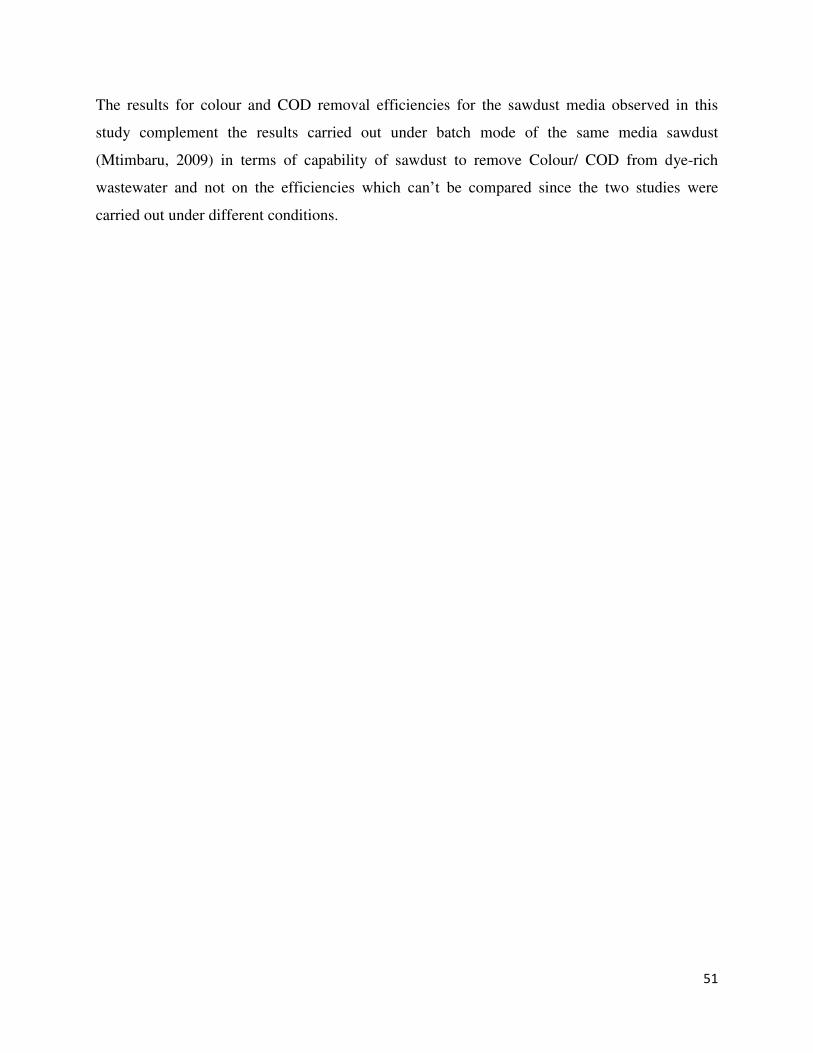
51
The results for colour and COD removal efficiencies for the sawdust media observed in this
study complement the results carried out under batch mode of the same media sawdust
(Mtimbaru, 2009) in terms of capability of sawdust to remove Colour/ COD from dye-rich
wastewater and not on the efficiencies which can’t be compared since the two studies were
carried out under different conditions.
52
CHAPTER FIVE
5.0 CONCLUSION AND RECOMMENDATIONS
5.1 CONCLUSION
Under the operating conditions in which this study was carried out, media used in the bio-
filter units showed good performance in the removal of colour from vat blue dye-rich
wastewater. Based on the results of last day of measurement, colour removal efficiencies
SWF (91%), SWC (89%), Sand (88%), HWC (80%) and HWF (79%) were achieved
where SWF showed to have performed better than the rest.
COD removal treatment performance showed to be higher from sand (75%), followed by
SWF (69%), SWC (68%), HWC (51%) and HWF (46%) in which it can be concluded
that the release of natural media colour affects COD treatment performance.
Removal efficiencies for both colour and COD removal are time dependent that is
efficiencies increase with maturity of the bio-filter units emphasizing that biodegradation
is the prevailing removal mechanism.
Due to remarkable increase in COD removal with time it can be concluded that the dye
molecules undergo complete destruction (mineralization) unlike other studies where dyes
simply undergo decolourization where by large proportion of dye organics are
transformed into non colour imparting organics.
Colour and COD removal along the filter column are height dependent and hence longer
filter columns are expected to perform with greater efficiency.
Limited duration of this study may have influenced the reported results. The fact that
dye-rich wastewater used in this study was synthesized and not true from tie and dye
small scale industry may have affected the results as well along with flow control
challenges.
53
Efficiencies for dye removal in the early days show that there is significant variation in
treatment efficiencies by the different media but with time the media show to have
relative treatment efficiencies concluding that with time all the bio-filter units packed
with sawdust media are expected to perform better with bio-degradation and hence all
can be used as best option.
5.2 RECOMMENDATIONS
• The use of hardwood sawdust as media for dye removal requires flushing off the natural
media colour to an equilibrium point where no further colour release from the media is
expected prior the commencement of the dye removal experiment.
• Follow up studies based on the promising results reported in this study are recommended
based on employing longer duration for observation.
• It is recommended as well follow up studies based on monitoring other parameters such
as sulphate, turbidity should be carried out in order to come up with good conclusion if
the use of sawdust in treatment of dye-rich wastewater is a good candidate as one of the
adsorbent material which is can easily be obtained and operated under low cost as
compared to other known to be efficient adsorbent materials such as activated carbon.
54
REFERENCES
Adams, R.C., F.S Maclean, J.K Dixon, F.M, Bennett, G.I Martin and R.C Lough (1951). “The
Utilization of Organic wastes in New Zealand, Second interim report of the inter-departmental
committee”. New Zealand Engineering (November 15, 1951): 396-424.
Eli-Latif, M.M., Ibrahim, A.M., (2009). “Adsorption, Kinetic and Equilibrium studies on
removal of basic dye from aqueous solutions using hydrolyzed Oak sawdust”. Desalination and
Water treatment, 1944-3994/1944-3986.
Fessenden R.J and Fessenden J.S., (1990). “Organic Chemistry”, 4th
ed., Brooks/Cole publishing
company, Pacific Grove, California.
Gohl, E.P.G, (1983). “Textile science, An explanation of fibre properties”, Second ed, National
Library of Australia.
Hoadley, R. Bruce (2000). “Understanding Wood: A craftman’s Guide to Wood Tehnology”.
Tauntor Press. ISBN 1-56, 158-358-8.
Kumar V., L. Wati, P. Nigam, I. M. Banat, B. S. Yadav, D. Singh and R. Marchant (1998),
Decolorization and biodegradation of anaerobically digested sugarcane molasses spent wash
effluent from biomethanation plants by white-rot fungi, Process Biochemistry, 33 (1998) 83-88.
Kyulule, A.L., (1994). “Introduction to Soil Mechanics”. Dar es Salaam University Press, Dar es
Salaam, Tanzania.
Mbuligwe S.E, (2004). “Comparative treatment of dye-rich wastewater in engineered wetland
systems vegetated with different plants”. Water research 39 (2005) 271-280.
Meshko, V., Markoska, L., Mincheva, M., Rodrigues, A.E., (2002). “Adsorption of basic dyes on
natural granular activated carbon and natural zeolite”. Water Res. 35 (14), 3357-3366.
Mtimbaru, E., (2009). “Assessment of Suitability of sawdust and wood shavings as media for
treating dye-rich wastewater”, B.Sc in Environmental Engineering dissertation “unpublished”
Ardhi University Tanzania.
Nigam P., Armour G., Banat I.M., Singh D., Marchant R., (2000). “Physical removal of textile
dyes from effluents and solid phase fermentation of dye adsorbed agricultural residues”.
Bioresource Technol. 72,219-229.
Nitratnisakorn, S., Thiravetyan, P., Nakbanpote, W., (2007). “Synthetic reactive dye wastewater
treatment by narrow-leaved cattails (Typha angustifolia Linn): Effects of dye, salinity and
metals” Science of the Total Environment 384 (2007) 67-76.
55
Ong, S., Toorisaka, E., Hirata, M., Hano, T., (2006). “Treatment of methylene blue-containing
wastewater using microorganisms supported on granular activated carbon under packed column
operation” Environ Chem Lett (2007) 5: 95-99.
Orhon, D., Dulkadiroglu, H., Dugruel, S., Kabdash, I., Sozen, S., Babuna, F.G., (2002).
“Ozonation application in activated sludge systems for a textile mill effluent”. Water Sci.
Technol. 45 (12), 305-313.
Robinson T., G. McMullan, R. Marchant, P. Nigam, Remediation of dyes in textiles effluent: a
critical review on current treatment technologies with a proposed alternative, Bioresource
Technology, 77 (2001) 247-255.
Sevimli, M.F.,Kinaci, C., (2002). “Decolourization of textile wastewater by ozonation and
Fenton’s process”. Water Sci. Technol. 45 (12), 279-286.
Spinoza, D.T., Isik, M., (2002). “Ultimate azo dye degradation in anaerobic/aerobic sequential
process”. Water Sci. Technol. 45 (12), 271-278.
Tanzania Bureau of Standards (TBS), (2005). “Limits for municipal and industrial wastewater”.
Yu, F and T. Viraraghavan, Fungal decolorization of dye wastewaters: a review, Bio-resource
Technology, 79 (2001) 251-262.
http://en.wikipedia.org/wiki/Dye last modified on 6 August 2009 at 16:37, viewed on Sunday,
viewed on Tuesday, 07.15am, 18 April, 2010.
http://en.dyeing-wikipedia.org/wiki last modified on 10 April 2010 at 18:52, viewed on
Tuesday, 07.45am, 18 April, 2010.
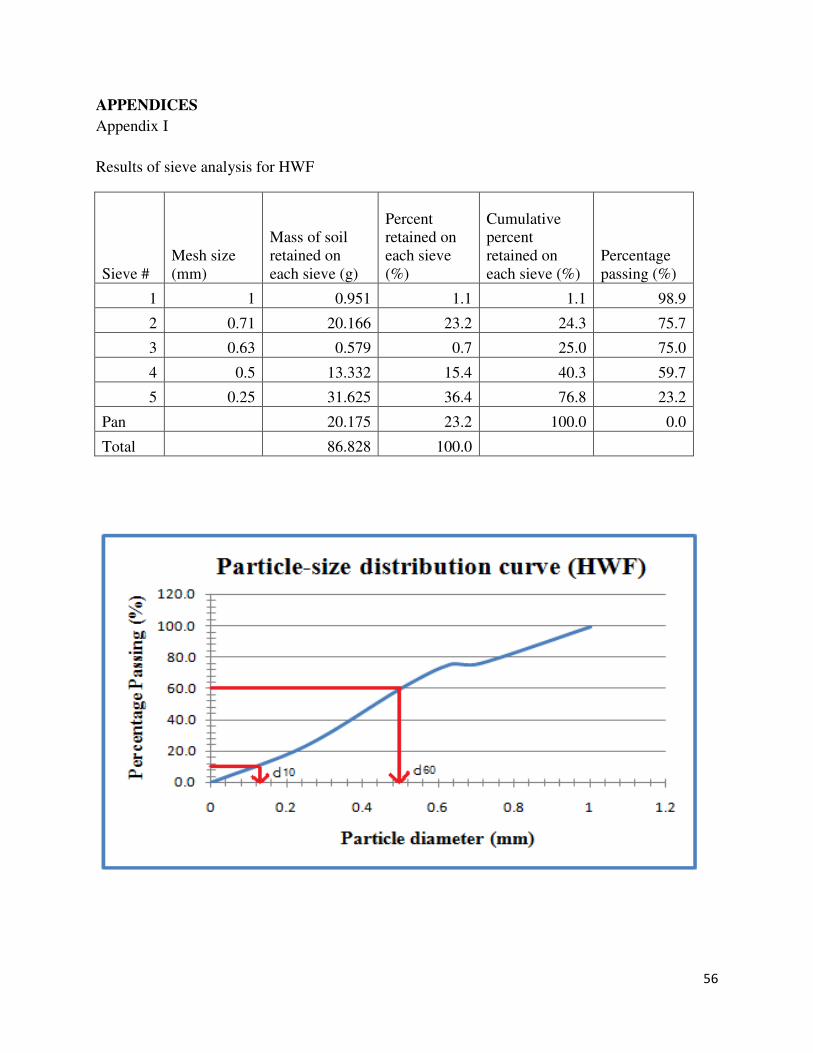
56
APPENDICES
Appendix I
Results of sieve analysis for HWF
Sieve #
Mesh size
(mm)
Mass of soil
retained on
each sieve (g)
Percent
retained on
each sieve
(%)
Cumulative
percent
retained on
each sieve (%)
Percentage
passing (%)
1 1 0.951 1.1 1.1 98.9
2 0.71 20.166 23.2 24.3 75.7
3 0.63 0.579 0.7 25.0 75.0
4 0.5 13.332 15.4 40.3 59.7
5 0.25 31.625 36.4 76.8 23.2
Pan 20.175 23.2 100.0 0.0
Total 86.828 100.0
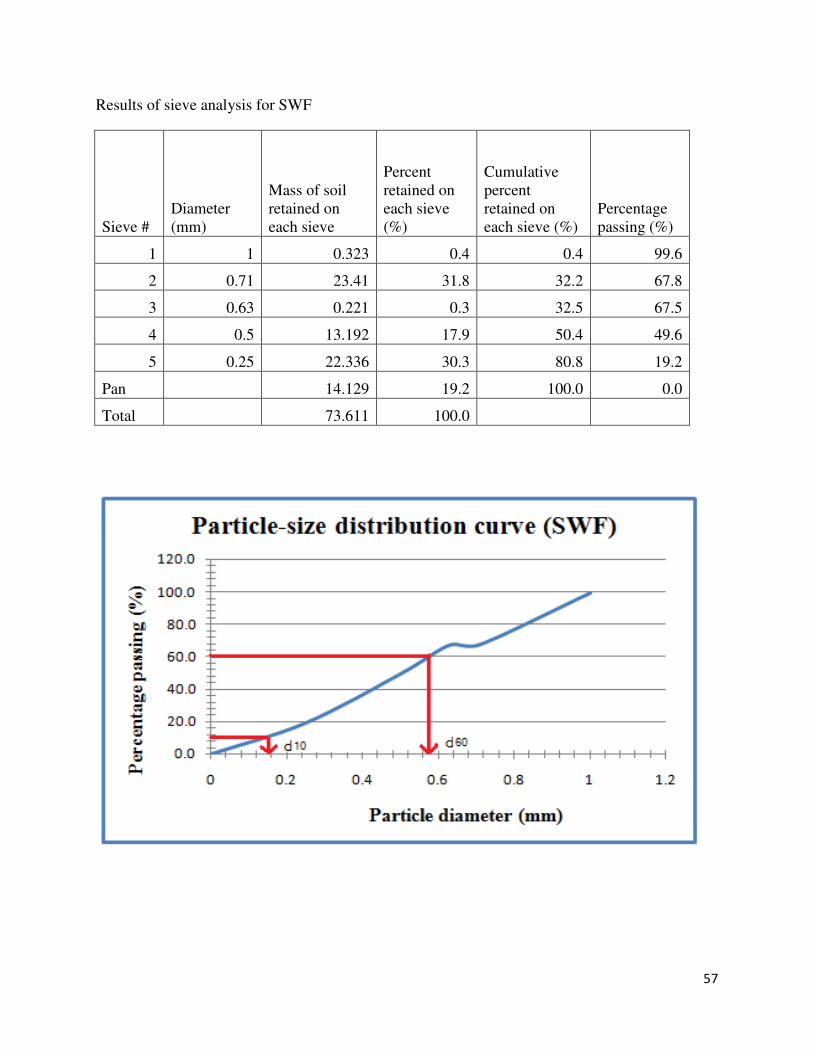
57
Results of sieve analysis for SWF
Sieve #
Diameter
(mm)
Mass of soil
retained on
each sieve
Percent
retained on
each sieve
(%)
Cumulative
percent
retained on
each sieve (%)
Percentage
passing (%)
1 1 0.323 0.4 0.4 99.6
2 0.71 23.41 31.8 32.2 67.8
3 0.63 0.221 0.3 32.5 67.5
4 0.5 13.192 17.9 50.4 49.6
5 0.25 22.336 30.3 80.8 19.2
Pan 14.129 19.2 100.0 0.0
Total 73.611 100.0
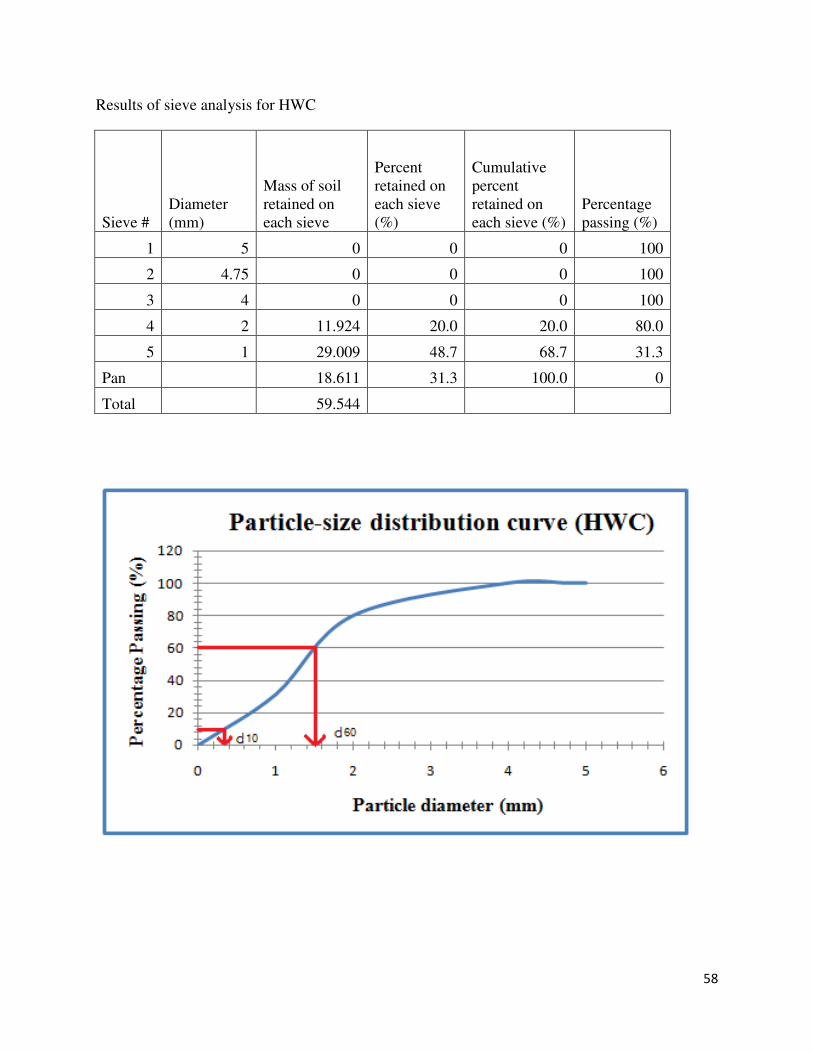
58
Results of sieve analysis for HWC
Sieve #
Diameter
(mm)
Mass of soil
retained on
each sieve
Percent
retained on
each sieve
(%)
Cumulative
percent
retained on
each sieve (%)
Percentage
passing (%)
1 5 0 0 0 100
2 4.75 0 0 0 100
3 4 0 0 0 100
4 2 11.924 20.0 20.0 80.0
5 1 29.009 48.7 68.7 31.3
Pan 18.611 31.3 100.0 0
Total 59.544
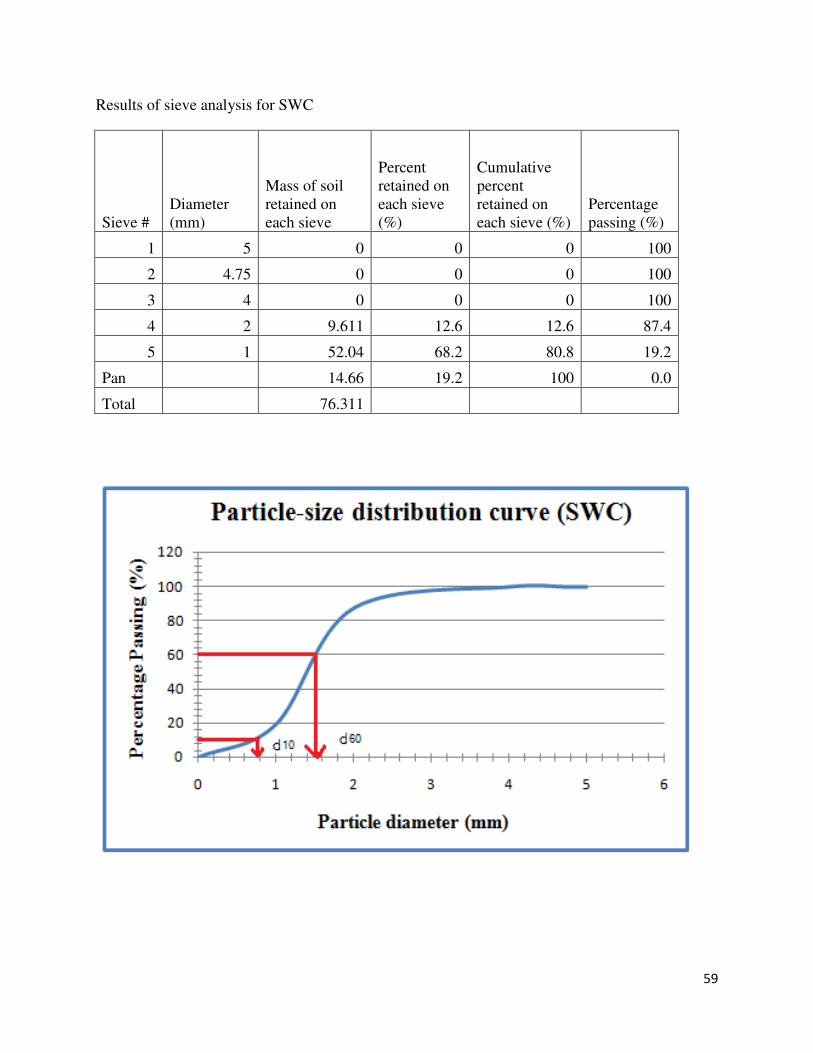
59
Results of sieve analysis for SWC
Sieve #
Diameter
(mm)
Mass of soil
retained on
each sieve
Percent
retained on
each sieve
(%)
Cumulative
percent
retained on
each sieve (%)
Percentage
passing (%)
1 5 0 0 0 100
2 4.75 0 0 0 100
3 4 0 0 0 100
4 2 9.611 12.6 12.6 87.4
5 1 52.04 68.2 80.8 19.2
Pan 14.66 19.2 100 0.0
Total 76.311

60
Results of sieve analysis for SAND
Sieve #
Diameter
(mm)
Mass of soil
retained on
each sieve
Percent
retained on
each sieve
(%)
Cumulative
percent
retained on
each sieve (%)
Percentage
passing (%)
1 4 0.27 0.0 0 100
2 2 10.706 1.8 1.8 98.2
3 1 60.665 10.1 11.9 88.1
4 0.71 98.466 16.4 28.3 71.7
5 0.63 6.48 1.1 29.4 70.6
6 0.4 189.25 31.6 61.0 39.0
7 0.25 154.482 25.8 86.7 13.3
Pan 79.236 13.2 100.0 0.0
Total 599.555 100.0
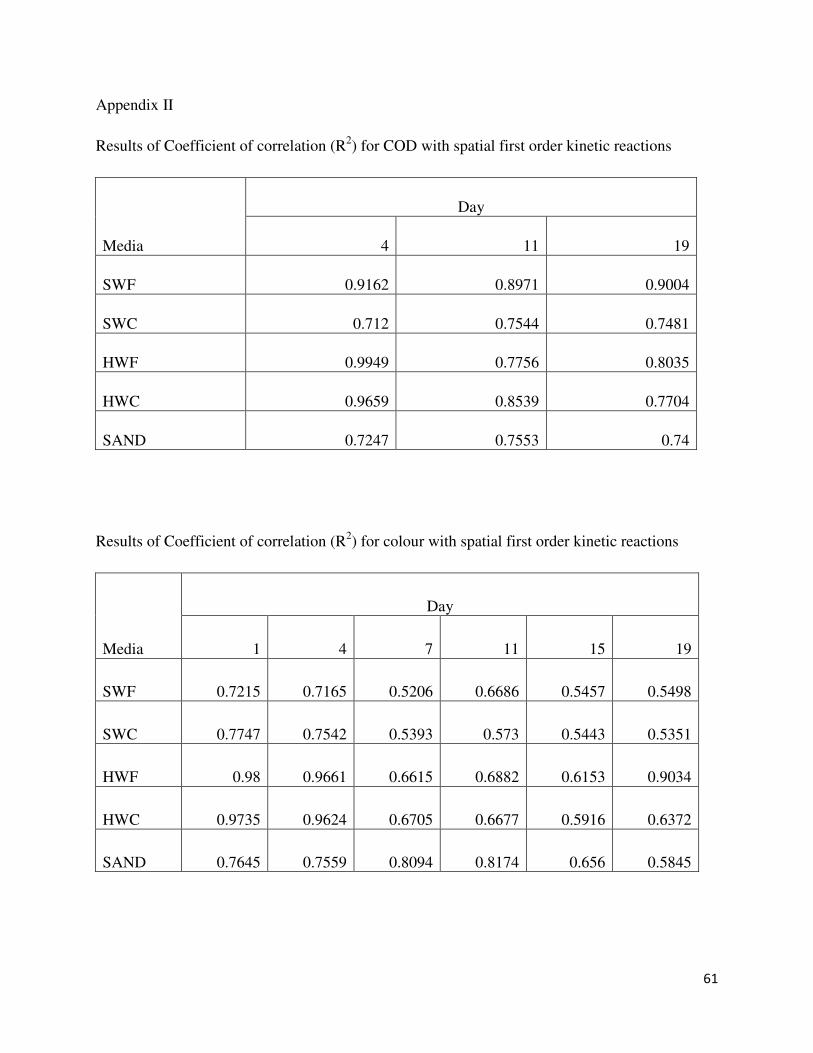
61
Appendix II
Results of Coefficient of correlation (R2) for COD with spatial first order kinetic reactions
Media
Day
4 11 19
SWF 0.9162 0.8971 0.9004
SWC 0.712 0.7544 0.7481
HWF 0.9949 0.7756 0.8035
HWC 0.9659 0.8539 0.7704
SAND 0.7247 0.7553 0.74
Results of Coefficient of correlation (R2) for colour with spatial first order kinetic reactions
Media
Day
1 4 7 11 15 19
SWF 0.7215 0.7165 0.5206 0.6686 0.5457 0.5498
SWC 0.7747 0.7542 0.5393 0.573 0.5443 0.5351
HWF 0.98 0.9661 0.6615 0.6882 0.6153 0.9034
HWC 0.9735 0.9624 0.6705 0.6677 0.5916 0.6372
SAND 0.7645 0.7559 0.8094 0.8174 0.656 0.5845