Embed Size (px)
Citation preview
Assesment on the use of SRTM DEM during post tsunami
operations
Thierry Rousselin Géo212 - France
June 20052 2
SRTM Workshop June 2005
Why such an analysis ?
In geospatial emergency production, each crisis isunique, in terms of :
causessymptoms
adequate solutions
Availables tools and sources
Due to the limited number of major crisis, militaryand civilian events have to be analysed alike
Generic lessons can be learned
But their temporal validity is short

June 20053 3
SRTM Workshop June 2005
Methodology
The main point is to get all relevant informations during the crisis (and not after)Any product must be analysed based :
On ops requirements (not always easy to know)On available sources at the momentOn general context
It is a day to day workReferencing the productsLinks with events of the days
Analysis afterwards is never a judgementon products or their authors. It must onlygive hints on futures services, products and organisational changes
June 20054 4
SRTM Workshop June 2005
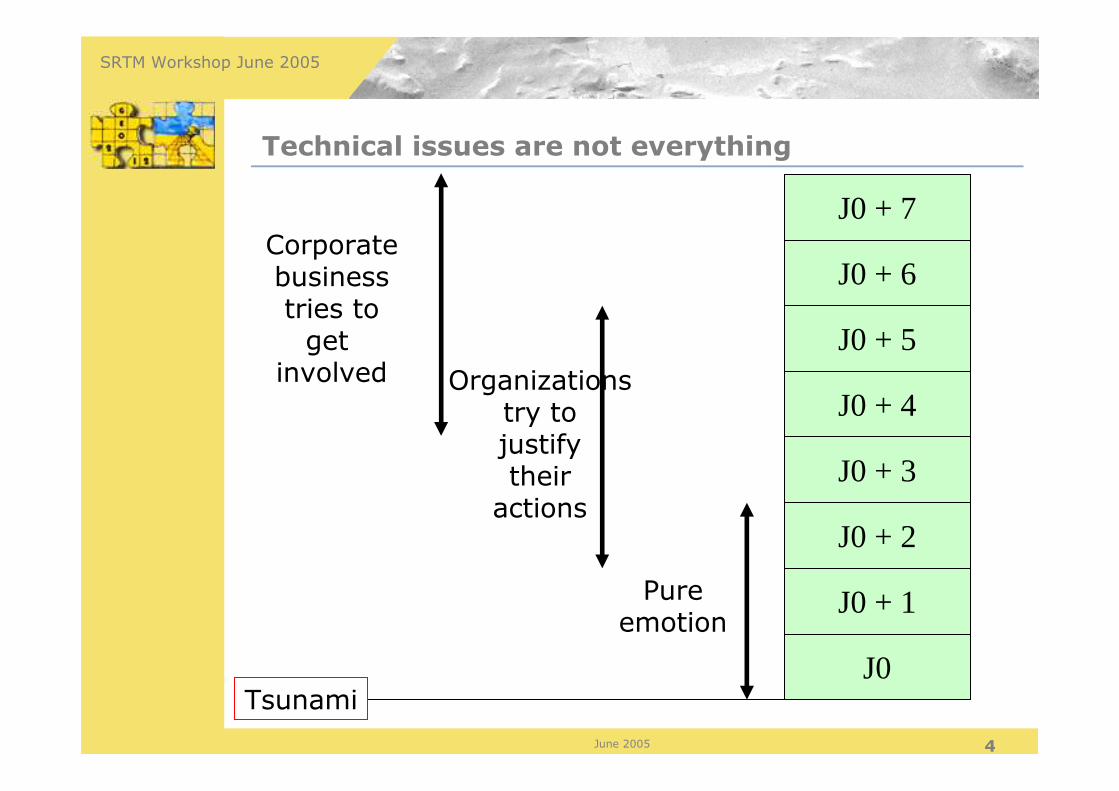
Technical issues are not everything
J0
J0 + 1
J0 + 2
J0 + 3
J0 + 4
J0 + 5
J0 + 6
J0 + 7
Tsunami
Pureemotion
Organizationstry tojustifytheir
actions
Corporatebusinesstries to
getinvolved
June 20055 5
SRTM Workshop June 2005
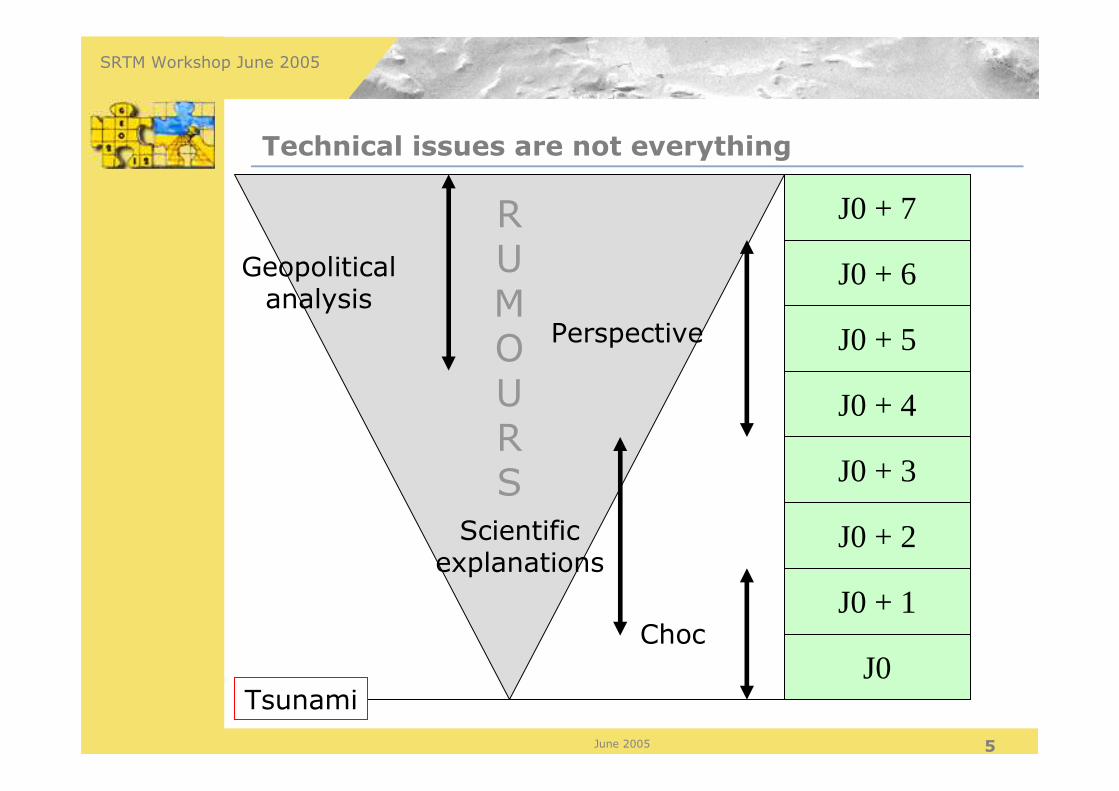
RUMOURS
Technical issues are not everything
J0
J0 + 1
J0 + 2
J0 + 3
J0 + 4
J0 + 5
J0 + 6
J0 + 7
Tsunami
Choc
Scientificexplanations
Perspective
Geopoliticalanalysis

June 20056 6
SRTM Workshop June 2005
Specific problems of this crisis
A lot of different areas of interest
Diversity of landscapes, local situations, issues
A lot of flat coastal areas where any error in z on the DEM creates large x, y errors on the interpretation
A lot of areas difficult for optical observation
June 20057 7
SRTM Workshop June 2005
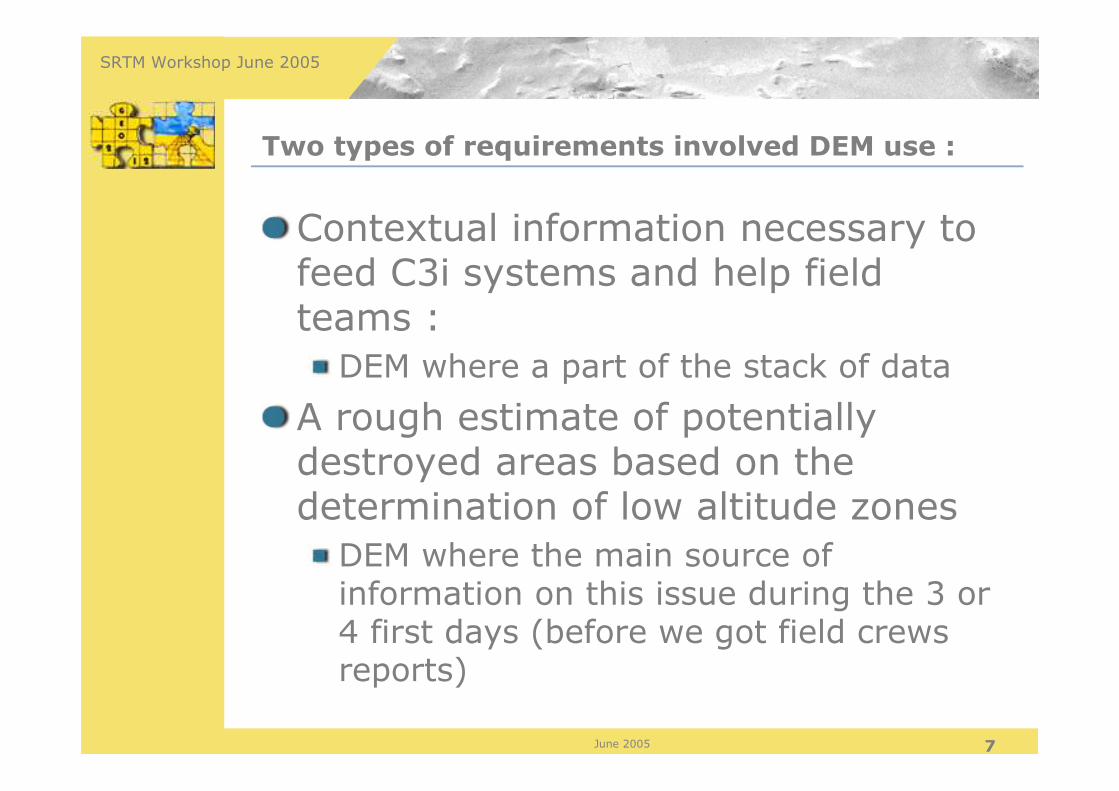
Two types of requirements involved DEM use :
Contextual information necessary to feed C3i systems and help fieldteams :
DEM where a part of the stack of data
A rough estimate of potentiallydestroyed areas based on the determination of low altitude zones
DEM where the main source of information on this issue during the 3 or 4 first days (before we got field crewsreports)
Contextual information
Data Mining
Image Information Mining
Cartography
June 20059 9
SRTM Workshop June 2005
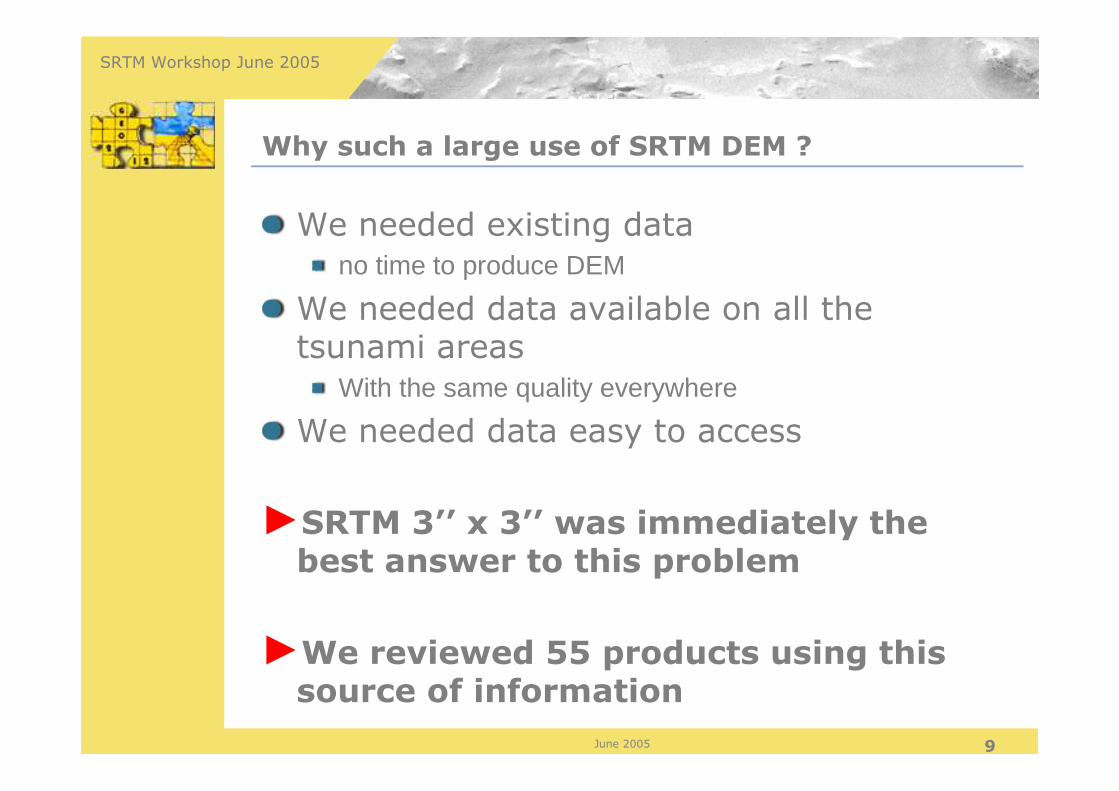
Why such a large use of SRTM DEM ?
We needed existing data no time to produce DEM
We needed data available on all the tsunami areas
With the same quality everywhere
We needed data easy to access
►SRTM 3’’ x 3’’ was immediately the best answer to this problem
►We reviewed 55 products using thissource of information
June 200510 10
SRTM Workshop June 2005
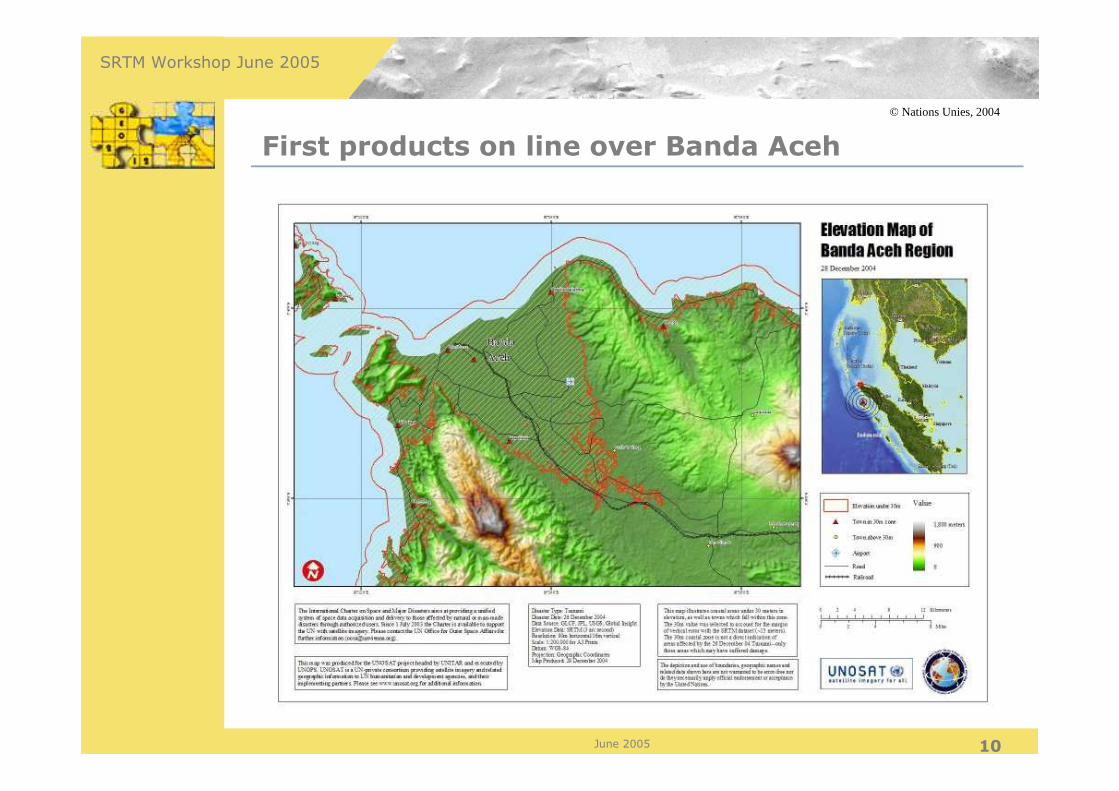
First products on line over Banda Aceh
© Nations Unies, 2004
June 200511 11
SRTM Workshop June 2005
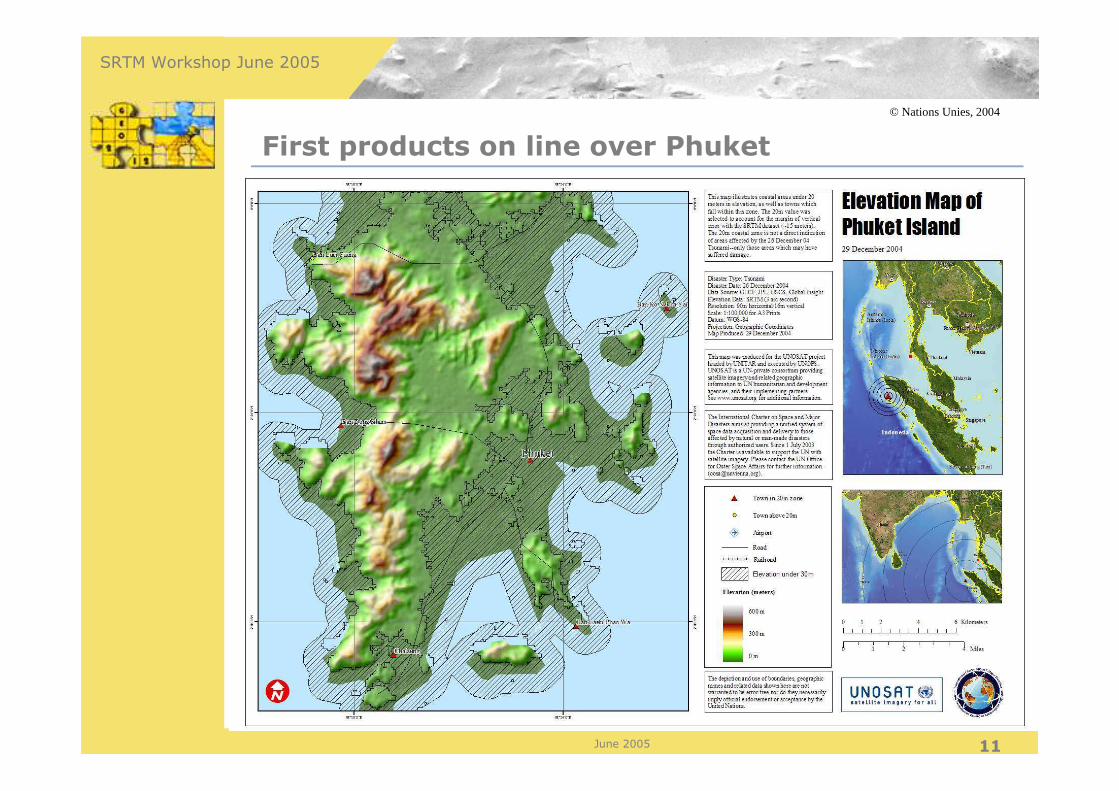
First products on line over Phuket
© Nations Unies, 2004
June 200512 12
SRTM Workshop June 2005
Analysis : Very good emergency products
Good geometry
A simple access to three main problems :Land useElevationPopulations
Based entirely on existing information
Belle facture cartographique
User alerts on possible uses of the data
Good metadataConfusions between SRTM90 and SRTM30)
June 200513 13
SRTM Workshop June 2005
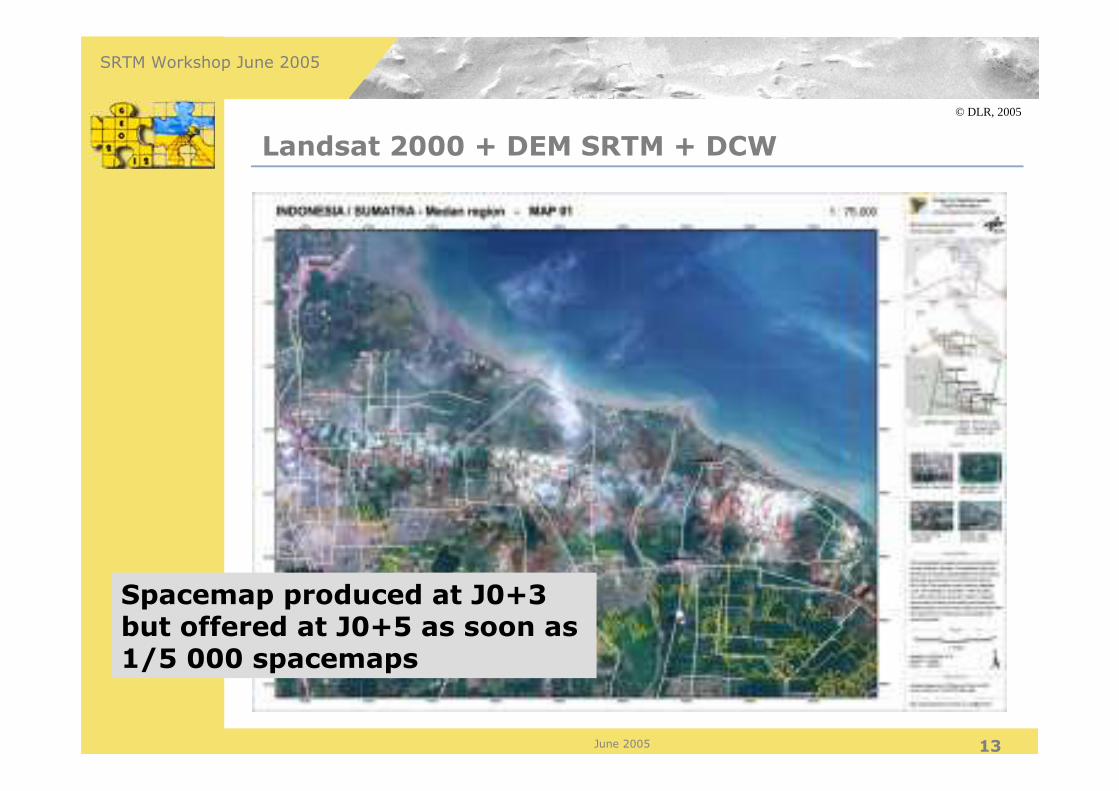
Landsat 2000 + DEM SRTM + DCW
© DLR, 2005
Spacemap produced at J0+3but offered at J0+5 as soon as 1/5 000 spacemaps
June 200514 14
SRTM Workshop June 2005
Analysis : Another good exemple
Those medium scale (1/75 000) spacemapswhere produced at J0+3. At this scale, alone, they did not give a lot of original information
But at J0+5 they were put on-line in a multi-scale data stack with change detection high resolution products.
Good optimization of :Image resolutionDigital product « scale »Printed dpi resolution
Same product at 1/50 000 scale wouldhave been mediocre.
June 200515 15
SRTM Workshop June 2005
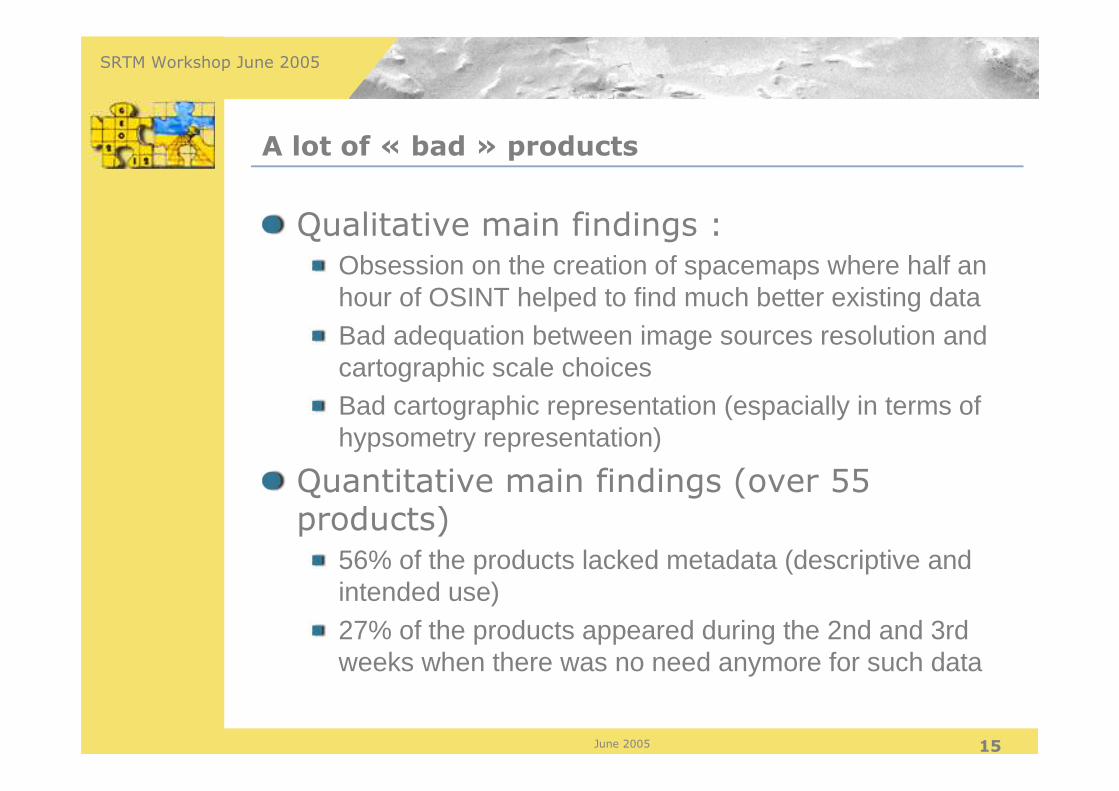
A lot of « bad » products
Qualitative main findings :Obsession on the creation of spacemaps where half an hour of OSINT helped to find much better existing data Bad adequation between image sources resolution and cartographic scale choicesBad cartographic representation (espacially in terms of hypsometry representation)
Quantitative main findings (over 55 products)
56% of the products lacked metadata (descriptive and intended use)27% of the products appeared during the 2nd and 3rd weeks when there was no need anymore for such data
A rough estimate of potentiallydestroyed areas
June 200517 17
SRTM Workshop June 2005
Operational needs
To get a first idea of potentially destroyedareas by identification of low altitude zones (30 m or 20 m depending on the areas)
Represent this information on cartographicdocuments distributed to authorities and field teams

June 200518 18
SRTM Workshop June 2005
The sources
5 possible sources GTOPO30SRTM90 correctedSRTM90 non correctedSRTM30Référence 3D
Over 102 products analysed, none has used SRTM30 or Référence3D
91% used SRTM data (but in most cases, users did not really know during thisemergency if it was corrected or not –finding based on interviews after the crisis)
June 200519 19
SRTM Workshop June 2005
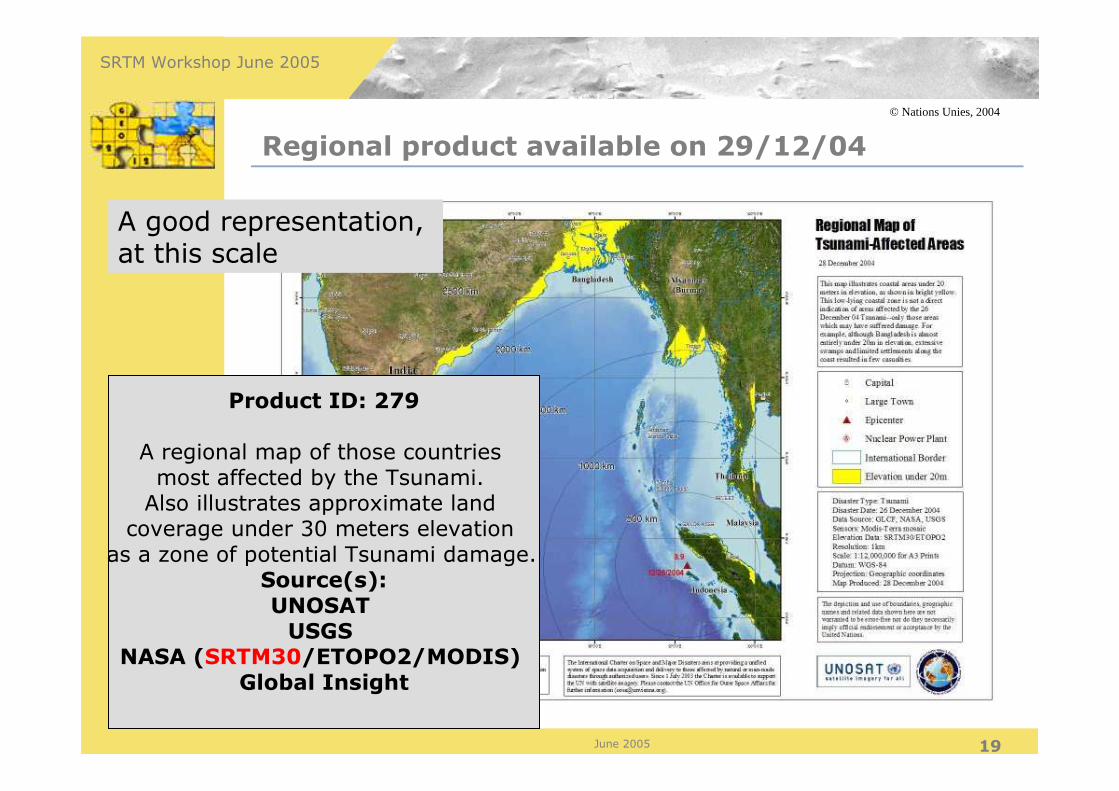
Regional product available on 29/12/04
© Nations Unies, 2004
A good representation, at this scale
Product ID: 279
A regional map of those countries most affected by the Tsunami.
Also illustrates approximate land coverage under 30 meters elevation
as a zone of potential Tsunami damage.Source(s):UNOSAT USGS
NASA (SRTM30/ETOPO2/MODIS) Global Insight

June 200520 20
SRTM Workshop June 2005
Aceh product available on 29/12/04
A careful representation
© Nations Unies, 2004
June 200521 21
SRTM Workshop June 2005
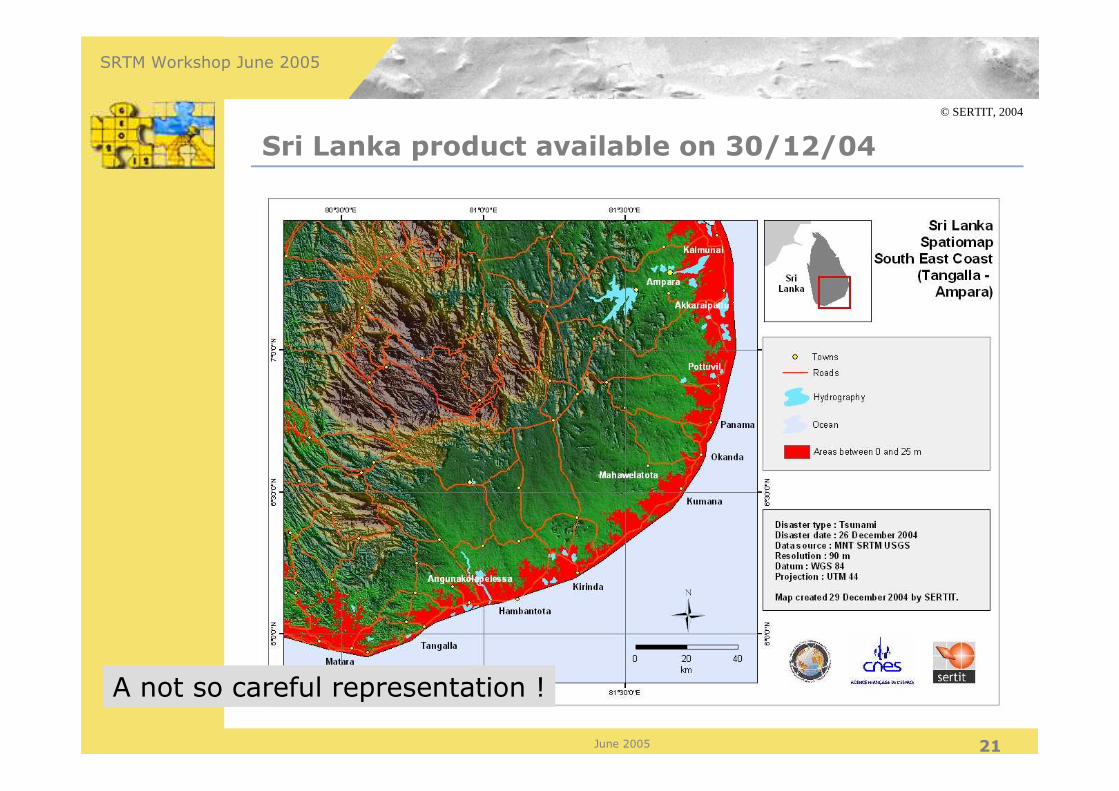
Sri Lanka product available on 30/12/04
A not so careful representation !
© SERTIT, 2004

June 200522 22
SRTM Workshop June 2005
Sri Lanka product available on 30/12/04
© SERTIT, 2004
An awful representation !
June 200523 23
SRTM Workshop June 2005
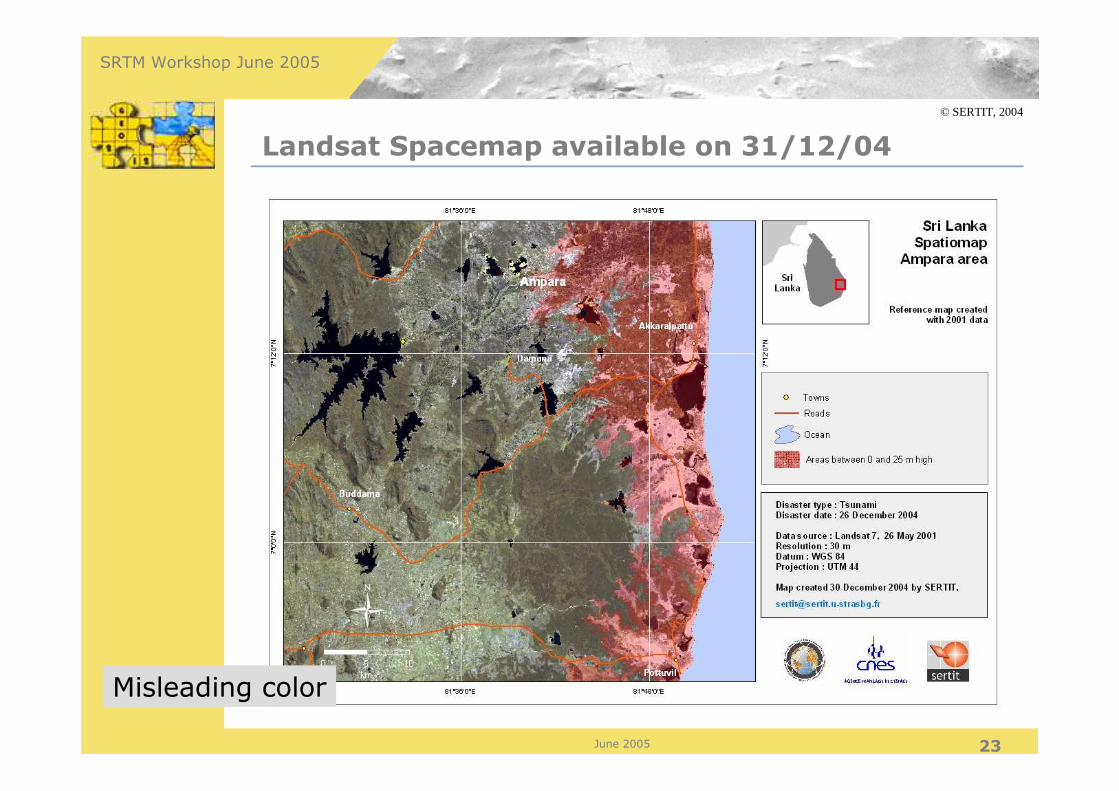
Landsat Spacemap available on 31/12/04
Misleading color
© SERTIT, 2004
June 200524 24
SRTM Workshop June 2005
Analysis : a simple problem …with not so simple answers (1/2)
SRTM90 elevations in coastal areas (in the 0 – 25 m altitude range) are difficult to interpretTake those elevations and draw them in RED on the spacemap gives an erroneousperception of reality.Products where the 20 m level isrepresented by a contour line give a betteridea to the user. In the same way, colorize the landsatspacemap in brown colors to give an ideaof hypsometry is a theoretically a good ideaexcept when it creates confusion with post tsunamy imagery covered with brown mud.
June 200525 25
SRTM Workshop June 2005
Analysis : a simple problem …with not so simple answers (2/2)
More than half of the 102 products analysed in thisfield gave erroneous perception of the situation (and technical data quality of SRTM DEM had nothing to do with it)
Data produced by official agencies (inside or outsidethe International Chart) contained the sameproportion of bad product than data produced by private efforts (business, universities or individuals)
Altitude informations are crucial but :
Metadata must accompany the productRepresentation must be carefully selected
June 200526 26
SRTM Workshop June 2005
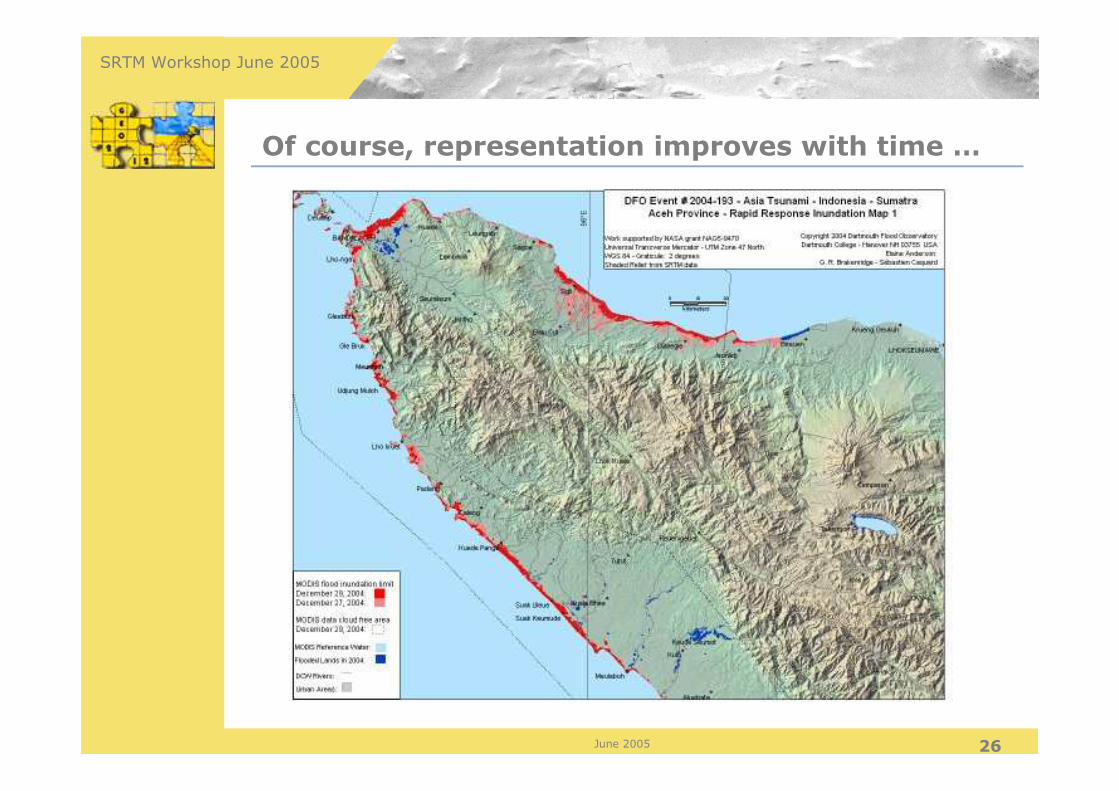
Of course, representation improves with time …
June 200527 27
SRTM Workshop June 2005
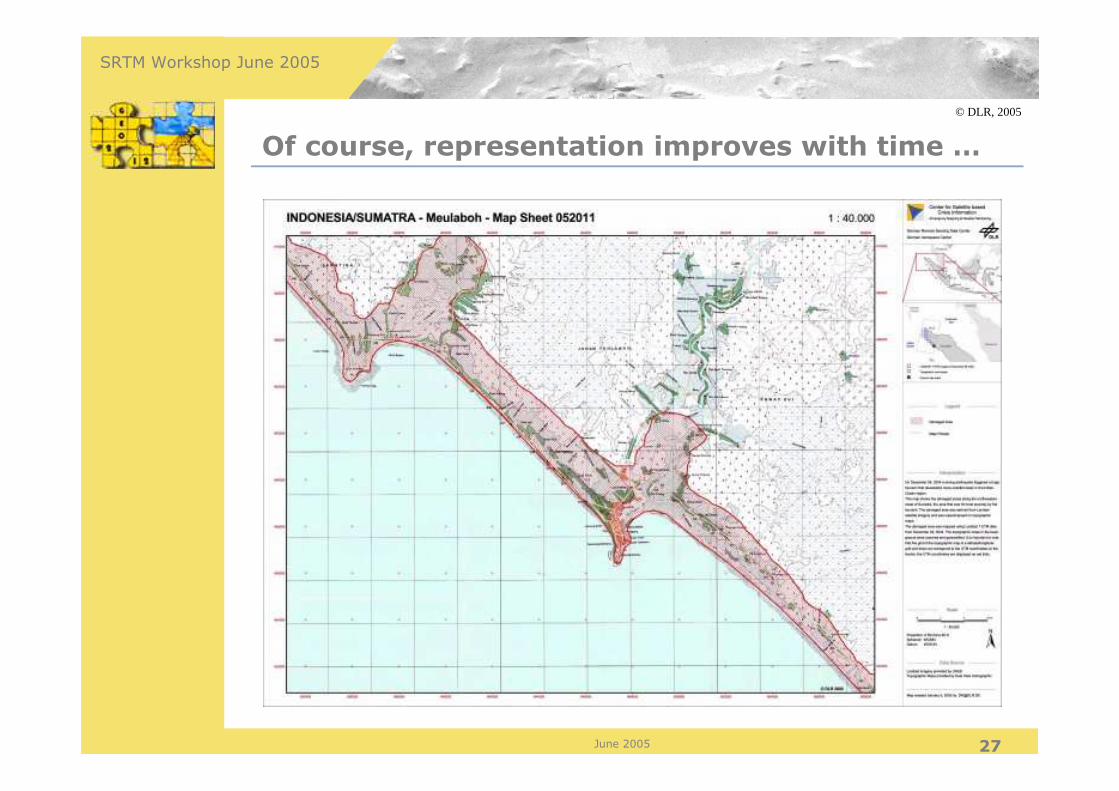
Of course, representation improves with time …
© DLR, 2005
Conclusions

June 200529 29
SRTM Workshop June 2005
Positive side
The emergency production system works
It can deliver timely products
The « good » sources were selected
Almost 40% of the products were welldesigned and gave good metadatainformation.
June 200530 30
SRTM Workshop June 2005
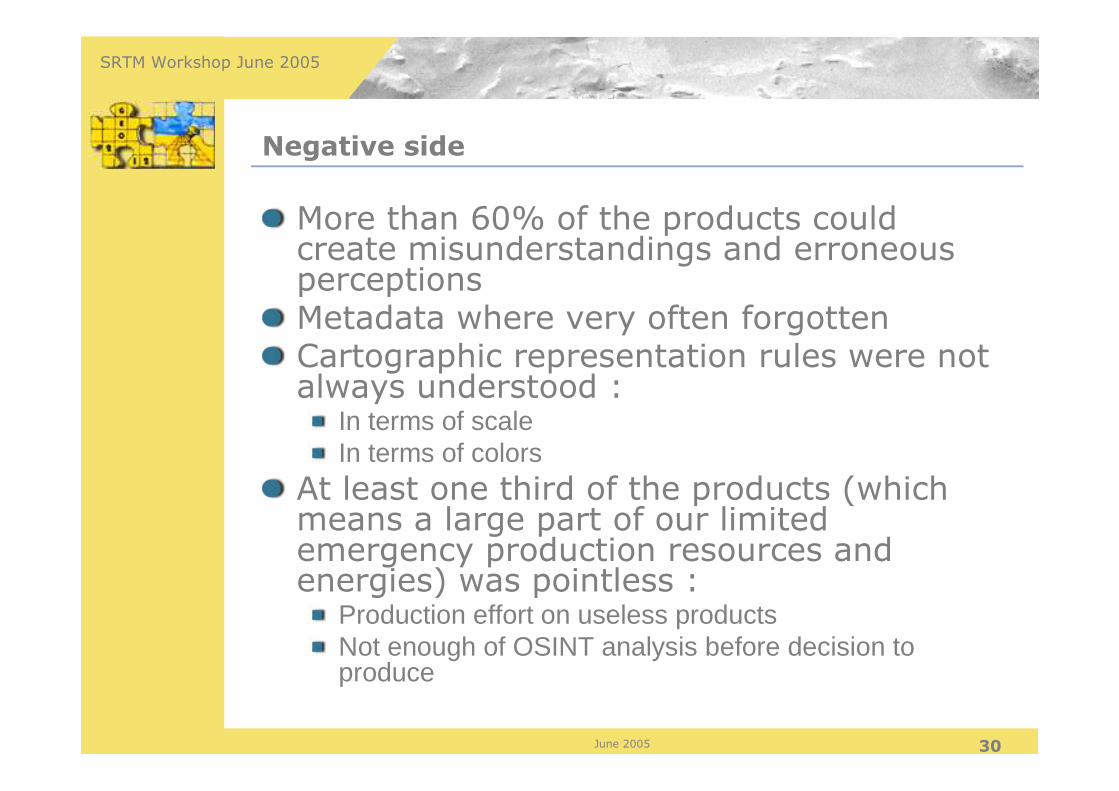
Negative side
More than 60% of the products couldcreate misunderstandings and erroneousperceptionsMetadata where very often forgottenCartographic representation rules were not always understood :
In terms of scaleIn terms of colors
At least one third of the products (whichmeans a large part of our limitedemergency production resources and energies) was pointless :
Production effort on useless productsNot enough of OSINT analysis before decision to produce
June 200531 31
SRTM Workshop June 2005
How to improve ?
Education and training
on radar data quality issueson adequate emergency metadata selection
and on cartography 101 ☺
Coordination :
Between agenciesBetween public and private sector in crisiswhere everybody wants to help