Embed Size (px)
Citation preview
This article was downloaded by: [Miami University Libraries]On: 18 October 2014, At: 09:24Publisher: Taylor & FrancisInforma Ltd Registered in England and Wales Registered Number: 1072954Registered office: Mortimer House, 37-41 Mortimer Street, London W1T 3JH, UK
International Journal ofMathematical Education in Scienceand TechnologyPublication details, including instructions for authors andsubscription information:http://www.tandfonline.com/loi/tmes20
Assessing American children'sattitudes towards computertechnologyRobertta H. Barba aa School of Teacher Education, College of Education , SanDiego State University , San Diego, California 92182, U.S.A.Published online: 09 Jul 2006.
To cite this article: Robertta H. Barba (1991) Assessing American children's attitudestowards computer technology, International Journal of Mathematical Education in Scienceand Technology, 22:5, 731-737, DOI: 10.1080/0020739910220504
To link to this article: http://dx.doi.org/10.1080/0020739910220504
PLEASE SCROLL DOWN FOR ARTICLE
Taylor & Francis makes every effort to ensure the accuracy of all the information(the “Content”) contained in the publications on our platform. However, Taylor& Francis, our agents, and our licensors make no representations or warrantieswhatsoever as to the accuracy, completeness, or suitability for any purposeof the Content. Any opinions and views expressed in this publication are theopinions and views of the authors, and are not the views of or endorsed by Taylor& Francis. The accuracy of the Content should not be relied upon and should beindependently verified with primary sources of information. Taylor and Francisshall not be liable for any losses, actions, claims, proceedings, demands, costs,expenses, damages, and other liabilities whatsoever or howsoever caused arisingdirectly or indirectly in connection with, in relation to or arising out of the use ofthe Content.
This article may be used for research, teaching, and private study purposes.Any substantial or systematic reproduction, redistribution, reselling, loan, sub-licensing, systematic supply, or distribution in any form to anyone is expressly

forbidden. Terms & Conditions of access and use can be found at http://www.tandfonline.com/page/terms-and-conditions
Dow
nloa
ded
by [
Mia
mi U
nive
rsity
Lib
rari
es]
at 0
9:24
18
Oct
ober
201
4
INT. J. MATH. EDUC. SCI. TECHNOL., 1991, VOL. 22, NO. 5, 731-737
Assessing American children's attitudestowards computer technology
by ROBERTTA H. BARBASchool of Teacher Education, College of Education, San Diego State University,
San Diego, California 92182, U.S.A.
(Received 6 July 1990)
The intention of this research was to develop an instrument with which toassess the attitude(s) of elementary school children in the United States towardsthe use of computer technologies. This instrument, modeled after the draw-a-scientist test, the draw-a-teacher test, and the draw-a-dentist test, was used toidentify the attitudes of 4,982 children in Reading, Pennsylvania andAlbuquerque, New Mexico towards computer usage in American society. Theresults of this study indicate that American children perceive of computer users asbeing professionals who use computers in their everyday work, rather than as aseparate occupation. American adults perceive of scientists and technologists,including computer users, as being white-coated; bespectacled; elderly men, whowork in equipment filled rooms, and who carry slide rulers in their hands andmechanical lead pencils in their pockets [1, 2]. American elementary-aged schoolchildren do not hold the same stereotypes as their parents towards the use ofcomputers and computer technology.
1. IntroductionThe purpose of this study was to determine what attitude(s) or perceptions
American children hold toward computers and those who use computer technologyin everyday life. It has been reported in American magazines, such as Public OpinionQuarterly [3], that science and technology are melded in an undifferentiated conceptin the minds of American adults. Adult perceptions of science and technology inAmerican society are dominated by images of everyday medicine, industry, andhousehold appliances. Do American children view science and technology, parti-cularly computer technology, in the same manner as their parents?
Scientists and technologists, including computer users and computer pro-grammers, are seen in stereotypical terms by American adults, who view them ascomic book characters or robots [3]. It is the perception of the general public in theUnited States that technologists, scientists, and computer programmers are white-coated, bespectacled, white-haired men, who work in equipment-filled rooms, andwho carry slide rulers in their hands and mechanical lead pencils in their pockets[1,2]. Technology is viewed by American adults as being simply an outgrowth ofscience [3].
From previous research, it is known that American children stereotype scientists[1,4], dentists [5], and teachers [6]. Do these children stereotype computer usersand/or computer programmers in the same fashion? Does a convergent image of acomputer user emerge and strengthen as children in the United States mature?
0020-739X/91 $300 © 1991 Taylor & Francis Ltd.
Dow
nloa
ded
by [
Mia
mi U
nive
rsity
Lib
rari
es]
at 0
9:24
18
Oct
ober
201
4
732 R. H. Barba
2. Using children's drawings to assess attitude(s)Children's drawings have been used as a means of assessing intelligence for more
than sixty years [7]. Daniel Mueller [8] suggested that children's art is a powerfultool for measuring children's attitudes and may be a more accurate measure of theactual attitude object than more traditional evaluation tools. Mueller has pointed outthat children try to please adults when they are engaged in test-taking situations.While taking written attitude tests, children select answers that they think will pleasethe adult administering the test, this same type of behaviour was not noted whenchildren were administered drawing instruments.
Using children's drawings to assess social values may on the surface seem absurd,in actuality, the content of children's drawings reflects group values more accuratelythan do pencil-and-paper instruments [9]. Pencil-and-paper assessment instru-ments require students to have appropriate reading and comprehension skills. Theuse of attitude instruments in which teachers or test administrators read instructionsor questions to students are subject to interpretation on the part of the child. Resultsfrom these instruments may be more a reflection of a child's verbal reception ofinformation rather than the attitude object itself.
Drawings are less reactive to encoding and decoding problems on the part of thechild than are traditional attitude assessment tools. When engaged in drawingactivities, children seldom take their eyes from the paper on which they are drawing.Based on this observation, it has been concluded that drawings reflect an internalmental image held by the child and not simply a drawing of the adult administeringthe test [9].
3. Methodology: the draw-a-computer user testThe initial research for this study took place over two years (1988-1990). The
draw-a-computer user test is not merely an extension of the draw-a-man test[7,10,11], but rather, it is an attempt to identify the attitudes that American childrenhold towards computers and their use in American society. This test seeks to assesschildren's attitudes, not to measure their intelligence, self-image or emotional state.Further, the draw-a-computer user test was designed to determine if childrenstereotype computer users in the same manner that they do other professionals.
Significance for this study is based on three points: timeliness, extendingprevious research, and developing a new instrument with which to assess children'sattitudes. The study of children's attitude(s) towards computer technology is timelyin light of the amount of time and financial resources which have been directedtowards acquiring this medium for use in schools in the United States. Previousresearch into children's attitudes towards careers in mathematics, science, andtechnology related fields in the United States, has not addressed computer relatedcareers. Finally, this study provides a new instrument with which to assess children'sattitudes.
4. ProceduresRegular classroom teachers were used as test administrators for this study, this is
in keeping with the procedures developed for the draw-a-scientist test [1], the draw-a-dentist test [6], and the draw-a-teacher test [12]. Classroom teachers were selectedas test administrators in order to reduce the effects of extraneous variables, such asthe presence of a researcher in the classroom. Students were given a blank sheet ofpaper and were instructed by their teachers to 'draw a computer user'.
Dow
nloa
ded
by [
Mia
mi U
nive
rsity
Lib
rari
es]
at 0
9:24
18
Oct
ober
201
4
Children's attitudes towards computer technology 733
4.1. Validity of the instrumentThe problem with establishing validity for a tool, such as this, is that there are no
measuring sticks by which to clearly and concisely measure the attitude object. Hays[13] suggests that validity may be based on strong and plausible theoreticalarguments that the instrument should measure the psychological trait involved; inthis case, the attitude(s) of American children towards the use of computers. Thepresence of a microcomputer in the child's drawing along with a human figureimplies that the child is conveying information about the attitude of that humanrepresentation towards the technology. Validity in this instance in associational, inthat the child is attributing an attitude toward the user of the computer. The attitudeobject is observable in the facial expression of the user, in words written on thedrawing, and in signs and symbols that the child has drawn.
4.2. Reliability of the instrumentThe question of reliability of children's drawings involves two aspects: consis-
tency within the child himself and consistency among judges rating the child'sdrawings. In order to establish inter-child reliability, 90 children (30 first graders, 30third graders, and 30 fifth graders) were administered the draw-a-man test [7,10,11]immediately before the administration of the draw-a-computer user test. The imageof the man from the draw-a-man test and the image of the human figure contained inthe drawing of the computer user were scored by three trained psychologists, usingthe rating scale from Goodenough draw-a-man test [10]. The Pearson productmoment correlation between the scores for the two human figures was determined tober = 0-85.
Before the drawings of the students could be analysed, it was necessary toestablish inter-judge or inter-rater reliability. Drawings of the 4,982 students weredivided into stacks by grade level. Two drawings were randomly selected from eachof the stacks. A group of 25 untrained volunteers (undergraduate elementary andsecondary education majors) rated each of these 12 drawings to determine itscharacteristics. Variables coded by the raters included: the presence of a humanfigure, the gender of the figure, the age of the figure, the facial expression of thehuman figure, stereotypical features (eyeglasses, facial hair, robots) identified byadults as germane to computer users, and occupation of the computer users, and soforth. The inter-rater reliability among the 25 untrained judges was determined tober = 0-914.
Eighty per cent of the rating error was attributable to three items: the age of thecomputer user, the occupation of the computer user, and the facial expression of thecomputer user. The remainder of the error was attributable to scoring errors andundetermined causes.
4.3. SubjectsA total of 4,982 elementary aged school children in Kindergarten through fifth
grade were used as subjects in this study. Eight hundred and forty-five students inthe Reading School District (Reading, Pennsylvania) and 4,137 students enrolled inthe Albuquerque Public Schools (Albuquerque, New Mexico) were interviewed inthis study. The students in the total population from which the sample was drawn,were 62% Anglo, 29% Hispanic, 8% Afro-Americans, and less than 1% NativeAmericans.
Dow
nloa
ded
by [
Mia
mi U
nive
rsity
Lib
rari
es]
at 0
9:24
18
Oct
ober
201
4
734 R. H. Barba
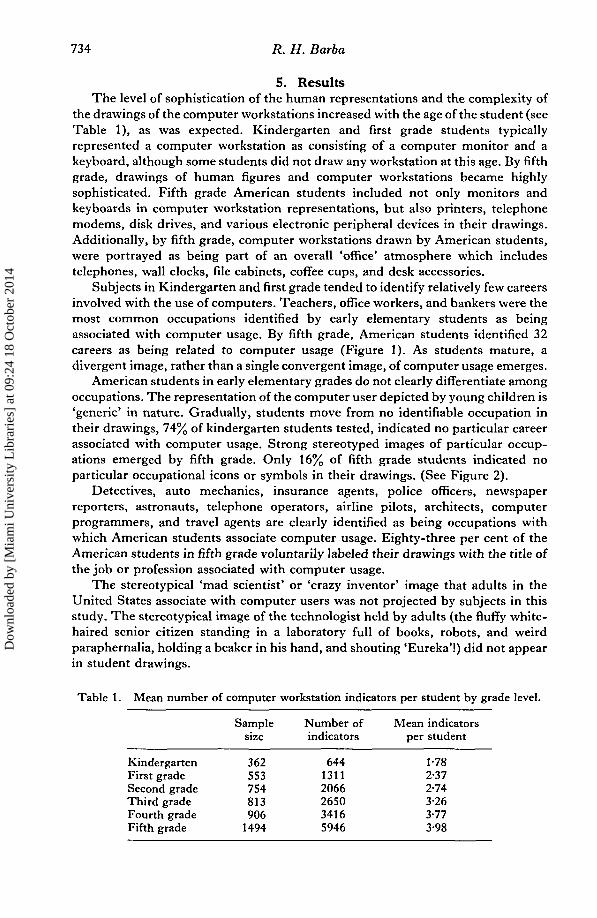
5. ResultsThe level of sophistication of the human representations and the complexity of
the drawings of the computer workstations increased with the age of the student (seeTable 1), as was expected. Kindergarten and first grade students typicallyrepresented a computer workstation as consisting of a computer monitor and akeyboard, although some students did not draw any workstation at this age. By fifthgrade, drawings of human figures and computer workstations became highlysophisticated. Fifth grade American students included not only monitors andkeyboards in computer workstation representations, but also printers, telephonemodems, disk drives, and various electronic peripheral devices in their drawings.Additionally, by fifth grade, computer workstations drawn by American students,were portrayed as being part of an overall 'office' atmosphere which includestelephones, wall clocks, file cabinets, coffee cups, and desk accessories.
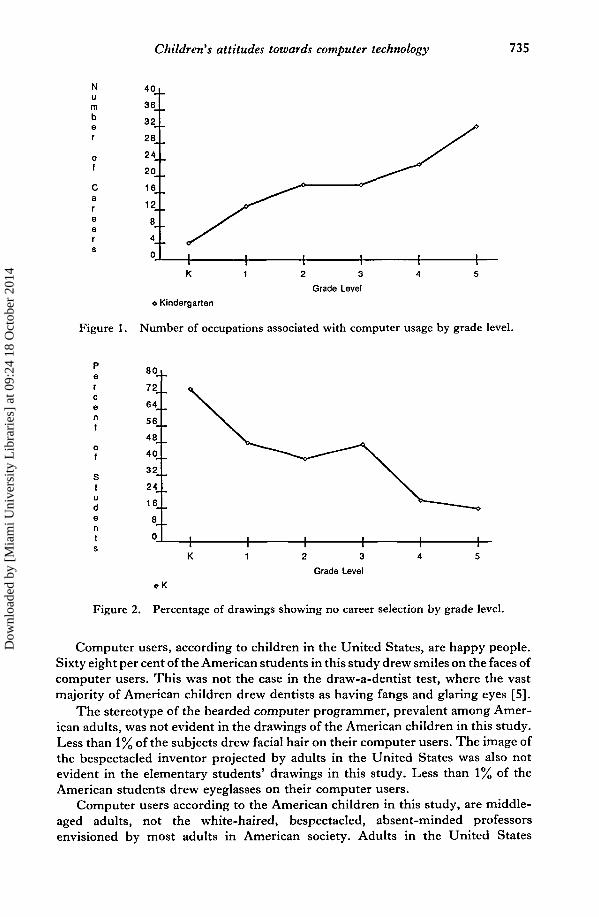
Subjects in Kindergarten and first grade tended to identify relatively few careersinvolved with the use of computers. Teachers, office workers, and bankers were themost common occupations identified by early elementary students as beingassociated with computer usage. By fifth grade, American students identified 32careers as being related to computer usage (Figure 1). As students mature, adivergent image, rather than a single convergent image, of computer usage emerges.
American students in early elementary grades do not clearly differentiate amongoccupations. The representation of the computer user depicted by young children is'generic' in nature. Gradually, students move from no identifiable occupation intheir drawings, 74% of kindergarten students tested, indicated no particular careerassociated with computer usage. Strong stereotyped images of particular occup-ations emerged by fifth grade. Only 16% of fifth grade students indicated noparticular occupational icons or symbols in their drawings. (See Figure 2).
Detectives, auto mechanics, insurance agents, police officers, newspaperreporters, astronauts, telephone operators, airline pilots, architects, computerprogrammers, and travel agents are clearly identified as being occupations withwhich American students associate computer usage. Eighty-three per cent of theAmerican students in fifth grade voluntarily labeled their drawings with the title ofthe job or profession associated with computer usage.
The stereotypical 'mad scientist' or 'crazy inventor' image that adults in theUnited States associate with computer users was not projected by subjects in thisstudy. The stereotypical image of the technologist held by adults (the fluffy white-haired senior citizen standing in a laboratory full of books, robots, and weirdparaphernalia, holding a beaker in his hand, and shouting 'Eureka'!) did not appearin student drawings.
Table 1. Mean number of computer workstation indicators per student by grade level.
KindergartenFirst gradeSecond gradeThird gradeFourth gradeFifth grade
Samplesize
362553754813906
1494
Number ofindicators
64413112066265034165946
Mean indicatorsper student
1-782-372-743-263-773-98
Dow
nloa
ded
by [
Mia
mi U
nive
rsity
Lib
rari
es]
at 0
9:24
18
Oct
ober
201
4
Children's attitudes towards computer technology 735
Number
0f
Care
rs
40 .
36_
32,
28.
24,
20_
16
8_
4_
0
>
1K
o Kindergarten
rcent
of
Students
2 3
Grade Level
Figure 1. Number of occupations associated with computer usage by grade level.
807 2 .
64.
56.
48,
40,
32,
24,
16,
8,
0
2 3
Grade Level
oK
Figure 2. Percentage of drawings showing no career selection by grade level.
Computer users, according to children in the United States, are happy people.Sixty eight per cent of the American students in this study drew smiles on the faces ofcomputer users. This was not the case in the draw-a-dentist test, where the vastmajority of American children drew dentists as having fangs and glaring eyes [5].
The stereotype of the bearded computer programmer, prevalent among Amer-ican adults, was not evident in the drawings of the American children in this study.Less than 1% of the subjects drew facial hair on their computer users. The image ofthe bespectacled inventor projected by adults in the United States was also notevident in the elementary students' drawings in this study. Less than 1% of theAmerican students drew eyeglasses on their computer users.
Computer users according to the American children in this study, are middle-aged adults, not the white-haired, bespectacled, absent-minded professorsenvisioned by most adults in American society. Adults in the United States
Dow
nloa
ded
by [
Mia
mi U
nive
rsity
Lib
rari
es]
at 0
9:24
18
Oct
ober
201
4
736 R. H. Barba
stereotype scientists and technologists as being eccentric senior citizens; children donot project this same image in their drawings. Sixteen percent of the subjects in thisstudy drew children as computer users, 13% of the subjects drew senior citizens ascomputer users; however, most children (71%) drew mature or middle-aged adultsas being computer users.
Previous studies [7,14,15] indicate that American children view science andtechnology careers as being primarily male domains. The average American adultalso stereotypes the typical computer user as being male. Children in this study,regardless of their gender, do not share this stereotype. Indeed, 56% of the Americanelementary students in this study drew female computer users, while 43% of theAmerican children drew male computer users (1% of the drawings contained humanfigures with no identifiable gender). Business executives, secretaries, teachers,students, scientists, computer programmers, writers, librarians, astronauts, doctors,and bankers are the most common computer users according to Americanelementary-aged subjects in this study.
6. ConclusionsFrom this study, it may be concluded that the stereotypical image of scientists
and technologists commonly found in American adults is not present in Americanelementary school children. American children do not form a convergent image ofcomputer users over time as they do with teachers, dentists, and scientists. Adivergent image of computer users emerges as children mature. Computer usage, inthe drawings of American children, is not a separate profession. Computer usage isintegrated into existing occupations. Elementary school children in the UnitedStates regard computer users as being those individuals who regularly use computersin the performance of their jobs.
Further validity studies could be conducted on this instrument. Differencesbetween known groups; such as, students who have had extensive computer trainingand those who have had minimal computer training could be explored. Differencesbetween attitudes of students of different genders, ethnic groups, and socio-economic groups could also be explored.
Because the draw-a-computer user test does not rely on verbal response, it can beutilized at an earlier age than other attitude instruments. This factor also allows forthe usage of this instrument with children who have limited English languageproficiency. The draw-a-computer user test is easier to administer to students thanmost attitude tests since it requires minimal instructions from the test administratorand minimal materials. The interpretation of the results of this instrument; however,is more cumbersome than traditional multiple choice, pencil-and-paper assessmentinstruments.
Stereotypical images of computer users held among the adult population in theUnited States did not emerge in the children in this study. It may be that suchstereotypes do emerge among older students, or it may be that the use of computertechnology is viewed differently by American children than by adults in the UnitedStates. This study could be replicated with older students to determine if images ofcomputer users change as students mature and are exposed to other experiences inthe educational process. The draw-a-computer user test is probably more useful inidentifying attitudes than in actually measuring attitudes. This instrument mayultimately prove more useful for researchers as a tool for constructing hypothesesregarding students attitudes than in the testing of those attitudes.
Dow
nloa
ded
by [
Mia
mi U
nive
rsity
Lib
rari
es]
at 0
9:24
18
Oct
ober
201
4
Children's attitudes towards computer technology 737
References[1] CHAMBERS, D. W., 1983, 5a. Educ, 67, 255-265.[2] SHERWOOD, M., 1970, New Set., 47, 382-384.[3] PION, G. M., and LIPSEY, M. W., 1981, Public Opinion Quarterly, 45, 303-316.[4] SCHIBECI, R. A., and SORENSEN, I., 1983, School Sci. Math., 81, 14-20.[5] PHILLIPS, S., 1980, Canadian Family Physician, 26, 1171-1174.[6] KLEPSCH, M., and LOGIE, L., 1982, Children Draw and Tell: An Introduction to the
Projective Uses of Children's Human Figure Drawings (New York: Brunner/Mazel).[7] GOODENOUGH, F. L., 1926, Measurement of Intelligence by Drawings (New York:
Harcourt Brace).[8] MUELLER, D. J., 1986, Measuring Social Attitudes (New York: Columbia University
Teachers College).[9] DENNIS, W., 1966, Group Values Through Children's Drawings (New York: John Wiley).
[10] HARRIS, D. B., 1963, Children's Drawings as Measures of Intellectual Maturity: ARevision and Extension of the Goodenough Draw-a-man Test (New York: HarcourtBrace).
[11] HARRIS, D. B., ROBERTS, J., and PINDER, G. D., 1970, Intellectual maturity of children asmeasured by the Goodenough-Harris Drawing Test, (National Center for HealthStatistics. Series II, No. 105. Washington, DC: U.S. Dept. of Health, Education, andWelfare).
[12] WELCH, I. D., FLANNIGAN, M. W., and RAVE, E. J., 1971, The Innovator, 2, 28-29.[13] HAYS, W. L., 1967, Quantification in Psychology (Belmont, CA: Brooks and Cole).[14] MULKEY, L. M., 1989, J. Res. Sci. Teaching, 26, 737-753.[15] SMITH, W. S., and ERB, O., 1986, J. Res. Sci. Teaching, 23, 667-676.
Dow
nloa
ded
by [
Mia
mi U
nive
rsity
Lib
rari
es]
at 0
9:24
18
Oct
ober
201
4