Embed Size (px)
Citation preview
1
Assessing Attitudes on Policies Concerning theNon-Citizen Population
1.1 Introduction to Public Opinion
It well known and widely observed that policy preferences differ across racial groups
in the United States (Kinder and Sanders, 1990; Sigelman and Welch, 1991; Kinder
and Sanders, 1996; Gilens, 2000; Kinder and Winter, 2001; Griffin and Newman,
2008; Winter, 2008; Abrajano and Alvarez, 2010). The literature on Black and White
public opinion in particular highlights how these groups differ on general social and
economic issues and especially on issues concerning race, such as affirmative action
(Kinder and Sanders, 1996). More recently, scholars have considered new dividing
lines in society, showing how ideology and opinions vary not only between Blacks
and Whites, but also between these groups and other racial and ethnic groups most
notably, Latinos (Griffin and Newman, 2008). In this chapter, I expand on existing
studies of racial group opinions to consider how Whites, Blacks and Latinos view
one particular dimension of policy: policy concerning non-citizen Latinos.
Because I explore a policy area that directly affects a subgroup of Latinos, I
1
also examine variation of opinion within the Latino community. Overall, it has
been shown in the literature that Latino subpopulations differ considerably in their
attitudes on both immigration and non-immigration related policies (de la Garza
et al., 1992; Hood and Shirkey, 1997; Leal, 2007; Branton, 2007; Rouse, Wilkinson and
Garand, 2010). For this reason, it is important to assess if and how preferences and
priorities on policies concerning the non-citizen subpopulation vary across key Latino
groups, particularly between non-citizen and citizen Latinos and across different
generations within the Latino citizen population. By drawing such comparisons in
this chapter, my goal is to determine whether lawmakers representing the interests of
non-citizen Latinos are responding to the preferences of all constituents, just Latino
constituents, or a subpopulation of the Latino community.
Results of my analysis show that while the Latino population is significantly
more supportive of policies to benefit non-citizen Latinos when compared to other
racial/ethnic groups, differences within the Latino population remain. Specifically,
I find that attitudes vary across generational groups. While non-citizen and first-
generation citizen Latinos are overwhelmingly in favor of policies to benefit the non-
citizen population, second-plus generation Latinos are, in many cases, much less
likely to favor these policies and are more likely to favor restrictionist measures.
Tying to my theory of legislative ambition, these results suggest that lawmakers
representing non-citizen Latinos are not working in the interest of all constituents,
or even all Latino constituents but rather, are specifically working in line with the
preferences of both first-generation Latino citizens and non-citizens themselves. My
argument, which is tested in subsequent chapters, is that as the voting power (Griffin
and Newman, 2013) of each of these subpopulations rises, i.e. as they make up larger
proportions of either the short-term (in the case of first-generation citizen Latinos)
or long-term (in the case of non-citizen Latinos) reelection constituency, lawmakers
will be more likely to engage in activities to support non-citizen interests.
2
1.2 Non-Citizen Latino Interests
In this dissertation, my primary focus is on policies that concern the specific interests
of non-citizen Latinos. In this case, it is important to draw a distinction between the
specific and general interests of this group. I define specific interests as those policies
and positions that concern one distinct group, in this case non-citizens Latinos,
while general interests are those that are shared by more than one group. This
distinction has been outlined most clearly for the Black and Latino population by
Kathleen Bratton (2006). In analyzing the behavior of Latino lawmakers, Bratton
considers how lawmakers respond to issues that specifically concern Latinos and
those that are important to Latinos but are also relevant to other minorities. Issues
such as education, health, welfare and policies concerning children are identified
by Bratton as being important to Latinos, yet are also salient to other minority
groups, including African Americans. On the other hand, there are also interests
that Bratton identifies as specific to Latinos. These include “measures to decrease
discrimination against Latinos or alleviate the effects of discrimination, measures
designed to improve the economic status of Latinos, programs to address the specific
needs of Latinos (including programs designed for LEP (Limited English Proficiency)
students), programs designed to highlight Latinos contributions to American society,
programs to address Latina pregnancy, and programs designed to protect the health,
welfare and safety of migrant workers or new or illegal immigrants” (Bratton, 2006).
In this project, I further refine this categorization to consider the interests of
a specific subset of the Latino population. In defining the interests of non-citizen
Latinos, I consider both issues, policies, and programs that provide distinct benefits
to non-citizen Latinos and those that produce distinct costs for this group. Measures
to benefit non-citizen Latinos include: policies to provide non-citizens with access to
benefits such as health care and education (including measures to grant non-citizens
3
in-state tuition rates), expand or institute new guest worker programs, allow the
matricula consular1 to be considered an acceptable form of identification, to remove
citizenship requirements for access to children’s benefits, prohibit the collection of
immigration status information, programs to assist non-citizens in the naturalization
process and programs to provide non-citizens who are victims of human trafficking
access to protection and benefits. I also consider any programs designed to protect
the health, welfare and safety of migrant workers or new or illegal immigrants a
specific non-citizen Latino interest, although such measures were originally classified
by Bratton as a “Latino interest” more broadly. Measures I examine that produce
clear costs for non-citizen Latinos include policies that: increase border security
measures, require proof of citizenship in order to obtain a driver’s license or vehicle
title, prohibit non-citizens from receiving certain public benefits (including welfare,
health care, and child care), exclude non-citizens from access to worker’s compensa-
tion programs, require law enforcement or public housing authorities to determine
the immigration status of person, make it easier for law enforcement officials to ar-
rest and transport unauthorized immigrants, ban the state from accepting consular
identification, and require employers to use the E-verify database (a federally run
employment verification program) to determine the immigration status and eligibility
of their workers.
1.3 Data Sources: Attitudes on Non-Citizen Latino Interests
In the first part of this chapter, I examine White,2 Black and Latino attitudes on
issues that are classified as being in the specific interest of non-citizen Latinos. In
order to examine the attitudes of these groups together, I rely on three primary
1 The Mexican Consular Identification Card
2 In references White attitudes throughout this dissertation I am specifically referring to non-Hispanic Whites.
4
sources: the 2008 American National Election Study (ANES), the 2006 Cooperative
Congressional Election Study (2006 CCES) and the 2010 Cooperative Congressional
Election Study (2010 CCES). The 2008 ANES data is particularly useful for my
purposes because the study contained an oversample of both Blacks and Latinos
(Black; N=569, Latino; N=509). In the 2006 and 2010 CCES surveys, there are also
large numbers of Black and Latino respondents (the 2006 CCES contained 3,389
Latino respondents and 3,693 Black respondents while the 2010 CCES contained
3,774 Latino respondents and 6,524 Black respondents).3 While these three surveys
do not cover the full range of specific non-citizen Latino interests, they do include a
variety of questions that fall into this category, including those concerning opening
a path to citizenship for illegal immigrants, guest worker programs, and increasing
immigration enforcement measures.
As a next step in my analysis, I examine variations in opinion among Latinos,
assessing both citizen and non-citizen attitudes and attitudes across generational
groups. I continue to rely on responses to the 2010 CCES survey mentioned above
(as this survey contains large samples of both citizen and non-citizen Latinos), yet
also draw on results from two additional surveys that only include self-identified
Latino/Hispanic respondents: The 2006 Latino National Survey (LNS) and the 2007
National Survey of Latinos (NSL).4 The LNS was conducted November 17, 2005
through August 4, 2006 and contains a sample of 8,634 Latinos. The NSL was
conducted by telephone from October 3 through November 9, 2007 and contains a
sample of 2,003 Hispanic adults. These surveys are particularly useful for this study
because they include responses from a significant number of non-citizen and first-,
and second-plus generation citizen Latinos5 and they ask questions on more specific
3 However, some questions were only asked of a subset of people, thus reducing the sample White,Black and Latino respondents for these questions
4 I do not use the 2008 ANES in this analysis because the survey only includes citizens respondents
5 Non-citizens include both documented and undocumented non-citizens, first-generation Lati-
5
programs and policies that directly concern non-citizens including some questions
that mirror those in the CCES and ANES, and additional questions on subjects such
as immigrant identification and in-state tuition for undocumented college students.
1.4 Policy Preferences of Latinos, Whites, and Blacks
Many prior studies have found significant differences in opinion between Latinos,
Blacks and Whites on a variety of policy issues and programs (Kinder and Sanders,
1990; Sigelman and Welch, 1991; Kinder and Sanders, 1996; Gilens, 2000; Kinder
and Winter, 2001; Griffin and Newman, 2008; Winter, 2008; Abrajano and Alvarez,
2010). In studies of Latino and White attitudes, scholars have found that in general,
Whites tend to be more conservative on both broad social and economic policies
and more race specific policies, including bilingual education and affirmative action
(de la Garza et al., 1992; Uhlaner and Garcia, 2002; Leal, 2007; Griffin and Newman,
2008). On the issue of immigration in particular, scholars have shown that Lati-
nos are typically more supportive of granting benefits to immigrants and are more
likely to favor open immigration policies when compared to Non-Hispanic Whites.
While Griffin and Newman (2008), find that approximately equal portions of Latinos
and Whites believe that the rate of immigration to the United States is a serious
problem, other scholars find that the attitudes of Whites on specific policies concern-
ing immigration and the rights of non-citizens/undocumented immigrants are much
more restrictive. Binder et al (1997) for example, compared the attitudes of Mexican
Americans and Whites and found that Mexican Americans are far more likely to fa-
vor policies granting amnesty to undocumented immigrants and admission to public
schools for children of undocumented immigrants. A more recent study conducted
by Rocha et al (2011) concluded that Whites are generally more likely to believe that
nos are individuals who were born outside of the U.S. and became naturalized and second-plusgeneration Latinos are individuals who were born in the United States.
6
immigrants have a negative impact on the economy, that the U.S. should decrease
levels of immigration, and that the U.S. should work to build a fence along the U.S.-
Mexico border. However this study, along with others in field (Berg, 2009; Hopkins,
2010), suggest that these anti-immigrant sentiments of Whites are often conditional
on the ethnic context in which they live. Other factors such as media exposure,
acculturation fear, and immigrant skill level are also found to affect White attitudes
(Hainmueller and Hiscox, 2010; Branton et al., 2011; Dunaway et al., 2011).
Several scholars assessing the attitudes of African Americans focus on the dif-
ferences between this group and Whites. Such studies generally conclude that the
mean opinions of Blacks and Whites differ considerably on issues directly related to
race such as affirmative action, job discrimination, and civil rights, and somewhat
less so on implicit racial issues such as education, health care and welfare spending
(Kinder and Sanders, 1996; Lubin, 1997; Canon, 1999). On the issue of immigra-
tion, results concerning the differences between Black and White attitudes have been
mixed. Some scholars have found that while Black and White opinions on the issue of
immigration are very similar, Blacks tend to be somewhat less supportive of restric-
tive immigration policies (Kinder and Sanders, 1996; Canon, 1999). Newer studies
have concluded that despite rising economic competition between Blacks and Latinos
(McClain, 1993; Camarota, 1998; Borjas, Grogger and Hanson, 2006), African Amer-
icans continue to hold more liberal views on the immigration issue largely because
they base their opinions on symbolic considerations rather than economic factors.
Brader et al (2010), for instance, argue that because Blacks identify with oppressed
groups, including immigrants, they tend to take less restrictive or punitive positions
on immigration-related policies. In this study, it was found that in comparison to
Whites, Blacks are less likely to support decreasing immigration levels overall and
are less supportive of hunting down and deporting illegal immigrants. They are
also more likely to favor providing benefits to illegal immigrants and more likely to
7
say that immigrants improve American culture (Brader et al., 2010). On the other
hand, McClain et al (2009) find that economic tensions between Blacks and Latinos
are becoming more prominent, especially in some southern states, and as a result,
Blacks are beginning to feel threatened by the Latino immigrant presence. Such
results imply that in certain contexts, Black attitudes on immigration may be more
restrictive.
To date, no studies have directly compared the opinions of Blacks and Latinos
on the issue of immigration. While existing research suggests that Black and Latino
attitudes may be closer than White and Latino attitudes, direct comparisons have yet
to be made. In this analysis, I assess the relation between Black, White and Latino
attitudes on policies and issues that specifically concern the non-citizen portion of
the immigrant population. In examining attitudes of all three of these groups, my
goal is not only to determine whether attitudes vary by race, but also to evaluate
whether Whites, Blacks, and Latinos align or diverge on these issues. By comparing
Black and Latino attitudes and White and Latino attitudes directly, I will be able
to determine which groups, if any, share opinions on policies affecting non-citizens.
These results will have important implications for studies of coalition formation and
policy development on the issue of immigration and the rights of non-citizens.
1.5 Measurements: Latino, White, and Black Attitudes
To examine attitudes on policies and programs directed at non-citizens, I rely on
two questions from the 2008 ANES, two questions from the 2006 CCES, and one
question from the 2010 CCES. To begin, I consider questions that address the issue
of providing a path to citizenship or granting legal status to undocumented or illegal
immigrants. Each of the three surveys asks some version of the ‘path to citizenship’
question, thus I find it appropriate to examine responses to these questions together.
The 2008 ANES asks respondents whether they “favor, oppose, or neither favor nor
8
oppose the U.S. government making it possible for illegal immigrants to become U.S.
citizens.”6 The 2006 CCES includes a similar question, asking respondents whether
they would support a Senate proposal that would “open a path to citizenship for
current illegal immigrants” or a House proposal, which “contains stricter enforcement
and deportations of undocumented aliens.”7 Finally, the 2010 CCES asks a question
on what Congress and the President should do about immigration, giving respondents
the option of selecting all responses that apply, one of which is to ”grant legal status
to all illegal immigrants who have held jobs and paid taxes for at least three years,
and not been convicted of any felony crimes.”8 Although these three questions differ
in structure and wording, because they all deal with the issue of providing a path
to citizenship or legal status for illegal immigrants specifically, I am confident that
they are tapping into the same dimension of the issue and therefore, that responses
will be comparable. Given that the structure of these questions differ, there is also
the added benefit of using these three surveys, as they provide additional robustness
checks on attitude variation between racial/ethnic groups on this issue.
As a next step in my analysis, I consider questions on the issue of temporary or
guest worker programs for non-citizen immigrants. The 2008 ANES asks respondents
whether they “favor, oppose or neither favor nor oppose allowing illegal immigrants
to work in the United States for up to three years, after which they would have
6 In generating a dependent variable using this question, I code those who favor making it possiblefor illegal immigrants to become citizens as “1”, those who oppose as “-1” and those who neitherfavor nor oppose as “0.”
7 For my purposes, I code responses to this question as a “1” if the respondent favors the Senatepolicy (opening a path to citizenship) and a “0” if he/she favors the House policy (mandatingstricter enforcement and deportations of illegal aliens)
8 Using this question, I generate a variable that is coded as a “1” if the respondent selected theoption of granting legal status to illegal immigrants and “0” if the respondent did not select thisoption. Other options given to respondents include: “fine businesses that hire illegal immigrants,”“increase the number of guest workers allowed to come legally to the U.S.,” “increase the numberof border patrol on the U.S.-Mexican border,” and “allow police to question anyone they think maybe a in the country illegally.”
9
to go back to their home country.”9 The second question I use to assess attitudes
on guest worker programs is drawn from the 2010 CCES. Again, the question on
the 2010 CCES asks respondents what Congress and the President should do about
immigration, with one of the response options being “increase the number of guest
workers allowed to come legally to the U.S.”10
While I analyze these questions together (as they both address the acceptability
of guest worker programs), unlike with the previous set of questions on providing a
path to citizenship for illegal immigrants, I do not claim that they are measuring the
same attitude. To the contrary, I argue that they are actually tapping into different
dimensions of the debate on guest worker programs. While the 2008 ANES asks
about the acceptability of allowing illegal immigrants to work temporarily in the
U.S., the 2010 CCES asks about increasing the number of legal guest workers to the
U.S. Essentially, these two questions are priming different sides of the legality aspect
of guest worker programs and for this reason, I except responses to differ across these
questions and also between Whites, Blacks, and Latinos.
Finally, I examine two additional response options to the 2010 CCES question on
immigration, both of which address immigration enforcement measures that produce
clear costs for non-citizens. In response to the question “What do you think Congress
and the President should do about immigration?” respondents are given the option
of selecting “increase the number of border patrol on the U.S.-Mexican border” and
“allow police to question anyone they think may be in the country illegally.” For
each of these possible responses, I create a variable denoting whether the respondent
selected that option (coded as “1”) or whether they did not (coded as “0”).
9 I code this question as I did the previous ANES question, with a “1” representing those whofavor the policy, a “-1” representing those who oppose and a “0” representing those who neitherfavor nor oppose the policy.
10 In my analysis, I generate a variable noting whether the respondent selected this option (codedas “1”) or whether they did not (coded as “0”).
10
For each of the dependent variables I create using these three surveys, I estimate
either a logit model or an ordered logit model with race/ethnicity of the respondent
serving as the key independent variable(s) of interest. I only include Latino, Black
and non-Hispanic White survey respondents in my analysis, generating independent
indicators for non-Hispanic Whites11 and Black12 while keeping Latino/Hispanics as
my out group. I also include a number of controls in my models that have been shown
to shape attitudes toward immigration policy. These include standard socioeconomic
and demographic factors such as household income, gender, and education (Binder,
1997). I also include a measure of age and partisan identification (Democratic and
Republican indicators) and a control for a respondent’s religion, which I measure
using an indicator of Roman Catholic religious affiliation. I include this measure
because previous research has shown that Roman Catholics are more likely to feel
empathy for, and are thus more supportive of, policies to benefit racial and ethnic
minorities when compared to members of other religious denominations (Fetzer, 1998;
Knoll, 2009).
The 2008 ANES also allows me to control for a variety of additional factors that
have been seen to condition attitudes on immigration. Specifically, in the ANES
models I include a Latino stereotype measure (generated using a question asking re-
spondents to place Latinos on a 7-point scale ranging from “hardworking” to “lazy”)
and a Latino feeling thermometer.13 Previous studies have shown that these group
valuation measures have a significant effect on immigration attitudes, especially in
recent years as the debate on immigration has become closely tied to the Latino
community (Ayers et al., 2009; McClain, 2009; Branton et al., 2011). In addition, I
include a Moral Tolerance measure, drawn from a scale developed by Conover and
11 1:non-Hispanic White; 0:otherwise
12 1:Black; 0:otherwise
13 Which is normalized to a “0” to “1” scale
11
Feldman (1999). This scale measures an individual’s acceptance of cultural change
and changing moral standards. The items used to compile this scale ask respondents
about adjusting “our view of moral behavior”; the extent to which “newer lifestyles
are contributing to the breakdown of society”; the degree to which we “should be
more tolerant of people who choose to live according to their own moral standards,
even if they are different from our own”; and the belief that the “country would have
fewer problems if there were more emphasis on traditional family ties.” These items
are Likert-scored and the resultant scale is coded from “0” to “1,” with higher scores
reflecting a higher level of moral tolerance and acceptance of change. Using a similar
scale, Branton et al (2011) found that since 9/11, an individual’s level of moral tol-
erance has come to have a significant effect on immigration attitudes. Specifically,
these scholars discovered that individuals who are less morally tolerant, or in other
words, those with higher levels of moral traditionalism, are much more likely to favor
a decrease in immigration levels to the United States.
1.6 Results: Latino, White, and Black Attitudes
Beginning with the assessment of attitudes on providing a path to citizenship or
granting legal status to undocumented or illegal immigrants, I find that significant
differences exist across racial/ethnic groups. As shown in Table 1.1, Latinos are
significantly more likely to support policies to grant legal status or provide a path to
citizenship for undocumented immigrants than Blacks or non-Hispanic Whites, even
when controlling for key socioeconomic, demographic and even attitudinal factors.
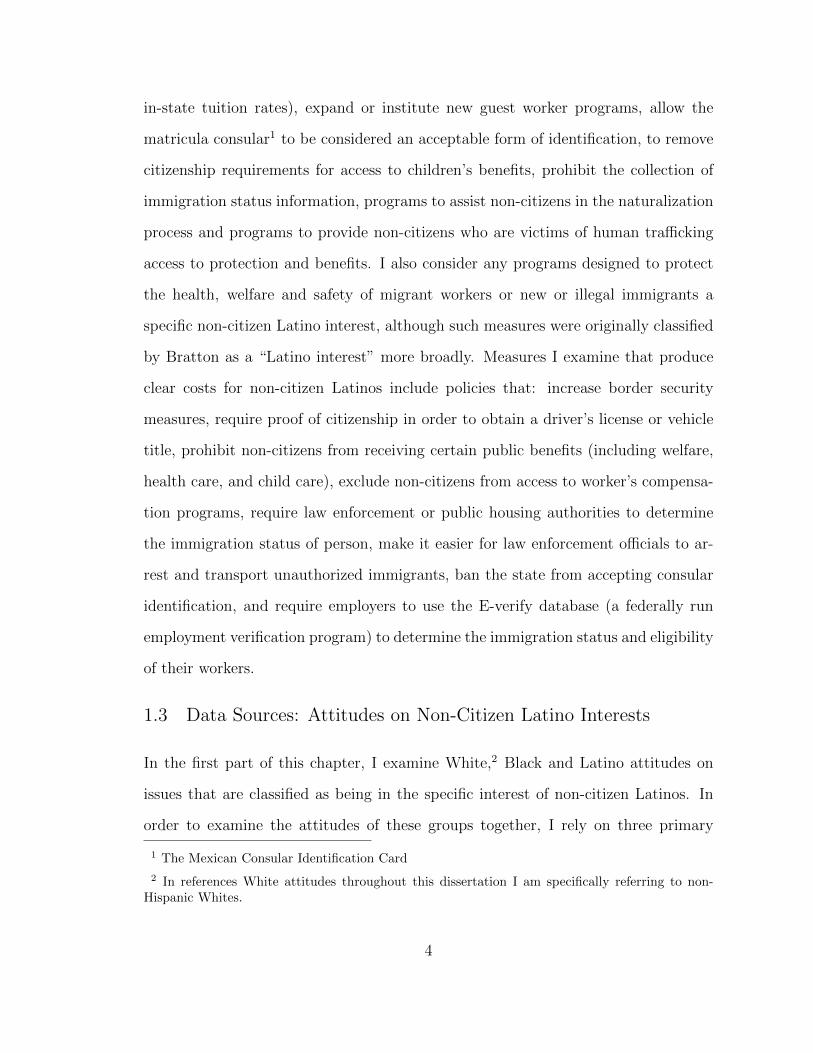
Figure 1.1, which shows the predicted probabilities and 95% confidence intervals
on these estimations,14 demonstrates that while Black and White attitudes are often
very close or even indistinguishable on these issues, Latino attitudes are significantly
14 I estimate these predicted probabilities for male, Democratic, non-Catholics with income, edu-cation and age set at the sample mean.
12
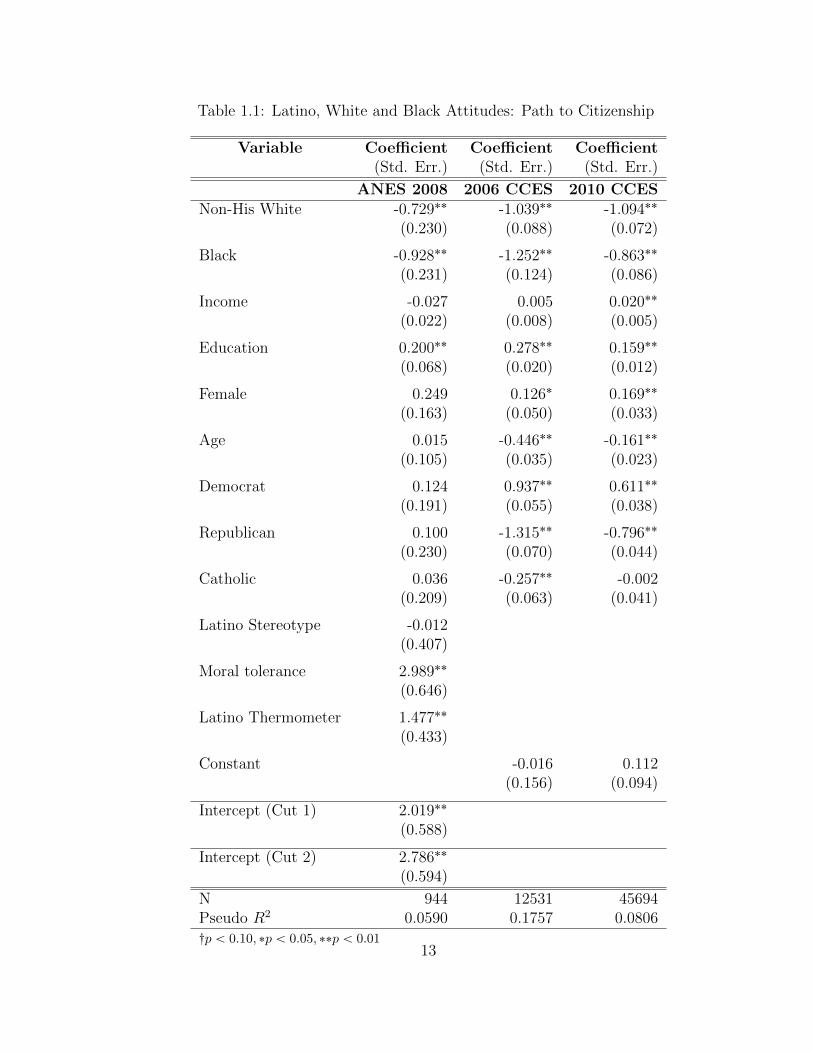
Table 1.1: Latino, White and Black Attitudes: Path to Citizenship
Variable Coefficient Coefficient Coefficient(Std. Err.) (Std. Err.) (Std. Err.)
ANES 2008 2006 CCES 2010 CCESNon-His White -0.729˚˚ -1.039˚˚ -1.094˚˚
(0.230) (0.088) (0.072)
Black -0.928˚˚ -1.252˚˚ -0.863˚˚
(0.231) (0.124) (0.086)
Income -0.027 0.005 0.020˚˚
(0.022) (0.008) (0.005)
Education 0.200˚˚ 0.278˚˚ 0.159˚˚
(0.068) (0.020) (0.012)
Female 0.249 0.126˚ 0.169˚˚
(0.163) (0.050) (0.033)
Age 0.015 -0.446˚˚ -0.161˚˚
(0.105) (0.035) (0.023)
Democrat 0.124 0.937˚˚ 0.611˚˚
(0.191) (0.055) (0.038)
Republican 0.100 -1.315˚˚ -0.796˚˚
(0.230) (0.070) (0.044)
Catholic 0.036 -0.257˚˚ -0.002(0.209) (0.063) (0.041)
Latino Stereotype -0.012(0.407)
Moral tolerance 2.989˚˚
(0.646)
Latino Thermometer 1.477˚˚
(0.433)
Constant -0.016 0.112(0.156) (0.094)
Intercept (Cut 1) 2.019˚˚
(0.588)
Intercept (Cut 2) 2.786˚˚
(0.594)
N 944 12531 45694Pseudo R2 0.0590 0.1757 0.0806:p ă 0.10, ˚p ă 0.05, ˚˚p ă 0.01
13
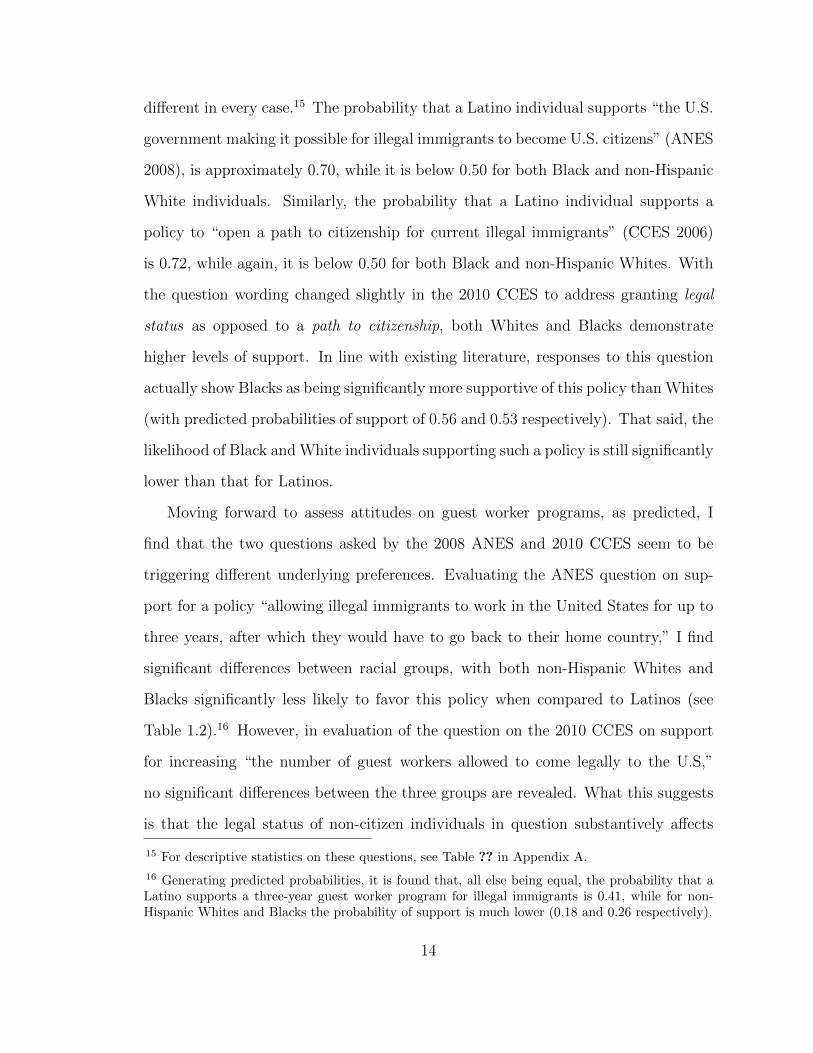
different in every case.15 The probability that a Latino individual supports “the U.S.
government making it possible for illegal immigrants to become U.S. citizens” (ANES
2008), is approximately 0.70, while it is below 0.50 for both Black and non-Hispanic
White individuals. Similarly, the probability that a Latino individual supports a
policy to “open a path to citizenship for current illegal immigrants” (CCES 2006)
is 0.72, while again, it is below 0.50 for both Black and non-Hispanic Whites. With
the question wording changed slightly in the 2010 CCES to address granting legal
status as opposed to a path to citizenship, both Whites and Blacks demonstrate
higher levels of support. In line with existing literature, responses to this question
actually show Blacks as being significantly more supportive of this policy than Whites
(with predicted probabilities of support of 0.56 and 0.53 respectively). That said, the
likelihood of Black and White individuals supporting such a policy is still significantly
lower than that for Latinos.
Moving forward to assess attitudes on guest worker programs, as predicted, I
find that the two questions asked by the 2008 ANES and 2010 CCES seem to be
triggering different underlying preferences. Evaluating the ANES question on sup-
port for a policy “allowing illegal immigrants to work in the United States for up to
three years, after which they would have to go back to their home country,” I find
significant differences between racial groups, with both non-Hispanic Whites and
Blacks significantly less likely to favor this policy when compared to Latinos (see
Table 1.2).16 However, in evaluation of the question on the 2010 CCES on support
for increasing “the number of guest workers allowed to come legally to the U.S,”
no significant differences between the three groups are revealed. What this suggests
is that the legal status of non-citizen individuals in question substantively affects
15 For descriptive statistics on these questions, see Table ?? in Appendix A.
16 Generating predicted probabilities, it is found that, all else being equal, the probability that aLatino supports a three-year guest worker program for illegal immigrants is 0.41, while for non-Hispanic Whites and Blacks the probability of support is much lower (0.18 and 0.26 respectively).
14
0.69 0.72 0.75
0.42
0.47 0.50
0.41 0.42
0.56
0
0.1
0.2
0.3
0.4
0.5
0.6
0.7
0.8
0.9
ANES 2008 CCES 2006 CCES 2010
Predicted Probability=1.0
Survey Title Latino White Black
Figure 1.1: Probability of Support: Path to Citizenship/Legal Status
group attitudes. The implication of this is that certain policies, particularly those
concerning legal non-citizens or programs to recruit legal guest workers, may gain a
wider range of support. If it is assumed that lawmakers are driven by the interests of
their constituents, then we can expect that these high levels of support may in turn,
factor into a lawmaker’s decision calculus and perhaps result in policy development
and implementation.
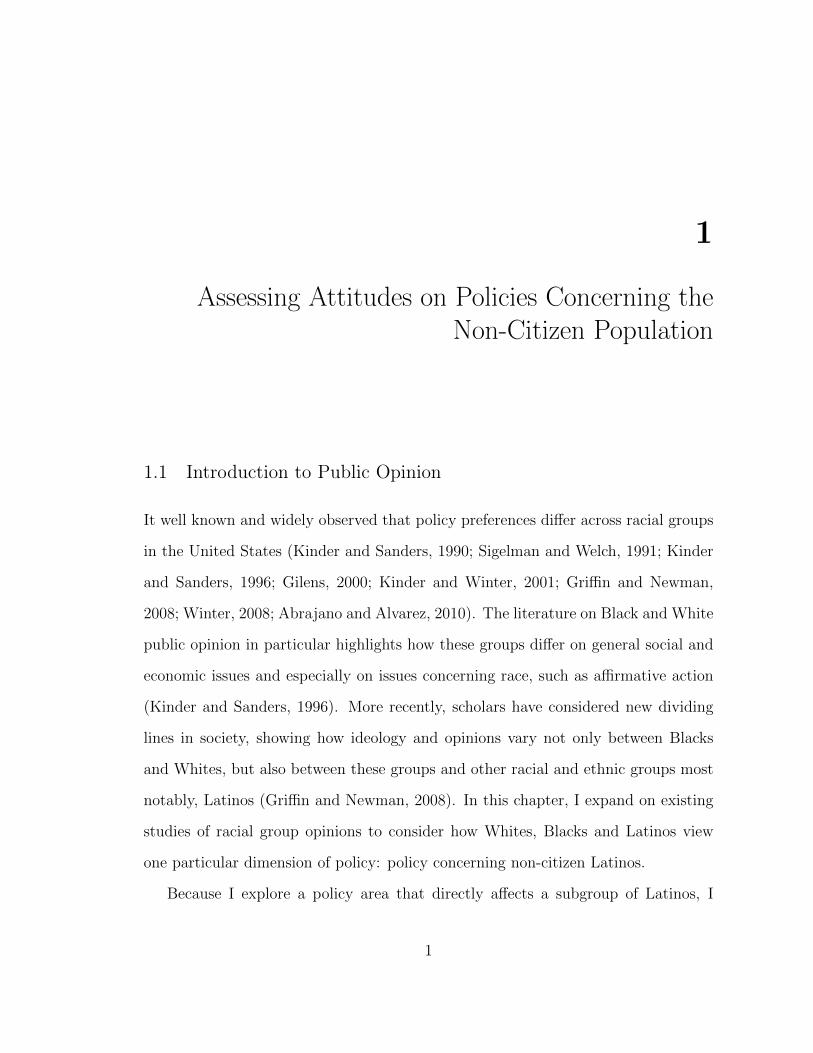
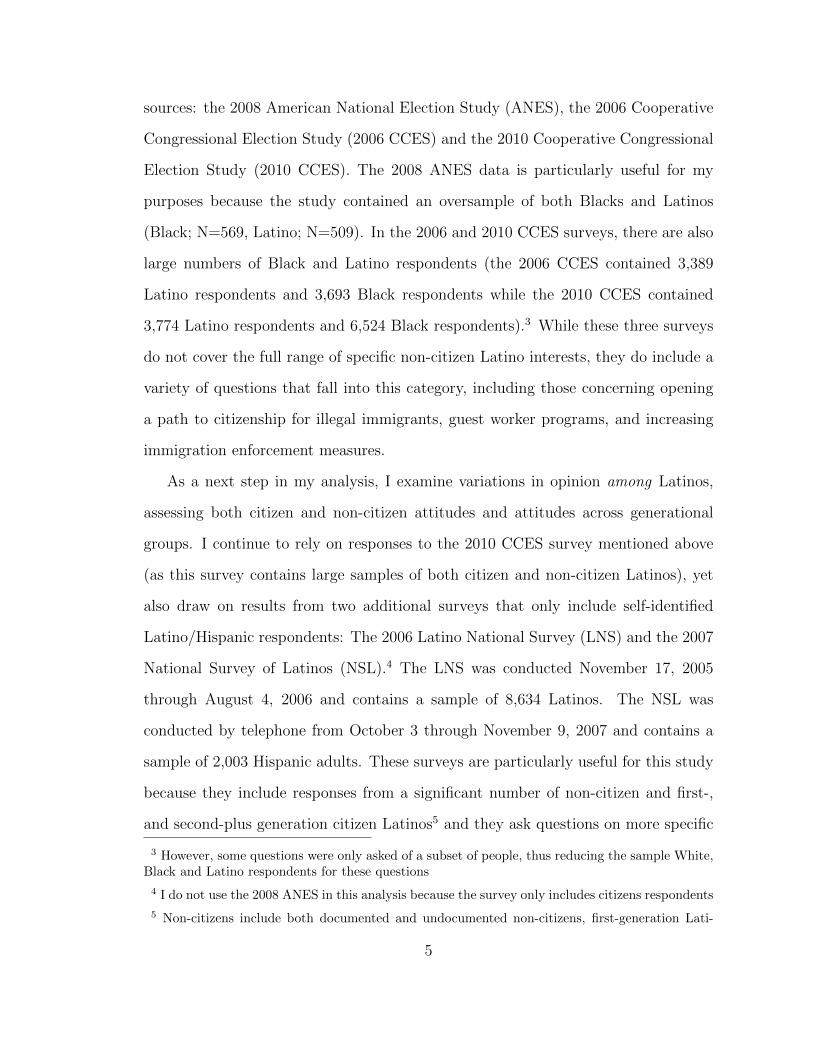
On questions concerning immigration enforcement measures, or measures that
are seen as producing distinct costs for non-citizen Latinos, I find that of the three
groups, Whites are the most likely to favor such policies. Of the 2010 CCES sample
15
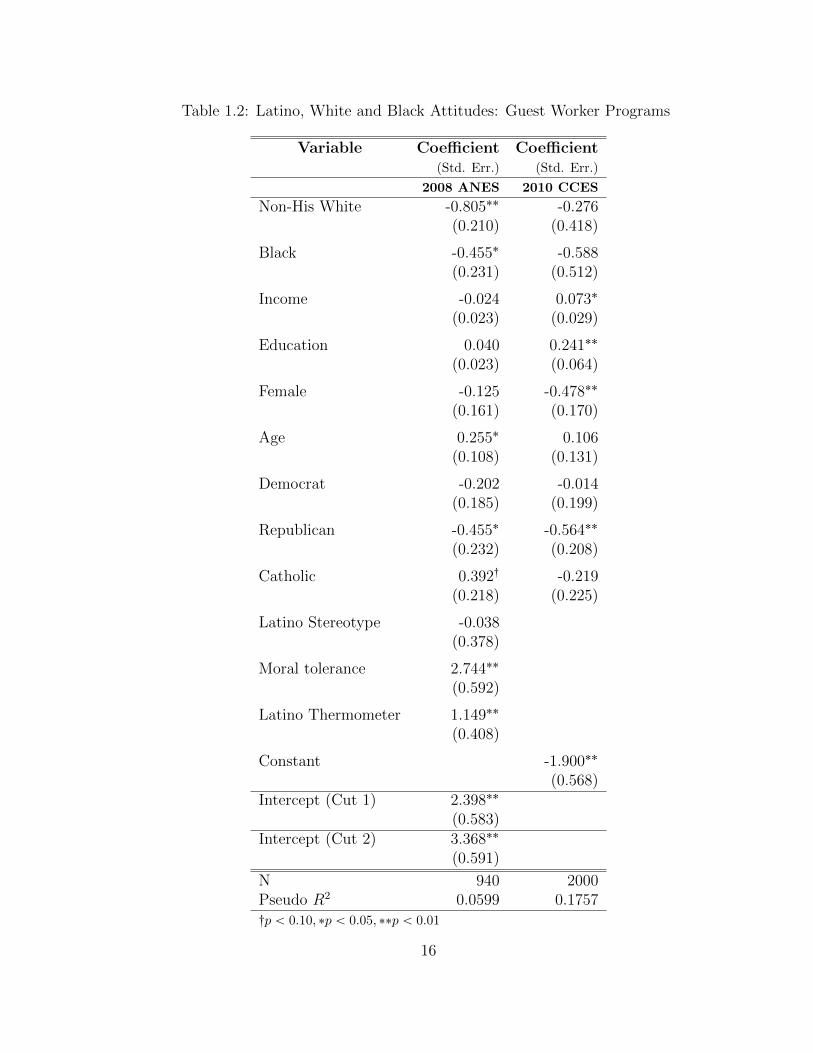
Table 1.2: Latino, White and Black Attitudes: Guest Worker Programs
Variable Coefficient Coefficient(Std. Err.) (Std. Err.)
2008 ANES 2010 CCES
Non-His White -0.805˚˚ -0.276(0.210) (0.418)
Black -0.455˚ -0.588(0.231) (0.512)
Income -0.024 0.073˚
(0.023) (0.029)
Education 0.040 0.241˚˚
(0.023) (0.064)
Female -0.125 -0.478˚˚
(0.161) (0.170)
Age 0.255˚ 0.106(0.108) (0.131)
Democrat -0.202 -0.014(0.185) (0.199)
Republican -0.455˚ -0.564˚˚
(0.232) (0.208)
Catholic 0.392: -0.219(0.218) (0.225)
Latino Stereotype -0.038(0.378)
Moral tolerance 2.744˚˚
(0.592)
Latino Thermometer 1.149˚˚
(0.408)
Constant -1.900˚˚
(0.568)Intercept (Cut 1) 2.398˚˚
(0.583)Intercept (Cut 2) 3.368˚˚
(0.591)
N 940 2000Pseudo R2 0.0599 0.1757:p ă 0.10, ˚p ă 0.05, ˚˚p ă 0.01
16
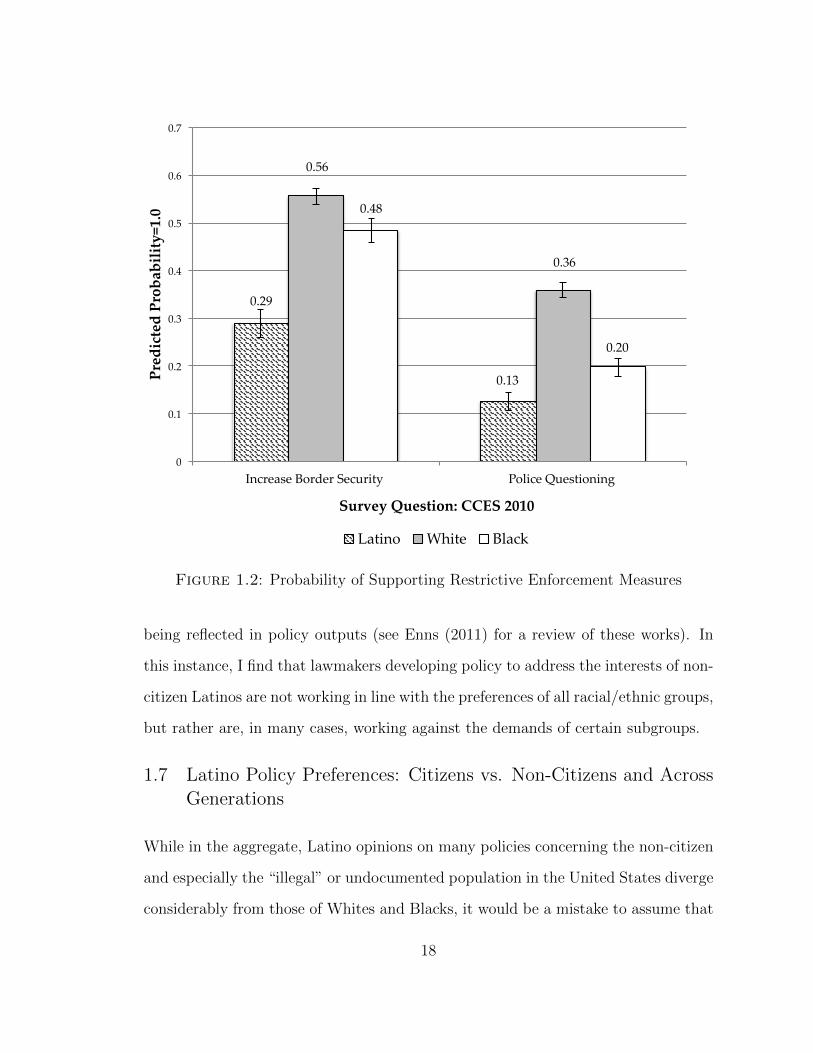
of respondents, 65% of Whites said they support a policy to “increase the number
of border patrol on the U.S.-Mexican border” while 49% of Blacks and only 41% of
Latinos said the same. Upon statistical analysis of this question, I find that these
differences across racial/ethnic groups are significant (see predicted probabilities pre-
sented in Figure 1.2). On the issue of whether to “allow police to question anyone
they think may be in the country illegally,” support levels drop for all three groups,
however, as seen in Figure 1.2, Whites remain the most supportive, with predicted
probability of support at approximately 0.36. Overall, these results fall in line with
those presented in existing literature. While Blacks are seen as less likely to favor
restrictive immigration policies when compared to Whites, perhaps for symbolic rea-
sons (Brader et al., 2010), their level of support for such measures continue to exceed
that of Latinos.
Taken together, the results for all three surveys suggest that clear attitudinal dif-
ferences exist across racial/ethnic groups on many policies concerning non-citizens.
While available data does not allow for the assessment of attitudes across all “spe-
cific” non-citizen Latino interest policies, available sources show that this issue area
is not one that sees a wide range of consensus. Although Whites, Blacks and Latinos
seem to be in relative agreement on certain policies concerning legal non-citizens,
the gap between these groups, and especially between Latinos and the rest of the
population, on policies addressing the undocumented population is significant. Par-
ticularly on policies to restrict undocumented immigrants, it is found that Whites
are the most supportive by far. On the other hand, in terms of policies to bene-
fit non-citizens and especially undocumented non-citizens, Whites show the lowest
levels of support with Blacks following as a close second.
When assessing the political representation of non-citizen Latino interests, these
attitudinal differences become extremely important. In seeking to understand who
is represented in American society, scholars work to establish who’s preferences are
17
0.29
0.13
0.56
0.36
0.48
0.20
0
0.1
0.2
0.3
0.4
0.5
0.6
0.7
Increase Border Security Police Questioning
Predicted Probability=1.0
Survey Question: CCES 2010
Latino White Black
Figure 1.2: Probability of Supporting Restrictive Enforcement Measures
being reflected in policy outputs (see Enns (2011) for a review of these works). In
this instance, I find that lawmakers developing policy to address the interests of non-
citizen Latinos are not working in line with the preferences of all racial/ethnic groups,
but rather are, in many cases, working against the demands of certain subgroups.
1.7 Latino Policy Preferences: Citizens vs. Non-Citizens and AcrossGenerations
While in the aggregate, Latino opinions on many policies concerning the non-citizen
and especially the “illegal” or undocumented population in the United States diverge
considerably from those of Whites and Blacks, it would be a mistake to assume that
18
Latino attitudes on these policies are simply uniform. Studies to date suggest that
Latino opinion on a variety of policies, including immigration, vary by a number
of factors including ethnicity, generational level and degree of cultural assimilation
(Miller, Polinard and Wrinkle, 1984; Polinard and de la Garza, 1984; Binder, 1997;
Hood and Shirkey, 1997; Branton, 2007; Rouse, Wilkinson and Garand, 2010). Cit-
izenship status has also been seen to affect Latino attitudes, however, there are
relatively few studies that have directly examined citizen and non-citizen opinions
on specific aspects of the immigration debate, including issues that directly concern
non-citizens. Michelson (2001) includes citizenship status in her analysis of the effect
of national mood on Latino opinions, but she does not consider how citizenship status
conditions support or opposition for certain policies. Similarly, Sanchez (2006) exam-
ines how citizenship status affects Latino opinion on issues such the death penalty,
abortion, and immigration levels, however he does not test whether it conditions
opinions on policies directly concerning non-citizens. Rouse, Wilkinson, and Garand
(2010) include a measure of citizenship in their model of Latino attitudes toward
legal and illegal immigration, but only find it to have a significant affect on attitudes
toward levels of legal immigration.
In an effort to expand on the existing literature and more closely examine the
dynamics of both Latino citizen and non-citizen attitudes, I continue to reply on
the 2010 CCES, yet also go further to assess responses to two additional surveys of
Latinos specifically: the 2006 Latino National Survey (LNS) and the 2007 National
Survey of Latinos (NSL). I not only consider whether attitudes vary by citizenship,
but also whether they vary across different generational groups within the Latino
citizen population.
The primary argument driving this analysis is drawn from the literature on self-
interest and policy preferences, which claims that individuals will make decisions
based out of self-interest when the policy in question offers clear benefits or costs
19
(Sears and Funk, 1991; Citrin et al., 1997; Chong, Citrin and Conley, 2001). In the
case of policies concerning non-citizen Latinos (including the undocumented popula-
tion), I argue that those individuals who have dealt with immigration, i.e. they are
or once were non-citizens, will be more likely to gain personal benefits from more
relaxed or less restrictive immigration policies. In turn, it is these individuals that
will be more likely to support policies to benefit non-citizens when compared to those
who are further removed from the immigration experience.
In evaluating this claim, an important place to begin is by examining the effect
of citizenship on attitude formation. In contrast to citizens, non-citizens are likely
to have more personal experience with immigration and current immigration-related
policies and thus, are the most likely Latino subgroup to benefit from pro-non-citizen
related policies. In addition, because these individuals are not citizens, they may
face direct personal costs as a result of harsh immigration enforcement measures.
In making such predictions however, I do not assume that all Latino citizens are
more likely to oppose more liberal immigration policies and policies to benefit non-
citizens, nor do I assume that attitudes are uniform across the entire Latino citizen
population. Rather, I continue to draw on existing literature to make the prediction
that as Latino citizens become further removed from the process of immigration or
experiences where they themselves lacked citizenship status, they will be less likely
to see personal benefits from more relaxed immigration policies and policies that
benefit non-citizens and therefore, will be less likely to support these policies. This
prediction falls in line with existing studies of Latino public opinion which show that
as generational status increases, Latinos become less inclined to support more liberal
polices related to immigration and the immigrant population (Miller, Polinard and
Wrinkle, 1984; Polinard and de la Garza, 1984; Binder, 1997; Hood and Shirkey,
1997; Branton, 2007; Rouse, Wilkinson and Garand, 2010).17
17 In addition to finding that generational status affects Latino attitudes, many scholars have
20
By assessing policy preferences across the Latino population, my hope is to 1)
expand on existing analyses of Latino public opinion and 2) consider how preference
diversity is affecting policy outputs. My argument, which is developed more thor-
oughly in later chapters, is that attitudinal differences across generations matter to
lawmakers and thus, the generational make-up of the Latino population across leg-
islative districts has significant consequences for non-citizen political representation.
1.8 Measurements and Results: Latino Citizens and Non-Citizens At-titudes
In conducting my analysis of Latino attitudes, I begin by examining differences be-
tween citizens and non-citizens. As in the section above on Latino, White and Black
attitudes, I focus on questions on issues such as opening a path to citizenship/legal
status for illegal immigrants, guest worker programs, and increasing immigration
enforcement measures. Given the nature of the LNS and the NSL, I am also able to
include additional questions on measures classified as benefiting non-citizens specifi-
cally.
One of the key issues that was seen as dividing Latinos, Blacks and non-Hispanic
Whites was the issue of providing a path to citizenship/legal status for undocumented
immigrants. Using the 2010 CCES and the 2006 LNS, I have the ability to assess
attitudes on this issue within the Latino community. Again, the 2010 CCES question
on this issue asks what Congress and the President should do about immigration,
determined that the process of acculturation, or acquiring “American” cultural traits, also influencespolicy attitudes. The argument is that as Latinos adopt American culture or become socialized inAmerican traditions (i.e. they begin to speak English, identify as American and express supportfor American symbols), they begin to take up policy positions that mirror those of the majoritypopulation, which on the issue of immigration, are far more conservative and restrictive (Binder andWrinkle, 1997; Branton, 2007). The underlying logic is that as a result of adopting American traits,Latinos become involved in social networks that provide uniquely “American” political informationand as a result, they begin to adopt native political values that are different from values drawn fromtheir country of origin (Tam Cho, 1999). While my primary concern is generational differences inattitudes, I consider this acculturation argument, using measures of cultural acquisition, specificallythose assessing language dominance, in a variety of robustness checks.
21
giving respondents the option of selecting all responses that apply, one of which is
to ”grant legal status to all illegal immigrants who have held jobs and paid taxes
for at least three years, and not been convicted of any felony crimes.” Using the
dependent variable generated using this question, I estimate a logit model with the
key independent variable of interest being the citizenship status of the individual
respondent, which is coded as a “1” for citizen Latinos and a “0” for non-citizen
Latinos.18
Through my analysis, I find that even when controlling for key socioeconomic
and demographic factors (income, education, gender, age, political partisanship, and
religious affiliation), citizenship status remains a significant factor affecting prefer-
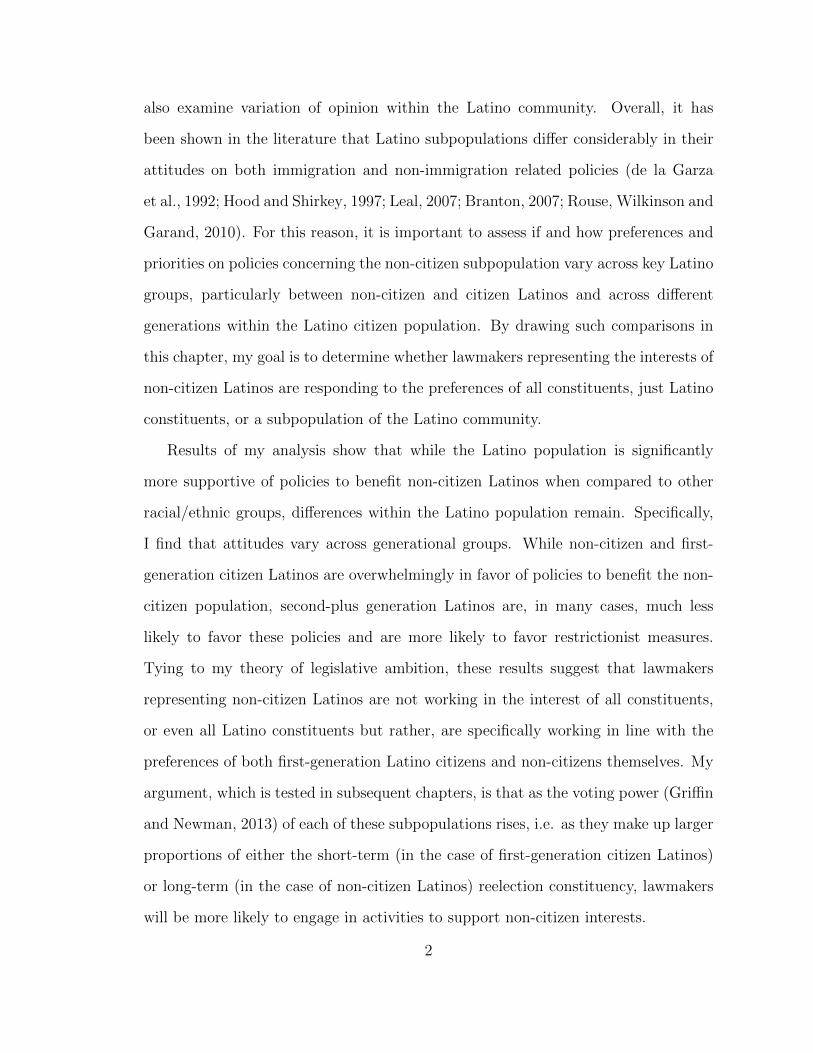
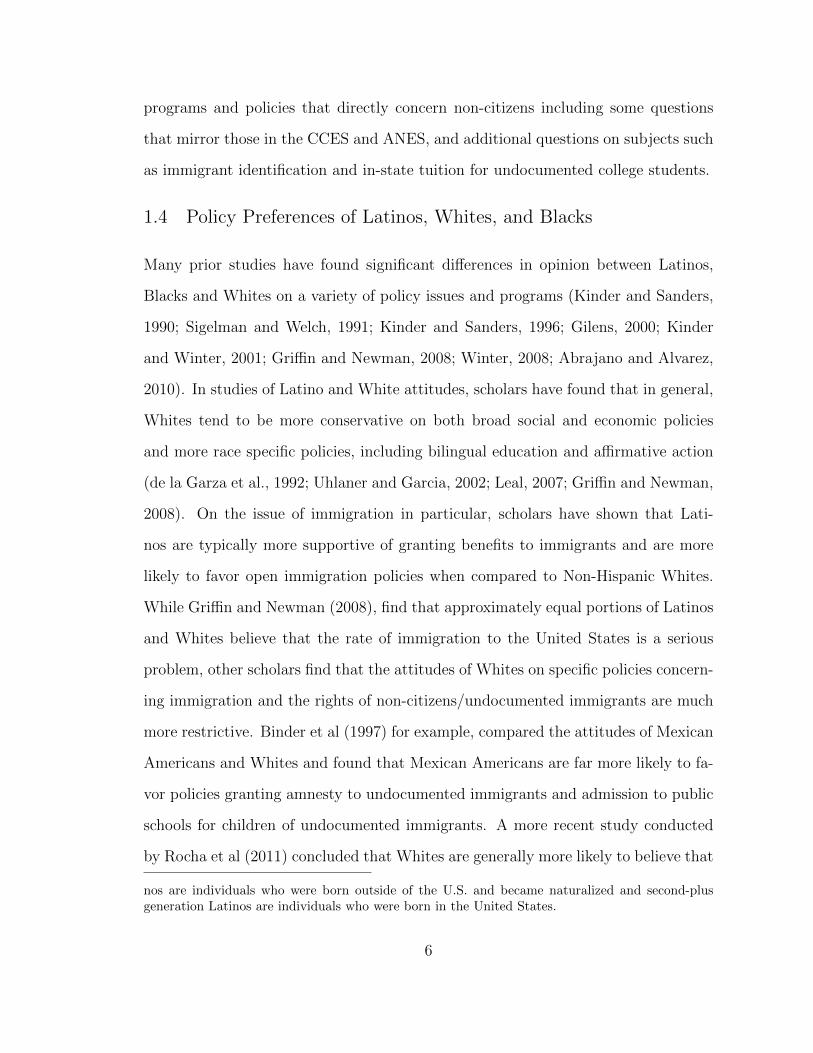
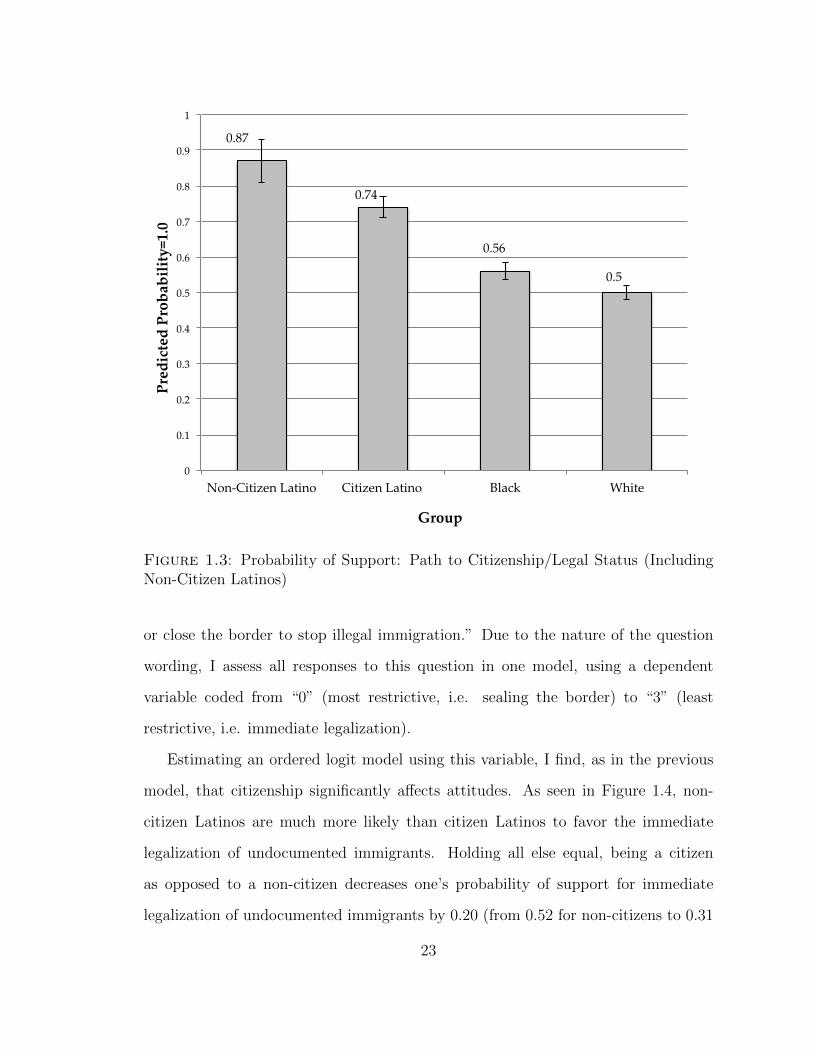
ences on this issue (for results, see Table ?? of the Appendix). As seen in Figure 1.3,
it is clear that non-citizen Latinos are significantly more likely to support granting
legal status to illegal immigrants than citizen Latinos, Blacks, and Whites.
Looking at a similar question in the 2006 Latino National Survey, I am able
to further examine Latino citizen and non-citizen preferences on this topic.19 On
the LNS, respondents were asked about their “preferred policy on undocumented
or illegal immigration” with one of four options being the “immediate legalization
of current undocumented immigrants.” Although this option is less detailed and
perhaps more lenient than the one provided on the 2010 CCES, it remains comparable
as it addresses the same issue of legalization. Unlike the CCES, however, the LNS
does not allow respondents to choose all responses that apply. Instead, individuals
can favor “immediate legalization of current undocumented immigrants,” “a guest
worker program leading to legalization eventually,” “a guest worker program that
permits immigrants to be in the country but only temporarily,” or “an effort to seal
18 In the CCES sample, there are 3,586 citizen Latinos and 188 non-citizen Latinos.
19 This survey included only Latino respondents. The sample of citizen Latinos was 4,260, whilethe sample of non-citizen Latinos was 3,474.
22
0.87
0.74
0.56
0.5
0
0.1
0.2
0.3
0.4
0.5
0.6
0.7
0.8
0.9
1
Non-‐‑Citizen Latino Citizen Latino Black White
Predicted Probability=1.0
Group
Figure 1.3: Probability of Support: Path to Citizenship/Legal Status (IncludingNon-Citizen Latinos)
or close the border to stop illegal immigration.” Due to the nature of the question
wording, I assess all responses to this question in one model, using a dependent
variable coded from “0” (most restrictive, i.e. sealing the border) to “3” (least
restrictive, i.e. immediate legalization).
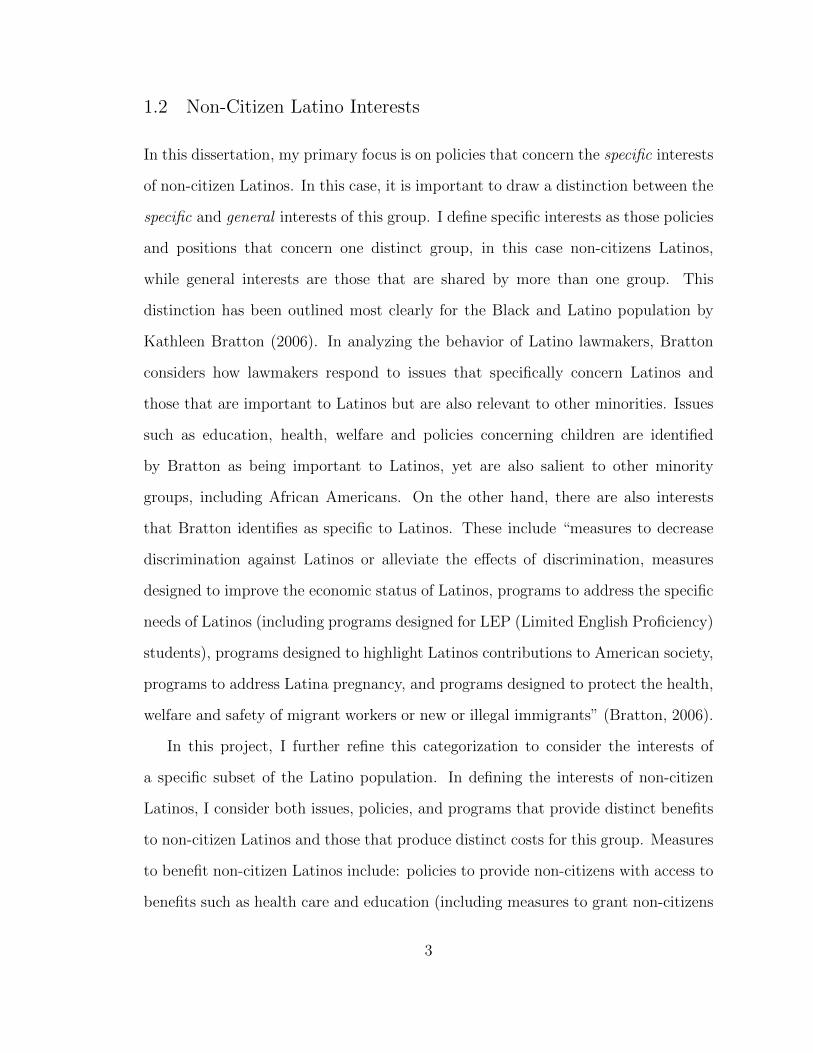
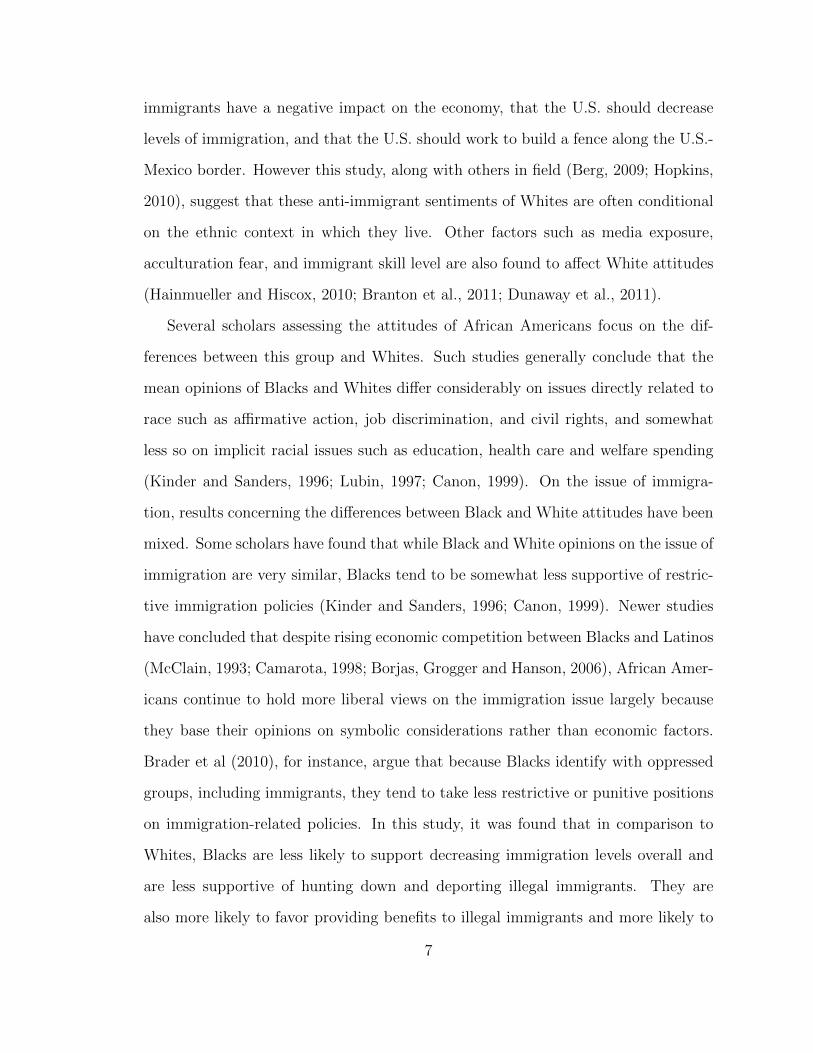
Estimating an ordered logit model using this variable, I find, as in the previous
model, that citizenship significantly affects attitudes. As seen in Figure 1.4, non-
citizen Latinos are much more likely than citizen Latinos to favor the immediate
legalization of undocumented immigrants. Holding all else equal, being a citizen
as opposed to a non-citizen decreases one’s probability of support for immediate
legalization of undocumented immigrants by 0.20 (from 0.52 for non-citizens to 0.31
23
0.07
0.17
0.45
0.31
0.03
0.09
0.36
0.52
0
0.1
0.2
0.3
0.4
0.5
0.6
Seal Border Temp Guest Worker Work to Legalization
Immed. Legalization
Predicted Probability=1.0
Preferred Policy
Citizen Latino Non-‐‑Citizen Latino
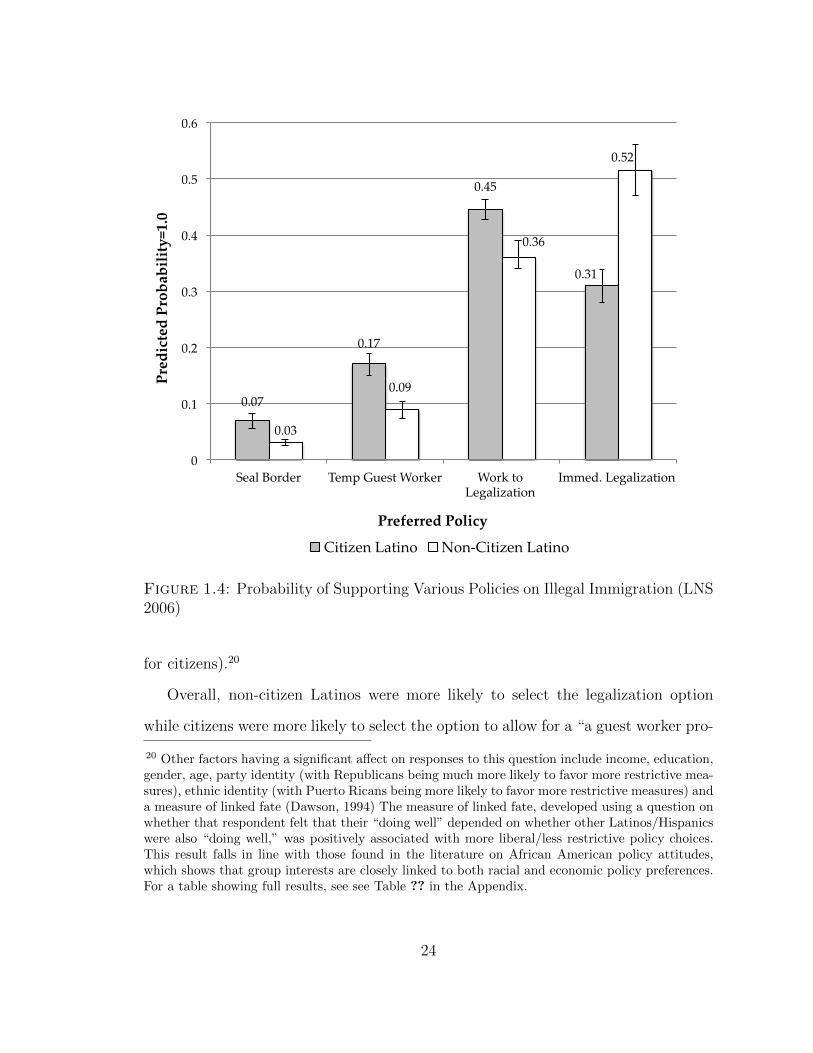
Figure 1.4: Probability of Supporting Various Policies on Illegal Immigration (LNS2006)
for citizens).20
Overall, non-citizen Latinos were more likely to select the legalization option
while citizens were more likely to select the option to allow for a “a guest worker pro-
20 Other factors having a significant affect on responses to this question include income, education,gender, age, party identity (with Republicans being much more likely to favor more restrictive mea-sures), ethnic identity (with Puerto Ricans being more likely to favor more restrictive measures) anda measure of linked fate (Dawson, 1994) The measure of linked fate, developed using a question onwhether that respondent felt that their “doing well” depended on whether other Latinos/Hispanicswere also “doing well,” was positively associated with more liberal/less restrictive policy choices.This result falls in line with those found in the literature on African American policy attitudes,which shows that group interests are closely linked to both racial and economic policy preferences.For a table showing full results, see see Table ?? in the Appendix.
24
gram leading to legalization eventually.”21 On the whole, compared to non-citizens,
citizens were also more likely to choose the option of creating a temporary guest
worker program.22 As noted above, when assessing attitudes across the different
racial/ethnic groups, the issue of guest worker programs seems to trigger very dif-
ferent responses depending on whether the program in question addresses legal or
illegal workers. However, using the LNS I am only able to gauge levels of support for
guest worker programs for illegal immigrants and perhaps to a detriment, the choice
to support such programs is made relative to other policy options. Unfortunately,
this is the only question I am able to use to gauge Latino citizen and non-citizen
attitudes on the issue of guest worker programs, as the sample of Latinos responding
to the related question on the 2010 CCES is too small. That said, it is expected
that response patterns on questions concerning legal guest worker programs would
mirror those found across racial/ethnic groups, with citizen and non-citizen Latinos
expressing equal levels of support for these programs. However, in order to make
this claim with certainty, additional survey questions, with large Latino citizen and
non-citizen responses, would need to be asked and examined.
The final issue area seen as dividing Latino, White and Black attitudes in the
section above concerned immigration enforcement measures, such as increasing bor-
der security and allowing police to question anyone they think may be in the country
illegally. The question on preferred policies on undocumented immigration from the
LNS gives respondents the option of selecting a policy to “seal or close the border to
stop illegal immigration.” As shown in Figure 1.4, although overall support for this
response was quite low,23 citizen Latinos are found to be significantly more likely to
21 Of the sample, 32% (1,358) of citizen Latinos and 65% (2,245) of non-citizens selected the optionof immediate legalization. 44% (1,880) of citizens and 24% (834) of non-citizens selected the optionof work to legalization.
22 15% (651) of citizens and 10% (350) of non-citizens respondents in my sample selected thisoption.
23 With 8.7% (371) of citizen respondents and 1.3% of non-citizen respondents in my sample
25
favor this option when compared to non-citizen Latinos (with predicted probabilities
at 0.07 and 0.03 respectively). In contrast, my assessment of Latino responses on the
2010 CCES question on immigration enforcement policies reveals no significant dif-
ferences between citizen and non-citizen Latino opinions, as both groups are equally
likely to oppose both increasing border patrol and allowing police to question anyone
they think may be in the country illegally. One potential reason for this result may
be the small sample size of non-citizen Latinos, as they only made up about 5% of the
Latino respondents in the CCES. However, it is also possible that such policies are
triggering equal levels of opposition because they are presenting costs to both citizen
and non-citizen Latino individuals. Policies to allow “police to question anyone they
think may be in the country illegally,” for instance, may result in a form of racial
profiling in which all Latinos, regardless of their citizenship status, are more likely
to be stopped and questioned by authorities. This has reportedly become a concern
among all Latinos with the passage of recent state-level immigration policies, most
notably, Arizona’s SB 1070 (Barreto, Segura and Sanchez, 2012).
Confirmation of this shared level of opposition among both citizen and non-citizen
Latinos to such policies is provided by the National Survey of Latinos (2007) which,
like the 2010 CCES, includes a question on whether local police should work to
identify undocumented immigrants.24 A first cut analysis of Latino attitudes on
this question again reveals no significant difference between citizens and non-citizen
attitudes (see column 1 of Table 1.3).25 Estimating a model with a binary dependent
variable (with a “1” reflecting support for police taking an active role in identifying
undocumented immigrants and a “0” reflecting support for ”enforcement to be left
supporting this option.
24 The exact question wording is: “Should local police take an active role in identifying undocu-mented or illegal immigrants, or should enforcement be left mainly to the federal authorities?”
25 Of the sample, 8.7% (65) of non-citizen Latinos and 18% (196) of citizen Latinos supported thispolicy.
26
up to federal authorities”) and assessing the results, I find that among both groups,
the probability of supporting this measure remains less than 0.14.
Factors that do distinguish individuals, as seen in Table 1.3, are party identity,
as Republicans are significantly more likely to support this policy. I also find that
feelings of discrimination against Latinos are significantly related to attitudes on
this issue. I include this indicator of discrimination (measuring whether respondents
feel discrimination against Latinos/Hispanics is a major problem, minor problem or
not a problem at all) in an effort to tap into Latino group consciousness, which has
been found to condition opinions on Latino salient issue areas (Sanchez, 2006).26
In line with the existing literature (Sanchez, 2006; Rouse, Wilkinson and Garand,
2010), my results show that those who feel discrimination against Latinos is a major
problem are more likely to oppose local police taking an active role in identifying
undocumented or illegal immigrants.
While no differences between citizens and non-citizens were found on the issue
of local police involvement in immigration enforcement, there are other enforcement
measures, asked about on the NSL, that do trigger different responses from these
groups. One question on the NSL asks respondents whether they approve or disap-
prove of “states checking for immigration status before issuing drivers licenses.” Of
the sample, almost half (49.2%) of the citizen Latinos stated that they approved of
this policy, while only 25% of non-citizen Latinos said the same. Estimating a logit
model using this question as a dependent variable (coded as “1” if the respondent
approves of states checking for immigration status before issuing drivers licenses and
“0” if they disapprove), it is clear that the differences between these two groups are
in fact significant, even when accounting for other key controls (see column two of
Table 1.3). On the whole, it is consequential that such a large portion of the citizen
26 Ideally, I would have also included a measure of linked fate (noted above), however, such questionswere not asked on this particular survey.
27

Table 1.3: Citizen and Non-Citizen Latinos Attitudes: Enforcement Measures (NSL)
Variable Coefficient Coefficient Coefficient(Std. Err.) (Std. Err.) (Std. Err.)
Local Police Driver’s License Workplace RaidCitizen 0.355 0.741˚˚ 0.858˚˚
(0.243) (0.124) (0.228)
Income 0.162 0.203˚ 0.185(0.135) (0.099) (0.118)
Education 0.005 0.038 0.037(0.048) (0.037) (0.045)
Female -0.227 -0.356: -0.297:
(0.195) (0.050) (0.177)
Age -0.204 -0.036 -0.069(0.144) (0.103) (0.124)
Democrat 0.162 -0.046 0.089(0.215) (0.160) (0.208)
Republican 1.521˚˚ 1.180˚˚ 1.063˚˚
(0.273) (0.240) (0.257)
Cuban 0.510 1.042˚˚ 0.033(0.436) (0.303) (0.364)
Puerto Rican 0.448 0.816˚˚ 0.577:
(0.322) (0.269) (0.297)
Other Ethnic Group 0.005 0.625˚˚ 0.235(0.217) (0.168) (0.210)
Discrimination (Latinos) -0.886˚˚ -1.232˚˚ -0.964˚˚
(0.332) (0.241) (0.271)
Constant -1.571˚˚ -0.554: -1.779˚˚
(0.459) (0.312) (0.347)
N 1497 1510 1504Pseudo R2 0.1042 0.1421 0.1149:p ă 0.10, ˚p ă 0.05, ˚˚p ă 0.01
28
Latino population remains in favor of these driver’s license checks. The implication
of this is that in any policy debates on this issue, a sizable segment of this group
may side with the non-Latino population (particularly Whites), perhaps encouraging
lawmakers to pass more restrictive policy.
Another question on the NSL that concerns enforcement measures addresses the
issue of workplace raids. The question asks respondents whether they approve or
disapprove of “workplace raids to discourage employers from hiring undocumented
or illegal immigrants.” Analysis of this question again reveals significant differences
between citizen and non-citizen individuals. Calculating predicted probabilities using
the results of the logit analysis presented in column three of Table 1.3, I find that
the probability of a citizen approving workplace raids is 0.2327 while for non-citizens,
it is only 0.10.28 Overall while support levels remain low among both groups, there
again is reason to expect that a significant portion of the citizen population would
actually support this policy and perhaps even side with the non-Latino population
to pressure lawmakers to pass it into law.
A final policy area, that I was not able to explore in my assessment of Latino,
Black, and White attitudes, concerns issues which I define as specifically benefit-
ing non-citizen Latinos. Above, I addressed policies to open a path to citizen-
ship/legalization for undocumented immigrants and policies to expand guest worker
programs, but with the aid of the Latino National Survey, I also have the ability
to examine questions on other salient policies, including those addressing in-state
tuition rates for undocumented students and the use of foreign identification cards.
The design of each of these relevant questions on the LNS asks respondents whether
they strongly oppose, oppose, support, or strongly support each policy. The first
question asks for responses in regard to the follow statement: “undocumented im-
27 With 95% confidence intervals of 0.16-0.30
28 With 95% confidence intervals of 0.06-0.15
29
migrants attending college should be charged a higher tuition rate at state colleges
and universities, even if they grew up and graduated high-school in the state.” Al-
though this question asks about charging higher rates to undocumented students,
I am able to use responses to gauge support for the implied alternative, which is
equal tuition rates for these students (i.e. a benefit to non-citizen individuals). The
second question asks for feelings on the “use of matricula consular- an ID issued by
foreign countries-as an acceptable form of identification for immigrants in the US.”
This policy is seen as beneficial to non-citizens as use of these foreign IDs can help
non-citizens set up bank accounts, rent homes, and prevent unnecessary deportations
(Ekstrand, 2004).
Upon looking at the descriptive statistics for these questions, I find that large
numbers of both citizen and non-citizen Latinos fall on the same side of these is-
sues. On the question regrading in-state tuition rates, approximately 81% of citizen
Latinos oppose or strongly oppose charging higher rates to undocumented immi-
grants while 89% of non-citizens feel the same. On the question concerning the use
of matricula consular, there is more division between the two groups however, large
majorities of each remain in favor of these more relaxed policies, with 66.5% of cit-
izens either supporting or strongly supporting this policy and 88% of non-citizens
doing the same. That said, in estimating ordered logit models using each of these
questions, it is found that these differences between citizen and non-citizen Latinos,
small as they may seem, remain significant. Breaking down support levels, I find
that non-citizen Latinos are significantly more likely to say that they “strongly op-
pose” higher tuition rates for undocumented students than citizen Latinos. In this
instance, the predicted probability of a citizen Latino strongly opposing this policy
is approximately 0.56 while for non-citizens, it is significantly higher at 0.65. On the
question concerning the use of the matricula consular, I find even greater differences,
as the probability that a citizen Latino strongly supports this policy is approximately
30
0.40, while the probability that non-citizens strongly support such policy is around
0.60. Overall, I would argue that these preference intensities may matter in terms of
policy outputs, either because they are affecting lawmaker incentives directly,29 or
they are affecting political participation rates (Kiousis and McDevitt, 2008), which
in turn spark legislative attention (Griffin and Newman, 2005; McCarty, Poole and
Rosenthal, 2006). This point will be considered further later on in this chapter.
1.9 Measurements and Results: The Effect of Generational Status onLatino Attitudes
From the results presented above, it is evident that in many cases, citizenship has
a significant effect on Latino attitudes on policies related to non-citizen interests.
Yet, as mentioned previously, it cannot be assumed that all citizens have the same
attitudes on this set of policies. Instead, I argue that generational status within the
citizen population will influence opinions and specifically, that those who are in later
generational categories (in this instance, who are second-generation or higher), will
be less likely to support policies to benefit non-citizen immigrants and more likely to
favor restricting non-citizens or tightening immigration enforcement measures. It is
these generational differences that I see as being key to understanding Latino atti-
tudes and especially to understanding who in society supports non-citizen interests
and who does not.
In my analysis of Latino attitudes across generations, I assess many of the ques-
tions discussed in the section above (excluding those from the 2010 CCES, as the
sample size of first-generation immigrants in this survey in particular, is much too
small). To reiterate, these questions are as follows:
29 This is an argument drawn out of the literature on public issue priorities and legislative activity(Jones and Baumgartner, 2004, 2005; Jones, Larsen-Pricea and Wilkerson, 2011). Such researchsuggests that what the public finds to be important is more likely influence legislative agenda-settingand decision-making.
31
• LNS: What is your preferred policy on undocumented or illegal immigration?
• NSL: Should local police take an active role in identifying undocumented or ille-
gal immigrants, or should enforcement be left mainly to the federal authorities?
• NSL: Do you approve or disapprove of states checking for immigration status
before issuing drivers licenses?
• NSL: Do you approve or disapprove of workplace raids to discourage employers
from hiring undocumented or illegal immigrants?
• LNS: Do you strongly support, support, oppose or strongly oppose the following
statement: Undocumented immigrants attending college should be charged a
higher tuition rate at state colleges and universities, even if they grew up and
graduated high-school in the state
• LNS: Do you strongly support, support, oppose or strongly oppose the use of
matricula consular-as an ID issued by foreign countries-as an acceptable form
of identification for immigrants in the US.
Key to this portion of my analysis are measures of generational status. I generate
three new independent variables: non-citizen, which takes the value of “1” if the
respondent is not a citizen of the United States and a “0” if otherwise; first-generation
citizen, which takes that value of “1” if the individual is a foreign-born Latino citizen
and “0” if otherwise; and second-plus generation citizen, which takes the value of “1”
if the individual is a native-born Latino citizen and a “0” if otherwise30
30 As an additional robustness check, I also examine whether acculturation, or the adoption ofAmerican culture, is influencing attitudes on these policies. To do so, I re-estimate all of my modelswith a measure of language preference (a key variable included in previous models of Latino policyattitudes). For analysis using the LNS, this variable is generated using a question asking respon-dents whether they rely more heavily on Spanish-language television, radio, and newspapers, or onEnglish-language TV, radio, and newspapers for information about public affairs, with responsescoded as “1” for English, “0” for both, and “-1” for Spanish. In my analysis of the NSL, the
32
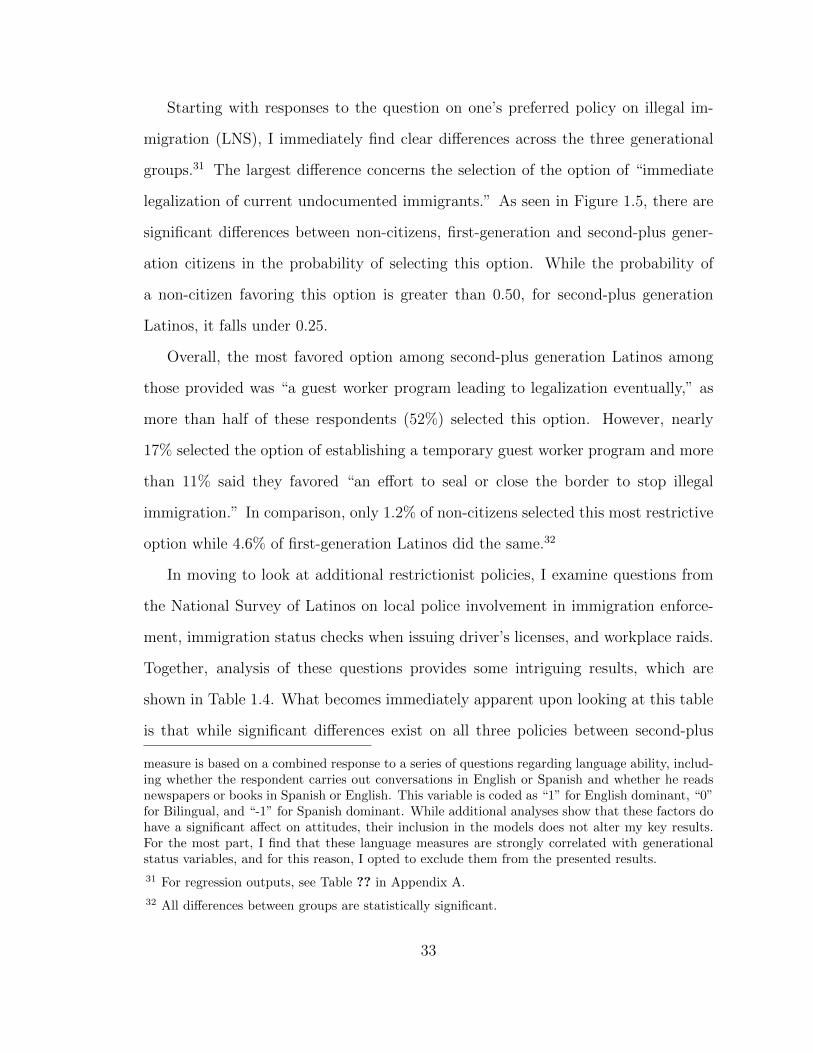
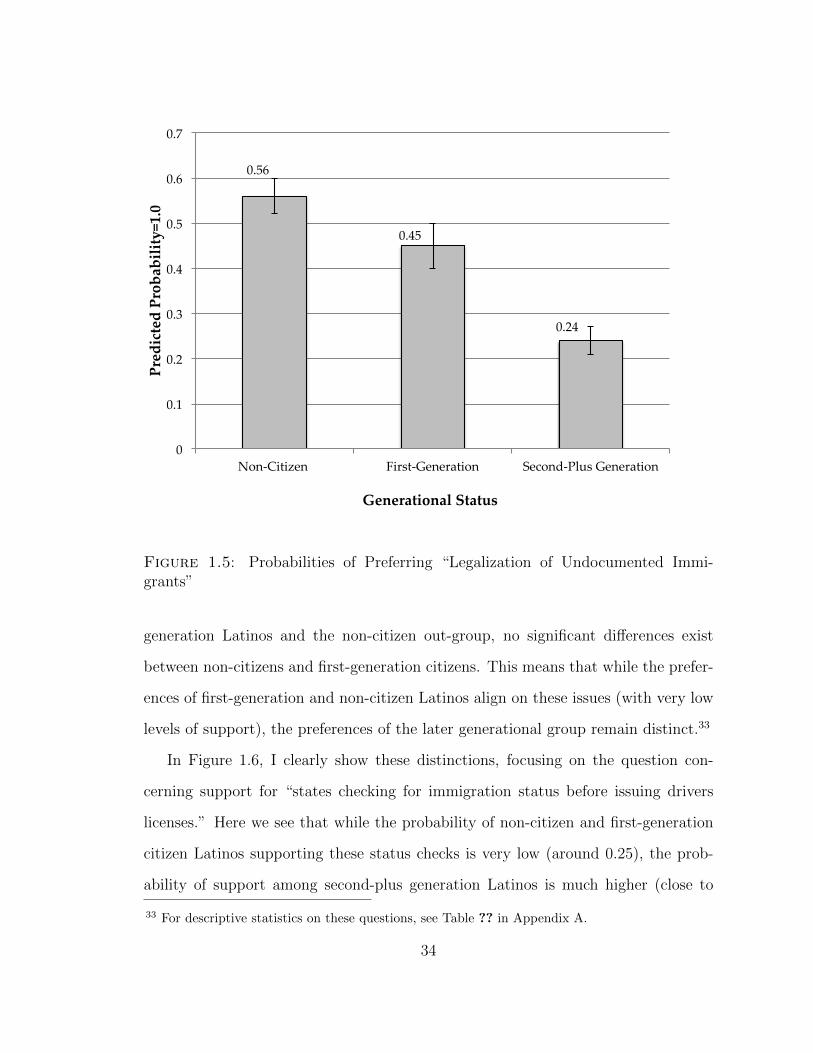
Starting with responses to the question on one’s preferred policy on illegal im-
migration (LNS), I immediately find clear differences across the three generational
groups.31 The largest difference concerns the selection of the option of “immediate
legalization of current undocumented immigrants.” As seen in Figure 1.5, there are
significant differences between non-citizens, first-generation and second-plus gener-
ation citizens in the probability of selecting this option. While the probability of
a non-citizen favoring this option is greater than 0.50, for second-plus generation
Latinos, it falls under 0.25.
Overall, the most favored option among second-plus generation Latinos among
those provided was “a guest worker program leading to legalization eventually,” as
more than half of these respondents (52%) selected this option. However, nearly
17% selected the option of establishing a temporary guest worker program and more
than 11% said they favored “an effort to seal or close the border to stop illegal
immigration.” In comparison, only 1.2% of non-citizens selected this most restrictive
option while 4.6% of first-generation Latinos did the same.32
In moving to look at additional restrictionist policies, I examine questions from
the National Survey of Latinos on local police involvement in immigration enforce-
ment, immigration status checks when issuing driver’s licenses, and workplace raids.
Together, analysis of these questions provides some intriguing results, which are
shown in Table 1.4. What becomes immediately apparent upon looking at this table
is that while significant differences exist on all three policies between second-plus
measure is based on a combined response to a series of questions regarding language ability, includ-ing whether the respondent carries out conversations in English or Spanish and whether he readsnewspapers or books in Spanish or English. This variable is coded as “1” for English dominant, “0”for Bilingual, and “-1” for Spanish dominant. While additional analyses show that these factors dohave a significant affect on attitudes, their inclusion in the models does not alter my key results.For the most part, I find that these language measures are strongly correlated with generationalstatus variables, and for this reason, I opted to exclude them from the presented results.
31 For regression outputs, see Table ?? in Appendix A.
32 All differences between groups are statistically significant.
33
0.56
0.45
0.24
0
0.1
0.2
0.3
0.4
0.5
0.6
0.7
Non-‐‑Citizen First-‐‑Generation Second-‐‑Plus Generation
Predicted Probability=1.0
Generational Status
Figure 1.5: Probabilities of Preferring “Legalization of Undocumented Immi-grants”
generation Latinos and the non-citizen out-group, no significant differences exist
between non-citizens and first-generation citizens. This means that while the prefer-
ences of first-generation and non-citizen Latinos align on these issues (with very low
levels of support), the preferences of the later generational group remain distinct.33
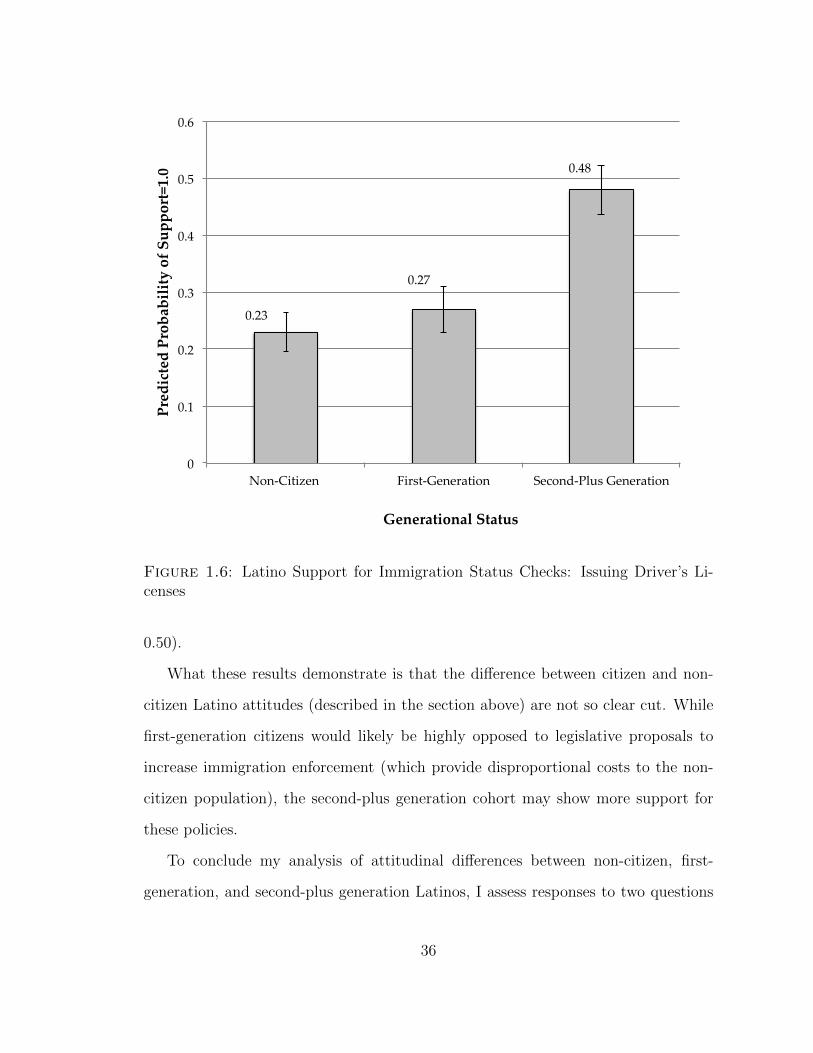
In Figure 1.6, I clearly show these distinctions, focusing on the question con-
cerning support for “states checking for immigration status before issuing drivers
licenses.” Here we see that while the probability of non-citizen and first-generation
citizen Latinos supporting these status checks is very low (around 0.25), the prob-
ability of support among second-plus generation Latinos is much higher (close to
33 For descriptive statistics on these questions, see Table ?? in Appendix A.
34
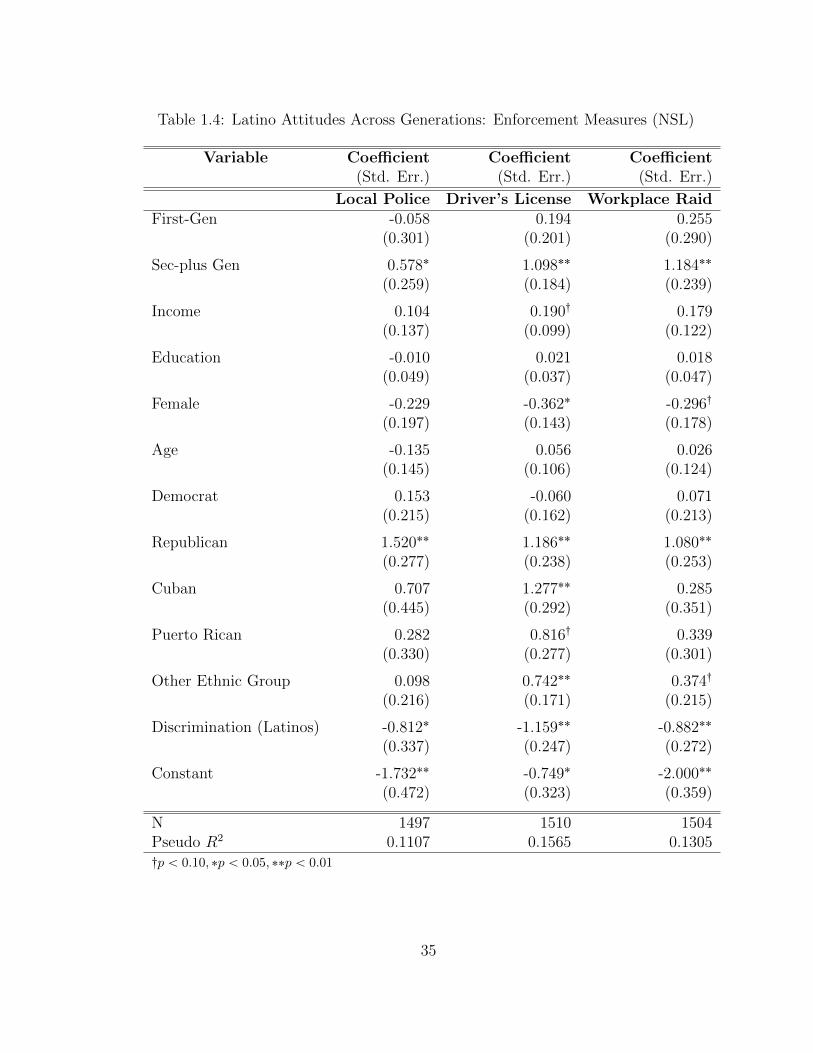
Table 1.4: Latino Attitudes Across Generations: Enforcement Measures (NSL)
Variable Coefficient Coefficient Coefficient(Std. Err.) (Std. Err.) (Std. Err.)
Local Police Driver’s License Workplace RaidFirst-Gen -0.058 0.194 0.255
(0.301) (0.201) (0.290)
Sec-plus Gen 0.578˚ 1.098˚˚ 1.184˚˚
(0.259) (0.184) (0.239)
Income 0.104 0.190: 0.179(0.137) (0.099) (0.122)
Education -0.010 0.021 0.018(0.049) (0.037) (0.047)
Female -0.229 -0.362˚ -0.296:
(0.197) (0.143) (0.178)
Age -0.135 0.056 0.026(0.145) (0.106) (0.124)
Democrat 0.153 -0.060 0.071(0.215) (0.162) (0.213)
Republican 1.520˚˚ 1.186˚˚ 1.080˚˚
(0.277) (0.238) (0.253)
Cuban 0.707 1.277˚˚ 0.285(0.445) (0.292) (0.351)
Puerto Rican 0.282 0.816: 0.339(0.330) (0.277) (0.301)
Other Ethnic Group 0.098 0.742˚˚ 0.374:
(0.216) (0.171) (0.215)
Discrimination (Latinos) -0.812˚ -1.159˚˚ -0.882˚˚
(0.337) (0.247) (0.272)
Constant -1.732˚˚ -0.749˚ -2.000˚˚
(0.472) (0.323) (0.359)
N 1497 1510 1504Pseudo R2 0.1107 0.1565 0.1305:p ă 0.10, ˚p ă 0.05, ˚˚p ă 0.01
35
0.23
0.27
0.48
0
0.1
0.2
0.3
0.4
0.5
0.6
Non-‐‑Citizen First-‐‑Generation Second-‐‑Plus Generation
Predicted Probability of Support=1.0
Generational Status
Figure 1.6: Latino Support for Immigration Status Checks: Issuing Driver’s Li-censes
0.50).
What these results demonstrate is that the difference between citizen and non-
citizen Latino attitudes (described in the section above) are not so clear cut. While
first-generation citizens would likely be highly opposed to legislative proposals to
increase immigration enforcement (which provide disproportional costs to the non-
citizen population), the second-plus generation cohort may show more support for
these policies.
To conclude my analysis of attitudinal differences between non-citizen, first-
generation, and second-plus generation Latinos, I assess responses to two questions
36
on the LNS concerning the provision of benefits to non-citizen Latinos; the first of
which asks about in-state tuition rates for undocumented students and the second of
which addresses the acceptability of using foreign identification cards. As mentioned
above, support for charging higher tuition rates to undocumented students remains
quite low among the broader Latino population, however significant differences across
generational groups remain (for regression estimations, see Table ?? in Appendix A).
Overall, non-citizens and first-generation Latino citizens are significantly more likely
to oppose higher tuition rates for undocumented students than the second-plus gen-
eration population. Of the sample of second-plus generation Latinos, 23% actually
said that they either support or strongly support increasing these tuition rates.
On the question of whether the matricula consular should qualify as an acceptable
form of identification for immigrants in the US, I find even larger differences across the
generational groups. Of the sample of second-plus generation Latinos, more than 40%
stated that they either “opposed” or “strongly opposed” the use of these foreign IDs.
Estimating an ordered logit model using the dependent variable generated from this
question, I find that the differences between the second-plus generation population
and non-citizens are in fact significant. Looking more carefully at degrees of support
for this proposal, I find that while the probability that a non-citizen Latino “strongly
supports” the use of these foreign IDs is 0.60 (with 95% confidence intervals of 0.54-
0.66), the probability of strong support from a second-plus generation Latino is
only 0.36 (with 95% confidence intervals of 0.30-0.42). First-generation citizens, like
non-citizens, show higher levels of support for this policy, as the probability that a
first-generation Latino strongly supports the use the matricula consular is 0.50.3435
As mentioned above, the intensity of preferences on these policies may be relevant,
34 95% confidence interval: 0.43-0.57
35 For regression for the question on the use of the matricula consular, see column 2 of Table ?? inAppendix A.
37
especially when considering how constituent attitudes translate into policy outputs.
1.10 Summary of Public Preferences and the Connection to PolicyOutputs
Taken together, this analysis of public opinion on policies addressing the ‘specific’
interest of non-citizen Latinos provides some interesting results, all of which have
important implications for the larger focus of this project. Comparing across racial
groups in the United States, I find significant differences in policy preferences, with
non-Hispanic Whites and Blacks being significantly less likely to support measures
to benefit non-citizens (especially those who are undocumented) than Latinos. And
while Latinos are highly unlikely to favor restrictionist immigration proposals, such
as those to increase border security and allow local police to take an active role in
immigration enforcement, in many cases, both Blacks and non-Hispanic Whites show
much higher levels of support for these policies.
Further analysis reveals that while aggregate Latino preferences are often distinct
from the rest of the population, significant differences remain within this population.
First, I find that compared to non-citizens, citizens as a whole are less likely to fa-
vor certain policies to benefit non-citizens (including those to legalize undocumented
immigrants), and are more likely to favor restrictionist measures. Looking across
generational groups, however, I find that Latino citizen attitudes are not simply
monolithic. In line with my predictions, results reveal that first-generation Latino
citizens, or those who are closer to the immigration experience, hold attitudes that
are often indistinguishable from those held by non-citizens themselves. While signif-
icant portions of the second-plus generation Latino population prefer policies that
conflict with non-citizen interests, by in large, first-generation Latinos support poli-
cies to benefit non-citizens and oppose measures that produce particularized costs
for this group. Importantly, these differences remain significant even when account-
38
ing for other key attitudinal predictors including income, education, party affiliation,
ethnic identity, and measures of group consciousness and linked fate. Together, these
group and subgroup differences suggest that when lawmakers generate or vote for
policies to benefit non-citizens, they are not working in line with the preferences of
all constituents but rather, are most distinctly working in line with the preferences
of both non-citizens themselves and first-generation Latino citizens.
In connecting these policy preferences to policy outputs, however, there are a few
additional points to consider. One factor, that was mentioned previously, centers
on the intensity of preferences held by certain groups and how these intensities are
affecting policy development. On questions that reveal preferences intensities, I found
that non-citizen and first-generation citizen Latinos were more likely to be strongly
in favor of policies to benefit non-citizen Latinos than the second-plus generation
cohort. Although I am unable to determine exactly whether or how these preference
intensities are translating into legislative behavior, it is at least probable that groups
with stronger preferences will gain more attention from lawmakers in debate on
these issues than groups with weaker preferences (Jones and Baumgartner, 2004,
2005; Jones, Larsen-Pricea and Wilkerson, 2011). Those with stronger preferences
may be more likely to become politically involved, for example either by petitioning,
lobbying etc., and thus may become increasingly important to reelection-minded
officials. While non-citizens may be unlikely to participate in such activities (as
described in further detail below), this is a way in which the first-generation Latino
citizen population may become relevant.
Related to this discussion of preference intensity is the question of issue priorities.
Along the same lines, it is expected that groups who view a certain issue as being
more important will be more likely to influence legislative views on that issue, all else
being equal. Unfortunately, available survey data makes it difficult to gauge group
priorities on policies directed at the non-citizen Latino community. In an attempt
39
to examine variation in priorities across Latinos, Blacks and Whites, I am able to
draw on some questions asked in the 2008 ANES and the 2006 CCES. On the ANES,
in follow-ups to both the question on whether the “U.S. government should make it
possible for illegal immigrants to become U.S. citizens” and the question on whether
we should allow “illegal immigrants to work in the United States for up to three
years, after which they would have to go back to their home country,” respondents
were asked to rate the importance of these issues (with options ranging from “not
at all important” (0) to “extremely important” (5)). Overall, while there are no
significant differences in importance levels between Whites, Blacks, and Latinos on
the question concerning temporary work programs for illegal workers, the issue of
providing citizenship to illegal immigrants was seen as significantly more important
to Latino respondents than respondents from all other groups. Of the ANES sample,
50.4% of Latino respondents ranked this issue as “very important” or “extremely
important,” while only 42.5% of Whites and 39.6% of Blacks did the same.
Another question, asked on the 2006 CCES, did not focus on the importance of
specific policies to benefit/restrict non-citizens, but rather, asked about what respon-
dents saw to be “the most important problem facing the country,” with one option
being “immigration.” Looking at the breakdown of responses across racial/ethnic
groups, I find that Blacks are significantly less likely to say that immigration is the
most important problem when compared to Latinos, however between Latinos and
Whites, no significant differences emerge. A similar ‘most important problem’ ques-
tion also appears on the Latino National Survey, thus allowing for further analysis
of priorities within the Latino community. In response to the question what is the
“one most important problem facing the Latino/Hispanic community today?” I find
that while 35.5% of non-citizen Latinos and 30% of first-generation citizens in the
sample said immigration was the most important problem, significantly fewer, 22.6%,
40
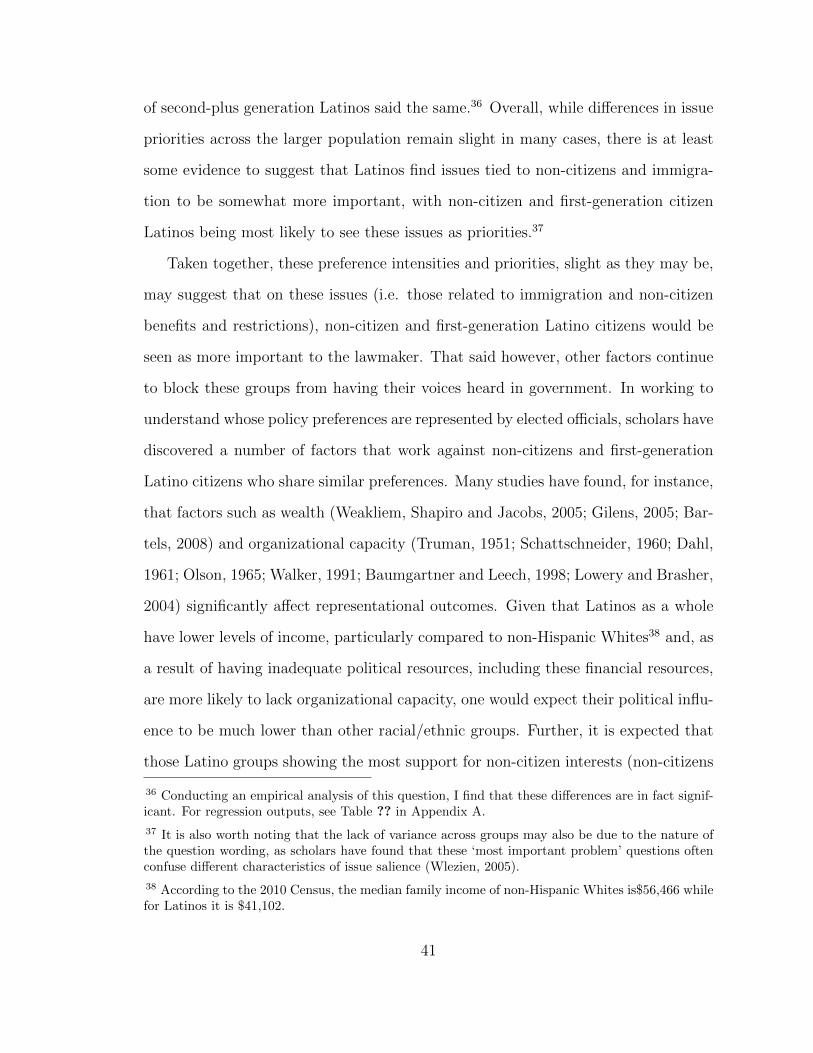
of second-plus generation Latinos said the same.36 Overall, while differences in issue
priorities across the larger population remain slight in many cases, there is at least
some evidence to suggest that Latinos find issues tied to non-citizens and immigra-
tion to be somewhat more important, with non-citizen and first-generation citizen
Latinos being most likely to see these issues as priorities.37
Taken together, these preference intensities and priorities, slight as they may be,
may suggest that on these issues (i.e. those related to immigration and non-citizen
benefits and restrictions), non-citizen and first-generation Latino citizens would be
seen as more important to the lawmaker. That said however, other factors continue
to block these groups from having their voices heard in government. In working to
understand whose policy preferences are represented by elected officials, scholars have
discovered a number of factors that work against non-citizens and first-generation
Latino citizens who share similar preferences. Many studies have found, for instance,
that factors such as wealth (Weakliem, Shapiro and Jacobs, 2005; Gilens, 2005; Bar-
tels, 2008) and organizational capacity (Truman, 1951; Schattschneider, 1960; Dahl,
1961; Olson, 1965; Walker, 1991; Baumgartner and Leech, 1998; Lowery and Brasher,
2004) significantly affect representational outcomes. Given that Latinos as a whole
have lower levels of income, particularly compared to non-Hispanic Whites38 and, as
a result of having inadequate political resources, including these financial resources,
are more likely to lack organizational capacity, one would expect their political influ-
ence to be much lower than other racial/ethnic groups. Further, it is expected that
those Latino groups showing the most support for non-citizen interests (non-citizens
36 Conducting an empirical analysis of this question, I find that these differences are in fact signif-icant. For regression outputs, see Table ?? in Appendix A.
37 It is also worth noting that the lack of variance across groups may also be due to the nature ofthe question wording, as scholars have found that these ‘most important problem’ questions oftenconfuse different characteristics of issue salience (Wlezien, 2005).
38 According to the 2010 Census, the median family income of non-Hispanic Whites is$56,466 whilefor Latinos it is $41,102.
41
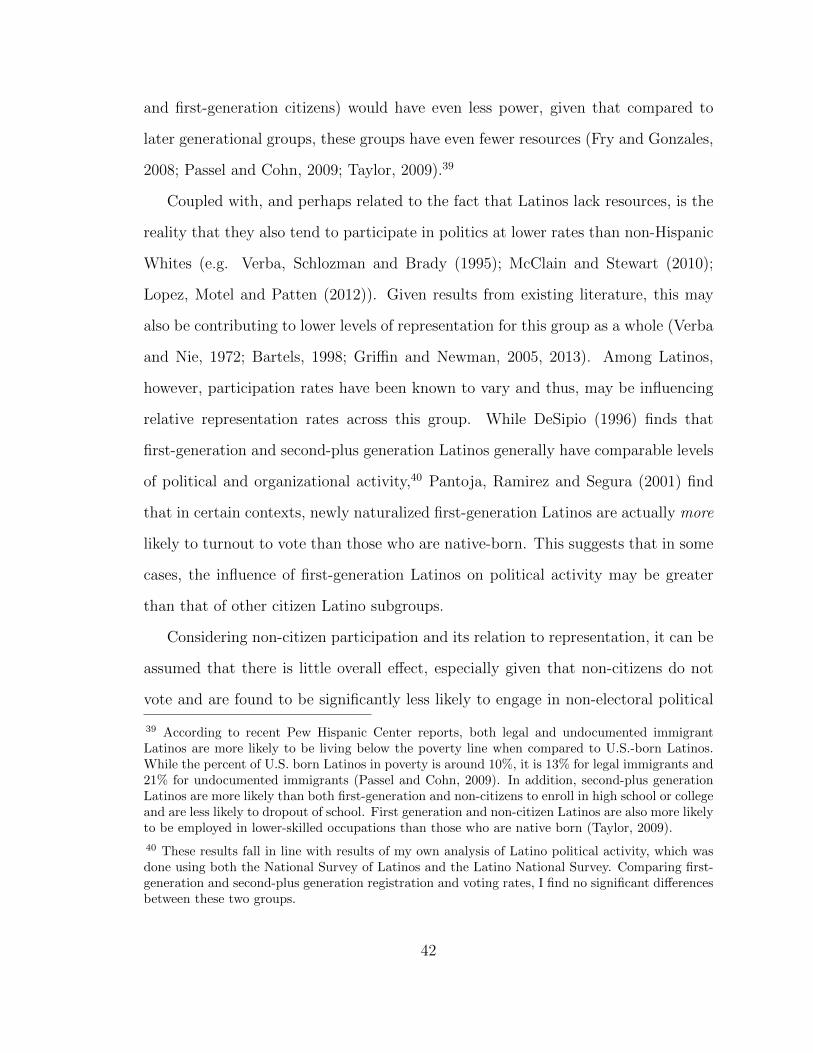
and first-generation citizens) would have even less power, given that compared to
later generational groups, these groups have even fewer resources (Fry and Gonzales,
2008; Passel and Cohn, 2009; Taylor, 2009).39
Coupled with, and perhaps related to the fact that Latinos lack resources, is the
reality that they also tend to participate in politics at lower rates than non-Hispanic
Whites (e.g. Verba, Schlozman and Brady (1995); McClain and Stewart (2010);
Lopez, Motel and Patten (2012)). Given results from existing literature, this may
also be contributing to lower levels of representation for this group as a whole (Verba
and Nie, 1972; Bartels, 1998; Griffin and Newman, 2005, 2013). Among Latinos,
however, participation rates have been known to vary and thus, may be influencing
relative representation rates across this group. While DeSipio (1996) finds that
first-generation and second-plus generation Latinos generally have comparable levels
of political and organizational activity,40 Pantoja, Ramirez and Segura (2001) find
that in certain contexts, newly naturalized first-generation Latinos are actually more
likely to turnout to vote than those who are native-born. This suggests that in some
cases, the influence of first-generation Latinos on political activity may be greater
than that of other citizen Latino subgroups.
Considering non-citizen participation and its relation to representation, it can be
assumed that there is little overall effect, especially given that non-citizens do not
vote and are found to be significantly less likely to engage in non-electoral political
39 According to recent Pew Hispanic Center reports, both legal and undocumented immigrantLatinos are more likely to be living below the poverty line when compared to U.S.-born Latinos.While the percent of U.S. born Latinos in poverty is around 10%, it is 13% for legal immigrants and21% for undocumented immigrants (Passel and Cohn, 2009). In addition, second-plus generationLatinos are more likely than both first-generation and non-citizens to enroll in high school or collegeand are less likely to dropout of school. First generation and non-citizen Latinos are also more likelyto be employed in lower-skilled occupations than those who are native born (Taylor, 2009).
40 These results fall in line with results of my own analysis of Latino political activity, which wasdone using both the National Survey of Latinos and the Latino National Survey. Comparing first-generation and second-plus generation registration and voting rates, I find no significant differencesbetween these two groups.
42
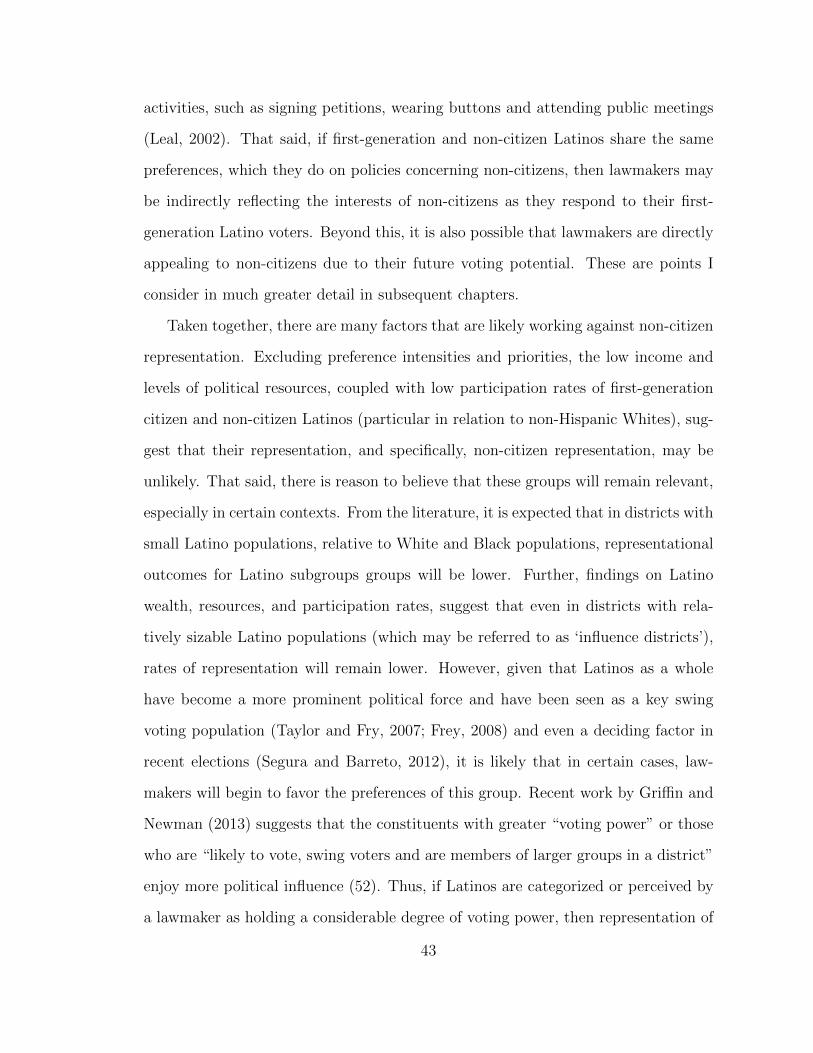
activities, such as signing petitions, wearing buttons and attending public meetings
(Leal, 2002). That said, if first-generation and non-citizen Latinos share the same
preferences, which they do on policies concerning non-citizens, then lawmakers may
be indirectly reflecting the interests of non-citizens as they respond to their first-
generation Latino voters. Beyond this, it is also possible that lawmakers are directly
appealing to non-citizens due to their future voting potential. These are points I
consider in much greater detail in subsequent chapters.
Taken together, there are many factors that are likely working against non-citizen
representation. Excluding preference intensities and priorities, the low income and
levels of political resources, coupled with low participation rates of first-generation
citizen and non-citizen Latinos (particular in relation to non-Hispanic Whites), sug-
gest that their representation, and specifically, non-citizen representation, may be
unlikely. That said, there is reason to believe that these groups will remain relevant,
especially in certain contexts. From the literature, it is expected that in districts with
small Latino populations, relative to White and Black populations, representational
outcomes for Latino subgroups groups will be lower. Further, findings on Latino
wealth, resources, and participation rates, suggest that even in districts with rela-
tively sizable Latino populations (which may be referred to as ‘influence districts’),
rates of representation will remain lower. However, given that Latinos as a whole
have become a more prominent political force and have been seen as a key swing
voting population (Taylor and Fry, 2007; Frey, 2008) and even a deciding factor in
recent elections (Segura and Barreto, 2012), it is likely that in certain cases, law-
makers will begin to favor the preferences of this group. Recent work by Griffin and
Newman (2013) suggests that the constituents with greater “voting power” or those
who are “likely to vote, swing voters and are members of larger groups in a district”
enjoy more political influence (52). Thus, if Latinos are categorized or perceived by
a lawmaker as holding a considerable degree of voting power, then representation of
43
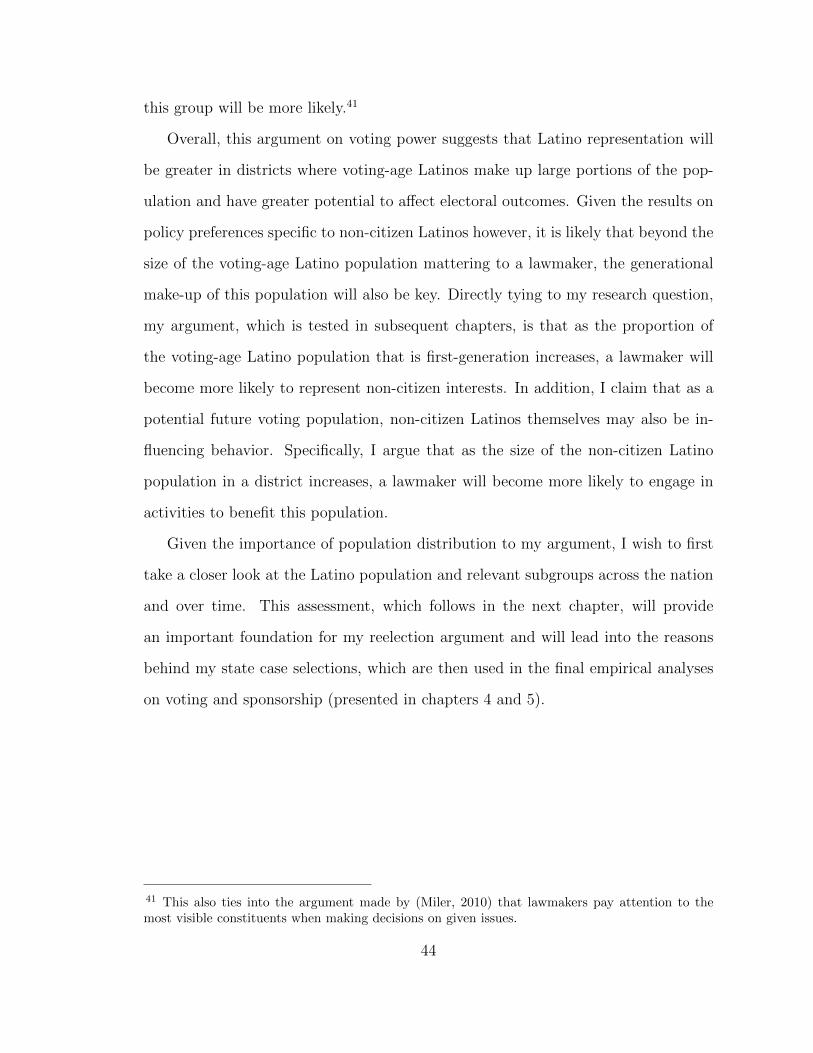
this group will be more likely.41
Overall, this argument on voting power suggests that Latino representation will
be greater in districts where voting-age Latinos make up large portions of the pop-
ulation and have greater potential to affect electoral outcomes. Given the results on
policy preferences specific to non-citizen Latinos however, it is likely that beyond the
size of the voting-age Latino population mattering to a lawmaker, the generational
make-up of this population will also be key. Directly tying to my research question,
my argument, which is tested in subsequent chapters, is that as the proportion of
the voting-age Latino population that is first-generation increases, a lawmaker will
become more likely to represent non-citizen interests. In addition, I claim that as a
potential future voting population, non-citizen Latinos themselves may also be in-
fluencing behavior. Specifically, I argue that as the size of the non-citizen Latino
population in a district increases, a lawmaker will become more likely to engage in
activities to benefit this population.
Given the importance of population distribution to my argument, I wish to first
take a closer look at the Latino population and relevant subgroups across the nation
and over time. This assessment, which follows in the next chapter, will provide
an important foundation for my reelection argument and will lead into the reasons
behind my state case selections, which are then used in the final empirical analyses
on voting and sponsorship (presented in chapters 4 and 5).
41 This also ties into the argument made by (Miler, 2010) that lawmakers pay attention to themost visible constituents when making decisions on given issues.
44
Bibliography
Abrajano, Marisa and R. Michael Alvarez. 2010. New Faces, New Voices: The LatinoElectorate in America. Princeton: Princeton University Press.
Ayers, John W., C. Richard Hofstetter, Keith Schnakenberg and Bohdan Kolody.2009. “Is Immigration a Racial Issue? Anglo Attitudes on Immigration Policies ina Border County.” Social Science Quarterly 90(3).
Barreto, Matt, Gary M. Segura and Gabriel Sanchez. 2012. “Poll: Latinos Over-whelmingly Oppose Supreme Court Decision to Uphold ”Show Me Your Papers”.”Latino Decisions .
Bartels, Larry M. 1998. Where the Ducks Are: Voting Power in a Party System. InPoliticians and Party Politics, ed. John Geer. Baltimore: John Hopkins UniversityPress.
Bartels, Larry M. 2008. Unequal Democracy: The Political Economy of the NewGilded Age. Princeton, N.J.: Princeton University Press.
Baumgartner, Frank R. and Beth L. Leech. 1998. Basic Interests: The Importanceof Groups in the Political Process. Princeton, N.J.: Princeton University Press.
Berg, Justin Allen. 2009. “Core Networksand Whites’ Attitudes Toward Immigrantsand Immigration Policy.” Public Opinion Quarterly 73(1):7–31.
Binder, Sarah A. 1997. Minority Rights, Majority Rule: Partisanship and the De-velopment of Congress. Cambridge: Cambridge University Press.
Binder, Sarah A., J.L. Polinard and Robert D. Wrinkle. 1997. “Mexican Americanand Anglo Attitudes toward Immigration Reform: A View from the Border.” SocialScience Quarterly 78(2).
Borjas, George J., Jeffrey Grogger and Gordon Hanson. 2006. “Immigration andAfrican-American Employment Opportunities: The Response of Wages, Employ-ment and Incarceration to Labor Supply Shocks.” National Bureau of EconomicResearch Working Paper.
45
Brader, Ted, Nicholas Valentino, Ashley E. Jardina and Timothy J. Ryan. 2010.“The Racial Divide on Immigration Opinion: Why Blacks are Less Threatened byImmigrants.” Paper presented at the Annual meeting of the American PoliticalScience Association.
Branton, Regina. 2007. “Latino Attitudes toward Various Areas of Public Policy.”Political Research Quarterly 60(2):293–303.
Branton, Regina, Erin C. Cassese, Bradford S. Jones and Chad Westerland. 2011.“All Along the Watchtower: Acculturation Fear, Anti-Latino Affect and Immigra-tion.” The Journal of Politics 73(3):664–679.
Bratton, Kathleen A. 2006. “The Behavior and Success of Latino Legislators: Evi-dence from the States.” Social Science Quarterly 87(5):1136–1157.
Camarota, Steven. 1998. “The Wages of Immigration.” Center for ImmigrationStudies 12.
Canon, David T. 1999. Race, Redistrcting and Representation: The UnintendedConsequences of Blacks Majority Districts. Chicago University Press.
Chong, Dennis, Jack Citrin and Patricia Conley. 2001. “When Self Interest Matters.”Political Psychology 22(3):541–570.
Citrin, Jack, Donald P. Green, Christopher Muste and Cara Wong. 1997. “PublicOpinion Toward Immigration Reform: The Role of Economic Motivations.” TheJournal of Politics 59(3):858–881.
Conover, Pamela J. and Stanley Feldman. 1999. Moral Traditionalism Scale. In Mea-sures of Political Attitudes, ed. John P. Robinson, Philip Shaver and Lawrence S.Wrightman. Academic Press.
Dahl, Robert A. 1961. Who Governs? Democracy and Power in an American City.New Haven, CT: Yale University Press.
Dawson, Michael C. 1994. Behind the Mule: Race and Class in African AmericanPolitics. Princeton, N.J.: Princeton University Press.
de la Garza, Rodolfo O., Louis Desipio, Chris Garcia, John Garcia and AngeloFlacon. 1992. Latino Voices: Mexican Puerto Rican and Cuban Perspectives onAmerican Politics. Boulder, CO: Westview Press.
DeSipio, Louis. 1996. “Making Citizens or Good Citizens? Naturalization as aPredictor of Organizational and Electoral Behavior among Latino Immigrants.”Hispanic Journal of Behavioral Sciences 18:194–213.
46
Dunaway, Johanna, Robert K. Goidel, Ashley Kirzinger and Betina Cutia Wilkinson.2011. “Rebuidling or Intruding? Media Coverage and Public Opinion on LatinoImmigration in Post-Katrina Louisiana.” Social Science Quarterly 92(4).
Ekstrand, Laurie. 2004. Consular Idenitification Cards Accepted within UnitedStates, but Consistent Federal Guidance Needed. Technical report U.S. Govern-ment Accountability Office.URL: http://www.gao.gov/new.items/d04881.pdf
Enns, Peter and Christopher Wlezien. 2011. Who Gets Represented? New York:Russell Sage Foundation.
Fetzer, Joel S. 1998. “Religious Minorities and Support for Immigrant Rights in theUnited States, France and Germany.” Journal for the Scientific Study of Religion37:41–49.
Frey, William. 2008. Race, Immigration ans America’s Changing Electorate. In Red,Blue and Purple American: The Future of Election Demographics, ed. Ruy Teix-eira. Brookings Institution Press.
Fry, Richard and Felisa Gonzales. 2008. “One-in-Five and Growing Fast: A Profileof Hispanic Public School Students.” Pew Hispanic Center .
Gilens, Martin. 2000. Why Americans Hate Welfare. Chicago: University of ChicagoPress.
Gilens, Martin. 2005. “Inequality and Democratic Responsiveness.” Public OpinionQuarterly 69(5):778–96.
Griffin, John D. and Brian Newman. 2005. “Are Voters Better Represented?” Jour-nal of Politics 67(4):1206–27.
Griffin, John D. and Brian Newman. 2008. Minority Report: Evaluating PoliticalEquality in America. The University of Chicago Press.
Griffin, John D. and Brian Newman. 2013. “Voting Power, Policy Representation,and Disparities in Voting’s Rewards.” The Journal of Politics 75(1):52–64.
Hainmueller, Jens and Michael J. Hiscox. 2010. “Attitudes toward Highly Skilledand Low-Skilled Immigration: Evidence from a Survey Experiment.” AmericanPolitical Science Review 104(1).
Hood, MV., Irwin L. Morris and Kurt A Shirkey. 1997. “Quedate o Vente: Uncover-ing the Determinants of Hispanic Public Opinion Toward Immigration.” PoliticalResearch Quarterly 50:627.
47
Hopkins, Daniel J. 2010. “Politicized Places: Explaining Where and When Immi-grants Provoke Local Opposition.” American Political Science Review 104:40–60.
Jones, Bryan D. and Frank R. Baumgartner. 2004. “Representation and AgendaSetting.” Policy Studies Journal 32(1):1–24.
Jones, Bryan D. and Frank R. Baumgartner. 2005. The Politics of Attention.Chicago: University of Chicago Press.
Jones, Bryan D., Heather Larsen-Pricea and John Wilkerson. 2011. “Representationand American Governing Institutions.” The Journal of Politics 71(1):277–290.
Kinder, Donald R. and Lynn M. Sanders. 1990. “Mimicking Political Debate withSurvey Questions: The Case of White Opinion on Affirmative Action.” SocialCognition 8(1):83–103.
Kinder, Donald R. and Lynn M. Sanders. 1996. Divided By Color: Racial Politicsand Democratic Ideals. The University of Chicago Press.
Kinder, Donald R. and Nicholas Winter. 2001. “Exploring the Racial Divide: Blacks,Whites and Opinion on National Policy.” American Journal of Political Science45(2):439–56.
Kiousis, Spiro and Michael McDevitt. 2008. “Agenda Setting in Civic Development:Effects of Cirricula and Issue Importance on Voter Turnout.” Communication Re-search 35(4):481–502.
Knoll, Benjamin R. 2009. “And Who is My Neighbor? Religion and ImmigrationPolicy Attitudes.” Journal for the Scientific Study of Religion 48:313–31.
Leal, David L. 2002. “Political Participation by Latino Non-Citizens in the UnitedStates.” British Journal of Political Science 32(2):353–370.
Leal, David L. 2007. Latino Public Opinion: Does it Exist? In Latino Politics:Identity, Mobilization and Representation, ed. Rodolfo Espino, David L. Leal andKenneth J. Meier. University of Virginia Press.
Lopez, Mark Hugo, Seth Motel and Eileen Patten. 2012. “A Record 24 MillionLatinos Are Eligible to Vote, But Turnout Rate Has Lagged That of Whites,Blacks.” Pew Hispanic Center .
Lowery, David and Holly Brasher. 2004. Organized Interests and American Govern-ment. New York: McGraw-Hill.
Lubin, David. 1997. The Paradox of Representation: Racial Gerrymandering andMinority Interests in Congress. Princeton University Press.
48
McCarty, Nolan, Keith T. Poole and Howard Rosenthal. 2006. Polarized America:The Dance of Ideology and Unequal Riches. Cambridge: MIT Press.
McClain, Paula D. 1993. “The Changing Dynamic of Urban Politics: Black andHispanic Municipal Employment: Is there Competition?” Journal of Politics 55.
McClain, Paula D. and Joseph Stewart. 2010. Can We All Get Along? Racial andEthnic Minorities in American Politics. 5th ed. Westview Press.
McClain, Paula D. et al. 2009. “Black and White Americans and Latino Immigrants:A Preliminary Look at Attitudes in Three Southern Cities.” Presented at theAnnual Meeting of the American Political Science Association.
Michelson, Melissa R. 2001. “The Effect of National Mood on Mexican AmericanPolitical Opinion.” Hispanic Journal of Behavioral Sciences 23.
Miler, Kristina C. 2010. Constituency Representation in Congress: A View FromCapitol Hill. New York: Cambridge University Press.
Miller, Lawrence W., Jerry L. Polinard and Robert D. Wrinkle. 1984. “Attitudestoward Undocumented Workers: The Mexican American Perspective.” Social Sci-ence Quarterly 65:482–94.
Olson, Mancur, Jr. 1965. The Logic of Collective Action. Cambridge, MA: HarvardUniversity Press.
Pantoja, Adrian D., Ricardo Ramirez and Gary M. Segura. 2001. “Citizens byChoice, Voters by Necessity: Patterns in Political Mobilization by NaturalizedLatinos.” Political Research Quarterly 54:729–750.
Passel, Jeffrey S. and D’Vera Cohn. 2009. “A Portrait of Unauthorized Immigrantsin the United States.”.
Polinard, Jerry, Robert Wrinkle and Rodolfo de la Garza. 1984. “Attitudes of Mex-ican Americans toward irregular Mexican Immigration.” International MigrationReview 18:782–899.
Rocha, Rene R., Thomas Longoria, Robert D. Wrinkle, Benjamin R. Knoll, J.L.Polinard and James Wenzel. 2011. “Ethnic Context and Immigration Policy: Pref-erences Among Latinos and Anglos.” Social Science Quarterly 92(1).
Rouse, Stella M., Betina Cutia Wilkinson and James C. Garand. 2010. “DividedLoyalties? Understanding Variation in Latinos’ Attitudes Toward Immigration.”Social Science Quarterly 91(3).
Sanchez, Gabriel R. 2006. “The Role of Group Consciousness in Latino PublicOpinion.” Political Research Quarterly 59(3):435–46.
49
Schattschneider, E. E. 1960. The Semi-Sovereign People: A Realist’s View of Democ-racy in America. New York: Holt, Rinehart, and Winston.
Sears, David O. and C. L. Funk. 1991. “The Role of Self-Interest in Social andPolitical Attitudes.” Advances in Experimental Social Psychology 24:1–91.
Segura, Gary and Matt Barreto. 2012. “Obama wins 75% of Latino vote, markshistoric Latino influence in presidential election.” Latino Decisions .URL: http://www.latinodecisions.com/blog/2012/11/07/obama-wins-75-of-latino-vote-marks-historic-latino-influence-in-presidential-election/
Sigelman, Lee and Susan Welch. 1991. Black Americans’ View of Racial Inequality:The Dream Deferred. New York: Cambridge University Press.
Tam Cho, Wendy K. 1999. “Naturalization, Socialization, Participation: Immigrantsand (Non-) Voting.” The Journal of Politics 61(4):1140–55.
Taylor, Paul. 2009. “Between Two Worlds: How Young Latinos Come of Age inAmerica.” Pew Hispanic Center .
Taylor, Paul and Richard Fry. 2007. “Hispanics and the 2008 Election: A SwingVote?” Pew Hispanic Center .
Truman, David B. 1951. The Governmental Process: Political Interests and PublicOpinion. New York: Alfred A. Knopf.
Uhlaner, Carole J. and F. Chris Garcia. 2002. Latino Public Opinion. In Under-standing Public Opinion, ed. Barbara Norrander and Clyde Wilcox. CQ Press.
Verba, Sidney, Kay Lehman Schlozman and Henry E. Brady. 1995. Voice and Equal-ity: Civic Voluntarism in American Politics. Cambridge: Harvard UniversityPress.
Verba, Sidney and Norman H. Nie. 1972. Participation in America: Political Democ-racy and Social Equality. Chicago: University of Chicago Press.
Walker, Jack L, Jr. 1991. Mobilizing Interest Groups in America. Ann Arbor, MI:University of Michigan Press.
Weakliem, R. Kent, Robert Y. Shapiro and Lawrence R. Jacobs. 2005. “By Pop-ular Demand: The Effect of Public Opinion on Income Inequality.” ComparativeSociology 4(3):260–84.
Winter, Nicholas. 2008. Dangerous Frames: How Ideas About Race and GenderShape Public Opinion. Chicago: University of Chicago Press.
Wlezien, Christopher. 2005. “On the salience of political issues: The problem with‘most important problem’.” Electoral Studies 24:555–579.
50


![PRINCIPALS’ ATTITUDES AND INSIGHTS CONCERNING THE ...cnweb.cn.edu/tedu/NCATE-State/Examples-ProfMajor/EDUC600Sample[3].pdfPrincipal’s Attitudes 3 Definitions Within the context](https://img.pdfslide.net/doc/110x75/5f5072c8548981174f5e18d2/principalsa-attitudes-and-insights-concerning-the-cnwebcneduteduncate-stateexamples-profmajoreduc600sample3pdf.jpg)


![Investigating the Knowledge, Attitudes, Practices … the Knowledge, Attitudes, Practices and ... 31 October 2015] ... Concerning the compliance with WHO recommendation in Saudi Arabia,](https://img.pdfslide.net/doc/110x75/5b2f4b907f8b9a594c8e1744/investigating-the-knowledge-attitudes-practices-the-knowledge-attitudes-practices.jpg)