Embed Size (px)
DESCRIPTION
Assessing Bay Criteria. Assessment method reminder ‘Relative Model’ method Direct model assessment Results. Criteria Assessment. Gather and interpolate WQ Data. Separate Open Water from Deep Water from Deep Channel using the pycnocline. - PowerPoint PPT Presentation
Citation preview
1
Assessing Bay Criteria
Assessment method reminder‘Relative Model’ method
Direct model assessmentResults
2
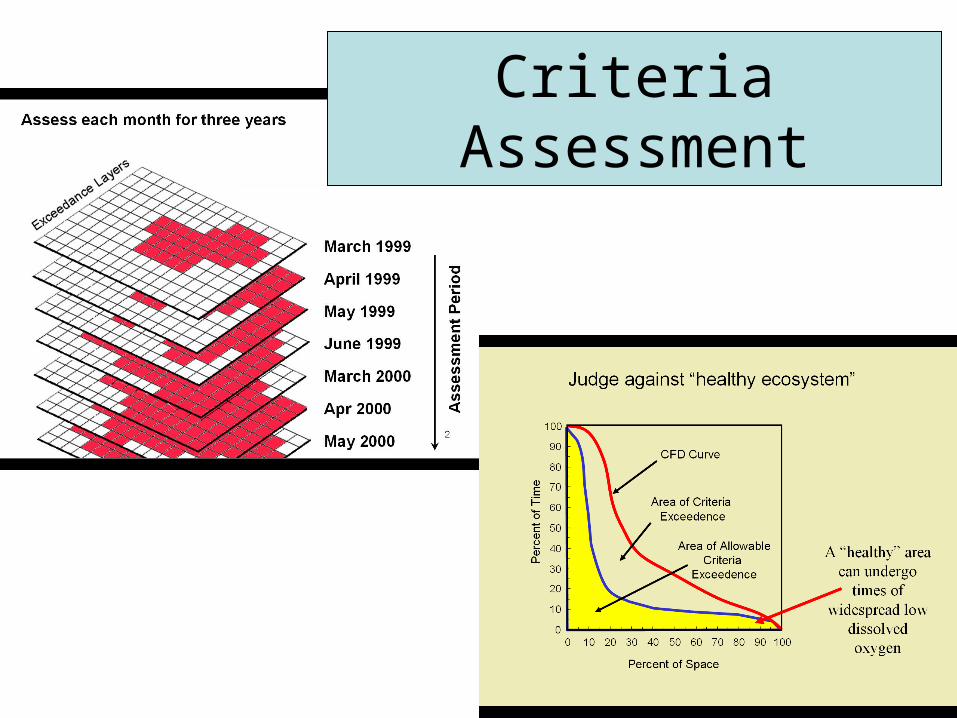
Criteria Assessment
3
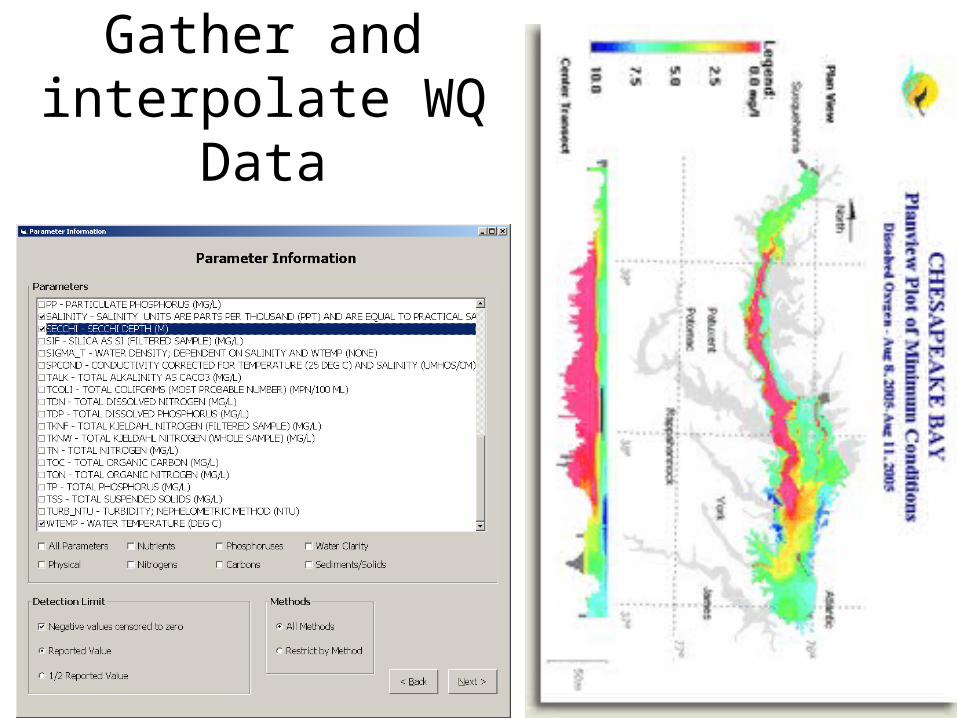
Gather and interpolate WQ Data
4
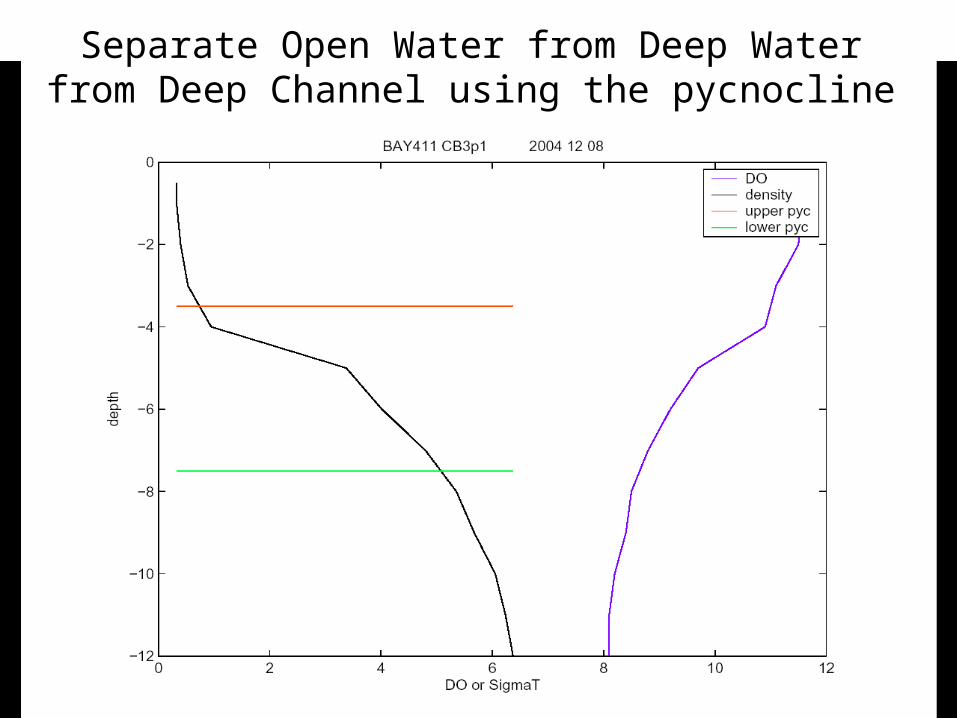
Separate Open Water from Deep Water from Deep Channel using the pycnocline
5
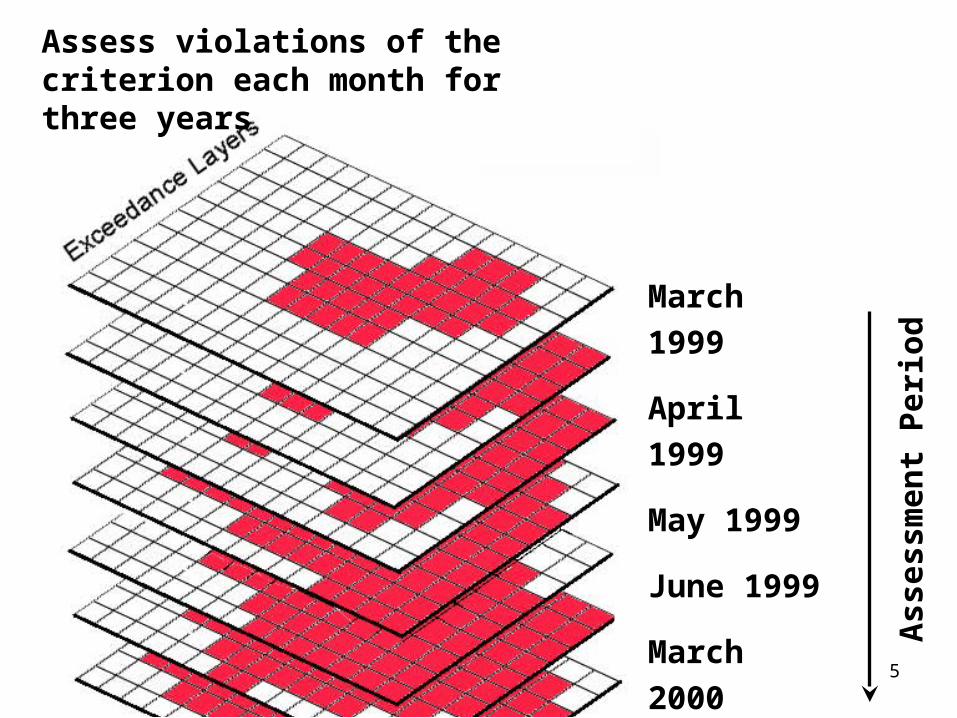
Assess violations of the criterion each month for three years
Ass
essm
ent
Per
iod
March 1999
April 1999
May 1999
June 1999
March 2000
Apr 2000
May 2000
6
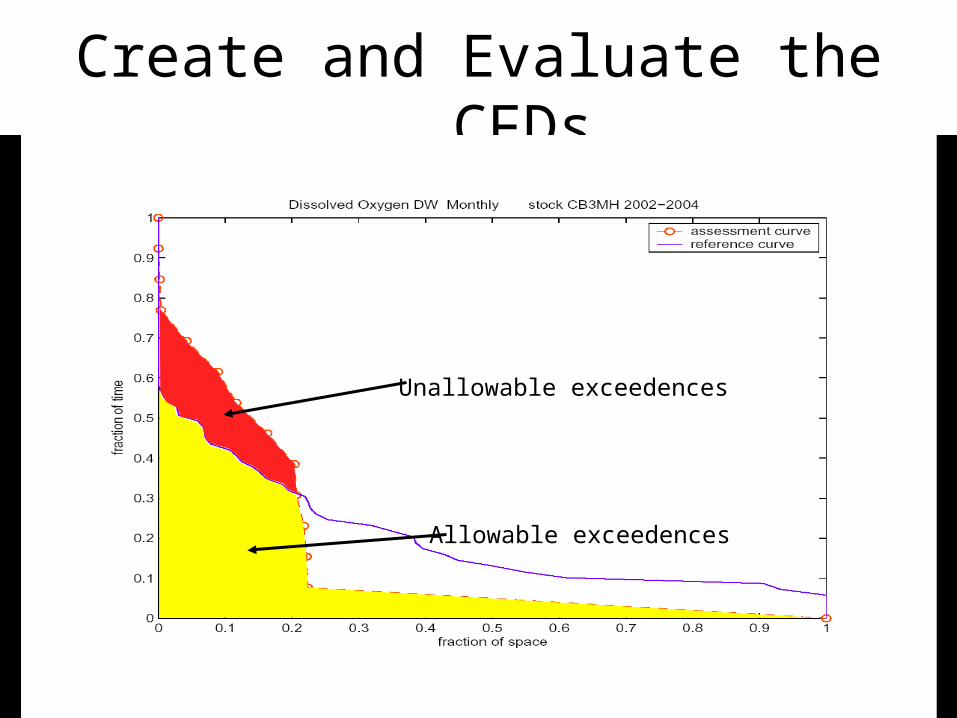
Create and Evaluate the CFDs
Allowable exceedences
Unallowable exceedences
7
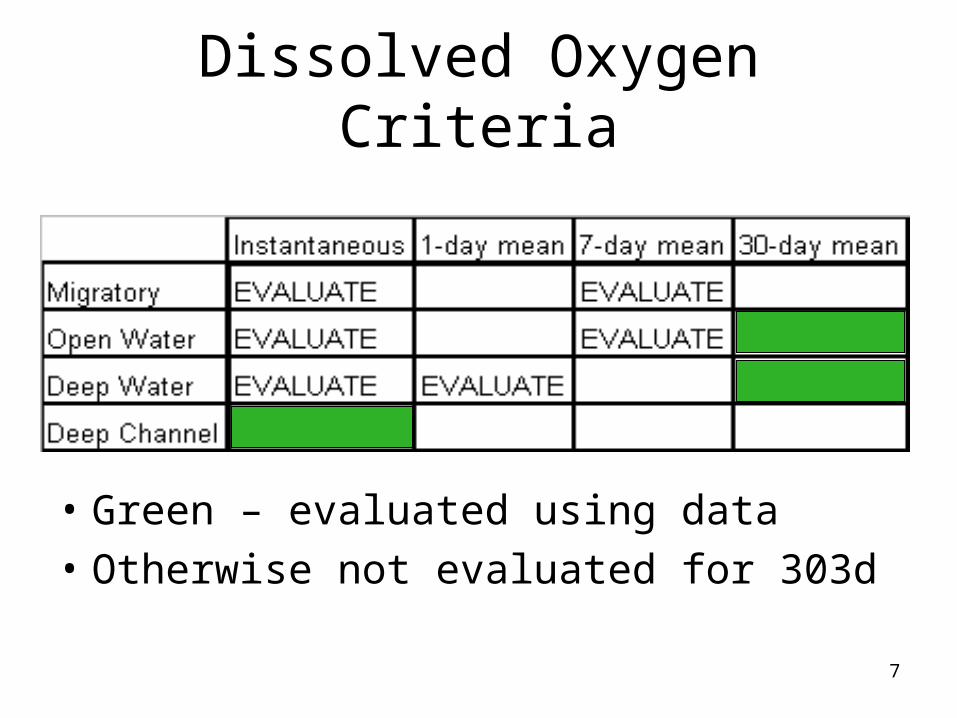
Dissolved Oxygen Criteria
• Green – evaluated using data
• Otherwise not evaluated for 303d
8
2003 DO Criteria Assessment
• Use the model in a relative sense to re-generate ‘observed’ data sets for different scenarios
• Model output not directly assessed
• Model response to scenarios overlaid on observed data to create “what we would have observed given scenario inputs”
9
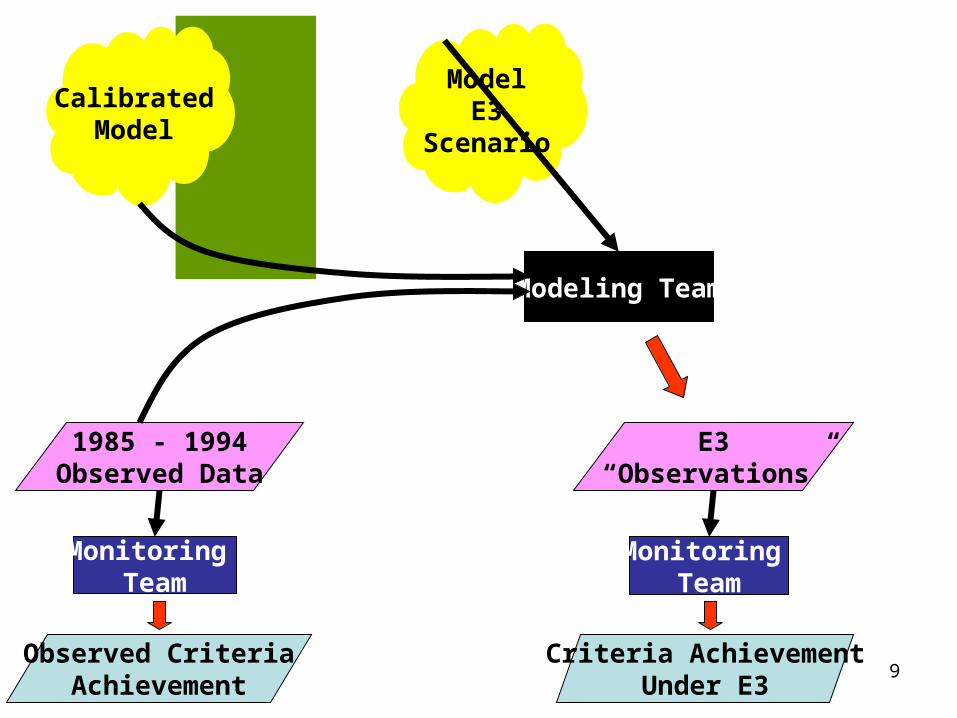
Monitoring Team
1985 - 1994Observed Data
Observed CriteriaAchievement
CalibratedModel
ModelE3
Scenario
Monitoring Team
E3“Observations”
Criteria AchievementUnder E3
Modeling Team
10
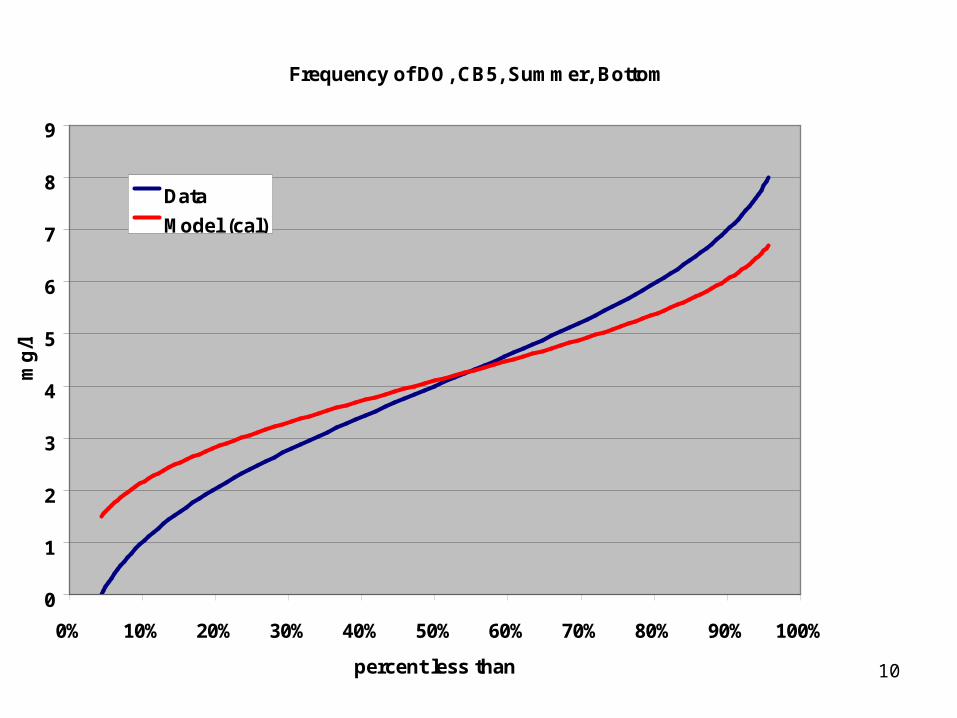
Frequency of DO, CB5, Summer, Bottom
0
1
2
3
4
5
6
7
8
9
0% 10% 20% 30% 40% 50% 60% 70% 80% 90% 100%
percent less than
mg
/l
Data
Model (cal)
11
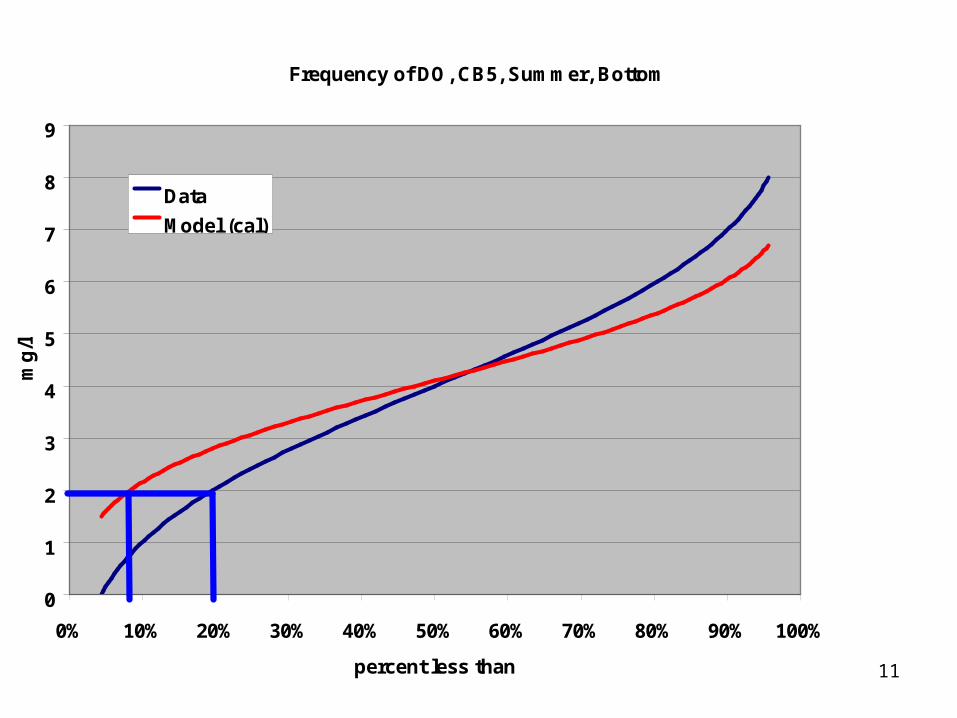
Frequency of DO, CB5, Summer, Bottom
0
1
2
3
4
5
6
7
8
9
0% 10% 20% 30% 40% 50% 60% 70% 80% 90% 100%
percent less than
mg
/l
Data
Model (cal)
12
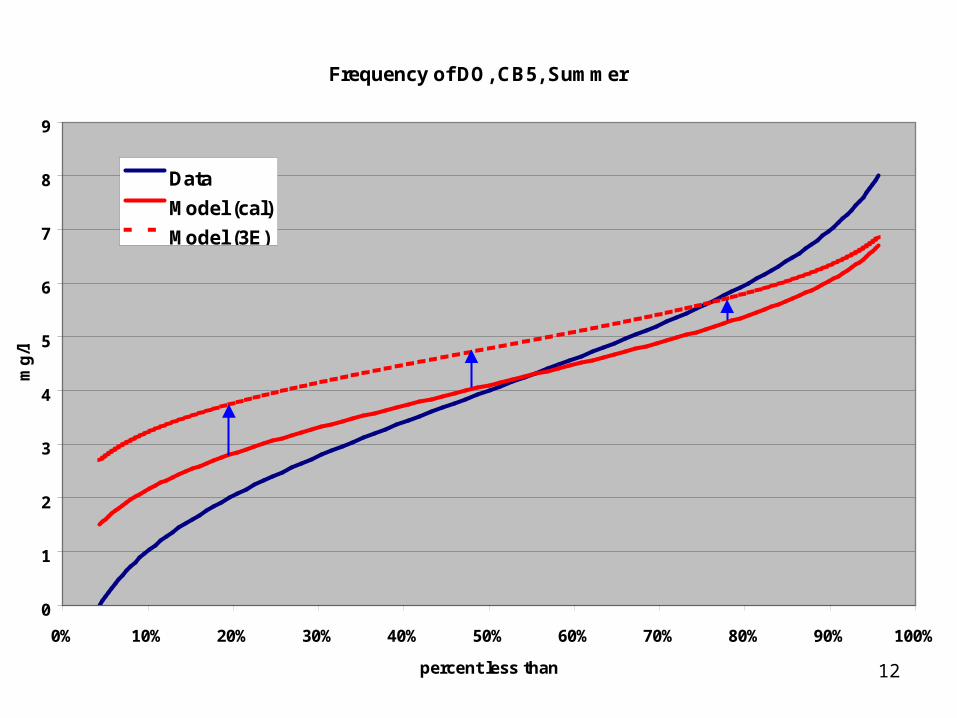
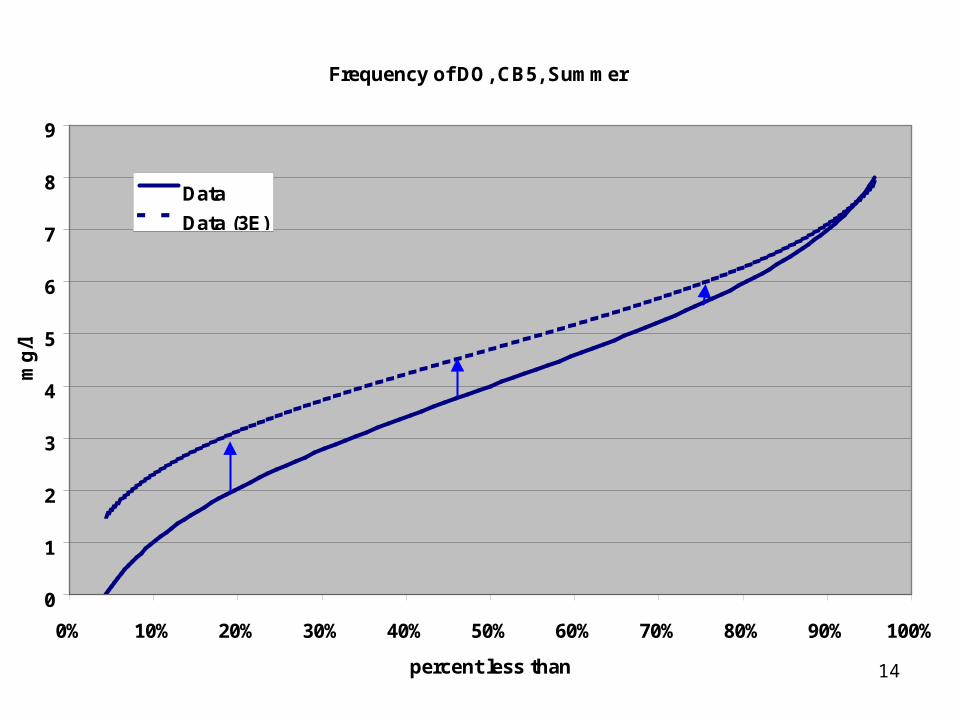
Frequency of DO, CB5, Summer
0
1
2
3
4
5
6
7
8
9
0% 10% 20% 30% 40% 50% 60% 70% 80% 90% 100%
percent less than
mg
/l
Data
Model (cal)
Model (3E)
13
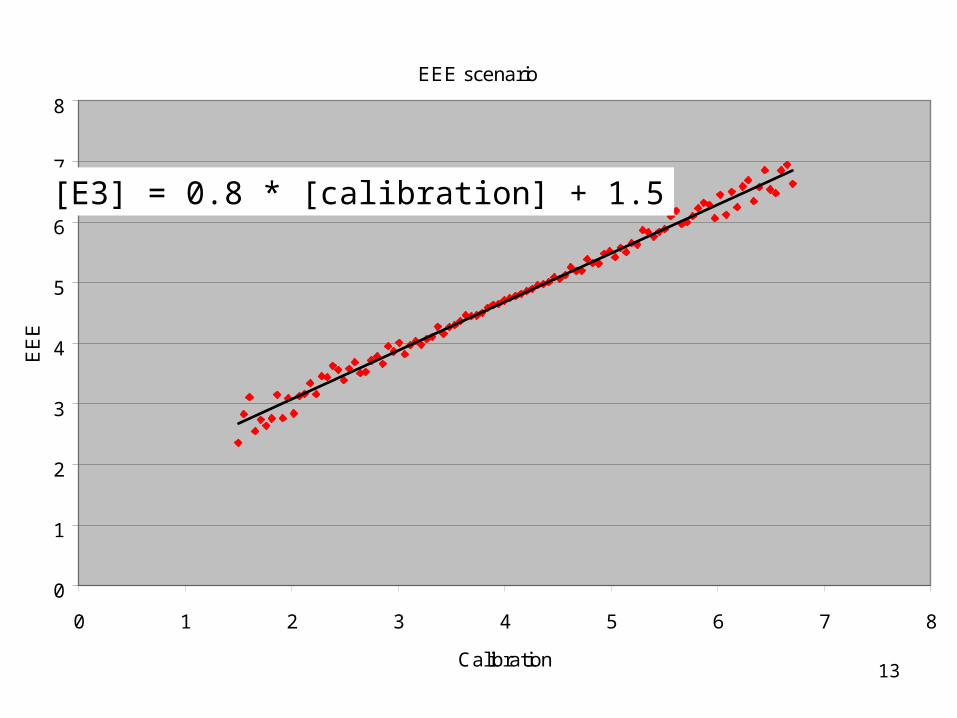
EEE scenario
y = 0.8059x + 1.4603
0
1
2
3
4
5
6
7
8
0 1 2 3 4 5 6 7 8
Calibration
EE
E
[E3] = 0.8 * [calibration] + 1.5
14
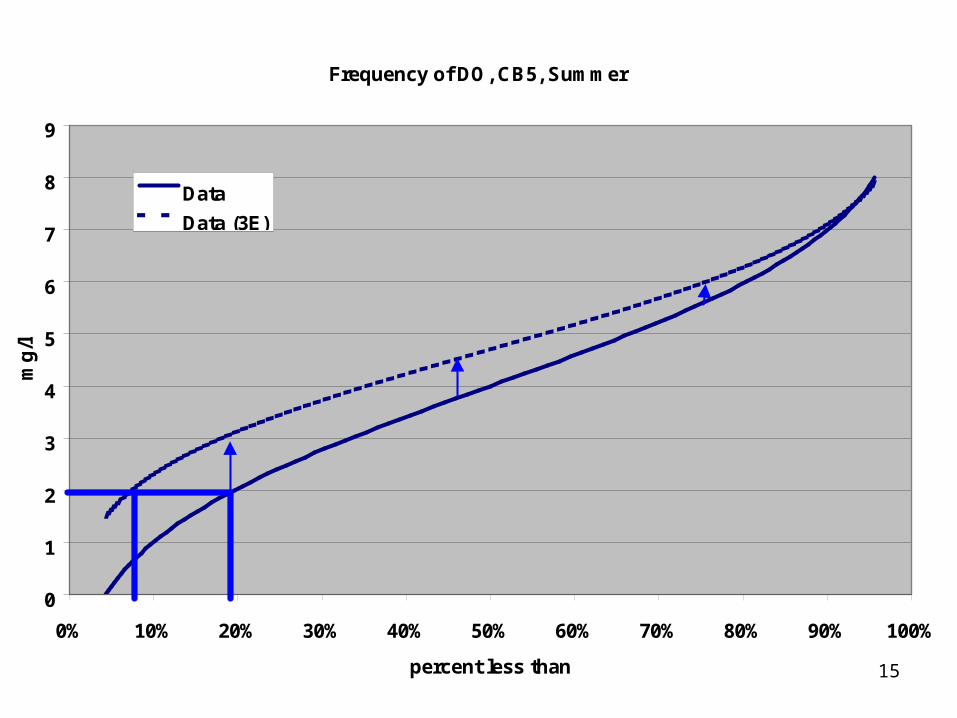
Frequency of DO, CB5, Summer
0
1
2
3
4
5
6
7
8
9
0% 10% 20% 30% 40% 50% 60% 70% 80% 90% 100%
percent less than
mg
/l
Data
Data (3E)
15
Frequency of DO, CB5, Summer
0
1
2
3
4
5
6
7
8
9
0% 10% 20% 30% 40% 50% 60% 70% 80% 90% 100%
percent less than
mg
/l
Data
Data (3E)
16
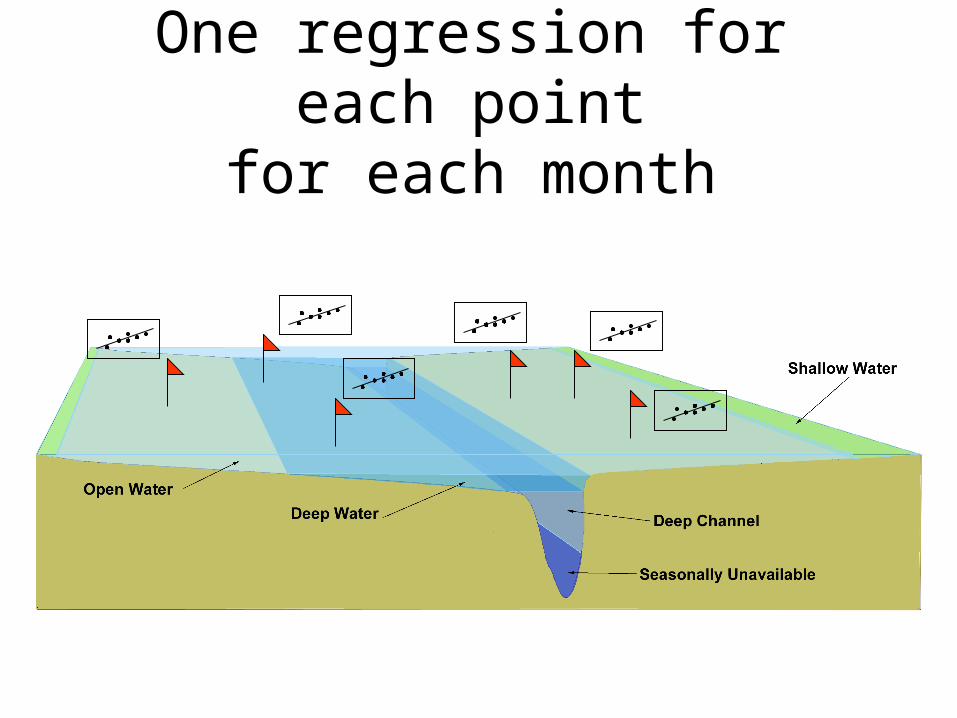
One regression for each pointfor each month
17
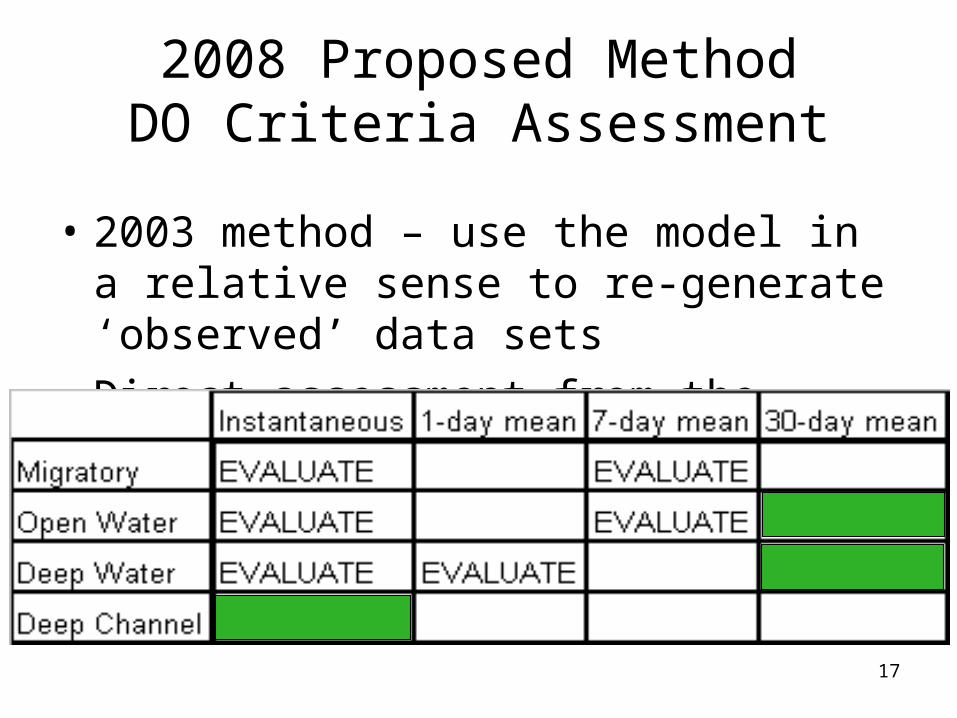
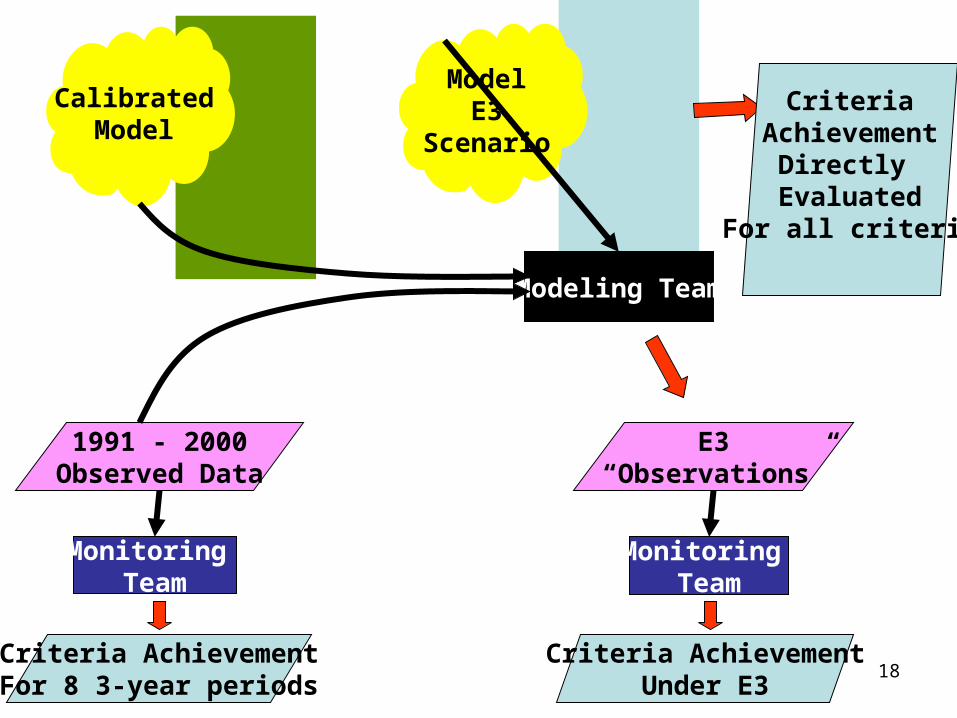
2008 Proposed MethodDO Criteria Assessment
• 2003 method – use the model in a relative sense to re-generate ‘observed’ data sets
• Direct assessment from the model
18
Monitoring Team
1991 - 2000Observed Data
Criteria AchievementFor 8 3-year periods
CalibratedModel
ModelE3
Scenario
Monitoring Team
E3“Observations”
Criteria AchievementUnder E3
Modeling Team
CriteriaAchievement
Directly Evaluated
For all criteria
19
Proposed DO Criteria Assessment
• Use the direct model assessment to determine whether the 3 relative-model assessments are more or less difficult to achieve– Question 1 – Which criteria are ‘limiting’?
• Use the model in a relative sense (2003 method) for the TMDL– Question 2 – What is the TMDL?
20
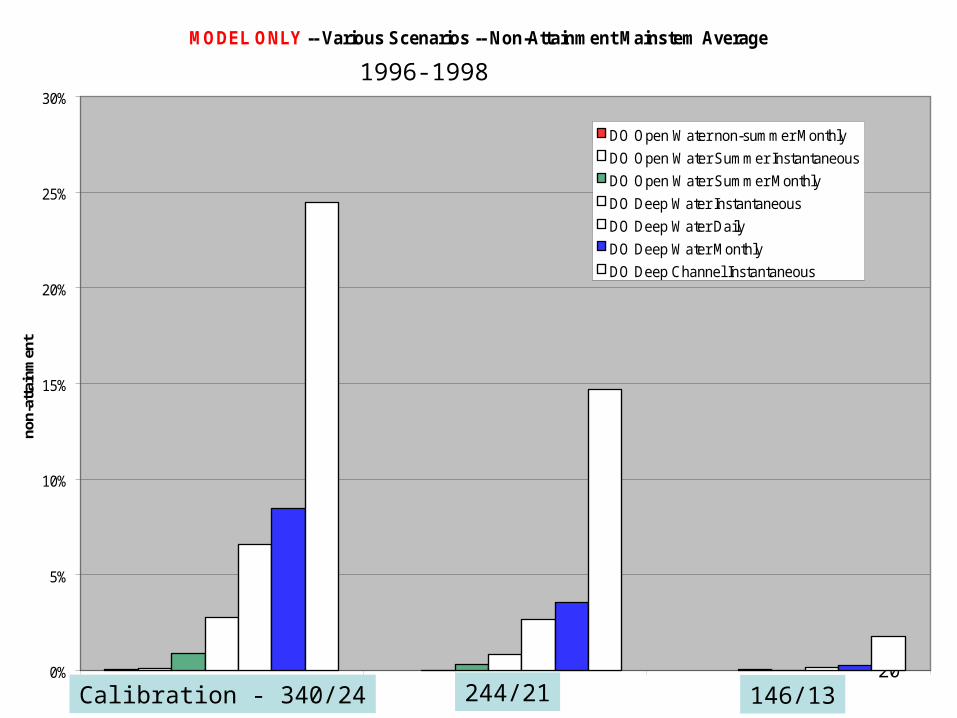
MODEL ONLY -- Various Scenarios -- Non-Attainment Mainstem Average
0%
5%
10%
15%
20%
25%
30%
Observed Bad Trib Strat BTS+40%
no
n-a
ttai
nm
ent
DO Open Water non-summer Monthly
DO Open Water Summer Instantaneous
DO Open Water Summer Monthly
DO Deep Water Instantaneous
DO Deep Water Daily
DO Deep Water Monthly
DO Deep Channel Instantaneous
Calibration - 340/24 244/21 146/13
1996-1998
21
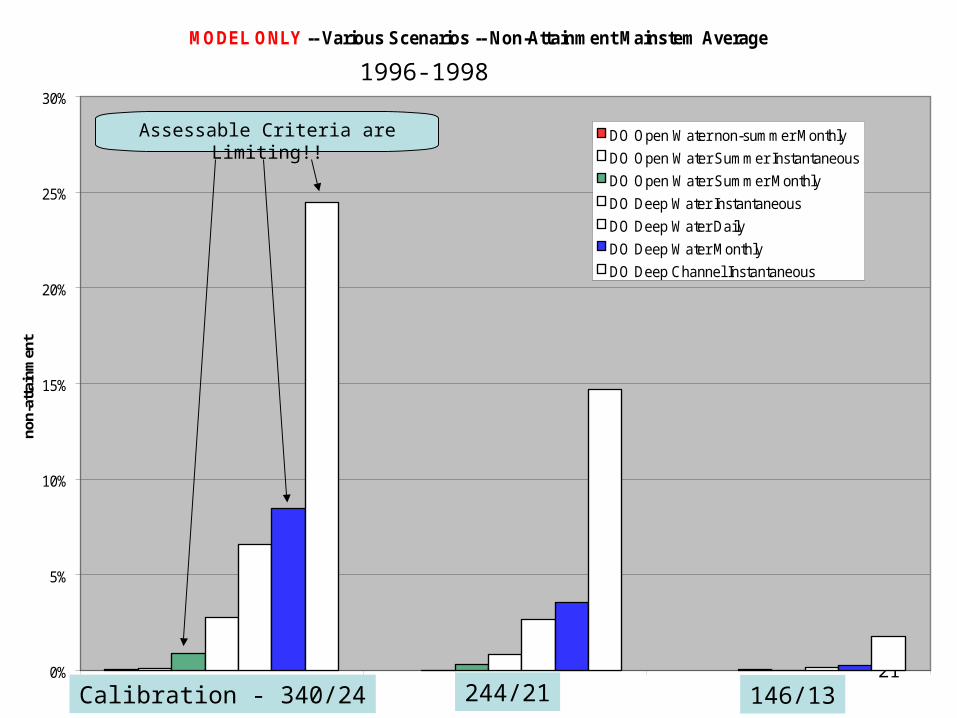
MODEL ONLY -- Various Scenarios -- Non-Attainment Mainstem Average
0%
5%
10%
15%
20%
25%
30%
Observed Bad Trib Strat BTS+40%
no
n-a
ttai
nm
ent
DO Open Water non-summer Monthly
DO Open Water Summer Instantaneous
DO Open Water Summer Monthly
DO Deep Water Instantaneous
DO Deep Water Daily
DO Deep Water Monthly
DO Deep Channel Instantaneous
Assessable Criteria are Limiting!!
Calibration - 340/24 244/21 146/13
1996-1998
22
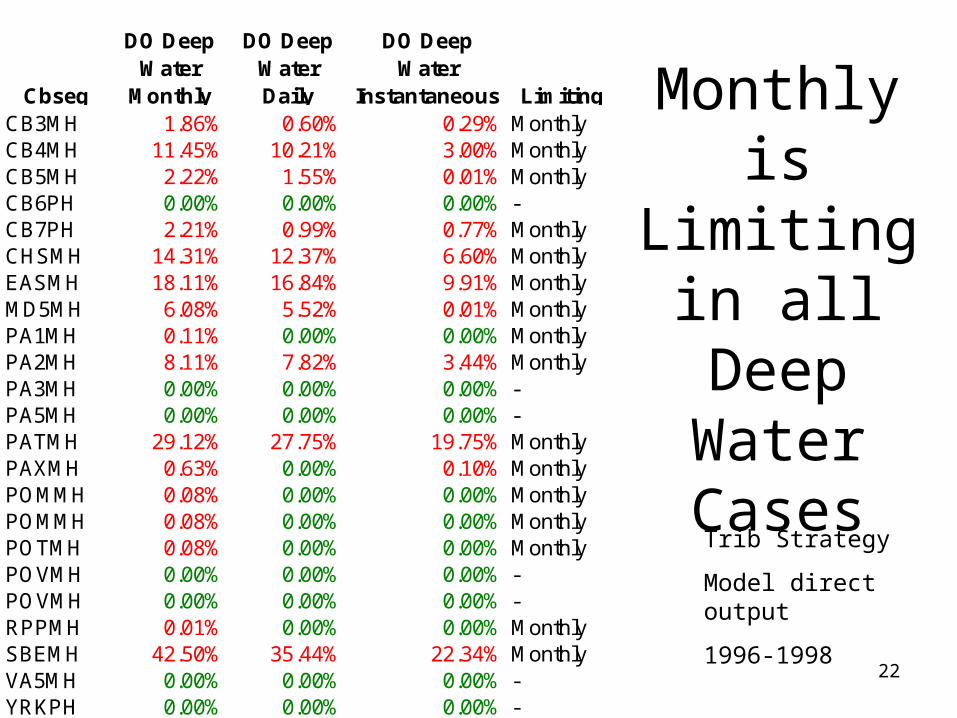
Monthly is Limiting in all Deep Water Cases
Cbseg
DO Deep Water
Monthly
DO Deep Water Daily
DO Deep Water
Instantaneous LimitingCB3MH 1.86% 0.60% 0.29% MonthlyCB4MH 11.45% 10.21% 3.00% MonthlyCB5MH 2.22% 1.55% 0.01% MonthlyCB6PH 0.00% 0.00% 0.00% -CB7PH 2.21% 0.99% 0.77% MonthlyCHSMH 14.31% 12.37% 6.60% MonthlyEASMH 18.11% 16.84% 9.91% MonthlyMD5MH 6.08% 5.52% 0.01% MonthlyPA1MH 0.11% 0.00% 0.00% MonthlyPA2MH 8.11% 7.82% 3.44% MonthlyPA3MH 0.00% 0.00% 0.00% -PA5MH 0.00% 0.00% 0.00% -PATMH 29.12% 27.75% 19.75% MonthlyPAXMH 0.63% 0.00% 0.10% MonthlyPOMMH 0.08% 0.00% 0.00% MonthlyPOMMH 0.08% 0.00% 0.00% MonthlyPOTMH 0.08% 0.00% 0.00% MonthlyPOVMH 0.00% 0.00% 0.00% -POVMH 0.00% 0.00% 0.00% -RPPMH 0.01% 0.00% 0.00% MonthlySBEMH 42.50% 35.44% 22.34% MonthlyVA5MH 0.00% 0.00% 0.00% -YRKPH 0.00% 0.00% 0.00% -
Trib Strategy
Model direct output
1996-1998
23
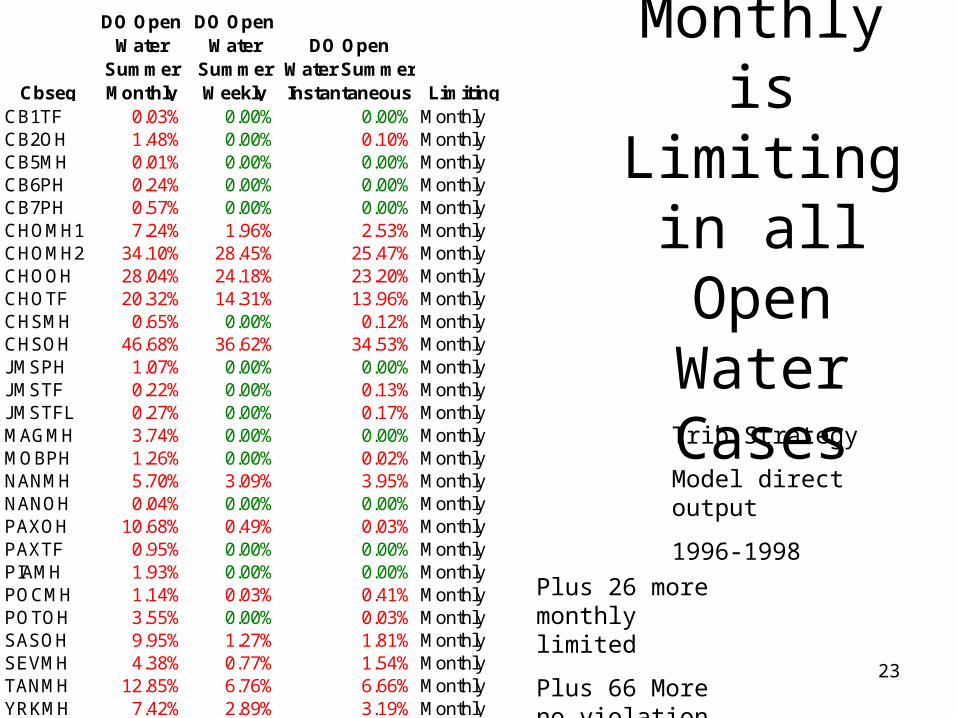
Monthly is Limiting in all Open Water Cases
Trib Strategy
Model direct output
1996-1998
Cbseg
DO Open Water
Summer Monthly
DO Open Water
Summer Weekly
DO Open Water Summer Instantaneous Limiting
CB1TF 0.03% 0.00% 0.00% MonthlyCB2OH 1.48% 0.00% 0.10% MonthlyCB5MH 0.01% 0.00% 0.00% MonthlyCB6PH 0.24% 0.00% 0.00% MonthlyCB7PH 0.57% 0.00% 0.00% MonthlyCHOMH1 7.24% 1.96% 2.53% MonthlyCHOMH2 34.10% 28.45% 25.47% MonthlyCHOOH 28.04% 24.18% 23.20% MonthlyCHOTF 20.32% 14.31% 13.96% MonthlyCHSMH 0.65% 0.00% 0.12% MonthlyCHSOH 46.68% 36.62% 34.53% MonthlyJMSPH 1.07% 0.00% 0.00% MonthlyJMSTF 0.22% 0.00% 0.13% MonthlyJMSTFL 0.27% 0.00% 0.17% MonthlyMAGMH 3.74% 0.00% 0.00% MonthlyMOBPH 1.26% 0.00% 0.02% MonthlyNANMH 5.70% 3.09% 3.95% MonthlyNANOH 0.04% 0.00% 0.00% MonthlyPAXOH 10.68% 0.49% 0.03% MonthlyPAXTF 0.95% 0.00% 0.00% MonthlyPIAMH 1.93% 0.00% 0.00% MonthlyPOCMH 1.14% 0.03% 0.41% MonthlyPOTOH 3.55% 0.00% 0.03% MonthlySASOH 9.95% 1.27% 1.81% MonthlySEVMH 4.38% 0.77% 1.54% MonthlyTANMH 12.85% 6.76% 6.66% MonthlyYRKMH 7.42% 2.89% 3.19% Monthly
Plus 26 more monthly limited
Plus 66 More no violation
24
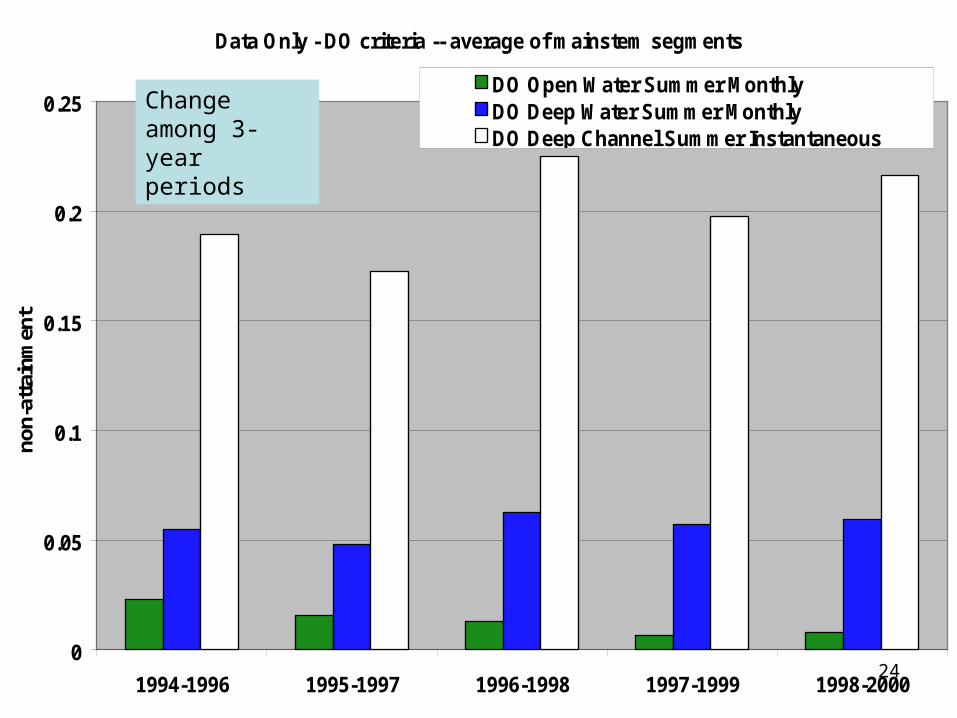
Data Only - DO criteria -- average of mainstem segments
0
0.05
0.1
0.15
0.2
0.25
1994-1996 1995-1997 1996-1998 1997-1999 1998-2000
non-
atta
inm
ent
DO Open Water Summer MonthlyDO Deep Water Summer MonthlyDO Deep Channel Summer Instantaneous
Change among 3-year periods
25
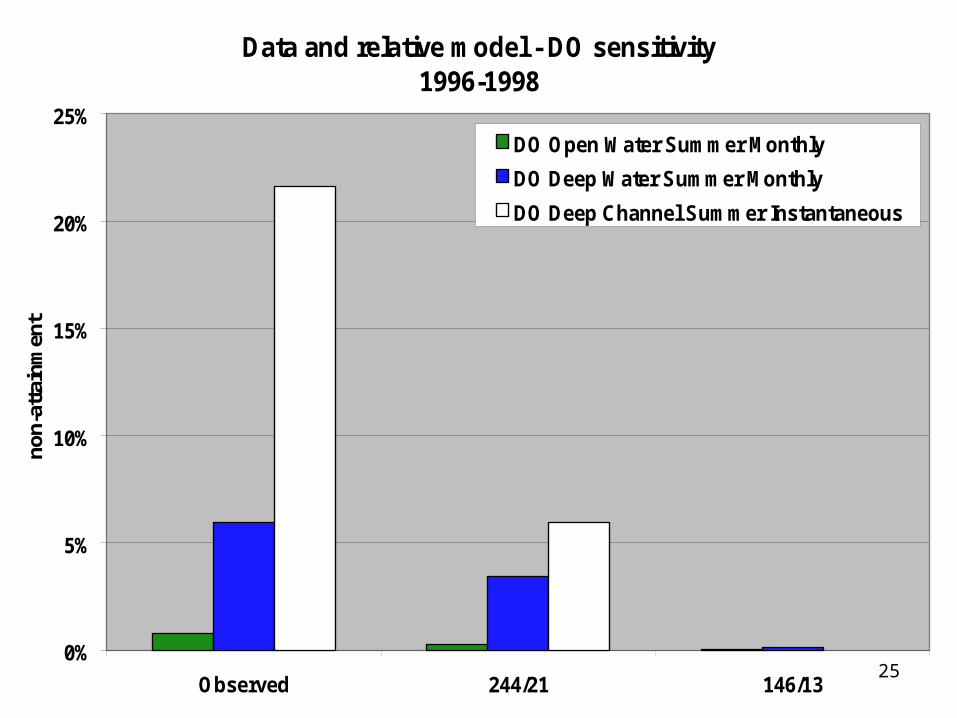
Data and relative model - DO sensitivity1996-1998
0%
5%
10%
15%
20%
25%
Observed 244/21 146/13
non-
atta
inm
ent
DO Open Water Summer Monthly
DO Deep Water Summer Monthly
DO Deep Channel Summer Instantaneous
26
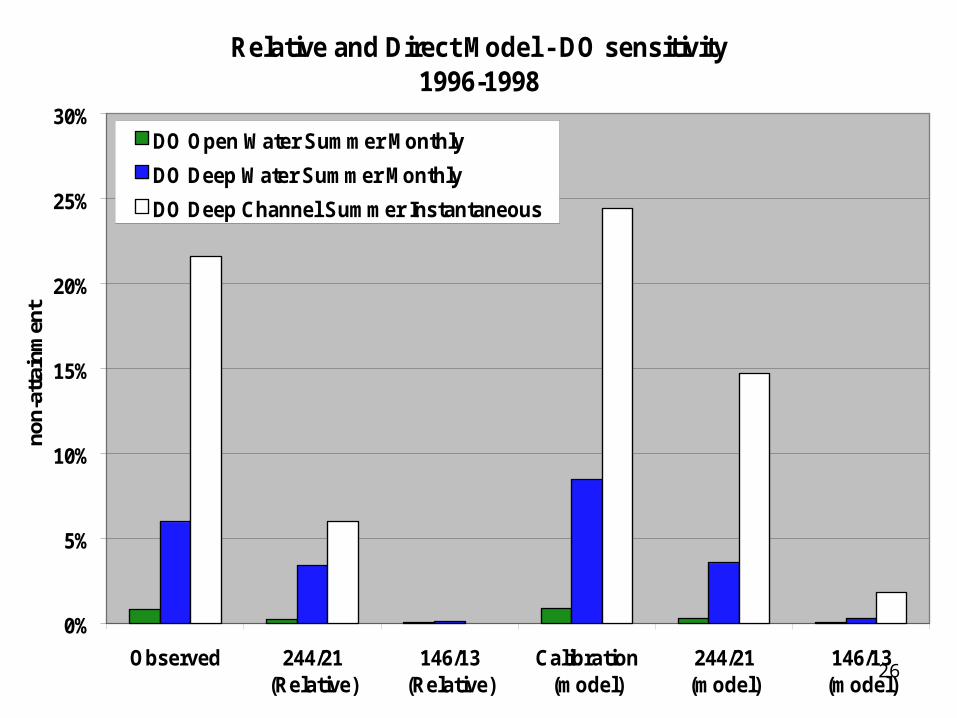
Relative and Direct Model - DO sensitivity1996-1998
0%
5%
10%
15%
20%
25%
30%
Observed 244/21(Relative)
146/13(Relative)
Calibration(model)
244/21(model)
146/13(model)
non-
atta
inm
ent
DO Open Water Summer Monthly
DO Deep Water Summer Monthly
DO Deep Channel Summer Instantaneous
27
Initial Observations
• Model predicts that the most restrictive criteria are the ones that we can measure and assess through the relative model method
• The relative model method is sensitive to load reductions
28
Decision Requested
• Agreement on proceeding forward with the recommended procedures for assessing the full suite of Bay criteria adopted by the states into their water quality standards regulations pending further understanding of which sets of criteria are driving the allocations.