Embed Size (px)
Citation preview
Objective: The objective was to establish a sys-tematic framework for measuring and understanding cognitive distraction in the automobile.
Background: Driver distraction from secondary in-vehicle activities is increasingly recognized as a sig-nificant source of injuries and fatalities on the roadway.
Method: Across three studies, participants com-pleted eight in-vehicle tasks commonly performed by the driver of an automobile. Primary, secondary, sub-jective, and physiological measures were collected and integrated into a cognitive distraction scale.
Results: In-vehicle activities, such as listening to the radio or an audio book, were associated with a low level of cognitive workload; the conversation activities of talking to a passenger in the vehicle or conversing with a friend on a handheld or hands-free cell phone were associated with a moderate level of cognitive workload; and using a speech-to-text interfaced e-mail system involved a high level of cognitive workload.
Conclusion: The research established that there are significant impairments to driving that stem from the diversion of attention from the task of operating a motor vehicle and that the impairments to driving are directly related to the cognitive workload of these in-vehicle activities. Moreover, the adoption of voice-based systems in the vehicle may have unintended con-sequences that adversely affect traffic safety.
Application: These findings can be used to help inform scientifically based policies on driver distraction, particularly as they relate to cognitive distraction stem-ming from the diversion of attention to other concur-rent activities in the vehicle.
Keywords: cognitive workload, cognitive distraction, driving, EEG, visual scanning behavior, divided atten-tion, multitasking
IntroductIonDriver distraction is increasingly recognized
as a significant source of injuries and fatalities on the roadway. In fact, the National Highway Traffic Safety Administration (NHTSA) esti-mated that inattention accounted for 25% of all police-reported crashes (Ranney, Mazzae, Garrott, & Goodman, 2000; Wang, Knipling, & Goodman, 1996). Other estimates have sug-gested that inattention was a factor in as many as 35% to 50% of all crashes (Sussman, Bishop, Madnick, & Walker, 1985). More recently, data from the 100-Car Naturalistic Driving Study (Dingus et al., 2006) showed that inattention was a factor in 78% of all crashes and near crashes, making it the single largest crash causa-tion factor in the analysis. However, in each of these analyses, the classification of inattention was a catchall category encompassing a vari-ety of phenomena, including fatigue, driving-related distractions (such as glances to mirrors during a merge), nonspecific eye glances away from the forward roadway, and distraction from secondary in-vehicle activities.
Distraction from secondary in-vehicle activi-ties stems from a combination of three sources (Strayer, Watson, & Drews, 2011). Impairments to driving can arise from a competition for visual processing, for example, when a driver takes his or her eyes off the road to interact with a device. Impairments can also arise from manual inter-ference, as in cases when drivers take their hands off the steering wheel to manipulate a device. Finally, cognitive sources of distraction occur when attention is withdrawn from the process-ing of information necessary for the safe opera-tion of a motor vehicle. These three sources of distraction can operate independently, but they are not mutually exclusive, and therefore inter-acting with different in-vehicle devices can result in impairments from one, two, or all three
575149 HFSXXX10.1177/0018720815575149Human FactorsCognitive Distraction in the Automobile
Address correspondence to David L. Strayer, Department of Psychology, University of Utah, 380 S. 1530 E. BEHS 502, Salt Lake City, UT 84112, USA; e-mail: [email protected].
SPECIAL SECTION: Peer Commentary on Assessing Cognitive Distraction in Driving
Assessing Cognitive Distraction in the Automobile
David L. Strayer and Jonna Turrill, University of Utah, Salt Lake City, Joel M. Cooper, Precision Driving Research, Salt Lake City, Utah, James R. Coleman, University of Utah, Salt Lake City, Nathan Medeiros-Ward, University of Illinois, Urbana-Champaign, and Francesco Biondi, University of Padova, Padova, Italy
HUMAN FACTORSVol. 57, No. 8, December 2015, pp. 1300 –1324DOI: 10.1177/0018720815575149Copyright © 2015, Human Factors and Ergonomics Society.
at TUFTS UNIV on August 8, 2016hfs.sagepub.comDownloaded from
Cognitive DistraCtion in the automobile 1301
sources. The focus of this article is on develop-ing a valid and sensitive tool for reliably mea-suring inattention arising from cognitive sources of distraction.
Standardized efforts to evaluate sources of distraction are not new. Indeed, NHTSA has issued driver distraction guidelines to address visual and manual sources of distraction (cf. NHTSA, 2012). Like other published standards, these guidelines specify a number of methods for evaluating the visual (and to a lesser extent, manual) demand of secondary-task interactions. However, there are currently no published stan-dards that explicitly and exclusively apply to cognitive distraction (but see Engström et al., 2013, for an evolving discussion on driver inat-tention). Moreover, with regard to the use of sec-ondary in-vehicle tasks, experimental studies using driving simulators or instrumented vehi-cles (Caird, Willness, Steel, & Scialfa, 2008; Horrey & Wickens, 2006; Strayer, Drews, & Johnston, 2003; Strayer & Johnston, 2001; see also the epidemiological studies by Redelmeier & Tibshirani, 1997, and McEvoy et al., 2005) have produced strikingly different estimates of driving impairment and crash risk than the cor-relation-based naturalistic studies of driving (Dingus et al., 2006; Klauer et al., 2014), so the precise crash risk associated with cell phone use is far from settled.
In fact, cognitive distraction is the most diffi-cult of the three sources of distraction to assess because of the problems associated with observ-ing what a driver’s brain (as opposed to hands or eyes) is doing. Furthermore, changes in driving performance associated with cognitive distrac-tion have been shown to be qualitatively differ-ent from those associated with visual distraction (Angell et al., 2006; Engström, Johansson, & Östlund, 2005). For example, visual distraction has been shown to increase the variability of lane position, whereas cognitive distraction has been shown to decrease the variability of lane position (Cooper, Medeiros-Ward, & Strayer, 2013; Medeiros-Ward, Cooper, & Strayer, 2013).
In order to assess cognitive workload, prior experimental research has typically employed some combination of primary-task and secondary- task behavioral measures, physiolog-ical measures (e.g., neurological, cardiovascular,
and ocular), and subjective workload assess-ments. Prior research in aviation psychology has used these measures to assess the cognitive workload of pilots (Kramer, Sirevaag, & Braun, 1987; Sirevaag et al., 1993). For example, Kramer et al. (1987) examined pilots’ workload by comparing their flight performance during takeoff, level flight, holding a heading, and land-ing. In this study, flight performance, subjective measurements, and brain-based physiological measures all reflected changes in mental work-load as the primary task of piloting became more difficult.
Following the lead from aviation psychology, Strayer et al. (2003; Strayer & Drews, 2007a) used an eye tracker in conjunction with an inci-dental recognition memory paradigm to deter-mine what information in the driving scene par-ticipants attended. The authors found that par-ticipants were more than twice as likely to recognize objects encountered in the single-task driving condition as when they were driving and concurrently talking on a hands-free cell phone. Even when the participants’ eyes were directed at objects in the driving environment for the same duration, they were less likely to remem-ber them if they had been conversing on a cell phone. Strayer and Drews (2007a; see also Strayer, Cooper, & Drews, 2004) suggested that using a cell phone induces a form of inattention blindness whereby the cell phone conversation diverts attention from processing the informa-tion necessary to safely operate a motor vehicle.
To evaluate cognitive driver distraction, reac-tion time (RT) is typically measured using sudden-onset stimuli (such as a braking lead vehicle or a flashing dashboard light) that require an immediate response from drivers. Results are often interpreted as an indication of a driver’s ability to quickly and safely respond to the sud-den appearance of a threat. RT measures show a great deal of consistency, regardless of whether drivers are responding to a lead braking vehicle, to peripherally flashing lights, or to the appear-ance of unexpected objects. In all cases, drivers engaged in secondary in-vehicle activities are slower to react than drivers who are paying attention to the roadway. Because of the consis-tent sensitivity of RT measures, a new effort is being considered by the International Standards
at TUFTS UNIV on August 8, 2016hfs.sagepub.comDownloaded from
1302 December 2015 - Human Factors
Organization (ISO) to standardize a protocol for RT measurement while driving (ISO, 2012). This technique will be discussed in more detail later.
Cognitive distraction can also be measured through a variety of physiological techniques. Among these, direct measures of brain activity may be the most compelling. One approach is to use time-locked signals of electroencephalo-graphic (EEG) activity, referred to as event-related brain potentials (ERPs). This technique provides a window into the brain activity that is associated with responses to imperative driving events (e.g., brake lights on a lead vehicle). Using this technique, Strayer and Drews (2007a) found that the brain activity associated with pro-cessing the information necessary for the safe operation of a motor vehicle was suppressed when drivers were talking on a cell phone. These data help to explain why drivers using a cell phone fail to see information in the driving scene and why their response time to scene events is slowed; they do not encode the information as well as they do when they are not distracted by a cell phone conversation. In situations when the driver is required to react quickly, the ERP data suggest that those drivers using a cell phone will be less able to do so because of the diversion of attention from driving to the phone conversation.
It is important to note that the demonstrations of inattention blindness provide a pure measure of cognitive distraction because participants’ eyes were on the road and they were not manu-ally manipulating the phone in dual-task condi-tions. However, one shortcoming of the litera-ture on cognitive distraction is that it has often assessed various secondary tasks in a piecemeal fashion. Although many forms of cognitive dis-traction have been evaluated (e.g., listening to the radio, talking on a cell phone, talking to a passenger, interacting with a speech-to-text sys-tem), no single study has yet involved analyzing a comprehensive set of common real-world tasks using the same experimental protocol. A number of studies have demonstrated the sensi-tivity of cognitive distraction metrics to grada-tions in artificial task difficulty (Mehler, Reimer, & Coughlin, 2012; Reimer, Mehler, Pohlmeyer, Coughlin, & Dusek, 2006), yet sensitivity to gradations in real-world cognitive tasks has not
been fully established (but see Angell et al., 2006, for a related project that focused primarily on visual/manual tasks and simple cognitive tasks, such as listening to a book on tape).
A second knowledge gap with respect to cog-nitive distraction is that there is no comprehen-sive way for assessing the distraction potential of any single activity and relating that to the distrac-tion potential of other in-vehicle activities. What is needed is a comprehensive method for assess-ing secondary-task cognitive distraction and a method to integrate the results into a simple, meaningful metric. This metric would allow researchers to make definitive statements about how one source of cognitive distraction com-pares to another. Although it is clear that activi-ties, such as conversing on a cell phone, degrade certain aspects of driving, it is not clear how to interpret the magnitude of the findings. Is the cognitive distraction of cell phone conversation so severe that it is clearly incompatible with safe driving, or is it sufficiently benign that it is nearly indistinguishable from listening to the radio?
In this article, we present the results from three experiments designed to systematically measure cognitive workload in the automobile. The first experiment served as a control in which participants performed eight different tasks without the concurrent operation of a motor vehicle. In the second experiment, participants performed the same eight tasks while operating a high-fidelity driving simulator. In the third experiment, participants performed the eight tasks while driving an instrumented vehicle in a residential section of a city.
In each experiment, the order of the eight tasks was counterbalanced, and the tasks involved (a) a baseline single-task condition (i.e., no concurrent secondary task), (b) concur-rent listening to a radio, (c) concurrent listening to an audio book, (d) concurrent conversation with a passenger seated next to the participant, (e) concurrent conversation on a handheld cell phone, (f) concurrent conversation on a hands-free cell phone, (g) concurrent interaction with a speech-to-text interfaced e-mail system, and (h) concurrent performance with an auditory ver-sion of the Operation Span (OSPAN) task. The OSPAN task is a demanding complex span task developed by Turner and Engle (1989) that
at TUFTS UNIV on August 8, 2016hfs.sagepub.comDownloaded from
Cognitive DistraCtion in the automobile 1303
requires participants to simultaneously perform a math and memorization task and was chosen to anchor the highest level of cognitive workload.
Each task allows the driver to keep his or her eyes on the road and, with the exception of the handheld cell phone condition, both hands on the steering wheel, so that any impairment to driving must stem from cognitive sources asso-ciated with the diversion of attention from the task of operating the motor vehicle. Based upon prior research (Strayer et al., 2011), these tasks were hypothesized to reflect increasing levels of cognitive workload and were selected because they are representative of the type of activities commonly engaged in while operating a motor vehicle (Stutts et al., 2003).
In each of the experiments, we used a combi-nation of performance indices to assess mental workload, including RT and accuracy, in response to a peripheral light detection task (the Detection Response Task [DRT]; ISO, 2012), subjective workload measures from the NASA Task Load Index (NASA-TLX; Hart & Stave-land, 1988), and physiological measures associ-ated with EEG activity and ERPs time locked to the peripheral light detection task. We also obtained primary-task measures of driving in experiments using the driving simulator and instrumented vehicle. By combining these dif-ferent measures of cognitive workload, we pro-vide a more comprehensive assessment than what would be afforded with using only one technique (Gopher & Donchin, 1986; Sirevaag et al., 1993).
After describing the methods and results of each study in greater detail, we report a meta-analysis that integrates the different dependent measures across the three studies to provide an overall cognitive distraction metric for each of the concurrent secondary tasks. In particular, we used these data to develop a rating system for cognitive distraction whereby nondistracted single-task driving anchored the low end (Cat-egory 1) and the OSPAN task anchored the high end (Category 5) of the scale. For each of the other tasks, its relative position compared to the low and high anchors provides an index of the cognitive workload for that activity when con-currently paired with the operation of a motor vehicle.
ExpErImEnt 1Experiment 1 was designed to provide a
baseline assessment of the eight tasks described earlier. In this controlled assessment, partici-pants were seated in front of a computer monitor that displayed a static fixation cross, and they performed the conditions without the added task of driving. The objective was to establish the cognitive workload associated with each activ-ity and to thereby predict, given the capacity limits of attention, the accompanied cognitive distraction from performing that activity while operating a motor vehicle.
methodParticipants. Thirty-eight participants (20
men and 18 women) from the University of Utah participated in the experiment. Participants ranged in age from 18 to 30 years, with an aver-age age of 22.2 years. All had normal neurologi-cal functioning, normal or corrected-to-normal visual acuity, normal color vision (Ishihara, 1993), and a valid driver’s license and were flu-ent in English. Participants’ years of driving experience ranged from 2.5 to 14.5, with an average of 6.9 years. All participants owned a cellular phone and reported that they used their phone regularly while driving. They were recruited via university-approved flyers posted on campus bulletin boards. Interested individu-als contacted an e-mail address for further infor-mation and to schedule an appointment. Eligible participants reported a clean driving history (e.g., no at-fault accidents or history of traffic violations).
Materials. Subjective workload ratings were collected using the NASA-TLX survey devel-oped by Hart and Staveland (1988). After com-pleting each of the conditions, participants responded to each of the six items on a 21-point Likert scale ranging from very low to very high. The questions in the NASA-TLX were as follows:
(a) How mentally demanding was the task?(b) How physically demanding was the task?(c) How hurried or rushed was the pace of the task?(d) How successful were you in accomplishing what
you were asked to do?
at TUFTS UNIV on August 8, 2016hfs.sagepub.comDownloaded from
1304 December 2015 - Human Factors
(e) How hard did you have to work to accomplish your level of performance?
(f) How insecure, discouraged, irritated, stressed, and annoyed were you?
Equipment. Cellular service was provided by Sprint. The cellular phone was manufactured by Samsung (Model M360), and the hands-free earpiece was manufactured by Jawbone (Model Era). Participants dialed a friend or family mem-ber, and the volume for both the cellular phone and the hands-free earpiece was adjusted prior to the task.
NaturalReader 10.0 software was used to simulate an interactive messaging service with speech-to-text features. Participants indicated friend names prior to beginning the study. These names were entered into a template containing generic e-mail and text messages (e.g., “Text from [name]: ‘Hey! Let’s meet for lunch some-time this week. When are you free?’”). Partici-pants were given a short list of commands (i.e., repeat, reply, forward, delete, and next message) that were used in order for the messaging pro-gram to respond. The NaturalReader program was controlled by the experimenter, who reacted to the participants’ verbal commands, mimick-ing a speech detection system with perfect fidel-ity. If a participant did not use the correct com-mand, the NaturalReader program would not continue.
Hosted on a 32-bit research laptop, Neu-roScan 4.5 software was used to collect continu-ous EEG in the experiment. The EEG was recorded using a NeuroScan32-electrode NuAmp amplifier. The EEG was filtered online with a low pass filter of 50 Hz and a high pass filter set to DC with a sample A/D rate of 250 Hz. The DRT software communicated with the NeuroScan system via a parallel port connection to create event markers associated with the con-tinuous EEG. These event markers allowed for offline stimulus-locked analysis of the EEG recordings (i.e., the DRT stimuli were used for the creating of time-locked ERPs; see details described later). The EEG was first visually inspected for artifacts, and any sections with excessive noise from movement or electronic interference were removed. Next, the influence of blinks on the EEG was corrected using ocular
artifact rejection techniques (Semlitsch, Anderer, Schuster, & Presslich, 1986), and the data were epoched 200 ms before to 1,200 ms after the onset of the green target light. These epochs were then filtered with a band pass, zero phase shift filter of 0.1 to 10 Hz. Finally, events that exceeded an artifact rejection criterion of 100 µV were rejected, and the remaining events were averaged to obtain one subject’s average wave-form for each condition in the experiment.
Procedure. Prior to their appointment time, participants were sent a general demographic survey. Upon arrival at the lab in the Behavioral Sciences building, participants read and signed the institutional review board (IRB)–approved consent document, and the research team fitted an EEG cap to each participant’s head. A refer-ence electrode was placed behind the left ear on the mastoid bone, and electrode site FP1 served as the ground. Electrooculogram electrodes were placed at the lateral canthi of both eyes (horizontal) and above and below the left eye (vertical) to track eye movements and record eye blinks for later data processing. Participants’ field of view and normal range of motion were not impeded when wearing the EEG cap.
Participants were asked to complete eight dif-ferent 10-minute conditions that were chosen to provide a range of cognitive workload. The order of these conditions were counterbalanced across participants. The participants were seated an average of 65 cm from a computer screen dis-playing a fixation cross. Participants were asked to look at the fixation cross and try to avoid making unnecessary movements during the completion of each task.
Described here in hypothesized ascending order of cognitive workload (Strayer et al., 2011; Strayer & Drews, 2007b), the single-task condi-tion was selected to provide a baseline of cogni-tive workload when performing the DRT (see details described later). In the second condition, participants were allowed to select a radio sta-tion to which they normally listen when driving. Depending on the participant’s selection, the live radio broadcast was a mix of music and talking. Before the condition began, participants selected the station and adjusted the volume to a comfortable level. Once they began the record-ing session, they were not allowed to change the
at TUFTS UNIV on August 8, 2016hfs.sagepub.comDownloaded from
Cognitive DistraCtion in the automobile 1305
station to avoid the influence of manual manipu-lations.
In the third condition, participants chose one of three audio book excerpts. They selected from excerpts of chapter 1 from The Giver (Lowry, 2002), chapter 20 from Water for Elephants (Gruen, 2006), or chapter 11 from Harry Potter and the Sorcerer’s Stone (Rowling, 1998). Once again, all manual adjustments to volume were made before the condition began. Participants were informed that at the end of the audio book, they would take a simple five-item quiz about the events in their chosen audio book excerpt. This quiz was to ensure that participants attended to the story. Across the three experiments reported, the accuracy on the quiz averaged 86%.
Conditions 4 through 6 involved different forms of conversation. In each of the conditions, the interlocutors were asked to speak and listen in equal proportions (i.e., 50% speaking and 50% listening). The fourth condition entailed conversation with the experimenter seated next to the participant. Participants wrote down a few conversation topics at the beginning of the study. Experimenters would ask the participant to start telling an interesting story from the list and then helped to maintain an engaging conversation by asking questions about the story or by respond-ing with a story of their own.
The fifth condition required the participant to call a friend or family member and talk with that person on a handheld cellular phone. The call was initiated and the volume was adjusted before the condition began. Because the microswitch for the DRT (described later) was attached to the left thumb, participants held the phone with their right hand. Most participants indicated that this was the hand they normally used to hold their handheld device. Similarly, the sixth condition was a conversation with either the same or a dif-ferent friend or family member, but it occurred via the hands-free Bluetooth earpiece. Partici-pants indicated in which ear they wished to use the hands-free earpiece.
For Condition 7, the participant interacted with a text-to-speech program, NaturalReader 10.0, which simulated speech-based e-mail and text-messaging services. Participants interacted with the program as if it were a fully automated system. Perfect speech recognition capabilities
were implemented using the “Wizard of Oz” paradigm (Kelley, 1983; Lee, Caven, Haake, & Brown, 2001) in which the participant’s speech was actually being secretly entered into the com-puter by the experimenter with perfect fidelity. Prior to beginning the condition, the participant was familiarized with the program’s basic com-mands, which were repeat, reply, forward, delete, and next message. The participant completed a simple tutorial to become familiar with how the commands function. Next is an example of an interaction using the speech-to-text system:
Participant’s command: “Next message.” Message read to participant: “Text message
from Mary: ‘When do you want to go to the grocery store?’”
Commands list read to participant: “Repeat, reply, forward, delete, next message.”
Participant’s response: “Reply: ‘Hi Mary, I can go this evening, let’s say 8 o’clock.’ Send.”
The final condition provided the highest level of cognitive workload: solving simple math problems and remembering words. The math and memory problems were read aloud by the experimenter, and the participant’s verbal answers were recorded by the experimenter. Par-ticipants completed a short example of the OSPAN task before beginning the condition.
OSPAN is a standardized task that can be used to create a challenging dual-task condition (Sanbonmatsu, Strayer, Medeiros-Ward, & Wat-son, 2013). Participants completed an auditory version of the OSPAN task developed by Wat-son and Strayer (2010) in which they attempted to recall single-syllable words in serial order while solving mathematical problems. In the auditory OSPAN task, participants were asked to remember a series of two to five words that were interspersed with math verification prob-lems (e.g., Given “[3 / 1] – 1 = 2? Cat. [2 × 2] + 1 = 4? Box. Recall,” the participant should have answered “True” and “False” to the math prob-lems when they were presented and recalled cat and box in the order in which they were pre-sented when given the recall probe). The math problems could be repeated at the participant’s request if the participant did not comprehend them.
at TUFTS UNIV on August 8, 2016hfs.sagepub.comDownloaded from
1306 December 2015 - Human Factors
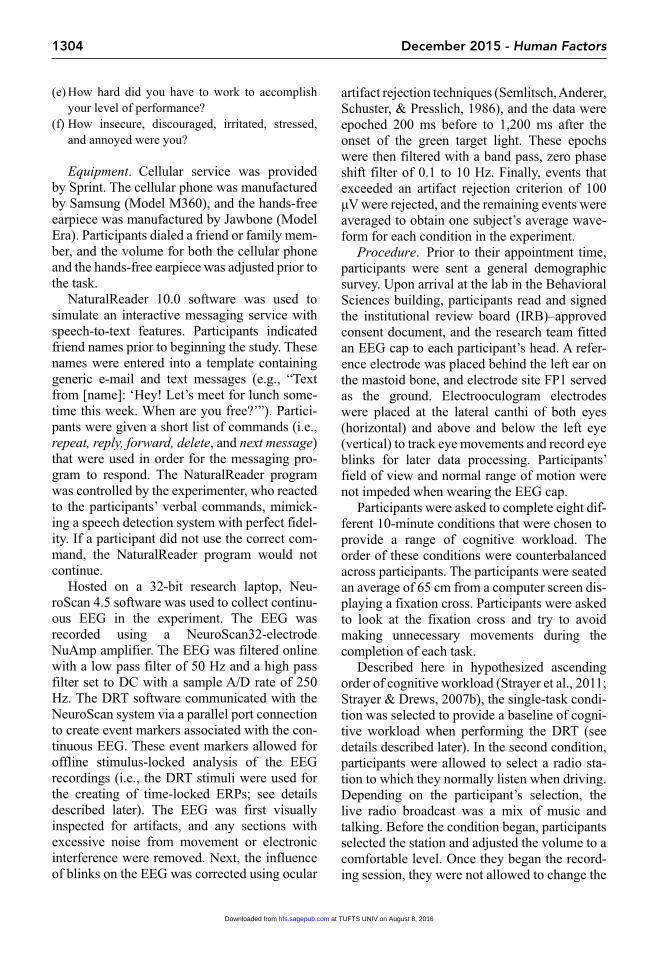
In each of these conditions, participants also performed a variant of the DRT (cf. the nascent ISO standard for measuring cognitive distrac-tion; ISO, 2012). In our version of the DRT, red and green lights were presented every 3 to 5 s via a head-mounted device. The light was posi-tioned an average 15° to the left and 7.5° above the participant’s left eye and was held in a fixed position on the head with a headband that did not interfere with the EEG data collection or with a clear field of view. Red lights were pre-sented 80% of the time, and green lights were presented 20% of the time. Both the color of the light and the interval between trials (e.g., 3–5 s) were randomized (i.e., this is a 20/80 oddball with stimuli presented in a Bernoulli sequence with an interstimulus interval of 3 to 5 s; see Donchin, 1981). Using a go/no-go design, par-ticipants were instructed to respond to the green light as quickly as they could by depressing a microswitch that was placed on the left thumb but to not respond to the red lights. The lights remained illuminated until a response was made or 1 s had elapsed. Response RT was recorded with millisecond accuracy.
resultsDRT. The DRT data reflect the manual
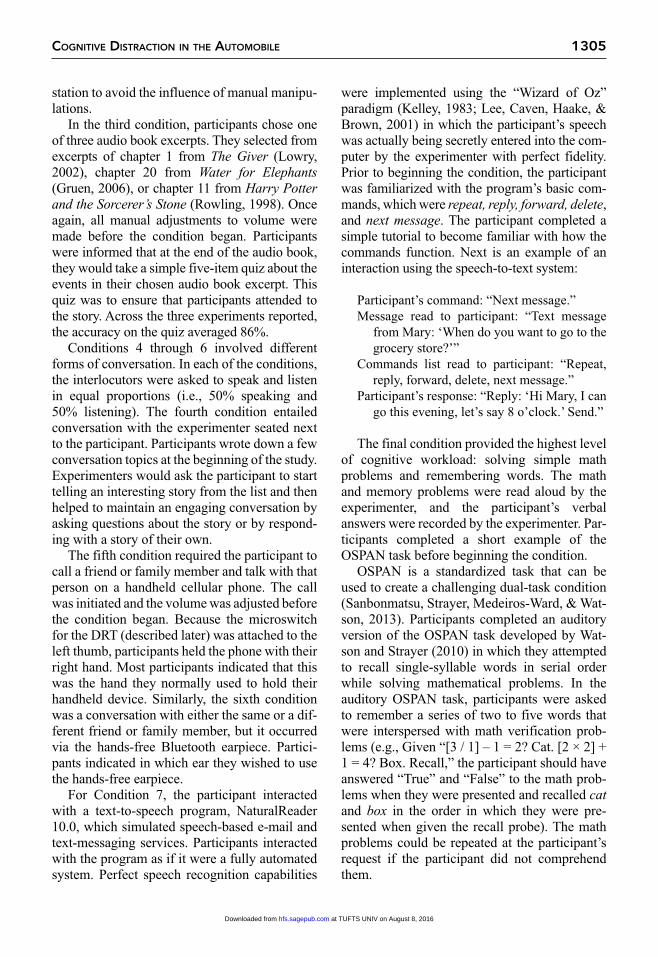
response to the red and green lights in the
peripheral detection task. The RT and accuracy data for the DRT are plotted in Figures 1 and 2, respectively. RT for correct responses (i.e., green-light responses) was measured to the nearest millisecond, and the accuracy data were converted to the nonparametric measure of sen-sitivity, A′, whereby a response to a green light was coded as a “hit,” nonresponses to a red light were coded as a “correct rejection,” nonre-sponses to a green light were coded as a “miss,” and responses to a red light were coded as a “false alarm” (Pollack & Norman, 1964). A′ ranges between 0.5 for chance performance and 1.0 for perfect accuracy (Parasuraman & Davies, 1984). A repeated-measures ANOVA revealed a main effect of condition on RT, F(7, 259) = 33.87, p < .01, partial η2 = .48, and A′, F(7, 259) = 7.62, p < .01, partial η2 = .17.
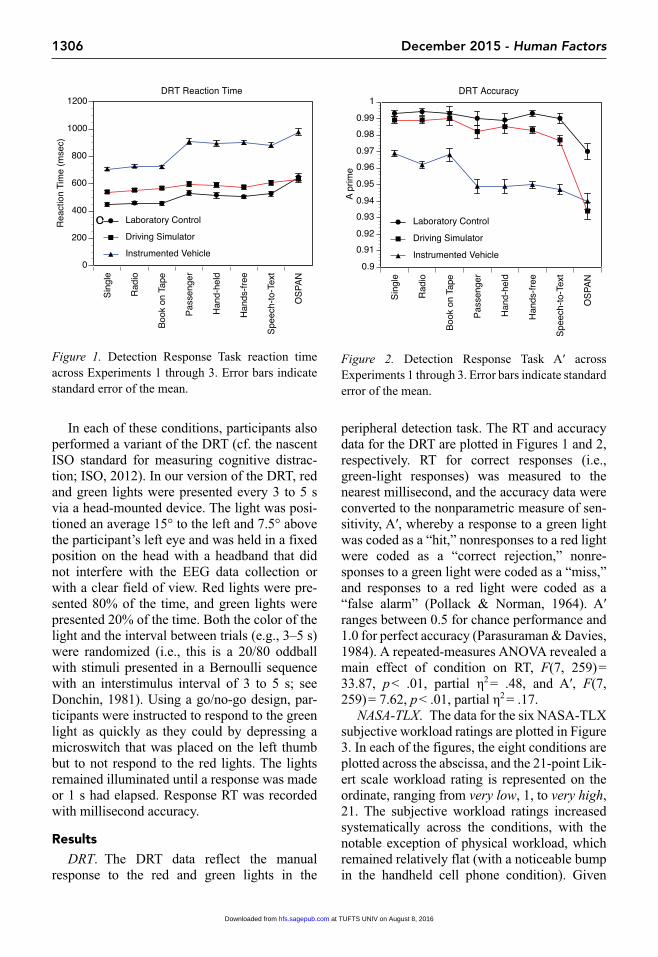
NASA-TLX. The data for the six NASA-TLX subjective workload ratings are plotted in Figure 3. In each of the figures, the eight conditions are plotted across the abscissa, and the 21-point Lik-ert scale workload rating is represented on the ordinate, ranging from very low, 1, to very high, 21. The subjective workload ratings increased systematically across the conditions, with the notable exception of physical workload, which remained relatively flat (with a noticeable bump in the handheld cell phone condition). Given
o
Figure 1. Detection Response Task reaction time across Experiments 1 through 3. Error bars indicate standard error of the mean.
Figure 2. Detection Response Task A′ across Experiments 1 through 3. Error bars indicate standard error of the mean.
at TUFTS UNIV on August 8, 2016hfs.sagepub.comDownloaded from
Cognitive DistraCtion in the automobile 1307
Figure 3. The six NASA Task Load Index subjective workload ratings across Experiments 1 through 3. Error bars indicate standard error of the mean.
at TUFTS UNIV on August 8, 2016hfs.sagepub.comDownloaded from
1308 December 2015 - Human Factors
that the conditions were selected to allow the driver to keep their eyes on the road and their hands on wheel, the physical workload ratings are consistent with what we would expect.
A series of repeated-measures ANOVAs revealed that NASA-TLX ratings increased for mental workload, F(7, 259) = 83.12, p < .01, par-tial η2 = .69; physical workload, F(7, 259) = 3.33, p < .01, partial η2 = .08; temporal demand, F(7, 259) = 28.74, p < .01, partial η2 = .44; per-formance, F(7, 259) = 14.92, p < .01, partial η2 = .29; effort, F(7, 259) = 64.87, p < .01, partial η2 = .64; and frustration, F(7, 259) = 33.79, p < .01, partial η2 = .48.
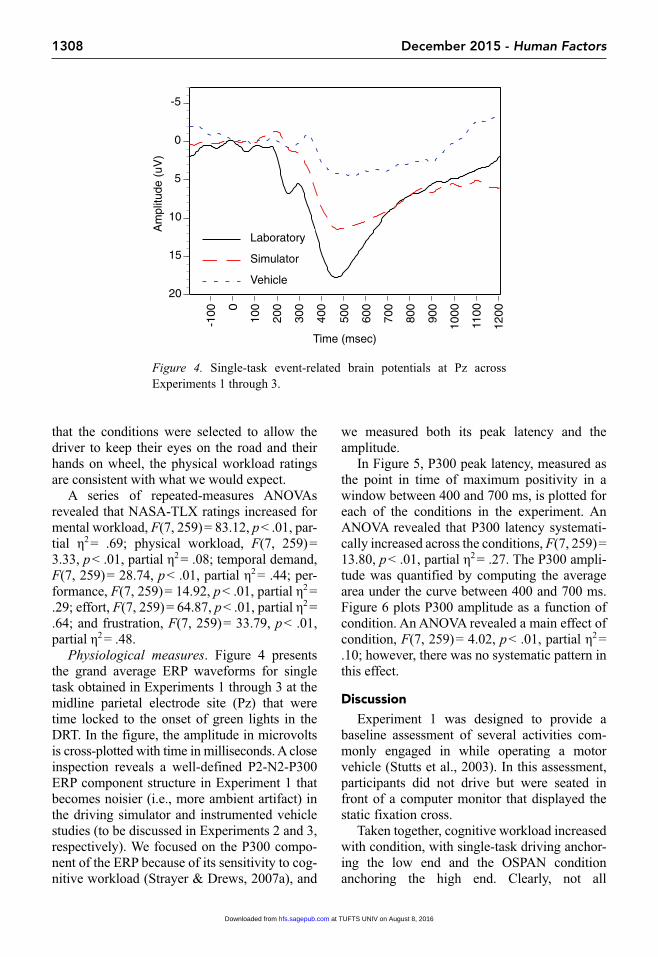
Physiological measures. Figure 4 presents the grand average ERP waveforms for single task obtained in Experiments 1 through 3 at the midline parietal electrode site (Pz) that were time locked to the onset of green lights in the DRT. In the figure, the amplitude in microvolts is cross-plotted with time in milliseconds. A close inspection reveals a well-defined P2-N2-P300 ERP component structure in Experiment 1 that becomes noisier (i.e., more ambient artifact) in the driving simulator and instrumented vehicle studies (to be discussed in Experiments 2 and 3, respectively). We focused on the P300 compo-nent of the ERP because of its sensitivity to cog-nitive workload (Strayer & Drews, 2007a), and
we measured both its peak latency and the amplitude.
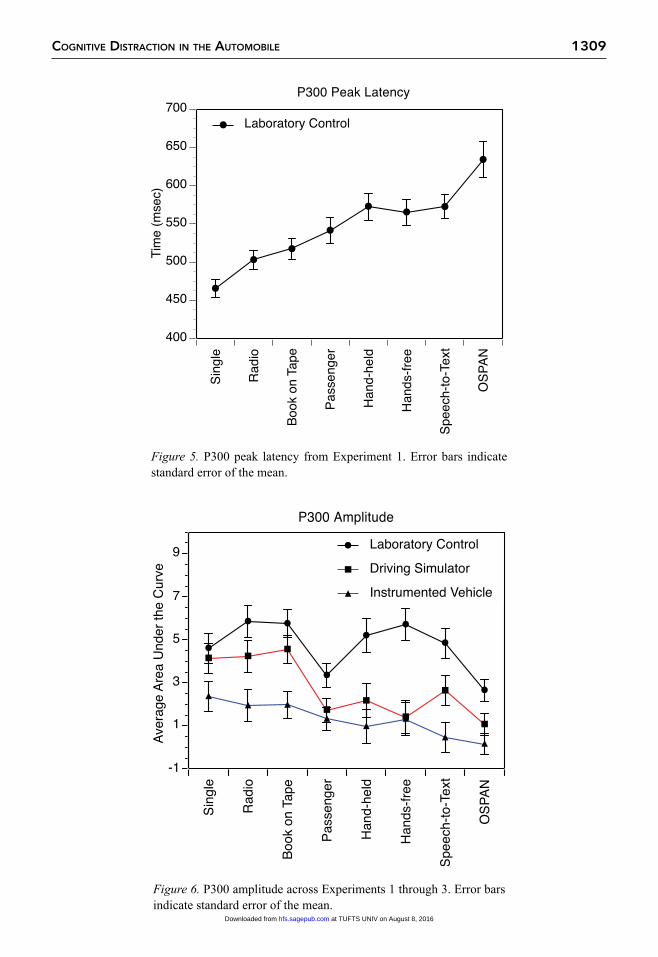
In Figure 5, P300 peak latency, measured as the point in time of maximum positivity in a window between 400 and 700 ms, is plotted for each of the conditions in the experiment. An ANOVA revealed that P300 latency systemati-cally increased across the conditions, F(7, 259) = 13.80, p < .01, partial η2 = .27. The P300 ampli-tude was quantified by computing the average area under the curve between 400 and 700 ms. Figure 6 plots P300 amplitude as a function of condition. An ANOVA revealed a main effect of condition, F(7, 259) = 4.02, p < .01, partial η2 = .10; however, there was no systematic pattern in this effect.
discussionExperiment 1 was designed to provide a
baseline assessment of several activities com-monly engaged in while operating a motor vehicle (Stutts et al., 2003). In this assessment, participants did not drive but were seated in front of a computer monitor that displayed the static fixation cross.
Taken together, cognitive workload increased with condition, with single-task driving anchor-ing the low end and the OSPAN condition anchoring the high end. Clearly, not all
-100 0
100
200
300
400
500
600
700
800
900
1000
1100
1200
20
15
10
5
0
-5
Am
plitu
de (
uV)
Time (msec)
Laboratory
Simulator
Vehicle
Figure 4. Single-task event-related brain potentials at Pz across Experiments 1 through 3.
at TUFTS UNIV on August 8, 2016hfs.sagepub.comDownloaded from
Cognitive DistraCtion in the automobile 1309
Figure 5. P300 peak latency from Experiment 1. Error bars indicate standard error of the mean.
Figure 6. P300 amplitude across Experiments 1 through 3. Error bars indicate standard error of the mean.
at TUFTS UNIV on August 8, 2016hfs.sagepub.comDownloaded from
1310 December 2015 - Human Factors
in-vehicle activities have the same level of cog-nitive workload. Indeed, some of the older in-vehicle activities, such as listening to the radio, were associated with negligible increases in cognitive workload. By contrast, some of the newer technologies, such as speech-to-text inter-actions with e-mail, were associated with some of the highest levels of workload. It is notewor-thy that the in-vehicle activities that were evalu-ated were “pure” measures of cognitive work-load in that these tasks do not require the partici-pant to divert his or her eyes from the road or hands from the steering wheel.
The results from the different measures obtained in Experiment 1 had a good correspon-dence and together help to lay the foundation for a metric of cognitive workload that increases across the conditions. As the cognitive workload associated with performing an activity increases, the cognitive distraction associated with per-forming that activity while operating a motor vehicle increases. Given the capacity limits of attention (Kahneman, 1973), performing an in-vehicle task that is associated with significant cognitive workload leaves less attention to be allocated to the task of driving. That is, cogni-tive distraction is the consequence of perform-ing an attention-demanding concurrent activity while driving (i.e., driving performance in Experiments 2 and 3 should be adversely affected by in-vehicle cognitive workload).
ExpErImEnt 2The goal of Experiment 2 was to extend
the findings from Experiment 1 to operating a high-fidelity driving simulator. Given the increase in cognitive workload associated with performing the different in-vehicle activities, we expected that measures of driving perfor-mance would be adversely affected with their concurrent performance. The driving simulator used a car-following paradigm on a multilane highway with moderate traffic. Participants fol-lowed a lead vehicle that braked aperiodically throughout the scenario, and in addition to the measures collected in Experiment 1, we also collected brake RT and following distance, as these variables associated with the primary task of driving have been shown to be sensitive to
cognitive distraction (Caird et al., 2008; Horrey & Wickens, 2006).
methodParticipants. Thirty-two participants (22
men and 10 women) from the University of Utah participated in the experiment. Participants ranged in age from 19 to 36, with an average age of 23.5 years. All participants met the same eli-gibility requirements and were recruited in the same manner as described in Experiment 1.
Equipment. In addition to the equipment used in Experiment 1, the present study used a fixed-base high-fidelity driving simulator (Mfr. L-3 Communications) with high-resolution dis-plays providing a 180° field of view. The dash-board instrumentation, steering wheel, gas, and brake pedals are from a Ford Crown Victoria sedan with an automatic transmission. The sim-ulator incorporated vehicle dynamics, traffic scenario, and road surface software to provide realistic scenes and traffic conditions. In the driving simulator, the DRT was implemented by mounting the red/green light on the vehicle dashboard directly in front of the participant. All other equipment was identical to Experiment 1.
Procedure. The procedures used in Experi-ment 1 were also used in Experiment 2, with the following modifications. In Experiment 2, we used a car-following paradigm in which partici-pants drove on a simulated multilane freeway with moderate traffic (approximately 1,500 vehicles per lane per hour). Each condition lasted approximately 10 min, and the posted speed on the freeway was 65 mph. Participants followed a pace car that would apply its brakes aperiodically (there were total of 20 unpredict-able braking events in each condition). Partici-pants were not allowed to change lanes to pass the pace car and were asked to maintain a 2-s following distance behind the pace car. Partici-pants were given a 3-min practice session to familiarize themselves with the driving simula-tor, scenario design, and prescribed following distance.
resultsDriving performance measures. We exam-
ined two measures of driving performance in
at TUFTS UNIV on August 8, 2016hfs.sagepub.comDownloaded from
Cognitive DistraCtion in the automobile 1311
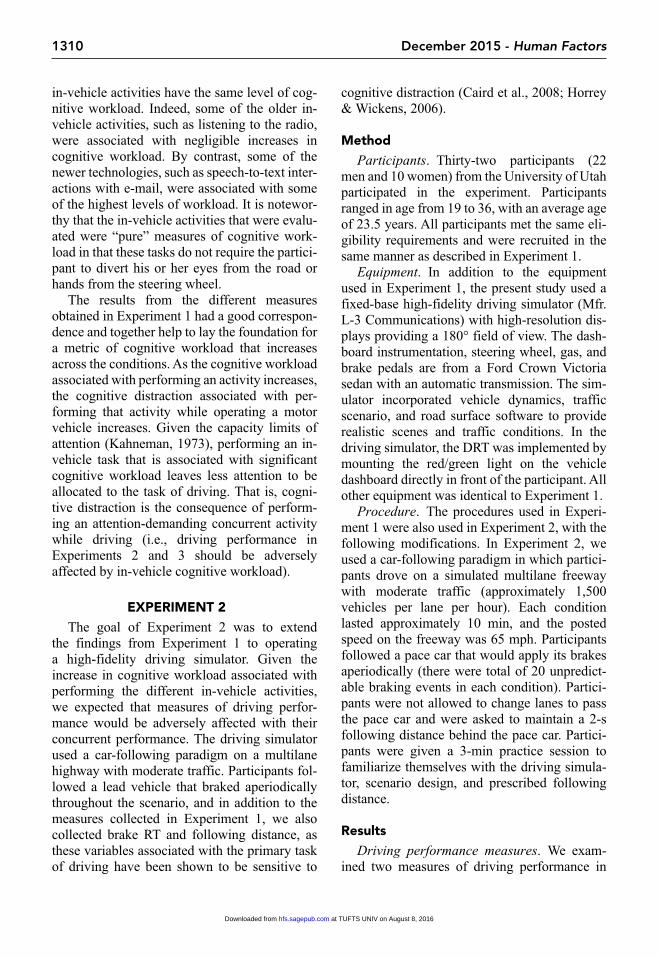
Experiment 2 that prior research has established are sensitive to cognitive distraction (Caird et al., 2008; Horrey & Wickens, 2006). Figure 7 presents the brake RT measured as the time interval between the onset of the pace car’s brake lights and the onset of the participant’s braking response (i.e., a 1% depression of the brake pedal).
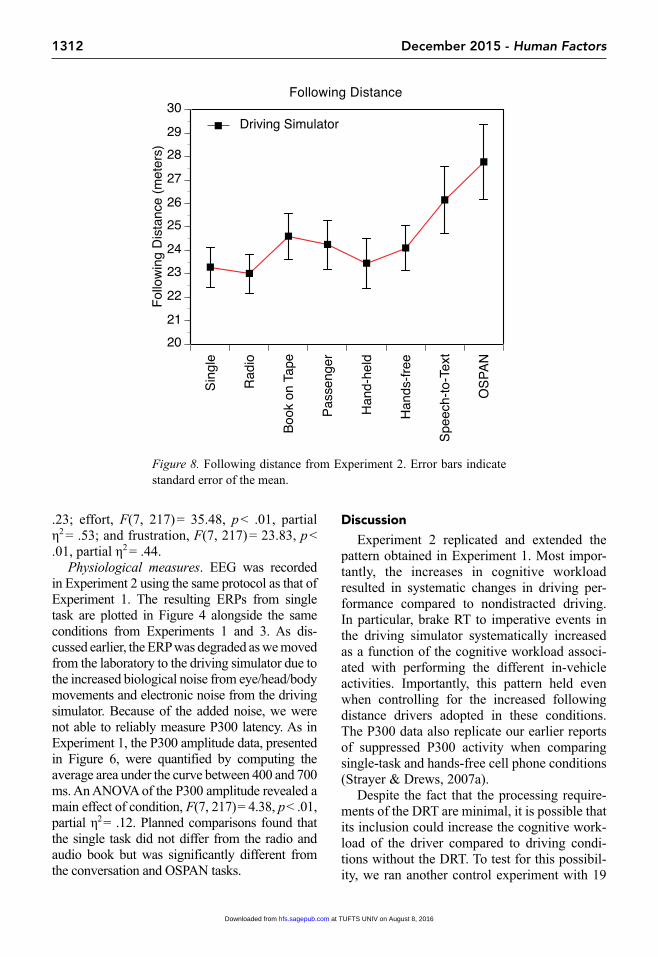
Figure 8 presents the following distance, measured as the distance between the rear bum-per of the pace car and the front bumper of the participant’s car at the moment of brake onset. A repeated-measures ANOVA revealed that both RT, F(7, 217) = 10.11, p < .01, partial η2 = .25, and following distance, F(7, 217) = 6.26, p < .05, partial η2 = .17, increased across condition. A subsidiary linear mixed-model analysis that held following distance constant showed that brake RT increased as a function of condition over and above any compensatory effects associated with following distance, F(7, 3972) = 12.77, p < .01. These data establish that in-vehicle activities that differ in their attentional requirements have differential effects on driving. Moreover, the
difference between conditions is even larger at the tail of the RT distribution (e.g., the speech-to-text/single-task RT ratio was 9% at the median, whereas this difference was 36% at the 90th percentile of the RT distribution; see also Ratcliff & Strayer, 2014).
DRT. The RT and accuracy data for the DRT are plotted in Figures 1 and 2, respectively. A repeated-measures ANOVA revealed that RT increased across condition, F(7, 217) = 13.51, p < .01, partial η2 = .30, and that A′ decreased across condition, F(7, 217) = 21.54, p < .01, par-tial η2 = .41.
NASA-TLX. The data for the six NASA-TLX subjective workload ratings are plotted in Figure 3. The subjective workload ratings increased systematically across the conditions. A series of repeated-measures ANOVAs revealed that NASA-TLX ratings increased for mental workload, F(7, 217) = 43.55, p < .01, partial η2 = .58; physical workload, F(7, 217) = 5.03, p < .01, partial η2 = .14; temporal demand, F(7, 217) = 26.92, p < .01, partial η2 = .47; per-formance, F(7, 217) = 9.27, p < .01, partial η2 =
Figure 7. Brake reaction time from Experiment 2. Error bars indicate standard error of the mean.
at TUFTS UNIV on August 8, 2016hfs.sagepub.comDownloaded from
1312 December 2015 - Human Factors
.23; effort, F(7, 217) = 35.48, p < .01, partial η2 = .53; and frustration, F(7, 217) = 23.83, p < .01, partial η2 = .44.
Physiological measures. EEG was recorded in Experiment 2 using the same protocol as that of Experiment 1. The resulting ERPs from single task are plotted in Figure 4 alongside the same conditions from Experiments 1 and 3. As dis-cussed earlier, the ERP was degraded as we moved from the laboratory to the driving simulator due to the increased biological noise from eye/head/body movements and electronic noise from the driving simulator. Because of the added noise, we were not able to reliably measure P300 latency. As in Experiment 1, the P300 amplitude data, presented in Figure 6, were quantified by computing the average area under the curve between 400 and 700 ms. An ANOVA of the P300 amplitude revealed a main effect of condition, F(7, 217) = 4.38, p < .01, partial η2 = .12. Planned comparisons found that the single task did not differ from the radio and audio book but was significantly different from the conversation and OSPAN tasks.
discussionExperiment 2 replicated and extended the
pattern obtained in Experiment 1. Most impor-tantly, the increases in cognitive workload resulted in systematic changes in driving per-formance compared to nondistracted driving. In particular, brake RT to imperative events in the driving simulator systematically increased as a function of the cognitive workload associ-ated with performing the different in-vehicle activities. Importantly, this pattern held even when controlling for the increased following distance drivers adopted in these conditions. The P300 data also replicate our earlier reports of suppressed P300 activity when comparing single-task and hands-free cell phone conditions (Strayer & Drews, 2007a).
Despite the fact that the processing require-ments of the DRT are minimal, it is possible that its inclusion could increase the cognitive work-load of the driver compared to driving condi-tions without the DRT. To test for this possibil-ity, we ran another control experiment with 19
Figure 8. Following distance from Experiment 2. Error bars indicate standard error of the mean.
at TUFTS UNIV on August 8, 2016hfs.sagepub.comDownloaded from
Cognitive DistraCtion in the automobile 1313
participants using the same protocol as Experi-ment 2 but without the DRT. We focused on the subjective workload ratings from the NASA-TLX because these measures were common to both experiments. A 2 (DRT task load: with vs. without the DRT) × 8 (condition) between-sub-jects MANOVA was performed to test for differ-ences in subjective workload associated with the imposition of the DRT. The MANOVA revealed a significant main effect of condition, F(35, 15) = 8.67, p < .01, partial η2 = .95; however, nei-ther the main effect of DRT task load nor the DRT Task Load × Condition interaction were significant (all ps > .25). This finding establishes that the imposition of the DRT did not increase the cognitive workload of the drive (as measured using the NASA-TLX).
It is worth considering the pattern of data had participants protected the driving task at the expense of the other in-vehicle activities. In such a case, we would expect that the primary task measures would be insensitive to secondary-task workload (i.e., Figures 7, 8, and 9, to be discussed later), would be flat, and that there would be no main effect of condition for these measures. Instead, we show that the mental resources avail-able for driving are inversely related to the cogni-tive workload of the concurrent secondary task.
ExpErImEnt 3The purpose of Experiment 3 was to establish
that the patterns obtained in the laboratory and driving simulator generalize to the operation of an instrumented vehicle on the residential roadways. Doing so is important because the consequences of impaired driving in the city are different from that of a driving simulator (e.g., a crash in the real world can have life-or-death consequences, whereas this is not the case in the driving simulator). Participants drove an instrumented vehicle in a residential section of a city while concurrently performing the eight conditions used in Experiments 1 and 2. If the findings generalize, then there should be corre-spondence between the results of Experiment 3 and those of Experiments 1 and 2.
methodParticipants. Thirty-two participants (12
men and 20 women) from the University of Utah
participated in the experiment. Participants ranged in age from 18 to 33, with an average age of 23.5 years. Participants’ years of driving experience ranged from 2 to 17, with an average of 7.1 years. All participants met the same eligi-bility requirements and were recruited in the same manner as described in Experiment 1. The Division of Risk Management Department at the University of Utah ran a motor vehicles record (MVR) report on each prospective participant to ensure participation eligibility based on a clean driving history (e.g., no at-fault accidents, sus-pended licensures, or history of traffic viola-tions). In addition, following university policy, each prospective participant was required to complete a university-devised 20-minute online defensive driving course and pass the certifica-tion test.
Equipment. In addition to the equipment used in Experiment 1, Experiment 3 used an instrumented 2010 Subaru Outback. The vehicle was augmented with four 1,080-pixel LifeCam USB cameras that captured the driving environ-ment and participants’ facial features. All other equipment was identical to Experiment 1.
Procedure. The procedures used in Experi-ment 1 were also used in Experiment 3, with the following modifications. Prior to their appoint-ment time, participants were sent the IRB-approved informed consent document, general demographic survey, and instructions for com-pleting the 20-min online defensive driving course and the certification test. Prior to the experimental session, we obtained an MVR report on the driver to ensure a clean driving record.
Before beginning the study, the driver was familiarized with the controls of the instrumented vehicle, adjusted the mirrors and seat, and was informed of the tasks to be completed while driv-ing. The participant drove around a parking lot in order to become familiar with the handling of the vehicle. Next, participants drove one circuit on a 2.75-mile loop in the Avenues section of Salt Lake City, Utah, in order to become familiar with the route itself. The route provided a suburban driving environment and contains nine all-way controlled stop signs, one two-way stop sign, and two stoplights. A research assistant and an exper-imenter accompanied the participant in the
at TUFTS UNIV on August 8, 2016hfs.sagepub.comDownloaded from
1314 December 2015 - Human Factors
vehicle at all times. The research assistant sat in the rear, and the experimenter sat in the front pas-senger seat and had ready access to a redundant braking system and notified the driver of any potential roadway hazards.
The driver’s task was to follow the route defined previously while complying with all local traffic rules, including a 25-mph speed restriction. If drivers began to exceed 25 mph, they were reminded of this restriction by the research team. Throughout each condition, the driver completed the DRT. Each condition lasted approximately 10 min, which was the average time required to make one loop around the track.
resultsDriving performance. Because participants
did not follow a lead vehicle as they did in Experiment 2, following distance or brake response data were not available for analysis. However, because high-definition cameras were used to record the driving environment, manual coding of eye movement data was possible. Prior to analyzing the eye movement data, 24
critical locations were identified for analysis. These locations included all four-way and two-way stops as well as pedestrian crosswalks. At each of these critical locations, eye movement data were coded frame by frame to record glances to the left and to the right of the forward roadway. A measure of glance probability reflects the proportion of complete scans (out of the 24 critical locations) in each of the condi-tions. Scans were recorded as complete if driv-ers looked to both the left and right. Partially complete scans were recorded where the drivers looked to either the left or right, and incomplete scans were recorded when drivers failed to scan for hazards. Each drive was analyzed by at least two trained coders, and any discrepancies in the coding were flagged and reviewed for consis-tency by a third coder. In general, coders were very accurate and only a small number of events needed to be double-checked.
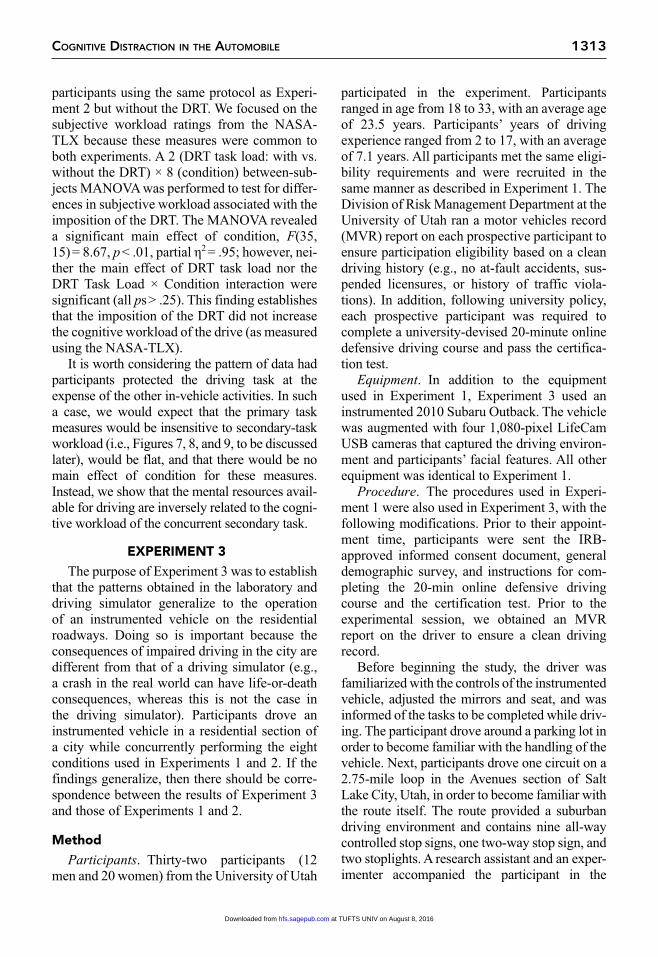
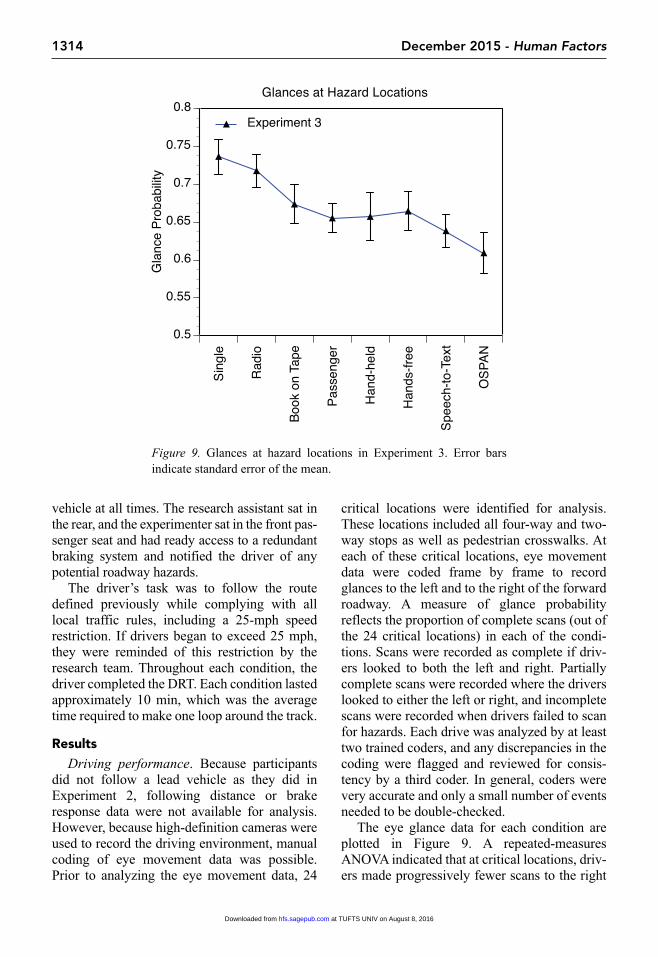
The eye glance data for each condition are plotted in Figure 9. A repeated-measures ANOVA indicated that at critical locations, driv-ers made progressively fewer scans to the right
Figure 9. Glances at hazard locations in Experiment 3. Error bars indicate standard error of the mean.
at TUFTS UNIV on August 8, 2016hfs.sagepub.comDownloaded from
Cognitive DistraCtion in the automobile 1315
and left of the forward roadway as cognitive workload increased, F(7, 168) = 5.92, p < .01, partial η2 = .20. These data replicate and extend the important work of Taylor et al. (2013) by establishing that the same failures to scan for roadway hazards observed in a driving simulator are found in an instrumented vehicle. Moreover, these results establish that that there is a system-atic decrease in scanning for hazards as cogni-tive workload increases.
DRT. The RT and accuracy data for the DRT are plotted in Figures 1 and 2, respectively. A repeated-measures ANOVA revealed that RT increased across condition, F(7, 217) = 27.21, p < .01, partial η2 = .47, and that A′ decreased across condition, F(7, 217) = 19.17, p < .01, par-tial η2 = .38.
NASA-TLX. The data for the six NASA-TLX subjective workload ratings are plotted in Figure 3. The subjective workload ratings increased sys-tematically with condition. A series of repeated-measures ANOVAs showed that NASA-TLX ratings increased for mental workload, F(7, 217) = 52.46, p < .01, partial η2 = .63; physical workload, F(7, 217) = 10.01, p < .01, partial η2 = .24; temporal demand, F(7, 217) = 37.81, p < .01, partial η2 = .55; performance, F(7, 217) = 19.66, p < .01, partial η2 = .39; effort, F(7, 217) = 47.99, p < .01, partial η2 = .61; and frustration, F(7, 217) = 26.06, p < .01, partial η2 = .40.
Physiological measures. EEG was recorded in Experiment 3 using the same protocol as that of the prior studies. The resulting ERPs from single task are plotted in Figure 4 alongside the same conditions from Experiments 1 and 2. The P300 component of the ERP was considerably degraded by the added noise of the instrumented vehicle, the added head and eye movements of the driver as he or she scanned the driving envi-ronment, and the increased cognitive load of the driving task (i.e., driving complexity increased from the laboratory to the driving simulator to the instrumented vehicle). Moreover, the P300 became even less distinct at higher workloads (e.g., while concurrently performing the OSPAN task). As in Experiment 2, we were not able to reliably measure P300 latency. P300 amplitude, plotted in Figure 6, was quantified by computing the average area under the curve between 400 and 700 ms. An ANOVA failed to show a main
effect of condition, but planned comparisons found that the single-task condition significantly differed from speech-to-text and OSPAN condi-tions (p < .05).
discussionExperiment 3 replicated and extended the
findings from the prior experiments in sev-eral important ways. Most importantly, they document that the patterns observed in the con-trolled laboratory setting of Experiment 1 and in the driving simulator setting of Experiment 2 generalize to what was observed in the instru-mented vehicle. There was a systematic increase in cognitive workload across condition, and importantly, driving performance as measured by scanning for potential hazards decreased as a function of in-vehicle secondary task. This latter finding replicates prior studies (Harbluk & Noy, 2002; Harbluk, Noy, Trbovich, & Eizenman, 2007; McCarley et al., 2004; Recarte & Nunes, 2000, 2003; Reimer, 2009; Reimer, Mehler, Wang, & Coughlin, 2012; Sodhi, Reimer, & Llamazares, 2002) that have shown that visual scanning behavior is impaired with increases in cognitive workload. As such, it suggests that the diversion of attention from the task of driving results in a degraded representation of the driving environment (i.e., impaired situa-tion awareness of the driving context; Fisher & Strayer, 2014; Gugerty, 1997; Kass, Cole, & Stanny, 2007). The data provide clear evidence that scanning the driving environment for poten-tial hazards is an active process that is disrupted by the diversion of attention to subsidiary in-vehicle activities.
GEnEral dIscussIonThe patterns observed in the three experi-
ments reported are remarkably consistent, estab-lishing that lessons learned in the laboratory and driving simulator are in good agreement with studies of cognitive distraction on the road-way. In each case, they document a systematic increase in cognitive workload as participants performed different in-vehicle activities. The data for the three studies were entered into a MANOVA to determine how cognitive work-load changed across condition for the three
at TUFTS UNIV on August 8, 2016hfs.sagepub.comDownloaded from
1316 December 2015 - Human Factors
experiments. For the sake of clarity, we focused our analyses based upon secondary, subjec-tive, and physiological assessments because these measures were identical across the three experiments.
By using a head-mounted version of the DRT, the impact of head and eye movements on detec-tion was negated. As drivers move their head, the DRT device moved with them and remained in a constant location relative to the eyes. The resulting RT and accuracy data provide a much more finely calibrated metric than the more tra-ditional measures of brake RT and following distance (which often covary, making unambig-uous interpretation difficult). A MANOVA per-formed on the secondary-task DRT data revealed a significant effect of condition, F(14, 86) = 19.58, p < .01, partial η2 = .76, and experiment, F(4, 198) = 26.84, p < .01, partial η2 = .35, and a Condition × Experiment interaction, F(28, 174) = 45.01, p < .01, partial η2 = .45. Further univariate analysis showed a main effect of con-dition such that RT increased, F(7, 693) = 65.02, p < .01, partial η2 = .40, and A′ decreased, F(7, 693) = 26.71, p < .01, partial η2 = .42, across condition. In addition, RT increased, F(2, 99) = 85.14 p < .01, partial η2 = .63, and A′ decreased, F(2, 99) = 35.78, p < .01, partial η2 = .42, from Experiment 1 to Experiment 3. On the whole, there is good agreement with the DRT measures across experiments; however, the laboratory- and simulator-based studies would appear to provide a more conservative estimate of the impairments to driving associated with in- vehicle technology use.
A MANOVA performed on the subjective workload ratings revealed a significant effect of condition, F(42, 58) = 26.48, p < .01, partial η2 = .95, and of experiment, F(12, 190) = 2.86, p < .01, partial η2 = .15; however, the Condition × Experiment interaction was not significant. Across experiments, main effects of condition were obtained for mental workload, F(7, 693) = 170.79, p < .01, partial η2 = .63; physical work-load, F(7, 693) = 16.08, p < .01, partial η2 = .14; temporal demand, F(7, 693) = 90.04, p < .01, partial η2 = .48; performance, F(7, 693) = 44.99, p < .01, partial η2 = .31; effort, F(7, 693) = 140.92, p < .01, partial η2 = .59; and frustration, F(7, 693) = 81.16, p < .01, partial η2 = .45. The
NASA-TLX measures also increased from Experiment 1 to Experiment 3 for mental work-load, F(2, 99) = 5.50, p < .01, partial η2 = .10; physical workload, F(2, 99) = 8.34, p < .01, par-tial η2 = .14; temporal demand, F(2, 99) = 8.38, p < .01, partial η2 = .14; effort, F(2, 99) = 5.04, p < .01, partial η2 = .09; and frustration, F(2, 99) = 7.98, p < .01, partial η2 = .13, but not for perfor-mance (p > .14). On the whole, the subjective workload measures were in agreement across six subscales, eight conditions, and three experi-ments. In particular, there was a consistent increase in subjective workload ratings from Condition 1 to Condition 8 and also a systematic increase in subjective workload ratings from Experiment 1 to Experiment 3.
A MANOVA performed on P300 amplitude revealed a main effect of condition, F(7, 93) = 6.67, p < .01, partial η2 = .33; experiment, F(2, 99) = 13.3, p < .01, partial η2 = .21; and a Condi-tion × Experiment interaction, F(14, 88) = 1.88, p < .05, partial η2 = .12. Overall, P300 amplitude was similar in magnitude for single task, radio, and audio book; smaller in magnitude for the conversation conditions (i.e., Conditions 4 through 7); and smallest for the OSPAN task. P300 amplitude was largest in Experiment 1, intermediate in magnitude for Experiment 2, and smallest in Experiment 3, and this result undoubtedly reflects the degraded quality of the ERP signal as the experiments progressed from the laboratory to the driving simulator to the instrumented vehicle. In fact, the P300 ampli-tude was the noisiest of all the measures we recorded, with contamination from movements of the mouth, jaw, eyes, head, and body accom-panied with environmental noise from the simu-lator and instrumented vehicle. Consequently, the P300 measures were the least sensitive of our measures to changes in cognitive workload, and this limitation was most apparent in the instrumented vehicle.
In the main, moving from the laboratory to the driving simulator to the instrumented vehicle increased the intercept of the cognitive work-load curves, and similar condition effects were obtained for the different dependent measures. This experimental cross-validation is important in its own right, establishing that the effects obtained in the simulator generalize to on-road
at TUFTS UNIV on August 8, 2016hfs.sagepub.comDownloaded from
Cognitive DistraCtion in the automobile 1317
driving. In fact, our measures in Experiment 1 were remarkably consistent with those obtained in Experiment 3, suggesting that there are occa-sions when the added complexity, expense, and risk of on-road study may be unnecessary. More-over, the similarity of the primary, secondary, subjective, and physiological measures provides convergence in our workload assessments. However, these different measures were differ-entially sensitive to the manipulation of cogni-tive load. For example, in the MANOVAs reported earlier that correct for any collinearities in the subscales within each measure, the partial η2 values for the main effect of condition were greater for the NASA-TLX (partial η2 = .95) than for the DRT (partial η2 = .76) and the physi-ological measures (partial η2 = .33).
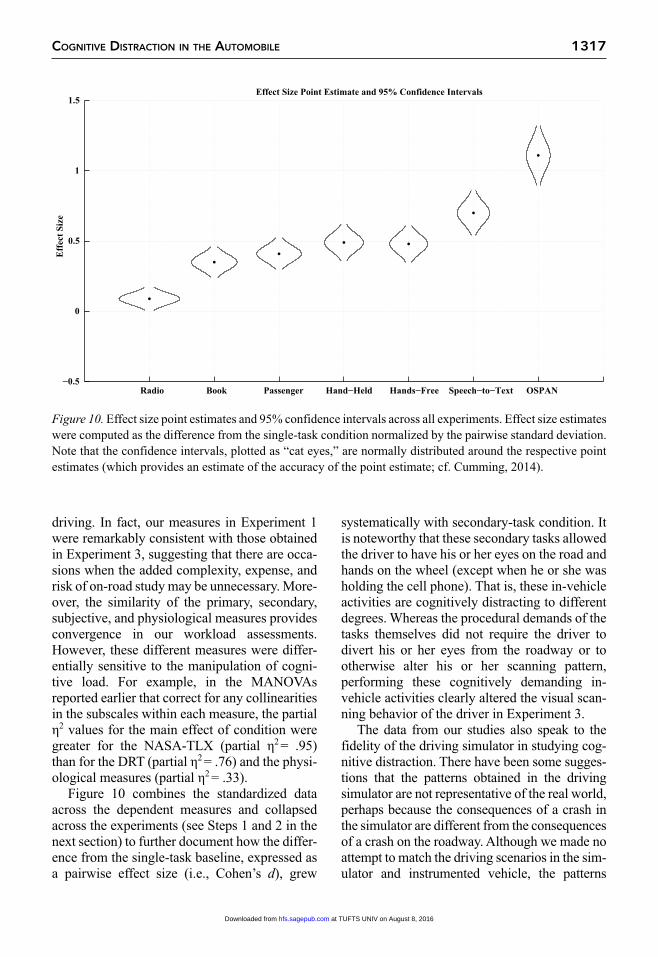
Figure 10 combines the standardized data across the dependent measures and collapsed across the experiments (see Steps 1 and 2 in the next section) to further document how the differ-ence from the single-task baseline, expressed as a pairwise effect size (i.e., Cohen’s d), grew
systematically with secondary-task condition. It is noteworthy that these secondary tasks allowed the driver to have his or her eyes on the road and hands on the wheel (except when he or she was holding the cell phone). That is, these in-vehicle activities are cognitively distracting to different degrees. Whereas the procedural demands of the tasks themselves did not require the driver to divert his or her eyes from the roadway or to otherwise alter his or her scanning pattern, performing these cognitively demanding in-vehicle activities clearly altered the visual scan-ning behavior of the driver in Experiment 3.
The data from our studies also speak to the fidelity of the driving simulator in studying cog-nitive distraction. There have been some sugges-tions that the patterns obtained in the driving simulator are not representative of the real world, perhaps because the consequences of a crash in the simulator are different from the consequences of a crash on the roadway. Although we made no attempt to match the driving scenarios in the sim-ulator and instrumented vehicle, the patterns
Radio Book Passenger Hand−Held Hands−Free Speech−to−Text OSPAN−0.5
0
0.5
1
1.5Effect Size Point Estimate and 95% Confidence Intervals
Eff
ect
Siz
e
Figure 10. Effect size point estimates and 95% confidence intervals across all experiments. Effect size estimates were computed as the difference from the single-task condition normalized by the pairwise standard deviation. Note that the confidence intervals, plotted as “cat eyes,” are normally distributed around the respective point estimates (which provides an estimate of the accuracy of the point estimate; cf. Cumming, 2014).
at TUFTS UNIV on August 8, 2016hfs.sagepub.comDownloaded from
1318 December 2015 - Human Factors
obtained in Experiments 2 and 3 were remark-ably similar. If anything, the data obtained in the simulator may underestimate the impairments associated with using different in-vehicle activi-ties on the road. It is noteworthy that Experiment 1 provided a low-cost alternative to the driving simulator and instrumented vehicle, and the data provided in this study were very predictive of driving performance on the roadway (Lee, 2004).
toward a standardIzEd scalE of coGnItIvE dIstractIon
The primary goal of the current research was to develop a metric of cognitive distraction asso-ciated with performing different activities while operating a motor vehicle. Because the differ-ent dependent measures are on different scales (e.g., milliseconds, meters, amplitude), each was transformed to a standardized score. This involved Z-transforming each of the dependent measures to have a mean of 0 and a standard deviation of 1 (across the experiments and con-ditions), and the average for each condition was then obtained. The standardized scores for each condition were then summed across the differ-ent dependent measures to provide an aggregate measure of cognitive distraction. Finally, the aggregated standardized scores were linearly scaled such that the nondistracted single-task driving condition anchored the low end (Cat-egory 1) and the OSPAN task anchored the high end (Category 5) of the cognitive distraction scale. For each of the other tasks, the relative position compared to the low and high anchors provided an index of the cognitive workload for that activity when concurrently performed while operating a motor vehicle. The four-step protocol for developing the cognitive distraction scale is listed next.
Step 1: For each dependent measure, the stan-dardized scores across experiments, condi-tions, and subjects were computed using Zi = (xi – X) / SD, where X refers to the over-all mean and SD refers to the pooled stan-dard deviation.
Step 2: For each dependent measure, the stan-dardized condition averages were com-puted by collapsing across experiments
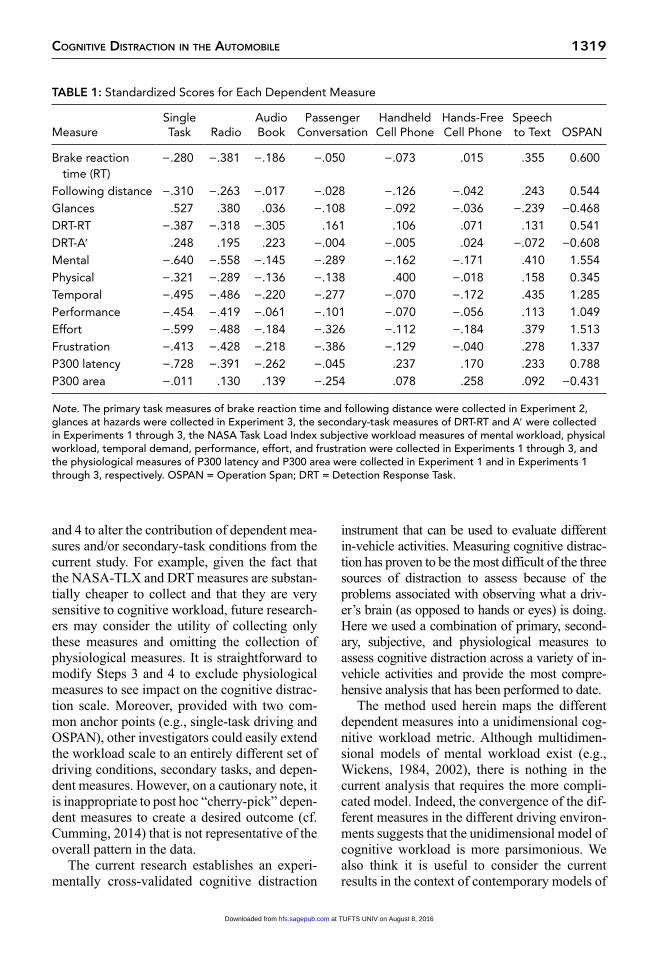
and subjects. Table 1 lists the 13 dependent measures that were used in the standardized condition averages separated in gray by the metric of which they belong.
Step 3: The standardized condition averages across dependent measures were computed with an equal weighting for physical, sec-ondary, subjective, and physiological met-rics. The measures within each metric were also equally weighted. For example, the secondary-task workload metric was com-posed of an equal weighting of the measures DRT-RT and DRT-A′ so that the two each contributed one eighth to the overall work-load scale (i.e., 25% of the workload scale is made up of secondary-task measures, each of which is equally weighted). Simi-larly, the six subjective workload measures were equally weighted so that each of the measures contributed one 24th to the overall workload scale. Note that eye glances, A′, and P300 amplitude were inversely coded in the summed condition averages.
Step 4: The standardized mean differences were range-corrected so that the nondis-tracted single-task condition had a rating of 1.0 and the OSPAN task had a rating of 5.0.
X Xi i= −[ ) −( ){ } +min max min 4 1./ ] * .0
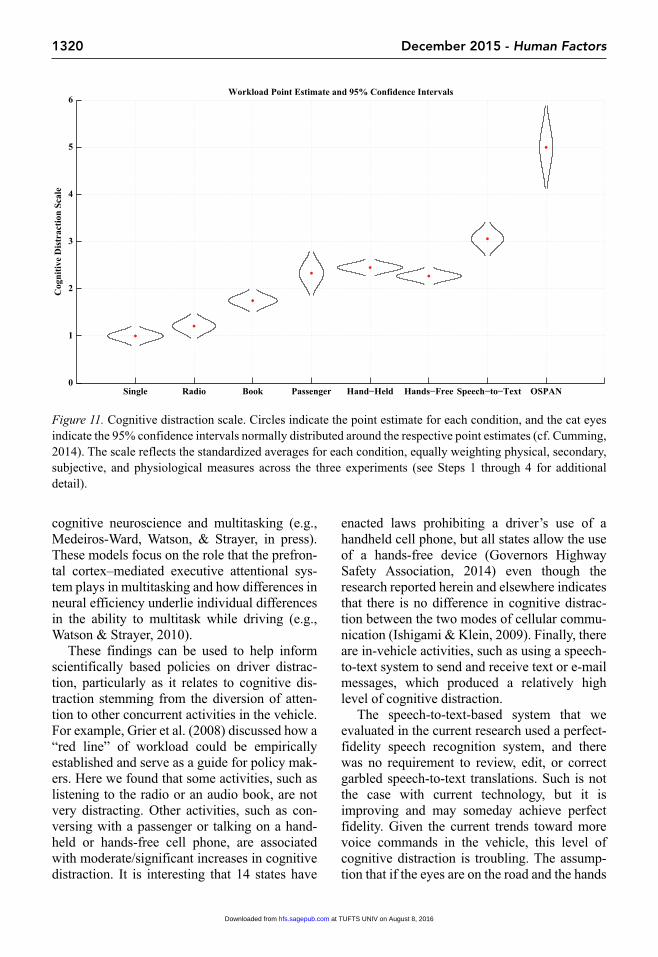
The cognitive distraction scale presented in Figure 11 ranges from 1.0 for the single-task condition and 5.0 for the OSPAN task. In- vehicle activities, such as listening to the radio (1.21) or an audio book (1.75), were associated with a small increase in cognitive distraction. The con-versation activities of talking to a passenger in the vehicle (2.33) and conversing with a friend on a handheld (2.45) or hands-free cell phone (2.27) were associated with a moderate increase in cognitive distraction, and the speech-to-text condition (3.06) had a large cognitive distraction rating.
The goal of this research was to be compre-hensive, using a variety of driving environments, a wide array of secondary task conditions, and an inclusive set of dependent measures. With the standardized values for each dependent measure provided in Table 1, it is possible to use Steps 3
at TUFTS UNIV on August 8, 2016hfs.sagepub.comDownloaded from
Cognitive DistraCtion in the automobile 1319
and 4 to alter the contribution of dependent mea-sures and/or secondary-task conditions from the current study. For example, given the fact that the NASA-TLX and DRT measures are substan-tially cheaper to collect and that they are very sensitive to cognitive workload, future research-ers may consider the utility of collecting only these measures and omitting the collection of physiological measures. It is straightforward to modify Steps 3 and 4 to exclude physiological measures to see impact on the cognitive distrac-tion scale. Moreover, provided with two com-mon anchor points (e.g., single-task driving and OSPAN), other investigators could easily extend the workload scale to an entirely different set of driving conditions, secondary tasks, and depen-dent measures. However, on a cautionary note, it is inappropriate to post hoc “cherry-pick” depen-dent measures to create a desired outcome (cf. Cumming, 2014) that is not representative of the overall pattern in the data.
The current research establishes an experi-mentally cross-validated cognitive distraction
instrument that can be used to evaluate different in-vehicle activities. Measuring cognitive distrac-tion has proven to be the most difficult of the three sources of distraction to assess because of the problems associated with observing what a driv-er’s brain (as opposed to hands or eyes) is doing. Here we used a combination of primary, second-ary, subjective, and physiological measures to assess cognitive distraction across a variety of in-vehicle activities and provide the most compre-hensive analysis that has been performed to date.
The method used herein maps the different dependent measures into a unidimensional cog-nitive workload metric. Although multidimen-sional models of mental workload exist (e.g., Wickens, 1984, 2002), there is nothing in the current analysis that requires the more compli-cated model. Indeed, the convergence of the dif-ferent measures in the different driving environ-ments suggests that the unidimensional model of cognitive workload is more parsimonious. We also think it is useful to consider the current results in the context of contemporary models of
TABLe 1: Standardized Scores for Each Dependent Measure
MeasureSingle Task Radio
Audio Book
Passenger Conversation
Handheld Cell Phone
Hands-Free Cell Phone
Speech to Text OSPAN
Brake reaction time (RT)
−.280 −.381 −.186 −.050 −.073 .015 .355 0.600
Following distance −.310 −.263 −.017 −.028 −.126 −.042 .243 0.544Glances .527 .380 .036 −.108 −.092 −.036 −.239 −0.468DRT-RT −.387 −.318 −.305 .161 .106 .071 .131 0.541DRT-A′ .248 .195 .223 −.004 −.005 .024 −.072 −0.608Mental −.640 −.558 −.145 −.289 −.162 −.171 .410 1.554Physical −.321 −.289 −.136 −.138 .400 −.018 .158 0.345Temporal −.495 −.486 −.220 −.277 −.070 −.172 .435 1.285Performance −.454 −.419 −.061 −.101 −.070 −.056 .113 1.049Effort −.599 −.488 −.184 −.326 −.112 −.184 .379 1.513Frustration −.413 −.428 −.218 −.386 −.129 −.040 .278 1.337P300 latency −.728 −.391 −.262 −.045 .237 .170 .233 0.788P300 area −.011 .130 .139 −.254 .078 .258 .092 −0.431
Note. The primary task measures of brake reaction time and following distance were collected in Experiment 2, glances at hazards were collected in Experiment 3, the secondary-task measures of DRT-RT and A′ were collected in Experiments 1 through 3, the NASA Task Load Index subjective workload measures of mental workload, physical workload, temporal demand, performance, effort, and frustration were collected in Experiments 1 through 3, and the physiological measures of P300 latency and P300 area were collected in Experiment 1 and in Experiments 1 through 3, respectively. OSPAN = Operation Span; DRT = Detection Response Task.
at TUFTS UNIV on August 8, 2016hfs.sagepub.comDownloaded from
1320 December 2015 - Human Factors
cognitive neuroscience and multitasking (e.g., Medeiros-Ward, Watson, & Strayer, in press). These models focus on the role that the prefron-tal cortex–mediated executive attentional sys-tem plays in multitasking and how differences in neural efficiency underlie individual differences in the ability to multitask while driving (e.g., Watson & Strayer, 2010).
These findings can be used to help inform scientifically based policies on driver distrac-tion, particularly as it relates to cognitive dis-traction stemming from the diversion of atten-tion to other concurrent activities in the vehicle. For example, Grier et al. (2008) discussed how a “red line” of workload could be empirically established and serve as a guide for policy mak-ers. Here we found that some activities, such as listening to the radio or an audio book, are not very distracting. Other activities, such as con-versing with a passenger or talking on a hand-held or hands-free cell phone, are associated with moderate/significant increases in cognitive distraction. It is interesting that 14 states have
enacted laws prohibiting a driver’s use of a handheld cell phone, but all states allow the use of a hands-free device (Governors Highway Safety Association, 2014) even though the research reported herein and elsewhere indicates that there is no difference in cognitive distrac-tion between the two modes of cellular commu-nication (Ishigami & Klein, 2009). Finally, there are in-vehicle activities, such as using a speech-to-text system to send and receive text or e-mail messages, which produced a relatively high level of cognitive distraction.
The speech-to-text-based system that we evaluated in the current research used a perfect-fidelity speech recognition system, and there was no requirement to review, edit, or correct garbled speech-to-text translations. Such is not the case with current technology, but it is improving and may someday achieve perfect fidelity. Given the current trends toward more voice commands in the vehicle, this level of cognitive distraction is troubling. The assump-tion that if the eyes are on the road and the hands
Single Radio Book Passenger Hand−Held Hands−Free Speech−to−Text OSPAN0
1
2
3
4
5
6Workload Point Estimate and 95% Confidence Intervals
Cog
nit
ive
Dis
trac
tion
Sca
le
Figure 11. Cognitive distraction scale. Circles indicate the point estimate for each condition, and the cat eyes indicate the 95% confidence intervals normally distributed around the respective point estimates (cf. Cumming, 2014). The scale reflects the standardized averages for each condition, equally weighting physical, secondary, subjective, and physiological measures across the three experiments (see Steps 1 through 4 for additional detail).
at TUFTS UNIV on August 8, 2016hfs.sagepub.comDownloaded from
Cognitive DistraCtion in the automobile 1321
are on the steering wheel, then voice-based interactions are safe appears to be unwarranted.
In the current research, conversation with a passenger in the vehicle or with a friend over a cell phone was associated with similar levels of cognitive distraction. In an earlier study compar-ing passenger and cell phone conversation (Drews, Pasupathi, & Strayer, 2008), the passen-ger was allowed to spontaneously help the driver with the task of driving (e.g., helping to navigate, pointing out hazards, or regulating conversation based upon the real-time demands of driving), and significant differences in route navigation were observed. Compared to single-task driving, when the participant was conversing with a friend seated next to him or her in the vehicle, there was no decline in navigation accuracy. By contrast, a conversation with a friend on a hands-free cell phone resulted in a 50% decline in navi-gation accuracy (i.e., half the participants missed their exit). What is the basis for the discrepancy between the current study and the study reported by Drews and colleagues (2008)? One important difference is that the DRT device that was used to measure RT and accuracy and served as a trigger for the ERP recordings was designed so that the driver could easily see the device; however, the passenger could not see the DRT lights and there-fore could not adjust his or her conversation to aid the driver as he or she did when navigating to a roadway exit. When the passenger cannot help with the task of driving, as in the current study, then any differences between conversation types will be minimal.
caveatsThe cognitive distraction scale provides a
comprehensive analysis of several of the cogni-tive sources of driver distraction. The scale does not directly measure visual/manual sources of distraction, although changes in visual scanning associated with cognitive workload are certainly included in the metric. Although driver distrac-tion can theoretically be separated into visual, manual, and cognitive sources, this sort of bal-kanization may prove overly simplistic in the real world. In Experiment 3, we demonstrated that there is cross-talk between cognitive and visual processing of potential hazards on the roadway. Moreover, a task that has a high visual demand
(e.g., text messaging) is also likely to require cog-nitive resources to read and process the message. Even when there are no demands for visual pro-cessing, interacting with cognitively demanding in-vehicle devices can alter how drivers scan and process information in the driving environment.
In this article, we provide evidence for a rela-tionship between secondary-task workload and distracted driving. Given the capacity limits of attention (e.g., Kahneman, 1973), an increase in cognitive workload associated with performing a concurrent secondary task reduces the available attention that can be allocated to driving. How-ever, as of yet, there has not been a comprehen-sive mapping of cognitive distraction to on-road crash risk. In experimental research that controls for exposure, it is reasonable to assume that there is a monotonic relationship between cognitive distraction and crash risk (the alternative would posit that increasing levels of distraction would somehow make drivers safer). In studies that lack such experimental control, the potential for self-regulatory factors to alter exposure patterns may complicate the relationship. For example, drivers may proactively decide not to use a cell phone when they are operating a motor vehicle. Drivers may also reactively self-regulate by moderating their usage in real time based upon driving difficulty or perception of driving errors. Reactive self-regulation may also involve trad-ing off different aspects of driving performance when multitasking. Future research is needed to establish when a behavior is a form of adaptive self-regulation or, instead, a by-product of the diversion of attention from driving.
acknowlEdGmEntsThis research was supported by the AAA Founda-
tion for Traffic Safety.
kEy poInts • The objective of this research was to establish a
systematic framework for measuring and under-standing cognitive distraction in the automobile.
• The relationship between mental workload, cogni-tive distraction, and impaired driving was devel-oped.
• Converging measures provided a stable estimate of driver distraction associated with different in-vehicle activities.
at TUFTS UNIV on August 8, 2016hfs.sagepub.comDownloaded from
1322 December 2015 - Human Factors
• The patterns observed in the three experiment set-tings (laboratory control, driving simulator, and instrumented vehicle) were strikingly consistent, establishing that lessons learned in the laboratory and driving simulator are in good agreement with studies of cognitive distraction on the roadway.
• There are significant impairments to driving that stem from the diversion of attention from the task of operating a motor vehicle that are directly related to the cognitive workload of these in-vehi-cle activities.
• The data suggest that the use of voice-based tech-nology in the vehicle may have unintended conse-quences that adversely affect traffic safety.
rEfErEncEsAngell, L., Auflick, J., Austria, P. A., Kochhar, D., Tijerina, L.,
Biever, W., & . . . Kiger, S. (2006). Driver workload metrics task 2 final report (DOT HS 810 635). Washington, DC: National Highway Traffic Safety Administration.
Caird, J. K., Willness, C. R., Steel, P., & Scialfa, C. (2008). A meta-analysis of the effects of cell phones on driver performance. Accident Analysis & Prevention, 40, 1282–1293. doi:10.1016/j.aap.2008.01.009
Cooper, J. M., Medeiros-Ward, N., & Strayer, D. L. (2013). The impact of eye movements and cognitive workload on lateral position variability. Human Factors, 55, 1001–1014.
Cumming, G. (2014). The new statistic: Why and how. Psychologi-cal Science, 25, 7–29.
Dingus, T. A., Klauer, S. G., Neale, V. L., Petersen, A., Lee, S. E., Sudweeks, J., & Knipling, R. R. (2006). The 100-Car Naturalistic Driving Study: Phase II. Results of the 100-Car Field Experiment (DOT HS 810 593). Washington, DC: National Highway Traf-fic Safety Administration. Retrieved from http://www.nhtsa.gov/Research/Human+Factors/Naturalistic+driving+studies:
Donchin, E. (1981). Presidential address, 1980: Surprise! . . . Sur-prise? Psychophysiology, 18, 493–513.
Drews, F. A., Pasupathi, M., & Strayer, D. L. (2008). Passenger and cell-phone conversation during simulated driving. Journal of Experimental Psychology: Applied, 14, 392–400. doi:10.1037/a0013119
Engström, J., Johansson, E., & Östlund, J. (2005). Effects of visual and cognitive load in real and simulated motorway driving. Transportation Research Part F, 8, 97–120. doi:10.1016/j.trf.2005.04.012
Engström, J., Monk, C. A., Hanowski, R. J., Horrey, W. J., Lee, J. D., McGehee, D. V., & . . . Yang, C.Y.D. (2013). A conceptual framework and taxonomy for understanding and categorizing driver inattention. Brussels, Belgium: European Commission.
Fisher, D. L., & Strayer, D. L. (2014). Modeling situation aware-ness and crash risk. Annals of Advances in Automotive Medi-cine, 5, 33–39.
Gopher, D., & Donchin, E. (1986). Workload: An experimentation of the concept. In K. Boff, L. Kaufmann, & J. Thomas (Eds.), Handbook of perception and performance: Vol. 2. Cognitive processes and performance (pp. 1–49). New York, NY: Wiley.
Governors Highway Safety Association. (2014). Distracted driving laws. Retrieved from http://www.ghsa.org/html/stateinfo/laws/cellphone_laws.html
Grier, R., Wickens, C. D., Kaber, D., Strayer, D. L., Boehm-Davis, D., Trafton, G. J., & St. John, M. (2008). The red-line of workload: Theory, research, and design. In Proceedings of the Human Factors and Ergonomics Society 52nd Annual Meet-ing (pp. 1204–1208). Santa Monica, CA: Human Factors and Ergonomics Society.
Gruen, S. (2006). Water for elephants: A novel. Chapel Hill, NC: Algonquin Books.
Gugerty, L. (1997). Situation awareness during driving: Explicit and implicit knowledge in dynamic spatial memory. Jour-nal of Experimental Psychology: Applied, 3, 42–66. doi:10.1037/1076-898X.3.1.42
Harbluk, L., & Noy, I. (2002). The impact of cognitive distraction on driver visual behaviour and vehicle control. Ottawa, Can-ada: Ergonomics Division, Road Safety Directorate and Motor Vehicle Regulation Directorate. Retrieved from http://sunburst .usd.edu/~schieber/materials/trans-canada-13889.pdf
Harbluk, J. L., Noy, Y. I., Trbovich, P. L., & Eizenman, M. (2007). An on-road assessment of cognitive distraction: Impacts on drivers’ visual behavior and braking performance. Accident Analysis & Prevention, 39, 372–379. doi:10.1016/j.aap.2006.08.013
Hart, S. G., & Staveland, L. E. (1988). Development of NASA-TLX (Task Load Index): Results of empirical and theoretical research. In P. A. Hancock & N. Meshkati (Eds.), Human men-tal workload (pp. 139–183). Oxford, UK: North-Holland.
Horrey, W. J., & Wickens, C. D. (2006). Examining the impact of cell phone conversations on driving using meta-analytic techniques. Human Factors, 48, 196–205. doi:10.1518/001872006776412135
Ishigami, Y., & Klein, R. (2009). Is a hands-free phone safer than a handheld phone? Journal of Safety Research, 40, 157–164. doi:10.1016/j.jsr.2009.02.006
Ishihara, S. (1993). Ishihara’s test for color-blindness. Tokyo, Japan: Kanehara.
International Standards Organization. (2012). Road vehicles: Transport information and control systems. Detection-Response Task (DRT) for assessing selective attention in driving (ISO TC 22 SC 13 N17488). Working draft under development by Working Group 8 of ISO TC22, SC 13.
Kahneman, D. (1973). Attention and effort. Englewood Cliffs, NJ: Prentice Hall.
Kass, S. J., Cole, K. S., & Stanny, C. J. (2007). Effects of distraction and experience on situation awareness and simulated driving. Transportation Research Part F, 10, 321–329. doi:10.1016/j.trf.2006.12.002
Kelley, J. F. (1983). An empirical methodology for writ-ing user-friendly natural language computer applications. In Proceedings of ACM SIG-CHI ’83 Human Factors in Computing Systems (pp. 193–196). New York, NY: ACM. doi:10.1145/800045.801609
Klauer, S. G., Guo, F., Simons-Morton, B. G., Ouiment, M. C., Lee, S. E., & Dingus, T. A. (2014). Distracted driving and risk of road crashes among novice and experienced drivers. New England Journal of Medicine, 370, 54–59.
Kramer, A. F., Sirevaag, E. J., & Braun, R. (1987). A psycho-physiological assessment of operator workload during simulated flight missions. Human Factors, 29, 145–160. doi:10.1177/001872088702900203
Lee, J. D. (2004, September). Simulator fidelity: How low can you go? Paper presented at the Human Factors and Ergonomics Society 48th Annual Meeting, New Orleans, LA.
Lee, J. D., Caven, B., Haake, S., & Brown, T. L. (2001). Speech-based interactions with in-vehicle computers: The effect of
at TUFTS UNIV on August 8, 2016hfs.sagepub.comDownloaded from
Cognitive DistraCtion in the automobile 1323
speech-based e-mail on drivers’ attention and roadway. Human Factors, 43, 631–640. doi:10.1518/001872001775870340
Lowry, L. (2002). The giver. New York, NY: Laurel Leaf Books.McCarley, J. S., Vais, M., Pringle, H., Kramer, A. F., Irwin, D. E.,
& Strayer, D. L. (2004). Conversation disrupts scanning and change detection in complex visual scenes. Human Factors, 46, 424–436. doi:10.1518/hfes.46.3.424.50394
McEvoy, S. P., Stevenson, M. R., McCartt, A. T., Woodward, M., Haworth, C., Palamara, P., & Cercarelli, R. (2005). Role of mobile phones in motor vehicle crashes resulting in hospital attendance: A case-crossover study. British Medical Journal, 331, 428–433.
Medeiros-Ward, N., Cooper, J. M., & Strayer, D. L. (2013). Hierar-chical control and driving. Journal of Experimental Psychology: General. Advance online publication. doi:10.1037/a0035097
Medeiros-Ward, N., Watson, J. M., & Strayer, D. L. (in press). On supertaskers and the neural basis of extraordinary multitasking. Psychonomic Bulletin and Review.
Mehler, B., Reimer, B., & Coughlin, J. F. (2012). Sensitivity of physiological measures for detecting systematic variations in cognitive demand from a working memory task: An on-road study across three age groups. Human Factors, 54, 396–412. doi:10.1177/0018720812442086
National Highway Traffic Safety Administration. (2012). Visual-manual NHTSA driver distraction guidelines for in-vehicle electronic devices: Department of Transportation (Docket No. NHTSA-2010-0053). Retrieved from https://www.federalregister.gov/articles/2012/02/24/2012-4017/visual-manual-nhtsa-driver-distraction-guidelines-for-in-vehicle-electronic-devices
Parasuraman, R., & Davies, D. R. (1984). Varieties of attention. San Francisco, CA: Academic Press.
Pollack, I., & Norman, D. A. (1964). Non-parametric analysis of recognition experiments. Psychonomic Science, 1, 125–126.
Ranney, T., Mazzae, E., Garrott, R., & Goodman, M. (2000). NHTSA driver distraction research: Past, present and future. Retrieved from http://ntl.bts.gov/ref/biblio/DistractedDriving/Distracted.htm
Ratcliff, R., & Strayer, D. L. (2014). Modeling simulated driving with a one-boundary diffusion model. Psychological Bulletin and Review, 21, 577–589.
Recarte, M. A., & Nunes, L. M. (2000). Effects of verbal and spatial-imagery tasks on eye fixations while driving. Journal of Experimental Psychology: Applied, 6, 31–43. doi:10.1037/1076-898X.6.1.31
Recarte, M. A., & Nunes, L. M. (2003). Mental workload while driving: Effects on visual search, discrimination, and decision making. Journal of Experimental Psychology: Applied, 9, 119–137. doi:10.1037/1076-898X.9.2.119
Redelmeier, D. A., & Tibshirani, R. J. (1997). Association between cellular-telephone calls and motor vehicle collisions. New Eng-land Journal of Medicine, 336, 453–458.
Reimer, B. (2009). Impact of cognitive task complexity on driv-ers’ visual tunneling. Transportation Research Record: Jour-nal of the Transportation Research Board, 2138, 13–19. doi:10.3141/2138-03
Reimer, B., Mehler, B. L., Pohlmeyer, A. E., Coughlin, J. F., & Dusek, J. A. (2006). The use of heart rate in a driving simulator as an indicator of age-related differences in driver workload. Advances in Transportation Studies an International Journal, Special Issue, 9–20.
Reimer, B., Mehler, B. L., Wang, Y., & Coughlin, J. F. (2012). A field study on the impact of variations in short term memory demands on drivers’ visual attention and driving performance
across three age groups. Human Factors, 54, 454–468. doi:10.1177/0018720812437274
Rowling, J. K. (1998). Harry Potter and the sorcerer’s stone. New York, NY: Arthur A. Levine Books.
Sanbonmatsu, D. M., Strayer, D. L., Medeiros-Ward, N., & Watson, J. M. (2013). Who multi-tasks and why? Multi- tasking ability, perceived multi-tasking ability, impulsiv-ity, and sensation seeking. PLOS ONE, 8, 1–8. doi:10.1371/ journal.pone.0054402
Semlitsch, H. V., Anderer, P., Schuster, P., & Presslich, O. (1986). A solution for reliable and valid reduction of ocular artifacts, applied to the P300 ERP. Psychophysiology, 23, 695–703. doi:10.1111/j.1469-8986.1986.tb00696.x
Sirevaag, E. J., Kramer, A. F., Wickens, C. D., Reisweber, M., Strayer, D. L., & Grenell, J. H. (1993). Assessment of pilot performance and mental workload in rotary wing aircraft. Ergonomics, 9, 1121–1140. doi:10.1080/00140139308967983
Sodhi, M., Reimer, B., & Llamazares, I. (2002). Glance analysis of driver eye movements to evaluate distraction. Behavior Research Methods, Instruments & Computers, 34, 529–538. doi:10.3758/BF03195482
Strayer, D. L., Cooper, J. M., & Drews, F. A. (2004). What do driv-ers fail to see when conversing on a cell phone? In Proceedings of the Human Factors and Ergonomics Society 48th Annual Meeting (pp. 2213–2217). Santa Monica, CA: Human Factors and Ergonomics Society.
Strayer, D. L., & Drews, F. A. (2007a). Cell-phone-induced driver distraction. Current Directions in Psychological Science, 16, 128–131. doi:10.1111/j.1467-8721.2007.00489.
Strayer, D. L., & Drews, F. A. (2007b). Multi-tasking in the auto-mobile. In A. Kramer, D. Wiegmann, & A. Kirlik (Eds.), Applied attention: From theory to practice (pp. 121–133). Oxford, UK: Oxford University Press.
Strayer, D. L., Drews, F. A., & Johnston, W. A. (2003). Cell phone induced failures of visual attention during simulated driv-ing. Journal of Experimental Psychology: Applied, 9, 23–32. doi:10.1037/1076-898X.9.1.23
Strayer, D. L., & Johnston, W. A. (2001). Driven to distraction: Dual-task studies of simulated driving and conversing on a cel-lular phone. Psychological Science, 12, 462–466.
Strayer, D. L., Watson, J. M., & Drews, F. A. (2011). Cognitive distraction while multitasking in the automobile. In B. Ross (Ed.), The psychology of learning and motivation: Advances in research and theory (Vol. 54, pp. 29–58). San Diego, CA: Elsevier Academic Press.
Stutts, J., Feaganes, J., Rodman, E., Hamlet, C., Meadows, T., Rinfurt, D., . . . Staplin, L. (2003). Distractions in everyday driving. Washington, DC: AAA Foundation for Traffic Safety. Retrieved from https://www.aaafoundation.org/distractions-everyday-driving-0
Sussman, E. D., Bishop, H., Madnick, B., & Walker, R. (1985). Driver inattention and highway safety. Transportation Research Record, 1047, 40–48.
Taylor, T., Pradhan, A. K., Divekar, G., Romoser, M., Muttart, J., Gomes, R., . . . Fisher, D. L. (2013). The view from the road: The contribution of on-road glance-monitoring technologies to understanding driver behavior. Accident Analysis & Preven-tion, 58, 175–186. doi:10.1016/j.aap.2013.02.008
Turner, M. L., & Engle, R. W. (1989). Is working memory capac-ity task dependent? Journal of Memory & Language, 28, 127–154. doi:10.1016/0749-596X(89)90040-5
Wang, J. S., Knipling, R. R., & Goodman, M. J. (1996). The role of driver inattention in crashes: New statistics from the 1995
at TUFTS UNIV on August 8, 2016hfs.sagepub.comDownloaded from
1324 December 2015 - Human Factors
Crashworthiness Data System. In 40th Annual Proceedings of the Association for the Advancement of Automotive Medicine (pp. 377–392). Retrieved from http://www-nrd.nhtsa.dot.gov/departments/Human%20Factors/driver-distraction/PDF/Wang.PDF
Watson, J. M., & Strayer, D. L. (2010). Profiles in extraordinary multitasking ability. Psychonomic Bulletin and Review, 17, 479–485. doi:10.3758/PBR.17.4.479
Wickens, C. D. (1984). Processing resources in attention. In R. Parasuraman, J. Beatty, & J. Davies (Eds.), Varieties of atten-tion (pp. 63–102). New York, NY: Academic Press.
Wickens, C. D. (2002) Multiple resources and performance prediction. Theoretical Issues in Ergonomics Science, 3, 159–177.
David L. Strayer is a professor at the University of Utah. He received a PhD in experimental psychol-ogy in 1989 from the University of Illinois at Urbana-Champaign.
Jonna Turrill is a PhD candidate at the University of Utah. She received an MS in cognition and neural science from the University of Utah in 2014.
Joel M. Cooper is the owner/CEO at Precision Driv-ing Research. He received a PhD in cognition and neural science in 2010 from the University of Utah.
James R. Coleman is a PhD candidate at the Univer-sity of Utah. He received an MS in cognition and neural science from the University of Utah in 2014.
Nathan Medeiros-Ward is a post-doctoral fellow at the Beckman Institute for Advanced Science and Technology, University of Illinois. He received a PhD in cognition and neural science in 2013 from the University of Utah.
Francesco Biondi is a post-doctoral fellow at the University of Utah. He received a PhD in experi-mental psychology and cognitive sciences in 2015 from the University of Padova, Italy.
Date received: September 9, 2013Date accepted: January 25, 2015
at TUFTS UNIV on August 8, 2016hfs.sagepub.comDownloaded from