Embed Size (px)
Citation preview

Lakehead University
Knowledge Commons,http://knowledgecommons.lakeheadu.ca
Electronic Theses and Dissertations Electronic Theses and Dissertations from 2009
2016
Assessing community forest resources
to determine potential for biomass
district heating in one rural and one
remote First Nation of Northwestern Ontario
Seymour, Stephanie
http://knowledgecommons.lakeheadu.ca/handle/2453/843
Downloaded from Lakehead University, KnowledgeCommons

ASSESSING COMMUNITY FOREST RESOURCES TO DETERMINE POTENTIAL FOR BIOMASS DISTRICT HEATING IN ONE RURAL AND ONE REMOTE FIRST
NATION OF NORTHWESTERN ONTARIO
by Stephanie Seymour
A Graduate Thesis Submitted in Partial Fulfillment of the Requirements for the Degree of Master of Science in Forestry
Faculty of Natural Resources Management Lakehead University
December 16 2015
Major Advisor Second Reader
LIBRARY RIGHTS STATEMENT

ii
In presenting this thesis as a partial requirement for the MScF degree at
Lakehead University in Thunder Bay, I agree that the University will make it freely
available for inspection.
This thesis is made available by my authority solely for the purpose of
private study and research and may not be copied or reproduced in whole or in part
(except as permitted by the Copyright Laws) without my written authority.
Signature:
Date:

iii
A CAUTION TO THE READER
This MScF thesis has been through a semi-formal process of review and
comment by my Supervisor, Dr. Peggy Smith, and members of my Supervisory
Committee, Dr. Mat Leitch and Dr. Chander Shahi. It is made available for loan by the
Faculty of Natural Resources Management for the purpose of advancing the practice of
professional and scientific forestry.
The reader should be aware that the opinions and conclusions expressed in this
document are those of the student and do not necessarily reflect the opinions of the
thesis supervisor, supervisory committee, the Faculty of Natural Resources Management
or Lakehead University.

iv
ABSTRACT
Seymour, S.I. 2015. Assessing community forest resources to determine potential for biomass district heating in two rural and remote First Nations of northwestern Ontario. Master of Science Thesis, Faculty of Natural Resources Management, Lakehead University, Thunder Bay ON. 183 pp. Keywords: biomass, biomass district heating, First Nations, remote communities,
renewable energy, wood properties The purpose of this thesis is to explore the feasibility of using biomass in rural
and remote First Nations for the purpose of supplying biomass district heating plants. The availability of forest resources, including the methods for determining biomass volumes and availability, and the policies which govern access to timber/biomass on Crown and reserve land will be assessed. The thesis is produced in conjunction with a pre-feasibility study conducted collaboratively between Confederation College and Lakehead University in Thunder Bay, ON.
It was found that sufficient forest resources exist to supply woody biomass to a biomass district heating plant (BDHP) in both the rural and remote communities, which can provide heat and hot water to community infrastructure and home dwellings in order to offset electrical use. It was found that there was variability between thermal potential, ash content and species present in the two communities. There was also variability between the wood properties values found in this study compared to the published values for the same species. Although there was a significant difference in species volume, annual growth per hectare and species composition at 95% probability, there was not a significant difference in wood properties. There was also a significant difference between the outcomes of using the Lakehead University Wood Science Testing Facility methods compared to Ontario Ministry of Natural Resources and Forestry Forest Resource Inventory methods related to species volume and composition reported by the different methods, while total volume was the same.
This information is not intended to replace a proper forest management plan, but to provide information to communities so that informed decisions can be made. In fact, accessing the identified available biomass would require an amendment to the forest management plan and may require additional legislated documentation and an approval process or a fibre supply agreement with the forest tenure holder.

v
TABLE OF CONTENTS
Abstract iv List of Figures ix List of Tables xiii List of Equations xiv List of Abbreviations xv
Acknowledgements xivii Chapter 1: Introduction 1
Biomass As An Alternative Energy Source For Remote And Rural First Nations 1
Definition Of Rural, Remote Communities 2
High cost of electricity 3
Environmental Considerations 6
Current Situation Facing First Nations 6
Confederation College Project Overview 9
Overview Of Thesis Research 11
Statement Of Purpose 12
Objectives 12
Research Questions and Null Hypotheses 13
Chapter 2: Literature Review 14
Natural Resources in Rural and Remote Areas of Northwestern Ontario 14
What is Biomass? 16
Can Biomass be Used and Produced Sustainably? 18

vi
Biomass to Offset Electrical Consumption 22
Biomass District Heating 25
Calculating Annual Harvest Area 33
Available Wood Supply and Supply Chain Management 33
Units of Measure 37
Wood Density 378
Moisture Content of Wood 39
Thermal Potential of Wood 39
Ash Content of Wood 40
First Nation access to timber on provincial crown land and federal reserve lands 42
Treaties, the Indian Act, and Supreme Court Decisions 44
The Far North Act and the Crown Forest Sustainability Act 48
Challenges of inventorying forest resources in remote and rural First Nations
56 Chapter 3: Methods 62
Community Selection 62
Sachigo Lake First Nation 64
Lac Seul First Nation 67
Pre-Field Work Planning – Acquiring Forest Inventory Data 72
GIS Mapping and Lands and Resource Information in Rural and Remote Areas 72
Delineation of Strata based on Available Forest Inventories 78
Forest Resource Inventory 79

vii
Inventory for Biomass Estimates 81
Identifying Available Biomass on a Sustainable Harvest Level 92
Standing and Harvest Volumes 92
Species Composition 92
Laboratory Analysis of Wood Properties 93
Moisture Content 94
Wood Density 96
Thermal Properties (MJ/kg Calculations) 98
Ash Content 100
Statistical Analysis 101
Chapter 4: Results 103
Comparing Provincial Data with Data Collected During Study 103
Landcover with Potential for Biomass Harvest in Remote Areas: SLFN 103 Comparison between Species Composition and Volumes Calculated for SLFN 106
Landcover with Potential for Biomass Harvest in Rural Areas: Lac Seul First Nation 112
Comparison between Species Composition and Volumes Calculated for LSFN 117
Comparing the Resources of the Rural (LSFN) and Remote (SLFN) First Nations 124
Statistical Analysis of the Forest Inventory 128
Wood properties 129
Comparison between Wood Properties in LSFN and SLFN 129

viii
Comparison Between Published Values and LUWSTF Results for Wood Properties 134
Statistical Analysis of the Wood Properties 142
Chapter 5: Discussion 144
Forest Inventory Results (Hypothesis 1) 144
Wood Resources Available to Rural and Remote Communities 146
Wood properties 151 Chapter 6: Conclusions and Recommendations 158
Summary of arguments 158
Future Studies 160 Literature Cited 161 APPENDIX I FOREST INVENTORY ANALYSIS DATA 176 APPENDIX II NUMBER SPECIES ANALYSIS DATA 179 APPENDIX III WOOD PROPERTIES ANALYSIS DATA 183 APPENDIX IV ETHICS APPROVAL 185

ix
LIST OF FIGURES
Figure Page
1. Location of electrical grids and remote communities dependent on diesel-generated electricity 4 2. Location of provincial road networks including winter roads 5 3. Forest Regions of Ontario 14 4. Sources of Biomass 17 5. Example of BDHP configuration 26 6. Location of BDHP in Finland 26 7. Location of Oujé-bougoumou in Quebec 31 8. Integrated wood supply chain demonstrating use of by-products for biomass energy use 35 9. Integrated wood supply chain demonstrating use of harvest residues 35 10. Numbered treaties in Canada 43 11. The Far North region of Ontario including Treaty Areas 51 12. Forest management units in Ontario 57 13. Aerial photography showing forest stand delineation 58 14. Experimental design for assessing forest biomass thermal potential 63 15. Forest regions of Ontario 64 16. Sachigo Lake First Nation community 65 17. Location of LSFN in relation to surrounding FMUs 68 18. Location of Frenchman's Head, Whitefish Bay, and Kejick Bay in the Lac Seul First Nation Reserve land and Lac Seul Forest 69 19. Map of FMUs in northwestern Ontario highlighting Lac Seul Forest and location of Lac Seul First Nation 70

x
20. Coniferous forest strata 74 21. Canopy of deciduous forest strata 75 22. Canopy of a mixedwood forest strata 75 23. Disturbed forest strata 76 24. Representative treed wetland site 77 25. Example of soil profile assessment in field 82 26. Examples of In (“Count”) vs. Out (“Don’t Count”) trees 85 27. Example of DBH measurement 86 28. Examples of tree defects 86 29. Crown canopy positions 87 30. Use of Suunto clinomete 89 31. Use of increment borer to determine age 89 32. Bark sample 90 33. Example of regeneration survey setup 91 34. Example of wood properties testing procedures and equipment 94 35. TGA-601 used for analyses 95 36. Species composition and percentage of 11,391,614 m³ total volume for SLFN Crown land using LUWSTF methods 107 37. Species composition of SLFN Crown land as calculated using OMNRF methods 107 38. Summary of volumes on SLFN Crown land calculated using two methods
108 39. Over and underestimation of volumes on SLFN Crown land 109 40. Species composition of SLFN reserve land calculated using LUWSTF methods. 110

xi
41. Species composition of SLFN reserve land calculated using OMNRF methods 110 42. Summary of volumes calculated for SLFN reserve land using OMNRF and LUWSTF methods 111 43. Demonstration of over or underestimates for SLFN reserve land 111 44. Area of forest cover type expressed as a percentage of total area of the Lac Seul Forest 115 45. Summary of species composition as a percentage of total volume (19 223 022 m³) for LSFN Crown land using OMNRF methods 118 46. Summary of species composition as a percentage of total volume for LSFN Crown land using LUWSTF methods. 119 47. Summary of volumes calculated for LSFN Crown land using OMNRF and LUWSTF methods. 119 48. Demonstration of over/underestimates of volumes for LSFN Crown land
120 49. Summary of species composition as a percentage of total volume (2 898 916 m³) for LSFN reserve land using OMNRF methods 122 50. Summary of species composition as a percentage of total volume (2 898 916 m³) for LSFN reserve land using LUWSTF methods 122 51. Summary of volumes calculated for LSFN reserve land using OMNRF and LUWSTF methods 123 52. Demonstration of over- and under estimations of volumes on LSFN reserve land 123 53. Comparison between number of species present in each community 124 54. Difference in volumes present in each community 125 55. Growth rate of forests in SLFN and LSFN 125 56. Potential sources of biomass in LSFN reserve land 126 57. Potential sources of biomass in LSFN Crown land 127

xii
58. Difference in area available to the rural and remote communities 127 59. Differences in volumes present on LSFN and SLFN land bases sorted by on and off reserve land 128 60. Comparison of thermal values between tree species in LSFN and SLFN 130 61. Comparison of ash content between tree species in LSFN and SLFN 132 62. Comparison of wood densities between tree species in LSFN and SLFN 133 63. LSFN wood density comparison to published values 135 64. SLFN wood density comparison to published values 136 65. SLFN comparison between green published thermal values and LUWSTF results 137 66. LSFN comparison between published thermal values and LUWSTF results
138 67. SLFN ash content in wood compared to published values 140 68. LSFN ash content in wood compared to published values 141 69. Difference in area available to the rural and remote communities 148

xiii
LIST OF TABLES
Table Page
1. Criteria of rural and remote communities used for this study 3
2. Provincial allocation of wood supply to Aboriginal tenure holders 54
3. Description of field data collected 81
4. Summary of forested areas by parcel and authority for SLFN 103
5. Comparison of species composition using the Provincial Landcover 2000 -
27 classes and the LUWSTF FRI at SLFN 105
6. Volume summary for the Lac Seul Forest comparing provincial FRI with LUWSTF FRI 116
7. Comparison of thermal values 131
8. Summary of ash content (%) 132
9. Summary of green wood density comparison for SLFN and LSFN 134
10. Comparison of LUWSTF results and published values for LSFN 135
11. Summary of green wood density comparison between LUWSTF results and published values for SLFN 136
12. Summary of published values and LUWSTF results used for comparison for SLFN 137
13. Summary of LUWSTF results and published values for LSFN 139
14. Summary of LUWSTF results and published values for SLFN 140
15. Summary of LUWSTF results and published values for LSFN 141
16. Post hoc subsets and species 143

xiv
LIST OF EQUATIONS
Equation Page
1. General formula for determining limiting distance. 84
2. Simple formula for determining limiting distance for a BAF2 plot. 84
3. Honer's volume equation. 92
4. Calculating species composition. 93
5. Calculation of Moisture Content 96
6. Calculating volume of a cylinder. 97
7. Calculation of temperature rise 99
8. Calorimeter Heat Capacity 99
9. Calorific Value Calculation 99
10. Net Calorific Value 100
11. Ash Content Calculation 101
12. Statistical model for analysis. 102

xv
LIST OF ABBREVIATIONS
AANDC - Aboriginal Affairs and Northern Development Canada AHA - Annual Harvest Area ANOVA - Analysis of Variance AOU - Area of Undertaking ASTM - American Society of Testing Materials BC - British Columbia BCR – Band Council Resolution BDH - Biomass District Heating BDHP - Biomass District Heating Plant BIC - Biomass Innovation Center BNA - British North America [Act] BTU – British Thermal Unit CABREE - Centre for Applied Business Research in Energy and the Environment C-bLUP - Community-based Land Use Plan CHP - Combined heat and power CFS - Canadian Forest Service CFSA - Crown Forest Sustainability Act CO2 - Carbon dioxide CO - Carbon monoxide DBH - Diameter at breast height DEM - Digital Elevation Model EANCP - Ecoenergy for Aboriginal and Northern Communities Program FAO - Food and Agriculture Organization FRI - Forest Resource Inventory FMP - Forest Management Plan FMU - Forest Management Unit FNA - Far North Act GEREMA - Geographical Resource Management GHG - Greenhouse Gas GLSL - Great Lakes - St. Lawrence IRT - Indian Timber Regulations HORCI - Hydro One Remote Communities Inc. IESO - Independent Electrical Systems Operators IFNA - Independent First Nations Alliance INAC - Indian and Northern Affairs Canada LIO - Lands and Information Ontario LUWSTF - Lakehead University Wood Science Testing Facility LSFN - Lac Seul First Nation MC - Moisture content MNRE - Ministry of New and Renewable Energy (India) MW - Megawatt NAFA - National Aboriginal Forestry Association NAN - Nishnawbe Aski Nation

i
NRCan - Natural Resources Canada NWT - Northwest Territories ODT - Oven Dry Tonnes OFTMA - Ontario Forest Tenture Modernization Act OMNR - Ontario Ministry of Natural Resources OMNRF - Ontario Ministry of Natural Resources and Forestry OMOE - Ontario Ministry of the Environment ORC - Obishikokaang Resource Corporation PEI - Prince Edward Island QUESTCanada - Quality Urban Energy Systems of Tomorrow Canada RETScreen - Renewable Energy Project Analysis Software ROR - Run of River SFMM - Sustainable Forest Management Model SLFN - Sachigo Lake First Nation TNG - Tsilhqot’in National Government TRCC - Truth and Reconcilliation Comission Canada UNFCCC - United Nations Framework Convention on Climate Change UW - Underutilized Wood WSApp - Wood Science App

ACKNOWLEDGEMENTS
I would like to thank my supervisor, Dr. Peggy Smith, for her continuous patience, support, and encouragement throughout the production of this thesis. Dr. Smith’s extensive knowledge and understanding on the topic were an invaluable resource. I would also like to thank Dr. Chander Shahi and Dr. Mathew Leitch for their helpful comments and support. Furthermore, I would like to acknowledge the support I received from Brian Kurikka and Confederation College, Lac Seul First Nation, Sachigo Lake First Nation, and the Lakehead University Wood Science Testing Facility (LUWSTF) for partnering on this project and providing resources and support to this project. I would like to thank Scott Miller for all his help and contributions throughout the project. I greatly appreciate his mentorship and assistance throughout the completion of this report. Ultimately, I owe the completion of this thesis to Scott. I would also like to thank my mother, Marion Seymour, and brothers, Nicholas and Christopher Seymour, for their inspiration, for supporting me through this project and being excellent role models. Further, I would like to thank Mike Hosszu for being a great mentor and project partner. Without Mike, I would not have endured through some stressful days. I would also like to thank Sarah Mansfield, my loving partner, and the rest of my friends and family who encouraged and supported me in this project. Finally, I would like to thank Cristiane Sater-Melnik and Paul Robitaille for their assistance with field work and in the processing and testing of wood specimens.
I credit the completion of this report to my supervisor, Dr. Peggy Smith, Scott
Miller, and my mother, who ensured that I stay motivated and focused on the task at hand. I am sincerely grateful.

1
CHAPTER 1: INTRODUCTION
BIOMASS AS AN ALTERNATIVE ENERGY SOURCE FOR REMOTE AND RURAL FIRST NATIONS
In rural and remote First Nations in northwestern Ontario communities rely on
costly electricity to produce heat and hot water. In some areas where the electrical grid
reaches the cost of electricity is much higher when compared to larger urban areas
(Arriaga et al. 2013; Arriaga 2015). Where communities are not connected to the
electrical grid, diesel generators are used to produce electricity. The use of diesel to
create energy has numerous implications that negatively affect the environment and the
communities dependent on this form of electrical generation including the contribution
of fossil fuels to climate change, high fuel costs, dependency on foreign imported fuels,
fuel shortages and limited electrical grid networks, and risk of contamination from spills
and air emissions (Albert 2007). Further, the cost of electricity, combined with limited
infrastructure, can inhibit development in First Nations. In order to reduce the
dependency and usage of diesel fueled generators, reduce the cost of heating in
communities, or to free up room on local electrical grids, biomass district heating (BDH)
systems were explored as an alternative. Rather than generating electricity via
transported diesel for large generators, a biomass district heating plant (BDHP) uses
locally-sourced forest biomass burned in a wood boiler and gasification system, which
heats fluid and is then piped to different buildings where it can be used as heat or as hot
water offsetting diesel-generated heat, which in turn reduces diesel usage. If a BDH
plant can be established in a community, there is potential to create local employment
through the operation and maintenance of the plant, and through the management and

2
harvesting of forest resources to fuel the BDHP. BDH can be a catalyst for community
development in rural and remote First Nations (McCallum et al. 1998; McCallum 2010;
Mabee et al. 2011; Arriaga et al. 2013; Arriaga 2015).
Diesel-generated electricity has been in use for decades and has been considered
an ideal method of creating energy in remote areas1 (HORCI 2011) as it does not require
stationary power engineers, and operation of diesel-generating plants is relatively simple
(Arriaga et al. 2013). A number of community members can be trained in operating the
diesel plant, and most operations are done through the use of a computer system. Given
its simplicity, reliability and relative ease of operation and maintenance, there is little
interest from Hydro One—the organization responsible for the maintenance of diesel-
generating facilities—in removing diesel facilities from communities. However, Hydro
One is open to the idea of offsetting electrical use by utilizing a supplementary heating
method to reduce diesel consumption, which would free up room on the electrical grid
(HORCI 2011; HORCI 2013) and assist in alleviating the negative impacts of diesel-
generated electricity.
DEFINITION OF RURAL, REMOTE COMMUNITIES There are many definitions of rural and remote communities in Ontario, Canada,
and the world; for the purpose of this study rural and remote communities were
determined based on three criteria: road access, available electrical grid, and available
natural gas pipelines. Table 1 demonstrates the comparison between rural and remote
1 Electrical generation in the urban and rural parts of Ontario is the responsibility of the Ontario Power Generation (OPG), the Ontario Power Authority (OPA), and Hydro One, a crown corporation. These companies service communities with electrical grid connection. Hydro One Remote Communities Inc. (HORCI) is responsible for providing electricity to 21 communities in remote areas in the northern parts of Ontario.

3
communities. In Ontario, First Nations are referred to as remote based on two criteria: 1)
their distance from major community centers, and 2) their lack of access to all-season
road networks and electrical grids (Slack et al. 2003; HORCI 2011; Arriaga et al. 2013).
These communities are located in an area referred to as the Far North (OMNR 2014b),
and are dependent on diesel generators to create electricity to power and heat their
homes. The First Nation communities in northwestern Ontario that are accessible by
road and have access to the electrical grid, but lack the natural gas pipelines that would
provide cheaper alternative heating and energy solutions to electric heat, are referred to
as rural for the purpose of this project.
Table 1. Criteria of rural and remote communities used for this study.
Criteria Rural Community Remote Community
Road access All-season road access Winter road access; fly-in during summer months
Available electrical grid Access to provincial electrical grid
Diesel generation for local micro-grid
Figures 1 and 2 show the location of remote communities in relation to natural
gas pipelines, electrical grids, and provincial road networks; ice-roads are also shown.
HIGH COST OF ELECTRICITY In spite of Hydro One’s endorsement of diesel for remote communities,
providing diesel-generated electricity to remote First Nations is problematic in a number
of ways. The fuel must be either trucked in on the winter road network or flown in when
road conditions are not suitable (Golden et al. 2011; Arriaga et al. 2013). This leads to a
higher cost of fuel (Gustavsson et al. 2011; Burlando 2012), which results in
communities paying a high price for energy, higher than most areas in the province (up

4
Figure 1. Location of electrical grids and remote communities dependent on diesel-generated electricity (Hydro One Networks Inc. 2013).

5
to $1.2/kWh) (Arriaga et al. 2013). In communities that are already burdened with few
employment opportunities and a plethora of socio-economic issues (Arriaga et al. 2013),
the high cost of fuel factors into the choices community members and their leadership
make in regards to the use of funding. In some instances, the lack of available energy
Figure 2. Location of provincial road networks including winter roads (Lemmen et al. 2008).
6
and price of fuel has inhibited communities from building additional housing or business
enterprises (Arriaga et al. 2013). Although the cost of electricity is less in rural
compared to remote communities, electrical heat is costly and can inhibit growth and
development of the communities.
ENVIRONMENTAL CONSIDERATIONS Diesel generators create carbon dioxide (CO2) and greenhouse gas (GHG)
emissions, posing a risk of contaminating soils and groundwater in the event of a spill or
leak (Neegan Burnside Ltd. 2004; Abbasi and Abbasi 2010; Arriaga et al. 2013; Arriaga
2015). Although the majority of these remote fly-in communities are low in population
(approximately 500 people in each community), and the emissions per community are
low when compared to other areas of the province with large commercial infrastructure,
when multiplying the emission levels and risk of spills by the 31 remote First Nations in
the Far North dependent on diesel-generated electricity, the risk and hazard to the
environment becomes more apparent (; Rice 2011; Statistics Canada 2011; Arriaga et al.
2013).
CURRENT SITUATION FACING FIRST NATIONS Historically, First Nation communities depended heavily on the forest to provide
food, medicines, shelter, security, and as a place to conduct ceremonies (Carlson and
Chetkiewicz 2012). With the establishment of the federal reserve system, families were
forced out of their homes in the woods and into small villages known as ‘reserves’
(Kinsella 2009; TRCC 2015:1). The subsequent establishment of Indian Residential
Schools forbade engaging in age-old traditions and cultural practices, such as hunting
and certain coming-of-age ceremonies (INAC 1991; Hurley and Wherret 2010; TRCC

7
2015:2). The establishment of the reserve system and the Indian Residential Schools
resulted in First Nations being disconnected from the traditional lands that had sustained
communities for centuries and losing their culture (Albert 2007; TRCC 2015). Present-
day impacts include poor socio-economic conditions on reserves, including high
unemployment rates (TRCC 2015:194), a loss of traditional knowledge and culture
(TRCC 2015:184), and a migration of educated youth to larger urban centers where
greater employment opportunities exist (TRCC 2015:193).
In recent years, some communities have begun to reassert their rights to access
and use traditional lands and to seek participation in current forest management planning
and harvesting (O’Flaherty et al. 2008). A greater say in forest management practices
has allowed communities to identify sacred sites that are not to be harvested, along with
traditional hunting and trapping grounds, and areas where plants or medicines are
collected amongst other considerations which must be addressed in forest management
plans (Burlando 2012). This allows First Nations to take advantage of economic
development opportunities and share some of the economic benefits that come with
forest management and can aid in improving socio-economic conditions (Treseder and
Krogman 1999). Although the current methods of including traditional ecological
knowledge or the desires of First Nations in forest management and development on
traditional lands is far from perfect, it is a step in the right direction. By managing local
forest resources to meet community heating needs, First Nations can begin to utilize the

8
natural resources in their traditional territories2 in a modern application.
In addition to the high cost of fuel, diesel shortages and brownouts can leave
communities without power for extended periods of time, often during the winter
months when low temperatures can be severe and there is an increased use in electrical
heating (Neegan Burnside Ltd. 2004; Giddings and Underwood 2007; Gerasimov et al.
2013). Proactive planning must be done in the event that the ice road season is shortened
due to changing climactic conditions (Newton et al. 2005; Golden et al. 2014) or a
winter season is prolonged resulting in prolonged use of electric heat and diesel fuel. In
the event of a fuel shortage, the community has no backup power generators, with the
exception of a few community buildings or homes with personal generators, and the
community can be without power for an extended time until fuel can be delivered.
When power is lost in these communities, there is often no alternative place to go
except to those commercial buildings with backup generators or individual fuel-oil
furnaces to provide heat. Even staying in other communities while the power is restarted
is difficult as accommodation for a large number of people often does not exist in remote
communities. It can also be difficult to find local skilled personnel to fix and repair the
generators when they break and to get replacement parts in a timely manner, as they too
would have to be flown in (Neegan Burnside Ltd. 2004).
Further complications arise when considering the provincial and federal
legislation which the First Nations and partners must adhere to when planning, operating
2 Traditional territory is an area that has been historically used and occupied, and continue to be used, by First Nations (see Thom (1999) for a discussion of the difference between Supreme Court of Canada definitions of traditional territory and First Nations self-definition).

9
and maintaining development projects, such as BDHP, and the associated use of lands
and resources (OMNR 2014b; AANDC 2015a). While it is a federal responsibility to
monitor actions on First Nations federal lands, provincial legislation governs the use of
lands and resources on the surrounding provincial Crown lands. It is this variation in
legal jurisdiction that makes planning for a BDHP on federal-reserve lands while using
provincial Crown resources complex (Natcher 2001; Wilson and Graham 2004; Miller
2011; Smith 2015).
There are a number of significant challenges to be addressed when assessing the
current electrical supply methods in remote areas, which can affect not only
environmental health, but also the health and wellbeing of community members. By
addressing these challenges, and exploring alternatives to supplement current electric
sources for heat and hot water, it is possible for communities to attain energy security
and encourage local economic development.
CONFEDERATION COLLEGE PROJECT OVERVIEW A pre-feasibility study conducted by Confederation College3 was designed to
assess forest resources and community energy use, community infrastructure, policy
requirements, emissions testing, engineering reports and cost estimations for one rural
and one remote First Nation community to develop a BDHP to provide heat and hot
water to the communities. This study is entitled “Biomass Heat as a Catalyst for
Community Development” (Miller 2015). Within this project, there are numerous other
3 Confederation College is a college of applied arts and technology located in Thunder Bay, Ontario. Confederation College has recently established the OPG BioEnergy Research and Learning Center and provides heat to its main campus through biomass heating using a 150 kW demonstration and research boiler.

10
studies which include an inventory of the energy use of the community and assessing
other alternative energy sources (i.e. wind and solar), to further offset diesel use, a cost-
benefit analysis using Renewable Energy Project Analysis Software (RETScreen) to
determine the overall cost, initial funding requirements, and total payback time for
alternative energy installments; an engineering report including a layout of the proposed
BDHP infrastructure including boilers, chip storage and water piping systems; an
Environmental and Regulatory Constraints Analysis which includes a review of the
policies which will be in affect when installing, operating and maintaining a BDHP
system; and an inventory of forest resources on the lands surrounding communities to
determine the amount of resources which can be utilized by the community for biomass
district heating.
The intent of the larger study is to contribute to sustainable economic growth in
northern communities while reducing the amount of atmospheric GHGs, CO2, air
emissions, and environmental contamination. The proposed BDHP and its associated
operations provide community benefits, including the development of a skilled
workforce that will provide opportunities for employment in areas with high
unemployment rates (Slack et al. 2003; Hall and Donald 2009) and the contribution to
the growing independence of First Nation communities by helping them to achieve
energy security (Albert 2007; Stupak et al. 2007; Arriaga et al. 2013). The research
project also provides an opportunity to document current energy policies and usage in
remote First Nations and identify factors that may limit the use of forest resources for
community heating needs.
The practical and applied information gathered from this research will contribute

11
to the small amount of research surrounding northern forests, including growth and yield
equations and thermal values of tree species mapping. Additionally, this information will
be utilized by the community in their community-based land use planning (C-bLUP)
process. By recognizing barriers, such as policies and regulations, lack of industrial
operations, and limited educated personnel to BDH development, it is possible to
identify avenues to overcome these barriers and encourage local economic development.
OVERVIEW OF THESIS RESEARCH This research project is a component of Confederation College’s prefeasibility
study. The research assessed the forest resources on the lands surrounding each
community and determined the stored thermal energy of wood as well as the sustainable
harvest volumes that are necessary to power a BDHP appropriate for the communities’
energy needs. The research is intended to provide an estimate of forest biomass volumes
on the surrounding land base, both reserve and Crown lands, but does not ensure that
these areas can be accessed by the community. To address this, a review of both
provincial and federal policies and scientific literature was conducted to identify the
potential legislative constraints, processes, and requirements to generate
recommendations for economic development projects.
The scope of this project will include the forest inventory and volume/energy
estimates, harvesting, planning and production requirements, and regulating policies
surrounding First Nations’ use of provincial Crown forests and federal reserve lands and
resources for biomass district heating. The data generated from this study will be in
compliance with the current Ontario Ministry of Natural Resources and Forestry
(OMNRF) forest management standards and the Crown Forest Sustainability Act

12
(CFSA) and is intended to be utilized by the communities to assist in decision making
and community planning processes. The constraints identified should assist both First
Nation communities and provincial policy makers with understanding the needs of all
parties involved when perusing economic development opportunities related to forest
resource use in rural and remote communities.
STATEMENT OF PURPOSE
The purpose of this study is to assist rural and remote communities in northern Ontario
to become more sustainable by identifying potential forest development opportunities to
utilize their natural resources for community heating needs. Specifically, the purpose of
this study is to assess one rural and one remote First Nation community’s natural
resources to determine whether or not sufficient woody biomass is present on the
surrounding land base to determine the annual harvest area (AHA) which can be
sustained in perpetuity to provide fuel for a BDHP. This may in turn stimulate
development in the local economy and contribute to energy security in remote and rural
areas of Ontario.
Objectives
The purpose of this research will be met by addressing the following research
objectives:
a. To develop a procedure for assessing a remote community’s forest
resources;
b. To determine the sustainable harvest levels in rural and remote
communities barring land access and policy considerations; and
c. To assess the biomass potential of the forest resources;

13
Research Questions and Null Hypotheses
In order to meet the objectives, the following thesis questions were addressed:
1. Is there a difference between the outcomes from forest inventory procedures provided
by the OMNRF and those executed in this study? Null Hypothesis: There is no
difference between the outcomes forest inventory procedures provided by the OMNRF
and those executed in this study.
2. Is there a difference between the forest resources available to the remote compared to
the rural First Nation community? Specifically, wood volumes and species composition
will be compared. Null Hypothesis: There is no difference between the forest resources
available to the remote and rural First Nation communities (volume, species diversity)
3. Is there a difference between the gross thermal thermal potential for tree species found
within the remote and rural communities? Null Hypothesis: There is no difference
between gross thermal thermal potential for tree species between remote and rural
communities.
4. Is there a difference in the selected wood properties of tree species measured in this
study compared to published values? Null Hypothesis: There is no difference in selected
wood properties of tree species measured in this study compared to published values.

14
CHAPTER 2: LITERATURE REVIEW
NATURAL RESOURCES IN RURAL AND REMOTE AREAS OF NORTHWESTERN ONTARIO
In Ontario, there are four distinct forest regions—the Carolinian (deciduous)
forests, the Great Lakes-St. Lawrence forests (GLSL), the boreal forest, and the Hudson
Bay Lowlands (Figure 3) (OMNR 2014c). Each forest region is characterised by
different tree species compositions. The majority of forest operations take place in the
boreal forest and the GLSL forests which occupy a combined total of approximately 64
million hectares (Perera et al. 2001: 30). The boreal forest is a zone which extends
circumpolar, with its southern boundary in Ontario beginning north of Lake Superior
and extending north to Hudson Bay and James Bay (Brandt 2009), encompassing
roughly 42% of Ontario’s land base (Carlson and Chetkiewicz 2012; Smith 2015). The
majority of rural and remote First Nations in Ontario are located within the Hudson Bay
Lowlands and the boreal forest of the Canadian Shield (Driben 1986; Carlson and
Chetkiewicz 2012). The boreal forest in Ontario is comprised of white and black spruce
(Picea glauca and Picea mariana respectively); trembling aspen (Populus tremuloides),
largetooth aspen (Populus
grandifolia); tamarack
(Larix laricina); white, red
and jack pine (Pinus
strobus, Pinus resinosa and
Pinus banksiana), and
cedar (Thuja occidentalis). Figure 3. Forest Regions of Ontario (OMNR 2014c).

15
The northern range of the boreal forest and Hudson Bay lowlands have
experienced little economic growth and development since the time of early settlers and
logging operations (Driben 1986; The Far North Science Advisory Panel 2010). The
boreal forest, subject to frequent fire and insect outbreaks, tends to naturally regenerate
itself approximately every 80 years (Ward and Mawdsley 2000; Krawchuk et al. 2012)
making it an ideal candidate for large-scale forest operations. However, because of its
northern location, the boreal forest tends to grow slower when compared to southern
locations (Krawchuk et al. 2012) and is viewed as ecologically sensitive due to the high
water levels in some regions, particularly in the Hudson Bay lowlands (OMNR 2009:
Krawchuk et al. 2012).
Forest resources is a blanket term to describe “a stock or supply” of natural
materials found in a forest (OMNR 2004). Forest resources encompass standing timber,
also known as merchantable timber, as well as woody by-products of harvesting or
milling, such as sawdust, slabs, and undesirable wood, and non-merchantable species,
including shrubs, saplings, seedlings, and woody vegetation (OMNR 2004; Puddister et
al. 2011). Forest resources in the past were primarily used to produce lumber and pulp
for commercial operations and firewood for local heating and cooking needs (Abbassi
and Abbassi 2010; Puddister et al. 2011). As technology advances and the number of
products produced from trees is expanding, there exists a greater opportunity to use
wood waste or manufacturing residues (Hesselink 2010). Biomass district heating can
provide an opportunity to redirect wood waste to be used for community heating needs.

16
What is Biomass?
BDHcan use a combination of wood from different sources once it is converted
into a usable form (Demirbas 2003). NRCan (2014) defines biomass as “a biological
material in solid, liquid or gaseous form that has stored sunlight in the form of chemical
energy.” This does not include coal or petroleum which has been converted over a long
period of time from an organic matter. For the purposes of this study, biomass will refer
to woody materials from forested lands. In industrial forest management, “merchantable
timber” refers to the stem/trunk of the tree that is then converted into lumber (OMNR
2009). The stem/trunk and tops, branches, and stumps of these trees, trees with
undesirable growth forms, as well as the non-merchantable shrub and tree species
account for above-ground biomass (Penner et al. 1997). Slabs, sawdust and other mill
residues can also contribute to the amount of available biomass if it is not already
utilized (Bradley 2006; NRCAN 2014). Proper integration of biomass harvesting
through agreements between mills and forest harvesting companies is essential for
communities utilizing BDH.
Biomass can also be obtained by meeting other forest management objectives,
such as the creation of fire breaks to prevent spread of wildfires, or the removal of dead,
dying and diseased trees (Neegan Burnside Ltd. 2004) which can prevent the spread of
insect outbreaks (Stupak et. al. 2009) and further reduce the down woody debris, which
can promote wildfire growth and spread (Johnson et al. 2015). Figure 4 presents various
sources of biomass, all of which can be sources of woody material for a BDHP if not
currently being allocated to local mills.

17
Communities and forest industries alike have yet to capture remaining biomass
from harvest or mill operations, barring the amount that is to be left on site for nutrient
cycling (Bradley 2010). Some mills, like the Resolute Forest Product pulp mill in
Thunder Bay, Ontario, utilize waste wood from their operations to supply their mills
with power and sell excess energy to the grid (Bradley 2010). However, this model is
not applied in many areas across Ontario. Although the use of beehive burners, like the
one in operation at the McKenzie Sawmill in Hudson, Ontario, has not been specifically
outlawed in Ontario, policies aimed at reducing air emissions and developing proper
waste management systems, in combination with an economic benefit to alternative
disposal methods, may contribute to the elimination of such beehive burners (Bradburn
2014).
Figure 4. Sources of Biomass (BIC 2014).

18
There exists an opportunity to capture and redirect the flow of waste wood from
sawmills and forest operations to biomass district heating plants and provide an
economic benefit/incentive. By capturing biomass from existing operations or as a
secondary output of meeting other forest management objectives, the need to harvest and
chip whole trees for use in a BDHP is reduced and can provide an opportunity for waste
management for industrial forest operations.
Can Biomass be Used and Produced Sustainably?
Biomass as a form of wood fuel was the primary fuel source across the globe
until the 19th century when fossils fuels became more widely used (Abbasi and Abbasi
2010). In developing countries, such as Brazil and India, biomass continues to be a
major source of energy (Lora and Andrade 2009; MNRE 2009; Abbasi and Abbasi
2010). In developed countries in Europe biomass is also utilized as wood pellets and in
Scandinavian and Nordic countries woody biomass is utilized for energy and heat
production (Gerasimov et al. 2013). As global climates are changing, there is increasing
interest in reducing the use of fossil fuels which emit CO2 which was stored millions of
years ago and contributes now to changing climates (Abbasi and Abbasi 2010).
According to the United Nations Framework Convention on Climate Change
(UNFCCC), biomass is considered renewable if it originate from forested lands and one
of the following conditions applies:
“(a) The land area remains a forest; and (b) Sustainable management practices are undertaken on these land areas to ensure, in particular, that the level of carbon stocks on these land areas does not systematically decrease over time (carbon stocks may temporarily decrease due to harvesting); and (c) Any national or regional forestry and nature conservation regulations are complied with.” (UNFCCC 2006).

19
Although the use of biomass as a fuel source has existed for centuries and continues to
play a role in energy production across the globe, questions remain whether or not it is
economical and sustainable.
The boreal forest is an ideal candidate for forest harvesting: the lifespan of
species ranges on average from 80-140 years, which can then be harvested every 80
years; the forest tends to uptake and store carbon until roughly 80 years when the stands
begin to degrade and decay, emitting carbon. The boreal forest is also subject to natural
stand-replacing disturbances (fire and insect infestation), which burn or decay, further
releasing carbon into the atmosphere (Johnson et al. 2015). Thus, if the boreal forest is
to play an important role in the storage of carbon and prevention of CO2 release,
harvesting and converting the wood into lumber or paper is a way to store carbon in the
long term (Pukkala 2014). On one hand, harvesting biomass for energy has many
benefits. It provides an avenue for harvest by-products and non-merchantable species or
wood forms that do not meet mill specifications (Dornburg and Faaij 2001; Demirbas
2005; Alam et al. 2008). Although it is important to leave some wood onsite for nutrient
cycling (Franklin et al. 2007), too much wood left on the forest floor can increase the
potential for wildfires (McCullough et al. 1998; Amiro et al. 2001) or the spread of
disease (McCullough et al. 1998), or make it difficult for species to regenerate
(McCullough et al. 1998; Franklin et al. 2007), which has potential to damage existing
and future stand development (Bonan and Shugart 1989).
Additionally, the amount of energy produced from harvest wastes can contribute
to energy production (Abbasi and Abbasi 2010), which has potential to offset the use of
fossil fuels. Because trees store carbon in the form of wood, the burning of biomass

20
emits the amount of carbon that has been stored, leading to a carbon-neutral source when
considering simply the act of burning the fuel (Abbasi and Abbasi 2010).
Comparatively, fossil fuels are emitting carbon that was stored millions of years ago
(Abbasi and Abbasi 2010). These fuels contain carbon stored many millennia ago
compared to forest biomass which stores carbon emitted in recent years. Fossil fuels are
a source of carbon and are adding to the amount of carbon in the atmosphere (Abbasi
and Abbasi 2010).
Focusing on the boreal forest of northwestern Ontario, there has been a recent
rise in pressure to preserve and conserve the boreal forest (Lintner 2014; Carlson et al.
2015). Harvesting biomass for the purpose of energy has raised concerns from
environmental groups, such as Greenpeace, who published a report which criticized the
use of biomass for the production of energy (Mainville 2011). The following section
describes the concerns raised about the use of biomass as an energy source.
Although biomass has been touted as a carbon neutral fuel (BC First Nations
Forestry Council 2008; Abbasi and Abbasi 2010), this conclusion does not take into
consideration the amount of carbon emitted through the transportation and harvesting of
biomass. Chippers, skidders, chainsaws and haul trucks utilize some form of fossil fuel
to operate and thus must be considered in calculating biomass’s carbon footprint
(McKendry 2002; Demirbas 2003). Although the procurement and production of
biomass can provide jobs in rural and remote communities, the use of heavy machinery
can lead to an increase in occupational health and safety issues (Albert 2007; Abbasi and
Abbassi 2010). This is particularly problematic in areas where access to health providers
and emergency services are limited.
21
Further, Abbasi and Abbasi (2010) noted that biomass may be a carbon-neutral
source but is not nutrient-neutral. Some amount of biomass must be left on-site to
contribute to nutrient cycling, which provides nutrients for future stands (Rowe et al.
2009). Stupak et al. (2009) suggest that the amount of nutrients left on site after a
harvest operation roughly corresponds to the nutrient content of foliage from trees
removed from the site.
Although harvesting biomass for local use in remote First Nation communities
can support local employment and reduce diesel consumption, it also increases the
likelihood of local environmental impacts. Rowe et al. (2009) also found that
ecosystems, habitats, and human livelihood (e.g. trapping) are at risk when introducing
harvest activities. Abbasi and Abbassi (2010) noted that there is a challenge to extract
energy in a clean and cost-effective manner; a challenge that has not yet been addressed,
particularly in northwestern Ontario.
However, biomass district heating has proved to be successful in Sweden,
Finland, Denmark, and various other places in Europe, including remote communities in
the British Isles, Lithuania, and Latvia (Eriksson et al. 2007; Giddings and Underwood
2007; Lund et al. 2009; Rezaie and Rosen 2012; Gerasimov et al. 2013) . A combination
of a smaller land base (Giddings and Underwood 2007; Gustavsson et al. 2011) which
lends to shorter transport distances, and the higher cost of fossil fuels (Gustavsson et al.
2011) can lead to district heating being a feasible option for meeting community heating
needs.
22
Biomass to Offset Electrical Consumption
As countries across the globe sign on to global commitments or adopt their own
strategy aimed at reducing GHGs, Canada and its provinces are beginning to develop
their own policies, which contribute to the reduction of CO2 and GHG emissions. In
Ontario, Canada, the provincial government has put in place a piece of legislation
entitled The Green Energy Act (2009), that expresses a commitment to eliminating coal
power and converting to renewable energy sources, such as wind, solar, hydro, nuclear
and biomass. As a result of the Act, Ontario is supporting the generation of electricity
through nuclear, solar, wind, and biomass, entirely eliminating coal-fired plants (Gross
2014).
In April 2013, the conversion of the Atikokan Generating Station from a coal-
fired plant to a biomass plant marked the beginning of large-scale biomass electricity
production in Ontario (Albert 2007; Alam et al. 2008; Alam et al. 2012). Other attempts
at biomass district heating in northwestern Ontario have occurred in Geraldton and
Grassy Narrows First Nation but an insufficient wood supply, closure of nearby mills,
and other factors, led to the decline and eventual shut down of these plants (McCallum
1998).
Despite provincial legislation aimed at reducing CO2 emissions, GHGs, and
utilizing alternative energy sources, the Act does not cover the remote regions of Ontario
where small, remote Aboriginal communities exist. Currently, there are no plans in place
to remove diesel generators from remote First Nations (HORCI 2012) in favour of a
more sustainable, less polluting and less expensive energy source, and remote

23
communities have yet to benefit from clean energy legislation.
In July 2015, a Pan-Canadian Task Force was established in response to the
Canadian Energy Strategy was introduced which aims to improve the production,
transportation, and regulation of energy use in Canada (Council of the Federation
2015Council of the Federation 2015: 4) through collaboration with industries,
researchers, Aboriginal communities and governments on projects which address social
and ecological concerns (Council of the Federation 2015: 1). Further, the Strategy aims
to provide energy security and contribute to economic growth while maintaining a high
standard of social and environmental responsibility (Council of the Federation 2015: 4).
The Strategy has ten areas of focus, with a number of goals and corresponding actions
which will contribute to meeting the goals (Council of the Federation 2015: 8). The
Strategy also identifies off-grid communities as a priority (Council of the Federation
2015:24; Francoeur 2015). The Pan-Canadian Task Force is composed of representatives
from the governments of Ontario, Quebec, Newfoundland and Labrador, Manitoba,
Yukon and the Northwest Territories whose purpose is to reduce the use of diesel in the
creation of electricity in remote communities (Francoeur 2015; Council of the
Federation 2015; Brody 2015).
Although the interests of provincial governments in reducing diesel use in remote
communities is timely and well-intended, there have been mixed reactions from
Nishnawbe Aski Nation (NAN) (Brody 2015). NAN has been trying to address the
issues of diesel-generated electricity in the 23 remote NAN First Nations for decades
and the proposed round table discussion with the Chiefs of Ontario First Nations and the
Government of Ontario ignored NAN’s request for a separate negotiating table (Brody
24
2015). Further, NAN communities, government, and Wataynikaneyap Power, a
company owned by 20 First Nations which has been attempting to connect remote
communities to the electrical grid and to reduce diesel use in these communities, do not
wish to see their progress stifled by provincial negotiations and discussions (Brody
2015) though they support the initiative (Boileau 2015).
Hydro One and the IESO are responsible for the creation and delivery of energy
in this region and have developed some programs aimed at promoting the use of
renewable energy (HORCI 2012) but these programs have yet to be utilized to their
fullest potential. Aboriginal Affairs and Northern Development Canada (AANDC) is a
department of the federal government that is responsible for ensuring that the obligations
of the Canadian government to First Nations are met (AANDC 2015a). Their mandate is
to “improve social well-being and economic prosperity; develop healthier, more
sustainable communities; and participate more fully in Canada’s political, social and
economic development—“to the benefit of all Canadians” (AANDC 2015a). There exist
programs within AANDC, such as the ecoENERGY for Aboriginal and Northern
Communities Program (EANCP), which are able to provide funding to northern
Aboriginal communities for renewable energy projects (AANDC 2015b). This may be
viewed as a shift in perspectives around the use of biomass for heat and electrical
generation in recent years (Abbasi and Abbasi 2010).
25
BIOMASS DISTRICT HEATING In order for Ontario and Canada to fully take advantage of their natural forest
resources for biomass heat and energy production, other northern countries with remote
communities in Europe can serve as examples. In Scandinavian (Norway and Sweden)
and Nordic (Finland) countries, there has been a rise in use of biomass in combined heat
and power (CHP) plants or in district heating systems (Stupak 2007) as can be seen in
Figure 5 (BIC 2014). An example of a BDH configuration is seen in Figure 6. These
countries also have numerous rural and remote communities, many of which are using
some sort of bioenergy facility to create energy locally as there is a great focus on
promoting the use of technology and locally available resources to provide alternative
sources of energy (Stupak 2007). A combination of strong policy, research and
development, a lack of local traditional fuel sources (oil and gas), heavily-taxed foreign
imported fuels, and a plentiful supply of fibre has led to alternative energy becoming a
more viable option (Gerasimov et al. 2013). For example, Sweden, Denmark, and
Finland have utilized district heating for many decades and have recently seen an
increase in the use of biomass for district heating or CHP generation (Stupak et al. 2007;
Giddings and Underwood 2007; Verkerk et al. 2011; Rezaie and Rosen 2012). By
improving energy policies, particularly those around the importing and use of small (<3
megawatt (MW)) biomass boilers in Canada and Ontario, the province and the nation
can begin to adopt European technologies for alternative energy generation in remote
areas.

26
Figure 6. Location of BDHP in Finland (BIC 2014).
Figure 5. Example of BDHP configuration (BIC 2014).

27
In order to plan for a community BDHP project, it is important to consider the
energy demand of a community, particularly around the use of heat and hot water, and
the amount of forest resources available for BDH use (Thompson et al. 2007). This
technology can be used as a short-term solution while future alternative energy
generation technology can be researched, planned, and installed at a later date. BDH can
use a combination of wood from different sources to be burned in a boiler contained
within a district heating plant.
It is imperative that the forest resources be converted to a usable form, whether it
is wood pellets or wood chips at specific moisture content (Rentizelas et al. 2009). The
mix of tree species is also important as it directly relates to the available thermal energy
and ash content (Öhman et al. 2002; Baxter 1993; Jamies et al. 2012) which factors into
the amount of forest resources needed to operate a BDHP.
In order for a BDHP to operate efficiently, it is important to have the necessary
physical infrastructure and human capacity. Necessary infrastructure includes the BDHP
itself, along with the equipment required to harvest, haul, chip (or grind), dry, and store
the fuel as chips or as pellets. Specifically, this includes: harvesting equipment, whether
it is a chainsaw, feller buncher or processing head; hauling equipment, such as a skidder
or forwarder, and a hauling truck; a chipper, either portable or on site; and a storage
bunker for the fuel (McKendry 2002; Rentizelas et al. 2009). Community members
trained in operating the above equipment is also a very important aspect of a successful
community operation (Community Energy Association 2013; Council of the Federation
2015). This is especially important in remote areas where supplies and replacement
equipment are not easily acquired. For example, if a chip hauling truck falls into

28
disrepair, it may be many months before the winter road system is usable and a new
truck brought in. Not only would this be costly, it would delay harvest and production,
which may lead to fuel shortages (McCallum 2010).
There are numerous examples of successful biomass district heating operations
in Europe and in Canada. Prince Edward Island (PEI), Quebec, Alberta, British
Columbia (BC), Yukon and Northwest Territories (NWT) have BDHP operations
(Neegan Burnside Ltd. 2004; Biomass Energy Resource Center 2009; McCallum 2010;
Germain 2013).
Madlener (2007) describes the various BDH operations in Austria, stating that
over 800 BDH plants were in operation by the end of 2003, mainly using wood residues
from forest operations or sawmill residues and some agricultural waste such as straw
(Stockinger and Obernberger 2014). Over time improvements in the planning and design
processes came as a result of the enhanced technical and economic efficiency
requirements from funding agencies and authorities (Madlener 2007; Stockinger and
Obernberger 2014). The use of BDH systems began in rural Austrian communities in the
mid-1980’s as a result of local initiatives and public policy to support the farming and
forestry sector (Madlener 2007; Stockinger and Obernberger 2014). McCallum 2010
notes that BDHP started in Finland in the 1950’s and has had numerous successes over
the years owing to the reliable and environmentally friendly method of heating,
especially in densely populated areas. He also notes that there have been recent
programs with aggressive strategies to meet Kyoto Protocol targets and numerous policy
frameworks have been developed to support the growth and development of biomass
energy in Scandinavia and Europe (Madlener 2007; McCallum 2010).

29
Charlottetown, PEI, established a district energy system in 1986 following the
construction of a district heating plant in 1980 and a district heating network at the
University of Prince Edward Island in 1986 (Biomass Energy Resource Center 2009;
McCallum 2010). Eventually the systems were consolidated into a larger network.
Currently, the operation has 33 employees and roughly six that work in wood chip
production (McCallum 2010). The system now includes a CHP plant which provides
energy as well as heat and utilizes mainly municipal solid waste, waste wood from
forestry operations and oil as a backup or during high peak times (Biomass Energy
Resource Center 2009).
Strathcona County, AB, installed a biomass district heating system in 2006 to
heat community buildings (Germain 2013). The community heating system utilizes
mainly waste wood from nearby North Star Pellets and some agricultural feedstocks
(QUEST Canada and CABREE 2012; Germain 2013). The project aims to utilize local
renewable fuel sources, reduce CO2 emissions and dependency on fossil fuels, while
contributing to sustainable development (Germain 2013). A business case study found
that both CHP and BDHP were feasible, but CHP was not plausible due to provincial
regulations which prevented the CHP plant from being connected to the electrical grid
(QUEST Canada and CABREE 2012) and the requirement for a more extensive
environmental assessment at the expense of the community (QUEST Canada and
CABREE 2012). The regulations regarding power distribution have since changed with
the introduction of the Micro-Generation Regulation 2008 which would make CHP
feasible (Electric Utilities Act 2008). However, further research into the identification of
potential customers would be required for a business study (QUEST Canada and

30
CABREE 2012).
In BC, the town of Revelstoke and the Dockside Green harbourfront community
in Victoria have installed BDH operations. It was noted that plans for CHP systems were
rejected in favour of smaller, heat-only operations which did not require a stationary
engineer thus reducing the cost of operations (McCallum 2010). Both systems utilize
waste wood from harvest operations.
Further north in Canada, the community of Yellowknife,NWT, installed a district
heating plant to heat its community pool, curling rink, and area; its primary fuel source
is wood pellets (McCallum 2010). Kluane First Nation in the Yukon installed a BDH
system in 1998 to reduce their dependency on outside fuel sources (Neegan Burnside
2004). Wood chips are the fuel for the system and are harvested from First Nations land
damaged by a forest fire leaving dead standing trees which provides a good fuel source
(Neegan Burnside 2004). Benefits to using BDH in the community include savings in
the operating budget, as well as a decrease reliance on fuel suppliers, less planning for
fluctuating fuel prices, stimulation of local economy, and the creation of local
employment (Neegan Burnside 2004).
One successful example of BDH in a First Nation in Canada is in Oujé-
bougoumou, Quebec (Figure 7), touted as the most successful example of BDH in
Canada (McCallum 2010). After the community received a large land claim settlement
in 1990, they decided to build a new town complete with a district heating system, which
serviced the entire community (McCallum 2010). As the town grew, so did the BDHP
and a second boiler was installed to meet the community’s energy demands. The
biomass is sourced from a nearby mill in the form of sawdust, slabs, and lumber ends

31
(Neegan Burnside 2004; McCallum 2010). The success of this project can be attributed
to a number of actions and planning that ensured smooth operations: a good relationship
between engineering consultants and the community who provided training in operating
the system; reference manuals complete with detailed maintenance schedules; the
Figure 7. Location of Oujé-bougoumou in Quebec (Wikipedia 2015 [edited]).

32
consultant provided recommendations that the BDHP have spare parts on hand so that in
the event of a part failure, the system will not be down for a long period of time; and a
local source of biomass (McCallum 2010). Though the community uses sawdust from a
nearby mill, it is acknowledged that not all communities have access to nearby mills to
capture waste, it is possible for other communities to use locally-created wood chips,
which would in turn create more jobs (McCallum 2010). The use of BDH in Oujé-
bougoumou can serve as a model for other rural or remote communities in Canada
(McCallum2010).
One First Nation in Ontario that has attempted BDH is Grassy Narrows. In 1997,
Grassy Narrows First Nation installed a BDHP, which served the core commercial area
of the community which included the school, day care centre, administration building,
community hall, and roughly 30% of the residences in the core area (Neegan Burnside
Ltd. 2004). When the project began, the community had its own wood chipping
operation to supply biomass to the BDHP, which provided a higher quality fuel but
proved not to be cost-effective due to transport and shipping costs (Neegan Burnside
Ltd. 2004). The community then switched to utilizing waste wood from a local sawmill
in Kenora, Ontario, which was available for the cost of trucking and loading. In 2004,
the cost of sawmill waste was anticipated to increase as the demand for waste was
increasing, so the community began seeking alternate fuel sources. Then the Abitibi
Consolidated Kenora mill was shut down in 2005 (Fort Frances Times 2005) and
without an alternate fuel source, the BDHP was eventually closed.

33
Calculating Annual Harvest Area
In order to determine how much wood can be harvested on an annual basis for
use in a BDHP, it is important to understand what is considered an Annual Harvest Area
(AHA) and how these volumes are calculated. In short, the AHA is the calculation for
the rate of harvest primarily used in managed forests that describes the volume of wood
which can be harvested in a given year while leaving enough volume (stems) to allow
the forest to grow in a manner which can be harvested again in the future with similar
volumes (Ford-Robertson 1971; Vanclay 2014). Calculation of the AHA is based on
three factors: the standing volume of timber, the growth rate of the forest, and the size of
the forest operation (Higman et al. 2013). Where growth and yield information are
incomplete or unreliable, conservative levels of harvest must be used to avoid over
harvesting (Higman et al. 2013). Harvest levels must not exceed the natural reproductive
capacity of the forest if harvesting is to be sustainable (Abbasi and Abbasi 2010). In
Ontario, the AHA is calculated for the province as a whole, and the harvest volume is
distributed amongst its forest management units (FMUs) (OMNR 2009).
Available Wood Supply and Supply Chain Management
In order to plan for a BDHP operation, it is necessary to establish not only the
available wood supply, but also a wood supply chain. An efficient wood supply chain
can assist in achieving the maximum value for the product, or benefit to society, without
jeopardizing future values and benefits (Pulkki 2001). A wood supply chain consists of a
few necessary components: forest land owner/manager; wood procurer, and end user
(McLure 2009). Additionally, the supply chain often includes loggers or wood
harvesters, trucking firms, forestry consulting firms, and government bodies to oversee

34
operations (McLure 2009).
For a biomass harvest operation, it may be possible to integrate into existing
forest operations whereby biomass is harvested as a byproduct or gathered as a waste
product from mills (Neegan Burnside Ltd. 2004; Bradley 2006; McCallum 2010;
NRCAN 2014; Sacchelli et al. 2013). The two operations could exist concurrently where
the merchantable timber is harvested and hauled to a mill, and the tops, branches, and
non-merchantable or undesirable species can be chipped and hauled to a BDH facility
(Sacchelli et al. 2013) as depicted in Figure 8. Figure 9 depicts an additional opportunity
to capture mill waste, such as slabs and sawdust, which can further add to the wood
supply for BDH (BIC 2014). It is necessary to ensure that all pieces of the supply chain
are acting simultaneously to ensure efficient transport of material and products
(Rentizelas et al. 2009) while maintaining ecological integrity (Puttock et al. 1998).
There current forest operations do not exist, as would be the case for remote
communities, establishing a wood supply chain can be a challenge. The volume of
standing wood within a reasonable haul distance from the community and the amount of
area which has potential to be considered for harvest must first be determined (Arriaga
et al. 2013). From this volume, certain areas and subsequent volumes must be subtracted
as they represent inoperable areas or ecologically sensitive areas (OMNR 2009). These
can include buffer zones around spawning areas and water bodies, trap lines and cabins,
known nesting or denning areas, environmental considerations such as pine marten
(Martes americana) habitat and caribou (Rangifer tarandus) migration corridors, and
protected areas such as sites of spiritual significance (OMNR 2009). Inoperable areas

35
Figure 9. Integrated wood supply chain demonstrating use of harvest residues (Sacchelli et al. 2013).
Figure 8. Integrated wood supply chain demonstrating use of by-products for biomass energy use (BIC 2014).
36
include areas on steep slopes or are inaccessible, such as bogs and wetlands (OMNR
2009). In industrial forest management zones, areas affected by insect or fire are
generally removed from the wood supply.
When establishing a biomass wood supply, these areas can be included in AHA
calculations as they can provide fibre/biomass for a BDH operation if there is no serious
degradation to the wood’s thermal properties (Leckie and Gillis 1995; Neegan Burnside
Ltd. 2004; Gautam et al. 2010; Hosegood et al. 2011). Once the total area and associated
volumes are removed from the total, it is possible to then determine the volume which
can be harvested annually on a sustainable basis taking into consideration the amount of
time it would take for a stand to regrow (OMNR 2009).
Given that community members in remote communities have training and
experience in winter road construction, it would be ideal to develop a winter road
network for harvesting during winter months when wetlands are frozen and roads could
be developed through these areas with less environmental damage compared to the
construction of all-season roads (Pulkki 2003). Further opportunities exist in managing
stands to improve forest health by removing the dead, dying and diseased trees from a
forest to allow for the growth of a healthier and more productive forest stand (Madlener
2007; Hosegood et al. 2011). These considerations must be taken into account when
planning for biomass harvests, particularly in remote areas where access is limited and
forest management for health and community is uncommon, yet remains a viable
possibility for accessing biomass.

37
Units of Measure
In order to accurately and consistently measure wood and account for the
variation in results, the basis on which wood is dried to must be known. Wood can have
differing moisture levels including air dry,oven dry, and green, while tests for wood
density and moisture are determined on either a wet basis or dry basis. Air dry biomas
refers to the condition of the wood after being harvested and exposed to local
atmospheric conditions for a period of time (Rosillo-Calle et al. 2015: 282). When
density is calculated using air-dry wood, it is “based on the weight and volume of wood
in equilibrium with the atmospheric conditions” and may contain between 8%-12%
moisture on a dry basis (Rosillo-Calle et al. 2015: 282). Oven dried wood is obtained by
placing the wood in a ventilated oven that is heated above the boiling temperature of
water so that all moisture is removed from the sample, achieving 0% moisture content
(Rosillo-Calle et al. 2015: 288). Green wood refers to trees that have been recently felled
or harvested and has not undergone prolonged exposure to local climatic conditions and
generally contains 30-35% moisture on a dry basis Rosillo-Calle et al. 2015: 280). The
difference between moisture content calculated on a dry basis compared to a wet basis is
how the water weight is expressed as a percentage of the total weight. When using a wet
basis, the water weight is expressed as a “percentage of the sum of the weight of the
water ash, and dry-and-ash-free matter” (Quack et al. 1999: 3). When calculating
moisture content on a dry basis, the water weight is expressed “as a percentage of the
dry-and-ash-free matter” (Quack et al. 1999: 3). It is important to identify the basis on
which moisture content is measured (Quack et al. 1999: 3) because “the energy value of
38
a unit of woody biomass is inversely proportional to the amount of water it contains”
(Rosillo-Calle et al. 2015: 53).
While this study utilizes the units of megajoules per kilogram (MJ/kg), it is
important to note that thermal potential can be described using other units, and that
biomass products such as wood pellets or chips can be sold in different units such as
gigajoules per kilogram (GJ/kg) or British thermal units (BTU).
Wood Density
When evaluating individual species for their value and potential for generating
heat, it is important to consider the density of the wood as “both the calorific value and
density depend mainly on the moisture of the [wood]” (Ragland et al. 1991). In short,
the more water per unit of wood weight, the less wood (fuel) present (FAO 2004). The
wood density is relevant to the combustion process as well, particularly the particle
density and the bulk density (Kanury1994; Demirbas 2003). The particle density can be
defined as the density of the material itself whereas bulk density refers the ratio of dry
material to the bulk volume (Ragland et al. 1991). This is important for transportation
and storage logistics (FAO 2004).
Density is also dependent on specific gravity and moisture content (MC)
(Simpson 1993). When the maximum MC is reached, the cell walls and lumen are filled
with water; when the specific gravity of the wood is high, the volume of the lumen is
low, there is less space in the wood for water to fill, thus MC is restricted by the space
available (Simpson 1993). Sandström et al. (2007) found that disease and rot can lead to
a decrease in density which increases the potential for higher moisture content, decreases
the thermal value, and increases ash content.

39
Moisture Content of Wood
When determining how much wood is needed for a community heating project, it
is also important to consider the MC of wood. Ultimately, moisture content will affect
the energy content of the wood, how well the fuel burns, and the amount of ash
remaining after the fuel has been burned (Jenkins et al. 1998). Simpson and TenWolde
(1999) state that MC can range between 30% to >200% of the dry-basis weight of wood
in trees. Softwoods generally have a greater MC in the sapwood compared to heartwood,
while MC in the heartwood and sapwood of hardwood trees is dependent on species
(Simpson and TenWolde 1999). However, wood is not separated by heartwood and
sapwood when harvested; thus the overall moisture content is most important.
The winter would be the ideal time to harvest (Pulkki 2003) as the lower
moisture content would decrease the drying time and fewer nutrients in the wood would
reduce the ash content (Jenkins et al. 1998). Drying or seasoning of the wood fuel can
take place in several ways: woody biomass can be piled and tarped to prevent dirt from
entering as this would increase the ash content increase the speed of drying, and prevent
an increase in MC from precipitation (Walki n.d; Fuller 1985; Gustavsso et al. 2011);
woody biomass can also be piled at roadside, or nearby the chipping operation or storage
bunker to be seasoned (Rentizelas et al. 2009). Wood dried to the specified MC can then
be stored in a bunker to maintain MC over time before use in a BDHP. Overall, it is
important to have dry wood for optimal efficiency of the BDHP boiler system.
Thermal Potential of Wood
If the purpose of calculating annual harvest volumes is to provide a sufficient
fuel source to produce heat in a BDHP, it is important to have an understanding of the

40
thermal potential of the wood. The thermal potential combined with the ash content will
assist in determining the optimal species mix for the fuel source (Demirbas 2003).
Ragland et al.(1991) stated that: “Specific heat depends on temperature and moisture
content but not on density or species”.
Knowing the density of wood, it’s MC and ash content can inform decisions
made as to the ideal fuel source. As an example, a species with a low thermal potential
and high ash content, compared to that of a high thermal potential and low ash content,
would not be ideal as the amount of energy produced from a cubic meter of the former
would be less than the latter (Asikainen et al. 2011) and would require a more frequent
removal of ashes from the boiler system. In order to reduce the harvest volumes and
frequency of ash disposal, it would be ideal to harvest those species with a higher
thermal potential and lower ash content (Demirbas 2003). Hakkila (1989) points out that
average ash content of bark is 2.97%, while stem wood generally has 0.3±0.1% ash
content for softwoods and 0.5±0.3% for hardwoods. If the intent is to use harvest residue
in a district heating operation, then wood ash may be an issue. When planning for
community heating projects, it is important to consider not only the volume of wood
available, but also, and more importantly, the amount of energy per unit of wood
available for use.
Ash Content of Wood
Another important factor to consider when determining an ideal fuel source is the
amount of ash remaining after the fuel has been burned. After burning wood, the
remaining ash is indicative of minerals present in the wood (Demeyer et al. 2001), as
well as any debris that was deposited on the wood during transport or removal such as

41
dirt. Ash can create a problem in a BDHP as it deposits “on heat transfer surfaces [of
the] boilers and on [the] internal surfaces of gasifiers” (Baxter 1993; Misra et al. 1993;
Demirbas 2005), which can impact how efficiently the boilers burn the fuel. Ash has
also been shown to degrade the metal internal components of boiler systems (Öhman et
al. 2004).
Wood ash has been demonstrated to be effective in potash production, which can
be utilized in agricultural practices (Misra et al. 1993) or when applied to soils where
harvesting has recently occurred as a way to replace nutrients and elements removed
from the soils (Demeyer et al. 2001). However, in Ontario it is currently considered to
be a non-hazardous industrial waste product (Environmental Protection Act 1999) and
can be disposed of in a landfill. Questions remain about the longevity of the existing
landfill sites in communities and whether or not they are able to handle the additional
waste generated from a BDHP and whether or not this would negatively affect the site’s
capacity (Demeyer et al. 2001; Jamies et al. 2012).
There are a number of potential uses for ash from boilers: as a liming agent for
roads or as a replacement for cement in concrete (Abdullahi 2006); spread in the forest
as a fertilizer (James et al. 2012, Demeyer et al. 2001); or in gardens as a fertilizer
(Naylor and Schmidt 1986; Pitman 2005). Stupak et al. (2007) advise that tops,
branches, and rotten wood be used for energy purposes as a supplement to the use of
clean bole wood because of the increased percentage of ash as a result of using branches,
tops and rotten wood. Regardless of how the ash is disposed, there exists a potential for
it to pose a problem which must be considered when planning for biomass district
heating in rural and remote communities.

42
FIRST NATION ACCESS TO TIMBER ON PROVINCIAL CROWN LAND AND FEDERAL RESERVE LANDS
In order for communities to access the surrounding natural resources for their use,
it is imperative to understand the policies that affect resource use and how they may
constrain the use of a particular resource. The barriers that policy presents can be further
exaggerated given the different jurisdiction of the lands and resources—under Canada’s
Constitution Act, 1982 “Indians, and Lands reserved for the Indians” are the
responsibility of the federal government (Constitution Act 1982. 91(24)) while forest
resources are a provincial responsibility (Constitution Act 1982 s. 92A). In certain cases,
such as the Treaty 9 area, the province of Ontario is a signatory to the Treaty and thus
has certain responsibilities (Smith 2015), which can add further complications. The
following section aims to illustrate the current policies in place, which may help or
hinder a community that is seeking access to natural resources, particularly on traditional
lands.
Canadian forest/land management policies have not historically favoured First
Nation communities in the past, particularly in natural resources management. This
exclusion has resulted in systemic poverty and the loss of traditional livelihoods and
knowledge in land management (TRCC 2015), creating a divide between policy makers
and the people whom those policies affect (Miller 2011; Hunt and Haider 2011, Gardner
et al. 2012). Finding a balance between provincial policies, federal treaties, and First
Nations’ traditional inherent rights makes land use planning in northern areas complex.
A combination of Crown land and reserve land with different laws and jurisdictions,
which apply to different areas and resources (Hurley and Wherret 2000; Smith 2015),
combined with a difficult historical relationship, makes collaborative planning for future

43
land use difficult.
Despite a low population density (Slack et al. 2003; Hall and Donald 2009), the
boreal forest area is home to approximately 70 First Nations communities consisting of
members from four Treaty areas—Robinson-Superior Treaty (1950), Treaty 3 (1873),
Treaty 5 (1875) , and Treaty 9 (1905-06; 1929-30) (OMNDM 2014; NAN 2015). A map
of Treaty areas in Canada can be seen in Figure 10.
In spite of the treaty rights that guaranteed First Nations continued use of their
territories for traditional purposes, Ontario often ignores those rights in their imposition
of provincial regulations on First Nations on provincial Crown lands. In the Treaty #3
area, which is in the Area of the Undertaking (AOU), the zone of active forest
management in Ontario (NAFA 2015: 17), First Nations are subject to provincial forest
management regulations (Brailsford 2011). In the Treaty 5 and 9 areas, the Far North
Act (2010) applies. In short, the Far North Act states that development in the region
Figure 10. Numbered treaties in Canada (OMOE 2011).

44
cannot take place until a C-bLUP is in place (The Far North Science Advisory Panel
2010). The Act aims to provide a planning process whereby First Nations and the
province of Ontario can collaborate on projects while meeting the social, economic, and
environmental objectives described by the parties (The Far North Science Advisory
Panel 2010). The question of the application of provincial regulations to First Nations,
described as “interjurisdictional immunity”, is an unresolved issue that is being worked
out in the courts (Mackenzie 2013).
The focus on the boreal forests of Canada as an ecologically important area has
been a recent development (Lintner 2014; Smith 2015). Attention has turned to the
boreal forest as conservation groups have declared the northern forests of Canada “the
world’s largest ecologically intact area of boreal forest” (Lintner 2014), with the goal to
protect a large expanse of the area. In the 1990’s continuing to present day,
environmental organizations, forest industry partners and governments have negotiated
the continued protection and development of the boreal forest (Cartwright 2003; Youden
2010; Burlando 2012; Smith 2015), resulting in a series of policies aimed at doing so.
What failed to happen in these discussions was consultation with First Nations peoples
and local communities residing in the area of interest (NAN 2010). As a result of
exclusion from the policy development process, NAN (2010) has stated that the
legislation does not adequately accommodate the communities under its jurisdiction, nor
does it encompass First Nation values and traditional knowledge or provide sufficient
opportunities for First Nation involvement (NAN 2010; Youden 2010; Gardner et al.
2012; Smith 2015).
Treaties, the Indian Act, and Supreme Court Decisions

45
In recent years, the Supreme Court of Canada has come out with a series of
decisions which affect land management and the relationship between the federal and
provincial governments and Aboriginal peoples, primarily with the acknowledgement
that the Crown (both provincial and federal governments) has a fiduciary responsibility
to protect the rights of First Nations and act in their best interest (Hurley and Wherret
2000; Smith 2015). The origin of this responsibility is outlined in the original treaties,
the Indian Act (1876), and the British North America Act (1876) (BNA). Notably, the
BNA in Section 91(24) and Section 92, describes the responsibility of the federal
government for “Indians and lands reserved for the Indians” in the former, while
delegating responsibilities of lands and resources within provincial boundaries to the
respective provinces in the latter (British North America Act 1867; Indian Act 1985;
Smith 2015). Smith (2015) stated “how to reconcile Crown-Aboriginal interests in
natural resources remains one of the most pressing issues faced by Canadians”.
The treaties provide further discrepancies in the requirements and responsibilities
of federal and provincial governments. It has become common knowledge that the spirit
and intent of the treaties as understood by First Nations is much different than the
written text recorded by the Crown (TRCC 2015).
The federal Indian Act (1876) and its regulations (Indian timber Harvesting
Regulations 1954; Indian Timber Regulations 1954) define who is an “Indian” and a
“Band” and sets out the rules for governance on reserve lands. Essentially, the Indian
Act governs matters pertaining to Indian status, bands, and Indian reserves (Hanson
n.d.). The regulations covering the use of forest resources on reserve land include the
Indian Timber Regulations and the Indian Timber Harvest Regulations. Section 93

46
(93.a.i) of the Indian Act (1876 or 1985) states that permission must be obtained by the
Minister or another authorized representative before any harvesting can occur on reserve
land.
The Indian Timber Regulations (C.R.C., c.961) and The Indian Timber Harvest
Regulations (SOR/2002-109) are further regulations made under the Indian Act that
describe the laws and regulations surrounding timber harvest on reserve land. Numerous
costs and permitting regulations are spelled out under these two regulations, which, if
not adhered to, can restrict or limit future development in the community.
The Indian Timber Regulations (ITR) discuss the requirements for permitting
and approval, associated charges and fees, as well as the methods of acquiring a licence,
scaling requirements, record keeping, and any consequences should the regulations not
be adhered to (Indian Act 1985). Under the ITR, it is unlawful to cut timber on reserve
lands without a license or permit from the federal Minister of Aboriginal Affairs and
Northern Development Canada. Permits may be issued to community members to cut
timber or fuelwood for personal use, or to a band for band purposes, free of charge
(Indian Timber Regulations 1954). However, if the wood is to be sold, consent must be
first issued from the Band/Chief and Council through a Band Council Resolution, and
the Minister then administers a licence for harvest and sale (Indian Timber Regulations
1954). Dues can be reduced to half of the prevailing rate of stumpage by the Minister
(Indian Timber Regulations 1954). If the operation is a medium- to large-scale project
(“dues payable pursuant to a licence will exceed $2500”), the federal Minister reserves
the right to invite tenders for the licence by means of public advertisement (Indian
Timber Regulations 1954). This means that the community may not win the bid to

47
harvest their lands should another company outbid their tender on medium- to large-
scale harvest operations.
On one hand, the regulations prevent communities from overharvesting, or any
kind of harvesting, until a plan is in place and it is approved. On the other, it does not
allow for communities to have autonomy over their resources (Westman 2005).
Westman (2005) critiques the management of First Nation reserve land by the federal
government through the Indian act, stating that it “does not adequately incorporate
contemporary resource management concerns relating to environmental sustability,
mixed-use, Aboriginal values or equitable distribution of forest rents.” (Westman 2005).
Further, he states that AANDC “does not consistently enforce the act and regulations,
does not provide First Nations with resources to intensively manage Reserve forests and
lacks internal forest management capacity” (Westman 2005). The failure to address
social, environmental, or economic issues in the Indian Act and the Indian Timber
Regulations has in the past resulted in timber theft and federal mismanagement of
reserve forests (Westman 2005).
One Supreme Court of Canada decision that may directly relate to harvesting of
Crown lands for the purpose of community heating is the case of R. v. Sappier; R. v.
Gray in 2006. First Nation community members in New Brunswick were charged with
unlawful possession of or cutting Crown timber from Crown lands under the New
Brunswick Crown Lands and Forests Act (1980). The timber was cut from traditional
lands and would be used in the construction of a new dwelling in the community,
community fuel wood use, and by a fashion furniture maker local to the First Nations
community (AANDC 2010). Because they possessed an Aboriginal and treaty right to

48
harvest timber for personal use, and the community members had no intent of selling
logs or products made from the harvested timber, they were acquitted at trial (AANDC
2010). The Supreme Court of Canada unanimously agreed that the community members
were acting within their Aboriginal and treaty rights. In conjunction with a few other
court cases, the Supreme Court of Canada also rules that, in the case of the Mi’kmaq and
Maliseet communities in the eastern provinces, pre-contact practices have evolved over
time that allows community members to harvest and use wood in the construction of
modern shelters, or for transportation, tools and fuel wood (AANDC 2010). However,
this right extends only within a community’s traditional territory, and the goods
harvested cannot be sold, traded or bartered to produce assets or raise money, even if it
is intended to finance construction or other projects (AANDC 2010). The Supreme
Court of Canada made it clear that there is no commercial dimension to this right. As a
result of the Sappier and Gray decision, the governments of Manitoba and New
Brunswick put in place guidelines for First Nations accessing timber on provincial
Crown lands (AANDC 2010). There are no such guidelines in Ontario. Perhaps future
policy development in Ontario will develop a system for First Nations to access timber
on provincial Crown lands, such as an Aboriginal forest tenure model.
The Far North Act and the Crown Forest Sustainability Act
For the rural and remote communities that are being reviewed, there are two
primary pieces of legislation that affect how the communities can access and utilize the
forest resources on their traditional territories—The Far North Act (FNA) (2010), which
affects the remote community, and the Crown Forest Sustainability Act (CFSA)(1994),
affecting the rural community.

49
In 2010, to the dismay of many First Nation communities in the remote regions
of Ontario, the Ontario government passed a piece of legislation entitled the“Far North
Act. The Far North Act: An Act with Respect to Land Use Planning and Protection in
the Far North”, also known as Bill 191, which came into effect in 2011, essentially
limits development on Crown land in the province of Ontario in the lands located above
the AOU unless a government-approved community-based land use plan (C-bLUP) is in
place (Youden 2010; Smith 2014). The FNA (2010) outlines the process and procedures
required for any development in the area north of approximately 50°-51° latitude in an
area now referred to as the Far North (The Far North Science Advisory Panel 2010). The
area is 452,000 km2 in size, roughly 42% of the total area of Ontario (The Far North
Science Advisory Panel 2010). As Figure 11 shows, the Far North region located above
the AOU encompasses Treaty 5 and Treaty 9 areas; the Act is binding on the
communities located in this area. While the FNA requires First Nation consent for large-
scale development projects in an attempt to ensure First Nations’ voices would be heard
and acknowledged when planning for developments, the FNA (2010) also restricts First
Nations from utilizing their traditional territories (off-reserve land) until a C-bLUP,
including protected areas, is in place. While the FNA claims to acknowledge Aboriginal
and Treaty rights, it does not provide communities with complete autonomy over their
traditional lands (Youden 2010; Burlando 2012). A review of the regulations described
under the FNA has found that the Ontario Ministry of Natural Resources and Forestry
has the final say in approving C-bLUPs (Far North Act 2010). The communities living
in the Far North are opposed to the FNA due to the lack of consultation in the
development of the Act and, for the reasons noted above, and have called for action to

50
alter the FNA (NAN 2010). Though the FNA in a way protects the region from
unfettered large-scale industrial development by making the commitment to placing half
the land base in an interconnected network of protected areas, it also proves to be a
barrier to First Nation communities already struggling to assert their rights to manage
and utilize their own traditional areas and resources (Youden 2010; Smith 2015).
The C-bLUP process involved both community-community interactions, as well
as collaboration between governments, industrial partnerships, and community members

51
Figure 11. The Far North region of Ontario including Treaty Areas (Sapic 2015).
52
themselves (Far North Act 2010). Some communities have completed C-bLUPs (Cat
Lake-Slate Falls, Deer Lake and Pauingassi and Little Grand Rapids in Manitoba) and
some were grandfathered (Pikanjikum for the Whitefeather Forest) (Far North Act 2010;
OMNR 2015b), while others, such as Eabametoong and Mishkeegogamang, Marten
Falls, Wawakapewin, Constance Lake and Webequie have completed Terms of
Reference and are beginning to collect the information necessary to move forward with
C-bLUP (OMNR 2015b).
While First Nations communities oppose the Far North Act, there are those that
support the FNA and its intent. The FNA does provide an outline for the process and
requirements to create a C-bLUP, and the OMNRF has created a branch to assist with
development in the Far North, the Far North Branch, which is to provide technological
services and guidance to communities undergoing the C-bLUP process (OMNR 2014b).
The outline for the planning process and the Far North Branch ensures that plans are in
place before development can occur (Far North Act 2010). Orton (1996) has stated that
environmental concerns should take precedence over social and political goals, leaving
Aboriginal and Treaty rights as a side note in the overall goals in sustainable
development, conservation, or preservation. The FNA ensures that plans are outlined
and approved by provincial Ministers who are informed and educated in western-styles
of land management and should be acting in the best interest of First Nations while
balancing interests of the broader society, as determined by the Supreme Court of
Canada (Hurley and Wherret 2000; Smith 2015).
For the rural First Nation community within the AOU, the CFSA (1994) applies.
The purpose of the CFSA is to ensure that forests are managed sustainably to meet

53
social, economic and environmental needs by regulating the use of the forest (Crown
Forest Sustainability Act 1994; OMNR 2009). The CFSA governs how forest licences
are issued and encompasses numerous regulatory and revenue-sharing procedures, such
as revenue collection, allocation of resources to trust funds, and forest resource
agreements (Crown Forest Sustainability Act 1994). Additional regulations regarding
forest operations, in particular the Forest Management Planning Manual, compliance
with existing laws and plans, as well as remedies and enforcement mechanisms support
the CFSA. The CFSA also regulates the licensing of wood scalers, and independent
forest audits. Provisions within the CFSA (1994) state that the CFSA does not detract
from or add to any Treaty rights that are recognised and affirmed by section 35 of the
Constitution Act (1982).
Communities such as Lac Seul First Nation are able to apply and compete to get
forest licenses which would give the community control over the forest resources subject
to provincial laws. The National Aboriginal Forestry Association (NAFA) produced a
series of reports which assess First Nation-held forest tenure over time which may serve
as a viable indicator of market access (NAFA 2015:6). NAFA (2015) states:
forest tenure information is already monitored by governments for non-First Nation entities to measure economic and political performance. The additional effort to identify First Nation-held tenure would be minimal and result in an expanded analysis of sustainability indicators. (NAFA 2015:6).
In 2011, Ontario underwent tenure modernization and the Ontario Forest Tenure
Modernization Act (OFTMA) came into effect June 1, 2015 (NAFA 2015: 17) with
amendments to the CFSA to support modernization objectives (NAFA 2015:17). One of
the objectives was to develop economic development opportunities for Aboriginal

54
people through forest tenure agreements (OFTMA 2011; NAFA 2015:18). Table 2
shows the increase in wood allocated for First Nations in the years 2003, 2006, and
2013. In 2003, only 3.6% of provincial wood was allocated to First Nations while 14.4%
was allocated in 2013. In BC, the current estimate is that First Nations collectively hold
17% of the total provincial annual harvest, approximately 90 M m³ in 2005 (Puglaas and
Raybould 2011). It can be seen that there is an increase in access to wood supply
markets for Aboriginal communities under the new tenure modernization process
(Canadian Biomass 2011; NAFA 2015:18).
Table 2. Provincial allocation of wood supply to Aboriginal tenure holders (NAFA 2015:19)
In other areas of Canada, provincial governments are working to enable First
Nation involvement in biomass operations. For example, in BC the Tsilhqot’in National
Government (TNG) and Western Biomass have partnered in a 50/50 joint venture for a
34 MW biomass facility located next to a TNG sawmill (Run of River (ROR) Power and
Western Biomass 2010). There are several aims for the development: to reduce open
slash burning; to fit government policy initiatives; to accelerate reforestation; fire
protection; create 130 permanent direct and indirect jobs; and to have a capital
investment of $140M (ROR Power and Western Biomass 2010). The project will
contribute annual revenue to the northern economy while addressing environmental

55
issues such as flooding and damage to riparian areas around salmon rivers (ROR Power
and Western Biomass 2010). Further, there were numerous presentations to local,
regional, provincial, and federal governments as well as to community members (ROR
Power and Western Biomass 2010). The sawmill produces 36,000 m³ of residual fibre
(15,126 oven dry tonnes [ODT]); the biomass power plant requires an additional
467,318 m³ or 196,352 ODT to operate (ROR Power and Western Biomass 2010). The
operation will source roadside residues and utilize waste from sawmills where feasible
(ROR Power and Western Biomass 2010). This project was possible because policies
were put in place, such as the BC Bio Energy Strategy, Clean Energy Plan, and Clean
Energy Act, which promoted First Nation opportunities (BC First Nations Forestry
Council 2008; ROR Power and Western Biomass 2010). Further, under the BC
Bioenergy Network—an association created to develop the bioenergy sector in the
province of BC—has received proposals for three projects in the north-central region of
interior BC in which the applications have been composed of partnerships between
energy companies and First Nations, and two other applications which involve First
Nations (BC First Nations Forestry Council 2008). These projects highlight that the
opportunities to participate in forest management and utilize the resources begins with
securing access to fibre and continued work with partners, consultants, and governments
(BC First Nations Forestry Council 2008; ROR Power and Western Biomass 2010).
Although such projects could benefit communities, the forest management
companies must adhere to the rules and regulations and meet the harvest volume
requirements delegated by the OMNRF (OMNR 2009). This means that community
management organizations have the freedom to act within existing regulations; it is not

56
complete freedom over resource management. Greenpeace was critical of the tenure
modernization process, particularly about the involvement of local communities,
Aboriginal and non-Aboriginal, in forest management planning (Greenpeace 2010).
Their letter produced in response to the “Proposed Framework to Modernize Ontario’s
Forest Tenure and Pricing System” states that the five-to-fifteen management
corporations comprised of 9-12 board members that will manage all of Ontario’s
allocated forest do “not have the flexibility required for the range of forests and diversity
of needs and concerns in Ontario. It also does not provide for substantive representation
of communities, Aboriginal or non-Aboriginal.” (Greenpeace 2010). The letter also
highlights a need for tenures specifically designed for Aboriginal communities which
would require a great deal of capacity-building and support from governments in order
to effectively manage the local forests (Greenpeace 2010). Further, the system of forest
tenure allocation should allow for First Nations’ management of traditional territories,
especially when access is desired and sought after by the communities (Greenpeace
2010).
CHALLENGES OF INVENTORYING FOREST RESOURCES IN REMOTE AND RURAL FIRST NATIONS
In Ontario, forest resources are inventoried using Ontario’s Forest Resource
Inventory (FRI) methodology created by the OMNRF. The FRI is carried out on all
lands in the AOU where commercial forest operations take place, combining a series of
aerial photo interpretation with on-the-ground measurements (Leckie and Gillis 1995).
The purpose of the FRI is to have a complete inventory of forest resources (Penner et al.
1997) to gain an edge on potential new developments and identify areas with harvest
potential or those to be conserved or protected (OMNR 2009). This helps forest

57
managers determine the volume of standing timber, stocking, species composition,
ecosite, regeneration techniques, AHA, and recommended harvest treatments for an area
(Sims et al. n.d; Stupak et. al 2009; OMNR 2014a). The FRI is based on different stands
delineated by ecosites, so if the same ecosite and site quality can be identified across a
region, we can assume that it would have similar volumes, stocking, and species
composition (Penner et al. 1997; Thompson et al. 2007). In the AOU, areas are broken
down into FMUs, as depicted in Figure 12, where the forest resources are measured
using the FRI methodology.
Figure 12. Forest management units in Ontario (OMNR 2014a).
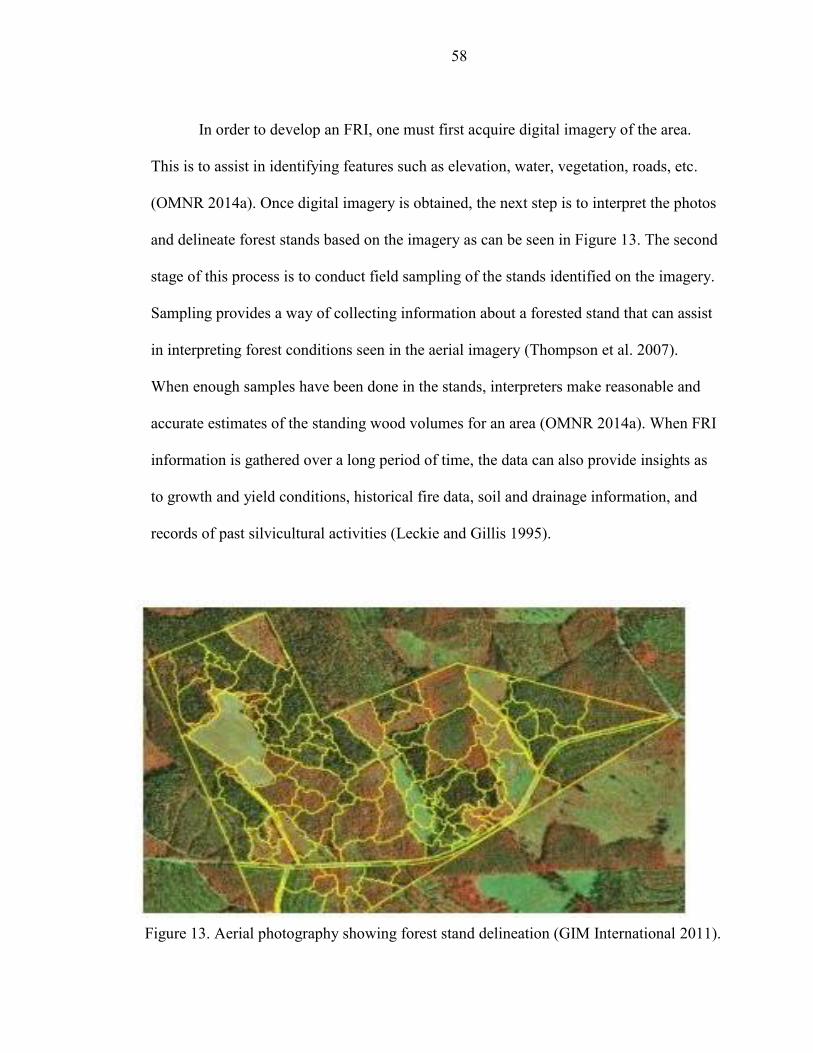
58
In order to develop an FRI, one must first acquire digital imagery of the area.
This is to assist in identifying features such as elevation, water, vegetation, roads, etc.
(OMNR 2014a). Once digital imagery is obtained, the next step is to interpret the photos
and delineate forest stands based on the imagery as can be seen in Figure 13. The second
stage of this process is to conduct field sampling of the stands identified on the imagery.
Sampling provides a way of collecting information about a forested stand that can assist
in interpreting forest conditions seen in the aerial imagery (Thompson et al. 2007).
When enough samples have been done in the stands, interpreters make reasonable and
accurate estimates of the standing wood volumes for an area (OMNR 2014a). When FRI
information is gathered over a long period of time, the data can also provide insights as
to growth and yield conditions, historical fire data, soil and drainage information, and
records of past silvicultural activities (Leckie and Gillis 1995).
Figure 13. Aerial photography showing forest stand delineation (GIM International 2011).
59
There are a few methods to inventory a forest to generate biomass volume
estimates; this report will focus on two: one method to calculate biomass uses existing
FRI stem wood volume estimates and applies a biomass factor which generates an
estimate of the amount of biomass in relation to the stem wood volume; the other
method involves an actual inventory designed to measure the amount of biomass
available in a given stand (Leckie and Gillis 1995; Penner et al. 1997).
There are benefits and drawbacks of each of these approaches. Traditional FRI
methods are aimed at capturing the amount of merchantable timber (sawlogs and pulp)
from merchantable species in a stand, but are not very effective at measuring the amount
of biomass remaining in the tops and branches, non-merchantable species, or the slabs
and sawdust at the mills (Lowe et al. 1996; Ter-Milaelian and Korzukhin 1997).
Although numerous studies have been done to quantify the volume of biomass in
relation to the stem wood volume for various tree species across different ecoregions
(Alemdag 1984; Gonzalez 1989; Singh 1982; Singh and Kostecky 1986; Ter-Milaelian
and Korzukhin 1997), the biomass:stem wood ratio calculated provides a general
guideline but is not necessarily accurate. This may result in an over- or under-estimate of
available wood (Thompson et al. 2007).
This method was used when Canada conducted a national biomass inventory
which was based on forest inventories conducted in each province and to which a
biomass factor specific to species and ecoregion was applied (Penner et al. 1997). The
purpose was to inventory biomass to model carbon budgets (Botkin and Simpson 1990;
Kurz and Apps 1993; Penner et al. 1997), and to have the information to understand the
biomass potential in each province and Canada in total (Lowe et al. 1996). This method

60
of calculating biomass is based on site class, age class and species composition (Penner
et al. 1997). The FRI was primarily developed and used to identify areas with high
potential for sawlogs and pulpwood, neglecting minor species not of commercial value.
Because the FRI for Ontario only takes into consideration the dominant species
or the species used for sawlogs and pulp, the biomass estimates do not accurately reflect
the minor or non-merchantable species which would represent waste in forest harvesting
operations and provide fuel for biomass heating operations (Penner et al. 1997). Further,
the current inventory procedures in Ontario do not capture or reflect northern non-
commercial forests (Leckie and Gillis 1995), which includes remote First Nation
communities. Though this method is less expensive and less time-consuming compared
to actual biomass inventories, it is also less accurate. Although heating with wood is not
a new concept (Abbasi and Abbasi 2010), measuring and managing for biomass adds
additional complexities to traditional forest resource inventories and management plans.
The second method for conducting biomass inventories is essentially a more
detailed forest inventory whereby other parameters that would influence the amount of
biomass available are taken into account (Xu 1999; Zheng 2007). Xu (1999) has
developed a model for estimating biomass based on DBH, height of the tree, crown
volume, crown size and crown length. Though these measurements can yield a more
accurate estimation of biomass volume available, the methods are time consuming and
costly, which would limit the use of these methods for large areas (Zheng 2007). As
changes in management practices and priorities evolve, whether as a response to
environmental concerns and multiple land uses, new technologies, or changing world
markets, the methods of forest inventory are likely to evolve as well (Leckie and Gillis

61
1995). A combination of the above two methods can provide a reconnaissance inventory
for biomass volumes in and around remote communities in northwestern Ontario. As
biomass opportunities are realized and prioritized, perhaps forest inventory methods will
evolve to capture biomass volumes in order to generate realistic estimates.
Overall, it is important to manage the forest resources to reduce the potential to affect
forest users in a negative way in order to achieve sustainable development. This involves
a balance of social, economic and environmental considerations (OFIA 2015). It is
important to plan for a sustainable supply of biomass for energy projects (Abbasi and
Abassi 2010) while managing for sustenance harvesting, trapping ,and fishing (OMNR
2009; OMNR 2015a), and for the protection of habitat, and traditional and contemporary
lifestyles (OMNR 2009; OMNR 2015a). This may help alleviate conflicts between
forest users and ensure a shared benefit from forest management.
62
CHAPTER 3: METHODS
To assess the thermal potential of the forest resources in northwestern Ontario
selected wood properties of forest resources from remote and rural First Nation
communities were compared as shown in Figure 14. For each community the forest
resources on reserve lands and the surrounding Crown lands were assessed for forest
type, species composition, volume, stand age, wood density and thermal potential. Data
collected for this study was completed in tandem with Confederation College’s
“Biomass Heat as a Catalyst for Community Development” research project. The
experimental design was simple and balanced, with an inference space limited to First
Nations located in the Northwest Forest Region of Ontario as shown in Figure 15.
COMMUNITY SELECTION As part of Confederation College’s community selection process, remote First
Nation communities located above the AOU and rural First Nations within the AOU
were invited to express their interest to participate in the “Biomass Heat as a Catalyst for
Community Development” research project. Once the College’s selection process was
completed, and one remote (no all-season road access) community that currently
receives its electricity, heat, and hot water primarily through diesel generation, and one
rural (all-season road access) community that does have access to the natural gas
pipeline network and utilizes the existing electrical grid network to provide heat, hot
water, and electricity to the community were selected to participate in the joint research,
all partners were informed. This design allowed for a comparison between the two
communities’ forest resources thermal potential.

63
Figure 14. Experimental design for assessing forest biomass thermal potential.

64
Using Statistics Canada and AANDC information, a brief description of each
community was developed which included the community’s geographic location and
population. The study complied with Lakehead University and Confederation College
research policy and ethical conduct, including the Tri-Council Policy Statement on the
Ethical Conduct for Research Involving Humans, Chapter 9, Research Involving First
Nations, Inuit, and Metis Peoples (Panel of Research Ethics 2010).
Sachigo Lake First Nation
The first community, Sachigo Lake First Nation (SLFN), is considered a remote
First Nation community and is located approximately 425 km north of the town of Sioux
Lookout (633 km northwest of Thunder Bay) in the unorganized Kenora District of
northwestern Ontario (KNET First Nation Communities 2009; Windigo Education
Authority n.d.). The First Nation is accessible via ice roads in the winter or air travel
Figure 15. Forest regions of Ontario (OMNRF 2015a).

65
during the summer (Albert 2007; Southcott and Walker 2009). The on-reserve
population is roughly 428 persons and 178 homes (AANDC 2013b). A satellite image of
the community can be seen in Figure 16. Sachigo Lake First Nation is a signatory to
Treaty 9 and a member of the Windigo First Nations Tribal Council, as well as the
political territorial organization representing Treaty 9 First Nations, Nishnawbe Aski
Nation (AANDC 2013b).
The on-reserve area is divided into three parcels separated by provincial-owned
Crown land that is subject to treaty terms. The total area of the parcels is 8 144.6
hectares (ha) with the main parcel where the community is located making up 3 588 ha
of the total area. The community has established a campground on the second parcel of
Figure 16. Sachigo Lake First Nation community (Google Earth n.d.).

66
reserve land with a total area of 2 833 ha located on a high ridge with generally sandy
soils. The surrounding forest in this area is composed primarily of jack pine; a portion of
this area, which extends into Crown land burned by wildfire in 1986, is recovering
naturally. The third parcel surrounds Ponask Lake which has few permanent settlements
and totals 1 723.6 ha. Although the reserve parcels and surrounding provincial Crown
land are primarily forested, the community is unable to access off-reserve resources until
a C-bLUP is developed and approved under the Far North Act 2010, thus potentially
limiting the resources available for immediate use for community heating needs.
On-reserve community buildings that have a greater heat energy demand than the
173 residential buildings include the band office, a small motel, the Northern store,
healing centre and nursing station, arena, water treatment plant, churches, residences for
teachers and nurses, TV/radio station, a small convenience store, the elementary school,
the airport and associated buildings, the diesel generation site, a garage for heavy
equipment, a small fire hall and a police station (KNET First Nation Communities
2009). In 2011, the community used 2 847 000 kWh or energy; a total of 788 069 L of
fuel (HORCI 2012). A Wellness Centre is currently being constructed which will further
add to the electrical load.
The electrical grid and natural gas pipeline do not extend this far north and the
electrical and heating needs are provided to the community via diesel power generators
(HORCI 2013). Some buildings have back-up generators in the event that power is lost
in the winter when electrical loads are maximized and temperatures are low; however,
these are not long-term solutions to reducing community diesel consumption.
With the exception of the Wellness Centre under construction, the community is

67
unable to add additional buildings to the local grid as the capacity of the diesel
generators has been reached. This means that stores and homes cannot be built thus
limiting economic development opportunities and the growth capacity of the
communities.
Lac Seul First Nation
The second community, Lac Seul First Nation (LSFN), is considered a rural First
Nations community and is located approximately 25 km west of the town of Sioux
Lookout (319 km NW of Thunder Bay) and receives its heating and electrical needs via
an electrical transmission line (AANDC 2013a). The community is divided into one
main community, Frenchman’s Head, and two satellite communities—Whitefish Bay
and Kejick Bay—which contain a combined total of 306 houses and an on-reserve
population of 762 (AANDC 2013a). In total, the community covers 26 821.5 ha. Lac
Seul First Nation is a signatory to Treaty 3, and a member of both the Independent First
Nations Alliance (IFNA) and NAN (AANDC 2013a).
A non-First Nation settlement, the town of Hudson, is located nearby the reserve
and can provide services to the communities. The reserve lands of LSFN are located
within the AOU and within an existing FMU—the Lac Seul Forest—on which
commercial forest operations under licence from the Ontario Ministry of Natural
Resources and Forestry are conducted as shown in Figure 17. Figure 18 shows the
location of each community in relation to the FMU and sawmill.

68
Figure 17. Location of LSFN in relation to surrounding FMUs.

69
Figure 18. Location of Frenchman's Head, Whitefish Bay, and Kejick Bay in the Lac Seul First Nation Reserve land and Lac Seul Forest.
LegendFrenchman's Head
Whitefish Bay
Kejick Bay

70
In 2012, a five-year Forest Resource License (FRL) was signed between the
Government of Ontario and the Chief of Lac Seul First Nation “which provided the
community 100% responsibility in managing the forest” (Shields 2014). Obishikokaang
Resource Corporation (ORC) was formed to represent LSFN in managing the Lac Seul
Forest and its commercial forest licence (Shields 2014). The office of ORC can be found
in the town of Hudson.
Figure 19. Map of FMUs in northwestern Ontario highlighting Lac Seul Forest and location of Lac Seul First Nation (OMNR 2015a).

71
Due to its location within an existing FMU, researchers were able to access the
FRI, which had previously delineated the landscape by ecosite, forest cover type, age,
and recommended harvest treatment, as well as past treatments and species composition.
The geodatabase used for mapping purposes was provided by ORC through
Greenmantle Forest Inc.; this is the same database used to develop the Lac Seul Forest
2011-2021 forest management plan (FMP) for the Lac Seul Forest. A greater amount of
data is available in the FMP compared to the information available for LSFN and has
provided researchers with the current AHA for the area as well as a series of five-year
work plans that can help future planning for integration of woody biomass into the wood
supply chain. Overall, there exists detailed information of the forest, which is beneficial
to researchers and will in turn allow for greater detail when developing community
recommendations.
A natural gas pipeline services various areas of Ontario but does not reach the
communities of Lac Seul First Nation. Although the cost and risk of using diesel-
generated power is not present in this community, high-energy prices are paid for
heating and hot water needs as they are dependent on electrical heat. Hydro One and the
Independent Electrical Systems Operators (IESO) are responsible for the production and
delivery of energy to this location and charge a residential rate of $0.086 kW/h and a
peak rate of $0.14 kW/h (Hosszu 2015).
Commercial buildings include an arena, band office, health building, schools,
community centres, water treatment plant, police station, fire hall, elder and youth
center, churches, and community stores.

72
PRE-FIELD WORK PLANNING – ACQUIRING FOREST INVENTORY DATA In order to prepare for field data collection, it was important to first determine
what information was available to the research team such as digital imagery, ArcGIS
maps, forest inventory data, and road maps.
GIS Mapping and Lands and Resource Information in Rural and Remote
Areas
Landcover of the remote regions of Ontario is obtained from the Scholars
GeoPortal and the Lands and Information Ontario (LIO) database created and
maintained by OMNRF, which was available at Lakehead University through their
library system. One set of files entitled “Provincial Landcover 2000–27 Classes”
(OMNR 2002) provided researchers with a basic outline of landcover in this region,
including both Crown and reserve land. This provided information about the forest cover
based on simple delineations (e.g. hardwood, softwood, mixedwood, treed swamp,
bedrock, gravel pits, and lakes), but the landcover information lacked information about
age, ecosite, and species composition. Supplemental layers also found in the LIO
database were added to the maps to determine the location of roads, community
buildings, water courses, and fire scars. With this information, researchers were able to
determine the location of forested stands with potential for biomass harvesting, as well
as the existing road networks that could be used to access these stands and information
regarding ecologically sensitive sites that should be avoided during future harvests.
A sufficient GIS database exists for the community located within the AOU,
which the OMNRF has created and updated with assistance from various other
organizations including forest management companies. The information was provided

73
by the forest management consulting firm that is responsible for developing the FMP,
and includes both the FMP and the GIS database used. A Band Council Resolution
(BCR) allowed for the sharing and use of the information in this project between team
members and the community. Following completion of this project, the information will
be given to each community. This database includes information regarding forest cover
type, ecosite, tree species composition, age, merchantable volume, harvest history, and
road layout for the Crown land surrounding the communities; this information is also
available for the reserve lands. Once the landcover polygons and supplementary layers
were obtained in ArcGIS through the LIO database for the federal reserve lands and
surrounding provincial Crown lands, further information necessary for conducting a
forest inventory was identified.
In order to calculate the wood volume available for remote areas, digital aerial
imagery was acquired through the LIO database. The five potentially operable stands are
described in the Provincial Landcover 2000–27 Classes Specifications V. 1.2 are as
follows:

74
Coniferous Treed—In this forest type represented in Figure 20 one can expect to
find tall treed vegetation (>10 m in height and >60% canopy closure) predominately
composed (>75%) of upland conifer trees, though open (>25% canopy closure) and low
treed (<10 m in height) areas are also included in this cover class. Common species
include jack pine (Pinus banksiana), black spruce (Picea mariana), and white spruce
(Picea glauca). When interpreting the aerial imagery, there could be some confusion
between Coniferous Treed sites and Coniferous Swamp sites, as they appear similar in
the images. Ground verification of the sites or further development of Digital Elevation
Models (DEM) could assist photo interpreters in more accurately identifying these sites.
Figure 20. Coniferous forest strata (Seymour 2015).

75
Deciduous Treed—These areas have a predominant forest cover of deciduous
(leafy) trees on varying soils with dry, fresh or sometimes moist conditions. Upland
deciduous tree species, such as trembling aspen (Populus tremuloides) and white birch
(Betula papyrifera) generally compose >75% of canopy closure as Figure 21 depicts.
Mixed Treed—These sites contain a mixture of deciduous and coniferous trees,
as can be seen in Figure 22, which make up >75% of the canopy. Common species
include jack pine, black spruce, white spruce, poplar and birch.
Disturbance–Treed and/or Shrub—These sites are the result of natural or
Figure 21. Canopy of deciduous forest strata (Seymour 2015).
Figure 22. Canopy of a mixedwood forest strata (Seymour 2015).

76
anthropogenic disturbances which have occurred at some point over the last 20 years. In
contrast to the above forest cover types, the Disturbance sites generally experience low
treed vegetation (<10 m tall, >60% canopy closure) as can be seen in Figure 23.
Treed Wetlands—These sites are an amalgamation of four Far North landcover
classes: Treed Bog, Treed Fen, Coniferous Swamp, and Thicket Swamp. Generally,
these sites have lower canopy closure, a greater abundance of shrub species, and are
subject to seasonal flooding, high water tables, and standing water, as they are
commonly found in depressions, low-lying areas, adjacent to streams, lakes, or bogs.
Figure 24 shows a site representative of these wetland sites. It was determined that these
Figure 23. Disturbed forest strata (Seymour 2015).

77
sites had potential to:
a. Be confused with Coniferous Treed sites,
b. Represent low-lying areas common to the boreal forest, and
c. Contain some amount of standing timber that may be harvested during winter.
It is important to note that the identification and delineation of stands based on
aerial imagery has a component of error to it. The specifications (OMNR 2002) state that
“percentages of deciduous and coniferous forest estimated using satellite imagery may
not align with field based estimates resulting in a source of field-remote mapping
discrepancy”.
The remaining landcover classes represent features such as bogs, fens, swamps,
peatlands, marshes, bedrock/rock outcrop, community infrastructure, mine tailings and
gravel pits. Though it is important to know where these are on the landscape, it is also
Figure 24. Representative treed wetland site (Seymour 2015).

78
important to note the reasoning behind delineating these sites as inoperable. These areas
either have limited forest growth, community infrastructure, or are ecologically sensitive
and susceptible to disturbances such as harvest activities. It is not recommended that
harvesting take place in any of these sites.
Delineation of Strata based on Available Forest Inventories
Given that the remote community has limited information regarding forest cover,
it was determined that the strata delineated in the Provincial Landcover 2000–27 classes
could not be further stratified based on the information available. Of the 27 available
landcover classes, it was determined that five could hold potential for harvesting based
on the inferred species composition and cover; stands that indicated wet sites (e.g.
swamps, fens, bogs, and marshes) were eliminated with the exception of the Treed
Wetlands class. This is due to the potential error identified in the delineation of stands
by the creators of the database as having potential to be confused with softwood cover
types (OMNR 2002). Landcover classes that were also eliminated included lakes and
rivers, exposed bedrock, community infrastructure, mines and mine tailings, sand/gravel,
tundra heath, pasture, and cropland. The five cover types that were determined to have
potential for biomass harvest in the remote area were as follows: Softwood, Hardwood,
Mixedwood, Treed Wetland, and Disturbed Area (labeled “Regenerating Depletion” in
(OMNR 2002)).
Further elimination of potential stands was based on physical limitations. Stands
under eight hectares were eliminated from the selection of stands to sample, as an eight-
ha minimum size requirement for FRI lines has been established by the OMNRF
(OMNR 2009; OMNR 2011). These stands were not eliminated from the total volume;

79
rather they were eliminated from stands chosen for sampling in order to follow OMNR
guidelines which have an eight-ha minimum size requirement to avoid sampling in
stands affected by edge effect. Given that time and money were also limiting factors,
stands >1 km from roadways and waterways were eliminated, as these stands would
require a greater amount of travel time in between, and given the lack of forest
harvesting in these areas, it was assumed that these stands would be representative of
those outside the 1 km radius of roadways. Due to the limited road network, stands
located far from roads were assumed to be inaccessible to harvest operations until a
larger road network could be developed. This land may be accessible in the future
should the community’s need for biomass increase and their road network expand. This
would allow harvest to be spread over a larger area to avoid overharvesting a smaller
land base. In summary, stands were chosen based on three criteria: forest cover, size,
and ease of access. After eliminating smaller stands and those difficult to access,
researchers were able to randomly select stands for ground proofing once in the
communities.
Given that the rural community has a detailed forest inventory database, a
plethora of information existed that would have allowed researchers to sample a wide
variety of forest cover types, ages, species composition, and ecosites. However, in order
to compare the two sites, the forest cover in the rural community had to be delineated in
the same manner as the remote community; that is, the stands must be categorized into
five strata: Hardwood, Softwood, Mixedwood, Treed Wetlands, and Disturbed Areas.
Forest Resource Inventory
The researchers prepared a modified FRI similar to the OMNRF FRI guidelines

80
that work in conjunction with the LUWSTF and their new Wood Science App
(WSApp).
A crew of four field researchers spent ten days in each community sampling the
forests and collecting information about community infrastructure. The purpose of this
was to determine:
a. How much energy is the communities using (results in Hosszu 2015)?
b. How much woody biomass volume is present on Crown and reserve lands?
c. How much energy is available in the forest resources to be used in a BDHP (determined through laboratory work)?
Forest resource information gathered in the field was entered into LUWSTF
WSApp (See Table 3). The WSApp allows raw forest resource data to be entered and
calculations on wood volume, species composition, site condition, and other information
carried out as needed. It contains embedded formulas consistent with the OMNRF’s
Strategic Forest Management Model (SFMM), an aspatial modelling program used by
the province of Ontario for forest management planning (Kloss 2002). For the purpose
of this study, additional wood thermal properties were added that allow the WSApp to
calculate the amount of energy per unit of wood and further the amount of energy per
unit area. Once stands were delineated into strata and stands that did not meet selection
criteria were eliminated, stands within the strata were selected at random to be sampled.

81
Table 3. Description of field data collected.
Forest Collected in Field Frequency Purpose
Count and species of BAF 2 “in” trees
# trees/species/plot; 10 plots per line
Basal area calculations; species composition
Diameter at breast height (DBH) of “in” trees
All trees in all plots in a line
Size distribution; volume estimates;
Defect classification + location
All trees in all plots in a line
stand health; Amount of standing dead biomass Successional stage?
Crown class All trees in all plots in a line
Canopy layers
Vegetation site Once per line Ecosite classification; growth factor
Other site information: fire sign; soil type + depth; Once per line
Ecosite classification; stand origin; growth factors
Height All ‘Measure Trees’ Volume calculations
Age All ‘Measure Trees’ Stand age
Crown width Base-to-live-crown ratio All ‘Measure Trees’ Crown shape and size
Inventory for Biomass Estimates
Similar to FRIs conducted by the OMNRF, the inventory methods involved
establishing a straight line, 200 meters long on a set azimuth and creating ten sample
plots along the line each 20 meters between plots. The line must be at least 10 m from
the stand edge and must be in a stand >8 ha (Thompson et al. 2007) in order for the line
to fit, to not cross into other stands, and to ensure plots are far enough from the stand
edge where oddities in species composition may occur due to the edge effect. This
prevented overlap between plots to ensure that the same tree was not counted within

82
both plots. At the beginning of each line, soil and site information was recorded which is
similar to what the OMNRF would record when conducting FRIs.
Soil Type and Ecosite Identification At the beginning of each line, a soil auger and the field manual for describing
soils in Ontario (Denholm et al. 1993) were used to determine the underlying soil
composition up to 1.6 m beneath the surface layer. A visual representation of how this
was conducted in the field is presented in Figure 25. This information was recorded in
the WSApp and was used to assist in identifying ecosites. A visual inspection of the
surrounding tree and shrub species, in conjunction with the soil type and the Field Guide
to the Forest Ecosystem Classification for Northwestern Ontario (Sims et al. 1997),
allowed researchers to determine the ecosite. It was further noted if any fire scars or
charcoal in soils were found, this
would give an indication as to how
the stand was created/regenerated
naturally. Further, it was recorded
whether the stand was a natural
stand, or if it was a planted stand
as this would give an indication to
the expected volumes to be found
on site. If, along the line, the
ecosite changed, this was noted in
the WSApp.
Figure 25. Example of soil profile assessment in field (Seymour 2015).

83
Plot Creation and Labelling Methods
In order to establish sample plots and maintain a labelling system, the following
method was established. For the lines containing ten plots spaced 20 m apart beginning
10 m from the edge of the stand, these plots were numbered 1-10 sequentially along the
line. Once a 20 m distance between plots had been reached, flagging tape with the label
information recorded on it was tied to a branch in the centre of the plot and photographs
were taken facing each cardinal direction (i.e. North, South, East, West), upwards
showing the canopy, and toward the ground showing ground cover. Trees selected for
additional measuring and non-destructive sampling were also numbered; a further
description of this process can be found in subsequent sections. A labelling system was
established and can be described as:
Where Lx = line number (lines were labelled beginning at one and following in
subsequent order); AA = study location (SL represents the remote community and LS
represents the rural community); BB = strata type– (a two-letter label was applied to
each strata: SW for softwood (coniferous) strata, HW for hardwood (deciduous) strata,
MW for mixedwood strata, DI for disturbed areas strata, and WL for treed wetlands; D =
jurisdiction of the land: C represents Crown land and R represents reserve land); Py =
plot number (labelled 1-10 sequentially); and Tz = tree number.
The labels were used both in the recording of information in the WSApp and also
in the labelling of samples for laboratory procedures.
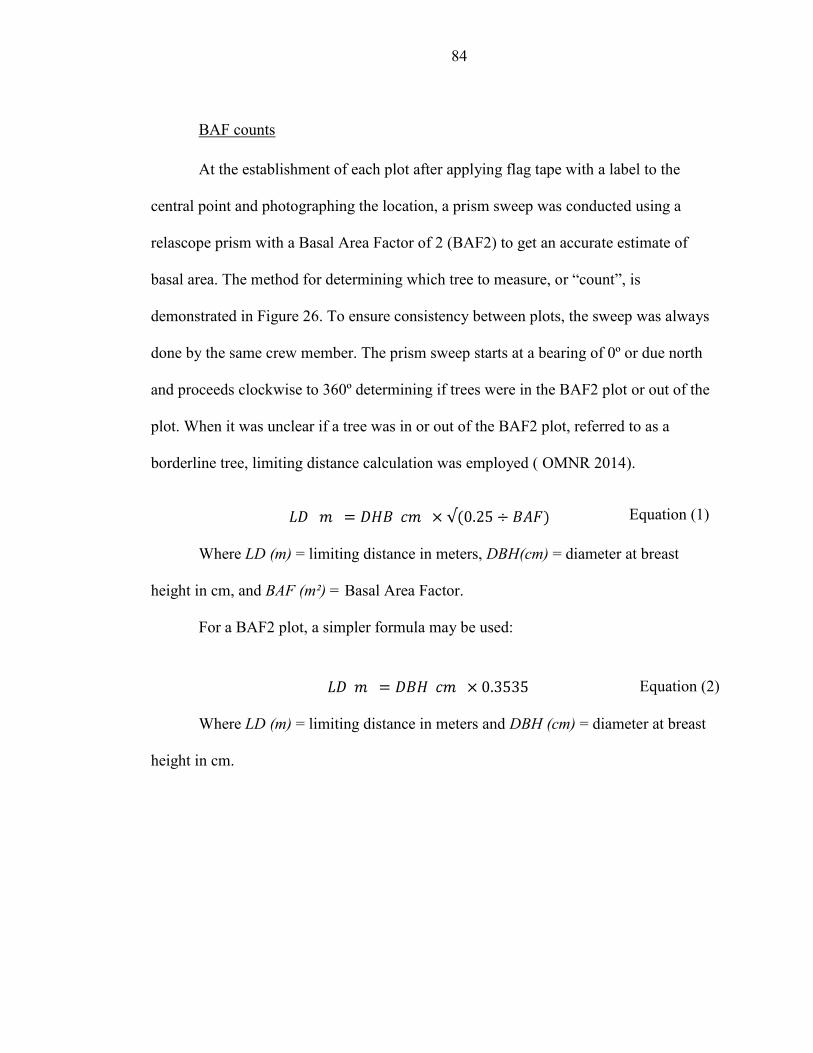
84
BAF counts
At the establishment of each plot after applying flag tape with a label to the
central point and photographing the location, a prism sweep was conducted using a
relascope prism with a Basal Area Factor of 2 (BAF2) to get an accurate estimate of
basal area. The method for determining which tree to measure, or “count”, is
demonstrated in Figure 26. To ensure consistency between plots, the sweep was always
done by the same crew member. The prism sweep starts at a bearing of 0º or due north
and proceeds clockwise to 360º determining if trees were in the BAF2 plot or out of the
plot. When it was unclear if a tree was in or out of the BAF2 plot, referred to as a
borderline tree, limiting distance calculation was employed ( OMNR 2014). Equation 1. General formula for determining limit ing d istance.
Equation (1)
Where LD (m) = limiting distance in meters, DBH(cm) = diameter at breast
height in cm, and BAF (m²) = Basal Area Factor.
For a BAF2 plot, a simpler formula may be used:
Equation 2. Simple formula for determining limiting d istance for a BAF2 plo t.
Equation (2)
Where LD (m) = limiting distance in meters and DBH (cm) = diameter at breast
height in cm.

85
Each “in” tree was spray-painted with a number beginning at one and
sequentially until a complete 360º sweep was accomplished. The field crew of four
persons was divided into groups of two; the first group would orienteer to the next plot,
flag and photograph the location, conduct a BAF sweep and label the trees before
moving on to repeat the process at the next plot location. The second crew would follow
behind and record the stem analysis information.
Stem Analysis After the “in” or “count” trees had been determined, the second crew would
arrive at the plot and begin to classify each labelled tree. The species of each tree was
recorded and the DBH was measured using a diameter tape and recorded to the nearest
0.1cm increment as seen in Figure 27. A visual inspection of the tree allowed
Figure 26. Examples of In (“Count”) vs. Out (“Don’t Count”) trees (Hemery 2011).

86
researchers to determine if the tree was alive, and whether or not the tree had defects.
Examples of tree defects can be seen in Figure 28 and include external and internal
defects, trunk or crown defects; suppressed (flat-topped) trees; scars; leans >20º; hollow
trunk; dead or dying top; forked (U or V) top; and presence of fungi or disease (OMNR
2004). This gives an indication as to the health of the stand and the quality of wood that
can be found on the site. One difference between the study sampling methods and
OMNRF methods is the recording of dead trees. This can help determine the
Figure 27. Example of DBH measurement (Seymour 2015).
Figure 28. Examples of tree defects (University of Minnesota 2011).

87
successional stage of the stand. Further, a recorded visual inspection of the crown helped
researchers determine the canopy position of the tree relative to surrounding trees.
Figure 29 gives a visualization of these canopy positions with D representing
dominant; C – co-dominant; I – intermediate; and S – supressed. Dominant or emergent
trees are those which rise above the co-dominant canopy layer and are likely to have
survived the last stand-replacing disturbance. Co-dominant trees share the highest full
layer of the forest canopy with others roughly the same height; intermediate trees are
those shorter than co-dominant, but not quite in the understory; and understory/
overtopped/ suppressed trees are often the shrub layer and generally represent a tree not
of the same age as those in the co-dominant layer that has grown under the full canopy
(OMNR 2004). This assisted researchers in inferring the successional stage and the
potential secondary growth of the forest. All this information was recorded and entered
into the WSApp.
Figure 29. Crown canopy positions (OMNR 2004).

88
Measure Trees for Wood Quality and Biomass Estimates Once the measurements for a line and all its plots were complete, researchers
selected representative trees for additional measurements. These trees were selected by
determining the dominant species present in the line and, targeting for measurement, the
defect-free trees that had the largest, smallest and average DBH for the line. In addition
to selecting three trees from the dominant species, the largest, defect-free tree of each of
the other species present on the line was selected for additional measurements. These
additional measures included the height of the selected trees, crown canopy
measurements (i.e. base-to-live-crown, crown width) and measurements indicating stem
wood quality or potential biomass quantity (i.e., height to first whorl, height to first
branch, large branch diameter). Heights were measured using a Suunto Clinometer, seen
in Figure 30, and measuring tapes. Again, to ensure consistency, these measurements
were taken by the same crew member each time.
Figure 30. Use of Suunto clinometer (Seymour 2015).

89
The age of each selected tree was also measured using a 5 mm increment borer.
Increment bores drilled at DBH, as seen in Figure 31, allowed researchers to count tree
rings and, using age correction factors, determine the age of the trees. In summary, these
additional measures would generally not be completed to the same level of detail in
OMNRF sampling methods, but provided researchers a greater amount of information
from which to infer conditions about the forest, which would influence the amount of
biomass available in a stand.
Non-Destructive Sampling Non-destructive sampling took place on each selected measure tree. The purpose
of this non-destructive sampling was to provide bole, branch, and bark samples for
laboratory analysis of thermal properties, density, moisture content, and ash content. The
increment bores used to determine age provide a sample of the heartwood and sapwood
Figure 31. Use of increment borer to determine age (Seymour 2015).

90
of the tree, while branch and bark samples provide samples of biomass that exist on a
tree other than the heartwood and sapwood. An example of this can be seen in Figure 32.
These samples were stored in Ziplock bags and given labels using a common format.
When the samples were returned to the lab, they were further processed to test various
properties relating to thermal energy stored in the samples.
Regeneration Surveys The LUWSTF sampling methods allowed researchers to collect a variety of
information about forested stands. However, it was noted that these methods would not
be appropriate in disturbed stands where the vegetation has not yet reached a
merchantable size (<2.5m in height; < 10 cm DBH), and conducting a BAF sweep in
these stands would not give an accurate representation of basal area and volume
Figure 33. Bark sample (Seymour 2015).

91
(Chaundhry 1981). In order to avoid this, researchers had determined that it would be
appropriate to conduct a variation of a regeneration survey: a technique used to assess
regenerating stands that have not yet reached a free-to-grow stage (Chaundhry 1981).
Similar to the LUWSTF methods, lines on a specific azimuth 200 m long with plots 20
m apart beginning 10 m from the stand edge were established. Rather than conducting a
BAF prism sweep at each plot center, four 1 m x 1 m plots (representing 0.0002 ha)
were established at plot centre, and the species and DBH class (i.e. 0-2 cm; 2-4 cm; 4-6
cm; 6-8 cm; 10+ cm) were recorded for each tree. Figure 33 shows a simple diagram of
regeneration survey plot organization. The tallest tree of each species was selected for
non-destructive sampling and the average height was recorded. Because the origin of
these stands is believed to be fire, it is assumed that the trees are all relatively the same
height and age and the selected trees for sampling are representative of the strata.
Figure 34. Example of regeneration survey setup.

92
IDENTIFYING AVAILABLE BIOMASS ON A SUSTAINABLE HARVEST LEVEL
Field data collected was entered into LUWSTF’s WSApp via tablet in order to
generate volume, species composition and thermal potential outputs.
Standing and Harvest Volumes
Standing wood volume and potential harvest volumes were calculated using the
embedded formulas in the WSApp which are concurrent with the formulas and
constraints embedded in SFMM, the provincial modelling program. Honer’s volume
equation (Equation 4) was used to calculate the volumes for standing trees: Equation 3. Honer's volume equation.
Equation (3)
Where Vtot (m) = total volume in m³; d1.3 = DBH in centimeters; H(m) = total height
of the tree; and a1, a2, and a0 are species-specific regression coefficients (Honer 1967;
Honer et al.1983).
The WSApp works in conjunction with the Geographical Resource Management
(GEREMA) software program, a spatial modelling program, which utilizes the
principles of SFMM in that it removes the wood volumes found in buffer zones and
protected areas, providing an estimate of standing volumes (Kloss 2002) and a map
demonstrating where these volumes are located.
Species Composition
Species composition is expressed as a percentage of total volume in the forest for
each species. When the OMNRF calculates species composition for a forest, any species
that makes up <10% of the total volume is not recorded, neither is the volume of shrub
species or undesirable (non-merchantable) species. The species composition calculated

93
from this research included species that make up any percentage of volumes regardless
of how small the percentage, whether they were tree or shrub species, and whether or not
they are merchantable. Species composition was calculated for each species using the
following formula: Equation 4. Ca lculating species composition.
Equation (4)
Where Sp.Comp (%) = species composition expressed as a percent of total
volume; Vsp = total volume of a given species in the stand; and Vtot = total volume of the
stand (Ford-Robertson 1971: 52). By applying this calculation to all species present in a
stand, it was possible to get a more accurate estimate of available biomass.
LABORATORY ANALYSIS OF WOOD PROPERTIES
Further analysis was done in the LUWSTF to determine a number of additional
wood properties that would affect how much biomass is needed on an annual basis to
offset heat and hot water usage within the community. Once the researchers returned
from field data collection, the bark, branches and bole wood specimens were classified
by species, aged, weighed and recorded as the green weight, then placed in a Hotpack
oven to dry at 70° Celsius for 48 hours. After this time, the specimens were removed and
weighed again, then placed in the oven for a further four hours to ensure the weight did
not change anymore; once the weight did not change anymore this was recorded as the
dry weight. After these steps, further preparations were done as per the standards of
various testing procedures, described below. Figure 34 demonstrates the various steps in
preparing the samples for testing. These tests assisted in determining the amount of
heartwood and sapwood, the age of sampled trees, the moisture content of green wood,
the amount of energy stored per unit of wood for each species, and the amount of ash

94
remaining after the sample had been burned. The age of the trees assisted researchers in
determining the age of the stand and in determining when the stand is available for
harvest. Moisture content, thermal energy value of the wood, and the residual ash
content assisted researchers in determining the ideal species mix for the BDHP;
choosing a species with a high density which can equate to a high thermal energy value,
and a low residual ash content, is ideal for the boilers to reduce ash buildup and
maximize energy production per unit of woody biomass.
Moisture Content
In order to determine the moisture content of the wood, the American Society of
Figure 35. Example of wood properties testing procedures and equipment. Figure 34a. shows the removal of wood from an increment borer. Figure 34b shows the weighing and dunking of wood samples to determine density, and Figure 34c shows the bomb calorimeter where thermal potential is measured.
Figure 34a
Figure 34b
Figure 34c

95
Testing Materials (ASTM) standards and methods were used. In particular, ASTM
Standard E 871-82 was used; Method A – Primary Oven Drying Method, was used as “it
is structured for research purposes where the highest accuracy or degree of precision is
needed” (ASTM 2013). The test determined the total moisture in a solid sample of wood
as a percentage of total volume (ASTM 2013). This was done by determining the loss in
weight of a given sample “when heated under rigidly controlled conditions of
temperature, time and atmosphere, sample weight and equipment specifications” (ASTM
2013). The materials required for this testing include a drying oven capable of
temperature regulation of 103 ±1ºC and allowing natural air circulation via openings in
the oven, a desiccator which contains the open containers, and open containers which are
nonporous ceramic and hold the test sample (ASTM 2013). The MC analysis is carried
out by the TGA-601 Thermogravimentric Analyser seen in Figure 35.
The procedures for calculating initial and oven-dry moisture content after
Figure 37. TGA-601 used for analyses (LECO Corporation 2001).

96
previous preparations are completed involved recording the initial weight of the sample
container then the sample container containing the material to be tested (Equation 5).
The sample was again placed in an oven to dry; with the dry weight recorded to the
nearest 0.02g. The sample, after being stored in a desiccator, was then transferred into
open containers or crucibles, which had been weighed in the TGA-601 to determine the
initial weight, and then weighed again to determine the weight of the sample to the
nearest 0.01 g. The analysis was conducted over a three-hour period or until the “total
weight changes varies less than 0.2%” and then the final weight was recorded. The
following formula was used to calculate moisture content: Equation 5. Calculat ion of Moisture Conten t
Equation (5).
Where MC (%) = moisture content of the wood sample expressed as a percent;
Wi = initial weight of sample in grams’ Wf = final weight of sample after drying in
grams; and Wc = weight of the open container (crucible) in grams (ASTM 2014).
Wood Density
In order to calculate the density of wood samples, ASTM Standard D2395 - 14 -
Standard Test Methods for Density and Specific Gravity (Relative Density) of Wood
and Wood-Based Materials – was used. For the purpose of this study, density serves as
an indicator of the amount of wood fuel that can be produced (ASTM 2014) and
information regarding the amount of fuel that can be transported in a specific volume
container such as a log or chip hauling truck can be inferred.
Increment Core Sample Preparation
Test Method E – Increment Core was used for this test given that there was no
97
destructive sampling; only increment cores and bark and branch samples were taken. To
prepare the samples, the core samples taken in the field were removed from their
protective casings, the sample divided roughly in half, and the growth rings counted
beginning at the pith. After the samples were processed in this manner, they were then
placed in aluminum trays labelled following a common labelling format. The samples
were then cut into segments of five annual growth rings, placed in test tubes,
subsequently labelled as described above, and placed into a conditioning chamber set at
65% humidity and 20ºC to acclimatize to 12% moisture content. After 14 days in the
conditioning chamber, a moisture content of 12% was achieved.
Density at 12% Moisture Content
Due to the size and condition of core samples, the traditional method of
calculating wood volume by the water displacement method was not possible. As such,
the volume was calculated by measuring the width and length of each core sample using
a calliper capable of measuring to the nearest 0.01 cm. The formula for calculating
volume of a cylinder was applied (Equation 6): Equation 6. Calculat ing vo lume of a cy linder.
Equation (6)
Where V = volume; r = radius of increment core (diameter ÷ 2); and h = length
of increment core (ASTM 2014).
The initial mass of each length of core sample was recorded using a scale
capable of measuring to four decimal places that had been calibrated prior to the
commencement of this test. This was done for all wood samples that were then returned
to their respective test tubes and placed into a drying oven in preparation for the next
analysis.
98
Thermal Properties (MJ/kg Calculations)
In order to test the thermal properties of the wood, the ASTM D5467-02
Standard Test Method for Gross Calorific and Ash Values of Waste Materials was used.
This test determines the calorific value using a bomb calorimeter equipped with
electronic temperature sensors and automatic calorimeter controllers. In summary, this
method allows for the determination of calorific values by burning a sample of a given
weight under controlled conditions in a calibrated calorimeter using oxygen. The
calorific value of the test sample was determined via temperature measurements made
before, during, and after combustion. The gross calorific value is defined by the ASTM
Standard D5467-02 as “the heat produced by combustion of a unit quantity of a solid or
liquid fuel when burned at a constant volume in an oxygen bomb calorimeter under
specified conditions with the resulting water condensed into a liquid”; the calorific value
is expressed in mega joules per kilogram (MJ/kg).
The accuracy of the bomb calorimeter was tested using benzoic acid tablets as
described in the ASTM standards (ASTM 2007b).
The procedure for assessing gross calorific values has several steps. First, the
mass of the pellet was recorded to the nearest 0.0001g in the sample holder in which it
was burned. The bomb must then be rinsed with water in order to lubricate dry surfaces
and internal seals, which must be done prior to assembly. The next step was to connect
the fuse to the ignition terminals as per the manufacturer’s guidelines and to place this
into the bomb, place the lid on and charge it with oxygen to a consistent pressure of 3

99
MPa. If this pressure is not attained, the result will be incomplete combustion and may
be visually determined by the presence of carbon residues or by the formation of carbon
monoxide (CO) rather than CO2. Then, the bomb, bucket, and calorimeter water must be
transferred to the jacket via the water handling system and the calorimeter started. It is
important that the initial water temperature be the same ±0.5º C for each sample.
In order to conduct this test, a number of calculations are used and described
below: Equation 7. Calculat ion of temperature rise
Equation (7)
Where t = corrected temperature rise in Celsius; tc = final temperature reading; ta
= initial temperature reading at time of firing; and Cr = radiation correction4 (ASTM
2007b). Equation 8. Calorimeter Heat Capacity
t Equation (8)
Where E = calorimeter heat capacity; Hc = heat of combustion of benzoic acid
(J/kg in air); m = mass (weight in air) in grams of benzoic acid; e1 = correction for the
heat of formation of HNO3 (4.2 J or 1 cal (considered a constant value); e2 = correction
for heat of combustion of ignition fuse OR 5.9 J/kg (1.13 J/mm) for No. 34 B and S
gauge iron wire (considered a constant value); and t = corrected temperature rise in
Celsius (ASTM 2007b). Equation 9. Calorific Value Calculation
Equation (9)
Where Qg(gross) = gross calorific value expressed in J/kg; t = corrected
temperature rise; E = heat capacity; e1 = titration correction (correction for the heat of
4 It is important to note that there is an error associated with the use of correction factors. Generally, there is a 96% confidence interval or a range of ±5% on all correction factors (Tarasov 2014).

100
formation of HNO3 (4.2 J or 1 cal.; considered a constant value)); e2 = fuse correction
(correction for heat of combustion of ignition fuse OR 5.9 J/kg (1.13 J/mm) for No. 34 B
and S gauge iron wire (considered a constant value)), e3 = correction for difference
between heat of formation of H2SO4 and the heat of formation of HNO3 expressed in
joules or 55.2 J/g multiplied by the percentage of sulfur in the sample multiplied by the
sample mass; e4 = a correction for use of tape (or gelatin capsule, mineral oil, ethylene
glycol, spiking material); where Hc is as described in the above
formula for thermochemical corrections, and m = mass in grams (ASTM 2007b). Equation 10. Net Calorific Value
Equation (10)
Where Qn (net) = the net calorific value,;Qg(gross) = gross calorific value
expressed in J/kg calculated in section 3.5.3.3; and H = total hydrogen expressed as a
percentage of mass (ASTM 2007b).
Additional calculations are required for the re-standardization of testing
materials. Further information about these calculations can be found in ASTM Standard
D5467-02.
Ash Content
To determine the ash content of the wood, ASTM Standard D1102-84 (2013)
was used as this allows researchers to determine “an approximate measure of the mineral
content and other inorganic matter in [the] wood.” The test allowed researchers to
determine the amount of ash expressed as a percentage of remaining residues after dry
oxidation (580ºC-600ºC) of the wood sample. This represents an approximate measure
of the amount of minerals or other inorganic matter in the wood sample (ASTM 2013).
Specimens were prepared by grinding samples into coarse material and then into fine

101
material (able to pass through a No.40, 425µm sieve) (LECO Corporation 2001) using a
Wiley No. 2 Mill and weighing no less than 2 g to ensure accuracy. Prepared samples
were sent to the Forest Resources and Soils Testing (FoReST) Laboratory at Lakehead
University where the tests were conducted. The necessary testing equipment includes
crucibles with lids to hold the samples, along with a muffle furnace with a pyrometer,
which is used for igniting wood samples and maintaining desired temperatures, an
analytical balance that can record weights to the nearest 0.1 mg and a drying oven which
can be controlled to remain between 100°C and 105°C (ASTM 2013). The procedure
takes place after moisture content is calculated using the TGA-601. After MC (%) is
determined, the crucible and its contents were placed in the muffle furnace and ignited
until all the carbon was eliminated leaving only the inorganic matter and other mineral
content from the wood sample. The sample was then removed and placed in a desiccator
with the covers loosely removed to allow for cooling and an accurate weighing recorded
to the nearest 0.1 mg. The formula to calculate ash content was as follows: Equation 11. Ash Conten t Calculat ion
Equation (11)
Where Ash (%) = the amount of ash remaining after dry oxidation expressed as a
percentage of the sample’s initial weight; W1 = the weight of ash remaining in the
crucible; and W2 = the weight of the oven dry sample of wood (ASTM 2007a; ASTM
2013).
Statistical Analysis
The four stated null hypotheses where grouped into two statistical analyses:
forest inventory and wood properties. The forest inventory null hypothesis states:
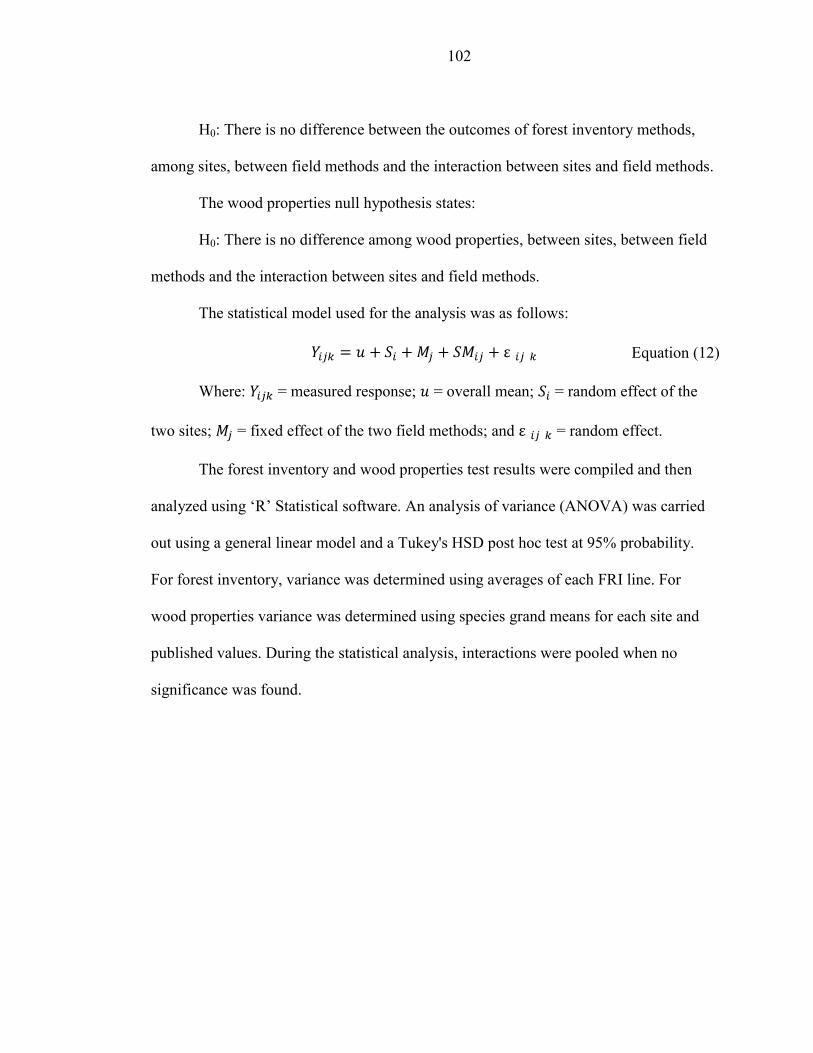
102
H0: There is no difference between the outcomes of forest inventory methods,
among sites, between field methods and the interaction between sites and field methods.
The wood properties null hypothesis states:
H0: There is no difference among wood properties, between sites, between field
methods and the interaction between sites and field methods.
The statistical model used for the analysis was as follows: Equation 12. Statistica l model for ana lysis.
Equation (12)
Where: = measured response; = overall mean; = random effect of the
two sites; = fixed effect of the two field methods; and = random effect.
The forest inventory and wood properties test results were compiled and then
analyzed using ‘R’ Statistical software. An analysis of variance (ANOVA) was carried
out using a general linear model and a Tukey's HSD post hoc test at 95% probability.
For forest inventory, variance was determined using averages of each FRI line. For
wood properties variance was determined using species grand means for each site and
published values. During the statistical analysis, interactions were pooled when no
significance was found.

103
CHAPTER 4: RESULTS
In order to promote sustainable development in rural and remote communities, it is
important to identify potential forest development opportunities to utilize their natural
resources for community heating needs. This was done by assessing one rural and one
remote First Nation community’s natural resources to determine whether or not
sufficient woody biomass is present on the surrounding land base to determine the AHA
which can be sustained in perpetuity to provide fuel for a BDHP.
COMPARING PROVINCIAL DATA WITH DATA COLLECTED DURING STUDY
Landcover with Potential for Biomass Harvest in Remote Areas: SLFN
In the case of SLFN, it was found that the LUWSTF inventory provided a more
detailed description of the forest cover compared to the “Provincial Landcover 2000–27
Classes”. This included information about ecosite, age, species composition, volume,
and thermal properties.
Table 4 summarizes the land base by total area and area of usable forest land in
SLFN. This takes into account the areas removed for buffers around lakes and water
courses, as well as inoperable areas such as swamps, fens, wetlands, community
settlements, rocky outcrops and roads. Table 5 shows a comparison between the species
composition calculated from the Provincial Landcover 2000–27 classes and the
LUWSTF FRI.
Table 4. Summary of forested areas by parcel and authority for SLFN.
Parcel Total Area (ha) Forested Land (ha) Parcel 1: Community Reserve Land 3,588 2, 266 Parcel 2: Reserve Land 2, 833 1, 898 Parcel 3: Ponask Lake Reserve Land 1, 723.6 867 Reserve Land (total) 8, 144.6 5, 031

104
Crown Land: (excluding Reserve land) 69, 677

105
Table 5. Comparison of species composition using the Provincial Landcover 2000–27 classes and the LUWSTF FRI at SLFN.
Data Source Strata Authority Species Composition Volume (m³)
Provincial Landcover 2000–27 classes
Coniferous Crown
Conifer species (Pj, Sb, Sw) ≥ 75% of Canopy Closure N/A Reserve
Deciduous Crown
Deciduous species (Pt, Bw) ≥ 75% of Canopy Closure N/A Reserve
Mixedwood Crown Deciduous + Coniferous species (Pj, Sb, Sw, Pt, Bw)
≥ 75% of Canopy Closure N/A Reserve
Disturbed Crown
No species description N/A Reserve
Treed Wetland Crown
Primarily bog species; shrubs N/A Reserve
TOTAL N/A
LUWSTF FRI
Coniferous Crown Pj 955 Sb 045 2,315,071.0 Reserve Sb 805 Bf 078 Sw 043 Bw 028 Wil 013 Ald 012 Pt 010 Pb 008 Pj 003 138,904.8
Deciduous Crown Bw 550 Pt 306 Pj 135 Sb 009 2,202,537.2 Reserve Pt 470 Sb 287 Bw 156 Pj 087 293,202.0
Mixedwood Crown Pj 386 Sb 313 Pt 157 Bw 144 785,573.1 Reserve Sb 531 Pt 177 Pj 116 Bf 092 Bw 078 Wil 003 La 003 121,892.9
Disturbed Crown Pj 963 Ald 021 Pt 007 Bw 004 Sb 003 Wil 002 0 Reserve N/A (no Disturbed sites on Reserve Land were sampled) 0
Treed Wetland Crown N/A (no Treed Wetland sites on Crown Land were sampled) 0 Reserve Sb 566 Pj 385 Pt 037 Bw 008 Bf 004 211,697.4
TOTAL 6,068,878.3 Pj – Jack pine; Pw – White pine; Pr – Red pine; Sb – Black spruce; Sw – White spruce; Pt – Trembling aspen; Pb – Balsam poplar; Bw – White birch; Bf – Balsam fir; La – Larch; Wil – Salix sp.; Ald – Alnus sp.; Map – Acer sp.; AmS – Amelanchier sp.

106
Comparison between Species Composition and Volumes Calculated for
SLFN
We found a greater variety of species, as well as additional volumes from the
inclusion of these species, when compared to the OMNRF data provided. Figures 34 and
35 demonstrate the species composition calculated using the LUWSTF methods and
OMNRF data, respectively.
Using the LUWSTF methods, it was found that SLFN Crown land is primarily
composed of jack pine (87.9%), while the remaining 12.1% of the 11,391,614 m³ present
on Crown land is composed of white birch (5.5%), trembling aspen (3.6%), and alder,
white spruce and willow composing <3% combined. Comparatively, using the OMNRF
methods for calculating species composition, it was determined that jack pine dominates
the landscape, making up 90.9% of the 11,391,614 m³ present on Crown land, while
white birch (5.5%), trembling aspen (3.0%), and black spruce (0.6%) compose the
remainder. It can be seen that using the OMNRF methods of calculating species
composition would result in an overestimation of volumes for the dominant species and
an underestimation of volumes for minor species. Figures 36 and 37 demonstrate the
difference in species composition calculated using the OMNRF and LUWSTF methods.

107
Figure 38. Species composition and percentage of 11,391,614 m³ total volume for SLFN Crown land using LUWSTF methods.
Figure 39. Species composition of SLFN Crown land as calculated using OMNRF methods.
87.81%
1.19% 3.60%
5.47% 1.76%
0.17%
Pj
Sb
Pt
Bw
Ald
Wil
90.87%
0.59% 3.04% 5.49%
Pj
Sb
Pt
Bw

108
The total volume of wood on the land base remained the same (11,391,614 m³)
regardless of the method of calculating species composition. The major difference is the
addition of minor or under-reported species that make up a portion of the landscape.
When these species are not taken into account, there is an overestimation of volume in
the dominant species. Figure 38 demonstrates the difference in wood volumes calculated
using the two methods. Figure 39 shows the difference in overall species composition
and volume calculated using the two methods. It can be seen that there are more species
present when using the LUWSTF methodology and the OMNRF methodology yields
more volume of the dominant species, which can lead to an overestimation of available
wood for that species. In addition, the volume of underutilized species is low in the
OMNRF methodology.
Figure 40. Summary of volumes on SLFN Crown land calculated using two methods.
0
2
4
6
8
10
12
Pj Sb Pt Bw Ald Wil
Woo
d V
olum
e (m
³) M
illio
ns
Species
LUWSTF
OMNRF

109
Figure 41. Over and underestimation of volumes on SLFN Crown land. This graph was developed by using the volumes determined by the OMNRF methods as the baseline (0), and the LUWSTF methods and resulting volumes as the differences (positive and negative).
For the reserve land, a total of 8,144.6 ha, the presence and percentage of total
volume of each species on the land base was vastly different than that of Crown land.
Once again, it was noted that there was a difference in overall species composition as a
percentage of total volume on the land base. The volume present on reserve land was
significantly less (1,516,236 m³) compared to Crown land, though this is likely a result
of a smaller area of reserve land. Comparing the OMNRF results for species
composition, it was found that the results differed from those calculated using the
LUWSTF methods (See Figures 40 and 41). Black spruce was found to be the dominant
species making up 49.4% of the total volume using OMNRF methods and 37.3% using
-300,000
-200,000
-100,000
0
100,000
200,000
300,000
400,000 348,779
-67,869 -63,240
2,122
-200,681
-19,112 Volu
me
(m³)
Species
Pj
Sb
Pt
Bw

110
the LUWSTF methods, jack pine made up 32.6% and 12.0%, respectively, and white
birch made up 15.1% and 12.3%, respectively. Other species present on the land base
include balsam fir 1.7% and 0.8%, respectively and trembling aspen 0.8% and 36.8%,
respectively. There is a notable difference in the percent composition of trembling aspen
calculated using the different methods which resulted in a volume of 12,129.9 m³ using
OMNRF methods and 557,823.2 m³ using the LUWSTF methods, a difference of
545,693.3 m³.
Figure 42. Species composition of SLFN reserve land calculated using LUWSTF methods.
Figure 43. Species composition of SLFN reserve land calculated using OMNRF methods.
12.07% 0.77%
37.30%
0.39% 0.02%
36.79%
0.07% 12.38% 0.11% 0.12% Pj
BfSbSwLaPtPbBw
32.56%
1.71% 49.41%
0.80% 15.51%
PjBfSbPtBw

111
Figure 42 demonstrates the difference in volumes for each species calculated
using the two methods. The notable differences in volumes are seen in the dominant
species—jack pine, black spruce, white birch, and trembling aspen. Figure 43 shows the
difference in volumes using the two methods.
Figure 44. Summary of volumes calculated for SLFN reserve land using OMNRF and LUWSTF methods.
Figure 45. Demonstration of over or underestimates (difference between outcomes of two methods for calculating species composition on SLFN reserve land). This graph was developed by using the volumes determined by the OMNRF methods as the baseline (0), and the LUWSTF methods and resulting volumes as the differences (positive and negative).
0100,000200,000300,000400,000500,000600,000700,000800,000
Pj Bf Sb Sw La Pt Pb Bw Ald Wil
Volu
me
(m³)
Species
StudyOMNRF
-600,000
-400,000
-200,000
0
200,000
400,000 312,192
14,398
184,608
-5,973 -366
-548,375
-1,111
47,733
-1,667 -1,806
Volu
me
(m³)
Species
Pj
Bf
Sb
Sw
La
Pt
Pb
Bw
Ald
Wil

112
In summary, the comparison between the provincial forest cover data in the case
of SLFN is the recording and reporting of all species present on the land base. For
SLFN, the LUWSTF FRI methodology was able to provide actual volumes and species
composition and provide some information about ecosite, age, and soil type.
Landcover with Potential for Biomass Harvest in Rural Areas: Lac Seul
First Nation
In order to study and inventory the rural forest in the same manner as the remote
location, the forest/landcover classes were divided into the same five land classes that
were determined to be operable—Coniferous Treed, Deciduous Treed, Mixedwood,
Treed Wetlands, and Disturbance–Treed and/or Shrub. There are 11 different forest units
on the Lac Seul Forest. A summary can be found in Figure 44 showing finer distinctions
of the five land classes. Four landcover classes can be found under Coniferous Treed,
including:
Conifer Mixedwood 1 (COMX1)—This forest cover type consists of a mix of
primarily conifer species, such as red pine (Pinus resinosa), white pine (Pinus strobus),
black and white spruce, jack pine, and balsam fir, making up roughly 70% of forest
cover while poplar and white birch compose the remainder. In 2011, this forest type
made up approximately 105 018 ha or 15% of the available forests units in the Lac Seul
Forest at that time.
Jack Pine Dominated (PJPUR—This forest unit is dominated by jack pine which
means that ≥70% of the forest is composed of jack pine, with ≤20% poplar and white
birch composing the remainder of cover.

113
Red and White Pine Mixed (PWRMX)—This stand type is identified by the
percent composition of red and white pine on the landscape (≥40%). Less than 1% of the
Lac Seul Forest is available in this stand type. The majority of this landcover class can
be found in parks, protected areas, or around water bodies which contributes to the lack
of availability on the forest landscape.
Spruce Upland (SPUP)—This common forest unit consists primarily of upland
spruce stands containing ≥70% black or white spruce, and a combined poplar and white
birch composition making up the remainder. Overall, this forest cover type represents
23% of available forest in the Lac Seul Forest.
Additional conifer-dominated forest/landcover classes were identified (ex.
BFDOM, OCL [Other Conifer]), but the percent cover on the landscape was very low
and was not within reasonable haul distance for the community.
Two landcover classes were identified for Deciduous Treed:
Poplar Dominated (POPUR)—This forest cover type contains stands that contain
≥70% poplar. In the past, poplar was not fully utilized as there was a lack of steady
markets to send wood, and thus there remains quite a bit of POPUR forest in an older
age category (81-100 years). Although this forest cover type makes up a small portion of
the landscape (3% of available forest in 2011), there is potential for these sites to
provide an opportunity to create Short Rotation Woody Crops (SRWC) to be managed
as a biomass plantation.
HWDMX—This forest cover type indicates a stand composed of ≥50% poplar,
white birch, and black ash (Fraxinus nigra). During the year 2011, approximately 6% of
available forest cover was composed of HWDMX. Historic records show this forest

114
cover was in greater abundance, but passive regeneration has led to an increase in
balsam fir and conifer-mixedwood stands. Current forest management objectives may
result in a further decline of this cover type.
Within the Mixed Treed designation, one landcover class was identified:
Conifer Mixedwood 2 (COMX2)—This forest type contains ~50% conifer species
(red and white pine, black and white spruce, jack pine, balsam fir, cedar (Thuja
occidentalis) and larch (Larix laricina) while the remainder is composed of deciduous
species (poplar, birch). Past passive regeneration practices during the 1970’s has led to
an increase in this forest type across the landscape. In the year 2011, this
forest/landcover type composed 10% of Lac Seul’s available forest at that time.
The Disturbance–Treed and/or Shrub stands were chosen based on three
different criteria: age, recent history of fire activity, and recent harvest treatments.
Within the FRI geodatabase for the Lac Seul Forest, stands less than 20 years of age
were identified as “Disturbed” as it was inferred that these sites would have been
depleted either naturally through disease or fire or artificially through harvest. An
additional column of information available through the FRI geodatabase described the
current status of the stands as determined by their most recent harvest treatments. It was
determined that stands classified as “Depleted – Harvest” would have been harvested
during the last period before the FRI geodatabase was updated, while stands classified as
either “Depleted – Natural” or “Depleted – Fire” were also classified as disturbed areas.
Within the Treed wetlands designation, two landcover classes were identified:
Lowland Black Spruce (SBLOW)—These sites are composed primary of lowland
spruce (≥70% spruce or a black spruce–larch mixture) forests on organic soils. There is a

115
significant amount of this forest cover type on the landscape (19% of available forest in
2011), particularly in mature age classes (81-100 years).
Mixed Conifer Lowland (MCL)—Similar to SBLOW, these sites are dominated
by conifers, including spruce, balsam fir, larch, and cedar, and contain a small portion of
hardwood species such as birch and poplar.
Figure 46. Area of forest cover type expressed as a percentage of total area of the Lac Seul Forest (Brailsford 2011).
Table 6 compares the species composition and volume of the Lac Seul Forest
calculated from the provincial FRI and the LUWSTF FRI. It can be noted that the
provincial FRI takes into account two dominant species and does not contain minor
species, shrubs, or those that make up less than 10% of the total volume. This results in
an over-estimation of volumes of certain species and an under-estimation of ‘waste’
created from the presence of minor or under-reported species.

116
Table 6. Volume summary for the Lac Seul Forest comparing provincial FRI with LUWSTF FRI.
Data Source Strata Authority Species Composition Volume (m³)
MNRF FRI
Coniferous Crown
Pj 50 Sb 40 Bf 10 14,156,544.9 Reserve 2,593,190.4
Deciduous Crown
Bf 50 Bw 20 Pt 20 Sb 10 1,106,756.1
Reserve 131,859.0
Mixedwood Crown
Pt 40 Bf 30 Sb 20 Bw 10 3,959,720.9
Reserve 89,826.3
Disturbed Crown
N/A N/A
Reserve 43,447.7 Treed Wetland
Crown N/A (sites contained in buffers; eliminated from available volume calculations)
N/A Reserve 40,592.6
TOTAL 22,121,937.9
LUWSTF FRI
Coniferous Crown Pj 539 Sb 397 Bf 043 Bw 021 14,156,544.9 Reserve Pj 899 Bw 041 Bf 026 Sb 018 Pt 014 Sw 002 2,593,190.4
Deciduous Crown Bf 464 Bw 250 Pt 214 Sb 072 1,106,756.1 Reserve Pt 439 Bf 230 Bw 138 Ald 069 Sb 050 Pb 042 Sw 021 Pw 003 Wil 003 Pr 003 Pj 002 131,859.0
Mixedwood Crown Pt 357 Bf 310 Sb 178 Bw 071 Ald 048 Ce 036 3,959,720.9 Reserve Bf 372 Ce 210 Bw 181 Map 064 Sb 061 Pt 056 A ld 022 Pb 017 Wil 007 Pj 007 Sw 003 89,826.3
Disturbed Crown N/A (no Disturbed sites on Crown Land were sampled) N/A Reserve Pj 246 Pt 229 Map189 Ald 103 Ch 097 AmS 080 Bf 034 Bw 017 Sb 005 43,447.7
Treed Wetland
Crown N/A (no Treed Wetland sites on Crown Land were sampled) N/A Reserve Sb 657 Bf 165 Bw 056 La 053 Pb 036 Pt 030 Ald 003 40,592.6
TOTAL 22,121,937.9

117
Comparison between Species Composition and Volumes Calculated for
LSFN
Similar to what was found for SLFN, there was a difference in the outcomes of the
LUWSTF inventory procedures and the OMNRF inventory procedures. Again, this was
likely a result of the different inventory procedures conducted in the field and how the
information was analyzed.
The LUWSTF FRI showed a greater variety of species, as well as additional
volumes from the inclusion of these species, when compared to the OMNRF data.
Figures 36 and 37 demonstrate the species composition calculated using the OMNRF
and the LUWSTF methods.
The total volume of wood on the land base remained the same (1,516,236 m³)
regardless of the method of calculating species composition. The major difference is the
addition of minor or underreported species that make up a portion on the landscape.
Figures 45 and 46 represent the difference in overall species composition calculated
using the two methods. Figure 47 demonstrates the difference in wood volumes
calculated using the two methods. When minor or underreported species are not taken
into account, there is an overestimation of volume in the dominant species and an
underestimation of volume in the unreported species, as can be seen in Figure 48. It can
be seen that there are more species present when using the LUWSTF methodology and
the OMNRF methodology yields more volume of the dominant species, which can lead
to an overestimation of available wood for that species.
A comparison between Figure 45 and 46 shows that there are only five species

118
present on LSFN Crown land using the OMNRF methods of calculating species
composition, whereas the LUWSTF methods yields seven species. The percent
composition of the dominant species—jack pine, black spruce and balsam fir—is similar
using both methods; however balsam fir using OMNRF methods is over estimated by
roughly 5%, which yields a difference in volumes of over 1 M m³. Similar to what was
seen in SLFN, the underreported and minor species—eastern white cedar and alder—
account for approximately 1.1% of the total volume which yields 100,284 m³ and
133,714 m³ respectively, a total of 233,996 m³. Figure 47 shows the differences in
volumes calculated using both OMNRF and LUWSTF methods. Using OMNRF
methods, the volume of jack pine, white birch, alder and cedar are underestimated, while
balsam fir, trembling aspen, and black spruce are overestimated. Figure 48 shows the
volume that is over- or underestimated for each species.
Figure 47. Summary of species composition as a percentage of total volume (19,223,022 m³) for LSFN Crown land using OMNRF methods.
42.83%
13.24%
36.94%
5.36% 1.62%
PjBfSbPtBw

119
Figure 48. Summary of species composition as a percentage of total volume for LSFN Crown land using LUWSTF methods.
Figure 49. Summary of volumes calculated for LSFN Crown land using OMNRF and LUWSTF methods.
46.17%
8.42%
36.36%
0.45% 4.85% 3.15%
0.60%
PjBfSbCePtBwAld
0
2,000,000
4,000,000
6,000,000
8,000,000
10,000,000
12,000,000
Pj Bf Sb Ce Pt Bw Ald
Vol
ume
(m³)
Species
StudyOMNRF

120
Figure 50. Demonstration of over/underestimates of volumes for LSFN Crown land. This graph was developed by using the volumes determined by the OMNRF methods as the baseline (0), and the LUWSTF methods and resulting volumes as the differences (positive and negative).
Using the LUWSTF methods, a greater presence of the minor or under reported
species present on the land base was found, which may provide an opportunity for
biomass. Further, the over reporting of dominant species may lead to an assumption of
greater volumes to be harvested as determined by the management plan, but that are not
actually present on the land base.
When reviewing the species composition for LSFN reserve land, a total of
26,821.5 ha, we see a similar trend in species reporting and associated volumes. The
OMNRF methods yield a higher volume and percent composition for the major
commercial species and some minor specie (i.e. jack pine, larch, alder and cherry) and
an underestimate of the other species present (i.e. balsam fir, black spruce, cedar,
trembling aspen, white birch, and maple). This can be seen in Figures 49 and 50. The
largest difference is noted in jack pine, which yields 88.2% using OMNRF methods and
-800,000-600,000-400,000-200,000
0200,000400,000600,000800,000
1,000,0001,200,000
-746,297
1,077,933
130,395
-100,284
113,932
-341,967 -133,712
Vol
ume
(m³)
Species
PjBfSbCePtBwAld
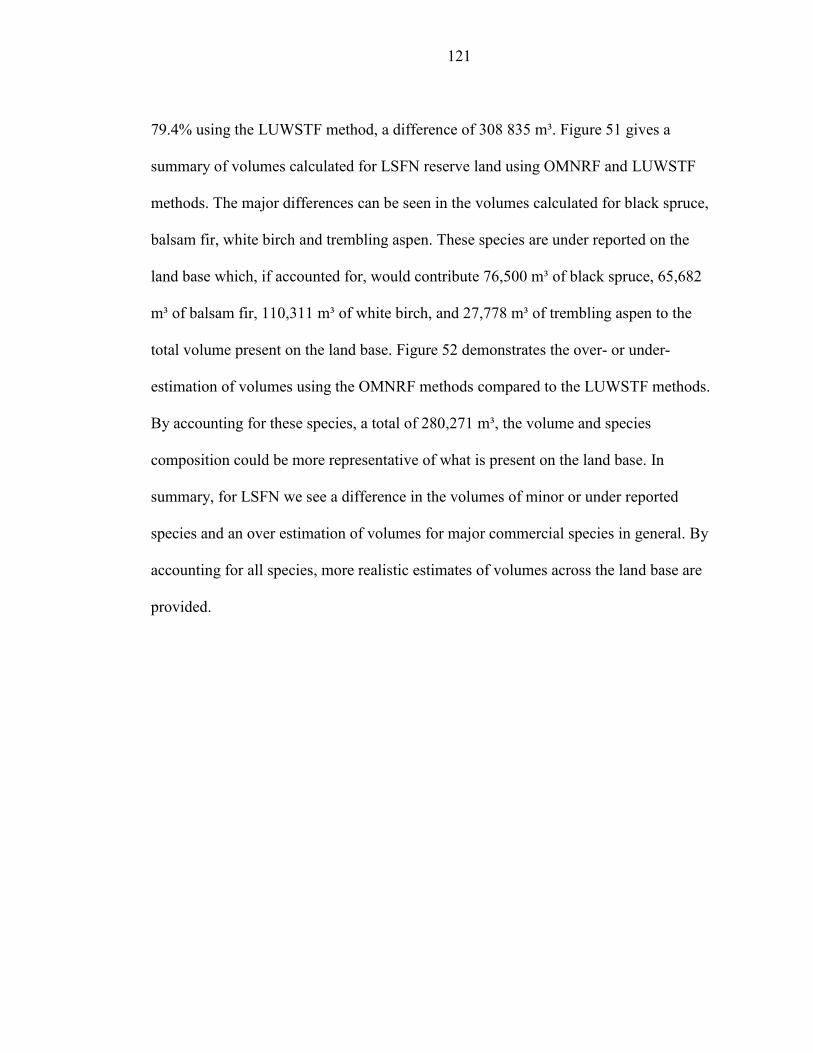
121
79.4% using the LUWSTF method, a difference of 308 835 m³. Figure 51 gives a
summary of volumes calculated for LSFN reserve land using OMNRF and LUWSTF
methods. The major differences can be seen in the volumes calculated for black spruce,
balsam fir, white birch and trembling aspen. These species are under reported on the
land base which, if accounted for, would contribute 76,500 m³ of black spruce, 65,682
m³ of balsam fir, 110,311 m³ of white birch, and 27,778 m³ of trembling aspen to the
total volume present on the land base. Figure 52 demonstrates the over- or under-
estimation of volumes using the OMNRF methods compared to the LUWSTF methods.
By accounting for these species, a total of 280,271 m³, the volume and species
composition could be more representative of what is present on the land base. In
summary, for LSFN we see a difference in the volumes of minor or under reported
species and an over estimation of volumes for major commercial species in general. By
accounting for all species, more realistic estimates of volumes across the land base are
provided.
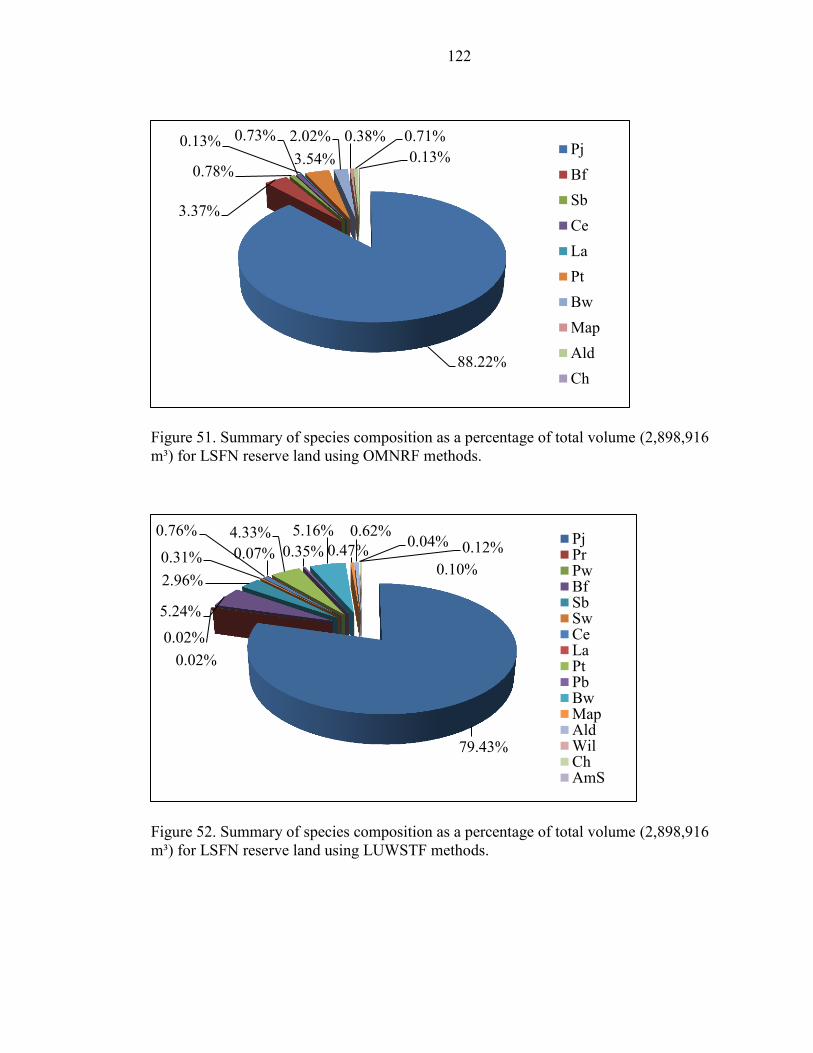
122
Figure 51. Summary of species composition as a percentage of total volume (2,898,916 m³) for LSFN reserve land using OMNRF methods.
Figure 52. Summary of species composition as a percentage of total volume (2,898,916 m³) for LSFN reserve land using LUWSTF methods.
88.22%
3.37%
0.78%
0.73% 0.13% 3.54%
2.02% 0.38% 0.71% 0.13% Pj
BfSbCeLaPtBwMapAldCh
79.43%
0.02% 0.02%
5.24%
2.96% 0.31%
0.76% 0.07% 4.33%
0.35% 5.16%
0.47% 0.62%
0.04% 0.12% 0.10%
PjPrPwBfSbSwCeLaPtPbBwMapAldWilChAmS

123
Figure 53. Summary of volumes calculated for LSFN reserve land using OMNRF and LUWSTF methods.
Figure 54. Demonstration of over- and under estimations of volumes on LSFN reserve land. This graph was developed by using the volumes determined by the OMNRF methods as the baseline (0), and the LUWSTF methods and resulting volumes as the differences (positive and negative).
0
500,000
1,000,000
1,500,000
2,000,000
2,500,000
3,000,000
3,500,000
Volu
me
(m³)
Species
StudyOMNRF
-150,000-100,000-50,000
050,000
100,000150,000200,000250,000300,000350,000 308,835
-616 -616
-65,682 -76,500
-10,875 -1,276
2,143
-27,778 -12,432
-110,311
-3,280
3,287
-1,509
132
-3,522
Volu
me
(m³)
Species
PjPrPwBfSbSwCeLaPtPbBwMapAldWilChAmS

124
COMPARING THE RESOURCES OF THE RURAL (LSFN) AND REMOTE (SLFN) FIRST NATIONS
The results show that there is a difference between the forest resources available to
the remote community compared to the rural community noted in two ways: species
composition and wood volume. Figures 53 and 54, respectively, demonstrate these
differences. Lac Seul First Nation has a more detailed FRI as they are part of an active
forest license in the AOU, which contains information such as species composition,
ages, and seral stages. However, because the FRI methodology includes only species
that make up at least 10% of the total volume, the research provided an opportunity to
include a variety of other species that could be captured in biomass harvest operations.
Although stand types were grouped together to create the same strata as was used in
SLFN, there is more variation in stand types within the delineated strata in the Lac Seul
Forest; however, it was not feasible to sample all stand types at the same intensity as was
done in the remote community because of the size of area.
Figure 55. Comparison between number of species present in each community.
02468
1012141618
LSFN SLFN
Num
ber
of S
peci
es
Community

125
Figure 56. Difference in volumes present in each community.
Another way the forest resources in LSFN and SLFN differ is the growth rate of
the forest. We see a faster growth rate in LSFN compared to SLFN which may be
attributed to the difference in latitude, the variation in climate, and the different lengths
of growing season. With a faster growth rate, the forests of LSFN are able to grow back
quicker which decreases the length of time between harvests, meaning that the forests
can be harvested on a shorter rotation in LSFN compared to SLFN. Figure 55
demonstrates the difference in growth rates between LSFN and SLFN with a growth rate
of 3 m³/ha/year and 1.75 m³/ha/year, respectively.
Figure 57. Growth rate of forests in SLFN and LSFN.
0
5,000,000
10,000,000
15,000,000
20,000,000
25,000,000
Crown Reserve Crown Reserve
LSFN SLFN
Vol
ume
(m³)
0
1
2
3
4
LSFN SLFN
m³/h
a/ye
ar Growth Rate
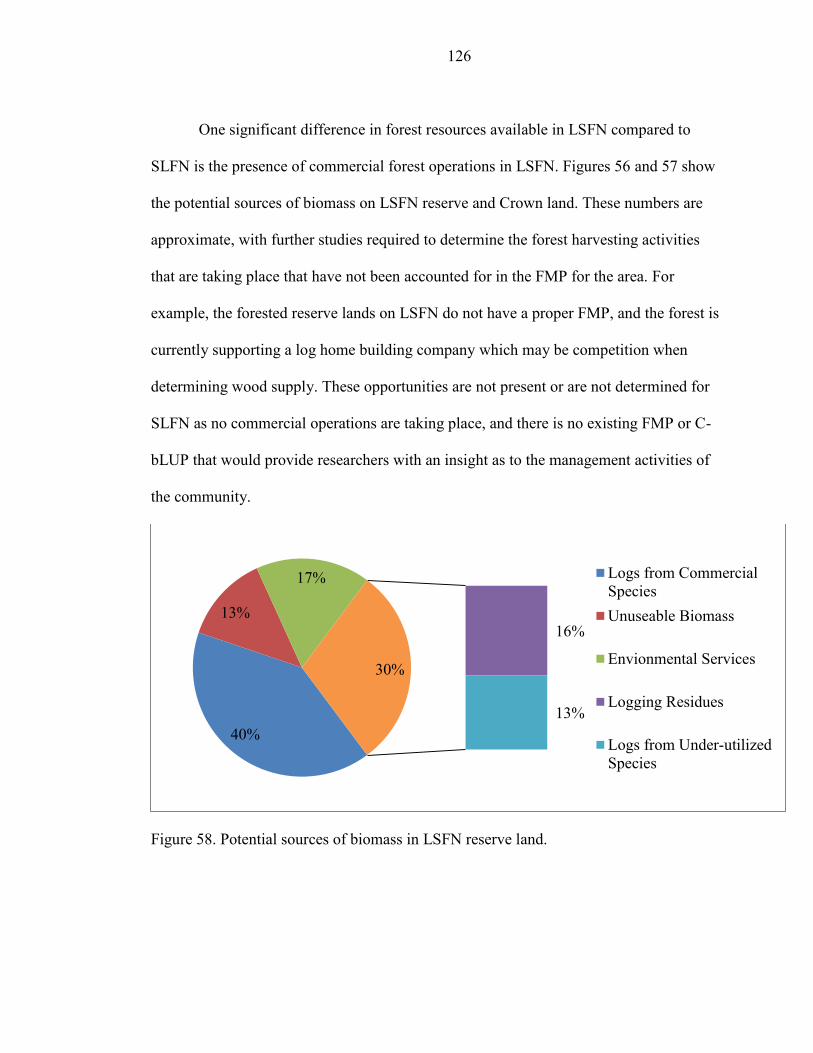
126
One significant difference in forest resources available in LSFN compared to
SLFN is the presence of commercial forest operations in LSFN. Figures 56 and 57 show
the potential sources of biomass on LSFN reserve and Crown land. These numbers are
approximate, with further studies required to determine the forest harvesting activities
that are taking place that have not been accounted for in the FMP for the area. For
example, the forested reserve lands on LSFN do not have a proper FMP, and the forest is
currently supporting a log home building company which may be competition when
determining wood supply. These opportunities are not present or are not determined for
SLFN as no commercial operations are taking place, and there is no existing FMP or C-
bLUP that would provide researchers with an insight as to the management activities of
the community.
Figure 58. Potential sources of biomass in LSFN reserve land.
40%
13%
17%
16%
13%
30%
Logs from CommercialSpeciesUnuseable Biomass
Envionmental Services
Logging Residues
Logs from Under-utilizedSpecies
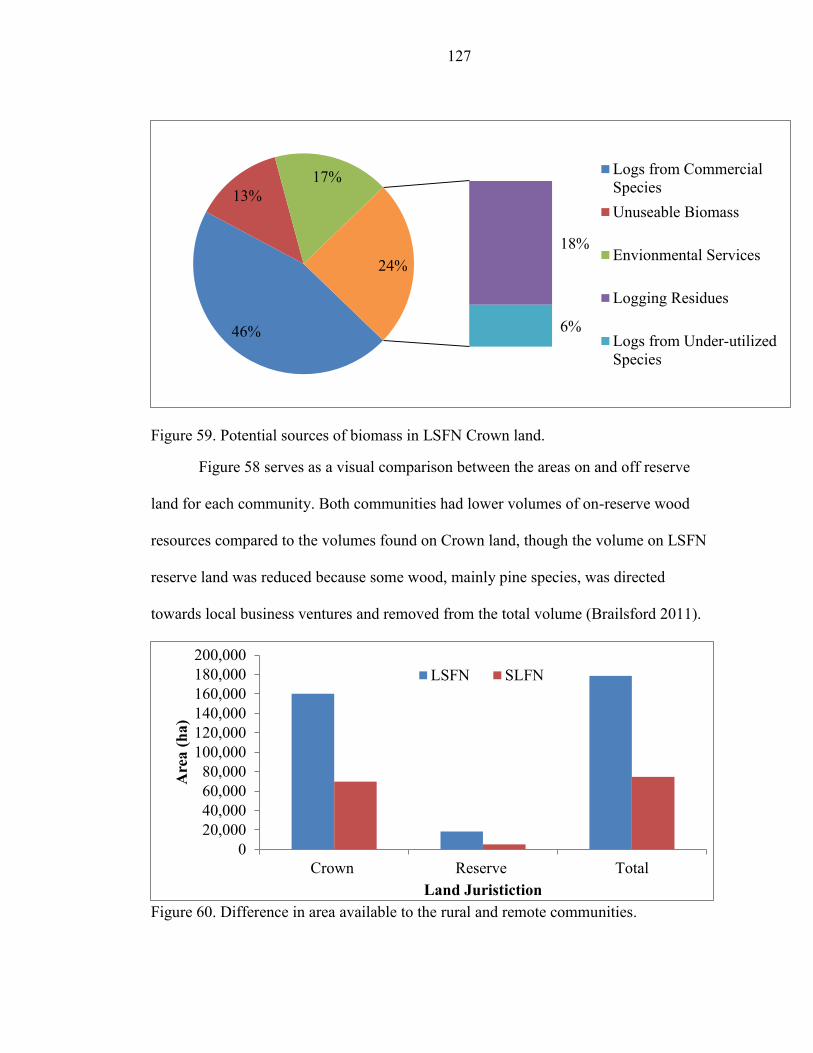
127
Figure 59. Potential sources of biomass in LSFN Crown land.
Figure 58 serves as a visual comparison between the areas on and off reserve
land for each community. Both communities had lower volumes of on-reserve wood
resources compared to the volumes found on Crown land, though the volume on LSFN
reserve land was reduced because some wood, mainly pine species, was directed
towards local business ventures and removed from the total volume (Brailsford 2011).
Figure 60. Difference in area available to the rural and remote communities.
46%
13% 17%
18%
6%
24%
Logs from CommercialSpeciesUnuseable Biomass
Envionmental Services
Logging Residues
Logs from Under-utilizedSpecies
020,00040,00060,00080,000
100,000120,000140,000160,000180,000200,000
Crown Reserve Total
Are
a (h
a)
Land Juristiction
LSFN SLFN

128
However, it is noted that LSFN has slightly more volume on its land base than SLFN as
is seen in Figure 59.
Figure 61. Differences in volumes present on LSFN and SLFN land bases sorted by on and off reserve land.
Statistical Analysis of the Forest Inventory
The ANOVA results of the forest inventory compared the field methods and sites
with regards to volume and species composition. The data was tested for normality and
homogeneity using the Shapiro-Wilk normality test and the Bartlett test of homogeneity
of variances. This confirmed the assumptions used when analyzing parametric data:
independence, normally distributed and homogeneity. The ANOVA indicated that for
volume there was a significant difference between site and method but there was no
significant difference between interaction of site and methods. For site and method, the
null hypothesis is rejected in favor of the alternative (F1,47 = 5.38, p < .001) (F15,47 =
19.72, p < .001). The Tukey's HSD post hoc test showed that there were two
homogenous subsets for site and method, rural and remote for site, and OMNRF species
volume and LUWSTF species volume for method, although the was no difference in
0
5,000,000
10,000,000
15,000,000
20,000,000
25,000,000
Crown Reserve Total
Volu
me
(m³)
Land Juristiction
LSFN SLFN

129
total volume for each site regardless of which method was employed.
The ANOVA indicated that for species composition there was a significant
difference between site and method but there was no significant difference between
interaction of site and methods. For site and method, the null hypothesis is rejected in
favor of the alternative (F1,71 = 32.28, p < .001) (F1,71 = 31.65, p < .001). A post hoc
test was not required for species composition as there were only two elements for each
factor: site had rural and remote while method had LUWSTF and OMNRF.
Wood properties
A series of laboratory tests on wood properties were conducted according to
ASTM Standards, including ash content, recoverable heat value, and wood density. This
included ASTM E711-87 Standard test method for moisture analysis of particulate wood
fuels, ASTM D1002-84 Standard test method for ash in wood, ASTM D5467-02
Standard test method for gross calorific and ash values of waste materials, and ASTM
D2395-14 Standard test methods for density and specific gravity (relative density) of
wood and wood-based materials.
Comparison between Wood Properties in LSFN and SLFN
When comparing the recoverable heat value of the solid wood (thermal
potential), it was found that there is a difference between the thermal potential of tree
species in SLFN and LSFN (Figure 60). Alder (15.3 MJ/kg and 13.1 MJ/kg,
respectively), balsam poplar (14.18 MJ/kg and 12.8 MJ/kg, respectively), trembling
aspen (13.98 MJ/kg and 13.1 MJ/kg, respectively), white birch (14.38 MJ/kg and 13.8
MJ/kg, respectively) and willow (15.3 MJ/kg and 14.4 MJ/kg, respectively) have a

130
higher thermal value in SLFN compared to LSFN, while black spruce (13.83 MJ/kg and
15.9 MJ/kg, respectively) has a lower thermal value in SLFN compared to LSFN. Larch,
white spruce and jack pine have roughly the same thermal value in both communities.
Again, because cherry (Ch), eastern white cedar (Ce), white pine (Pw), mountain maple
(Map), and red pine (Pr) were not sampled in SLFN, thermal properties for these species
were not determined due to lack of time and resources. Table 7 offers the numerical
values for recoverable heat value of solid wood (green) for SLFN, LSFN, and the
published values used for comparison.
Figure 62. Comparison of thermal values between tree species in LSFN and SLFN.
02468
1012141618
Ald Bf
Pb Sb La Sw Pj Pt Bw
Wil Ch Ce
Pw Map PrR
ecov
erab
le H
eat V
alue
of
Solid
Woo
d Vo
lum
e (G
reen
) (
GJ/
m3)
Species
SLFN LSFN

131
Table 7. Comparison of thermal values.
Species
SLFN Results (Green) (GJ/m³)
LSFN Results (Green) (GJ/m³)
Published Results (Green) (GJ/m³)
Ald 15.3 13.1 13.1 Bf 14.5 13.4 13.3 Pb 14.18 12.8 13.5 Sb 13.83 15.9 12.4 La 14.04 14 14 Sb 12.85 12.8 12.6 Pj 14.04 13.7 12.8 Pt 13.98 13.1 12.9 Bw 14.38 13.8 12.6 Wil 15.3 14.4 14.4 Ch N/A 15.2 15.2 Ce N/A 16.7 14.6 Pw N/A 13.5 14.9 Map N/A 12.3 12.3 Pr N/A 14.2 14.1
Figure 61 shows a comparison of ash content in tree species between LSFN and
SLFN. Table 8 summarizes the ash values found in the study. Due to the absence of
certain species on the land base in SLFN, ash content was not able to be determined for
cherry (Ch), eastern white cedar (Ce), white pine (Pw), mountain maple (Map), and red
pine (Pr) due to lack of time and resources. Overall, it was found that LSFN tree species
had lower ash content when compared to SLFN.

132
Figure 63. Comparison of ash content between tree species in LSFN and SLFN.
Table 8. Summary of ash content (%).
Species SLFN Results (%)
LSFN Results (%)
Ald 0.07 0.07 Bf 0.56 0.07 Pb 0.39 0.11 Sb 0.26 0.06 La 0.04 0.04 Sw 0.07 0.07 Pj 0.28 0.03 Pt 0.39 0.03
Bw 0.24 0.06 Wil 0.07 0.07 Ch N/A 0.06 Ce N/A 0.05 Pw N/A 0.03
Map N/A 0.06 Pr N/A 0.04
When comparing wood density, it was found that densities were roughly the
same in both communities with some minor differences. The biggest differences were
noted in white birch and trembling aspen. White birch had a higher density in LSFN
0.0%
0.1%
0.2%
0.3%
0.4%
0.5%
0.6%
Ash
Con
tent
Species
LSFN SLFN

133
compared to SLFN (775 kg/m³ and 653 kg/m³, respectively) as did black spruce (557
kg/m³ and 541 kg/m³, respectively). Trembling aspen had a lower density in LSFN
compared to SLFN with a density of 685 kg/m³ and 596 kg/m³, respectively. Figure 62
demonstrates the comparison between the wood densities in LSFN and SLFN. Table 9
summarizes the actual values.
Figure 64. Comparison of wood densities between tree species in LSFN and SLFN.
0100200300400500600700800900
Woo
d D
ensi
ty (g
reen
) (kg
/m3)
Species
LSFN SLFN

134
Table 9. Summary of green wood density comparison for SLFN and LSFN.
Species SLFN Results Green Density (kg/m³)
LSFN Results Green Density (kg/m³)
Ald 602 594 Bf 509 521 Pb 587 587 Sb 541 557 La 680 680 Sw 528 528 Pj 616 621 Pt 685 596 Bw 653 775 Wil 504 504 Ch N/A 679 Ce N/A 439 Pw N/A 558 Map N/A 606 Pr N/A 601 Overall, it was found that the percentage of ash content in SLFN was higher
compared to that of LSFN, while the thermal potential of SLFN was higher than LSFN
with the exception of black spruce. Further, wood density was higher in SLFN compared
to LSFN with the exception of trembling aspen. Species that were not found in each
community were not able to be compared.
COMPARISON BETWEEN PUBLISHED VALUES AND LUWSTF RESULTS FOR WOOD PROPERTIES
Figure 62 compared the published (Jessome 2000) range of green wood density
for the species present on the LSFN land base to those found in the study. Species that
fall within the range of published densities include black and white spruce, cherry, larch,
maple and willow. As a result of this study, alder, balsam fir, balsam poplar, cedar,
white pine, red pine, jack pine, trembling aspen and white birch were found to be above

135
the published range of green wood density for LSFN (see Figure 63). Table 10
summarizes the LUWSTF results compared to the published values.
Figure 65. LSFN wood density comparison to published values.
Table 10. Comparison of LUWSTF results and published values for LSFN.
Species Range of Wood Density (green) (kg/m³)
LSFN Results Green Density (kg/m³)
Ald 446 536 594 Bf 373 489 521 Pb 438 531 587 Sb 448 593 557 La 560 712 680 Sw 378 540 528 Pj 461 616 621 Pt 443 543 596 Bw 600 743 775 Wil 446 536 504 Ch 632 805 679 Ce 337 416 439 Pw 380 543 558 Map 492 642 606 Pr 410 584 601
0100200300400500600700800900
Ald Bf Pb Sb Ch La Ce Pw Sw Pj Map Pr Pt Bw Wil
Den
sity
(Kg/
m³)
Species
Published Range of Green Wood Density
Study Results

136
Figure 60 shows the results of wood density tests for species found in SLFN
compared to published values (Jessome 2000). Once again, white and black spruce,
cherry, willow, white birch, and larch are within the range of published values (Jessome
2000). In the case of white birch, it falls within the published range of green density for
SLFN but not LSFN. Species that were found to have a higher density than published
values include alder, balsam fir, balsam poplar, trembling aspen, and jack pine (see
Figure 60). Table 10 gives a summary of these values.
Figure 66. SLFN wood density comparison to published values.
Table 11. Summary of green wood density comparison between LUWSTF results and published values for SLFN.
Species Range of Wood Density (green) (kg/m³)
SLFN Results Green Density (kg/m³)
Ald 446 536 602 Bf 373 489 509 Pb 438 531 587 Sb 448 593 541 La 560 712 680 Sw 378 540 528 Pj 461 616 616 Pt 443 543 685 Bw 600 743 653 Wil 446 536 504
0
200
400
600
800
Ald Bf Pb Sb La Sw Pj Pt Bw Wil
Den
sity
(Kg/
m³)
Species
Range of Published Wood Density Study results

137
In order to compare thermal potential for the species in the study compared to
published values, Figures 65 and 66 were developed. Figure 65 demonstrates the
difference between published gross heat for green wood (thermal potential) expressed as
MJ/kg for the tree species sampled in SLFN. It can be seen that all species in SLFN have
a higher thermal potential than published values (Singh 1982; Singh and Kostecky 1986;
Hosegood 2011). Table 12 shows the actual values for this comparison.
Figure 67. SLFN comparison between green published thermal values and LUWSTF results.
Table 12. Summary of published values and LUWSTF results used for comparison for SLFN.
Species SLFN Results(Green)(MJ/kg) Published Results(Green)(MJ/kg) Ald 15.3 13.1 Bf 14.5 13.3 Pb 14.18 13.5 Sb 13.83 12.4 La 14.04 14 Sb 12.85 12.6 Pj 14.04 12.8 Pt 13.98 12.9 Bw 14.38 12.6 Wil 15.3 14.4
0
5
10
15
20
Ald Bf Pb Sb La Sb Pj Pt Bw Wil
The
rmal
Pot
entia
l (G
reen
) (M
J/kg
)
Species
Published Gross Heat (green) Study Results

138
Figure 66 compares the thermal potential of tree species in LSFN to published
values. Table 13 summarizes this information. Willow, cherry, alder, larch and maple
were found to have the same thermal potential in both published values and study
results. Black spruce, white birch, jack pine and cedar were found to have a higher
thermal potential compared to published values, while balsam poplar and white pine
were found to have a lower thermal value compared to published values. Balsam fir, red
pine, white spruce, and trembling aspen differed slightly from published values, but
were found to be quite close to published values.
Figure 68. LSFN comparison between published thermal values and LUWSTF results.
02468
1012141618
Ald Bf Pb Sb Ch La Ce Pw Sw Pj Map Pr Pt Bw Wil
The
rmal
Pot
entia
l (M
J/kg
)
Species
Published Gross Heat (green) Study results

139
Table 13. Summary of LUWSTF results and published values for LSFN.
Species LSFN Results(Green) (MJ/kg)
Published Results (Green) (MJ/kg)
Ald 13.1 13.1 Bf 13.4 13.3 Pb 12.8 13.5 Sb 15.9 12.4 La 14 14 Sb 12.8 12.6 Pj 13.7 12.8 Pt 13.1 12.9 Bw 13.8 12.6 Wil 14.4 14.4
A separate comparison was done between published ash content for particular
tree species and the ash content of the same tree species found in SLFN and LSFN.
Figures 67 and 69 demonstrate this comparison. It is important to note that there are very
few published ash values for these species in this particular region.
In Figure 67 we see the SLFN ash content in wood as determined by this study
compared to published values. Table 14 gives a summary of published values and
results. It can be noticed that alder, white spruce and willow do not have published ash
values for this region. Balsam fir, larch, black spruce and white birch yield lower ash
content than was previously published (Zhurinsh 1997; Hosegood 2010; Avelin 2014),
while jack pine, trembling aspen, and balsam poplar yield a higher ash content from this
study compared to published values (Hosegood 2011).

140
Figure 69. SLFN ash content in wood compared to published values.
Table 14. Summary of LUWSTF results and published values for SLFN.
Species Published Ash Values (%) SLFN Results (%) LSFN Results (%)
Ald 0.680 0.07 0.07 Bf 0.814 0.56 0.07 Pb 0.384 0.39 0.11 Sb 0.579 0.26 0.06 La 0.169 0.04 0.04 Sw 0.220 0.07 0.07 Pj 0.202 0.28 0.03 Pt 0.384 0.39 0.03 Bw 0.307 0.24 0.06 Wil 0.680 0.07 0.07 Ch 0.680 N/A 0.06 Ce 0.260 N/A 0.05 Pw 0.300 N/A 0.03 Map 0.680 N/A 0.06 Pr 0.300 N/A 0.04
Figure 68 demonstrates the ash content in tree species found in LSFN compared
to published values (Zhurinsh 1997; Hosegood 2010; Avelin 2014). Table 15
summarizes the published values and results. All species that underwent laboratory tests
to determined ash content as a percentage of solid wood yielded less ash than previously
00.10.20.30.40.50.60.70.80.9
Ald Bf Pb Sb La Sw Pj Pt Bw Wil
Ash
Con
tent
(%)
Species
Published Ash ValuesStudy Results

141
published.
Figure 70. LSFN ash content in wood compared to published values (Hosegood 2011).
Table 15. Summary of LUWSTF results and published values for LSFN.
Species Published Ash Values (%) LSFN Results (%)
Ald 0.680 0.07 Bf 0.814 0.07 Pb 0.384 0.11 Sb 0.579 0.06 La 0.169 0.04 Sw 0.220 0.07 Pj 0.202 0.03 Pt 0.384 0.03 Bw 0.307 0.06 Wil 0.680 0.07 Ch 0.680 0.06 Ce 0.260 0.05 Pw 0.300 0.03 Map 0.680 0.06 Pr 0.300 0.04
0
0.2
0.4
0.6
0.8
1
Ald Bf Pb Sb Ch La Ce Pw Sw Pj Map Pr Pt Bw Wil
Ash
Con
tent
(%)
Species
Published Ash ValuesStudy results

142
Statistical Analysis of the Wood Properties
The ANOVA results of the wood properties compared the published data and
sites with regards to wood density, thermal values and ash content. The data was tested
for normality and homogeneity using the Shapiro-Wilk normality test and the Bartlett
test of homogeneity of variances. This confirmed the assumptions used when analyzing
parametric data: independence, normally distributed and homogeneity. The ANOVA
indicated that for wood density and thermal potential there was no significant difference
between site and published values with interactions pooled. For site and published, the
null hypothesis is accepted (F2, 37 = 2.288, p < .116) (F2, 37 = 1.569, p < .222)
respectively. The ANOVA for ash indicated there was a significant difference between
site and published values with interactions pooled. For site and published values, the null
hypothesis is rejected in favor of the alternative (F2, 37 = 21.85, p < .001). A Tukeys
HSD was completed on the ANOVA results and nine homogeneous subsets were
identified as shown in Table 16.
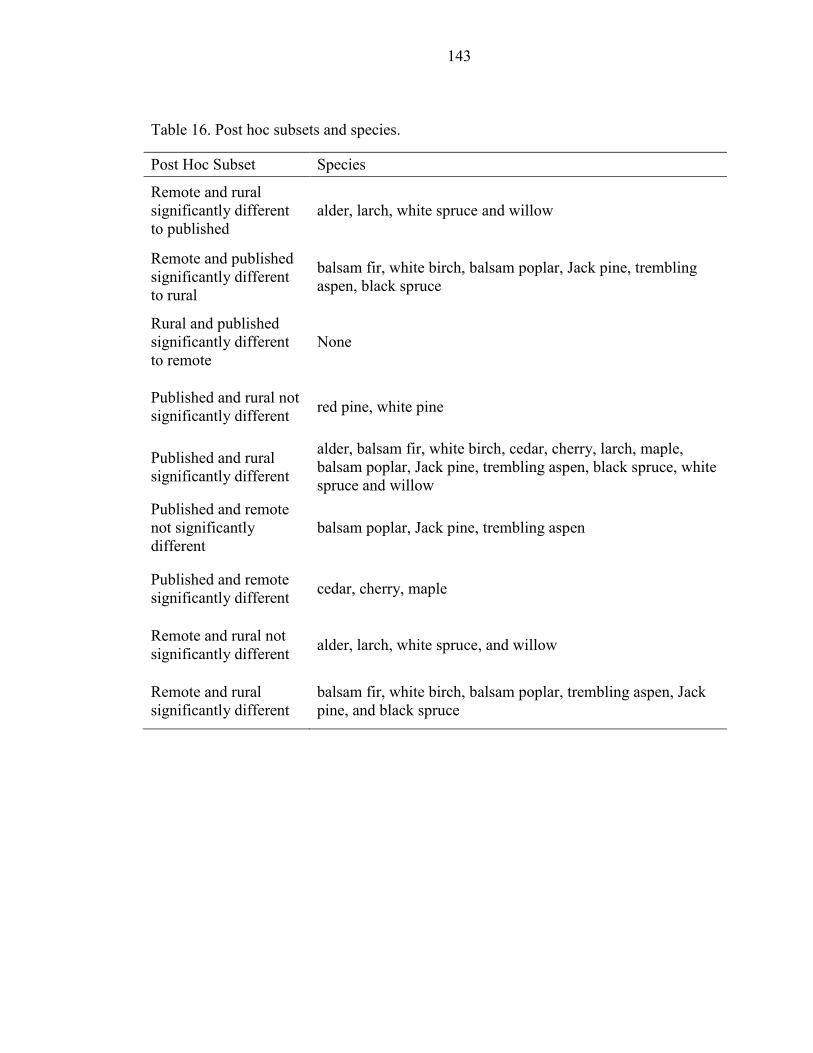
143
Table 16. Post hoc subsets and species.
Post Hoc Subset Species
Remote and rural significantly different to published
alder, larch, white spruce and willow
Remote and published significantly different to rural
balsam fir, white birch, balsam poplar, Jack pine, trembling aspen, black spruce
Rural and published significantly different to remote
None
Published and rural not significantly different red pine, white pine
Published and rural significantly different
alder, balsam fir, white birch, cedar, cherry, larch, maple, balsam poplar, Jack pine, trembling aspen, black spruce, white spruce and willow
Published and remote not significantly different
balsam poplar, Jack pine, trembling aspen
Published and remote significantly different cedar, cherry, maple
Remote and rural not significantly different alder, larch, white spruce, and willow
Remote and rural significantly different
balsam fir, white birch, balsam poplar, trembling aspen, Jack pine, and black spruce

144
CHAPTER 5: DISCUSSION
This section will focus on discussing the results of the study, give potential
reasons for why the results differ, and how the results may affect future studies or
demonstration projects using biomass for BDHP operations.
FOREST INVENTORY RESULTS (HYPOTHESIS 1) The major difference between the inventory outcomes using LUWSTF methods
and OMNRF is the species composition of the forest. In both LSFN and SLFN Crown
and reserve land, the volume calculated was the same using both methods in SFMM, but
the percentage of the total volume occupied by each species was different. There was an
overestimation of the dominant species as determined in the OMNRF methods, and an
underestimation of the minor species that are often not recorded. These differences may
be a result of the OMNRF methods targeting the dominant species because these are the
species that would often generate sawlogs or pulpwood, while ignoring those species
that make up <10% as they would not contribute a large amount to the overall volume
and are often not used for traditional forest products (OMNR 2009). Given that forest
management in the past has targeted these species in order to maximize production, it is
understandable that the methods of calculating species composition favour the reporting
of target species.
However, problems arise when the volumes of dominant species are
overestimated, harvesters/management companies are harvesting less of the desirable
species, and there is increased waste due to the presence of undesirable species that were
not recorded in the inventory (Penner et al. 1997, Zheng et al. 2007). By recording the
percent composition of all species on the land base, it is possible to get a more accurate

145
picture of the forest on the land base and therefore be able to better manage for waste
from harvest operations. Knowing the complete species composition allows better
planning, particularly for the allocation of wood resources for biomass operations, which
could utilize those species not allocated to sawmills or pulp mills, and the tops,
branches, undesirable tree forms, and shrub species (Zheng et al. 2007, Alam et al.
2008). For example, Alam et al. (2012) stated “woody biomass may also be collected
from underutilized wood (UW) species, which are not commercially important for
lumber and pulpwood production.”
One factor, which may contribute to discrepancies between the FRI and the
Provincial Land Cover 2000-27 Classes and the study results may be the timing of the
different inventories. As Thompson et al. (2007) noted in their report, it is important to
conduct inventories as close as possible in time to when the aerial photos are taken in
order to have correct verification of forest conditions. Both the FRI and Provincial Land
Cover 2000÷27 Classes were conducted more than a decade before the current study.
This may lead to discrepancies between the study data and the inventory and stand
delineation data (Thompson et al. 2007). For example, the GIS data used in this study
was produced in 2002 (OMNR 2002) and our sampling was completed in 2014. The data
specifications state that: the “percentages of deciduous and coniferous forest estimated
using satellite imagery may not align with field based estimates resulting in a source of
field-remote mapping discrepancy” (OMNR 2002), and lands labelled as treed wetlands
could be confused with coniferous sites. Thompson et al. (2007) found that of the 129
stands sampled, 83 were classified incorrectly by species composition, and
approximately 30% were incorrectly classified by dominant forest group such as conifer,

146
mixedwood, and deciduous. Further, Thompson et al. (2007) found that 10-20% less
softwood fibre was available on the land base for harvest than originally predicted from
the FRI. The study also found that there was more poplar than predicted in the original
FRI in the 30-50 year age class. The study did not quantify the economic impacts of this
miscalculation.
Overall, the data from this study rejects the first null hypothesis that states that
the outcomes of the provincial methods and this study will not be different, and supports
the hypothesis. The difference between the outcomes is not in the total volume, but in
reporting the volumes of all species present on the land base, not simply the dominant
species.
WOOD RESOURCES AVAILABLE TO RURAL AND REMOTE COMMUNITIES There appear to be five major differences between the wood resources available
to the rural community compared to the remote community: i) the number of species
present; ii) the area of the reserve land and surrounding Crown land; iii) the total volume
present on the land base; iv) the growth rate; and v) access to commercial forest
operations.
In LSFN, there are more species found on the land base with a total of 16 species
compared to 10 species found in SLFN. This may be a result of longer growing seasons
experienced at a more southern latitude or a result of the different soils found in the
LSFN area compared to those in SLFN which may favour the growth of different
species (Botkin and Simpson 1990, Krawchuk et al. 2012). Species not found in SLFN
that were found in LSFN include cherry species, maple species, white and red pine, and
eastern white cedar. This may be due to the location of LSFN and the environmental

147
conditions it experiences. For example, the soil type is found to different than those
found in SLFN, being more fertile and rich. The area experiences a longer growing
season and less harsh winters compared to SLFN (Kemp 1991) and may be influenced
from warm fronts moving across the prairie provinces or northern prairie states (Botkin
and Simpson 1990; Krawchuk et al. 2012). Further, it is located closer to the GLSL
forest region and may be in the transition zone, which means that one would see some
more southern species in the forest composition.
The second major difference between the communities is the amount of area on
and off reserve land (shown in Figure 69) that the community may access providing
proper arrangements are made with federal or provincial ministries. LSFN has a total on-
reserve area covering 18 438 ha; volume estimates were calculated for the off-reserve
land in the Lac Seul Forest within a 150 km haul distance of the major community
center of Frenchman’s Head. The off reserve area provided an additional 160 192 ha for
a total of 178 630 ha. This number was determined by the principle investigator who
wanted to demonstrate the amount of volume present on the land base which could
theoretically support a BDHP. Comparatively, SLFN has a total on-reserve area of 5 031
ha, with the area surrounding the community totaling 69 611 ha for a grand total of 74
642 ha. The available area was restricted by the limited roads to access the various areas
of off-reserve land. The difference in area that each community could access has
influenced the volumes available on each community’s land base.
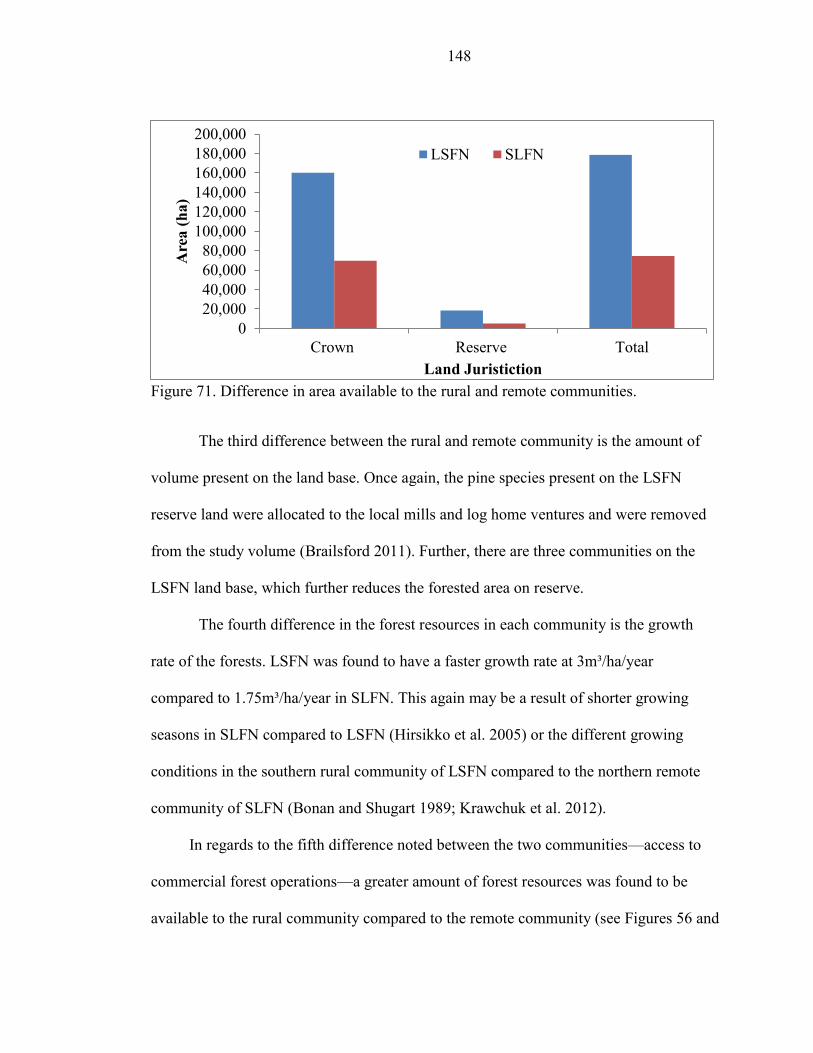
148
Figure 71. Difference in area available to the rural and remote communities.
The third difference between the rural and remote community is the amount of
volume present on the land base. Once again, the pine species present on the LSFN
reserve land were allocated to the local mills and log home ventures and were removed
from the study volume (Brailsford 2011). Further, there are three communities on the
LSFN land base, which further reduces the forested area on reserve.
The fourth difference in the forest resources in each community is the growth
rate of the forests. LSFN was found to have a faster growth rate at 3m³/ha/year
compared to 1.75m³/ha/year in SLFN. This again may be a result of shorter growing
seasons in SLFN compared to LSFN (Hirsikko et al. 2005) or the different growing
conditions in the southern rural community of LSFN compared to the northern remote
community of SLFN (Bonan and Shugart 1989; Krawchuk et al. 2012).
In regards to the fifth difference noted between the two communities—access to
commercial forest operations—a greater amount of forest resources was found to be
available to the rural community compared to the remote community (see Figures 56 and
020,00040,00060,00080,000
100,000120,000140,000160,000180,000200,000
Crown Reserve Total
Are
a (h
a)
Land Juristiction
LSFN SLFN

149
57). Sachigo Lake First Nation has greater restrictions on the amount of forest resources
available, including limitations set by provincial policies such as Ontario’s Far North
Act (2010) and the Indian Act (1987). These areas have restrictions on growth due to the
increased pressure to protect the boreal forest which has limited how communities living
in the Far North region can utilize their resources. Though the Far North Act does not
apply to reserve land, the Indian Act does. However, the Indian Act is not a perfect
system, is outdated, and the governing body AANDC focuses more on water and waste
issues than timber harvesting on reserve land. Despite there being a surplus of wood
resources in the Crown forests surrounding the community, there exist limitations in the
Far North Act and the Indian Act which may prohibit the use of resources in the
immediate future (Smith 2015).
Lac Seul First Nation experiences fewer limitations to access forest resources
than Sachigo Lake First Nation as opportunities in forest management are already in
place. This includes holding the license for forest operations on the surrounding forest
(Brailsford 2011). Given that harvest operations are taking place on the surrounding land
base, biomass may be captured as harvest waste from existing forest operations, and the
presence of a sawmill in nearby Hudson can provide additional biomass through wood
scraps and waste (McKendry 2002; Puddister et al. 2011). Additionally, within the Lac
Seul FMU, LSFN has been given an area to manage for community usage (Brailsford
2011) by the province. If sufficient biomass cannot be captured from harvest or mill
byproducts, the reserve lands or lands set aside for LSFN can be managed to produce
biomass. One area that is set out in the FMP (Brailsford 2011) is to eliminate the balsam
fir content which could provide a resource of biomass during other management

150
activities. The amount of balsam fir on the land base is higher than the historic average
due to fire suppression and lack of replanting during the 1970’s. The community and the
FMP have identified that they would like to reduce the amount of balsam fir on the land
base to a historic average. Another area that can provide biomass is managing to
improve forest health. In this area, roads and infrastructure are not limiting.
The terms “available” and “accessible” used in this report do not imply that
communities are legally able to access these resources. It simply means that the
resources are present on the land base and can be accessed providing the requirements of
the provincial and federal legislation are met. For LSFN, amendments can be made to
the FMP which would allow for wood flow to biomass facilities and may include further
agreements with nearby mills. Historically, the softwood from the LSF has been
destined for: MacKenzie Forest Products Inc. in Hudson, Ontario; Abitibi Consolidated
Company of Canada in Fort Frances (shut down at the time of writing); Domtar Inc. in
Dryden, Ontario; Bowater Canadian Forest Products Inc. in Thunder Bay; Atikokan
Forest Products Ltd. in Sapawe, and Terrace Bay Pulp Inc. Hardwood species were sent
to Weyerhaeauser Company Ltd. in Dryden, Ontario; Domtar Inc. in Dryden Ontario;
Northern Sawmills Inc. in Thunder Bay; for commercial energy production at the
AbitibiBowater mill in Fort Frances (shut down at time of writing); Bowater Canadian
Forest Products Inc. in Thunder Bay, and Buchanan Northern Hardwoods Inc. in
Thunder Bay (Brailsford 2011). According to the 2011-2021 Lac Seul Forest FMP, the
wood is destined for MacKenzie Forest Products Inc. in Hudson to be manufactured into
lumber and to Domtar Inc. in Dryden. There were other mills open at that time that are
now closed, such as the AbitibiBowater mill in Fort Frances, and mills that were closed

151
at the time which are now open, such as MacKenzie Forest Products Inc. in Hudson,
Ontario. In the current management plan, biomass for the purpose of supplying a BDHP
is not addressed (Brailsford 2011). On reserve land, the areas surrounding the
community are generally used for hunting, hiking, fuelwood and as a buffer between
homes and communities while some logs are used in the construction of log homes. This
volume has yet to be quantified. The Indian Act essentially limits harvesting on reserve
land until an approved plan is in place, but is not strongly adhered to by the governing
body AANDC or the community itself.
In summary, the research conducted in this study supports the rejection of the
null hypothesis and accepts the hypothesis that there is a difference between the wood
resources available to the remote community compared to the rural community. These
differences can be seen in the total volume and area for each community, the species
present, the growth rate of the forest, and the access to commercial forest operations.
WOOD PROPERTIES Several differences can be seen in wood properties between the rural and remote
communities. These include ash content, recoverable heat value of solid green wood also
referred to as thermal potential, and wood density. The first property compared was ash
content. As was noted in the previous section, there were some species that were not
present in both communities (i.e. cherry species, eastern white cedar, white and red pine,
and mountain maple) and thus these species were not able to be compared between
communities. The statistical analysis showed the ash content to be quite variable, with
significant differences between the two sites and between sites and published values. As
Bioenarea (2012) points out “the ash content may originate from the biomass itself, e.g.

152
materials that the plant absorbed from the water or the soil during its growth, or from the
supply chain, e.g. soil collected along with biomass.” However, both published and
tested values for these species showed their ash content to be below 1%; thus the
variability of the ash content is not an issue. According to Thek and Obernberg (2010)
ash content should be 0.7% or less to meet European Union standards for wood pellets,
while the Pellet Fuel Institute (2010) defines acceptable ash content to be equal to or less
than 1%.
Ash content is not a limiting factor for the use of biomass in either community;
the ash content falls below the threshold of 3% for commercial ventures and 1% for
domestic heating (Tarasov 2014). Öhman et al. (2002) recommend that ash-rich fuels,
such as logging residues and bark, should not be used in residential pellet boilers. Ash
must be managed in order to maintain proper function of the BDHP and prevent
slagging/residue buildup by regularly cleaning the wood boiler system (Bioenarea 2012).
Öhman et al. (2004) also notes that the strength of ash deposits (sintering/slagging) was
greatly affected by the fuel composition, which highlights a need for careful planning of
biomass fuel sources to the BDHP. Additional planning must be done to ensure that
waste disposal areas can support the increased amount of ash entering landfills (James et
al. 2012). James et al. (2012) noted that when there is an increase in the use of biomass
for energy, so too do the volumes of ash and residue entering landfills. Bark and foliage
have higher ash content than pure wood (Baxter 1993). For example, Hakkila (1989)
points out that average ash content of bark is 2.97%, while stem wood generally contains
0.3±0.1% ash content for softwoods and 0.5±0.3% for hardwoods. If the intent is to use
harvest residues in the case of LSFN, then ash may be an issue. Further, James et al.
153
(2012) highlight the major concern of an increased use of wood fuel, which is the need
to create storage, disposal, and use of the ash (James et al. 2012). In areas where landfill
expansion can be limited, there is an issue of increased ash volume leading to a decrease
in space available in landfills for storage of waste (James et al. 2012). Some studies have
been done which look at the effects of spreading ash in the forest or for other industrial
purposes (Campbell 1990; Demeyer et al. 2001; Pitman 2005; Abdullahi 2006 James et
al. 2012). It is unsure at this time what the most cost-effective method at disposing of
ash waste is in these communities, though simple disposal in landfills may be the ideal
option until another usage becomes operationally and economically feasible. In some
areas, ash may be used as a liming agent for roads, as a replacement for cement in
concrete (Abdullahi 2006) or in gardens as a fertilizer (Naylor and Schmidt 1986;
Pitman 2005). Care must be taken when using ash in gardens as it produces lye and salt
when wet which, in small quantities, does not damage plants; in large amounts it may
burn plants (Naylor and Schmidt 1986). Further studies are needed to determine the
proper use for ash in these communities.
Both communities are below the threshold for ash. However, if either decides to
use diseased wood, or primarily tops and branches, moisture content and ash content
must be monitored. Further, with an increase in ash content, there exists potential to lead
to an increased amount of waste in a landfill or to buildup of residues in boilers which
cause them to be inefficient. However, there are alternate uses for ash. This includes as a
liming agent for roads, an additive for concrete/cement/asphalt, fertilizer for gardens,
and potentially respreads in forests. Further exploration regarding the most cost-effective
methods for utilizing ash waste is required. MC must be monitored and maintained to

154
ensure thermal potential. This can be done by planning for storage and drying methods.
Roadside drying of slash piles or a storage bunker for chip drying are two options. When
planning for a BDHP operation, forest inventories and management plans can include
calculations of wood volume required based on thermal potential, rather than simple
wood volume.
The second wood property compared was the recoverable heat value of solid
wood, also referred to as thermal potential. The statistical analysis showed no significant
differences in thermal potential between sites and published values relative to species.
Larch, white spruce, and jack pine had roughly the same thermal values in SLFN and
LSFN, while alder, balsam poplar, trembling aspen, white birch, and willow had a
higher thermal potential in SLFN compared to LSFN. This may be a result of higher
density wood in SLFN that would yield a greater recoverable heat value. Tarasov (2014)
states, “heating value depends on the particular wood’s density, in other words how
much mass is contained in each unit volume.” Black spruce was the only species with a
lower recoverable heat value in SLFN compared to LSFN. The difference in thermal
values relative to published values may be due to the lack of studies conducted in
northern areas of the province.
The third wood property compared was the wood density of the available tree
species in both communities. The statistical analysis showed no significant differences
in wood density between sites and published values relative to species. There was some
variability in density observed in white birch, which had a higher density in LSFN
compared to SLFN, while black spruce and trembling aspen exhibited lower densities.
The differences in densities may be attributed to different growing seasons and growth

155
rates, or differences in site conditions. Miller (2010) points out that site factors leading
to phenotypic variation within a tree species can account for substantial variation in
wood density.
With regards to thermal properties and the recoverable heat values of wood from
the selected tree species, the SLFN samples appear to have a greater recoverable heat
value compared to the published values. Because recoverable heat values are closely
linked to density, and wood densities were found to be higher in SLFN compared to the
published values, these higher densities may help explain the differences in recoverable
heat values. For LSFN, we see some species—balsam fir, black spruce, cedar, jack pine,
red pine, trembling aspen and white birch—with a higher recoverable heat value than the
published values. This again may be closely linked to a higher density wood in the area
which in turn generates a higher recoverable heat value. In some cases, particularly for
balsam poplar and white pine, it can be seen that the published results have a lower
recoverable heat value than the published values. Overall, the recoverable heat values
for the species in LSFN were closer to published values than SLFN. This may be a result
of prior research being conducted on these species in similar latitudes or growing
conditions.
The density and thermal potential of wood will not limit the use of biomass for
district heating purposes in either community. Higher wood density leads to a greater
thermal potential per unit of wood, and results in a lesser amount of wood needed to
create the same amount of energy compared to wood with a lower density (Ragland et
al. 1991). For example, Miller (2015) found that since SLFN was found to have a higher
thermal potential, they will need to harvest less wood to produce the same amount of

156
energy compared to LSFN. Calculating harvest volumes required for BDHP operations
includes wood properties such as wood density, moisture content and thermal thermal
potential calculations as opposed to simple volume estimates (Sandström et al. 2007;
Alam et al. 2012). This may lead to a more accurate figure of how much wood volume is
needed to produce the required amount of heat.
One wood property that is important to monitor is the moisture content of wood.
The greater the moisture content, the lower the density and thermal potential (Guatam et
al. 2010). If moisture content is greater, then the amount of space per unit of wood is
filled with moisture, and if there exists a greater ratio of airspace to wood, the density is
lower and the moisture can be higher as it is filling the empty spaces in wood cells. If
density is low and moisture content is high, the thermal potential will be lower thus it is
important to maintain proper moisture content for the wood boiler units else they will
decrease efficiency and ultimately break down. Disease and rot can lead to a decrease in
density (Sandström et al. 2007). If the community plans to improve forest health and
remove the dead, dying and diseased for biomass, further studies could be done to
determine density, thermal potential, and ash content of diseased trees.
The results of this study suggest that the wood properties of the forest resources
included in this study differ from published properties. Some species exhibit the same or
similar properties while some are vastly different. In terms of density, it was noted that
some species in LSFN—alder, balsam fir, balsam poplar, cedar, white pine, red pine,
jack pine, trembling aspen and white birch—were found to be above the published range
of green wood density. Similarly, in SLFN, alder, balsam fir, balsam poplar, trembling
aspen and jack pine were found to have higher density than the existing published

157
values. This may be because the literature lacks published wood density for the further
north areas in Ontario.
In summary, the data suggests that we accept the null hypothesis and offers
support for the hypothesis that there is a no difference between wood properties
measured in the rural community compared to the remote community. Although it was
observed that the percentage of ash content found in SLFN was higher compared to that
of LSFN, both were under 1% and within standard’s thresholds. Similarly, while the
thermal potential of SLFN was higher than LSFN with the exception of black spruce, the
values were not significantly different. Further, wood density was higher in SLFN
compared to LSFN with the exception of trembling aspen; however, not significantly
different.

158
CHAPTER 6: CONCLUSIONS AND RECOMMENDATIONS
SUMMARY OF ARGUMENTS Several conclusions can be inferred from this research. To address the
hypotheses of the study: There is a difference between government-generated forest
inventory methods and outcomes and the study methods and outcomes; there is a
difference between the forest resources present in a rural community compared to a
remote community; there is no difference between the published wood properties and
the properties sampled in this study; and there is no difference between the wood
properties in the remote community compared to the rural. The inference for this study is
limited to LSFN and SLFN and the Crown land surrounding the two communities.
The difference between the two forest inventory methods outcomes can be
attributed to the inclusion of all species when determining species composition
(LUWSTF methods), not simply the lead species (OMNRF methods). This gives a more
accurate representation of the species present on the land base, which may allow for
better forest management planning, particularly for biomass which is currently not
considered in management plans. The difference in forest resources present in each
community may be attributed to the locations at different latitudes, which present
different growing conditions that would accommodate a greater or lesser variety of
species.
Although there is no significant difference between published wood properties
and those determined by this study, the variability observed between communities and
published values may be attributed to the lack of published wood properties from
northern locations, specifically, northwestern Ontario. There exist some published

159
values from the Atikokan area in northwestern Ontario, but none from the Far North
region. Further, and this is reiterated when explaining the fourth hypothesis, the
variability in densities can be attributed to the slower growing forests found in the
northern boreal. The variability between wood properties in the rural and remote
communities can be explained somewhat by the different growing conditions
experienced in the two communities. The community located further north overall had
higher ash content, density, and recoverable heat value compared to the community
located further south. Conversely, Hosegood (2011) found no statistical differences in
thermal potential and ash content when comparing these values from tree species found
near Thunder Bay, Ontario and Atikokan, Ontario. These communities are located
roughly at the same latitude about 200 km apart from each other longitudinally.
Although the study is similar, the communities are not separated by the same
geographical space, particularly in the latitudinal aspect. This summarizes the overall
findings of this study.
Although the studies which attempt to quantify and qualify the amount and
quality of the wood resources present in each community for the purpose of supplying
biomass to a district heating operation, the issue of how to acquire the resource remains.
There are processes, procedures, and mechanisms through which communities are able
to access the resources through the governing federal and provincial departments, yet
they are not necessarily easy for communities to navigate. For example, the process of
applying and attaining a C-bLUP can be costly, as the communities of Pikangicum First
Nation and Cat Lake–Slate Falls First Nations have found when undergoing the process.
It would be important for each community to consider the next steps of the project, how

160
they would acquire the necessary funds and resources, and what the long-term goals are
for community improvement and forest management.
FUTURE STUDIES This study highlights the need for a number of further studies. To proceed further
with the potential installation of a BDHP in one rural and one remote community, a
feasibility study is required which includes a business plan, engineering reports, and a
more-detailed look into the policies which govern how resources may be used by a
community. Before projects can begin, it is important to have an understanding of the
policies and subsidies which impact how communities are able to access and acquire
funds and resources. An in-depth review of the policies would present an interesting
research project or study, as well as a review of the agencies that monitor and ensure
regulations are being followed and those that provide incentives for renewable energy
projects which may allow for a greater chance of success and longevity of BDHP
installations. As communities choose to move forward with various renewable energy
projects, there exists greater opportunities for future studies to explore conditions for
successful implementation.

161
LITERATURE CITED
Abbasi, T., and S.A. Abbasi. 2010. Biomass energy and the environmental impacts associated with its production and utilization. Renewable and Sustainable Energy Reviews 14(3):919-937.
Abdullahi, M. 2006. Characteristics of wood ash/OPC concrete. Leonardo Electronic Journal of Practices and Technologies 8:9-16.
[AANDC] Aboriginal Affairs and Northern Development Canada. 2010. R. v. Sappier; R. v. Pochies; R. v. Gray. https://www.aadnc-aandc.gc.ca/eng/1100100028620/1100100028621. October 17, 2014.
[AANDC] Aboriginal Affairs and Northern Development Canada. 2012. Off-Grid Communities. Aboriginal Affairs and Northern Development Canada. https://www.aadnc-aandc.gc.ca/eng/1314295992771/1314296121126
[AANDC] Aboriginal Affairs and Northern Development Canada. 2013a. Lac Seul Community Profile. Aboriginal Affairs and Northern Development Canada. Government of Canada. http://www.aadnc-aandc.gc.ca/eng/1357840942079/1360164073018. July 15 2015.
[AANDC] Aboriginal Affairs and Northern Development Canada. 2013b. Sachigo Lake Community Profile. Aboriginal Affairs and Northern Development Canada. Government of Canada. http://www.aadnc-aandc.gc.ca/eng/1357840942127/1360164683729. July 15 2015.
[AANDC] Aboriginal Affairs and Northern Development Canada. 2015a. About AANDC. Aboriginal Affairs and Northern Development Canada. http://www.aadnc-aandc.gc.ca/eng/1100100010023/1100100010027. July 28 2015.
[AANDC] Aboriginal Affairs and Northern Development Canada. 2015b. EcoENERGY for Aboriginal and Northern Communities Program. Aboriginal Affairs and Northern Development Canada. http://www.aadnc-aandc.gc.ca/eng/1100100034258/1100100034259. July 28 2015.
Alam, Md.B, R. Pulkki, and C. Shahi. 2008. Forest biomass availability in northwestern Ontario. Pp. xx-xx in Baker, A., M.C. Bolding, and W.D. Greene (eds.) Addressing Forest Engineering Challenges for the Future; Proceedings of the 31st Annual Meeting of the Council on Forest Engineering, Charleston, South Carolina, USA, June 22-25, 2008.
Alam, Md.B., R. Pulkki, C. Shahi, and T. Upadhyay. 2012. Modelling woody biomass procurement for bioenergy production at the Atikokan Generating Station in northwestern Ontario, Canada. Energies 5(12): 5065-5085.
Albert, S. 2007. Transition to a forest bioeconomy: A community development strategy

162
discussion. Journal of Rural and Community Development 2:64-83.
Alemdag, I.S. 1983. Mass equations and merchantability factors for Ontario softwoods. Can. For. Serv. Petawawa, Ont. Inf. Rep. PI–X–23.
Arriaga Marin, M., C.A. Canizares, and M. Kazerani. 2013. Renewable energy alternatives for remote communities in northern Ontario, Canada. IEEE Transactions on Sustainable Energy 4(3):661-670.
Arriaga Marin, M. 2015. Long-term renewable energy generation planning for off-grid remote communities. PhD dissertation. Electrical and Computer Engineering, University of Waterloo. Waterloo, ON. 121 pp.
ASTM D1002-84. 2007a. Standard test method for ash in wood. American Society for Testing and Materials. West Conshohocken, USA. 2 pp.
ASTM D5467-02. 2007b. Standard test method for gross calorific and ash values of waste materials. ASTM International, West Conshohocken, USA. 4 pp.
ASTM E711-87. 2013 Standard test method for moisture analysis of particulate wood fuels. American Society for Testing and Materials. West Conshohocken, USA. 2 pp.
ASTM D2395-14. 2014. Standard test methods for density and specific gravity (relative density) of wood and wood-based materials. ASTM International, West Conshohocken, USA. 6 pp.
Avelin, A., J. Skvaril, R. Aulin, M. Odlare, and E. Dahlquist. 2014. Forest biomass for bioenergy production – comparison of different forest species. Energy Procedia 61:1820-1823.
Baxter, L. 1993. Ash deposition during biomass and coal combustion: a mechanistic approach. Biomass Bioenergy 4(2): 85-102.
BC First Nations Forestry Council. 2008. Briefing document. BC bioenergy and First Nations: Essential participation and partnerships. http://www.fnforestrycouncil.ca/downloads/bioenergy_and_first_nations.pdf September 5, 2008. 12 pp.
Bioenarea. 2012. The Bioenergy System Planners Handbook. http://bisyplan.bioenarea.eu/Handbook-intro.html. October 20 2015.
Biomass Energy Resource Center. 2009. In Prince Edward Island’s capital city, a biomass pioneer just keeps on working. Biomass Energy Resource Center. http://www.biomassinnovation.ca/pdf/Case%20Studies/CaseStudy_CharlottetownDH2.pdf. September 12 2015.
[BIC] Biomass Innovation Center. 2014. Bioenergy training session modules. September 15-19 2014. Unpublished material.

163
Boileau P. 2015. Wataynikaneyap Power applauds provincial commitment to support remote First Nations communities. August 21 2015. http://wataypower.ca/node/211. Accessed September 3 2015.
Botkin, D.B. and L.G. Simpson. 1990. Biomass of the North American boreal forest. Biogeochemistry 9: 161–174.
Bonan, G.B., and H.H. Shugart. 1989. Environmental factors and ecological processes in boreal forests. Annual Review of Ecology and Systematics 20:1-28.
Bradburn, K. 2014. Report on the status of bioenergy in Canada. Canadian Bioenery Association. http://www.bioenergytrade.org/downloads/canada-country-report-2014-Feb-23.pdf. January 29 2015.
Bradley, D. 2006. Canada Biomass-Bioenergy Report. Climate Change Solutions. https://bioenergytrade.org/downloads/canadacountryreportmay312006.pdf. May 23 2015.
Brailsford, A. 2011. Lac Seul Forest 2011-2021 Forest Management Plan. file:///C:/Users/owner/Downloads/MU702_2011_FMP_P1_TXT_PlanText.pdf. April 2014.
Brandt, J.P. 2009. The extent of the North American boreal zone. Environmental Reviews 17: 101-161.
British North America Act, 1867. 30-31 Vict., c. 3 (U.K) – Enactment no. 1. http://canada.justice.gc.ca/eng/rp-pr/csj-sjc/constitution/lawreg-loireg/p1t11.html. January 23 2015.
Brody, T. 2015. NAN, Wataynikaneyap Power respond to creation of special Pan-Canadian Task Force. Sioux Bulletin. 24(38). July 29, 2015. http://www.siouxbulletin.com/nan-wataynikaneyap-power-respond-to-creation-of-special-pan-canadian-task-force. September 3 2015.
Burlando, C. 2012. Land use planning policy in the Far North Region of Ontario: Conservation targets, politics of scale, and the role of civil society organizations in Aboriginal-state relations. Ph.D dissertation. Natural Resources Institute, Univ. of Manitoba. Winnipeg, MB. 315 pp.
Carlson, M. and C. Chetkiewicz. 2012. A fork in the road: Future development in Ontario's Far North. Canadian Boreal Initiative. Ottawa, ON. xx + 61 pp.
Carlson, M., J. Wells, and M. Jacobson. 2015. Balancing the relationship between protection and sustainable management in Canada’s boreal forest. Conservation and Society 13(1):13-22.
164
Campbell, A.G. 1990. Recycling and deposing of wood ash. Tappi Journal 73(9):141-146.
Canadian Environmental Assessment Act, 2012. S.C. 2012, c. 19, s. 52.
Canadian Biomass. 2011. Ontario introduces new forest tenure act. Canadian Biomass. February 25 2011. http://www.canadianbiomassmagazine.ca/news/ontario-introduces-new-forest-tenure-act-2317. September 17 2015.
Cartwright, J. 2003. Environmental groups, Ontario’s Lands for Life process and the Forest Accord. Environmental Politics 12(2):115-132.
Chaundhry, M.A. 1981. Regeneration Survey Manual for Ontario. Forest Ecology. Ontario Ministry of Natural Resources. xx + 76 pp. Community Energy Association. 2013. Small-scale biomass district heating handbook - A guide for BC communities. 46 pp.
Community Energy Association. 2014. Small-scale biomass district heating handbook - A reference for Alberta and BC local governments. 46 pp.
Constitution Act, 1982. R.S.C. 1982.
[CFSA] Crown Forest Sustainability Act, S.O. 1994, c. 25.
Crown Lands and Forests Act, SNB 1980, c C-38.1.
Council of the Federation, The. 2015. Canadian Energy Strategy. The Council of the Federation. Canada’s Premiers. July 2015. http://www.canadaspremiers.ca/phocadownload/publications/canadian_energy_strategy_eng_fnl.pdf. Accessed September 3 2015.
Denholm, K.A., L.W. Schut, and D.E. Irvine. 1993. Field Manual for Describing Soils in Ontario, 4th Ed. Ontario Agricultural College. Department of Land Resource Science. Guelph, ON. xx pp.
Demeyer, A., J. Voundi Nkana, and M. Verloo. 2001. Characteristics of wood ash and influence on soil properties and nutrient uptake: An overview. Biosource Technology 77:287-295.
Demirbas, A. 2003. Combustion characteristics of different biomass fuels. Progress in Energy and Combustion Science 30:219-230.
Demirbas, A. 2005. Potential applications of renewable energy sources, biomass combustion problems in boiler power systems and combustion related environmental issues. Progress in Energy and Combustion Science 31:171-192.
Dornburg, V. and A.P.C. Faaij. 2001. Efficiency and economy of wood-fired biomass energy systems in relation to scale regarding heat and power generation using combustion and gasification technologies. Biomass and Bioenergy 21(2):91-108.

165
Driben, P. 1986. Revisiting the RCNE: An evaluation of the recommendations made by the Royal Commission on the Northern Environment conerning the Native people in northern Ontario. Native Studies Review 2(1):45-67.
[Electric Utilities Act] Electric Utilities Act Micro-generation Regulation. 2008. Alberta Regulation 27/2008.
Electricity Act, 1998, S.O. 1998, c. 15, Schedule A.
Eriksson, O., G. Finnvenden, T. Ekvall, and A. Björklund. 2007. Life cycle assessment of fuels for district heating: A comparison of waste incineration, biomass- and natural gas combustion. Energy Policy 35(2):1346-1362.
Environmental Assessment Act, R.S.O 1990. c. E. 18.
Environmental Protection Act, R.S.O. 199. c. E. 19. Reg. 347: General – Waste Management.
Far North Act, S.O. 2010, c. 18. The Far North Act: An Act with Respect to Land Use Planning and Protection in the Far North. (Bill 191). 2010.
First Nations Land Management Act. S.C. 1999. c. 24.
[FAO] Food and Agriculture Organization of the United Nations. 2004. UBET - Unified Bioenergy Terminology. FAO Forestry Department Wood Energy Programme. Italy. 50 pp.
Ford-Robertson, F.C. 1971. Terminology of Forest Science, Technology, Practice and Products. Society of American Foresters, Washington, DC. 349 pp.
Fort Frances Times. 2005. Abitibi to shut down Kenora Mill. Fort Frances Times. July 28 2005.http://www.fftimes.com/news/news/abitibi-shut-down-kenora-mill. September 3 2015.
Francoeur, R. 2015. Pan-Canadian Task Force to reduce diesel use in remote communities. Electrical Business. July 21 2015. http://www.ebmag.com/generation/pan-canadian-task-force-to-reduce-diesel-use-in-remote-communities-17629. September 3 2015.
Franklin, J.F., R.J. Mitchell, and B.J. Palik. 2007. Natural disturbances and stand development principles for ecological forestry. United States Department of Agriculture. Forest Service. Northern Research Station. General Technical Report NRS-19.
Fuller, W. 1985. Chip pile storage-a review of practices to avoid deterioration and economic losses. Tappi Journal 68(8): 48-52.
Gardner, H. T., S.R. Tsuji, D.D. McCarthy, G.S. Whitelaw, and L.J. Tsuji. 2012. The Far North Act (2010) consultative process: A new beginning or the

166
reinforcement of an unacceptable relationship in northern Ontario, Canada. The International Indigenous Policy Journal 3(2):7-21.
Gautam, S., R. Pulkki, C. Shahi, and M. Leitch. 2010. Economic and energy efficiency of salvaging biomass from wildfire burnt areas for bioenergy production in northwestern Ontario: A case study. Biomass and Bioenergy 34(11):1562-1572.
Gerasimov, Y., S. Senko, and T. Karjalainen. 2013. Nordic forest energy solutions in the Republic of Karelia. Forests 4:945-967.
Germain, L. 2013. Biomass demo launched in Park. Sherwood Park News. January 24 2013. http://www.sherwoodparknews.com/2013/01/24/biomass-demo-launched-in-park. September 10 2015.
GIM International. 2014. Blom increases Finnish remote sensing-based forest project. GIM International. http://www.gim-international.com/content/article/blom-increases-finnish-remote-sensing-based-forest-project. May 20 2014.
Giddings, B., and C. Underwood. 2007. Renewable energy in remote communities. Journal of Environmental Planning and Management 50(3): 397-419.
Golden, D.M., M.A. Smith, and S.J. Columbo. 2011. Forest carbon management and carbon trading: A review of Canadian forest options for climate change mitigation. The Forestry Chronicle 87(5):625-635.
Golden, D.M., C. Audet, and M.A. (Peggy) Smith. 2014.“Blue-ice”: Framing climate change and reframing climate change adaptation from the indigenous peoples' perspective in the northern boreal forest of Ontario, Canada. Climate and Development 7(5):401-413.
Gonzalez, J.S. 1989. Average stemwood density of Canadian tree species derived from biomass studies. Paper presented at the 7th Canadian Bioenergy R&D seminar, April 24–26, 1989. Ottawa, Ont.
Green Energy Act, S.O. 2009. c. 12, Sched. A, s 2. http://www.ontario.ca/laws/statute/09g12.
Greenpeace. 2010. Response to the “Propose Framework to Modernize Ontario’s Forest Tenure and Pricing System”. http://www.greenpeace.org/canada/Global/canada/report/2010/7/Greenpeace%20Response%20to%20Proposed%20Tenure%20Reforms.pdf. September 19 2015.
Gross, D. 2014. How Ontario is winning the war on coal (according to an American). The National Post, Toronto, ON. Aug. 7, 2014. http://news.nationalpost.com/news/canada/how-ontario-is-winning-the-war-on-coal-according-to-an-american. September 10 2014.
Gustavsson, L., L. Eriksson, and R. Sathre. 2011. Costs and CO2 benefits of recovering,

167
refining and transporting logging residues for fossil fuel replacement. AppliedEnergy 88:192-197.
Hakkila P. 1989. Utilization of residual forest biomass. Springer Series in Wood Science. Springer Verlag, Berlin. 568 pp.
Hall, H. and B. Donald. 2009. Innovation and creativity on the periphery: Challenges and opportunities in northern Ontario. Working Paper Series: Ontario in the Creative Age. Martin Prosperity Institute. Rotman School of Management. University of Toronto, ON. xx + 33 pp.
Hanson, E. n.d. Government Policy. The Indian Act. University of British Columbia. First Nations Studies Program. 2009. http://indigenousfoundations.arts.ubc.ca/home/government-policy/the-indian-act.html. September 19 2015.
Hemery, G. 2011. How to use a wedge prism relascope to measure basal area. Gabriel Hemery. http://gabrielhemery.com/2011/12/05/how-to-use-a-wedge-prism-relascope-to-measure-basal-area/. April 7 2015.
Hesselink, T.P. 2010. Increasing pressures to use forest biomass: A conservation viewpoint. The Forestry Chronicle 86(1):28-35.
Higman, S., J. Mayers, S. Bass, N. Judd, and R. Nussbaum. 2013. The Sustainable Forestry Handbook: A Practical Guide for Tropical Forestry. London, UK: Cromwell Press. 330 pp.
Hirsikko, A., L. Laakso, U. Hõrrak, P.P. Aalto, V-M. Kerminen, and M. Kulmala. 2005. Annual and size dependent variation of growth rates and ion concentrations in the boreal forest. Boreal Environment Research 10: 357-369.
Honer, T.G. 1967. Standard volume tables and merchantable conversion factors for the commercial tree species of central and eastern Canada. Can. Dept. Forestry Rural Devel., For. Mgmt. Res. and Serv. Inst. Info. Rep. FMR-X-5.
Honer, T.G., M.F. Ker, and I.S. Alemdag. 1983. Metric timber tables for the commercial tree species of central and eastern Canada. Can. For. Serv., Maritimes For. Res. Cent. Inf. Rep. MX-140. 42 pp.
Hosegood, S. 2011. Fuel characteristics of northwestern Ontario tree species and their components. M.Sc. dissertation. Faculty of Natural Resources Management, Lakehead University, Thunder Bay, ON. 122 pp.
Hosegood, S., M. Leitch, C. Shahi, and R. Pulkki. 2011. Moisture and energy content of fire-burnt tree species for bioenergy production: A case study of four tree species from northwestern Ontario. The Forestry Chronicle 87(1):41-47.
Hosszu, M. 2015. Untitled. M.Sc. dissertation. Faculty of Natural Resources

168
Management, Lakehead University, Thunder Bay, ON. Unpublished manuscript.
Hunt, L., and W. Haider. 2011. Fair and effective decision making in forest management planning. Society and Natural Resources 14(10):873-887.
Hurley, M.C., and J. Wherret. 2010. The report of the Royal Commission on Aboriginal Peoples. Parliamentary Research Branch. Library of Parliament. PRB 99-24E. 3 pp. http://www.parl.gc.ca/Content/LOP/ResearchPublications/prb9924-e.pdf. September 3 2015.
Hydro One Networks Inc. 2013. Hydro One Remote Communities Inc. 4GIRM 2014 Distribution Rate Application – Application and Evidence Filing. EB-2013-0142. http://www.hydroone.com/RegulatoryAffairs/Documents/EB-2013-0142/H1RC_APPL_20131025.pdf. December 17 2014.
[HORCI] Hydro One Remote Communities Inc. 2012. 2011 Greenhouse gas inventory report and action plan. Hydro One Remote Communities Inc. Thunder Bay, ON. xx + 61 pp.
[HORCI] Hydro One Remote Communities Inc. 2013. (Newsletter) Connected: Remote communities. Winter 2013-2014. http://www.hydroone.com/OurCommitment/RemoteCommunities/Connected%20Newsletter/REMOTES%20Connected%20Winter%202013%20ENGLISH.pdf. December 17 2014.
Indian Act, R.S.> 1985, c.1-5.
[INAC] Indian and Northern Affairs Canada. 1991. Report of the Royal Commission on Aboriginal Peoples 1(10). Canada Communication Group – Publishing. Ottawa, ON.
Indian Timber Harvesting Regulations. SOR/2002-109. 2002. 1954.
Indian Timber Regulations. C.R.C., c. 961. s. 3(F). 1954.
James, A.K., R.W. Thring, S. Helle, and H.S. Ghuman. 2012. Ash management review – Applications of biomass bottom ash. Energies 5: 3856-3873.
Jenkins, B.M., L.L. Baxter, T.R. Miles Jr., and T.R. Miles. 1998. Combustion properties of biomass. Fuel Processing Technologies. 54:17-46.
Jessome, A.P. 2000. Strength and related properties of woods grown in Canada. Publication SP-514E. Forintek Canada Corporation, Ottawa, ON. 37 pp.
Kanury. A. 1994. Combustion characteristics of biomass fuels. Combustion Sci. Technology 97: 469-491.

169
Kemp, D.D. 1991. The climate of northern Ontario. Occasional Paper Number 11. Lakehead University. Centre for Northern Studies, Thunder Bay, ON. 87 pp.
Kinsella, N.A. (Hon.). 2009. Apology to students of Indian residential schools. Canada. Parliament. Edited Hansard 146(45). 40th Parliament, 2nd session. http://www.parl.gc.ca/Content/Sen/Chamber/402/Debates/045db_2009-06-11-e.htm#23. September 23 2015.
Kloss, D. 2002. Strategic Forest Management Model, Version 2.0 User Guide. Forest Management Planning Section, Forest Policy Management Branch, Ont. Min. Nat. Res. Queen's Printer for Ontario, Toronto, Ontario.
KNET First Nation Communities. 2009. Sachigo Lake. http://firstnation.ca/sachigo-lake. November 20 2014.
Krawchuk, M., K. Lisgo, S. Leroux, P. Vernier, S. Cumming, and F. Schiegelow. 2012. Boreal forest, Canada pp 69-81 in Hilty, J.A., C. Chester, and M.S. Cross (eds). Climate and Conservation: Landscape and Seascape Science, Planning and Action. Island Press, Washington DC. 392 pp.
Kurz, W.A. and M.J. Apps. 1993. Contribution of northern forest to the global cycle: Canada as a case study. Water Air Soil Pollution 70:163–176.
Lac Seul First Nation. n.d. About Lac Seul First Nation. http://lacseul.firstnation.ca/. November 20 2014.
Leckie, D.G., and M.D Gillis. 1995. Forest inventory in Canada with emphasis on map production. The Forestry Chronicle 71(1):74-88.
LECO Corporation. 2001. TGA-601 Instructional Manual. LECO Corporation. MI, USA.
Lemmen, D.S., F.J. Warren, J. Lacroix, and E. Bush (eds.) 2008. From impacts to adaptation: Canada in a changing climate 2007. Natural Resources Canada. Government of Canada, Ottawa, ON. xx + 448 pp.
Lintner, A. 2014. Far north at risk unless Ontario adopts new inclusive planning process. Ecojustice. https://www.ecojustice.ca/media-centre/press-releases/far-north-at-risk-unless-ontario-adopts-new-inclusive-planning-process-report. Oct. 7 2014.
Lora, E.S., and R.V. Andrade. 2009. Biomass as energy source in Brazil. Renewable and Sustainable Energy Reviews 13: 777–788.
Lowe, J.J., K. Power, and S.L. Gray. 1996. Canada’s forest inventory 1991: The 1994 version. An addendum to Canada’s forest inventory 1991. Pacific Forestry Centre. Canadian Forest Service Pacific and Yukon Region Pacific Forestry Centre. Information report BC-X-362E.

170
http://www.cfs.nrcan.gc.ca/pubwarehouse/pdfs/4590.pdf. July 17 2015.
Lund, H., B. Möller, B.V. Mathiesen, and A. Dyrelund. The role of district heating in future renewable energy systems. Energy 35(3):1381-1390.
Mabee, W., J. Mirck, and R. Chandra. 2011. Energy from forest biomass in Ontario: Getting beyond the promise. The Forestry Chronicle 87(1):61-70.
Mackenzie, J. 2013. Environmental laws on First Nation reserves: Bridging the regulatory gap. Aboriginal Law Section. Department of Justice Canada. Slideshow presented at Site Remediation in B.C. From Policy to Practice. B.C Ministry of Environment. March 7-8, 2013. July 27 2015.
Madlener, R. 2007. Innovation diffusion, public policy, and local initiative: the case of wood-fuelled district heating systems in Austria. Energy Policy 35(3):1992-2008.
Mainville, N. 2011. Fuelling a biomess. Why burning trees for energy will harm people, the climate, and forests. Greenpeace. Montreal, Canada. http://www.greenpeace.org/canada/Global/canada/report/2011/10/ForestBiomess_Eng.pdf. February 3 2015.
McCallum, B., and M. Conroy. 1998. Forest biomass for energy: is it a realistic option for remote communities? pp. 1-5 in J. Richardson (ed.) Bioenergy and Boreal Forest Management. International Energy Agency (IEA) - Bioenergy Agreement Task XII: Biomass Production, Harvesting, and Supply Forest Management Activity. Proceedings of a workshop held in Timmins, Ontario, Canada, September 23, 1997. Scientific and Technical Publications, Science Branch Canadian Forest Service, Natural Resources Canada Ottawa, 1998.
McCallum, B. 2010. Warming the neighbourhood. Canadian Biomass, February 28 2010. http://www.canadianbiomassmagazine.ca/news/warming-the-neighbourhood-1676. August 28 2015.
McCullough, D.G., R.A. Werner, and D. Neumann. 1998. Fire and insects in northern and boreal forests ecosystems of North America. Annual Review of Entomology 43:107-127.
McKendry, P. 2002. Energy production from biomass (part 1): Overview of biomass. Bioresource Technology 83(1):37-46.
McLure, N. 2009. A general description of the timber supply chain in Georgia and the southern United States. Georgia Forestry Commission. GA, USA. 3 pp.
Miller, S. 2010. Is wood characteristics mapping an opportunity to optimize the value chain in northwestern Ontario? A case study considering eastern larch (larix

171
laricina (du roi) k. koch) grown in the Thunder Bay District. M.Sc. dissertation. Faculty of Natural Resources Management, Lakehead University, ON.197 pp.
Miller, A.C. 2011. From the Indian Act to the Far North Act: Environmental racism in First Nations communities in Ontario. Department of Environmental Studies. Queen’s University. Kingston, Ontario. 55 pp. http://www.queensu.ca/ensc/sites/webpublish.queensu.ca.enscwww/files/files/501/Miller_ENSC501.pdf. Oct. 31, 2015.
Miller, S. 2015. Assessment of the Available Forest Biomass for the Biomass Community Heating Prefeasibility Study. Unpublished Report. Lakehead University Wood Science Testing Facility, Faculty of Natural Resources Management, Lakehead University, Thunder Bay. 21 pp.
Misra, M., K. Ragland, and A. Baker. 1993. Wood ash composition as a function of furnace temperature. Biomass and Bioenergy 4(2):103-113.
Ministry of Infrastructure and Ministry of Northern Development, Mines and Forestry. 2011. An introduction to the growth plan for northern Ontario. Queen's Printer for Ontario, Toronto. 17 pp.
[MNRE] Ministry of New and Renewable Energy. 2009. Biogas generation, purification, and bottling development in India – A case study. Ministry of New and Renewable Energy. India. http://mnre.gov.in/file-manager/UserFiles/case-study-Biogas-Generation_Purification_and_Bottling-Development-In-India.pdf June 3 2015.
[NAFA] National Aboriginal Forestry Association. 2015. Third report on First Nation-held forest tenure in Canada 2015. National Aboriginal Forestry Association. Ottawa, Ontario. 42 pp.
[NRCan] Natural Resources Canada. 2013. Bioenergy from biomass. Natural Resources Canada. http://www.nrcan.gc.ca/forests/industry/bioproducts/13323. November 6 2014.
[NRCan] Naural Resouces Canada. 2014. About Renewable Energy. Natural Resources Canada. April 11 214. http://www.nrcan.gc.ca/energy/renewable-electricity/7295#bio. November 2 2015.
Neegan Burnside Ltd. 2004. Sharing the story: Aboriginal and northern energy experiences – Energy efficiency and renewable energy. Indian Affairs and Northern Development, Ottawa, ON. xx + 88 pp.
[NAN] Nishnawbe Aski Nation. 2010. NAN slams provincial government for lack of consultation. Thunder Bay, Ontario. http://www.nan.on.ca/upload/documents/com-2010-09-30-nan-slams-premier.pdf. October 07 2014.
172
[NAN] Nishnawbe Aski Nation. 2015. About us. Nishnawbe Aski Nation. 2015. http://www.nan.on.ca/article/about-us-3.asp. November 2 2015.
Natcher, D.C. 2001. Land use research and the duty to consult: a misrepresentation of the Aboriginal landscape. Land Use Policy 18: 113-122.
Naylor, L.M., and E.J. Schmidt. 1986. Agricultural use of wood ash as a fertilizer and liming agent. Tappi 69(10): 114-119.
Newton, J., C.D.J. Paci, and A. Ogdnen. 2005. Climate change and natural hazards in northern Canada: Integrating indigenous perspectives with government policy. Mitigation and Adaption Strategies for Global Change 10:541-571.
O’Flaherty, M.O., I.J. Davidson-Hunt, and M. Manseau. 2008. Indigenous knowledge and values in planning for sustainable forestry: Pikangikum First Nation and the Whitefeather Forest Initiative. Ecology and Society 13(1): 6.
Öhman, M., C. Boman, H. Hedman, A. Nordin, and D. Boström. 2002. Slagging tendencies of wood pellet ash during combustion in residential pellet burners. Biomass and Bioenergy 27(6):585-596.
[OFIA] Ontario Forest Industries Association. 2015. Ontario’s forest products sector – Our greenest opportunity. Planning for generations: Putting wood to work. OFIA 2015 pre-budget submission. Ontario Forest Industries Association. 11 pp.
[OFTMA] Ontario Forest Tenure Modernization Act, 2011. S.O. 2011, c. 10.
[OMOE] Ontario Ministry of Education. 2011. First Nation Treaty Education in Ontario. Slideshow presented at the Circle of Light 2011: A First Nation, Métis and Inuit Education Conference. November 14-16 2011. http://www.edu.gov.on.ca/eng/aboriginal/5J_COL2011TreatyEducation.pdf. September 2014.
[OMNR] Ontario Ministry of Natural Resources. 2002. Provincial landcover 2000 – 27 classes. SPECTRANALYSIS Inc. Ont. Min. Nat. Res.
[OMNR] Ontario Ministry of Natural Resources. 2004. Ontario Tree Marking Guide Version 1.1. Queen's Printer for Ontario, Toronto..
[OMNR] Ontario Ministry of Natural Resources. 2009. Forest Management Planning Manual for Ontario’s Crown Forests. Queen’s Printer for Ontario, Toronto. 447 pp.
[OMNR] Ontario Ministry of Natural Resources. 2010. Land Use Strategy. Ottawa, Ontario: Queen's Printer for Ontario.
[OMNR] Ontario Ministry of Natural Resources. 2011. Ontario Ministry of Natural Resources Growth and Yield Program PSP and PGP Reference Manual. Ont. Min. Nat. Res.Toronto. Queen’s printer for Ontario. 524 pp.

173
[OMNR] Ontario Ministry of Natural Resources. 2014a. An inventory of forest resources in Ontario. Ont. Min. Nat. Res.Toronto. Queen’s Printer for Ontario. 2 pp.
[OMNR] Ontario Ministry of Natural Resources. 2014b. Far North of Ontario. Ontario Ministry of Natural Resources. https://www.ontario.ca/environment-and-energy/far-north-ontario. October 7 2014.
[OMNR] Ontario Ministry of Natural Resources. 2014c. Forest Regions of Ontario. Ontario Ministry of Natural Resources. July 30 2014. http://www.ontario.ca/page/forest-regions. September 5 2015.
[OMNR] Ontario Ministry of Natural Resources. 2015a. Forest management planning. Ontario Ministry of Natural Resources. http://www.ontario.ca/page/forest-management-planning. September 11 2014.
[OMNR] Ontario Ministry of Natural Resources. 2015b. Land use planning process in the Far North. Queen’s Printer for Ontario, Toronto, ON.. http://www.ontario.ca/page/land-use-planning-process-far-north. August 23 2015.
[OMNDM] Ontario Ministry of Northern Development and Mines. 2014. First Nation Partnerships. Ministry of Northern Development and Mines. http://www.mndm.gov.on.ca/en/ring-fire-secretariat/first-nations-partnerships. October 7 2014
Ontario Water Resources Act, R.S.O. 1990, c. O.40.
Orton, D. 1996. Social environmentalism and native relations. Green Web Bulletin #50. http://www.hartford-hwp.com/archives/25b/005.html. Accessed September 10 2015
Panel on Research Ethics. 2010. Tri-council policy statement: Ethical conduct of research involving humans, 2nd edition (TCPS 2). Government of Canada. Ottawa, ON.
Pellet Fuel Institute. 2010. Pellet Fuels Institute Standard Specification for Residential/Commercial Densified Fuel. Pellet Fuel Institute, Arlington, USA. 9 pp.
Penner, M., K. Power, C. Muhairwe, R. Tellier, and Y. Wang. 1997. Canada’s forest biomass resources: Deriving estimates from Canada’s forest inventory. Landscape Management Network. Can. For. Serve. Pacific Forestry Centre. Nat. Res. Can. Info. Rep. BC-X-370. xx + 33 pp.
Perera, A.H., D.L. Euler, and I. Thompson. 2001. Ecology of a Managed Terrestrial Landscape: Patterns and Processes of Forest Landscapes in Ontario. UBC Press. 352 pp.

174
Pitman, R.M. 2005. Wood ash use in forestry – a review of the environmental impacts. Forestry 79(5): 563-588.
Puddister, D., S.W.J. Dominy, J.A. Baker, D.M. Morris, J. Maure, J.A. Rice, T.A. Jones, I. Majumdar, P.W. Hazlett, B.D. Titus, R.L. Fleming, and S. Wetzel. 2011. Opportunities and challenges for Ontario’s forest bioeconomy. The Forestry Chronicle 87(4):468-477.
Puglaas (J. Wilson-Raybould) and Raybould, T. 2011. Governance toolkit: A guide to nation building. British Columbia Assembly of First Nations, Vancouver. http://www.bcafn.ca/toolkit/pdf/Part1Tabs.pdf. September 20 2015.
Pukkala, T. 2014. Does biofuel harvesting and continuous cover management increase carbon sequestration? Forest Policy and Economics 43:41-50.
Pulkki, R. 2001. Role of supply chain management in wise use of wood resources. South African Forestry Journal 191: 89-95.
Pulkki, R. 2003. Minimizing negative environmental impacts of forest harvesting operations pp. 581-628 (Ch.15) in Burton, P.J., C. Messier, D.W. Smith, and W.L Adamowicz (eds.) Towards Sustainable Management of the Boreal Forest. NRC Research Press, Ottawa, Ontario, Canada. 971 pp.
Puttock, D., D. McGregor, and E. Bevilacqua. 1998. A forest management planning strategy for remote communities. Great Lakes For. Cent. Nat. Res. Can. Inf. Rep. GLC-X-2. 13 pp.
Quack, P., H. Knoef, and H. Stassen. 1999. Energy from Biomass: A Review of Combustion and Gasification Technologies. World Bank Technical Paper No. 422. Energy Series. xx + 70 pp.
QUEST Canada and CABREE. 2012. Integrated community energy system business case study. Strathcona County community energy system. Quality Urban Energy Systems of Tomorrow (QUEST) and Center for Applied Business Research on Energy and Environment (CABREE) Alberta School of Business.
R. v. Sappier; R. v. Gray, [2006] 2 SCR 686, 2006 SCC 54.
Ragland, K., D. Aerts, and A. Baker. 1991. Properties of wood for combustion analysis. Biosource Technology 37: 161-168.
Rentizelas, A., A. Tolis and I. Tatsiopoulos. 2009. Logistics issues of biomass: The storage problem and the multi-biomass supply chain. Renewable and Sustainable Energy Reviews 3:887-894.
Rezaie, B., and M.A. Rosen. 2012. District heating and cooling: Review of technology and potential enhancements. Applied Energy 93:2-10.
Rice, L. 2011. Rates and Billing Conservation & Renewable Energy Program (CARE) -
175
Hydro One Remote Communities Inc. in Proc. 9th Annual First Nations 2011 Northern Housing Conference, Thunder Bay, Canada, 2011
ROR Power and Western Biomass. 2010. Tsilhqot’in power project phase II call. ROR Power and Western Biomass. CEBC 2010. 21 pp.
Rosillo-Calle,. F., P. De Groot, J. Woods, V.V. Chandra, and S. Hemstock. 2015. General introduction to the basis of biomass assessment methodology 34-68 pp. in Rosillo-Calle,. F., P. De Groot, S. Hemstock, andJ. Woods, , and [eds]. The Biomass Assessment Handbook: Energy for a Sustainable Environment. Routlege. New York. 336 pp.
Rowe, L., R. Street, and N.R. Taylor. 2009. Identifying potential environmental impacts of large-scale development of dedicated bioenergy crops in the UK. Renewable and Sustainable Energy Reviews 13:271-190.
Sacchelli, S., P. Zambelli, P. Zatelli, and M. Ciolli. 2013. Biomasfor: An open-source holistic mdel for the assessment of sustainable forest energy. Journal of Biogeosciences and Forestry 6:285-293.
Sandström, F., H. Petersson, N. Kruys. and G. Ståhl. 2007. Biomass conversion factors (density and carbon concentration) by decay classes for dead wood of Pinus sylvestris, Picea abies, and Betula spp. in boreal forests of Sweden. Forest Ecology and Management 243(1):19-27.
Sapic, T. 2015. Far North region of Ontario including Treaty Areas. Faculty of Natural Resources Management. Lakehead University.
Seymour, S. 2015. An album of summer work experience. Unpublished materials.
Shields, G. 2014. Conference held to discuss regional development. Sioux Lookout Bulletin 23(46). September 24, 2014. http://www.siouxbulletin.com/conference-held-to-discuss-regional-development. September 10 2015.
Sims, R.A., W.D. Towill, K.A. Baldwin, and G.M. Wickware. 1997. Field guide to the forest ecosystem classification for northwestern Ontario. Northwestern Ontario Forest Technology Development Unit. Ontario Ministry of Natural Resources. Thunder Bay, Ontario. 210 pp.
Simpson, W.T. 1993. Specific gravity, moisture content, and density relationship for wood. Gen. Tech. Rep. FPL-GTR-76. Madison, WI. U.S. Department of Agriculture, Forest Service, Forest Products Laboratory. 13 pp.
Simpson, W.T., and A. TenWolde. 1999. Wood handbook—Wood as an engineering material. Gen. Tech. Rep. FPL–GTR–113. Madison, WI: U.S. Department of Agriculture, Forest Service, Forest Products Laboratory. 463 pp.
Singh, T. 1982. Biomass equations for ten major tree species of the prairie provinces.

176
Can. For. Serv., Edmonton, Alta. Inf. Rep. NOR–X–242.
Singh, T. and M.M. Kostecky. 1986. Calorific value variations in components of 10 Canadian tree species. Can. J. For. Res. 16:1378–1381.
Slack, E., L.S. Bourne, and M.S. Gertler. 2003. Small, rural and remote communities: The anatomy of risk. A paper prepared for the Panel on the Role of Government. Enid Slack Consulting and University of Toronto. xx + 38 pp.
Smith, M.A. 1995. Funding mechanisms for First Nation forest-based economic development. National Aboriginal Forestry Association. 29 pp.
Smith, M.A. 2015. A reflection on First Nations in their boreal homelands in Ontario: Between a rock and a caribou. Conservation and Society 13(1):23-28.
Somogyi, E., E. Cienciala, R. Makipaa, P. Muukkonen, A. Lentonen, and P. Weiss. 2007. Indirect methods of large-scale forest biomass estimation. European Journal of Forest Research 126:197-207.
Southcott, C., and V. Walker. 2009. A portrait of the social economy in northern Canada. The Northern Review 30:13-36.
Stockinger, H., and I. Obernberger. 2014. Life cycle analysis of district heating with biomass in Proceedings of the 10th European Bioenergy Conference June 8-11, 1998. Würzburg, Germany.
Stupak, I., A. Asikainen, M. Jonsell, E. Karltun, A. Lunnan, D. Mizaraite, K. Pasanen, H. Pärn, K. Raulund-Rasmussen, D. Röser, M. Schroeder, I. Varnagiryte, L. Vilkriste, I. Callesen, K. Clarke, T. Gaitneiks, M. Ingerslev, M. Mandre, R. Ozolincius, A. Saarsalmi, K. Armolaitis, H.S. Helmisaari, A. Indriksons, L. Kairiukstis, K. Katzensteiner, M. Kukkola, K. Ots, H.P. Ravn, and P. Tamminen. 2007. Sustainable utilisation of forest biomass for energy – Possibilities and problems: Policy, legislation, certification and recommendations and guidelines in the Nordic, Baltic, and other European countries. Biomass and Bioenergy 31(10):666-684. Proceedings of the WOOD-EN-MAN session at the conference Nordic Bioenergy 2005 Trondheim, Norway, Oct. 27, 2005.
Tarasov, D. 2014. Comparative analysis of wood pellet parameters: Canadian case study. M.Sc. dissertation. Faculty of Natural Resource Management, Lakehead University, ON. 102 pp.
Ter-Mikaelian, M.T., and M.D. Korzukhin. 1997. Biomass equations for sixty-five North American tree species. Forest Ecology and Management 97(1):1-24.
The Far North Science Advisory Panel. 2010. Science for a changing Far North: The report of the far North Science Advisory Panel. A report submitted to the Ontario Ministry of Natural Resources. June 2010. http://www.web2.mnr.gov.on.ca/FarNorth/sciencereports/Far_North_Science_Pa

177
nel_Report_Summary_June_2010.pdf. July 20 2014.
The Council of the Federation. 2015. Canadian Energy Strategy. The Council of the Federation. Canada’s Premiers. July 2015. http://www.canadaspremiers.ca/phocadownload/publications/canadian_energy_strategy_eng_fnl.pdf. September 3 2015.
Thek, G. and I. Obernberg. 2010. The Pellet Handbook: The Production and Thermal Utilization of Biomass Pellets, Earthscan, London, UK, 2010. 600 pp.
Thom, B. 1999. Rising to the test: Meeting Lamer’s test for Aboriginal rights and title after Delgamukw. Paper presented at the 1999 meeting of the Canadian Anthropoligical Society, Quebec City, QC. http://www.web.uvic.ca/~bthom1/Media/pdfs/abrights/tests.htm. Nov. 1, 2015.
Thompson, I.D., S.C. Maher, D.P. Rouillard, J.M. Fryxell, and J.A. Baker. 2007. Accuracy of forest inventory mapping: Some implications for boreal forest management. Forest Ecology and Management 252(1-3)208-221.
Treseder L., and N.T. Krogman. 1999. Features of First Nation forest management institutions and implications for sustainability. The Forestry Chronicle 75(5):793-798.
[TRCC] Truth and Reconciliation Commission of Canada. 2012. Truth and Reconciliation Commission of Canada: Calls to action. Winnipeg, MB. xx+11 pp.
[TRCC] Truth and Reconciliation Commission of Canada. 2015. Honouring the truth, reconciling for the future. Summary of the final report of the Truth and Reconciliation Commission of Canada. xx+382 pp.
[UNFCCC] United Nations Framework Convention on Climate Change. 2006. Annex 18 definition of renewable biomass. EB 23 report of the 23rd meeting of the executive board. February 22-24 2006. https://cdm.unfccc.int/EB/023/eb23_repan18.pdf. November 2 2015.
University of Minnesota. 2011. Conducting a woodland Inventory. Online Woodland Stewardship. http://woodlandstewardship.org/?page_id=4. June 1, 2015.
Vanclay, J.K. 2014. Allowable cut in forest management in Pancel, L. and M Köhl (eds.) Tropical Forestry Handbook, 2nd Edition. Springer. 1200 pp http://citeseerx.ist.psu.edu/viewdoc/download?doi=10.1.1.403.6496&rep=rep1&type=pdf. July 27 2015.
Verkerk, P.J., P. Anttila, J. Eggers, M. Lindner, and A. Asikainen. 2011. The realisable potential supply of woody biomass from forests in the European Union. Forest Ecology and Management 261(11): 2007-2015.

178
Walki, n.d. Biomass Cover: Maximize the energy value of forest residues. http://www.walki.com/web/images/Walki-BiomassCover_gb.pdf/$FILE/Walki-BiomassCover_gb.pdf. September 20 2015.
Ward, P.C., and W. Mawdsley. 2000. Fire management in Canadian boreal forests pp. 66-84 in Kasischke, E.S. and B.J. Stocks (eds.) Fire, Climate Change and Carbon Cycling in the Boreal Forest. Springer-Verlag. New York, NY. 452 pp.
Westman, C.N. 2005. Tutelage, development and legitimacy: A brief critique of Canada’s Indian Reserve forest management regime. The Canadian Journal of Native Studies 15(1):207-214.
Wilson J., and J. Graham. 2004. Relationships between First Nations and the forest industry: The legal and policy context. National Aboriginal Forestry Association, Ottawa, ON. http://www.nafaforestry.org/docs/IOGRptFeb2005.pdf. Oct. 31, 2015.
Windigo Education Authority. (n.d). Sachigo Lake First Nation. Windigo Education Authority. http://www.windigoeducation.on.ca/communities/sachigolake. November 20 2015.
Xu, H. 1999. A biomass model compatible with volume. Journal of Beiiung Forestry University 21(5):32-36.
Youden, H.L. 2010. Planning in Ontario’s Far North: Preservation, development and culture in policy. M.Sc. dissertation. School of Environmental Studies, Queen’s University, ON. 125 pp.
Zheng, G., J.M. Chen, Q.J. Tian, W.M. Ju, and X.Q. Xia. 2007. Combining remote sensing imagery and forest age inventory for biomass mapping. Journal of Environmental Management 85(3):616-623.
Zhurinsh, A. 1997. A feasibility to utilize wood of low-value deciduous species in charcoal production. Baltic Forestry 2:53-57.

APPENDICES

176
APPENDIX I FOREST INVENTORY ANALYSIS DATA
Site Authority Method Species Volume Percent Species Composition
Rural Crown LUWSTF Pj 10314214 46.17 Rural Crown LUWSTF Pr 0 0 Rural Crown LUWSTF Pw 0 0 Rural Crown LUWSTF Bf 1880336 8.42 Rural Crown LUWSTF Sb 8122868 36.36 Rural Crown LUWSTF Sw 0 0 Rural Crown LUWSTF Ce 100284 0.45 Rural Crown LUWSTF La 0 0 Rural Crown LUWSTF Pt 1083928 4.85 Rural Crown LUWSTF Pb 0 0 Rural Crown LUWSTF Bw 704128 3.15 Rural Crown LUWSTF Map 0 0 Rural Crown LUWSTF Ald 133712 0.6 Rural Crown LUWSTF Wil 0 0 Rural Crown LUWSTF Ch 0 0 Rural Crown LUWSTF AmS 0 0 Rural Crown OMNRF Pj 9567916 42.83 Rural Crown OMNRF Pr 0 0 Rural Crown OMNRF Pw 0 0 Rural Crown OMNRF Bf 2958269 13.24 Rural Crown OMNRF Sb 8253263 36.94 Rural Crown OMNRF Sw 0 0 Rural Crown OMNRF Ce 0 0 Rural Crown OMNRF La 0 0 Rural Crown OMNRF Pt 1197860 5.36 Rural Crown OMNRF Pb 0 0 Rural Crown OMNRF Bw 362161 1.62 Rural Crown OMNRF Map 0 0 Rural Crown OMNRF Ald 0 0 Rural Crown OMNRF Wil 0 0 Rural Crown OMNRF Ch 0 0 Rural Crown OMNRF AmS 0 0 Remote Crown LUWSTF Pj 10003071 87.81 Remote Crown LUWSTF Pr 0 0

177
Remote Crown LUWSTF Pw 0 0 Remote Crown LUWSTF Bf 0 0 Remote Crown LUWSTF Sb 135437 1.19 Remote Crown LUWSTF Sw 0 0 Remote Crown LUWSTF Ce 0 0 Remote Crown LUWSTF La 0 0 Remote Crown LUWSTF Pt 409827 3.6 Remote Crown LUWSTF Pb 0 0 Remote Crown LUWSTF Bw 623485 5.47 Remote Crown LUWSTF Map 0 0 Remote Crown LUWSTF Ald 200681 1.76 Remote Crown LUWSTF Wil 19112 0.17 Remote Crown LUWSTF Ch 0 0 Remote Crown LUWSTF AmS 0 0 Remote Crown OMNRF Pj 10351851 90.87 Remote Crown OMNRF Pr 0 0 Remote Crown OMNRF Pw 0 0 Remote Crown OMNRF Bf 0 0 Remote Crown OMNRF Sb 67568 0.59 Remote Crown OMNRF Sw 0 0 Remote Crown OMNRF Ce 0 0 Remote Crown OMNRF La 0 0 Remote Crown OMNRF Pt 346588 3.04 Remote Crown OMNRF Pb 0 0 Remote Crown OMNRF Bw 625607 5.49 Remote Crown OMNRF Map 0 0 Remote Crown OMNRF Ald 0 0 Remote Crown OMNRF Wil 0 0 Remote Crown OMNRF Ch 0 0 Remote Crown OMNRF AmS 0 0
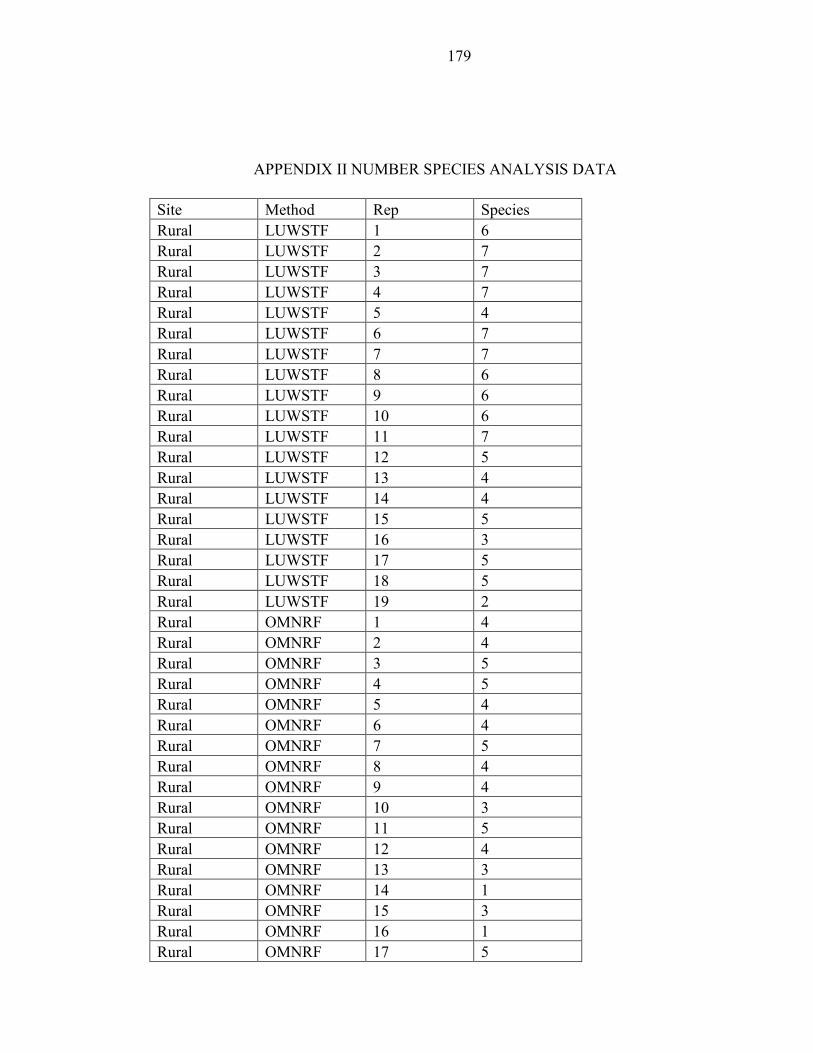
179
APPENDIX II NUMBER SPECIES ANALYSIS DATA
Site Method Rep Species Rural LUWSTF 1 6 Rural LUWSTF 2 7 Rural LUWSTF 3 7 Rural LUWSTF 4 7 Rural LUWSTF 5 4 Rural LUWSTF 6 7 Rural LUWSTF 7 7 Rural LUWSTF 8 6 Rural LUWSTF 9 6 Rural LUWSTF 10 6 Rural LUWSTF 11 7 Rural LUWSTF 12 5 Rural LUWSTF 13 4 Rural LUWSTF 14 4 Rural LUWSTF 15 5 Rural LUWSTF 16 3 Rural LUWSTF 17 5 Rural LUWSTF 18 5 Rural LUWSTF 19 2 Rural OMNRF 1 4 Rural OMNRF 2 4 Rural OMNRF 3 5 Rural OMNRF 4 5 Rural OMNRF 5 4 Rural OMNRF 6 4 Rural OMNRF 7 5 Rural OMNRF 8 4 Rural OMNRF 9 4 Rural OMNRF 10 3 Rural OMNRF 11 5 Rural OMNRF 12 4 Rural OMNRF 13 3 Rural OMNRF 14 1 Rural OMNRF 15 3 Rural OMNRF 16 1 Rural OMNRF 17 5

180
Rural OMNRF 18 3 Rural OMNRF 19 2 Remote LUWSTF 1 5 Remote LUWSTF 2 3 Remote LUWSTF 3 3 Remote LUWSTF 4 4 Remote LUWSTF 5 3 Remote LUWSTF 6 3 Remote LUWSTF 7 2 Remote LUWSTF 8 4 Remote LUWSTF 9 5 Remote LUWSTF 10 4 Remote LUWSTF 11 4 Remote LUWSTF 12 2 Remote LUWSTF 13 4 Remote LUWSTF 14 4 Remote LUWSTF 15 7 Remote LUWSTF 16 1 Remote LUWSTF 17 3 Remote LUWSTF 18 4 Remote OMNRF 1 1 Remote OMNRF 2 1 Remote OMNRF 3 1 Remote OMNRF 4 3 Remote OMNRF 5 2 Remote OMNRF 6 3 Remote OMNRF 7 1 Remote OMNRF 8 4 Remote OMNRF 9 2 Remote OMNRF 10 3 Remote OMNRF 11 3 Remote OMNRF 12 1 Remote OMNRF 13 2 Remote OMNRF 14 2 Remote OMNRF 15 3 Remote OMNRF 16 1 Remote OMNRF 17 1 Remote OMNRF 18 3

183
APPENDIX III WOOD PROPERTIES ANALYSIS DATA
Site Species
Wood Density Green (kg/m3)
Wood Density Air-dry (kg/m3)
Heat Value Green (MJ/kg)
Heat Value Air-dry (MJ/kg)
Percent Ash
Rural Ald 594 546 13.1 19.8 0.07 Rural Bf 521 480 13.4 20.2 0.07 Rural Pb 587 540 12.8 19.4 0.11 Rural Sb 557 513 15.9 23.7 0.06 Rural Ch 679 625 15.2 22.7 0.06 Rural La 680 626 14 21.1 0.04 Rural Ce 439 395 16.7 24.9 0.05 Rural Pw 558 511 13.5 20.4 0.03 Rural Sw 528 485 12.8 19.4 0.07 Rural Pj 621 565 13.7 20.7 0.03 Rural Map 606 558 12.3 18.7 0.06 Rural Pr 601 553 14.2 21.3 0.04 Rural Pt 596 549 13.1 19.7 0.03 Rural Bw 775 713 13.8 20.8 0.06 Rural Wil 504 464 14.4 21.6 0.07 Publish Ald 491 460 13.1 19.8 0.68 Publish Bf 431 394 13.3 20 0.81 Publish Pb 485 461 13.5 20.4 0.38 Publish Sb 521 480 12.4 18.8 0.58 Publish Ch 719 677 15.2 22.7 0.68 Publish La 636 590 14 21.1 0.17 Publish Ce 376 337 14.6 21.9 0.26 Publish Pw 461 416 14.9 22.4 0.30 Publish Sw 459 424 12.6 19 0.22 Publish Pj 539 492 12.8 19.4 0.20 Publish Map 567 539 12.3 18.7 0.68 Publish Pr 497 458 14.1 21.3 0.30 Publish Pt 493 463 12.9 19.5 0.38 Publish Bw 672 647 12.6 19.1 0.31 Publish Wil 491 460 14.4 21.6 0.68 Remote Ald 602 554 15.3 22.9 0.07 Remote Bf 509 469 14.5 21.8 0.56 Remote Pb 587 540 14.2 21.3 0.39

184
Remote Sb 541 497 13.8 20.8 0.26 Remote La 680 626 14 21.1 0.04 Remote Sw 528 485 12.8 19.4 0.07 Remote Pj 616 566 14 21.1 0.28 Remote Pt 685 631 14 21 0.39 Remote Bw 653 601 14.4 21.6 0.24 Remote Wil 504 464 15.3 22.9 0.07

185
APPENDIX IV ETHICS APPROVAL
General Info FileNo: 1464087 Title: Biomass Heat as a Catalyst for Community Development in the Boreal Forest Start Date: 01/10/2014 End Date: 05/11/2016 Keywords: First Nations, renewable energy, forest resource inventory, remote/rural communities Related Awards
Award # Title Award Status
PI Last Name
PI First Name Sponsors Summary Notes
1463105
First Nations Renewable Energy Initiatives and Economic Development in Northern Ontario
Active Shahi Chander
Social Sciences and Humanities Research Council/Insight Development Grant(Active) 11-50-15000505 2013/06/01 - 2015/05/31
Project Members Principal Investigator Prefix: Dr. Last Name: Shahi First Name: Chander Affiliation: Natural Resources Management\Natural Resources Management Rank: ASSO Gender: Male Email: [email protected] Phone1: 807-343-8114 Phone2: Fax: Mailing Address: 955 Oliver Road Thunder Bay, ON P7B 5E1 Institution: Lakehead University Country: Canada Comments: Tenured Others
Rank Last Name First Name Affiliation Role In
Project
ASSO Smith Margaret (Peggy)
Natural Resources Management\Natural Resources Management
Co-Investigator

186
STU Robitaille Paul Natural Resources Management\Natural Resources Management
Co-Investigator
STU Seymour Stephanie Natural Resources Management\Natural Resources Management Student
STU Hosszu Mike Natural Resources Management\Natural Resources Management Student
Attachments Description File Name Version Date TCPS2-Mike.pdf TCPS2-Stephanie.pdf TCPS2-Chander.pdf TCPS2-Peggy.pdf revised proposal.pdf 1464087-proposal.pdf 1464087-approval.pdf Robitaille signature 1464087 signature Robitaille.pdf RobitaillePaul20151021.pdf