Embed Size (px)
Citation preview

Virginia Commonwealth University Virginia Commonwealth University
VCU Scholars Compass VCU Scholars Compass
Theses and Dissertations Graduate School
2010
Assessing Economic and HRQL Burden of Food Allergy and Assessing Economic and HRQL Burden of Food Allergy and
Anaphylaxis in the U.S. Anaphylaxis in the U.S.
Dipen Patel Virginia Commonwealth University
Follow this and additional works at: https://scholarscompass.vcu.edu/etd
Part of the Medicine and Health Sciences Commons
© The Author
Downloaded from Downloaded from https://scholarscompass.vcu.edu/etd/2220
This Dissertation is brought to you for free and open access by the Graduate School at VCU Scholars Compass. It has been accepted for inclusion in Theses and Dissertations by an authorized administrator of VCU Scholars Compass. For more information, please contact [email protected].

i
© Dipen A Patel, 2010
All Rights Reserved

ii
ASSESSING ECONOMIC AND QUALITY OF LIFE BURDEN OF FOOD ALLERGY AND ANAPHYLAXIS IN THE U.S.
A dissertation submitted in partial fulfillment of the requirements for the degree of
Doctor of Philosophy at Virginia Commonwealth University
by
DIPEN A PATEL Bachelor of Pharmacy, M.S. University, India 2006
PhD Candidate, VCU School of Pharmacy 2010
Advisor: DAVID A HOLDFORD, R.Ph., M.S., Ph.D., FAPhA Associate Professor
Vice-Chair of Graduate Education Department of Pharmacotherapy and Outcomes Science
Virginia Commonwealth University Richmond, Virginia
July 2010

iii
Dedication
This dissertation is dedicated to my parents. Their support and encouragement is the prime reason for my success

iv
Acknowledgements
There are a lot of people to thank for the successful completion of this dissertation, but none
greater than my parents, Dr. Ashok Patel and Mrs. Bharti Patel and my elder sister Dhvani Patel.
Apart from passing on their smart genes, these amazing parents made sure their kids received the
best possible education. Their constant support and encouragement helped me get through all
hurdles during my school and college years. I deeply appreciate their dedication as parents, a
family and as my mentors for ‘life’. “Jai Sachchidanand !”
My advisor, Dr. David Holdford has been a great mentor ever since I stepped into VCU. He was
‘always there’ to offer assistance whenever required. Our conversations often involved me
finding the answers for my own questions and that helped me a great deal to learn working
efficiently and independently. His expert guidance on several issues helped me successfully
tackle this dissertation. Thank you so much Dr. Holdford !
Dr. Norman Carroll is a great teacher and his ‘simplistic’ style of teaching helped me crack few
basic yet complicated issues. Also, his critical thinking and comments on this dissertation helped
me clarify a lot of intricate details, and I sincerely thank him for that. I have utmost respect for
this great professor.
Sincere thanks to Dr. Spencer Harpe for being “the go-to guy” in this department. He’s always
had answers to all questions and his selfless helping nature makes him the most desired
committee members on every graduate students list. Thanks a lot Dr. Harpe!

v
I got a chance to interact with Dr. Michael Pyles only for the last one year, but it was a great
experience. A very supporting professor and a SAS expert who helped me tackle few tricky
issues with the software. I greatly appreciate your time and concern to serve on my committee.
Kavita Gajria served as one of the most critical members on my committee and I am very
thankful to her for being tough. She pushed me to think through some fundamental issues which
helped me strengthen this dissertation. She is a busy professional working in pharmaceutical
industry, and in spite she spared her precious time to serve on my committee, which speaks a lot
about her helping nature. Thank you Kavita!
What’s a life without friends, and I’ve been lucky to have many in Richmond. But few special
ones deserve a mention here for their love, good wishes and amazing fun times spent together.
First on the list is Namrata, who is the special one in my life, and hopefully will become my life
partner soon. Avani has been with me all throughout the eight years of my college. Wow! It will
be so difficult to not have her around after a week. Shreni and Shreya are two special friends I
made in Richmond, and am sure will be there forever. That leaves my ultra cool gang of guys
which made me enjoy the last two years like I’ve never had before. Thanks to Aditya, Harshad,
Jay, Jayul, Pratik and Shankar.
Above all, I would like to thank God for helping me in every walk of life.

vi
Table of Contents
Table of Contents ………………………………………………………………………...............iv
List of Tables.………………………………………………………………………….................vi
List of Figures …………………………………………………………………………..............viii
Abstract ………………………………………………………………………………..................ix
Chapter 1: Introduction ………………………………………………………………...................1
Overview of the document ……………………………………………………..................1
Specific Aims …………………………………………………………………..................2
Hypotheses …………………………………………………………………......................3
Significance ………………………………………………………………….....................4
Chapter 2: Background ………………………………………………………………...................6
Food Allergy Overview ………………………………………………………..................6
Economic Burden Background ……………………………………………….................11
HRQL Background …………………………………………………………...................19
Theoretical Framework ……………………………………………………….................25
Previous Investigations ……………………………………………………….................29
Generalized Linear Models ……………………………………………………...............31
Chapter 3: Estimating the Economic Burden of FAA …….………………………….................34
Methods ……………………………………………………………………….................34
Results ………………………………………………………………………...................57
Discussion …………………………………………………………………….................69
Chapter 4: Estimating the HRQL Burden of FAA ……………..………………………..............76
Methods ……………………………………………………………………….................76

vii
Results ………………………………………………………………………...................85
Discussion …………………………………………………………………….................96
Chapter 5: Future Research and Conclusions ………………………………………….............102
Future Research ……………………………………………………………..................102
Conclusions …………………………………………………………………….............104
Reference List.………………………………………………………………………….............105
Appendix A: IRB Approval for the HRQL Study ………..……………………………............115
Appendix B: Estimating Health Utilities using EQ-5D ………….…………………….............116
Appendix C: SAS codes for ‘greedy matching’..........................................................................118
Appendix D: List of Abbreviations..............................................................................................120
Curriculum Vita ………………………………………………………………………..............121

viii
List of Tables and Figures
Tables:
Table 1: Mueller severity grading of food allergic reaction............................................................8
Table 2: Costs included, by perspective........................................................................................12
Table 3: Previous studies investigating the impact of food allergy on HRQL..............................30
Table 4: Summary of the data sources...........................................................................................37
Table 5: List of ICD-9 codes for food allergy and anaphylaxis ...................................................38
Table 6: Primary ICD-9 codes for non-primary diagnosed NAMCS and NHAMCS-OPD patients
that were included..........................................................................................................................40
Table 7: Primary CCS codes for non-primary diagnosed NIS and NEDS patients that were
included..........................................................................................................................................41
Table 8: CPT codes used in the study............................................................................................42
Table 9: Description of variables used in the GLM.......................................................................48
Table 10: Key variables and ranges used in sensitivity analyses...................................................52
Table 11: Demographic and clinical characteristics of FAA patients...........................................57
Table 12: Number of patients and mean costs broken down by ICD-9 codes...............................58
Table 13: Direct Medical Costs (USD 2007 values) ....................................................................59
Table 14: Indirect Costs (USD 2007 values) ................................................................................60
Table 15: Results of Probabilistic Sensitivity Analysis (USD 2007 values).................................62
Table 16: Impact of Asthma on Total Costs, controlling for key variables–using Inpatient
Sample............................................................................................................................................66
Table 17: Impact of Asthma on Total Costs, controlling for key variables–using ED Sample.....66

ix
Table 18: Comparing costs (Matched analysis) ............................................................................68
Table 19: Comparing economic burden of FAA with selected diseases.......................................71
Table 20: Sample size calculation for HRQL surveys.. ................................................................79
Table 21: Description of variables used in the GLM.....................................................................81
Table 22: Patient participation.......................................................................................................85
Table 23: Demographic characteristics of Food Allergic participants..........................................85
Table 24: Clinical characteristics of food allergic participants.....................................................86
Table 25: Previous food allergic reaction characteristics of study participants.............................87
Table 26: FAQL-AF item responses (only for adults) ..................................................................88
Table 27: Proportions of EQ-5D levels by dimension...................................................................90
Table 28: Score distribution of Health Utility methods for children and adults............................90
Table 29: Impact of food allergy related factors on Adult Health Utilities (EQ-5D scores).........94
Table 30: Impact of food allergy related factors on FAQL-AF scores..........................................95

x
Figures:
Figure 1: Flowchart of events that may occur after exposure to an allergen.................................10
Figure 2: Different type of costs related to a disease condition.....................................................15
Figure 3: Types of HRQL measures..............................................................................................21
Figure 4: Direct costs in an economic cost analysis......................................................................26
Figure 5: Indirect costs in an economic cost analysis....................................................................26
Figure 6: Wilson and Cleary’s HRQL conceptual model..............................................................28
Figure 7: Subject selection flowchart............................................................................................39
Figure 8: Summary of the procedure for calculating direct medical and indirect costs................44
Figure 9: One-way sensitivity analysis (Tornado diagrams).........................................................61
Figure 10: Scatter plot for simulations..........................................................................................63
Figure 11: Scatter plot depicting Homoskedasticity......................................................................65
Figure 12: Scatter plots depicting Homoskedasticity....................................................................93

xi
Abstract
Background:
Food allergy, an abnormal immunologic response to food protein, has an estimated prevalence of
6% in young children and 3.7% in adults in the U.S. 2,5-7 The only proven therapy for food
allergy is strict elimination of the offending allergens. 8 As a result, caregivers and patients
could experience constant anxiety and stress that affects their quality of life. 6 Additionally, food
allergy can lead to significant economic impact on the health care system, since severe reactions
often lead to ED visits and hospitalizations. 4,6,9
Objectives:
The first major objective was to determine the economic burden of Food Allergy and
Anaphylaxis (FAA) patients in the U.S. by estimating the direct medical and indirect costs. The
second principal objective involved assessing the Health Related Quality of Life (HRQL) of food
allergic patients by measuring their health utilities and disease specific quality of life.
Methods:
Economic burden was estimated by measuring certain direct medical and indirect costs from a
societal perspective. Costs were estimated using a bottom-up approach -- calculating the average
cost of illness per patient and multiplying it by reported prevalence estimates. FAA patients with
an emergency department (ED) visit, office based physician visit, outpatient department visit,
and hospital admission were identified from a list of federally administered databases using ICD-
9 codes. Sensitivity analyses were conducted to measure the robustness of the estimates.
The cross-sectional HRQL study measured health utilities in food allergic adults and children,
and quality of life in allergic adults using EQ-5D and FAQL-AF questionnaires respectively.

xii
These questionnaires were administered in an online survey format. Regression models were
specified to explore the deviations in HRQL scores between patients with different disease
related characteristics.
Results:
The findings reveal that for a given year (2007), direct medical costs worth $225 million and
indirect costs worth $115 million were incurred. Owing to the irregularities in the reporting and
diagnosis of food allergy, these values might be an underestimation. Simulations from
probabilistic sensitivity analysis generated mean direct medical costs of $307 million and
indirect costs of $203 million.
Survey responses were collected online for eight months, during which 45 adults and 94 parents
(acting as proxy for their food allergic child) responded. Adults reported a mean utility of 0.874
compared to 0.918 for children. Gender, number of food allergies and frequency of carrying
epinephrine device had significant impacts on HRQL scores. An effect size of 0.003 was
estimated comparing health utilities of food allergic adults with the general U.S. population.
Conclusions:
This was the first research to examine economic burden of FAA, and elucidate health utilities for
food allergic patients. A large proportion of costs were incurred due to ambulatory visits. Effect
size calculation revealed that health utilities of food allergic patients were very similar to the
general U.S. population.

1
CHAPTER 1
INTRODUCTION
Overview of the document
Food allergies are widely prevalent in the U.S. population, especially among children. This
disease condition has received a lot of clinical attention, and huge amount of research dollars
have been spent trying to understand the causal mechanism and develop potential treatments.
Acknowledging that the disease affects at an early age, and usually stays for life, it is believed to
have a significant economic and psychological impact on the society. The research in these areas
has been very limited. This dissertation aims to fill the voids by assessing the economic and
health related quality of life (HRQL) burden of food allergy and anaphylaxis (FAA) in the U.S.
This chapter describes the objectives and hypotheses, followed by an explanation of the rationale
and significance of this research. The second chapter systematically reviews the available
literature and provides an extensive background on previous investigations, FAA, economic
burden, and HRQL. It also provides a theoretical framework for estimating direct and indirect
costs, and assessing HRQL and health utilities. Chapters 3 and 4 provide a detailed description of
the methods, results and discussion for estimating the economic burden and HRQL burden of
food allergy respectively. Chapter 5 discusses the concluding remarks.

2
Specific Aims
1. To assess economic burden:
i. Estimate the direct medical and indirect costs of food allergy and anaphylaxis patients
in the U.S.
ii. Analyze the impact of asthma on total costs incurred, controlling for gender, race,
location of the patient, primary payer, median income by patient’s zip code,
admission source, and co-morbidities
iii. Conduct a matched analysis to compare the costs incurred by food allergic
hospitalized patients with similar patients without food allergic reactions
2. To assess health related quality of life:
i. Measure health utilities in food allergic patients using EuroQol (EQ) – 5D
ii. Measure quality of life in food allergic adults using Food Allergy Quality of Life –
Adult Form (FAQL-AF) questionnaire
iii. Analyze the variation in health utilities and quality of life scores due to different
disease related factors (such as number of food allergies, time since diagnosing food
allergy, severity of previous allergic reaction, asthma, frequency of carrying
epinephrine injector device)

3
Hypotheses
Several factors appear to predispose individuals to severe food allergic reactions and
anaphylaxis. The presence of asthma is one such factor that has been established and reported by
several published studies as a major factor affecting the severity of food allergic reactions. 10-14
Few studies have also explored the role played by food allergens with the severity of reaction
10,15,16, and found that foods implicated most often include sea food and nuts (peanuts or tree
nuts).
The economic burden section involved a regression analysis, where the dependent variable was
costs incurred per hospital visit, which served as an indicator for severity of reaction. In this
regression, the study intended to test the following hypothesis:
• Given other things constant, patients with asthma incur greater healthcare costs from food
allergic reactions compared to those without asthma
The study also wanted to test the impact of type of food allergy on costs incurred, which was not
possible because the available databases do not provide details on the food allergen responsible
for the reaction.
Additionally, a matched analysis was conducted using inpatients sample to test the following
hypothesis:
• There is no difference in costs incurred by hospitalized food allergic patients with similar
other hospitalized patients

4
In the HRQL section, data was collected on food allergic patients’ quality of life and their health
utilities. The study aimed to test the following hypothesis:
• There is no difference in HRQL of FAA patients versus the general U.S. population
Significance
The economic impact of food allergy is believed to be widespread and costly to society and
individuals. 17 However, no data currently exists on the economic impact of FAA in the U.S.
This study proposes to address this deficit through research using federal healthcare databases
and published literature. This research will help place a monetary value to the impact of FAA,
and a better understanding of the economic impact will aid private and governmental decision
makers in formulating public health policies and clinical guidelines. Such economic burden
studies also provide cost estimates useful for future health economic evaluations, such as cost-
effectiveness analysis of a new food allergy treatment. In addition, results can also be used by
advocacy groups to demonstrate the impact of food allergies on society, and justify greater
attention and research funding.
There is no cure for food allergies yet, and strict avoidance is the only way to prevent allergic
reactions. There are very few symptomatic treatment options, and traces of allergens are enough
to trigger a reaction. This makes simple tasks such as grocery shopping and cooking very time-
consuming, expensive, and demanding. As a result, food allergic patients and their families may

5
experience constant anxiety and stress given the risk of severe reactions and lack of control over
those risks. Hence, measuring HRQL in such individuals is essential to better understand the
disease from the patient’s perspective, its impact on their daily life and obtain an insight into the
specific problems of this patient group. HRQL data can be used to compare the impact of food
allergies with other diseases in terms functioning and well-being, and also can be used by
country’s health planners to justify allocation of health care resources. 18
In the current healthcare setting, a common question asked by third-party payers, formulary
managers, and health planners is, “Is the high cost of the treatment justified by its benefits or
improvement in quality of life?” This economic issue is addressed by pharmacoeconomic
evaluations of the reported benefits in quality of life, using cost effectiveness or cost utility
analysis. 19 For such evaluations, health utility values serve as “quality-adjustment factors” for
the calculation of Quality Adjusted Life Years (QALYs). QALYs are the most widely used
outcome measure in cost-utility analyses (cost per QALY gained), an approach that is
increasingly being used in assessing new technologies. 20
Several published studies have described HRQL in food allergic children and their families.
However, none has looked into the HRQL impact in food allergic adults in the U.S. In addition,
no published study has systematically quantified health utilities for food allergic patients. Neither
has any study identified the degree to which these utilities are affected by factors such as: type of
food allergies, number of food allergies, severity of allergy, use of epinephrine self-injector, and
co-morbidities. This research tries to fill these voids by focusing on these unanswered questions.

6
CHAPTER 2
BACKGROUND
Food Allergy and Anaphylaxis Overview
Food allergy, an abnormal immunologic response to food protein, has an estimated prevalence of
6% in young children and 3.7% in adults in the U.S. 2,5-7 Although hundreds of different foods
are included in the human diet, a relatively small number account for the vast majority of food-
induced allergic reactions. In young children, milk, eggs, peanuts, soy, and wheat account for
approximately 90% of hypersensitivity reactions, whereas in adolescents and adults, peanuts,
fish, shellfish, and tree nuts account for approximately 85% of reactions. 21,22 In about 80% of
children, allergies to milk, egg, soy, and wheat usually resolve by school age. 23 Peanut, tree nut,
and seafood allergies are generally considered permanent, although 20% of young children with
peanut allergy experience resolution by age five, with a possibility of recurrence.24,25
Allergic reactions to food are either Immunoglobulin E (IgE)-mediated or non-IgE-mediated.
The role of IgE-mediated reactions in food allergy is well established. Persons who are
genetically predisposed to an allergy produce specific IgE antibodies to certain proteins when are
exposed. 26 These antibodies bind to mast cells and other cells in body tissues. When a food
protein is ingested, the IgE releases mediators (e.g., histamine), and symptoms occur. The
symptoms of IgE-mediated reactions typically involve the skin (urticaria, atopic dermatitis, and
angioedema), respiratory system (asthma and allergic rhinitis) and gastrointestinal tract (allergic
eosinophilic gastroenteritis, oral allergy syndrome and celiac disease). 27 Pathogenesis of non--

7
IgE-mediated reactions in food allergy is not as clearly defined, but T cells and macrophages
most likely play a role. Illnesses caused by these non-IgE-mediated immunologic responses are
similar to the IgE-mediated reactions. 28
Food-induced anaphylaxis is an allergic syndrome manifested by an abrupt onset of symptoms
within minutes to hours of ingesting a food, commonly peanuts, tree nuts, fish, and shellfish. 11
Such reactions are associated with the classic features of IgE-mediated hypersensitivity,
frequently angioedema, hypotensive shock, and wheeze. 10,11 The symptoms are often severe and
may affect multiple organ systems, commonly skin, respiratory, cardiovascular, and
gastrointestinal. Previous estimates of the incidence of food-related anaphylaxis in the U.S. have
varied. 15 Based on the results, 9,29,30 it is estimated that 30,000 food-related anaphylactic
reactions are treated in Emergency Departments (EDs) per year, with 2000 hospitalizations and
150 deaths. 29,30
Clinical manifestations from food allergy vary from trivial (facial urticaria) to life threatening
anaphylactic shock (hypotensive shock). 10,31,32 There is no standard measure for severity of food
allergic reactions, but the Mueller scale 33 has often been used by health professionals to assess
the severity of symptoms. 16,32,34 This system makes a distinction between four gradations of
allergic reactions, 31 as seen in Table 1. This scale was initially developed for reactions to insect
sting, but later found application in other forms of allergies.

8
Table 1: Mueller severity grading of food allergic reaction 31
Reaction Grade Clinical Features
I. Very Mild Itching, rashes, tiredness, weakness, anxiety or depression
II. Mild Swollen lips, swollen glands, swollen limbs, nausea, vomiting, diarrhea, stomach cramps, runny nose, itchy eyes
III. Moderate Bloating, wind, indigestion, dizziness, shortness of breath, wheezing, rattling in the throat
IV. Severe Discolored skin, fainting, collapsing, weak bladder, bowel incontinence, low blood pressure
Once a diagnosis of food hypersensitivity has been established, the only proven therapy is strict
elimination of the offending allergen. Patients and their families must be educated to avoid
accidentally ingesting food allergens, recognize early symptoms of an allergic reaction, and
initiate early management of an anaphylactic reaction including using self-injected epinephrine. 8
Antihistamines and oral corticosteroids might partially relieve symptoms of food allergy but do
not block systemic reactions. 7 A number of novel forms of immunotherapy are being explored
for the treatment of IgE-mediated food allergy. Studies have found them effective for pollen-
food allergy syndrome, however, the risk/benefit ratio of traditional immunotherapy is
considered unacceptable for the treatment of peanut allergy. 7,8
The pathway of outcomes following a food allergic reaction is described in Figure 1. On
ingesting an allergen, an individual may experience mild, moderate or severe reactions. This
often results in an ER or clinic visit, unless the reaction is mild and patients might self-treat using
over-the-counter products. Clinic or ER visits may result in routine discharge or hospitalizations

9
if complications arise. In rare cases, allergic reactions result in death after an ER visit or during
hospitalization. Resource utilization, in terms of medical costs, was captured using public
databases for hospital, ambulatory and ER visits. Greater details on datasets are provided under
the methods section of economic burden. Costs from self-treatment were not captured due to a
lack of data.
Figure 1: Flowchart of events that may occur after exposure to an allergen

10

11
Economic Burden Background
Illness and disability have profound consequences for individuals, their families, and society as a
whole. Many methods have been developed to summarize these effects. Two frequently used
approaches in health economics include estimation of the economic burden and health utility, an
indirect measure of health related quality of life.
Economic burden studies (also referred as cost-of-illness) measure the costs associated with a
disease and estimate the maximum amount that could potentially be saved or gained if a disease
were to be eradicated. 35,36 Numerous economic burden studies have been conducted over the
past 30 years. 35 Results have been used to set policy and research priorities, estimate the relative
societal impact of different health conditions, provide a framework for program evaluation, and
other purposes. 37 Nevertheless, cost of illness studies are not without controversies. For
instance, some argue that decisions regarding policy or program trade-offs might be better
informed by analyses that evaluate the relative marginal impact and costs of specific
interventions. 36,38
Economic burden analyses require some key methodological decisions, such as perspective for
the study; types of costs to capture; and whether to consider costs for all patients with the
condition at a given point in time or costs for a specified group of patients over time. 39 Each of
these are explained below.

12
Perspective
An economic burden study may be conducted from several different perspectives, each of which
includes slightly different costs (Table 2). 35 These perspectives may measure costs to society,
the health care system, third-party payers, employers, the government, and participants and their
families. 37,40,41 The purpose of the study ultimately determines the necessary perspective. For
instance a study concerned with the economic burden of an illness on an insurance company
would require the third party payer perspective. The societal perspective is the most
comprehensive and often the most preferred because it includes all direct medical costs and
indirect costs for members of the society. 35
Table 2: Costs included, by perspective
Perspective Medical Costs Morbidity Costs Mortality Costs
Transportation / Nonmedical Costs
Societal All costs All costs All costs All costs
Health care system / Hospital All costs – – –
Third party payer Covered costs – Covered costs –
Employer Covered costs Lost productivity (absenteeism)
Future lost productivity –
Government funded health care programs
Covered (Medicare, Medicaid) – – Criminal justice
costs
Participants and families Out-of-pocket costs
Lost wages / household production
Lost wages / household production
Out-of-pocket costs
Note: Adapted from Luce et al. 35,40

13
Range of costs captured
The choice of perspective helps determine what costs to include in the analysis. At the core of
most economic burden studies is the concept of opportunity costs, the value of resources that are
directed away from alternative uses because of the illness in question. 39,42 Direct medical, direct
non-medical, and indirect costs are commonly considered for such analyses (Figure 2). Some
studies also include intangible costs of pain and suffering, usually in the form of health related
quality of life measures. This category of costs is often omitted because of the difficulty in
accurately quantifying it in monetary terms. 35
Direct medical costs are incurred due to direct patient-care services. They include hospital
inpatient, physician inpatient, physician outpatient, emergency department outpatient, nursing
home care, hospice care, rehabilitation care, specialists’ and other health professionals’ care,
diagnostic tests, prescription drugs and drug sundries, and medical supplies. 35
One challenge with calculating direct medical costs, particularly hospital costs, is that charges
are often the only data available. Because of the nature of determining hospital charges, they
often do not accurately reflect the underlying costs. 35 Charges are often higher than costs to
cover losses from patients who are unable to fully pay their expenses, such as procedures not
covered by insurance companies, and to cover the rising costs of replacing and updating medical
equipment. 43 In addition, most insurers negotiate reimbursement rates and receive substantial
discounts off listed charges. 35 Hence, to obtain more accurate estimates, studies prefer to refrain
from using charges if possible. When use of charge is unavoidable, it is common to use a cost-to-
charge ratio for specific hospitals, and convert charges to costs. Alternatively, reimbursement

14
values from large insurers like Medicare can be used, which negotiates the lowest reimbursement
rates, and are often considered the closest estimates to true costs. 44
Direct nonmedical costs refer to the costs directly incurred from the disease condition, but not
related to the healthcare services. They often include transportation costs to health care
providers; relocation expenses; and costs of making changes to one’s diet, house, car, or related
items. Some nonmedical costs are generally not included, such as research, training, and capital
costs (e.g., construction). 35 It can be difficult to attribute these costs to a particular disease.
Additionally, training health care providers for a particular illness or capital costs, such as a new
wing or equipment to treat an illness, are often reflected in the charges of care. To include them
separately would lead to the double-counting of costs. 45
Indirect costs represent the other portion of estimated costs and are associated with the impact of
disease on a patient’s or caregiver’s economic output. 35 These costs can either be morbidity
related (productivity losses), or mortality related (future productivity lost). Productivity losses
from morbidity are those that result from people being unable to work or perform normal
housekeeping duties because of a health problem or due to their caregiver duties. 44 Productivity
losses can either be permanent, for example due to a hand amputation, or temporary, such as
absenteeism from work due to hospitalization. Indirect cost from mortality is the present value of
the future productivity lost to society as a result of premature death. 44

15
Figure 2: Different type of costs related to a disease condition
Methods for estimating direct costs
Direct costs can be estimated using one of three approaches: the top-down, the bottom-up, or the
econometric approach. The top-down approach, also known as the epidemiological or
attributable risk approach, measures the proportion of a disease that is due to exposure to the
disease or risk factor. 46,47 The approach uses aggregated data along with a population-

16
attributable fraction to calculate the attributable costs. This approach is rarely used since it
requires additional data on the relative risks to calculate the population-attributable fraction. 35
The bottom-up approach estimates costs by calculating the average cost of treatment of the
illness and multiplying it by the prevalence of the illness. 46,47 The average cost of treatment for
an illness is seldom readily available; hence, the bottom-up approach often calculates the average
cost of treatment by adding together the costs of various products and services associated with
the treatment. For example, the average cost of an outpatient physician visit is multiplied by the
number of visits within a time period, to get a cost estimate of outpatient physician care for a
particular illness. The method is repeated for each type of care to obtain a total average cost per
case, which is then multiplied by the prevalence of the illness to get an estimate of the total direct
costs. 35,48 This approach combines unit cost data with utilization data, which means it can be
useful for less common illnesses. 35
The econometric or incremental approach estimates the difference in costs between a cohort of
the population with the disease and a cohort of the population without the disease. 35 The two
cohorts are matched, usually via regression analysis, by various demographic characteristics and
the presence of other chronic conditions. The econometric approach is most appropriate with a
large, national dataset and is especially useful for risk factors and diseases with several co-
morbidities. 35
17
Methods for estimating indirect costs
There are three primary approaches to estimate the indirect costs, willingness-to-pay, human
capital, and friction cost methods. Although used for similar ends, the underlying approaches are
fundamentally different.
The willingness to pay approach measures the amount an individual would pay to reduce the
probability of illness or mortality. 45,49 There are various methods of determining an individual’s
willingness to pay including surveys, examining the additional wages for jobs with high risks,
examining the demand for products that lead to greater health or safety (e.g., seatbelts), and other
related methods. 35,50 This method typically produces the largest estimates of the indirect costs of
illness. Critics point to significant variations in willingness-to-pay values depending on factors
such as estimation method used, time frame, and type of population interviewed. 39
The human capital method is the most common approach used in burden of illness studies. 35 It
measures the lost production, in terms of lost earnings, of a patient or caregiver due to a disease
or illness. 35 For mortality or permanent disability costs, the approach multiplies the earnings lost
at each age by the probability of living to that age. The earnings in future years are discounted
using appropriate rates. 35 Indirect cost from morbidity is determined by the number of sick or
hospitalized days multiplied by the daily wage rate. 44 The human capital approach often
includes the value of household work, usually valued as the opportunity cost of hiring a
replacement from the labor market. 45,49

18
This conventional approach has often been criticized as lacking a theoretical foundation, and to
many critics, the calculation of expected lifetime earnings misses many of the subtleties of
human existence. Relying as it does on existing earnings patterns, the human capital approach
tends to give greater weight to working-age men compared to women, the young, minorities, and
older persons. 45 Critics of this approach also point to the difficulty of projecting earning
potential over long periods of time (e.g. in the case of long-term disability incurred by children).
39 Additionally, many argue whether lost earnings (actual or imputed) are the best measure for
production and/or welfare loss, and other challenges. The justification for the human capital
methodology is not that it measures the value of life, but that it does provide a measure of a cost
of disease, and even those who decry human capital as a measure of the value of life recognize
that it, or some form of it, is part of the value lost to mortality. 45
A related method, the friction cost method, measures only the production losses during the time
it takes to replace a worker. 35,51 This approach assumes that short-term work losses can be made
up by an employee and the loss of an employee only results in costs in the time it takes a new
employee to be hired and trained, known as the friction period.
Time horizon
The time horizon is the follow-up period for a cost analysis that determines the outcomes to be
included. 52 Some analyses use an ‘incidence’ approach, prospectively estimating costs from
onset to conclusion of a disease condition for cases beginning within the period of the study. 35,39
For instance, if the study period is one year, then all patients with their disease onset in that year
will be considered for the cost analysis and followed until they get cured or die. Incidence costs

19
include the discounted lifetime medical, morbidity, and mortality costs for the incident cohort. 35
For diseases with long-term health consequences, incidence-based studies require sophisticated
assumptions about the likely course and consequences of the disease. 39
More commonly, a ‘prevalence’ approach is used, which measures the costs of an illness in one
period, usually a year, regardless of the date of onset. 35 Prevalence-based studies include all
medical care costs and morbidity costs for a disease within the study year. The mortality and
permanent disability costs are discounted for all patients who die or become permanently
disabled in the study year until the expected age of death. 35 Prevalence-based studies are more
common because they require less data and fewer assumptions than incidence-based studies. 35
Health Related Quality of Life Background
Quality of Life and Health Related Quality of Life
The terms Quality of Life (QoL) and Health Related Quality of Life (HRQL) are vague concepts
and there has been little consensus on definition. 53 To make matters more confusing, these terms
are often used interchangeably. 54 The following section will define and differentiate the two
concepts.
QoL is a broad concept that incorporates all aspects of life and has been used in a variety of
disciplines such as: geography, philosophy, medical sciences, social sciences, health promotion,
and advertising. 54,55 The World Health Organization defines QoL as "an individual's perception
of their position in life in the context of the culture and value systems in which they live and in

20
relation to their goals, expectations, standards and concerns. It is a broad ranging concept
affected in a complex way by the person's physical health, psychological state, personal beliefs,
social relationships and their relationship to salient features of their environment". 56
HRQL is "limited to the aspects of life that are important to the evaluator in the context of health
and illness." 20,54 The overall goal of healthcare is to make patients feel better, and live longer.
Physiologic and clinical measures (e.g. sedimentation rate, forced expiratory volume, serum
creatinine) can correlate poorly with functional capacity and well-being of patients. 20 Hence, it
is important to measure HRQL, which allows an insight into the patient’s perspective of his or
her disease and its impact on the daily life and activities.
Type of HRQL measures
Two basic approaches characterize the measurement of HRQL: ‘generic’ instruments (including
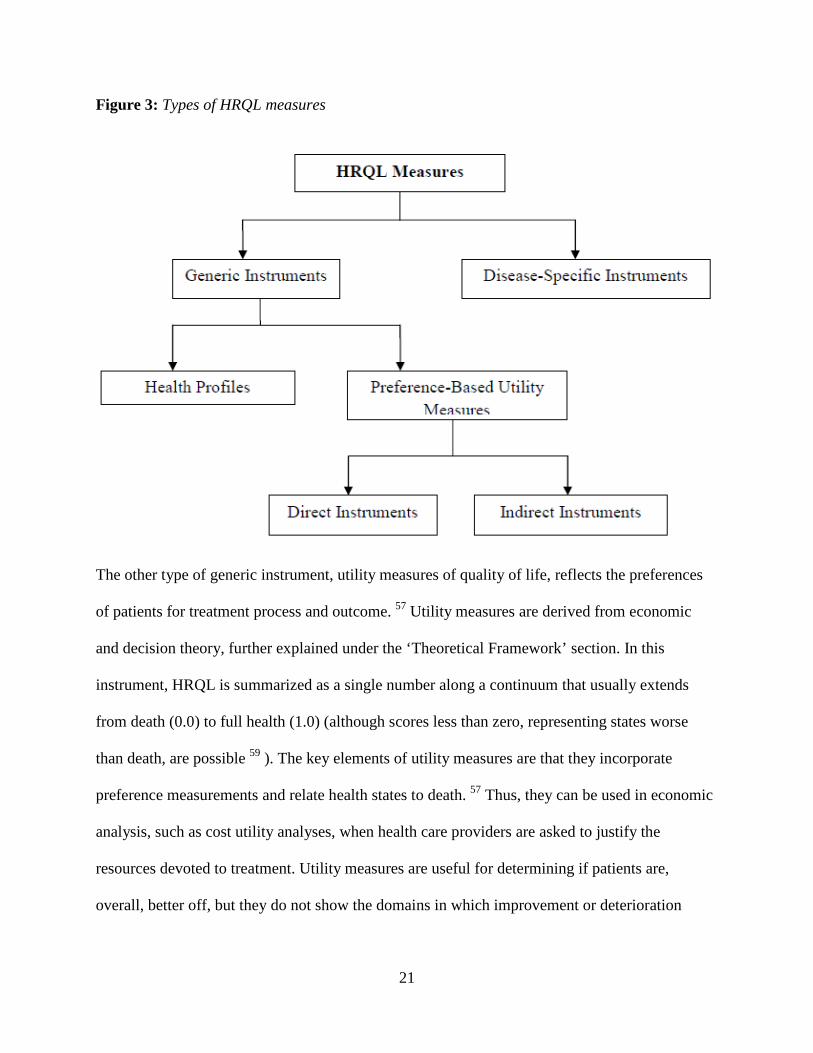
health profiles, and utility measures) and ‘disease-specific’ instruments (Figure 3). 57,58 Generic
health profiles are instruments that attempt to measure all important aspects of HRQL. 57 The
Sickness Impact Profile is an example that includes a physical dimension; a psychosocial
dimension; and five independent categories including eating, work, home management, sleep and
rest, as well as recreations. 57 Major advantages of health profiles include dealing with a variety
of areas and use in any population, regardless of the underlying condition. Because generic
instruments apply to a variety of populations, they allow for broad comparisons of the relative
impact of various health care programs. Generic profiles may be unresponsive to changes in
specific conditions. 57
21
Figure 3: Types of HRQL measures
The other type of generic instrument, utility measures of quality of life, reflects the preferences
of patients for treatment process and outcome. 57 Utility measures are derived from economic
and decision theory, further explained under the ‘Theoretical Framework’ section. In this
instrument, HRQL is summarized as a single number along a continuum that usually extends
from death (0.0) to full health (1.0) (although scores less than zero, representing states worse
than death, are possible 59 ). The key elements of utility measures are that they incorporate
preference measurements and relate health states to death. 57 Thus, they can be used in economic
analysis, such as cost utility analyses, when health care providers are asked to justify the
resources devoted to treatment. Utility measures are useful for determining if patients are,
overall, better off, but they do not show the domains in which improvement or deterioration

22
occurs. 57 The simultaneous use of a health profile or specific instruments can complement the
utility approach by providing this valuable information. 57
There are two basic types of preference-based instruments to measure health utilities: direct and
indirect. 20 Direct instruments measure preferences with direct techniques such as standard
gamble, time trade-off, and visual analog scale. These techniques are based on traditional utility
theory, and ask patients to make a series of choices to identify at what point they are indifferent
about the choice between two options. Direct instruments are expensive and tedious to develop
and administer. On the contrary, indirect instruments are much simpler to use; wherein a patient
can rate their health status using a multi-attribute, health-status classification system that
provides a preference-based score. 20,57 Three well-known systems in this category are the Short
Form (SF) - 12/6D, EQ-5D, and Health Utilities Index (HUI). In all of these, the scoring formula
is based on directly measured preferences of the general public, which is seen as strength of the
system because recent guidelines 60 recommend that the appropriate preferences for the
calculation of QALYs be community preferences.
The second basic approach to HRQL measurement focuses on aspects of health status that are
specific to the area of primary interest. The rationale for this approach lies in the potential for
increased responsiveness that may result from including only important aspects of HRQL which
are relevant to the patients being studied. The instrument may be specific to the disease (such as
heart failure or asthma), to a population of patients (such as the frail elderly), to a certain
function (such as sleep or sexual function), or to a problem (such as pain). In addition to the
likelihood of improved responsiveness, specific measures have the advantage of relating closely

23
to areas routinely analyzed by clinicians. For example, FAQL-AF is a disease-specific
instrument that measures quality of life among food allergic adults.
Minimal Important Differences
An important advance in HRQL research is the concept of minimal important difference (MID),
defined as the smallest difference in score on an HRQL instrument that patients perceive as
beneficial. 61,62 Differences in scores smaller than the MID are considered unimportant,
regardless of whether statistical significance is reached. For example, although an average
change of 0.15 point on the Health Assessment Questionnaire Disability Index (HAQ-DI) may
be statistically significant in a clinical trial, it may not be perceived as meaningful by study
subjects, so it would not meet MID criteria for this questionnaire which is 0.22 points. 62 For
indirect health utilities, MIDs are generally in the range of 0.01 to –0.10. 63 MIDs are estimated
using anchor-based methods that examine the relationship between an HRQL measure and an
independent measure to elucidate the meaning of a particular degree of change. 63
FAQL-AF and EQ-5D
FAQL-AF is a disease specific questionnaire to determine the impact of food allergy on adult
patient’s daily life and activities. It was developed and validated by Flokstra-de Blok and his
colleagues, 64 who are a part of EuroPrevall group in the Netherlands. The questionnaire includes
29 items evaluating four domains of quality of life due to FAA: allergy avoidance and dietary
restrictions, emotional impact, rick of accidental exposure, and food allergy related health. The
scores range from 1 ‘not troubled’ to 7 ‘extremely troubled’. The questionnaire has been
validated in the Dutch population, and psychometric validation is ongoing in the U.S. 64

24
EQ-5D is a generic instrument to measure Health Utilities, and is applicable to a wide range of
health conditions and treatments. The EQ-5D descriptive system comprises of the following five
dimensions: mobility, self-care, usual activities, pain/discomfort and anxiety/depression. Each
dimension has three levels: no problems, some problems, severe problems. The respondent is
asked to indicate his/her health state by selecting the most appropriate statement in each of the 5
dimensions. This decision results in a 1-digit number expressing the level selected for that
dimension. The digits for five dimensions can be combined in a 5-digit number describing the
respondent’s health state. It should be noted that the numerals 1-3 have no arithmetic properties
and should not be used as a cardinal score. The 5-digit EQ-5D health states, defined by the EQ-
5D descriptive system, may be converted into a single summary index (Health Utility score) by
applying a formula that essentially attaches values (also called weights) to each of the levels in
each dimension. The index can be calculated by deducting the appropriate weights from 1, the
value for full health (i.e. state 11111). 65 For further clarification, this procedure is explained
with pictures in Appendix B. The questionnaire also contains a Visual Analog Scale, wherein the
patients are asked to rate their health on a scale of 0 to 100, with 0 being the worst health. This
instrument was developed by EuroQol, which is a group of international multidisciplinary
researchers devoted to the measurement of health status. EQ-5D has been used in several studies
worldwide and its reliability and validity has been well established. 65

25
Theoretical Framework
Direct and indirect costs
The direct costs as a consequence of illness are composed of the value of the other goods and
services that could have been produced if the resources had not been used for health care. 66 In
Figure 4, direct costs are described by means of a production possibility curve, which is a graph
that shows the different rates of production of two goods that an individual or group can
efficiently produce with limited productive resources. If no resources are used for health care; Y
units of other goods are obtained, and vice versa. Health care involves in this case all the goods
and services that exist as a result of illnesses and accidents. All combinations along and under
the production possibility curve are possible. It should be noted that the area under the curve
means inefficiency; with the same resources more health care as well as other consumption can
be produced. In a society where the resources are distributed according to point C; A units of
health care and E units of other consumption can be attained. The direct cost for all the diseases
corresponds to the difference between Y and E. For a disease that causes resource distribution
according to point D; B units of health care and F units of other goods can be consumed. Hence,
the direct costs from that disease can be illustrated as the difference between F and Y. 66,67
Figure 4: Direct costs in an economic cost analysis
26
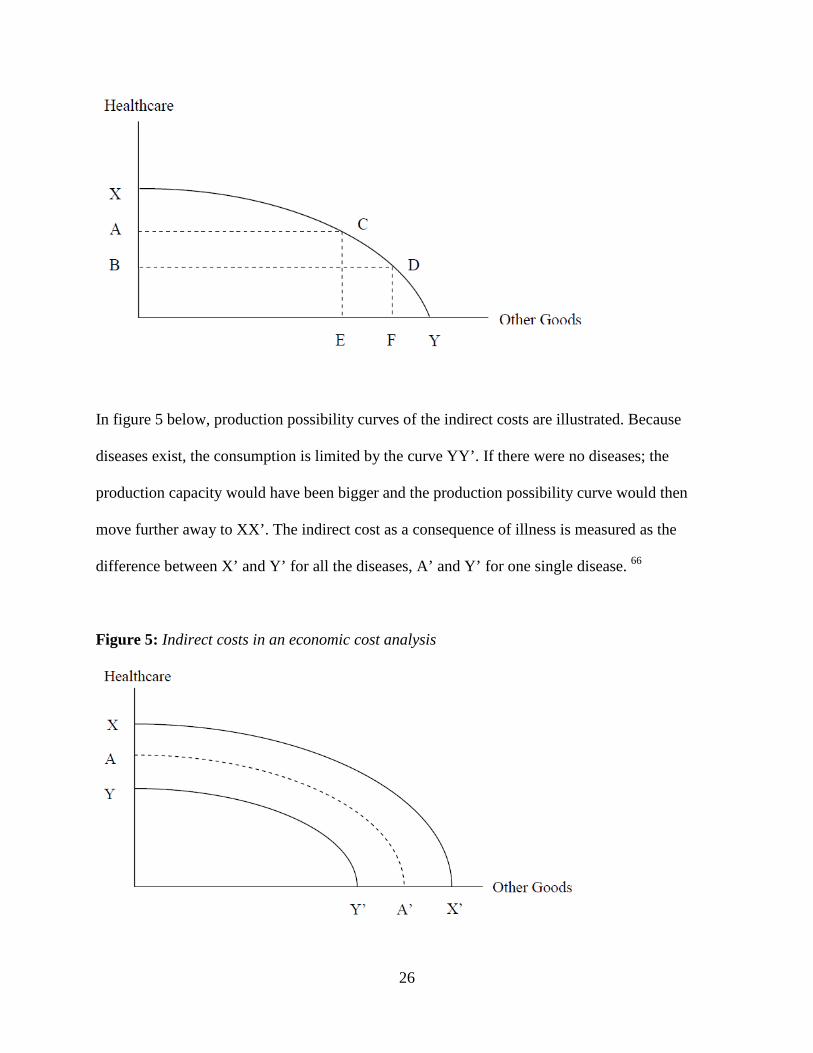
In figure 5 below, production possibility curves of the indirect costs are illustrated. Because
diseases exist, the consumption is limited by the curve YY’. If there were no diseases; the
production capacity would have been bigger and the production possibility curve would then
move further away to XX’. The indirect cost as a consequence of illness is measured as the
difference between X’ and Y’ for all the diseases, A’ and Y’ for one single disease. 66
Figure 5: Indirect costs in an economic cost analysis
27
Health Related Quality of Life
Wilson and Cleary’s HRQL conceptual model 68 forms the theoretical basis for the HRQL
research (Figure 6). According to the model, the measures of health can be thought of as existing
on a continuum of increasing biological, social, and psychological complexity. At one end of the
continuum are biological and physiological measures such as, the reaction between IgE and mast
cells responsible for food allergies. Such physiological factors lead to symptoms that may be
physical or emotional. The common physical symptoms from food allergy involve skin reactions.
The next level in the model is functional status which affects an individual’s ability to perform
particular defined tasks. Existing food allergies does not directly affect an individuals’ ability to
function, but it does force a change in certain daily activities like cooking and grocery shopping.
A combination of symptoms and daily functional ability usually influence individuals’ general
health perceptions. All these factors combined determine a subject’s well-being and is a measure
of how happy and/or satisfied they are with their health as a whole. This is commonly termed as
Health Related Quality of Life. Apart from the one’s discussed above, there can be other factors
that influence a person’s HRQL, as seen in the figure, such as personal motivation, social and
economic support, and psychological support.

28
Figure 6: Wilson and Cleary’s 68 HRQL conceptual model
Health utilities
Modern utility theory was developed in 1944 by von Neumann and Morgenstern. 69 It is a theory
of how individuals ought to make decisions in the face of uncertainty if they wish to act in a way
that is defined as rational. 20 Based on this theory, the term utilities (as currently used by health
economists) is defined as the cardinal values that represent the strength of an individual’s
preferences for specific outcomes under conditions of uncertainty. 70 Specifically, health utilities
are preferences for specific health states or treatments. They provide an approach to the
comprehensive measurement of HRQL.
In the 1970s, von Neumann-Morgenstern utility theory was extended to the class of problems in
which the outcomes are described by multiple attributes. This extension is known as multi-
attribute utility theory (MAUT). 71 This theory applies to the measurement of preferences for

29
health states that are defined according to a multi-attribute health status classification system.
Such a system consists of dimensions of health status called ‘attributes’, and ‘levels’ on each
attribute range from full function to severely compromised function. 71 To extend traditional
utility theory to MAUT, an additional assumption of first order utility independence is required.
71 This assumption implies that there is no interaction between preferences for levels on any one
attribute and the fixed levels for the other attributes. This characteristic must hold for each
attribute. 71
Previous Investigations
A large number of economic burden studies have been published over the past three decades. 35,72
These studies have captured a wide range of disease conditions, with greater focus on
cardiovascular diseases, cancer, diabetes, asthma, and musculoskeletal conditions. 73 Among the
allergic illnesses, economic burden studies have been very few, with most of them focusing on
allergic rhinitis. 74-79 In addition, there is no published literature estimating the economic burden
of food allergy in the U.S. or any other country. The only studies that discuss food allergy and
economic burden are by Miles et al. 17 and Fox et al. 31. The former provides a framework for
assessing cost of illness of food allergy from different viewpoints. It offers a structure for
identifying the different cost impacts on allergic and non-allergic consumers, food producers and
society as a whole, and for scoping, measurement and valuation of relevant costs. 17 The latter
discusses development of a questionnaire to measure social and economic costs of food allergies
in Europe. Focus groups and pilot surveys were conducted leading to the final design of the
questionnaire, which is now available for use to measure the direct and indirect costs of food

30
allergies across different settings and countries. 31 It is suitable to use a questionnaire to estimate
indirect and non-medical costs from food allergies; however, for medical costs researchers often
prefer using existing healthcare databases over questionnaires, primarily due to their large
sample sizes. 44
Food allergy is believed to have a significant impact on HRQL of patients and their families. 6
Several published studies have focused on this topic (Table 3). The majority of these investigated
the HRQL impact in either children or adolescents with food allergy, or parents with a food
allergic child. Only two studies have examined HRQL in adults with food allergy. The study by
Primeau et al. 80 reported that daily life was significantly more disrupted in peanut allergic adults
than in adults with a rheumatological disease. This study used a generic HRQL questionnaire,
and may be not as sensitive as a disease-specific HRQL questionnaire. 64 The study by Flokstra-
de Blok et al. 64 is relatively recent, and they developed the first disease-specific HRQL
questionnaire for food allergic adults (FAQL-AF), which reflects the most important issues that
food allergic patients have to face. 64 The questionnaire is valid, reliable and discriminates
between patients with different disease characteristics, 64 but has been administered and validated
only in the Dutch population and hasn’t been used in the U.S. population yet.
Table 3: Previous studies investigating the impact of food allergy on HRQL
Author Study Population Location Study
Year Questionnaire Used
Flokstra-de Blok, et al. 81 Children Netherlands 2007
Food Allergy Quality of Life Questionnaire (FAQLQ) – Children Form
Flokstra-de Blok, et al. 82 Adolescents Netherlands 2007 FAQLQ – Teenage Form
Flokstra-de Blok, Adults Netherlands 2007 FAQLQ – Adult Form

31
et al. 64 Dunngalvin A, et al. 83 Parents Ireland 2009 FAQLQ – Parent Form
LeBovidge J, et al. 84 Parents U.S. 2006 Food Allergy Parents
Questionnaire
Cohen B, et al. 85 Parents / families U.S. 2003 FAQL – Parental Burden
Questionnaire
Marklund B, et al. 86
Children – using parental perceptions
Sweden 2006
• CHQ – PF28 (Child Health Questionnaire Parent Completed Form 28)
• Food allergy specific questions
Marklund B, et al. 87 Adolescents Sweden 2004
• Food allergy specific questions
• Short-Form 36
Avery N, et al. 88 Children with peanut allergy
UK 2002 Food allergy questions adapted from Vespid Allergy QoL questions
Bollinger M, et al. 6
Children and their families U.S. 2005 Food Allergy Impact Scale
(FAIS)
Sicherer S, et al. 89
Children – using parental perceptions
U.S. 2000 CHQ – PF50
Primeau M, et al. 80
Peanut allergic adults and parents
Canada 2000 • Visual Analog Scale • Impact on Family
Questionnaire
Ostblom E, et al. 90
Children – parental perceptions
Sweden 2008 • Food allergy specific
questions • CHQ – PF28
Generalized Linear Models (GLM)
GLMs are empirical transforms of the classical linear (Gaussian) regression model and are
distinguished from Ordinary Least Squares (OLS) by particular model, rather than data
transformations: specifically, a response distribution of one of the exponential family of

32
distributions (normal, poisson, gamma, binomial, inverse gaussian) and a (monotonic) link
function (identity, logarithmic, square root, logistic, power) which relates the mean of the
response to a scale on which the model effects combine additively. It has been suggested that
health care expenditure and use data frequently have a log-normal or gamma distribution and the
studies using GLM for cost analysis have focused on the gamma response distribution and log
link. 91 In such log link models, covariates act multiplicatively on the dependent variable. For
their interpretation, they are usually exponentiated (anti-logged) to provide a ratio of means,
which can be re-expressed as the percentage increase in mean cost per unit increase in the
covariate. 91 For example, per year increase in age would increase/decrease costs by x%.
GLMs have lately become the preferred approach for multivariate analysis of cost data,
compared to the traditional OLS model, because medical cost data are usually right skewed, with
variability increasing as mean cost increases. 92 Such skewness violates the normality assumption
necessary with OLS regression. Another approach involves logarithmic transformation of cost
data to normalize the skewness. The key limitation of transformations is that it leaves the
problem of interpretation of the results. Analysis on transformed scales does not ‘provide
inferences about population mean costs which are of primary interest’. 91 Thus, ‘simple’
logarithmic transformation has attendant problems in terms of both the appropriate back
transformation into the original scale and the interpretation of regression coefficients. 92
A few key advantages of GLMs are:
• Relaxes normality and homoskedasticity assumptions

33
• Consistent even with misspecification of family, as long as link function and covariates
are specified correctly
• Avoids retransformation problems of log OLS models

34
CHAPTER 3
ESTIMATING THE ECONOMIC BURDEN OF
FOOD ALLERGY & ANAPHYLAXIS
Methods
Study design
This was a retrospective data analysis of 2006 and 2007 data (the latest available) from four
national databases maintained by federal agencies and published literature. A societal
perspective framed the study because it is more comprehensive in assessing the costs attributable
to a disease condition. 35 Economic costs were estimated using a prevalence-based approach,
which involves measuring the costs of an illness in one period, usually a year, regardless of the
date of onset. 35 This approach was considered suitable because food allergy reactions and
anaphylaxis are acute illnesses.
Direct medical costs in this study included emergency department visits, outpatient visits,
inpatient admissions, ambulance services, and epinephrine self-injected device usage. These
costs were estimated using the bottom-up approach, which involves calculating the average cost
of treatment of the illness and multiplying it by the prevalence. 35 Indirect costs from
productivity loss due to absenteeism and mortality were relatively easy to measure by assigning
an economic cost (e.g., salary and benefits lost) to each additional day absent or lost due to
death. But, assigning economic costs to decreased productivity in daily tasks was problematic
and difficult to defend. 17,93 Therefore, this study only assessed the indirect costs of FAA on

35
absenteeism and mortality using the human capital method which measured lost production in
terms of lost earnings of a patient or caregiver. 35
Data sources
Direct Medical Costs
Direct medical costs data was acquired from a combination of four federally funded and
nationally representative databases and published literature. The Healthcare Costs and Utilization
Project – National Inpatient Sample (HCUP NIS) database was used to capture the nationwide
hospitalizations. HCUP NIS is the largest all-payer inpatient care database in the country. It
contains discharge data from 1,045 hospitals located in 38 States and approximates a 20-percent
stratified sample of U.S. community hospitals. 94 For each recorded hospital stay, the following
data are provided: patient demographics, principal and co-morbid diagnoses, medical
procedures/tests, length of stay, payment source, total billed charges (does not include physician
fees) and patient visit ‘weight’. The ‘weight’ is an adjustment variable, essential to generate
national estimates of similar patient visits. Charges were adjusted using available cost-to-charge
ratios to more closely estimate the actual amount reimbursed by payers.
HCUP Nationwide Emergency Department Sample (NEDS) was used to generate cost estimates
for ED visits. NEDS is the largest all-payer ED database in the U.S., covering almost 20%
stratified sample of ED visits. The variables in this dataset are similar to HCUP NIS.
The National Ambulatory Medical Care Survey (NAMCS) database is a national probability
sample survey of approximately 0.3% of U.S. office-based physician visits, and it contains about

36
30,000 patient records. Data on variables similar to those collected in HCUP were gathered from
the NAMCS data set except billing information, which is not available.
The National Hospital Ambulatory Medical Care Survey (NHAMCS) database is a national
probability sample survey of hospital emergency department visits (NHAMCS ED dataset) and
hospital outpatient visits (NHAMCS OPD dataset). It samples approximately 10% of all visits in
the U.S. The variables in these datasets are similar to those in NAMCS. 95 For this research, we
used NHAMCS OPD dataset to capture hospital outpatient visits that occurred among FAA
patients as a result of allergic reactions.
Physician service fees are not included in any databases, hence Current Procedural Terminology
(CPT) codes were used to calculate physician utilization data from all four databases. CPT codes
for physician services accompanying inpatient, office, hospital outpatient, and emergency room
visits were combined with their respective Medicare reimbursement values 96,97 to estimate the
cost of physician services.
Direct costs for ambulance and epinephrine self-injected devices weren’t available from HCUP
or NAMCS dataset, hence were estimated from published studies. Estimates for ambulance runs
due to food allergy reaction were obtained from a study by Clark et al., 1 and cost per ambulance
run were obtained from a Government Accountability Office (GAO) report. 98 National estimates
for epinephrine self-injected device use by the patients following a documented food allergy
reaction were modeled from several studies, 2-4 and cost for an epinephrine device were
calculated using Average Wholesale Price (AWP) from Drug Red Book.

37
Indirect Costs
The costs of productivity loss due to absenteeism and mortality used methods described by
Haddix et al. 44 Productivity loss estimates for absenteeism were converted from annual mean
earnings to average daily figures and aggregated over age groups to yield estimates of the dollar
value of a day of incapacity. Costs from mortality were the present value of future earnings and
household production, which were calculated by discounting future expected earnings and
production for various ages.
A summary of data sources used in the study is provided in Table 4. The study did not require
Institutional Review Board (IRB) approval, because all patient data sources were de-identified.
Table 4: Summary of the data sources
Costs Causes Data Sources Data collected
Direct Medical costs
ED visit without hospitalization HCUP - NEDS
Total billed charges (converted to costs using CTC ratio), and prevalence estimates
Hospital outpatient visit NHAMCS - OPD Diagnostic procedures, laboratory tests, medications, and prevalence estimates
Physician office visit NAMCS Same as above
Inpatient admission (with and without ED visit) HCUP - NIS
Total billed charges (converted to costs using cost-to-charge ratio), and prevalence estimates
Ambulance runs Clark et al. 1 National estimates for ambulance runs
GAO report 98 Mean Medicare
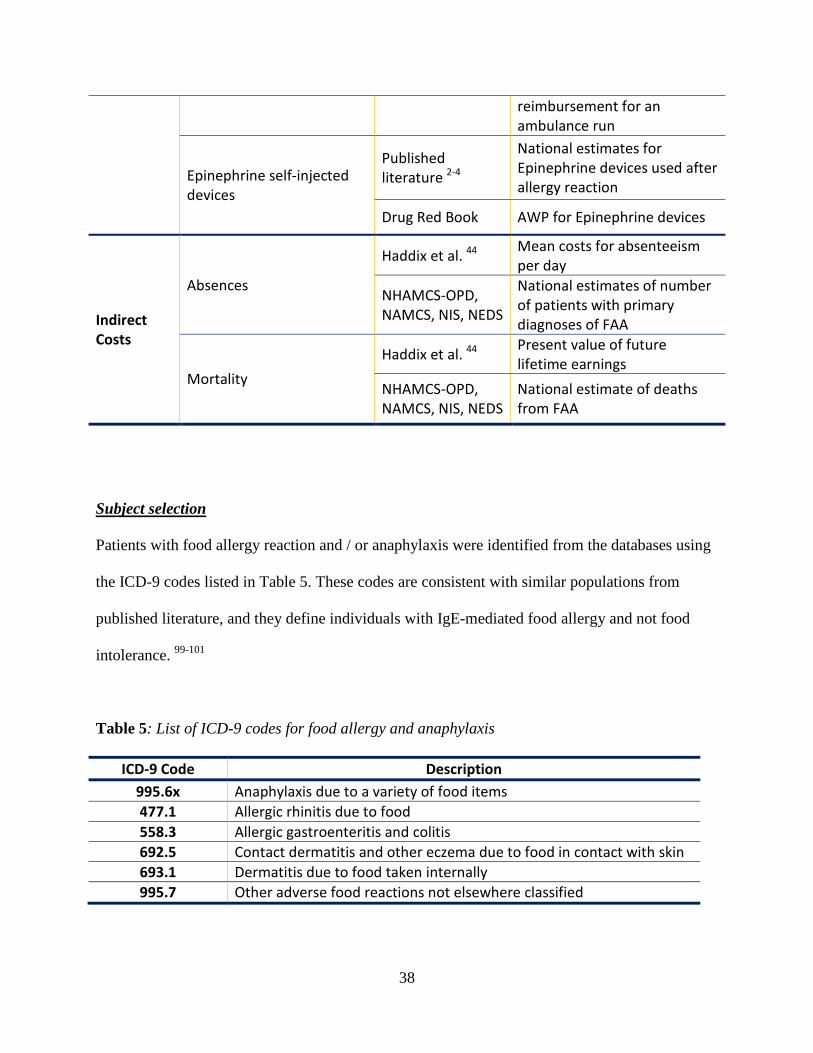
38
reimbursement for an ambulance run
Epinephrine self-injected devices
Published literature 2-4
National estimates for Epinephrine devices used after allergy reaction
Drug Red Book AWP for Epinephrine devices
Indirect Costs
Absences
Haddix et al. 44 Mean costs for absenteeism per day
NHAMCS-OPD, NAMCS, NIS, NEDS
National estimates of number of patients with primary diagnoses of FAA
Mortality Haddix et al. 44 Present value of future
lifetime earnings NHAMCS-OPD, NAMCS, NIS, NEDS
National estimate of deaths from FAA
Subject selection
Patients with food allergy reaction and / or anaphylaxis were identified from the databases using
the ICD-9 codes listed in Table 5. These codes are consistent with similar populations from
published literature, and they define individuals with IgE-mediated food allergy and not food
intolerance. 99-101
Table 5: List of ICD-9 codes for food allergy and anaphylaxis
ICD-9 Code Description 995.6x Anaphylaxis due to a variety of food items 477.1 Allergic rhinitis due to food 558.3 Allergic gastroenteritis and colitis 692.5 Contact dermatitis and other eczema due to food in contact with skin 693.1 Dermatitis due to food taken internally 995.7 Other adverse food reactions not elsewhere classified
39
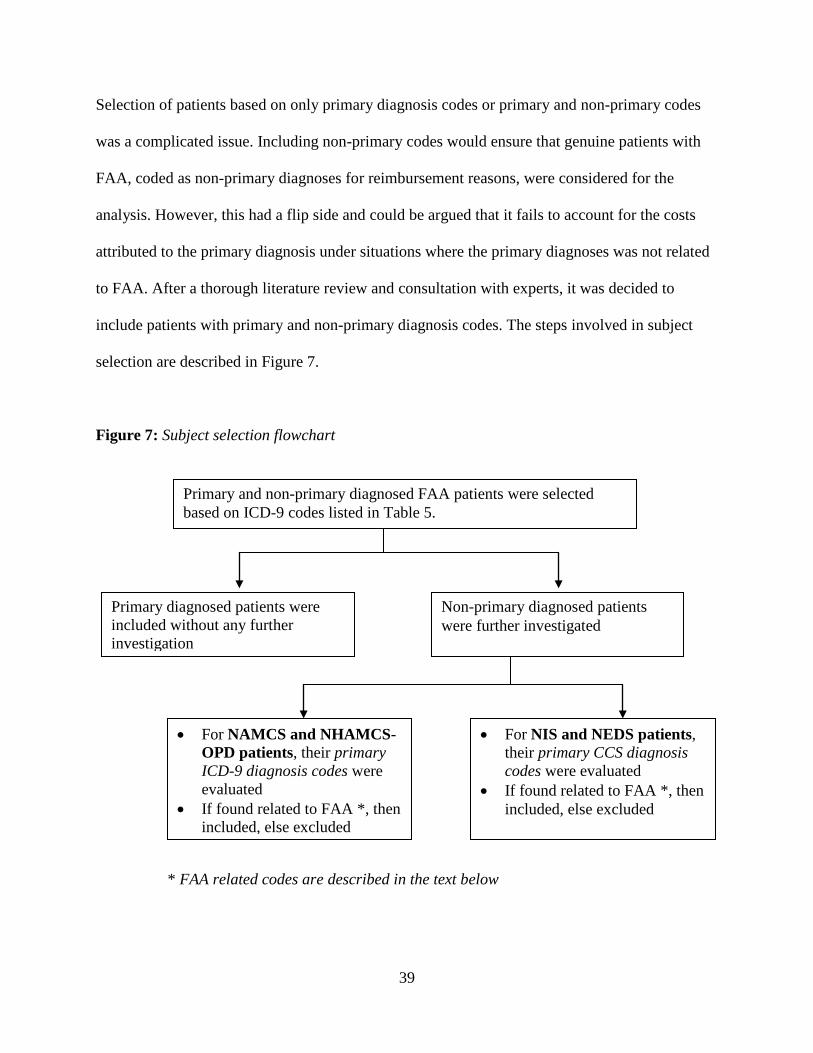
Selection of patients based on only primary diagnosis codes or primary and non-primary codes
was a complicated issue. Including non-primary codes would ensure that genuine patients with
FAA, coded as non-primary diagnoses for reimbursement reasons, were considered for the
analysis. However, this had a flip side and could be argued that it fails to account for the costs
attributed to the primary diagnosis under situations where the primary diagnoses was not related
to FAA. After a thorough literature review and consultation with experts, it was decided to
include patients with primary and non-primary diagnosis codes. The steps involved in subject
selection are described in Figure 7.
Figure 7: Subject selection flowchart
Primary and non-primary diagnosed FAA patients were selected based on ICD-9 codes listed in Table 5.
Primary diagnosed patients were included without any further investigation
Non-primary diagnosed patients were further investigated
• For NAMCS and NHAMCS-OPD patients, their primary ICD-9 diagnosis codes were evaluated
• If found related to FAA *, then included, else excluded
• For NIS and NEDS patients, their primary CCS diagnosis codes were evaluated
• If found related to FAA *, then included, else excluded
* FAA related codes are described in the text below

40
Since there were a small number of patients (<50) in NAMCS and NHAMCS-OPD datasets, the
primary ICD-9 diagnosis codes for each non-primary diagnosed patients were perused manually
by the primary researcher. A decision, on whether the codes were related to FAA, was made
based on referencing the common symptoms from food allergy and a clinician’s opinion. Hence,
if a primary code’s description was found similar to one of the listed food allergy symptoms
(obtained from published literature 7,21,102), the patient was included. List of primary ICD-9 codes
that were included are presented in Table 6.
Table 6: Primary ICD-9 codes for non-primary diagnosed NAMCS and NHAMCS-OPD patients
that were included
ICD-9 Code Description 692.9 Contact dermatitis and other eczema, unspecified cause
477.90 Allergic rhinitis, unspecified cause 691.80 Other atopic dermatitis and related condition 708.00 Allergic urticaria 472.00 Chronic rhinitis 708.90 Unspecified urticaria 473.90 Unspecified sinusitis (chronic) 536.90 Unspecified functional disorder of stomach 493.00 Extrinsic asthma unspecified 477.20 Allergic rhinitis 493.90 Asthma, unspecified
In NIS and NEDS datasets combined, there were over 20,000 patient records. Initial analysis
revealed that the primary ICD-9 codes for non-primary diagnosed patients varied greatly, and
there were over 1000 unique ICD-9 codes. Examining each code would be very tedious, and
hence, an alternative had to be found to decide whether the non-primary diagnosed patients were
related to FAA. The selected alternative was Clinical Classifications Software (CCS) codes
developed by HCUP for its NIS and NEDS datasets. This classification system collapses the

41
multitude of ICD-9 diagnosis (14,000) and procedure (3,900) codes into a smaller number (about
250) of clinically meaningful categories. For every ICD-9 codes, each patient in these datasets is
also assigned a matching CCS code. Hence, the primary CCS codes for non-primary diagnosed
patients were evaluated, and using criteria as discussed above, were either included or excluded
from the analysis. Along with the description of CCS codes, the list of ICD-9 codes included
under the selected CCS codes was also reviewed prior to making the inclusion / exclusion
decision. List of primary CCS codes that were included are presented in Table 7.
Table 7: Primary CCS codes for non-primary diagnosed NIS and NEDS patients that were
included
CCS Code Description 251 Abdominal pain 253 Allergic reactions 128 Asthma 93 Conditions associated with dizziness or vertigo
138 Esophageal disorders 140 Gastritis and duodenitis 250 Nausea and vomiting 154 Noninfectious gastroenteritis 155 Other gastrointestinal disorders 198 Other inflammatory condition of skin 200 Other skin disorders 131 Respiratory failure; insufficiency; arrest 245 Syncope
Measuring direct medical costs
The methods for estimating the direct medical costs from the datasets and literature are described
in the following sections. Figure 8 summarizes the procedure for calculating direct medical and
indirect costs from FAA.

42
Inpatient admission
HCUP-NIS was used to estimate costs for patients that had a hospitalization with or without a
prior ED visit. The dataset provided total charges billed by facilities for the full inpatient stay,
ambulatory surgery/diagnosis procedure, lab tests, or ED visit. This eliminated the need of
tracking individual procedures and lab tests prescribed for the patient. Charges were converted to
costs using the hospital specific cost-to-charge (CTC) ratio, which was provided in a separate file
with the dataset. The CTC data file had an ‘All-payer inpatient CTC’ (APICC) rate, which is
unique for every participating hospital. The data also provided the ‘Group average CTC’
(GAPICC), which is a weighted average for each hospitals based on the groups they are
assigned. These groups are defined by variables such as state, urban/rural, investor-owned/other,
and bed size. Ideally APICC rate should be used, but it had several missing values, and hence,
GAPICC rates were used. Physician service fees were determined for initial inpatient visit and
discharge visit using appropriate CPT codes (listed in Table 8), and added to each discharge.
Total inpatient costs were computed by multiplying the final cost for each patient discharge by
its patient-visit ‘weight’ (provided by the database), and then adding them all up. It should be
noted that the obtained cost estimates would be for the years 2006 and 2007 combined. Hence,
these values had to be divided by two to generate costs estimates for a given year (2007). The
same procedure was repeated for all other cost categories.
Table 8: CPT codes used in the study
CPT Code Description For Inpatients
99222 New/Established hospital inpatient with moderate severity 99238 Hospital discharge day management (30 minutes)

43
For ED visit 99284 ED visit for evaluation of a patient
For Office-based physician and OPD visit 99241 15 minutes with physician
ED visit without hospitalization
HCUP-NEDS dataset provided total charges billed by facilities for the ED visit, similar to NIS.
These charges were converted to costs using cost-to-charge ratio. Unlike for NIS, HCUP does
not provide hospital specific CTC ratio data for NEDS. Hence, an average CTC ratio of 0.53,
estimated from publicly available Medicare cost report data was used. 95 Physician visit fees
were obtained using Medicare reimbursement for CPT code listed in Table 8, and added to the
costs. Patients with an ‘ED visit without hospitalization’ were identified using the ‘DISP_ED’
variable, which described the patients’ hospitalization status after an ED visit. Cases with
hospitalizations following an ED visit were excluded for this cohort to avoid double counting,
since they were included under inpatients cohort. Total ED costs were computed using a similar
procedure as described under inpatients.
The ‘total charges’ variable in NEDS had missing values for about 20% of the data. Excluding
all those records would result in a huge loss of data, and hence, the missing values were imputed
using specialized techniques. This is described in greater detail under the ‘Missing value
analysis’ section.

44
Figure 8: Summary of the procedure for calculating direct medical and indirect costs
1. Direct Medical Costs: Medical Facilities Σ (Inpatient cost × Discharge weight) + Σ (ED visit cost × Patient-visit weight) + Σ (OPD visit cost × Patient-visit weight) + Σ (Physician office visit cost × Patient-visit weight)
2. Direct Medical Costs: Ambulance Cost of an ambulance run × National estimate of ambulance runs for FAA (obtained from Clark et al.1)
3. Direct Medical Costs: Epinephrine self injected devices Cost of an epinephrine self injection × National estimate of such injections after an FAA reaction (obtained from published literature 2-4 )
4. Indirect Costs: Absenteeism No. of absent days × Mean wage per day × National estimate of no. of patients with primary diagnoses of FAA (obtained from the databases)
5. Indirect Costs: Mortality Mean future productivity loss × National estimate of deaths from FAA (obtained from the databases)
Estimated Costs of Food Allergy and Anaphylaxis (FAA) = summation of 1 to 5

45
Outpatient visit
Outpatient visits could be either to an office-based physician or a hospital outpatient clinic. The
NAMCS database was used to collect resource use for the former and NHAMCS-OPD for the
latter. Total costs for each of these visits (for each patient) were computed using similar
procedures, by aggregating the reimbursement costs for physician fees, diagnostic procedures,
laboratory tests and medications prescribed. Physician visit fees were obtained using Medicare
reimbursement for appropriate CPT codes (listed in Table 8). Reimbursements for FAA related
procedures were determined using APC (Ambulatory Payment Classification) codes for the year
2007, which are maintained and used by Center for Medicare and Medicaid Services (CMS). For
laboratory services, ‘Medicare Lab Schedule Reimbursement 2007’ file was used, freely
available from the CMS website. Reimbursements for medications were based on the Average
Wholesale Prices (AWP) published in the Drug Red Book. For brand name drugs,
reimbursement was calculated as,
AWP – 16.1% + 1.88
and for generic drugs as,
AWP – 43.6% + 1.92
The percentage values are the average reimbursement received by pharmacies from insurance
companies, and ‘1.88’ and ‘1.92’ are the average dispensing fee reimbursed to pharmacy stores.
These values were obtained from the 2007 Pharmacy Benefit Management Institute (PBMI)
report. 103 Facility charges, obtained from published literature, were included while estimating
hospital outpatient visit costs. 104
46
Total outpatient costs were computed by multiplying the aggregated cost for each visit by its
patient-visit ‘weight’ (provided by the database), and then adding them all up.
Ambulance runs
National estimates for ambulance runs due to food allergy reaction were obtained from the study
by Clark et al.1 These estimates were multiplied by the mean Medicare reimbursement for an
ambulance run, obtained from a report published by the Government Accountability Office. 98
Epinephrine self-injected devices
National estimates for epinephrine devices used after a food allergy reaction were obtained from
the published literature, 2-4 which estimate that 30% to 86% of patients with allergies carry
epinephrine devices at all times. An assumption was made that all patients who have device will
use it following a reaction. These estimates were multiplied with the average unit cost of an
epinephrine device, calculated using the brand name drug formula described under ‘Outpatient
visit’ section.
Measuring indirect costs
Morbidity
Indirect costs due to morbidity accounted for lost wages from absenteeism from work. For
inpatients, absenteeism was defined as their length of stay. For patients with only an
ED/ambulatory visit, an absence of one day was considered because published literature does not
suggest any follow up visits. In case of FAA in children, an absence of one day was assumed for

47
one parent acting as a caregiver. The lost days of work were multiplied with the mean value of a
lost day, based on the Current Population Survey conducted by the U.S. Census Bureau, obtained
from Haddix et al. 44 These estimates were for the year 2000, and were adjusted upward to 2007
estimates using average annual earnings increases reported by the Bureau of Labor Statistics
(BLS). 105 BLS reported an average hourly wage of $17.42 and $14.02 for the years 2007 and
2000 respectively (for the private sector). Their ratio of 1.24 was used as an adjusting factor to
convert the ‘mean value of a lost day’ estimates to 2007 values. 44
Mortality
Indirect costs due to mortality estimated the future productivity loss to society because of
premature deaths. Deaths were identified using the ‘discharge status’ variable of the databases.
Indirect costs were derived using Appendix I from Haddix et al., 44 which projects the present
value of future lifetime earnings by age and gender, using a range of different discount rates
(from 0% to 10%). For every patient that died, their lost earnings were estimated from the
appendix based on their age and gender, using a discount rate of 3%. 106,107 All indirect costs
included earnings estimates and household production estimates. Earnings estimates comprise of
the money paid to individuals in the form of wage and salary income. In contrast, household
production estimates refer to the value of household services performed by household members
who do not receive pay for these services. 44 Household production estimates were more
prominent in case of mortality, than morbidity.

48
Data analyses and Assumption testing
All statistical analyses were performed using PASW (formerly called SPSS) version 17 and SAS
version 9.2 software packages. Estimates for continuous variables were reported using mean and
standard deviation, and for categorical variables using frequencies and proportions.
GLM was used to examine the impact of asthma on total healthcare costs incurred, controlling
for age, gender, race, location, primary payer, hospital characteristics, and severity of illness. The
model used gamma distribution 108 and log link functions. National inpatient data (from HCUP-
NIS) was used to conduct the analysis. The rationale for selecting GLM over OLS regression is
explained in chapter 2. Table 9 provides a detailed description of all variables included in the
regression model.
Table 9: Description of variables used in the GLM
Variables Description Categories Dependent Variable
Healthcare costs
Direct medical costs incurred per inpatient visit N/A
Independent Variables Age Age of the patient N/A
Asthma Whether the patient had asthma listed as a co-morbidity
• Yes • No
Gender Gender of the patient o Male o Female
Race Ethnic race of the patient
• White • Black • Hispanic • Asian or Pacific Islander • Native American • Other

49
• Missing from source
APR severity of illness
All Patient Refined severity of illness assigned to patients based on their Diagnosis Related Groups (DRGs)
o No class specified o Minor loss of function (includes cases
with no co-morbidity or complications) o Moderate loss of function o Major loss of function o Extreme loss of function o Missing
Primary payer
Expected primary payer for the patients healthcare costs
• Medicare • Medicaid • Private insurance • Self-pay • No charge • Other • Missing
Hospital location
Hospital location based on the urban-rural classification
o Rural o Urban o Missing
Hospital teaching status
Hospitals teaching status obtained from AHA annual hospital survey
• Teaching • Non-teaching
Hospital bed size Hospitals bed size capacity
o Small o Medium o Large
Variables were included in the model based on their perceived significance in the prediction,
rather than just the significance testing (using p-values). Age, gender, race are commonly
included covariates, and were considered reasonable proxies for a person’s need for healthcare
services. 109 Hospital and insurance characteristics were included to control for the differences
that could arise in type and quality of care based on the type of hospital and insurance coverage.
Asthma was included as a predictor variable, controlling for the patients severity of illness.
Different models, with inclusion and exclusion of interaction variables (age x asthma, age x

50
severity of illness, children x asthma), were compared based on the likelihood ratios and
Akaike’s Information Criterion (AIC). Model with the best fit was analyzed for the final results.
Regression models were tested for the four key assumptions prior to analyses.
(i) Linearity – tested by a scatter plot of standardized residuals against standardized
predicted values. The graph should show a linear trend. Additionally, as a rule of
thumb, standard deviation of residuals < standard deviation of predicted values also
indicate linearity in the model. 110
(ii) Normality – Shapiro-Wilk test was used to assess normality of the cost data. Ordinary
Least Square regression assumes normal distribution. Conversely, Generalized Linear
Models are flexible with the normality assumption and allows specifying different
distributions based on the data.
(iii) Homoskedasticity – refers to constant variance in error terms for all values of the
predictor variable. It was tested by plotting deviance residuals against predicted
values. A uniform scatter of points implies homoskedasticity.
(iv) Multicollinearity – refers to unacceptably high levels of correlation amongst the
independent variables. It was tested by calculating Variance Inflation Factors (VIF)
for the independent variables. VIF values > 4 are considered to indicate
multicollinearity. 110
51
Matched analysis
Food allergic reaction patients were matched with similar patient hospitalizations without food
allergy in a ratio of 1:2. The matching factors included age, gender, race, primary payer, hospital
characteristics (location, bed size and teaching status), and severity of illness during the
hospitalization. Exact matching was performed on all the eight listed variables, and such a
technique is called ‘greedy matching.’ Matched analysis was conducted with inpatient sample
(NIS), since they provided a huge pool of patients (> 7 million) that allowed matching on all
controlling variables. NEDS had a large cohort as well, but did not contain several variables that
were supposed to be matched. SAS v.2 was used for this analysis, and the matching codes are
provided in Appendix C.
Sensitivity analyses
The study used a range of data sources and assumptions, and hence, there was inevitably some
uncertainty in the estimated costs of FAA. Sensitivity analysis was therefore conducted to
examine potential sources of uncertainty in the data.
One-way sensitivity analyses and Tornado diagram
One-way sensitivity analyses were performed on cost and prevalence estimates by varying the
value of one variable at a time, through a range of plausible values, while keeping the other
variables constant. These analyses helped identify variables having greatest impact on direct and
indirect costs. Table 10 lists the baseline values and ranges along with their sources for all

52
variables used in the sensitivity analyses. Ranges were generated using gamma distribution for
several cost variables in probabilistic sensitivity analysis. This was not possible in one-way
analysis, and hence, 5 and 95 percentile values were used for the ranges. Tornado diagrams were
also constructed in MS Excel software, for direct and indirect costs using the results of one-way
sensitivity analyses. A tornado diagram is a set of one-way sensitivity analyses brought together
in a single graph, with the most critical variable in terms of impact at the top of the graph and the
rest ranked according to their impact thereafter. 111
Table 10: Key variables and ranges used in sensitivity analyses
Variables Baseline Range Source Common variables
Daily wage – Men $164 131; 197 ± 20% Daily wage – Women $109 87; 131 ± 20%
Present value for future productivity lost (mortality costs)
Differs with age at death
Using gamma distribution, Mean = 892,153
and SD = 453,180
Haddix et al. 44
Inpatients
Mean Inpatient cost $4719 Using gamma distribution,
Mean = 4719 and SD = 9136
NIS dataset
No. of inpatients 11,508 9620; 21,713 Clark et al.112
No. of inpatient deaths 15 15; 150 Sampson et al. 30; Bock et al.4
Days lost from work 3 Using gamma distribution, Mean = 2.6 and SD = 4.1
NIS dataset
ED visits
Mean ED visit cost $551.3 Using gamma distribution,
Mean = 551.3 and SD = 439
NEDS dataset
No. of ED visits 163,876 131,071; 309,200 Clark et al.112
No. of ED deaths 8 8; 150 Sampson et al.30; Bock et al.4
OPD visits Mean OPD visit costs 279 223; 335 ± 20% No. of OPD visits 66,849 53,479; 126,130 Clark et al.112
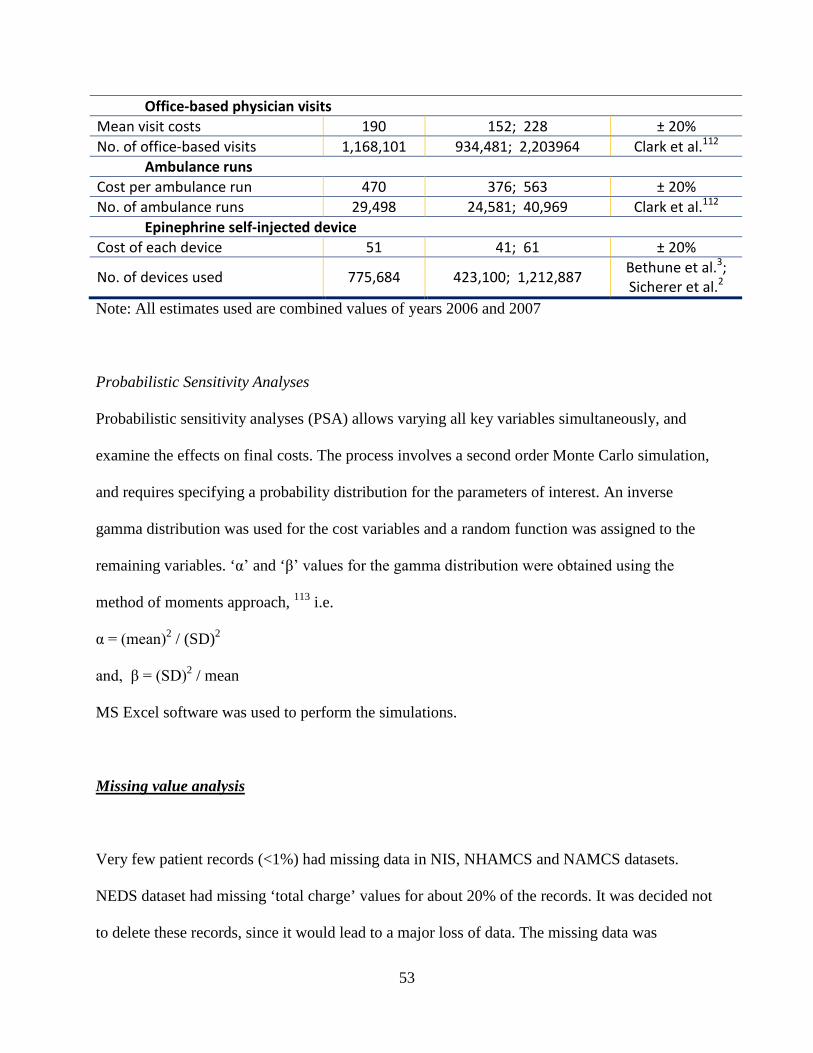
53
Office-based physician visits Mean visit costs 190 152; 228 ± 20% No. of office-based visits 1,168,101 934,481; 2,203964 Clark et al.112
Ambulance runs Cost per ambulance run 470 376; 563 ± 20% No. of ambulance runs 29,498 24,581; 40,969 Clark et al.112
Epinephrine self-injected device Cost of each device 51 41; 61 ± 20%
No. of devices used 775,684 423,100; 1,212,887 Bethune et al.3; Sicherer et al.2
Note: All estimates used are combined values of years 2006 and 2007
Probabilistic Sensitivity Analyses
Probabilistic sensitivity analyses (PSA) allows varying all key variables simultaneously, and
examine the effects on final costs. The process involves a second order Monte Carlo simulation,
and requires specifying a probability distribution for the parameters of interest. An inverse
gamma distribution was used for the cost variables and a random function was assigned to the
remaining variables. ‘α’ and ‘β’ values for the gamma distribution were obtained using the
method of moments approach, 113 i.e.
α = (mean)2 / (SD)2
and, β = (SD)2 / mean
MS Excel software was used to perform the simulations.
Missing value analysis
Very few patient records (<1%) had missing data in NIS, NHAMCS and NAMCS datasets.
NEDS dataset had missing ‘total charge’ values for about 20% of the records. It was decided not
to delete these records, since it would lead to a major loss of data. The missing data was

54
identified to have a ‘Univariate Missing Pattern’ because only one variable (total charge) had
missing values more than 1%. 114 In addition, the missing pattern was assumed to be ‘Missing
Completely At Random’ (MCAR), i.e. the missing values bear no relation to the value of any of
the variables, because the reason for missing values was unclear from the data. 115
Missing values were imputed using Multiple Imputation (MI) technique. With this technique, the
missing charge values were imputed several (m) times, where the values to fill were drawn from
the predictive distribution of the missing data, given the observed data, using regression
techniques. 115 Choosing the imputation model is an important step, and its intention is not to
provide a parsimonious description of the data, nor to represent structural or causal relationships
among variables. 114 The model is merely a device to preserve important features of the joint
distribution (means, variances, and correlations) in the imputed values. It is not necessary to have
a scientific theory underlying an imputation model; however, it is crucial for that model to be
general enough to preserve effects of interest in later analyses. 114 Hence, it was decided to
include all observed variables as covariates in the model. These were age, presence of asthma,
disposition after ED visit, primary diagnosis CCS code, type of ED event, gender, region of
hospital, number of diagnoses on the record, primary expected payer, patient location, year, and
primary vs. non-primary diagnoses.
In this study, five imputations were generated as this should give efficiency greater than 95%. 115
Imputations were performed using PASW 17.0 (previously known as SPSS) software. The
initial imputations performed for the ‘total charge’ variable resulted in several negative imputed
values. Additionally, the mean values for each imputation were considerably higher and the
55
maximum values were considerably lower than for the original data. This could have resulted
from the right-skewed distribution of the charge values. In order to prevent this, imputations
were performed for logarithm of ‘total charge’ with minimum values restricted at zero. The
logarithm values were later converted to charge values prior to the analyses.
Limitations
This research has following limitations:
• NAMCS and NHAMCS databases contain only 30,000 patient-visit records. This made it
difficult to find a sufficient number of food allergic records to generate reliable estimates.
Hence, the results should be interpreted with caution. Sensitivity analyses were
conducted using a range of prevalence estimates for ambulatory visit to account for the
potential inaccuracies in the cost estimates due to the small sample size.
• The study did not estimate direct nonmedical costs such as those incurred from lifestyle
changes due to FAA. Hence, the total costs were underestimated because the study only
addresses the cost of treatment – not the cost of prevention.
• Using hospital specific cost-to-charge ratios may introduce errors in the estimates, since
one common ratio across different hospital services might over or underestimate actual
costs. 95
• The cost values range over two years, 2006 and 2007. The results were reported for only
2007 baseline year without any adjustments, because it was believed that the difference
would be very small.

56
• Subject selection from the datasets was done by reviewing ICD-9 codes by the primary
researcher and inputs from a clinician. This could have introduced a bias in the selection
procedure, since only one expert opinion was used.

57
Results
There were an estimated 11,327 inpatient admissions, 163,876 emergency department visits,
66,849 oupatient visits, and 1.17 million office based physician visits from food allergy and
anaphylaxis in the U.S. over the years 2006 and 2007. Table 11 provides description of the
demographic and clinical characteristics of these patients in the four different datasets. Mean age
of patients was around 23 to 26, except in outpatient visits, where it was 8 years. Proportion of
children varied within the different patient cohorts. Asthma, as co-morbidity, varied as well with
proportions ranging from 1.1% in OPD to 27.3% in office based visits. Mortality rates from food
allergic reactions were very low (<0.5%).
Table 11: Demographic and clinical characteristics of FAA patients (2006 and 2007 combined)
Characteristics Inpatients (NIS)
ED visit (NEDS)
OPD visit (NHAMCS-OPD)
Office-based physician visit
(NAMCS) Number of visits
• Sample count * 2259 35,907 24 26
• Weighted count 11,327 163,876 66,849 1,168,101 Age, mean (SD), years 25.8 (26.3) 26.6 (20.1) 8.0 (15.1) 23.4 (26.4)
• Children (< 18 yrs), n (%) 5776 (51) 62,631 (38.2) 65,743 (98.3) 783,576 (67.1) Gender, male / female (%) 48.6 / 50.7 44.4 / 55.6 61.5 / 38.5 51.5 / 48.5 Race, n (%)
• White 4449 (39.3) N/A 37,788 (56.5) 565,620 (48.4) • African-American 1929 (17) N/A 25,440 (38.1) 229,306 (19.6)
• Hispanic 1370 (12.1) N/A 0 0 • Asian / Pacific Islander 341 (3) N/A 3216 (4.8) 0
• Other 566 (5) N/A 0 0 Asthma, n (%) 2501 (22.1) 10,342 (6.3) 736 (1.1) 318,630 (27.3) Mortality (%) 33 (0.3) 9 (0.006) 0 0 Length of Stay, mean (SD) days 2.5 (4.2) N/A N/A N/A APR Severity of illness, n (%)

58
• Minor loss of function 5834 (51.5) N/A N/A N/A • Moderate loss of function 4130 (36.4) N/A N/A N/A • Major loss of function 1038 (9.2) N/A N/A N/A • Extreme loss of function 328 (2.9) N/A N/A N/A
* Records with missing cost values excluded
N/A = Not Available
The study also analyzed the number of FAA patients and mean costs by the different ICD-9
codes (Table 12). Food anaphylaxis (ICD-9 code 995.6x) accounted for 44% of the hospitalized
patients and 10.6% of ED patients. Mean costs incurred by anaphylactic patients ($ 4445) were
found to be significantly lower than non-anaphylactic food allergic ($ 4938) hospitalized patients
(Kruskal-Wallis p-value = 0.003). On the contrary, among the ED visit sample, anaphylactic
patients ($ 749) incurred significantly higher costs than non-anaphylactic food allergic ($527)
patients (Kruskal-Wallis p-value < 0.001).
Table 12: Number of patients and mean costs broken down by ICD-9 codes
ICD-9 Code Inpatient Sample (n=2259) ED Visit Sample (n=35,809)
No. of patients (%)
Mean Costs (SD)
No. of patients (%)
Mean Costs (SD)
995.6x - Food Anaphylaxis 987 (43.8) $ 4445 (7398) 3691 (10.6) $ 749 (591) 477.1 - Allergic rhinitis from food 11 (0.5) $ 4592 (2988) 98 (0.3) $ 869 (2239) 558.3 - Allergic gastroenteritis/colitis 606 (26.8) $ 6042 (13738) 993 (2.8) $ 595 (485)
692.5 - Contact dermatitis/other eczema 5 (0.2) $ 6077 (5727) 555 (1.5) $ 417 (256)
693.1 - Dermatitis from food taken internally 351 (15.5) $ 4079 (5951) 18,434 (51.3) $ 502 (392)
995.7 - Other adverse food reactions 299 (13.2) $ 3605 (4188) 12,038 (33.5) $ 564 (455)

59
Direct medical costs
Total annual direct medical costs from food allergy and anaphylactic reactions were estimated at
$225 million (year 2007 US dollars). Office visits accounted for 52.5% of costs, and the
remainder was split among ED visits (20%), inpatient hospitalizations (11.8%), OPD visits
(3.9%), ambulance runs (3%), and epinephrine devices (8.7%). Costs are detailed in Table 13.
Children accounted for 46.6% of the total inpatient costs, 31.5% of the ED visit costs, 67.3% of
the office-visit and 97.7% of the total OPD visit costs.
Table 13: Direct Medical Costs (USD 2007 values)
Type of costs Average costs per patient (SD) Median (IQR) Total annual costs
(in millions) Inpatients $ 4719 (9136) $2703 (1750 – 4615) $ 26.6 ED visits $ 553 (462) $428 (285 – 665) $ 44.8 Office-based physician visits $ 193 (119) $185 (88 – 303) $ 118.2 OPD visits $ 280 (89) $277 (183 – 341) $ 8.7 Ambulance runs $ 469.5 * – $ 6.9 Epinephrine self-injected device $ 50.7 * – $ 19.7
TOTAL – – $ 224.9 * These are the unit costs per ambulance run or epinephrine device
Indirect costs
Morbidity related costs were dominant, accounting for 85% of the indirect costs. These costs
primarily arise from disease related sick days. Among morbidity related indirect costs, office
visits were responsible for the majority proportion (82%). Detailed cost descriptions are provided
in Table 14.

60
Table 14: Indirect Costs (USD 2007 values)
Type of patients Total annual costs – Morbidity related
(in millions)
Total annual costs – Mortality related
(in millions) Inpatients $ 2.0 $ 12.2 ED visits $ 10.9 $ 4.8 Office-based physician visits $ 80.2 - OPD visits $ 4.8 - TOTAL $ 97.9 $ 17.0
Sensitivity analysis
A series of one-way sensitivity analyses (represented by the Tornado diagram in Figure 9)
revealed the most sensitive variables in the model. Variations in the prevalence estimates and
mean costs for office-visits, inpatients and ED visits resulted in the largest impact on the direct
costs. For instance, a ±20% variation in the office-visit prevalence resulted in a ± $120 million
impact on the direct costs. For the indirect costs, the changes in number of food allergy related
deaths and office-visit prevalence estimates accounted for the largest impact. Varying the
number of ED and inpatient deaths within the published ranges resulted in an approximately ±
$60 million impact on indirect costs.
Figure 9: One-way sensitivity analysis (Tornado diagrams)
a) For Direct costs

61
b) For Indirect costs

62
The simultaneous changes in all variables within their specified ranges were analyzed by running
10,000 simulations of the data using probabilistic sensitivity analysis, and are reported in Table
15. During the simulations, the direct cost estimates ranged between $180 million and $1.3
billion, and the indirect costs between $112 million and $443 million. The mean (±SD) direct
and indirect costs after 10,000 simulations were $307 (±89.5) million and $202.7 (±39.7) million
respectively.
Table 15: Results of Probabilistic Sensitivity Analysis (USD 2007 values)
After 10,000 simulations Direct costs (in millions) Indirect costs (in millions) Mean $ 307.0 $ 202.7 S.D. 89.5 39.7 Minimum $ 180.3 $ 112.3 Maximum $ 1,290.6 $ 443.8 25 percentile $ 248.7 $ 173.8 50 percentile $ 283.1 $ 197.3 75 percentile $ 337.4 $ 225.7
Figure 10: Scatter plot for simulations
a) Direct costs

63
b) Indirect costs
$100
$300
$500
$700
$900
$1,100
0 2000 4000 6000 8000 10000
Dire
ct M
edic
al C
osts
(in
Mill
ions
)
Simulations
$100
$150
$200
$250
$300
$350
$400
$450
0 2000 4000 6000 8000 10000
Indi
rect
Cos
ts (i
n M
illio
ns)
Simulations

64
Regression models
Generalized linear models with gamma distribution and log link were performed for the
inpatients and ED visit patient samples. For the inpatient sample, 1719 patients were included in
the regression, and 35,693 patients for the ED visit sample. The selected models had the lowest
Akaike’s Information Criterion (AIC) values compared to other models with interaction
variables. Lower AIC values imply a better fit model.
Shapiro-Wilk tests for cost values were statistically significant (p-value < 0.001) with inpatient
and ED visit samples, which indicated non-normality with the cost data. This was accounted for
by conducting GLMs using gamma distribution for the cost data. Scatter plots of deviance
residuals vs. predicted values (Figure 11) indicated homoskedasticity, since the variance did not
show an increasing or decreasing pattern. Additionally, no multicollinearity among independent
variables was found, since the VIF values for none of the variables were greater than 2.
Results of GLM with inpatient and ED visit sample are reported in Table 16 and 17. Impact of
asthma on total costs, controlling for key variables wasn’t significant in either of the samples (p-
value = 0.112 and 0.167).
Figure 11: Scatter plot depicting Homoskedasticity
a) Inpatient sample regression

65
b) ED visit sample regression

66
Table 16: Impact of Asthma on Total Costs, controlling for key variables – using Inpatient
Sample
(n = 1719; 2006 and 2007 data combined)
Parameter β estimate Exp (β) p-value Intercept 10.253 - < 0.001 No Asthma (vs. Asthma) - 0.096 0.908 0.112 Male (vs. Female) -0.052 0.949 0.233 Age 0.001 1.001 0.353 Primary Payer Medicare (vs. Other) 0.019 1.019 0.878 Primary Payer Medicaid (vs. Other) 0.027 1.027 0.790 Primary Payer Private Insurance (vs. Other) 0.041 1.042 0.666 Primary Payer Self-pay (vs. Other) -0.007 0.993 0.949 Primary Payer No-charge (vs. Other) 0.056 1.058 0.869 Race White (vs. Other) -0.071 0.931 0.366 Race African American (vs. Other) 0.003 1.003 0.969 Race Hispanic (vs. Other) -0.019 0.981 0.826 Race Asian (vs. Other) 0.054 1.055 0.707 Race Native American (vs. Other) 0.282 1.326 0.150 APR DRG Severity of illness Minor (vs. Extreme) -2.179 0.113 < 0.001 APR DRG Severity of illness Moderate (vs. Extreme) -1.720 0.179 < 0.001 APR DRG Severity of illness Major (vs. Extreme) -0.906 0.404 < 0.001 Hospital bed size Small (vs. Large) -0.077 0.926 0.189 Hospital bed size Medium (vs. Large) -0.116 0.890 0.018 Rural hospital (vs. Urban) -0.152 0.859 0.471 Non-teaching hospital (vs. Teaching) -0.037 0.964 0.012
GLM with gamma distribution and log link Degrees of freedom = 20; Omnibus test – likelihood ratio chi-square = 1056 (p<0.001)
Table 17: Impact of Asthma on Total Costs, controlling for key variables – using ED Sample
(n = 35,693; 2006 and 2007 data combined)
Parameter β estimate Exp (β) p-value Intercept 5.789 - < 0.001 No Asthma (vs. Asthma) 0.065 1.067 0.167 Male (vs. Female) 0.046 1.047 < 0.001 Age 0.008 1.008 < 0.001

67
Primary Payer Medicare (vs. Other) -0.138 0.871 < 0.001 Primary Payer Medicaid (vs. Other) -0.068 0.934 0.012 Primary Payer Private Insurance (vs. Other) -0.032 0.969 0.221 Primary Payer Self-pay (vs. Other) -0.001 0.999 0.973 Primary Payer No-charge (vs. Other) 0.065 1.067 0.159 Charlson Co-morbidity Index 0.244 1.276 < 0.001 Hospital Metropolitan non-teaching (vs. Non-metropolitan) 0.247 1.280 < 0.001
Hospital Metropolitan teaching (vs. Non-metropolitan) 0.269 1.309 < 0.001
GLM with gamma distribution and log link Degrees of freedom = 14; Omnibus test – likelihood ratio chi-square = 3892 (p<0.001)
Matched analysis
Matching on eight variables led to a loss of around 400 cases from the inpatient sample and
resulted in 733 food allergic patients and 1466 hospitalized non-allergic patients (Table 18). The
total costs incurred by hospitalized food allergic patients were one-half the costs by similar
patients without food allergy ($5451 vs. $10,020). A non-parametric Kruskal-Wallis test
confirmed these costs to be significantly different.
Around one-third patients were lost due to the exact matching technique. On further analyzing
the lost inpatients, the mean costs were found to be lower than that of the included patients. This
suggested that with the entire inpatient cohort, the difference between the two groups would have
been even larger.
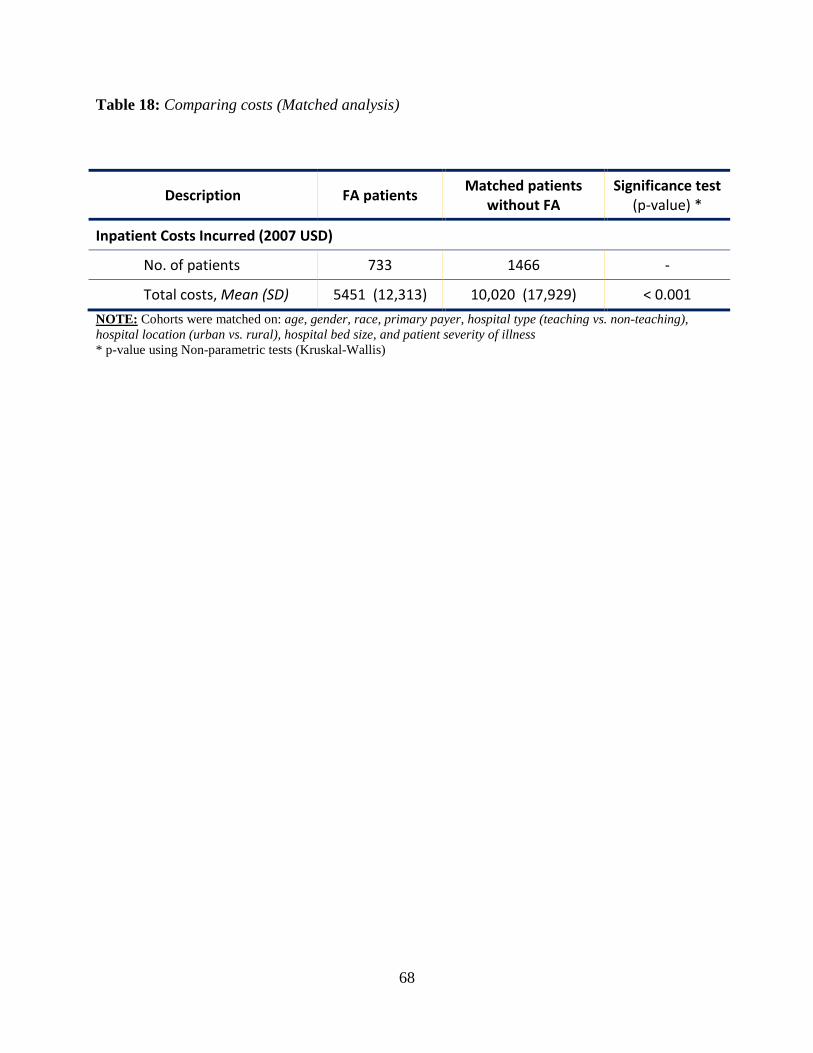
68
Table 18: Comparing costs (Matched analysis)
Description FA patients Matched patients without FA
Significance test (p-value) *
Inpatient Costs Incurred (2007 USD)
No. of patients 733 1466 -
Total costs, Mean (SD) 5451 (12,313) 10,020 (17,929) < 0.001 NOTE: Cohorts were matched on: age, gender, race, primary payer, hospital type (teaching vs. non-teaching), hospital location (urban vs. rural), hospital bed size, and patient severity of illness * p-value using Non-parametric tests (Kruskal-Wallis)

69
Discussion
This is the first study estimating the economic burden of food allergy and anaphylaxis. The
findings reveal that for a given year (2007), direct medical costs worth $225 million and indirect
costs worth $115 million were incurred in the U.S. from a societal perspective. Owing to the
irregularities in the reporting and diagnosis of food allergy, these values might very well be an
underestimation. Simulations from probabilistic sensitivity analysis generated mean direct
medical costs of $307 million and indirect costs of $203 million, and these should be considered
as more robust estimates.
The study used combined data for 2006 and 2007, primarily to increase the sample size for
outpatient and office-visit cohorts. In spite of that, the sample sizes for each were less than 30,
which might put doubts on the reliability of its estimates. Nevertheless, the study tried to control
for these inaccuracies in the sensitivity analysis. Due to restricted resources, the study had to use
the only freely available data for ambulatory visits. Future funded research should consider using
the more expensive private data to generate larger sample sizes.
A significant proportion of the population (60%) was children, and it was also reflected in the
total cost estimates where they accounted for a similar proportion. The mortality rates in food
allergy were very low, 0.3% in inpatients and 0.006% in ED sample. These numbers compare
well with the published literature. 4,11 About 20% of food allergic patients had asthma, which is
greater than the numbers reported by Ozol et al. 116 However, clinically, food allergy and asthma
are both atopic diseases, and hence, there are high chances that they may coexist.

70
This research used a complicated subject selection process to ensure that all primary and
appropriate non-primary diagnosed patients were included. On further analysis, it was revealed
that about 84% of inpatients and 94% of ER patients had primary diagnoses of food allergy. This
increased the confidence in the results and indicated that the majority of the costs were incurred
from the reliable primary diagnosed patients. The mean costs differed significantly between the
primary and non-primary diagnosed patients, $4056 vs. $8028 for inpatients and $549 vs. $612
for ER visit patients.
More than 50% of the total costs came from office based physician visits, primarily due to a huge
national estimate for the number of office visits. These values are based on a sample size less
than 30, and hence, should be interpreted with caution. It was anticipated that ED visits would
account for the largest sample proportion, but the data revealed otherwise. Nevertheless, the
large number of office based visits can be originating from the regular check-ups of allergic
patients, especially to renew their prescriptions for epinephrine device.
Since this was the first investigation focusing on the economic burden of food allergy, it was not
possible to establish reliability of the results by comparing it with other published studies. The
matched analysis allowed comparing inpatient costs from food allergic patients with similar
patients (matched on eight variables) without food allergic reactions. The results revealed that
the former incurred one-half the costs compared to the latter. This is a huge difference, and
indicates that per event medical costs from food allergic reactions are much less compared to
other disease conditions.

71
Additionally, the economic burden of FAA was compared with other similar allergic diseases
(Table 19) to better understand the impact of this condition from a societal perspective. Total
direct and indirect costs from FAA were much lower compared to allergic rhinitis or asthma.
This could be due to differences in prevalence rates, and to account for it, mean cost per visit
were compared. For asthma, mean costs per ED visit (converted to 2007 USD value) were $345
117,118, which is lower than $553 for FAA. For hospitalization it was $4570 117,118, which is
similar to $4719 for FAA. For allergic rhinitis, mean ambulatory costs were $743 75 (adjusted to
2007 USD values), which is significantly higher than $280 for OPD visits from FAA. This
discrepancy could be due to the difference in calculation methods, because for rhinitis the mean
costs were per patient per year, which might include multiple visits, whereas, for FAA it was
mean costs per visit.
Table 19: Comparing economic burden of FAA with selected diseases
Disease Direct costs
(Billion $)
Indirect costs
(Billion $)
Mean Costs per visit (inflated to
2007 values) Year Study
Current Study - Food Allergy and Anaphylaxis
0.23 0.13 Ambulatory = $280
ER visit = $553 Inpatients = $4719
2007 Current Study
Allergic rhinitis 1.2 - Ambulatory = $743
1994 Malone et al. 119
Allergic rhinitis - 7.7 1996/97 Kessler et al. 120
Asthma 7.4 5.3 ER visit = $345 Inpatients = $4570
1998 Weiss et al. 117
Asthma 5.7 - 1996 Druss et al. 121
Influenza 10.4 16.3
Ambulatory = $457 to $1045
Inpatients = $952 to $2263
2003 Molinari et al. 122

72
It is important to estimate indirect costs, especially in a societal perspective, to get a
comprehensive understanding of the economic burden due to the disease condition. For FAA,
indirect costs account for one-third of the total economic burden. The results emphasize that the
inclusion of patient and caregiver time losses is an important component when evaluating the
overall patient costs, and exclusion of these costs would underestimate the true burden.
Economic burden of disease conditions are often computed using costs and prevalence estimates
obtained from a variety of sources, originating from different countries or time periods, which
may introduce inaccuracies in the final estimates. To compound the problem, there have been
several studies that have highlighted severe irregularities in diagnosis and coding of FAA. For
instance, a study by Clark et al. indicated almost half the patients with food allergy would have
been missed by using food specific ICD-9 CM codes alone. 112
To account for such inaccuracies in the data and avoid severe under-estimation of economic
burden, it was essential to conduct a thorough sensitivity analysis. In spite of the importance of
such analysis, very few ‘cost of illness’ studies conduct it. This may be due to the complexities
involved.
Nationwide estimates of office-based physician visits accounted for over 80% of the total FAA
visits. Additionally, the range used for office-visit prevalence estimate was very large, and that
would explain it being the most sensitive variable for the direct and indirect costs. For indirect
costs, another sensitive variable was the number of deaths from FAA. The reason for its
sensitivity was the large amount of costs associated with every additional death. On an average,

73
the indirect costs incurred from the death of an adult working individual would be close to a
million dollar. These estimates are the present value of future productivity lost, using earnings
estimates and household services provided.
Results of one-way sensitivity analysis by itself are not very useful for reporting purposes. Some
argue that one-way analysis could substantially underestimate the uncertainty in cost of illness
estimates. 47 Hence, results of such analyses are primarily used to determine the most sensitive
variables, and further use them in two-way or Probabilistic Sensitivity Analysis (PSA).
PSA is considered to be the most thorough form of sensitivity analysis, because it generates
estimates by varying all variables simultaneously a large number of times. The mean direct costs
after 10,000 simulations were $307 million, which was a 36% increase from the baseline value
of $225 million. For indirect costs, the PSA mean estimate was $203 million, which was a 76%
increase from the baseline value of $115 million. These large differences between PSA and
baseline estimates were primarily due to the wide ranges around prevalence estimates, and may
indicate that the baseline values are not very robust. The ranges were obtained from published
literature and were largely driven by results from Clark et al. 112, which reported about 50% of
food allergy patients would be missed if ICD-9 codes alone were used for subject selection.
Regression models were conducted to test the hypothesis whether asthmatic food allergic
individuals incurred greater healthcare costs (implying worst allergic reactions) compared to
non-asthmatic patients. Contrary to the published literature, results from this database analysis

74
failed to indicate a significant relationship between presence of asthma and severity of outcomes
(or healthcare costs incurred).
Practical implications
The ‘Significance’ section in Chapter 1 explained the importance of cost of illness studies to
emphasize the economic impact of FAA and assist decision makers in setting funding priorities.
The results suggested that the economic burden is less than a billion dollar, which is much
smaller compared to other disease conditions, either allergic or non-allergic. Consequently,
policy makers can use this information in determining which conditions deserve more (or less)
attention and funding.
The other significance was that cost of illness studies provide useful cost estimates for health
economics evaluations, especially Cost Effectiveness Analysis. Practically, this goal was
accomplished, because the study broke down the direct and indirect costs into different
components that can be used for future cost studies related to food allergy.
The key economic principle governing a cost of illness study is that the results tell us how much
the society is spending on a particular disease and by implication the amount that would be saved
if the disease were abolished. 36 However, it is not plausible to abolish food allergy, especially
when the physiological causes are still uncertain. Nevertheless, by identifying the different
components of cost and the size of the contribution of each sector in society, at least it can help
to highlight areas where inefficiencies may exist and savings be made. 36 For instance, severe
allergic reactions, extended hospitalizations and even deaths can be avoided by spreading

75
awareness amongst food allergic patients to constantly carry their epinephrine device and use it
immediately after a reaction. Hence, practically the results can be used to target certain
components of the economic burden which can be avoided by proactive measures such as
spreading awareness. Additionally, although treatment costs may be high, the costs of prevention
could easily be much greater, and it should be factored into the consideration prior to any
decision making.

76
CHAPTER 4
ESTIMATING THE HRQL BURDEN OF
FOOD ALLERGY & ANAPHYLAXIS
Methods
Study design
This was a cross-sectional HRQL study with an aim to measure health utilities in food allergic
adults and children, and quality of life in food allergic adults using EQ-5D and FAQL-AF
questionnaires respectively. These questionnaires were administered in an online survey format,
which is believed to be a simple, fast, and inexpensive mode to reach potential participants.
Increasing segments of population have access to computers/internet, especially the young and
middle-aged people, whom we anticipated would constitute the majority of our study population.
Study questionnaires were short in length, easy to self-administer, and would not take more than
15 minutes to complete. Participants were asked to provide an online informed consent prior to
starting the survey, and no personally identifiable information was collected. Food allergic
patients were recruited from ‘Richmond Allergy and Asthma Specialists’ clinic, and internet
food allergy groups, using voluntary response sampling technique.
In addition to the quality of life questions, the survey also recorded patient information such as
age, gender, race, co-morbidities, number and type of food allergies, severity of allergy, and use
of epinephrine self-injected devices. Survey responses were collected for around eight months,

77
starting October 2009. The protocol for this study was reviewed and approved by the Virginia
Commonwealth University Institutional Review Board (IRB).
The study measured HRQL only at baseline, since there was no intervention (or treatment)
involved in the study to measure pre and post HRQL. Administering disease specific
questionnaires only at baseline is a common practice, especially in food allergy, since it allows
getting an insight into the impact of this condition on patients’ daily life. On the contrary, health
utilities are commonly measured before and after an intervention (or treatment). However, there
have been studies 123,124 that measured utilities at baseline, and used a regression to explore the
determinants of utility and develop an additive model to generate the utilities for different patient
and disease related factors. These values can later be used as baseline utilities in cost
effectiveness evaluations.
Patient recruitment
The study recruited any food allergic patients that visited Richmond Allergy and Asthma
Specialists clinic, a private physicians’ facility based in Richmond VA, and volunteered to
participate in the survey. Research flyers were placed at the facility, and nurses / physicians
informed the patients about the study. In addition, research announcements were posted on
internet food allergy groups and blogs.
For volunteering adults (>18 years of age), the internet-survey was self-administered. For
volunteering children (<18 years), parents/guardians acted as proxy, provided the informed
consent, and completed the survey on their child’s behalf. Participants of any age, gender, and

78
ethnicity were recruited for measuring health utilities. For measuring quality of life, FAQL-AF
questionnaire were administered to only food allergic adults (> 18 years), since this questionnaire
was prepared and validated for adults only. Participants who did not understand English
language were excluded from the study because the survey was self-administered and in English
language.
Data collection
Research flyers and announcements displayed an easy to remember website link. Volunteering
patients were asked to visit the specified website and click on the link to the online survey
questionnaires. There were separate survey links for food allergic adults and parents acting as
proxy for their allergic child. The online survey was prepared using VCU School of Pharmacy
license for ‘Qualtrics’ internet-survey service provider. Qualtrics is a paid service provider, and
ensures safety of data transfer over the internet via Secure-HTTP encryption. Prior to starting the
survey, the patients had to give an informed consent by selecting ‘ACCEPT’ on the online
consent form. For subjects less than 18 years of age, their parent or guardian acted as proxy,
provided the online consent, and completed the survey. Survey responses were stored in a
password-protected database, and all collected information was de-identified upfront by
collecting anonymous survey response.
Patient responses to the EQ-5D survey were recorded as the 5-digit EQ-5D health states, which
were converted into a single summary index (Health Utility score, ranging from 0 to 1) by
applying a scoring algorithm that produces U.S. specific health states preference indices. This
algorithm is based on the value set derived for EQ-5D in the U.S. by the Agency for Healthcare

79
Research and Quality (AHRQ), using the time trade-off (TTO) valuation technique. 125 This
value set was developed in 2002 using a representative sample of the U.S. general population,
thereby ensuring that they represent the community preferences.
The scoring for FAQL-AF was relatively easy, wherein item responses were recorded as 1-7.
The total FAQL-AF item response was the mean score of all items with a range of 1 ‘no
impairment’ to 7 ‘maximal impairment’.
Data analysis
An appropriate survey sample size was required for accurate determination of significant
differences in the Health Utilities and FAQL-AF scores within the food allergic patients. Sample
sizes were determined using Appendix 6A from Hulley et al. 126 Table 20 lists the details used to
calculate the sample sizes. Standard deviations used were anticipated to match well with the
study questionnaires. For health utility measurements, Minimally Important Difference (MID) in
EQ-5D scores, was used as the ‘difference in population means’ that we intend to test (expected
effect size). For FAQL-AF questionnaires, expected effect size was a commonly preferred MID
for a 7-point scale questionnaire.
Table 20: Sample size calculation for HRQL surveys
Standard deviation (σ) Expected effect size (δ) Sample size Type I error, one-sided (α) = 0.05; Power = 80%
For FAQL-AF 1.0 0.5 (Reference = 64 ) 50 2.0 0.5 199 For Health Utilities 0.1 0.074 (Reference = 63 ) 23 0.2 0.074 91

80
Generalized Linear Models, were specified to explore the deviations in health utility and FAQL-
AF scores between patients with different demographic and disease related characteristics. It was
decided to use gamma distribution for the scores 108 and an identify link function to facilitate the
interpretation of the coefficients. Generally, beta distribution is used for health utility scores
since it allows for negative and zero values. Due to software limitations, gamma distribution was
used, which was justified because the collected data does not have any zero or negative utility
values, and in the absence of such values, gamma and beta distribution are very similar. Table 21
lists all variables used in the regression model. A 5% risk of type I error was employed as the
level of statistical significance for the study. All analyses were performed using SAS v.9.2 and
PASW (formerly called as SPSS) v.17.
Variables were included in the model based on their perceived significance in the prediction,
rather than just the significance testing (using p-values). Age, gender, race are commonly
included covariates, and were considered reasonable proxies for a person’s need for healthcare
services. 109 Asthma, number of food allergies, years with food allergy, carrying epinephrine
device, and severity of past reaction were included as predictor variables based on the available
literature. In absence of ‘APR DRG Severity of Illness’ or ‘Charlson Co-morbidity Index’
variables, ‘number of co-morbidities’ was used to control for the patients severity of illness.
Different models, with inclusion and exclusion of interaction variables (age x asthma, number of
FAs x carrying epinephrine device), were compared based on the likelihood ratios and Akaike’s
Information Criterion (AIC). Model with the best fit was analyzed for the final results.
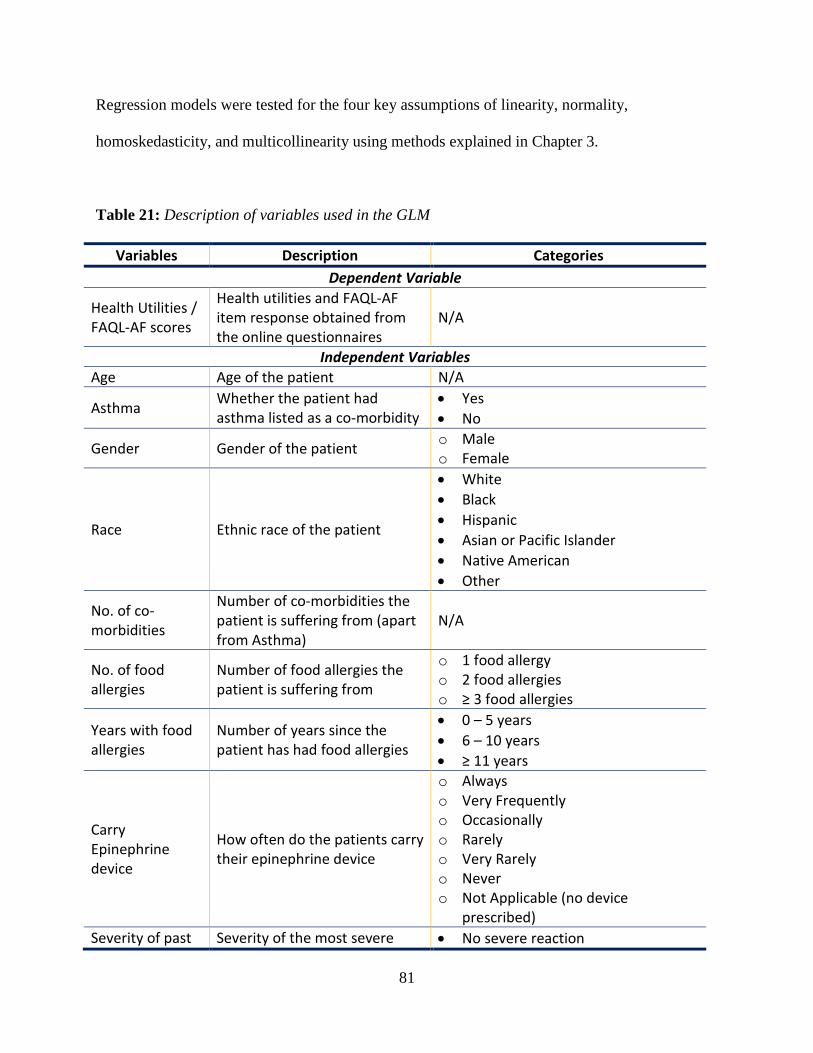
81
Regression models were tested for the four key assumptions of linearity, normality,
homoskedasticity, and multicollinearity using methods explained in Chapter 3.
Table 21: Description of variables used in the GLM
Variables Description Categories Dependent Variable
Health Utilities / FAQL-AF scores
Health utilities and FAQL-AF item response obtained from the online questionnaires
N/A
Independent Variables Age Age of the patient N/A
Asthma Whether the patient had asthma listed as a co-morbidity
• Yes • No
Gender Gender of the patient o Male o Female
Race Ethnic race of the patient
• White • Black • Hispanic • Asian or Pacific Islander • Native American • Other
No. of co-morbidities
Number of co-morbidities the patient is suffering from (apart from Asthma)
N/A
No. of food allergies
Number of food allergies the patient is suffering from
o 1 food allergy o 2 food allergies o ≥ 3 food allergies
Years with food allergies
Number of years since the patient has had food allergies
• 0 – 5 years • 6 – 10 years • ≥ 11 years
Carry Epinephrine device
How often do the patients carry their epinephrine device
o Always o Very Frequently o Occasionally o Rarely o Very Rarely o Never o Not Applicable (no device
prescribed) Severity of past Severity of the most severe • No severe reaction
82
reaction reaction in the past (using Mueller scale classification – explained in CH.2 – FAA Overview)
• Category I • Category II • Category III • Category IV
Health utilities were collected using a normal EQ-5D version for adults, and proxy version for
children. It can be argued that the utilities generated would be significantly different between the
two versions due to a proxy effect, wherein parents (proxies) may over or underestimate the
HRQL of their child. Hence, a non-parametric Mann-Whitney / Kruskal-Walis test was
performed to check whether the utilities differed significantly. In case of a significant difference,
the two datasets would be analyzed and interpreted separately.
Effect size was determined by comparing FAA adult patient health utilities with the general U.S.
population, which was used as a reference group. It was computed by taking a difference in the
mean of health utilities between the two groups, and dividing it by the standard deviation of the
reference group. Health utilities for the U.S. general population will be obtained from the value
set derived for EQ-5D by AHRQ in 2002. 125 Based on Cohen’s criteria, an effect size of 0.2 or
less will be designated as small, 0.5 as medium and 0.8 or greater as large. 127 A small effect size
represents a change of at least one-fifth of a standard deviation of the baseline measure. It must
be noted that Cohen’s criteria for interpreting effect sizes are not based on any theoretically or
statistically derived principles. Rather, they represent an intuitive estimate and have become the
accepted benchmarks. 128

83
Missing value analysis
For the adult questionnaires, there were missing values for three records in the FAQL-AF section
but complete responses for the EQ-5D questions. Hence, these records were included for EQ-5D
analysis but excluded for FAQL-AF analysis. For the children questionnaires, one record had
missing values on all questions and was excluded. Completion rates for the questionnaires were
over 90%, and hence, no additional steps were taken to increase completion rates.
Limitations
• Voluntary response sampling technique may introduce a voluntary response bias,
wherein, resulting sample over-represents patients / parents with strong opinions that
drives them to volunteer.
• Due to voluntary response sampling technique and the inability to track whether a patient
response originated from the Richmond Allergy clinic or online sources, the study may
end up with a disproportionate sample of respondents.
• Health utilities for children were measured using EQ-5D proxy version. Proxy responses
have certain inherent drawbacks, most important being proxies tend to overestimate
patient disability relative to the patients themselves, especially with regard to capacity to
perform instrumental activities of daily living. 129 Hence, proxy responses were analyzed
separately from adult responses.
• FAQL-AF questionnaire has been validated only in the Dutch population until now; its
validation in the U.S. is ongoing.
• EQ-5D has been reported to have a ceiling effect, which restricts its sensitivity in
capturing health utilities for relatively healthy patients. 130

84
EQ-5D has been validated as a paper based questionnaire, and not as an online format. However,
based on the results of a report by Stolk E et al 131, the study assumed no significant differences
between the two questionnaire formats.

85
Results
Patient characteristics
Survey responses were collected online for eight months (Oct ‘09 till May ‘10), during which 45
adults and 94 parents (acting as proxy for their food allergic child) responded. The response
numbers are close to the sample sizes calculated earlier (Table 20.) Demographic characteristics
of food allergy patients are presented in Table 22. The majority of the adult responders were
female, whereas the proportions were almost equal for children. Around 80% of the subjects
were Caucasian and had a mean age of 6 for children and 37 for adults.
Table 22: Patient participation
Questionnaires Children Adults FAQL-AF
Responded N/A 45 Excluded N/A 3 Analyzed N/A 42
EQ-5D Responded 94 45 Excluded 1 0 Analyzed 93 45
Table 23: Demographic characteristics of Food Allergic participants
Characteristics Children Adults Patients, n 93 45 Gender, male / female 50 / 42 6 / 39 Race, n (%) o White 77 (83) 36 (80) o African-American 2 (2) 2 (5) o Asian / Pacific Islander 3 (3) 3 (7) o Hispanic 1 (1) - o Other 8 (9) 2 (5)

86
Age, mean (SD), years 5.7 (3.4) 37 (10.7) Age range, years 1 – 16 18 – 60
Clinical characteristics of the study subjects are described in Table 24. Among the children,
three-quarters had peanut allergy and about 50% were allergic to nuts, milk and/or eggs.
Whereas among the adults, shellfish allergy was the most common, and a quarter were allergic to
peanuts, nuts, and/or milk. Around 50% of the participants were diagnosed with asthma.
Table 24: Clinical characteristics of food allergic participants
Characteristics Children Adults Time since food allergies were first diagnosed, mean (SD), years 4.3 (3.3) 14.6 (13.5)
Type of food allergies, n (%) o Peanuts 70 (75.3) 9 (20) o Nuts 51 (55) 12 (26.6) o Milk 42 (45) 12 (26.6) o Eggs 48 (51.6) 6 (13.3) o Wheat 16 (17) 10 (22) o Soy 26 (28) 7 (15.5) o Sesame 15 (16) 3 (7) o Fish 13 (14) 8 (17.7) o Shellfish 14 (15.1) 17 (37.7) o Celery 4 (4.3) 1 (2.3) o Fruit 12 (13) 13 (29) o Vegetables 7 (7.5) 10 (22.2) o Others 22 (23.7) 25 (55.5)
Number of food allergies, n (%) o 1 food 14 (15) 11 (24.4) o 2 foods 21 (22.6) 13 (29) o ≥ 3 foods 57 (61.3) 20 (44.4)
How often they carry epinephrine device, n (%) o Always 72 (77.4) 14 (31) o Very frequently 7 (7.5) 2 (4.4) o Occasionally 3 (3) 2 (4.4)
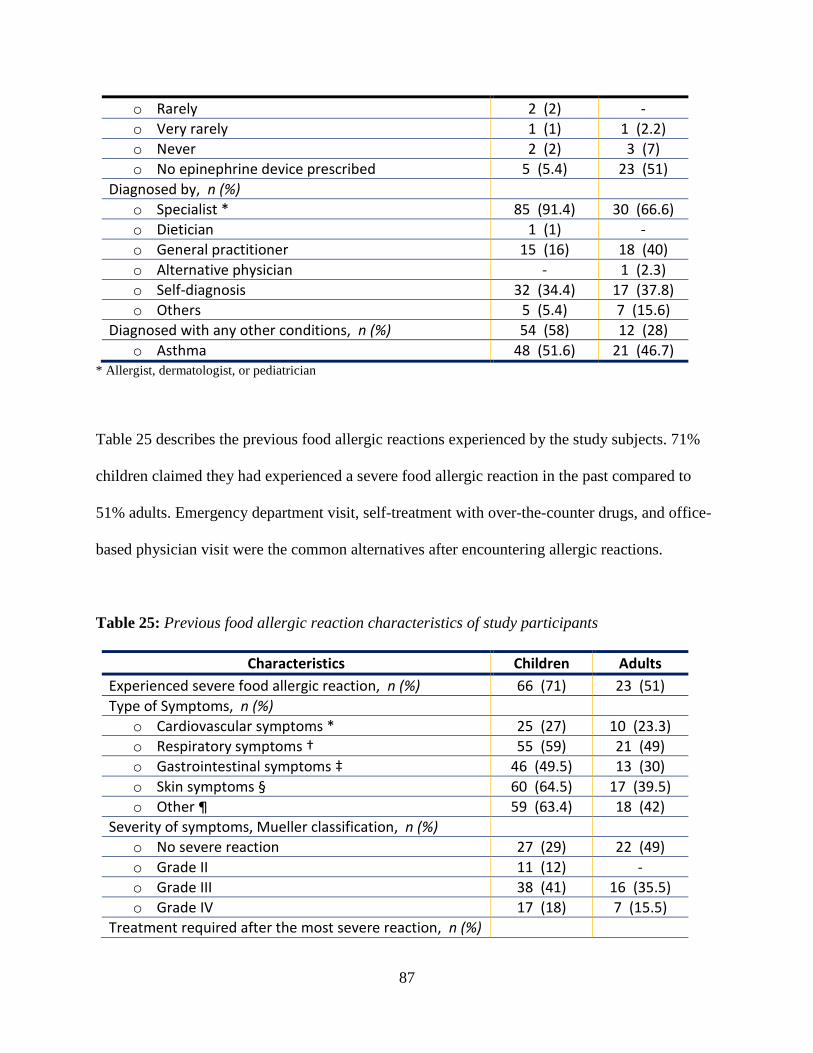
87
o Rarely 2 (2) - o Very rarely 1 (1) 1 (2.2) o Never 2 (2) 3 (7) o No epinephrine device prescribed 5 (5.4) 23 (51)
Diagnosed by, n (%) o Specialist * 85 (91.4) 30 (66.6) o Dietician 1 (1) - o General practitioner 15 (16) 18 (40) o Alternative physician - 1 (2.3) o Self-diagnosis 32 (34.4) 17 (37.8) o Others 5 (5.4) 7 (15.6)
Diagnosed with any other conditions, n (%) 54 (58) 12 (28) o Asthma 48 (51.6) 21 (46.7)
* Allergist, dermatologist, or pediatrician
Table 25 describes the previous food allergic reactions experienced by the study subjects. 71%
children claimed they had experienced a severe food allergic reaction in the past compared to
51% adults. Emergency department visit, self-treatment with over-the-counter drugs, and office-
based physician visit were the common alternatives after encountering allergic reactions.
Table 25: Previous food allergic reaction characteristics of study participants
Characteristics Children Adults Experienced severe food allergic reaction, n (%) 66 (71) 23 (51) Type of Symptoms, n (%)
o Cardiovascular symptoms * 25 (27) 10 (23.3) o Respiratory symptoms † 55 (59) 21 (49) o Gastrointestinal symptoms ‡ 46 (49.5) 13 (30) o Skin symptoms § 60 (64.5) 17 (39.5) o Other ¶ 59 (63.4) 18 (42)
Severity of symptoms, Mueller classification, n (%) o No severe reaction 27 (29) 22 (49) o Grade II 11 (12) - o Grade III 38 (41) 16 (35.5) o Grade IV 17 (18) 7 (15.5)
Treatment required after the most severe reaction, n (%)

88
o ED visit 37 (40) 9 (20) o Hospital OPD visit 1 (1.1) - o Office-based physician visit 17 (18.3) 6 (13.3) o Admitted to a hospital 3 (3.2) - o Self-treated 22 (23.7) 11 (24.4) o No treatment required 1 (1.1) - o No severe reaction 27 (29) 22 (49)
* Dizziness, palpitations, loss of vision, inability to stand, light headedness, collapse, loss of consciousness † Tightening throat, difficulty swallowing, hoarse voice, difficulty breathing, shortness of breath, wheezing, cough ‡ Nausea, stomach cramps, vomiting, diarrhea § Itchy skin, red rash, urticaria, worsening eczema, swelling of the skin ¶ Oral allergy, swollen tongue or lips, symptoms of the nose or eyes
FAQL-AF questionnaire responses
On a scale of 1 (no impairment) to 7 (maximal impairment), the mean FAQL-AF score was 4.7
(Table 26). The questions were grouped into four sections based on their constructs. The mean
scores for AADR, EI and RAE sections were significantly higher than the FAH section
(Friedman test for k-related samples; p-value = 0.002). The maximum impairment was caused by
the item ‘incomplete labels’, and minimum by ‘unclear about foods you are allergic’.
Table 26: FAQL-AF item responses (only for adults)
Questionnaire items
Individual responses, n (%) Mean
score (SD) Not,
Barely Slightly,
Moderately, Quite
Very, Extremely
Total FAQL-AF score N/A N/A N/A 4.7 (1.6) Allergen Avoidance and Dietary Restrictions (AADR) N/A N/A N/A 4.73 (1.8)
Eating out less often 4 (9.5) 17 (40.5) 21 (50) 4.0 (2.1) Limited as to products you can buy 7 (16.6) 17 (40.5) 18 (43) 4.3 (2.1) Check personally whether you can eat something when out 10 (24) 16 (38) 16 (38) 5.1 (2.0) Able to eat fewer products 9 (21.4) 13 (31) 20 (47.6) 4.6 (1.9) Less able to taste or try various products when eating out 10 (24) 12 (28.5) 20 (47.6) 4.7 (2.1) Having to read labels 12 (28.5) 12 (28.5) 18 (43) 4.6 (2.2)

89
Always be alert as to what you are eating 10 (24) 9 (21.4) 23 (54.6) 4.9 (1.8) Hesitate eating a product when you have doubts about it 11 (26) 18 (43) 13 (31) 5.1 (2.1) Refuse many things during social activities 7 (16.6) 10 (24) 25 (59.5) 4.6 (2.2) Less able to accept spontaneously an invitation to stay for a meal 7 (16.6) 10 (24) 25 (59.5) 4.3 (2.2)
Having to explain to those around you that you have a food allergy 8 (19) 12 (28.5) 22 (52.3) 4.8 (2.1)
Emotional Impact (EI) N/A N/A N/A 4.6 (1.6) Frightened of accidentally eating the wrong food 10 (24) 12 (28.5) 20 (47.6) 4.5 (2.0) Frightened of allergic reaction 9 (21.4) 20 (47.6) 13 (31) 4.2 (2.0) Frightened of an allergic reaction when eating out despite the fact that your dietary restrictions have been discussed beforehand
7 (16.6) 19 (45.2) 16 (38) 4.2 (2.1)
Apprehensive about eating something you have never eaten before 12 (28.5) 14 (33.4) 16 (38) 5.0 (1.9)
Feel discouraged during an allergic reaction 9 (21.4) 17 (40.5) 16 (38) 5.0 (1.6) Have the feeling that you have less control of what you eat when eating out 3 (7.2) 19 (45.2) 20 (47.6) 4.7 (2.1)
Feel you are being a nuisance because you have a food allergy when eating out 4 (9.5) 17 (40.5) 21 (50) 4.5 (2.0)
Risk of Accidental Exposure (RAE) N/A N/A N/A 4.9 (1.7) Sometimes frustrate people when they are making an effort to accommodate your food allergy 11 (26) 14 (33.4) 17 (40.5) 4.5 (2.1)
People underestimate your problems caused by food allergy 5 (12) 14 (33.4) 23 (54.6) 5.4 (2.0) Change of ingredients of a product 6 (14.3) 7 (16.6) 29 5.1 (2.0) Labels are incomplete 11 (26) 13 (31) 18 (43) 5.6 (2.1) Ingredients are different in other countries (e.g. during vacation) 7 (16.6) 9 (21.4) 26 (62) 3.9 (2.4)
Label states: ‘May contain (traces of)…’ 19 (45.2) 7 (16.6) 16 (38.2) 5.2 (2.1) Troublesome for your host should you have an allergic reaction 6 (14.3) 8 (19) 28 (66.7) 4.6 (2.2)
The lettering on labels is too small 9 (21.4) 11 (26) 22 (52.3) 4.5 (2.2) Food Allergy Related Health (FAH) N/A N/A N/A 4.1 (1.6) Worried about your health 22 (52.3) 9 (21.4) 11 (26) 4.1 (1.9) Unclear to which foods you are allergic 10 (24) 19 (45.1) 13 (31) 3.2 (2.3) Worried that the allergic reactions to foods will become increasingly severe 7 (16.6) 18 (43) 17 (40.5) 4.7 (1.9)

90
EQ-5D responses
Tables 27 and 28 report the EQ-5D responses for children and adults. Mean adult health utility
was 0.874, which is significantly lower than 0.918 for children (Kruskal-Walis non-parametric
test; p-value = 0.03). Ceiling effect (perfect one score) was seen in over 60% of children and
over 40% adults. For children, primarily the problem persisted with anxiety / depression,
followed by usual activities, whereas, for adults it was primarily pain / discomfort, followed by
anxiety / depression.
Table 27: Proportions of EQ-5D levels by dimension
EQ-5D Dimensions Children Adults
Mobility No Problem 97.8 84.4
Problem 2.2 15.6
Self-Care No Problem 92.5 95.6 Problem 7.5 4.4
Usual Activities No Problem 84.9 75.6 Problem 15.1 24.4
Pain / Discomfort No Problem 86.0 60.0 Problem 14.0 40.0
Anxiety / Depression No Problem 77.4 66.7 Problem 22.6 33.3
No problem = EQ-5D Level 1 Problem = EQ-5D Levels 2 and 3
Table 28: Score distribution of Health Utility methods for children and adults
Health Utility Method Children Adults EQ-5D Mean (SD) 0.918 (0.133) 0.8744 (0.138) Median 1.0 0.844 25th percentile 0.843 0.799 75th percentile 1.0 1.0 Floor (%) 0.0 0.0

91
Ceiling (%) 63.4 44.4 EQ-Visual Analog Scale (VAS) Mean (SD) 84.77 (18.35) 74.1 (20.3) Median 91.0 81.0 25th percentile 81.0 50.0 75th percentile 96.0 91.0 Floor (%) 0.0 0.0 Ceiling (%) 14.0 2.2
Effect size
The mean (SD) health utilities for the reference group (general U.S. population) and food allergic
adults were estimated to be 0.8749 (0.166) and 0.8744 (0.138) respectively. Using these, the
effect size was computed as [(0.8749 – 0.8744) / 0.166] = 0.003.
Regression models
Generalized linear models with gamma distribution and identity link were performed for the EQ-
5D and FAQL-AF scores. For the adult EQ-5D scores 44 patient responses were included in the
regression, 80 for the EQ-5D children sample and 42 for the FAQL-AF score regression. The
selected models had the lowest Akaike’s Information Criterion (AIC) values compared to other
models with interaction variables.
Shapiro-Wilk tests for health utilities and FAQL-AF scores were statistically significant (p-value
< 0.01), which indicated non-normality with the data. Scatter plots of deviance residuals vs.
predicted values (Figure 12) indicated homoskedasticity, since the variance did not show an
increasing or decreasing pattern. Additionally, multicollinearity tests were negative for all three,
and VIF values for none of the variables were greater than 2.

92
Results of GLM are reported in Tables 29 and 30. In the adult health utilities model, only gender,
race, and number of food allergies had a significant impact on the health utility values. Patients
with only one food allergy had health utility values greater by 0.158 compared to patients with
three or more allergies, and utilities of males were greater by 0.177 compared to females, given
other things constant.
The children health utility model showed a very poor fit, with an insignificant likelihood ratio
chi-square test (p-value = 0.26). This implied the fitted model was not significantly different
from the intercept-only model. Various models with and without interaction variables were tried,
and they yielded similar insignificant likelihood ratio tests. Hence, results from this model were
not reported.
In the FAQL-AF model, gender, number of food allergies, and frequency of carrying epinephrine
device had a significant impact on the quality of life scores. Given other things constant, FAQL-
AF scores for patients with only one food allergy were lower by 1.96 compared to patients with
three or more allergies, and scores for males were lower by 2.43 compared to females.
Additionally, patients who always carried an epinephrine device had scores greater by 1.35
compared to similar individuals without a prescription for the device.
Figure 12: Scatter plots depicting Homoskedasticity
a) Using Adult EQ-5D scores

93
b) Using FAQL-AF scores
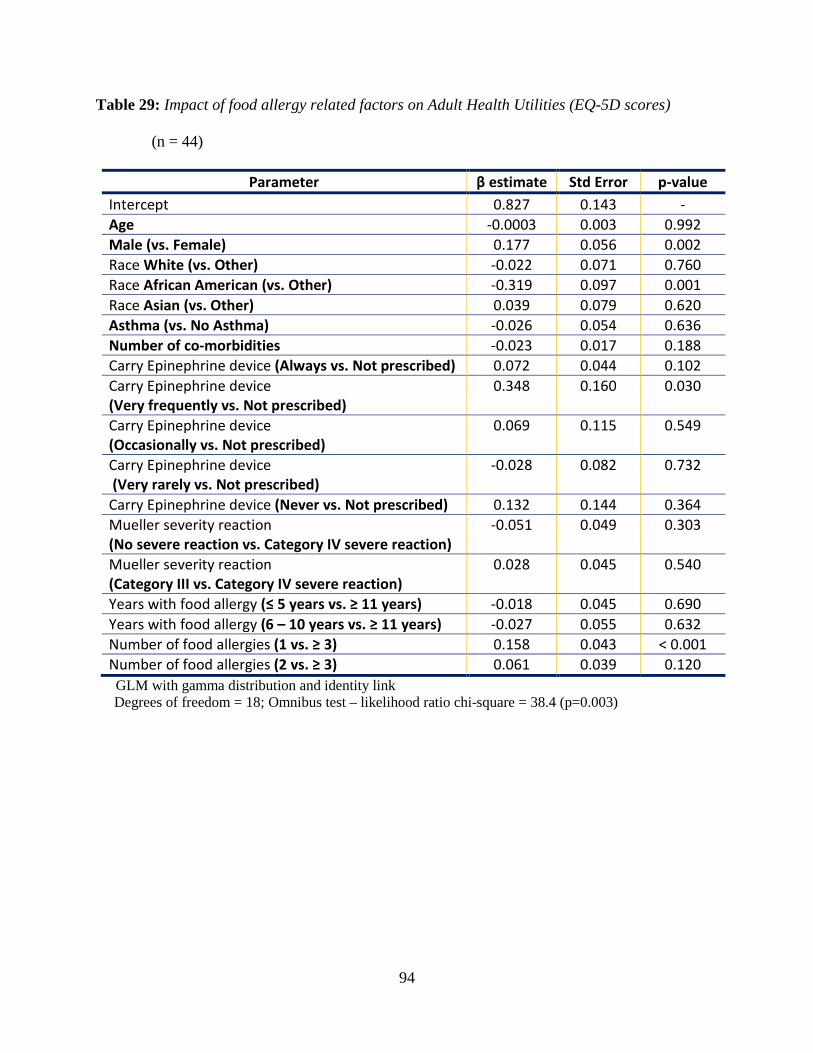
94
Table 29: Impact of food allergy related factors on Adult Health Utilities (EQ-5D scores)
(n = 44)
Parameter β estimate Std Error p-value Intercept 0.827 0.143 - Age -0.0003 0.003 0.992 Male (vs. Female) 0.177 0.056 0.002 Race White (vs. Other) -0.022 0.071 0.760 Race African American (vs. Other) -0.319 0.097 0.001 Race Asian (vs. Other) 0.039 0.079 0.620 Asthma (vs. No Asthma) -0.026 0.054 0.636 Number of co-morbidities -0.023 0.017 0.188 Carry Epinephrine device (Always vs. Not prescribed) 0.072 0.044 0.102 Carry Epinephrine device (Very frequently vs. Not prescribed)
0.348 0.160 0.030
Carry Epinephrine device (Occasionally vs. Not prescribed)
0.069 0.115 0.549
Carry Epinephrine device (Very rarely vs. Not prescribed)
-0.028 0.082 0.732
Carry Epinephrine device (Never vs. Not prescribed) 0.132 0.144 0.364 Mueller severity reaction (No severe reaction vs. Category IV severe reaction)
-0.051 0.049 0.303
Mueller severity reaction (Category III vs. Category IV severe reaction)
0.028 0.045 0.540
Years with food allergy (≤ 5 years vs. ≥ 11 years) -0.018 0.045 0.690 Years with food allergy (6 – 10 years vs. ≥ 11 years) -0.027 0.055 0.632 Number of food allergies (1 vs. ≥ 3) 0.158 0.043 < 0.001 Number of food allergies (2 vs. ≥ 3) 0.061 0.039 0.120
GLM with gamma distribution and identity link Degrees of freedom = 18; Omnibus test – likelihood ratio chi-square = 38.4 (p=0.003)

95
Table 30: Impact of food allergy related factors on FAQL-AF scores
(n = 42)
Parameter β estimate Std Error p-value Intercept 6.718 1.789 Age -0.047 0.036 0.200 Male (vs. Female) -2.429 0.636 < 0.001 Race White (vs. Other) -0.656 1.145 0.567 Race African American (vs. Other) -1.319 1.612 0.413 Race Asian (vs. Other) -1.693 1.586 0.286 Asthma (vs. No Asthma) 0.355 0.414 0.392 Number of co-morbidities 0.046 0.169 0.786 Carry Epinephrine device (Always vs. Not prescribed) 1.351 0.496 0.006 Carry Epinephrine device (Very frequently vs. Not prescribed)
0.725 1.189 0.542
Carry Epinephrine device (Occasionally vs. Not prescribed)
0.874 0.746 0.242
Carry Epinephrine device (Very rarely vs. Not prescribed)
-0.092 1.375 0.947
Carry Epinephrine device (Never vs. Not prescribed) -1.660 0.804 0.039 Mueller severity reaction (No severe reaction vs. Category IV severe reaction)
0.514 0.561 0.360
Mueller severity reaction (Category III vs. Category IV severe reaction)
0.041 0.503 0.935
Years with food allergy (≤ 5 years vs. ≥ 11 years) 0.444 0.616 0.471 Years with food allergy (6 – 10 years vs. ≥ 11 years) 0.589 0.545 0.280 Number of food allergies (1 vs. ≥ 3) -1.958 0.744 0.009 Number of food allergies (2 vs. ≥ 3) 0.299 0.701 0.670
GLM with gamma distribution and identity link Degrees of freedom = 18; Omnibus test – likelihood ratio chi-square = 39.8 (p=0.002)

96
Discussion
When one considers the significant time and effort that it takes to provide a safe environment for
children and adults with food allergy, logic dictates that food allergy would have a significant
impact on daily life. 6 Several studies have reported the impact of food allergy on children and
their families. This was the first study that determined a similar significant impact on various
domains of life amongst food allergic adults. Additionally, for the first time health utility values
were measured for food allergic adults and children using EQ-5D questionnaire. Adults reported
a mean utility of 0.874 compared to 0.918 for children measured using their parents as proxy.
The study also analyzed different factors that had an impact on the HRQL of food allergic
patients.
The study results provided an understanding of general and clinical characteristics of food
allergic patients. There are several triggers to food allergy, but the most common allergens as
identified from the data were peanuts, tree nuts, soybeans, milk, egg, and fish. This coincides
with the list of common allergens published by other studies. 22 Epinephrine auto-injector
devices can be life-saving for allergic patients, and physicians recommend their patients to carry
it at all times. During a reaction, an immediate administration of epinephrine significantly
reduces the severity of outcomes. About 95% of food allergic children had a prescription for an
epinephrine device, and 78% carried it at all times. On the contrary, only 50% adults had a
prescription and around 30% carried it at all times. This vast difference can be explained by a
greater anxiety and stress level amongst parents of food allergic children, which drives them to

97
ensure their children always carry the device. Additionally, most of the schools make it
mandatory for allergic children to carry their device to school at all times.
Disease specific quality of life was measured for food allergic adults using FAQL-AF. The
overall mean score was 4.7, with 7 being the maximal impairment. The utility of this
questionnaire is less from its overall mean score, and more from the individual items. The
content of the questionnaire reflects the most important issues that food allergic patients have to
deal with in their daily life and impairs their quality of life. Consequently, these issues are likely
to be important targets for interventions by healthcare providers, catering industries, food
manufacturers and governments aimed at improving quality of life in food allergic patients. 64
For example, the results suggest that issues such as ‘incomplete labels’ and ‘label statements:
‘May contain (traces of)…’’ cause the maximal impairment to the quality of life of patients. The
impact of such issues can be reduced if regulators take a tough stand and ensure that
manufacturers provide every detail about potential allergens on the product. Another major
concern for patients was ‘change of ingredients of a product’. This item indicates that food
allergic patients find it very frustrating when a product that was safe to eat, which in some cases
are very few, turned out to be unsafe. The impact of this item may be reduced to some extent if,
for example, manufacturers would place a warning on the product indicating changed
ingredients. A significant concern was also reported due to ‘people underestimating your
problems caused by food allergy,’ which is more relating to social awareness about food allergy.
The least impairment was reported for the issue of ‘being unclear about the foods a patient is
allergic to’. This could be a good sign suggesting that individuals are getting proper diagnoses

98
for suspected food allergies and is avoiding unnecessary impairment of quality of life. 64 Another
item which caused little impairment was ‘food ingredients are different in other countries (e.g.
during vacation).’ Not many people travel abroad often, and hence, this would not be a major
concern. For frequent travelers, one can imagine the impact of this issue, especially due to the
language barrier.
Health utilities were measured for children and adults using EQ-5D, which is a preference-based
generic HRQL tool. Mean health utilities and Visual Analog Scale (VAS) scores for children
were 0.918 and 84.7 compared to 0.874 and 74.1 for adults. A significant difference was found
between the scores, indicating that adults have a lower HRQL compared to children. A plausible
reason for this difference could be the co-morbidities among the adult sample, which might be
pulling down the utility values. One could argue that the difference was due to the proxy effect,
since, parents are answering the questionnaire on their child’s behalf. Usually the proxies
overestimate the patients’ disability 129, but in this case the higher utility values imply an
underestimation.
EQ-5D questionnaire consists of five health dimensions, and as anticipated, ‘anxiety /
depression’ had the highest impact on the HRQL, followed by ‘daily activities’. A very high
proportion of patients had a perfect score of 1 on EQ-5D health utilities. On the contrary, very
few had a perfect score on Visual Analog Scale (VAS). This re-emphasizes the drawback of
ceiling effect with EQ-5D and its inability to distinguish between patients with relatively good
HRQL. VAS scores do not have a ceiling effect, but they are not useful in health economic
evaluations to generate Quality Adjusted Life Years (QALYs). Additionally, adults with a

99
perfect one score on EQ-5D had a mean FAQL score of 3.98, compared to 5.2 for adults with
health utilities less than one. This difference was statistically significant (p-value = 0.012) and
indicates that in spite of ceiling effect the disease specific quality of life was different between
these adults.
The tariffs used in this study, to calculate utility scores, were generated by the AHRQ. 125 These
are referred to as social tariffs, because they are based on health state valuations in a general
population sample. It is debatable whether this is the most appropriate approach. 124 The
alternative would be to base the valuations on individuals who are actually in the health state
(i.e., food allergic patients) using direct measurement techniques such as standard gamble. Due
to restricted resources, this research could not employ the direct measurement technique. One
application of EQ-5D index values is for economic evaluations, and there is an indication in the
literature suggesting that the use of the social tariffs would result in overestimated gains in
QALYs compared with individual values 124,132 , which should be kept in mind when using the
results from the present study for cost-effectiveness analysis in future.
In addition to reporting baseline health utilities, this research also aimed at comparing health
utilities for food allergic patients with the general U.S. population using effect size estimation,
which was calculated to be 0.003. Using Cohen’s criteria 127, the effect size was interpreted to be
very small, and implies that the overall HRQL for food allergic patients is not very different
from the general population. However, it can be argued that EQ-5D is not the best instrument to
measure generic HRQL, since it has only five questions and bears a ceiling effect. Future
100
researchers should conduct similar effect size calculation with a more comprehensive generic
HRQL questionnaire, such as Short Form (SF)-36.
This research analyzed the impact of different clinical factors on the HRQL of food allergic
patients. This has been done in the past in few studies, 6,88 where they made direct comparisons
between the groups without controlling for covariates. This research used regression models,
which would be considered more reliable, especially in absence on randomized sampling.
Individuals with more than two food allergies had significantly lower HRQL scores. This finding
makes sense given the greater burden of reading labels and watching for additional food triggers
associated with more food allergies. 6 In contrast, the presence or absence of a prior anaphylactic
or severe allergic reaction was not related to perceived impact on the patient, suggesting that
what really matters is the patients’ perceptions of the food allergy and the consequences of
ingestion of contraindicated substances and the precautions they need to take to keep themselves
healthy regardless of the type of reaction they have experienced in the past. 6
Frequency of carrying epinephrine device had a significant impact on adults HRQL. Patients
who always carried their device had a significantly lower HRQL compared to patients who did
not even have a prescription for the device. This is rational considering that patients who always
carry their device have the worst food allergies and their constant anxiety leads to a lower
HRQL.

101
Adult food allergic females reported a lower HRQL compared to males. No U.S. studies have
analyzed the gender difference on food allergy related quality of life. A Swedish study reported
similar results and stated that in general, female gender among adults report a larger burden of
health problems. 87 Moreover, the gender-based difference could certainly be arising from the
huge difference in male and female proportions, i.e. about 85% females in the sample, and hence
should be interpreted with caution.
One of the variables in the model was ‘years spent with food allergies.’ It was anticipated that
individuals who had dealt with food allergy for many years would report less of an impact than
those with a more recent diagnosis who were still adjusting to the impact. 6 However, no
significant relationship was found between this variable and HRQL.
A major drawback with the regression analyses is the small sample size (<50) for adult
population. Interpretation of predictor variables based on such a small sample is not advisable.
133 Hence, the results should be used with caution, and should ideally serve as a good starting
point for future analyses with greater sample sizes.

102
CHAPTER 5
FUTURE RESEARCH AND CONCLUSIONS
Future Research
This research estimated the direct medical and indirect costs from FAA in the U.S. There is still
an important component of economic burden which was not considered, i.e. the direct non-
medical costs from FAA. These costs would typically be related to the life-style changes that the
patients have to make to avoid any allergic reactions, most importantly, the cost of special diets
and non-allergenic products and services. It is not possible to measure such costs from existing
databases due to lack of the required information. Hence, future research should consider
conducting primary data collection using focus group interviews and administering
questionnaires.
Another area under discussion with a great potential for future research is the immediate usage of
epinephrine self-injected device. Several studies have iterated the importance of immediate
administration of epinephrine after an allergic reaction to avoid severe outcomes. Hospital data
can be used along with chart reviews, to determine the differences in health and economic
outcomes associated with immediate administration of epinephrine versus epinephrine
administered more than one hour after the first symptoms. Results from such research can help
stimulate efforts to spread awareness about immediate use of epinephrine after a reaction.

103
This study estimated economic burden using a large database analysis, and food allergy reactions
were identified using ICD-9 codes. Published studies have emphasized on irregularities with
diagnosing and reporting of food allergic reactions. 112,134 Additionally, it has been reported that
estimates of food allergy based only on ICD-9-CM codes for identification should be interpreted
cautiously because they significantly underestimate the true prevalence of food allergy. 112
Hence, future research should try to overcome this drawback by using multiple sources to
identify patients, such as reviewing patient charts or using a wider range of ICD-9 codes
approved by experts. Additionally, future studies can also focus on identifying the reasons
behind irregularities in coding, whether it is intentional miscoding or a lack of clarity in defining
FAA.
The study findings suggest that a large proportion of economic burden for FAA arises from
office-based physician visits. However, these estimates were based on a small sample size.
Hence, future research might consider focusing on office and hospital outpatient FA visits using
private databases, which would ensure a greater sample size and more robust estimates.
This research used EQ-5D questionnaire to measure health utilities, which has two major
drawbacks, the associated ceiling effect and using parents has proxy for children. Future research
can attempt to overcome the ceiling effect issue by using other preference-based instruments like
SF-6D, which does not bear this problem, but is more expensive. Also, EuroQol has reported that
they are currently developing a youth version which can be used in children above the age of 7 to
measure their health utilities. Future researchers might want to consider using the youth version
to overcome the issue of proxy effect.
104
Conclusions
This research elucidated the economic and HRQL burden experienced by food allergy and
anaphylactic patients through the identification of direct medical and indirect costs, and generic
and food allergy specific quality of life.
FAA was associated with direct medical costs worth $225 million and indirect costs worth $115
million in the U.S. from a societal perspective. Owing to the irregularities in the reporting and
diagnosis of food allergy, these values might be an underestimation. The mean costs per allergy
consultations and ambulatory visits were less than half from ED visits and negligible compared
to hospitalizations. Matched analysis revealed that food allergy reaction patients incur one-half
the costs of similar hospitalized patients without food allergy.
For the first time health utility values were measured for food allergic adults and children using
EQ-5D questionnaire. Adults reported a mean utility of 0.874 compared to 0.918 for children
measured using their parents as proxy. An effect size of 0.003 revealed that health utilities of
food allergic patients are very similar to the general U.S. population. Additionally, FAQL-AF
questionnaires were used to elucidate the effect of food allergy on the daily life of food allergic
adults in the U.S., and identify the issues that cause the most stress to these patients. The study
also analyzed different factors that had an impact on the HRQL of food allergic patients, the
significant ones being gender, number of food allergies, and frequency of carrying epinephrine
devices.

105
Reference List
(1) Clark S, Bock A, Gaeta T, Brenner B, Cydulka R, Camargo C. Multicenter study of emergency department visits for food allergies. Journal of Allergy and Clinical Immunology. 2004;113:347-352.
(2) Sicherer S, Forman J, Noone S. Use assessment of self-administered epinephrine among food-allergic children and pediatricians. Pediatrics. 2000;105:359-362.
(3) Bethune C, Fay A. Adrenaline in the treatment of food anaphylaxis: What is the evidence? British Medical Journal. 2003;327:1332-1335.
(4) Bock S, Munoz-Furlong A, Sampson H. Fatalities due to anaphylactic reactions to food. Journal of Allergy and Clinical Immunology. 2001;107:191-193.
(5) Sicherer S, Munoz-Furlong A, Sampson H. Prevalence of sea food allergy in the US determined by a random telephone survey. Journal of Allergy and Clinical Immunology. 2004;114:159-165.
(6) Bollinger M, Dahlquist L, Mudd K, Sonntag C, Dillinger L, McKenna K. The impact of food allergy on the daily activities of children and their families. Annals of allergy, asthma and immunology. 2006;96.
(7) Sampson H. Update on food allergy. Journal of Allergy and Clinical Immunology. 2004;113:805-819.
(8) Sampson H. Food Allergy, Part 2: diagnosis and management. Journal of Allergy and Clinical Immunology. 1999;103:981-999.
(9) Yocum M, Butterfield J, Klein J, Volcheck G. Epidemiology of anaphylaxis in Olmstead county: a population-based study. Journal of Allergy and Clinical Immunology. 1999;104:452-456.
(10) Macdougall C, Cant A, Colver A. How dangerous is food allergy in childhood? The incidence of severe and fatal allergic reactions across the UK and Ireland. Archives of Disease in Childhood. 2002;86:236-239.
(11) Sampson H. Fatal food induced anaphylaxis. Allergy. 1998;53:125-130.
(12) Atkins F, Steinberg S, Metcalfe D. Evaluation of immediate adverse reactions to foods in adult patients. I. Correlation of demographic, laboratory, and prick skin test data with response to controlled oral food challenge. J Allergy Clin Immunol. 1985;75:348-355.
(13) Sampson H, Mendelson L, Rosen J. Fatal and near-fatal anaphylactic reactions to food in children and adolescents. N Engl J Med. 1992;327:380-384.
(14) Yunginger J, Sweeney K, Sturner W et al. Fatal food-induced anaphylaxis. JAMA. 1988;260:1450-1452.

106
(15) Ross M, Ferguson M, Street D, Klontz K, Schroeder T, Luccioli S. Analysis of food-allergic and anaphylactic events in the National Electronic Injury Surveillance System. Journal of Allergy and Clinical Immunology. 2007;121:166-171.
(16) Ewan P, Clark A. Long-term prospective observational study of patients with peanut and nut allergy after participation in a management plan. Lancet. 2001;357:111-115.
(17) Miles S, Fordham R, Mills C, Valovirta E, Mugford M. A framework for measuring costs to society of IgE-mediated food allergy. Allergy. 2005;60:996-1003.
(18) Spilker B. Quality of Life and Pharmacoeconomics in Clinical Trials. Second ed. 1996.
(19) Spilker B. Quality of Life and Pharmacoeconomics in Clinical Trials. Second ed. 1996.
(20) Torrance G. Preferences for Health Outcomes and Cost-Utility Analysis. The American Journal of Managed Care. 1997;3 Supp.
(21) Sampson H. Food Allergy. Part 1: Immunopathogenesis and clinical disorders. The Jounal of Allergy and Clinical Immunology. 1999;103:717-728.
(22) Vierk K, Koehler K, Fein S, Street D. Prevalence of self-reported food allergy in American adults and use of food labels. Journal of Allergy and Clinical Immunology. 2007;119.
(23) Wood R. The natural history of food allergy. Pediatrics. 2003;111:1631-1637.
(24) Sicherer S, Sampson H. Food allergy. Journal of Allergy and Clinical Immunology. 2006;117:S471-S475.
(25) Hourihane J, Roberts S. Resolution of peanut allergy: case-control study. British Mecical Journal. 1998;316:1271-1275.
(26) Geha R. Regulation of IgE synthesis in humans. Journal of Allergy and Clinical Immunology. 1992;90:143-150.
(27) Bock S, Atkins F. Patterns of food hypersensitivity during sixteen years of double-blind, placebo-controlled food challenges. Journal of Pediatrics. 1990;117:561-567.
(28) Sicherer S. Manifestations of food allergy: Evaluation and management. The American Family Physician. 1999;415-424.
(29) Neugut A, Ghatak A, Miller R. Anaphylaxis in the United States: an investigation into its epidemiology. Archives of Internal Medicine. 2001;161:15-21.
(30) Sampson H. Anaphylaxis and emergency treatment. Pediatrics. 2003;111:1601-1608.
(31) Fox M, Voordouw J, Mugford M, Cornelisse J, Antonides G, Frewer L. Social and economic costs of food allergies in Europe: Development of a questionnaire to measure costs and health utility. Health Services Research. 2009;44:1662-1678.

107
(32) Clark A, Ewan P. Food allergy in childhood. Archives of Disease in Childhood. 2003;88:79-81.
(33) Mueller H. Diagnosis and treatment of insect sensitivity. Journal of Asthma Research. 1966;3:331-336.
(34) Brown S. Clinical features and severity grading of anaphylaxis. Journal of Allergy and Clinical Immunology. 2004;114:371-376.
(35) Segel J. Cost of Illness Studies - A Primer. 2006. RTI International. Ref Type: Report
(36) Byford S, Torgerson D, Raftery J. Economic note: Cost of illness studies. British Mecical Journal. 2000;320:1335.
(37) Rice D. Cost of illness studies: What is good about them? Injury Prevention. 2000;6:177-179.
(38) Donaldson C, Narayan K. The cost of diabetes. A useful statistic. Diabetes Care. 1998;21:1370-1371.
(39) Zelmer J. The economic burden of end-stage renal disease in Canada: Present and future [ McMaster University, 2005.
(40) Luce B, Manning W, Siegel J, Lipscomb J. Estimating costs in cost-effectiveness analysis. In: Gold M, Siegel J, Russell L, eds. Cost effectiveness in health and medicine. New York: Oxford University Press; 1996.
(41) Hodgson T. Cost of illness in cost-effectiveness analysis: A review of the methodology. Pharmacoeconomics. 1994;6:536-552.
(42) Pindyck R, Rubinfeld D. Microeconomics. New York: Macmillan Publishing Company; 1992.
(43) Finkler S. The distinction between costs and charges. Annals of Internal Medicine. 1982;96:102-109.
(44) Haddix A, Teutsch S, Corso P. Prevention effectiveness: A guide to decision analysis and economic evaluation. Second ed. New York City: Oxford University Press; 2003.
(45) Hodgson T, Meiners M. Cost-of-illness methodology: a guide to current practices and procedures. Milbank Mem Fund Q Health Soc. 1982;60:429-462.
(46) Bloom B, Bruno D, Maman D, Jayadevappa R. Usefulness of US cost-of-illness studies in healthcare decision making. Pharmacoeconomics. 2001;19:207-213.
(47) Liu J, Maniadakis N, Gray A, Rayner M. The economic burden of coronary heart disease in the UK. Heart. 2002;88:597-603.

108
(48) Rice D, Miller L. Health economics and cost implications of anxiety and other mental disorders in the United States. Br J Psychiatry Suppl. 1998;4-9.
(49) Rice D, Kelman S, Miller L. Estimates of economic costs of alcohol and drug abuse and mental illness, 1985 and 1988. Public Health Rep. 1991;106:280-292.
(50) Hirth R, Chernew M, Miller E, Fendrick A, Weissert W. Willingness to pay for a quality-adjusted life year: in search of a standard. Med Decis Making. 2000;20:332-342.
(51) Koopmanschap M, Rutten F, van Ineveld B, van Roijen. The friction cost method for measuring indirect costs of disease. J Health Econ. 1995;14:171-189.
(52) Riegelman R. Studyin a study and testing a test: How to read the medical evidence. Philadelphia: Lippincott Williams and Wilkins; 2000.
(53) Barclay-Goddard R. Health related quality of life over one year post stroke: Identifying response shift susceptible constructs [ University of Manitoba, 2008.
(54) Oort F, Visser M, Sprangers M. An application of structural equation modeling to detect response shifts and true change in quality of life data from cancer patients undergoing invasive surgery. Qual Life Res. 2005;14:599-609.
(55) Ahmed S, Mayo N, Wood-Dauphinee S, Hanley J, Cohen S. Using the Patient Generated Index to evaluate response shift post-stroke. Qual Life Res. 2005;14:2247-2257.
(56) Oort F. Using structural equation modeling to detect response shifts and true change. Qual Life Res. 2005;14:587-598.
(57) Guyatt G, Feeny D, Patrick D. Measuring health-related quality of life. Ann Intern Med. 1993;118:622-629.
(58) Patrick D, Deyo R. Generic and disease-specific measures in assessing health status and quality of life. Med Care. 1989;27:S217-S232.
(59) Boyle M, Torrance G, Sinclair J, Horwood S. Economic evaluation of neonatal intensive care of very-low-birth-weight infants. N Engl J Med. 1983;308:1330-1337.
(60) Gold M, Patrick D, Torrance G. Identifying and valuing outcomes. In: Gold M, Siegel J, Russell L, Weinstein M, eds. Cost effectiveness in Health and Medicine. New York, NY: Oxford University Press; 1996:82-134.
(61) Jaeschke R, Singer J, Guyatt G. Measurement of health status. Ascertaining the minimal clinically important difference. Control Clin Trials. 1989;10:407-415.
(62) Khanna D, Tsevat J. Health-related quality of life--an introduction. Am J Manag Care. 2007;13 Suppl 9:S218-S223.

109
(63) Walters S, Brazier J. Comparison of the minimally important difference for two health state utility measures: SF-6D and EQ-5D. Quality of Life Research. 2005;14:1523-1532.
(64) Flokstra-de Blok, B., Van der Meulen G. Development and Validation of the Food Allergy Quality of Life Questionnaire - Adult Form. Allergy. 2009;2009.
(65) Oppe M, Rabin R, and Charro F. EQ-5D user guide. 2008. EuroQoL group. Ref Type: Report
(66) Hojvall J. A cost-of-illness study of skin, soft tissue, bone and lung infections caused by Staphylococci [ Uppsala University, 2006.
(67) Jacobson L, Lindgren B. Vad kostar sjukdomarna? [What are the costs of illness?]. Stockholm: Socialstyrelsen (National Board of Health and Welfare). 1996.
(68) Wilson I, Cleary P. Linking clinical variables with health-related quality of life. A conceptual model of patient outcomes. JAMA. 1995;273:59-65.
(69) von Neumann J, Morgenstern O. Theory of games and economic behavior. Princeton, NJ: Princeton University Press; 1944.
(70) Petrou S. What are Health Utilities? 1[4]. 2001. Hayword Medical Communications. Ref Type: Pamphlet
(71) Torrance G., Furlong W, Feeny D, Boyle M. Multi-Attribute Preference Functions: Health Utilities Index. Pharmacoeconomics. 1995;7:503-520.
(72) Clabaugh G, Ward M. Cost-of-illness studies in the United States: a systematic review of methodologies used for direct cost. Value Health. 2008;11:13-21.
(73) Cost of illness summaries for selected conditions. 2006. RTI International. Ref Type: Report
(74) Reed S, Lee T, McCrory D. The economic burden of allergic rhinitis: a critical evaluation of the literature. Pharmacoeconomics. 2004;22:345-361.
(75) Dalal A, Stanford R, Henry H, Borah B. Economic burden of rhinitis in managed care: a retrospective claims data analysis. Ann Allergy Asthma Immunol. 2008;101:23-29.
(76) Ray N, Baraniuk J, Thamer M et al. Direct expenditures for the treatment of allergic rhinoconjunctivitis in 1996, including the contributions of related airway illnesses. J Allergy Clin Immunol. 1999;103:401-407.
(77) Ray N, Baraniuk J, Thamer M et al. Healthcare expenditures for sinusitis in 1996: contributions of asthma, rhinitis, and other airway disorders. J Allergy Clin Immunol. 1999;103:408-414.

110
(78) Crystal-Peters J, Crown W, Goetzel R, Schutt D. The cost of productivity losses associated with allergic rhinitis. Am J Manag Care. 2000;6:373-378.
(79) Gupta R, Sheikh A, Strachan D, Anderson H. Burden of allergic disease in the UK: secondary analyses of national databases. Clin Exp Allergy. 2004;34:520-526.
(80) Primeau M, Kagan R, Joseph L et al. The psychological burden of peanut allergy as perceived by adults with peanut allergy and the parents of peanut-allergic children. Clin Exp Allergy. 2000;30:1135-1143.
(81) Flokstra-de Blok B, Dunngalvin A, Vlieg-Boerstra B et al. Development and validation of a self-administered Food Allergy Quality of Life Questionnaire for children. Clin Exp Allergy. 2009;39:127-137.
(82) Flokstra-de Blok B, Dunngalvin A, Vlieg-Boerstra B et al. Development and validation of the self-administered Food Allergy Quality of Life Questionnaire for adolescents. J Allergy Clin Immunol. 2008;122:139-44, 144.
(83) Dunngalvin A, Cullinane C, Daly D, Flokstra-de Blok B, Dubois A, Hourihane J. Longitudinal validity and responsiveness of the Food Allergy Quality of Life Questionnaire - Parent Form in children 0-12 years following positive and negative food challenges. Clin Exp Allergy. 2010;40:476-485.
(84) Lebovidge J, Stone K, Twarog F et al. Development of a preliminary questionnaire to assess parental response to children's food allergies. Ann Allergy Asthma Immunol. 2006;96:472-477.
(85) Cohen B, Noone S, Munoz-Furlong A, Sicherer S. Development of a questionnaire to measure quality of life in families with a child with food allergy. J Allergy Clin Immunol. 2004;114:1159-1163.
(86) Marklund B, Ahlstedt S, Nordstrom G. Health-related quality of life in food hypersensitive schoolchildren and their families: parents' perceptions. Health Qual Life Outcomes. 2006;4:48.
(87) Marklund B, Ahlstedt S, Nordstrom G. Health-related quality of life among adolescents with allergy-like conditions - with emphasis on food hypersensitivity. Health Qual Life Outcomes. 2004;2:65.
(88) Avery N, King R, Knight S, Hourihane J. Assessment of quality of life in children with peanut allergy. Pediatr Allergy Immunol. 2003;14:378-382.
(89) Sicherer S, Noone S, Munoz-Furlong A. The impact of childhood food allergy on quality of life. Ann Allergy Asthma Immunol. 2001;87:461-464.
(90) Ostblom E, Egmar A, Gardulf A, Lilja G, Wickman M. The impact of food hypersensitivity reported in 9-year-old children by their parents on health-related quality of life. Allergy. 2008;63:211-218.

111
(91) Barber J, Thompson J. Multiple regression of cost data: use of generalized linea models. Journal of Health Services Research and Policy. 2004;2004:197-204.
(92) Moran J. New models for old questions: generalized linear models for cost prediction. Journal of Evaluation and Clinical Practice. 2007;13:381-389.
(93) Flabbee J, Petit N, Jay N et al. The economic costs of severe anaphylaxis in France: an inquiry carried out by the Allergy Vigilance Network. Allergy. 2008;63:360-365.
(94) HCUP Nationwide inpatient sample (NIS). Healthcare cost and utlization project (HCUP). 1998-2007. Agency for healthcare research and quality . 2010. Ref Type: Internet Communication
(95) Coyne K, Paramore C, Grandy S, Mercader M. Assessing the direct costs of treating nonalvular atrial fibrillation in the United States. Value in Health. 2006;9:348-356.
(96) Custom coder: Coding, billing, and reimbursement information. DecisionHealth . 2010. 3-21-2010. Ref Type: Internet Communication
(97) My health score: Healthcare quality information for consumers. Intellimed Inc. 2010. 3-20-2010. Ref Type: Internet Communication
(98) GAO-07-383. Ambulance providers: Costs and expected Medicare margins vary greatly. 2007. Ref Type: Report
(99) Branum A, Lukacs S. Food Allergy among children in the United States. Pediatrics. 2009;124:1549-1555.
(100) Branum A and Lukacs S. Food Allergy among US childrens: Trends in Prevalence and Hospitalizations. 10. 2008. National Center for Health Statistics. Ref Type: Report
(101) Coding for Food Allergy. Vol. 20; No.2, 25. 1-21-2008. For the Record. Ref Type: Report
(102) Davis C. Food allergies: clinical manifestations, diagnosis, and management. Curr Probl Pediatr Adolesc Health Care. 2009;39:236-254.
(103) Prescription drug benefit cost and plan design report. 2007. Takeda Pharmaceuticals. Ref Type: Report
(104) Williams R. Distribution of Emergency Department Costs. Annals of Emergency Medicine. 1996;28:671-678.

112
(105) Goings G. Employment and earnings. 2009. Bureau of Labor Statistics. Ref Type: Report
(106) Zaloshnja E, Miller T, Lawrence B, Romano E. The costs of unintentional home injuries. Am J Prev Med. 2005;28:88-94.
(107) Berge J, Drennan D, Jacobs R et al. The cost of hepatitis A infections in American adolescents and adults in 1997. Hepatology. 2000;31:469-473.
(108) Sculpher M. The use of probabilistic sensitivity analysis in decision making: The example of drug-eluting stents. 2004. Ref Type: Pamphlet
(109) Diehr P, Yanez D, Ash A, Hornbrook M, Lin D. Methods for analyzing health care utilization and costs. Annu Rev Public Health. 1999;20:125-144.
(110) Garson D. Statnotes: topics in multivariate analysis. http://faculty.chass.ncsu.edu/garson/pa765/statnote.htm. 2007. NCSU. 6-1-2010. Ref Type: Electronic Citation
(111) Berger M, Bingefors K, Hedblom E, Pashos C. Healthcare cost, quality, and outcomes. Lawrenceville, NJ: ISPOR; 2003.
(112) Clark S, Gaeta T, Kamarthi G, Camargo C. ICD-9-CM coding of emergency department visits for food and insect sting allergy. Ann Epidemiol. 2006;16:696-700.
(113) Briggs A, Sculpher M, Claxton K. Decision modelling for health economic evaluation. Oxford, UK: Oxford University Press; 2006.
(114) Schafer J, Graham J. Missing data: our view of the state of the art. Psychol Methods. 2002;7:147-177.
(115) BriggsA, Clark T, Wolstenholme J, Clarke P. Missing... presumed at random: cost-analysis of incomplete data. Health Econ. 2003;12:377-392.
(116) Ozol D, Uz E, Bozalan R, Turkay C, Yildirim Z. Relationship between asthma and irritable bowel syndrome: role of food allergy. J Asthma. 2006;43:773-775.
(117) Weiss K, Sullivan S. The health economics of asthma and rhinitis. I. Assessing the economic impact. J Allergy Clin Immunol. 2001;107:3-8.
(118) Stanford R, McLaughlin T, Okamoto L. The cost of asthma in the emergency department and hospital. Am J Respir Crit Care Med. 1999;160:211-215.
(119) Malone D, Lawson K, Smith D, Arrighi H, Battista C. A cost of illness study of allergic rhinitis in the United States. J Allergy Clin Immunol. 1997;99:22-27.

113
(120) Kessler R, Almeida D, Berglund P, Stang P. Pollen and mold exposure impairs the work performance of employees with allergic rhinitis. Ann Allergy Asthma Immunol. 2001;87:289-295.
(121) Druss B, Marcus S, Olfson M, Tanielian T, Elinson L, Pincus H. Comparing the national economic burden of five chronic conditions. Health Aff (Millwood ). 2001;20:233-241.
(122) Molinari N, Ortega-Sanchez I, Messonnier M et al. The annual impact of seasonal influenza in the US: measuring disease burden and costs. Vaccine. 2007;25:5086-5096.
(123) Coffey J, Brandle M, Zhou H et al. Valuing health-related quality of life in diabetes. Diabetes Care. 2002;25:2238-2243.
(124) Sobocki P, Ekman M, Agren H et al. Health-related quality of life measured with EQ-5D in patients treated for depression in primary care. Value Health. 2007;10:153-160.
(125) U.S. valuation of the EuroQol EQ-5D health states. Agency for healthcare research and quality, Rockville, MD. 2005. Ref Type: Internet Communication
(126) Hulley S, Cummings S, Browner W, Grady D, Newman T. Designing clinical research. Third ed. Philadelphia, PA: Lippincott Williams and Wilkins; 2007.
(127) Cohen J. Statistical power analysis for the behavioral sciences. Rev. ed. New York: Wiley; 1977.
(128) Hevey D, McGee H. The Effect Size statistic: Useful in health outcomes research? Journal of Health Psychology. 1998;3:163.
(129) Magaziner J, Simonsick E, Kashner T. Patient-proxy response comparability on measures of patient health and functional status. Journal of Clinical Epidemiology. 1998;41:1065-1074.
(130) Bharmal M, Thomas J. Comparing the EQ-5D and the SF-6D descriptive systems to assess their ceiling effects in the US general population. Value in Health. 2006;9:262-271.
(131) Stolk E, Krabbe P, and Busschbach J. Using the internet to collect EQ-5D norm scores: a valid alternative? 24th Scientific Plenary Meeting of the EuroQol Group , 153-165. 2009. Ref Type: Conference Proceeding
(132) Burstrom K, Johannesson M, Diderichsen F. A comparison of individual and social time trade-off values for health states in the general population. Health Policy. 2006;76:359-370.
(133) Wilson C, Morgan B. Understanding power and rules of thumb for determing sample sizes. Tutorials in Quantitative Methods for Psychology. 2007;3:43-50.

114
(134) Chafen J, Newberry S, iedl M et al. Diagnosing and managing common food allergies: a systematic review. JAMA. 2010;303:1848-1856.

115
Appendix A IRB Approval for HRQL study

116
Appendix B Estimating Health Utilities using EQ-5D Step 1: Convert patients’ EQ-5D responses to 5 digit scores
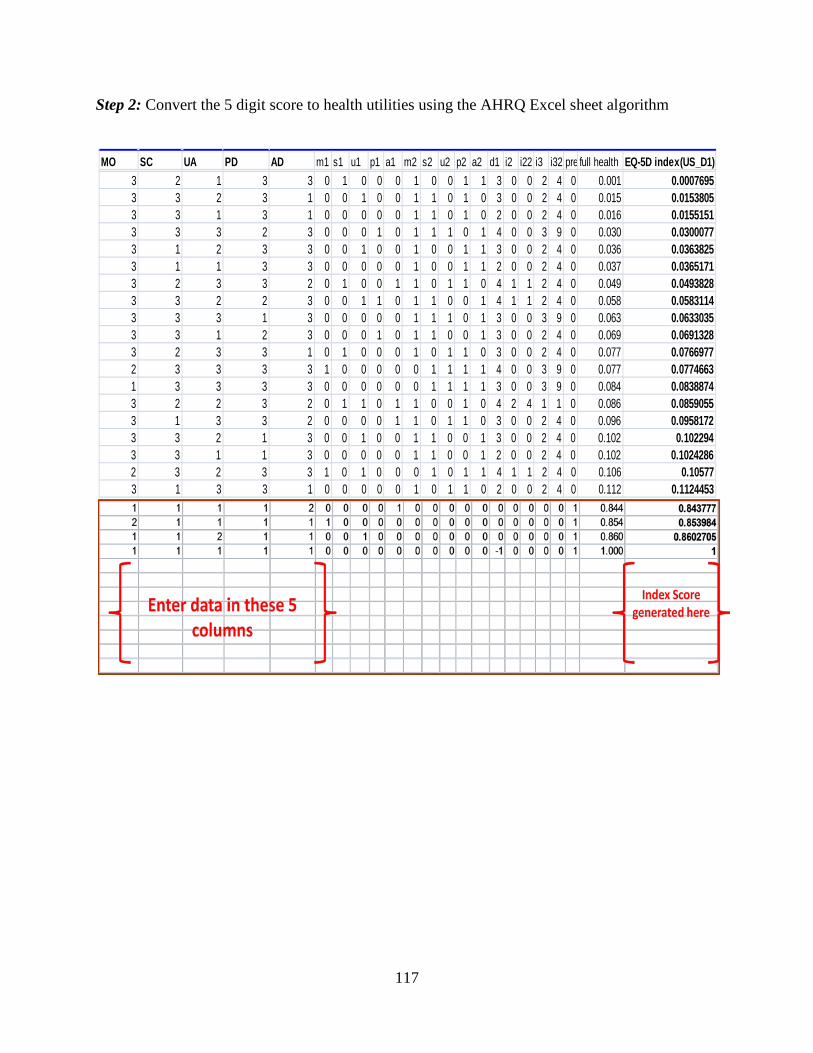
117
Step 2: Convert the 5 digit score to health utilities using the AHRQ Excel sheet algorithm
3 2 1 3 3 0 1 0 0 0 1 0 0 1 1 3 0 0 2 4 0 0.001 0.00076953 3 2 3 1 0 0 1 0 0 1 1 0 1 0 3 0 0 2 4 0 0.015 0.01538053 3 1 3 1 0 0 0 0 0 1 1 0 1 0 2 0 0 2 4 0 0.016 0.01551513 3 3 2 3 0 0 0 1 0 1 1 1 0 1 4 0 0 3 9 0 0.030 0.03000773 1 2 3 3 0 0 1 0 0 1 0 0 1 1 3 0 0 2 4 0 0.036 0.03638253 1 1 3 3 0 0 0 0 0 1 0 0 1 1 2 0 0 2 4 0 0.037 0.03651713 2 3 3 2 0 1 0 0 1 1 0 1 1 0 4 1 1 2 4 0 0.049 0.04938283 3 2 2 3 0 0 1 1 0 1 1 0 0 1 4 1 1 2 4 0 0.058 0.05831143 3 3 1 3 0 0 0 0 0 1 1 1 0 1 3 0 0 3 9 0 0.063 0.06330353 3 1 2 3 0 0 0 1 0 1 1 0 0 1 3 0 0 2 4 0 0.069 0.06913283 2 3 3 1 0 1 0 0 0 1 0 1 1 0 3 0 0 2 4 0 0.077 0.07669772 3 3 3 3 1 0 0 0 0 0 1 1 1 1 4 0 0 3 9 0 0.077 0.07746631 3 3 3 3 0 0 0 0 0 0 1 1 1 1 3 0 0 3 9 0 0.084 0.08388743 2 2 3 2 0 1 1 0 1 1 0 0 1 0 4 2 4 1 1 0 0.086 0.08590553 1 3 3 2 0 0 0 0 1 1 0 1 1 0 3 0 0 2 4 0 0.096 0.09581723 3 2 1 3 0 0 1 0 0 1 1 0 0 1 3 0 0 2 4 0 0.102 0.1022943 3 1 1 3 0 0 0 0 0 1 1 0 0 1 2 0 0 2 4 0 0.102 0.10242862 3 2 3 3 1 0 1 0 0 0 1 0 1 1 4 1 1 2 4 0 0.106 0.105773 1 3 3 1 0 0 0 0 0 1 0 1 1 0 2 0 0 2 4 0 0.112 0.1124453
MO SC UA PD AD m1 s1 u1 p1 a1 m2 s2 u2 p2 a2 d1 i2 i22 i3 i32 pre full health EQ-5D index(US_D1)

118
Appendix C SAS Codes – for Greedy Matching libname mylib 'C:\Users\pateld\Desktop\data'; data mylib.study mylib.control; set mylib.Nis07_matching; rand_num=uniform(0); if cases=1 then output mylib.study; else output mylib.control; run; PROC SQL; CREATE table mylib.abcdef as select one.key as study_id, two.key as control_id, one.age_grp as study_age_group, two.age_grp as control_age_group, one.female as study_gender, two.female as control_gender, one.race as study_race, two.race as control_race, one.pay1 as study_prim_payor, two.pay1 as control_prim_payor, one.hosp_tea as study_teaching, two.hosp_tea as control_teaching, one.hosp_loc as study_hosp_location, two.hosp_loc as control_hosp_location, one.aprdrg_s as study_sev_illness, two.aprdrg_s as control_sev_illness, one.hosp_bed as study_hosp_size, two.hosp_bed as control_hosp_size, one.rand_num as rand_num from mylib.study one, mylib.control two where (one.age_grp=two.age_grp and one.female=two.female and one.race=two.race and one.pay1=two.pay1 and one.hosp_tea=two.hosp_tea and one.hosp_loc=two.hosp_loc and one.aprdrg_s=two.aprdrg_s and one.hosp_bed=two.hosp_bed); proc sort data=mylib.abcdef nodupkey; by control_id; run; proc sort data=mylib.abcdef; by study_id rand_num; run; data mylib.matched_case_controls mylib.not_enough; set mylib.abcdef; by study_id ; retain num; if first.study_id then num=1; if num le 2 then do;

119
output mylib.matched_case_controls; num=num+1; end; if last.study_id then do; if num le 2 then output mylib.not_enough; end; run;

120
Appendix D List of Abbreviations used in the text AHRQ = Agency of Healthcare Research and Quality AIC = Akaike Information Criterion APC = Ambulatory Payment Classification AWP = Average Wholesale Price CCS = Clinical Classification Software CPT = Current Procedural Terminology CTC = Cost to Charge ED = Emergency Department ER = Emergency Room EQ-5D = EuroQol-5 Dimensions FAA = Food Allergy and Anaphylaxis FAQL-AF = Food Allergy Quality of Life – Adult Form FDA = Food and Drug Administration GAO = Government Accountability Office GLM = Generalized Linear Models HCUP = Healthcare Cost and Utilization Project HRQL = Health Related Quality of Life HU = Health Utilities ICD = International Classification of Diseases IRB = Institutional Review Board MID = Minimal Important Difference NAMCS = National Ambulatory Medical Care Survey NEDS = National Emergency Department Sample NHAMCS–OPD = National Hospital Ambulatory Medical Care Survey – Outpatient Department NIS = National Inpatient Sample PSA = Probabilistic Sensitivity Analysis QALY = Quality Adjusted Life Year QoL = Quality of Life USD = U.S. Dollar

121

122