Embed Size (px)
Citation preview

INOM EXAMENSARBETE TEKNIK,GRUNDNIVÅ, 15 HP
, STOCKHOLM SVERIGE 2018
Assessing financial advice using machine learning
JOHAN HENRIQUES
WILLIAM WESTERLUND
KTHSKOLAN FÖR INDUSTRIELL TEKNIK OCH MANAGEMENT
Assessing financial advice using machine learning
Johan Henriques and William Westerlund
Abstract— The fields of artificial intelligence and machinelearning are rapidly transforming the global technologicallandscape. Many enterprises within the financial sector areincreasingly pursuing such projects to replace or enhanceexisting systems to be part of the new technological frontier.ABC Bank is a financial institution that aims to introducea level of screening of advisory-texts in order to enhancequality and to improve resource efficiency within the firm.Through development of an implementation using the modelsRandom Forest, Multi-Layer Perceptron and Support VectorMachine, this project served as a pilot study, an enabler, forfurther machine learning solutions to be developed within thebank. Whereas the developed model performed better thanrandomly guessing the most likely class-label for an advisory-text, the scarce amount of data currently accessible preventsmaking claims whether the implementation is eligible forproduction-stage or not. The project highlights some barriersfor introducing machine learning on a larger scale and adviceon how to proceed is presented.
I. INTRODUCTION
Natural Language Processing (NLP) is a rapidly growingfield often associated with artificial intelligence and machinelearning. Its history dates back to the 1950s and has tradi-tionally been a field where rule-based systems have beenprominent. Today, companies that have previously solvedNLP-related tasks with rule-based systems now have thepossibility to use new technology - such as machine learning- to accomplish these tasks. Human communication is oftenvague; in both speech and writing we use colloquialismsand abbreviations, making the task of analyzing naturallanguage an arduous process. In the last decade, NLP andmachine learning has shown immense progress in treatingthese inconsistencies of human writing and speech; renderingnew opportunities available across a wide variety of scientificdomains.
There are various topics that fall under the domain ofNLP, one of major relevance for this paper being semanticanalysis. Capturing and processing information is often aneasy task, but to understand and interpret what is being saidor written account to the difficult part, even more so doingit at scale. Semantic analysis is the process of trying tounderstand and interpret language based on meaning andcontext. For problems of lower complexity, using purelystatistical NLP is satisfactory but many contemporary tasksdemands a deeper understanding of context and meaningto reliably approximate an adequate result. This constitutesthe basis for the rise of using machine learning to resolvesemantic NLP tasks.
The client for this project, from here on referred to asABC Bank (ABC), is a financial institution that works witha project within the domain of NLP to decide if financial
advising for private customers are motivated based on acollection of questions. The idea with the project is tointroduce a level of screening of advisory-texts before humanassessment ultimately takes place. Financial advice meetingsare between an adviser and a customer, resulting in a finaldocument that serve as a recap of the meeting and possibleproposals from the adviser. Furthermore, to ensure highquality and that these advisory-documents comply with setregulations, a larger subset of these are then revisited by anassessor to ensure that the documents do not contain anyerrors. The task of the assessor is to confirm that financialadvice proposed by the adviser is justified based on the infor-mation the customer has presented during the meeting. Theassessment consists of seven questions to be answered on adegree of 0-4 to evaluate a given advisory-text. To providecontext about the advice; in general terms, the advice is builtupon information concerning the customers economic- andprivate circumstances, the meetings background, as well asguidelines from the bank. The assessment-process is todayexecuted manually by a significant number of employees, andABC aspire to enhance the process with machine learning toensure higher quality and resource efficiency.[1] This projectaims aid ABC in this process of automation by implementinga machine learning system that has the potential to be of greatuse to the enterprise.
A. Goal and PurposeThe purpose of this paper is to investigate opportunities
to introduce screening for the assessment process by ap-plying machine learning. The technical goal in its essenceis to create a solution that can obtain satisfactory resultsin evaluating whether provided financial advice is justifiedfor a given customer. Herein lies several questions thatneed to be answered as the work progresses: What modelshould be used? How should the model be evaluated? Whatare satisfactory results? Further, a deeper look into AI andchange management will be conducted to observe its possibleimplications for digitalization, both for the industry as awhole and for ABC bank in particular.
The project will be of interest for banks and other financialinstitutions as it will add insight on how machine learningcan be applied to concrete language problems for the finan-cial business sector and to create opportunity to automatizecostly processes. Furthermore, Swedish banks are requiredby law to send customers advisory-text that detail the adviceand the motivation for the advice, which further magnifiesthe impact and importance of this work.
Lastly, the project will be of interest to anyone whoexplores the field of machine learning and natural language
1
processing as it gives insight as to the opportunities and thelimitations of certain approaches.
B. Ethical Considerations
The task of assessment involves sensitive consumer dataand is part of an important decision process. As such, thereare naturally ethical considerations to address. Preferably, themodel would need to be transparent, so that it is possibleto back-track how a prediction is made. If the model is ablack-box in the sense that there is no way of understandinghow a decision is made, Finansinspektionen will not besatisfied as they require a firm basis to support these typesof decisions. However, transparency will not be the focus ofthis project which instead will be to ensure high performancethereby rendering transparency secondary. Next, it needsto be made sure that the model does not discriminate byfavoring doubtful feature correlations, such as proposing thatgender is a determining factor for the output of the model.
Not related directly to the model is that the data used forboth training and evaluation is extremely sensitive, and canunder no circumstances leak as a consequence of improperhandling of the data or poor implementation.
Finally, as noted implicitly, the advisory-texts are bynature important for the customers and the bank as theydetail how the customers should handle economic matters.It is therefore of dire importance that the model accuratelyevaluates if a text should not be considered approved toensure high value for the customer.
C. Scientific Question
The primary question that is addressed in this paper is:How can machine learning be applied to classify advisory-texts on a scale between 0-4 and what effects can beobserved in terms of change management and what are theimplications for further digitalization?
The advisory-texts are to be evaluated based on sevendifferent questions that will assess whether the advice isjustified for a particular customer. Six of the questionsconcern certain aspects and details of the customer (eg.needs, risk-tolerance, motive), whereas the seventh questionis an overall evaluation of the customer case. Fundamentally,each text will receive several grades, depending on how wellit satisfies the requirements for each question on a scalebetween 0-4. The assessment is made through processinga selection of 365 metadata tags. These consist of customerinformation, free-text data, and timestamps. This means thatone data point is multi-dimensional and includes an advisorytext combined with details about said customer case.
The assignment entails an ensemble of challenges in formof text pre-processing and feature selection. Next, the modelhas to be selected as such to provide a satisfactory result andtry to reduce the black-box effect. There is often a trade-offbetween complexity and transparency, so that there is valuein attempting to try less complex models at this stage ofthe automation process, which aligns with the wants of thetaskmaster.
Another aspect is that different assessors may grade agiven advisory-text differently, which means that the data isnot thoroughly objective and results in fuzzy logic. On onehand, the data includes noise which might prevent extensiveover-fitting, on the other hand, it also means that it might bedifficult to draw any certain conclusions.
II. BACKGROUND
The machine learning model to be chosen will renderparamount for the overall design and implementation of thefinal solution. Every model comes with its pros and cons andhence, a crucial task is to determine the model that best fit theproblem at hand. There are several prerequisites that underliethe task that serve as important data points when selectingthe model. Since the advisory-texts are graded on multi-numbered scale on seven different questions, the problemin its essence can be thought of as seven separate multi-classification tasks for each advisory-text. As previouslymentioned, the model would preferably be transparent andnot typically prone to over fitting. The model would alsoneed to be able to scale well since many advisory-textscan be expected in the future. The model can not be toocomplex, allowing ABC to continue to work and to improvethe solution in the future. Furthermore, reduced complexityalso often entails increased transparency. The aim of theupcoming section is to introduce the selected algorithms forthe study.
A. Support Vector Machines
Support vector machine (SVM) originally separates thebinary classes (K = 2) with a maximized margin criterion.[2,p. 1] Problems in the real-world however, usually requiresdiscrimination for a number of categories larger than 2. Tra-ditionally, multi-class classification with SVM has involvedusing multiple binary classifiers and combining them in whatis using either a one-vs-all or a one-vs-one approach. Theformer involves creating k separate classifiers for a k-classclassification problem, and then training the m-th classifierand setting the data of class m to positive, the rest tonegative. Then, when testing, the class label is determinedby which class gives the highest output value.[2, p. 26]The latter works by generating k(k-1)/2 classifiers and thenapplying each classifier to a test and giving each class avote so that the predicted class is composed of the majorityvote. There is also the possibility of using an all-togetherapproach where all classes are represented in one singleoptimization processing step. The major drawback is that itsuch an approach is computationally intensive as the size ofthe resulting Quadratic Programming (QP) problem is of sizei * j where i is number of samples and j is number of classes.In essence, a QP problem involves finding a vector thatminimizes or maximizes a mathematical quadratic functionsubject to certain bounds.[3] Even if it is not necessarilyan issue as the number of samples is small, this means thatSVM approaches may be hard to scale. However, there areways to minimize the QP by using certain implementationsof SVM which makes it a compelling alternative to use for
2
this particular problem.[2, p. 27] The main point to consideris that SVM output is in terms of distance to a given line,and the discussion here becomes more on how to interpretthat and if it makes sense for the dataset to be representedin the way that SVM requires.
B. Decision Trees
Decision tree learning is an intuitive machine learningmodel that predicts conclusions about an items target valuerepresented in the leaves, based on observations about anitem that are represented in the branches. For multi-classclassification, each branch would represent decisive featuresleading to a target leaf that would represent a class. Froma set of selected features and training data it is possible tolearn a tree through recursive partitioning. This essentiallyworks by calculating the resulting entropy from differentsplits, choosing the one where the information gain islargest and thus, the measure of impurity is lowest. This isdone recursively for all sub-trees until the splitting processterminates after a stopping criterion is reached. DecisionTrees are transparent by design as it is trivial to followthe decision paths and would therefore allow for auditingof the decision process. However, there are certain aspectsthat make it challenging for this project as will be stated inthe next section. [4, p. 1-6]
C. Random Forests
Among the major drawbacks of using a single decisiontree is the tendency to over-fit and the challenge of doingeffective splits. Random Forests (RF) is an ensemble methodthat tries to solve these issues by combining multiple decisiontrees in a stochastic manner. The idea is that the Law of LargeNumbers apply and can be used to make accurate predictionsand prevent over-fitting. It is suggested by Breiman thatselecting multiple independent decision trees that each canvote for the classification results in higher accuracy and lessover-fitting when studying the majority vote compared tousing a single decision tree.[5, p. 1-2] Each decision tree usesa random selection of features which makes the model morerobust to noise. Random Tree algorithms are effective whenthere are many types of features and a lot of data, whichmakes it interesting for this particular topic. Specifically, itfares well with combining both numerical and categoricalfeatures, a characteristic which as mentioned previously isimportant for this case.[5, p. 13, 25] Potential drawbacksthat are relevant for this case is the tendency to black-box,which means that there might be hardships in interpretingwhat constitutes the output of the model. However, there areways to interpret Random Forests using for instance featureimportance ranking, whereby the impurity can be analyzed tosee how different features impact the results. Also, decisionpaths can be used to visualize how a prediction was madealbeit with some caveats. The process of visualizing thedecision path can be tedious and complex as it involvesaggregating the decision paths for every single tree. [6]
D. Neural NetworksNeural networks can among other things be used for text-
classification and supervised learning. The idea is to try tomodel the human brain by connecting a series of neuronsthat each take some input and give an output adjusted witha weight. By doing this with many neurons, the aim isto simulate how the human brain works and try to makedecisions by adjusting these weights. For this reason, neuralnetworks that are constructed are usually called ArtificialNeural Networks or ANNs for short. The simplest variant ofANNs is the linear approach which uses a function f(x;W,b)= x * W + b, where x is the input vector of features, Wis a weight vector and b represents the bias. The resultingfunction has a range of (-inf, inf) whereby it is feasible toadd some function to reduce the output to for instance [-1,1]. Such a function is an example of an activation function.The sigmoid function is often applied to feed-forward neuralnetworks as it, when combined with a suitable loss function,can be used to interpret binary predictions as a probabilityestimate. A loss function is used to train the neural networkby quantifying the prediction compared to its true value, inpractice this can take many forms and a common approach isto use stochastic gradient descent.[7, p. 31-35] The output ofthe network is then used to determine the class.[7, p. 13-20]For the multi-class case, which is relevant for this particularproblem, one could use multiple weight vectors W and thencalculate the output for each of the weight vectors and takethe argmax of the output to decide the class.[7, p. 21]
E. Related WorkIn a study by Guobin and Murphey investigating multi-
class pattern classification by studying neural network ap-proaches and modeling pattern classes, it was concluded thatusing SVM and Artificial Neural Networks (ANN) can beproblematic for multi-class problems. The reason being thatit often culminates in unexpected complexity and weakerperformance as the algorithms are extended from two-classto multi-class problems.[8]
Another study conducted by Pal and Mather in 2006 in-vestigating classification performance between SVMs, max-imum likelihood models and ANNs, concluded that SVMshas the potential to achieve a higher classification accuracycompared to ANNs. It was also concluded that SVMs mayfare well with high-dimensional data and small trainingsets.[9] Although in a study by Madzarov et al. studyingSVMs in different scenarios, it was suggested that extendingSVMs to multi-classification problems is non-trivial, whichconfirms the work by Guobin and Murphey in the paper men-tioned previously.[10] A corollary is that SVMs might notrender suitable for this case due to its apparent complexity.
A study considering classification of micro-array data per-formed by Daz-Uriarte and Alvarez de Andres used RandomForests and found that such ensemble methods work wellwhen the number of variables is larger than the number ofobservations, which might of interest given the sparse datasetof 361 being used in this project. Also, it was suggestedthat even when most predictive variables were noise, the
3
Random Forest worked well, which might also be interestingas the feature selection aspect will be hard. Furthermore, theassessors have used their subjective view when rating theadvisory-texts, which means that there will be noise.[11]
III. METHODA. Preface
Considering the data, the algorithm choice would needto account for noise, sparsity and if possible scalability.Aspects that would need to be considered regarding theinner workings of the algorithm are transparency, complexityand accuracy. As mentioned earlier, transparency will be asecondary consideration for the project.
It was decided to use Random Forests, ANNs and SVMsfor the implementation as those have many of the favorableproperties for this project. The primary classifier used duringthe development stage was the Random Forest classifier andthe other two were secondary to see how the use of differentclassifiers might affect the output. The implementation ofANNs are later on referred to as Multi-layer perceptrons(MLP).
B. DatasetThe dataset consists of 361 data points with 365 metadata
tags. The data is provided by ABC and is confidential.Thus, numerical values and features may or may not bealtered depending upon the taskmasters preferences to ensureconfidentially and to protect sensitive information. A resultis that the exact question descriptions will not be includedand that questions to be answered only will be representedby a number. Currently the dataset is very small, which is achallenge. In the long run, large amounts of data could beavailable for ABC’s disposal. However, said data is currentlyinaccessible and therefore not usable for this project.
The data itself consists of imbalanced data. The majorityof the graded questions have one class to where 80-95%of the labels pertain to. Thus, there will be large classimbalances that would need to be balanced and kept in mind.The scikit-learn library provided useful tools to handle thissituation, in particular when working with the Random Forestmodel the library had a feature that allowed for weighing thedata accordingly. The class imbalance would also mean thatthe classifier in order to be of practical usefulness, wouldneed to perform better than randomly guessing the class withthe most label occurrences. Meaning, if a question 2.x hasa 95% label occurrence of class Y, the classifier would needan accuracy greater than 95%.
C. ImplementationThe implementation was done in Python 3.6 as part of
the Anaconda binary which includes scikit-learn, numpyand pandas. Initially pandas was used to read the datasetprovided in excel format. The data was then shuffled usinga random seed and split into a training set consisting of80% of the data and a test set containing 20% of thedata. Using scikit-learn, a pipeline was then generated whichprovided an easy way to deal with multiple features and
a range of other tools to streamline the implementation.The pipeline allowed for modification of feature weights,rendering the process of giving importance to certain featuresa simple task. The pipeline also provided an easy way to dohyper-parameter optimization, described in more detail in anupcoming subsection. Furthermore, with the pipeline, onecould easily change classifier if desired. Once the pipelinewas generated it could be used to train the model in orderpredict the labels in the test set.
D. Feature SelectionAs previously mentioned, the dataset consists of 365 meta-
data tags that may be used in the model. ABC provided aidin the process of selecting the features that they perceivedas being most relevant. A multitude of features were thenselected that were thought to be able to affect the outcomein any significant way. The large amounts of features madeit inconceivable to try every feature and every possiblecombination within the given time frame. Meaning, intuitionand general financial expertise had to be applied to prioritizeamong the endless possibilities.
The features can be divided into word-based and numericalfeatures. The former is based on free-text and on word count,whereas numerical features are based on numbers such as anindividuals expenses.
The final implementation is based on two types of vector-izers that extract features and an assortment of classifiers, thelatter which has been discussed extensively to this point. Thevectorizers used are TfidfVectorizer and DictVectorizer. Theformer works by counting word occurrences and developinga sparse matrix to then apply Term Frequency Inverse Docu-ment Frequency normalization to the matrix. Term FrequencyInverse Document Frequency normalization aims to scaledown the impact of frequent tokens in the corpus and putmore emphasis on more rare features since the informationgain on those are higher. Next, the DictVectorizer transformslists of feature-value mappings to vectors to use in conjunc-tion with the word count features. The feature extraction fromthese two vectorizer types are then sent through a pipelineto the classifier of choice which is trained on the training setand then used to predict from the test set.
E. Hyper-parameter OptimizationHyper-parameters are parameters that are set before the
learning phase and important as they serve as a way totune the algorithms. Afshin et al. postulate that correctoptimization of hyper-parameters are critical to ensure a highreliability and performance of the model.[12] Therefore, inorder to tune the parameters to be as close to optimal aspossible, tools that are part of the scikit-learn package wereused to optimize the model using metrics mentioned in thenext section.
In order to optimize the hyper-parameters, a grid searchwas done. Effectively this means trying different parametersin combination with 3 fold cross-validation in order totry find the parameters which give the best results. TheTfidfVectorizer were tuned in this way, as was the Random
4
Forest Classifier. The SVM and the MLP classifiers werenot hyper-parameter optimized, which in turn means thatthere are possible that some combination of hyper-parameterswould prove more effective for those classifiers.
The final parameters used for the TfidfVectorizer was touse n-grams sized 1 to 4 words, require that features arein at least 10% of the data-points and finally that there canbe a maximum of 5000 features from the vectorizer. The10% threshold is an example where a lemmatizer might haveimpact since words that are inflected frequently might getremoved that should be part of the final document matrix.For the Random Forest Classifier, it was possible to tunethe number of trees and if to adjust for class imbalance.The number of trees used for the RF was 100 and it wasset to adjust for class imbalance. In practice, the classimbalance adjustment meant to use the label-values to try toautomatically adjust weights inversely proportional to classfrequencies in input data.
In the MLP, the number of hidden layers was set to1000, the activation function used was ReLU, which takesthe neuron value and outputs it to max(0, value). Thisis suggested to mitigate the vanishing gradient problem,which is when neurons lose output value so that the gradientdiminishes. [13, p.4]
With regard to the SVM, an RBF kernel was used as partof the default implementation of the scikit-learn library.
F. EvaluationIn order to evaluate the model, the dataset was split 80/20
to training and test set respectively whereby the followingmetrics were then used for evaluation: accuracy and F1-score. This is due to their accepted statuses as standardperformance metrics used within the field of AI at thetechnological frontier. F1-score and accuracy are preferredover precision and recall due to difficulties in evaluating thelatter metrics against each other, whereas F1-score providesa harmonic mean that indicates in this case a more compre-hensible score to compare the results.
The classification output can be divided into true positives(TP), true negatives (TN), false positives (FP) and falsenegatives (FN). Using this, a definition for each of the metricscan be made:
1) Accuracy: Accuracy is measured by adding the truepositives and true negatives and dividing by the total. Inpractice this means to add all correct classifications anddivide over the total number of classifications.
Accuracy =TP + TN
TP + TN + FP + FN
2) F1-Score: F1-score utilizes precision and recall and iscalculated by the harmonic mean of these two. The metricsare best illustrated with an example. Precision measures howmany selected items that are relevant and recall measureshow many relevant items are selected. For this project, preci-sion and recall is regarded equally significant and important.F1-score is a means as to combine these two metrics whichputs equal significance to each of the metrics and is thereforea natural choice for the purpose of evaluation. In addition,
collecting precision and recall under a single metric makescomparisons of the results easier.
Precision(PR) =TP
TP + FP
Recall(RE) =TP
TP + FN
F1 = 2⇥ RE ⇥ PR
RE + PR
The F1-score was then weighted to account for the classimbalances in the data to make the F1-measure less biased.This is done by first calculated the F1-macro score and thenweighting for class imbalance using label-frequency. It issuggested by Van Asch that a macro-averaged score givesa better sense for small classes which is the case with thisdataset and why macro-averaged score was used.[15, p. 18]
Furthermore, a result of the class imbalance is also thatthere are some cases where there were either no data pointswith a particular label in the set or that there were nopredictions toward that label. This has been accounted forby setting the score to 0.0 in these cases as suggested byForman and Scholz. Furthermore, Forman and Scholz alsoargue that this creates a bias in the data in that it adjusts theF1-score downward and that in order to account for this, k-fold cross validation can be used. This means that the ”true”F1-score might be better than presented in the results.[16]
IV. RESULTSPresented on the following page are the results of the
training and testing with the three different classifiers. Thequestions are prefixed with 2. to reflect how the questionsare named internally at ABC. Results are presented with andwithout numerical features with regards to both accuracy andF1-score. There is also a figure on class distribution and aconfusion matrix for question 2.4.
5
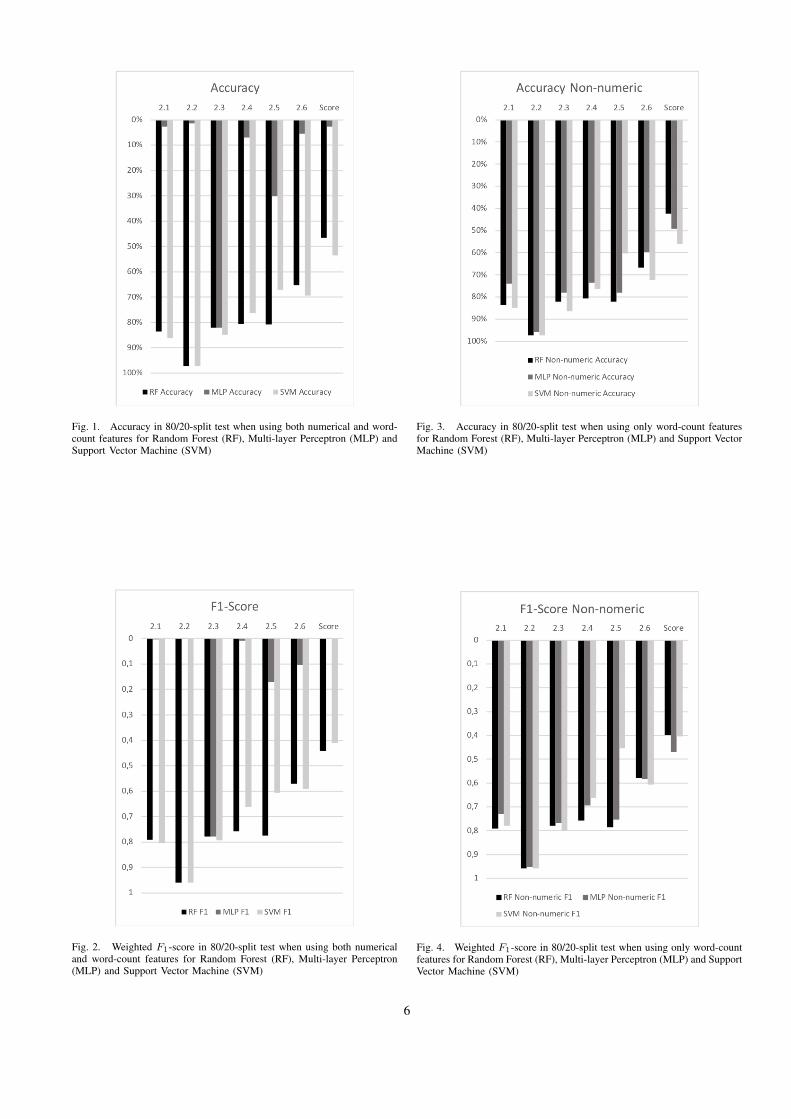
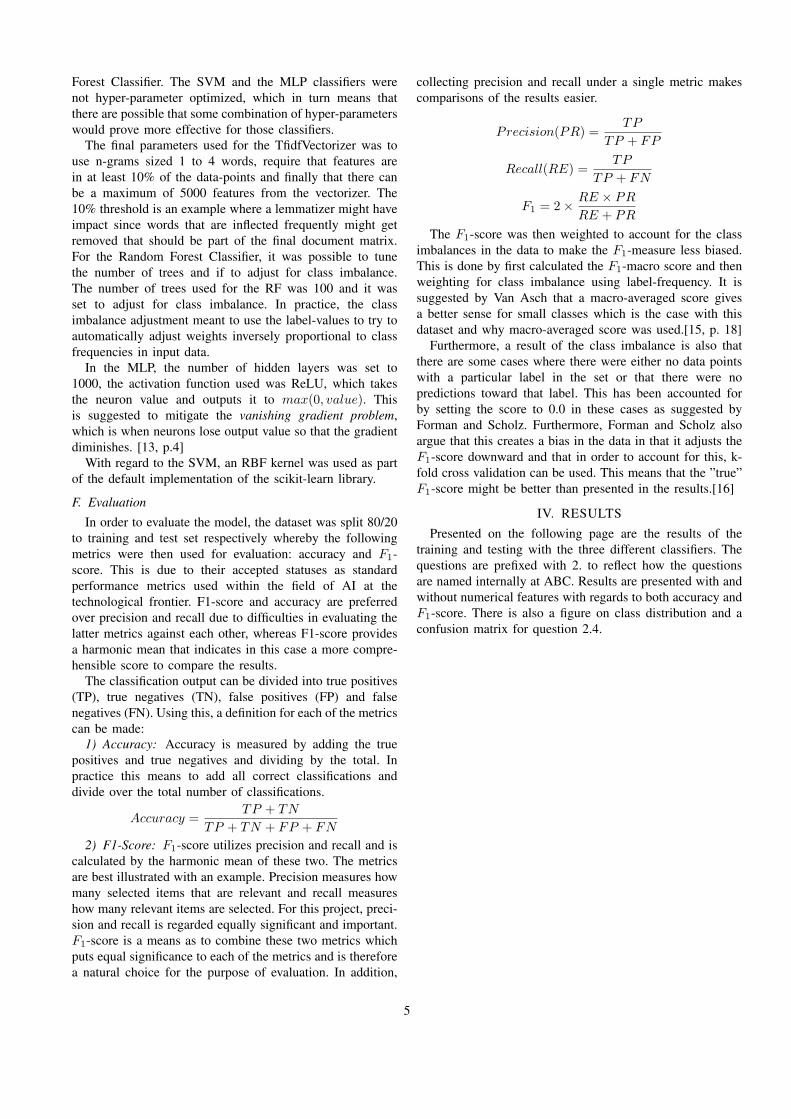
Fig. 1. Accuracy in 80/20-split test when using both numerical and word-count features for Random Forest (RF), Multi-layer Perceptron (MLP) andSupport Vector Machine (SVM)
Fig. 2. Weighted F1-score in 80/20-split test when using both numericaland word-count features for Random Forest (RF), Multi-layer Perceptron(MLP) and Support Vector Machine (SVM)
Fig. 3. Accuracy in 80/20-split test when using only word-count featuresfor Random Forest (RF), Multi-layer Perceptron (MLP) and Support VectorMachine (SVM)
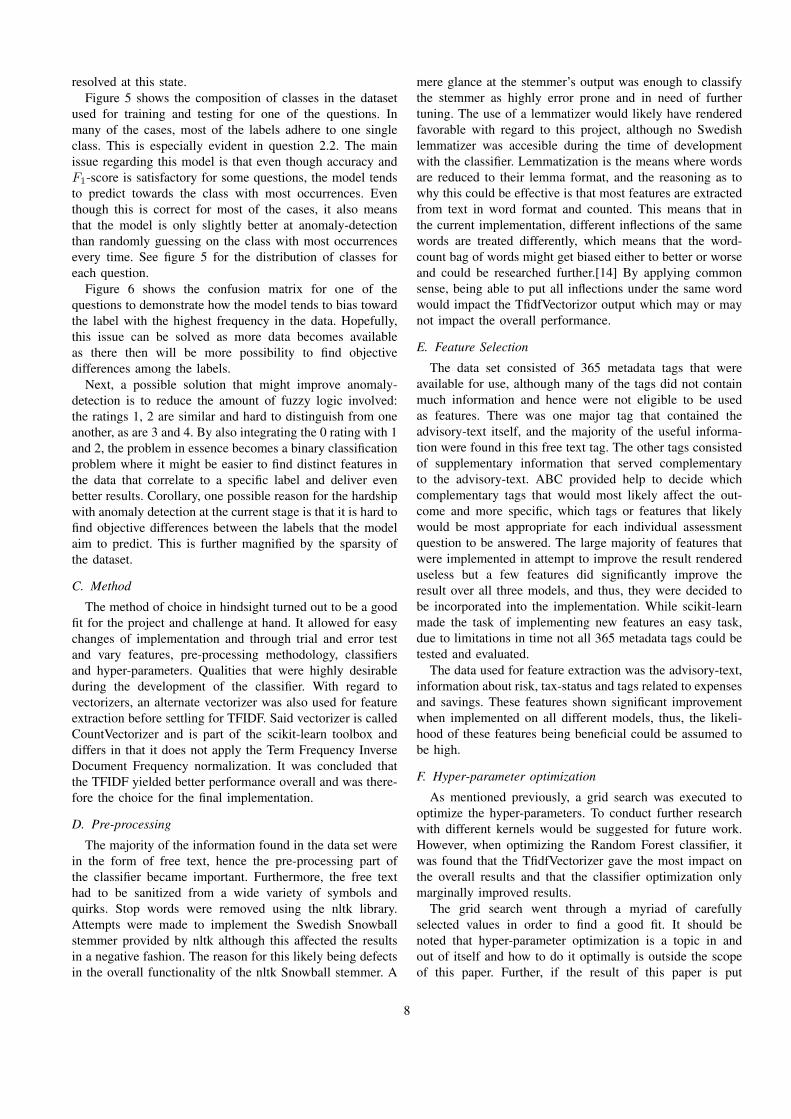
Fig. 4. Weighted F1-score in 80/20-split test when using only word-countfeatures for Random Forest (RF), Multi-layer Perceptron (MLP) and SupportVector Machine (SVM)
6
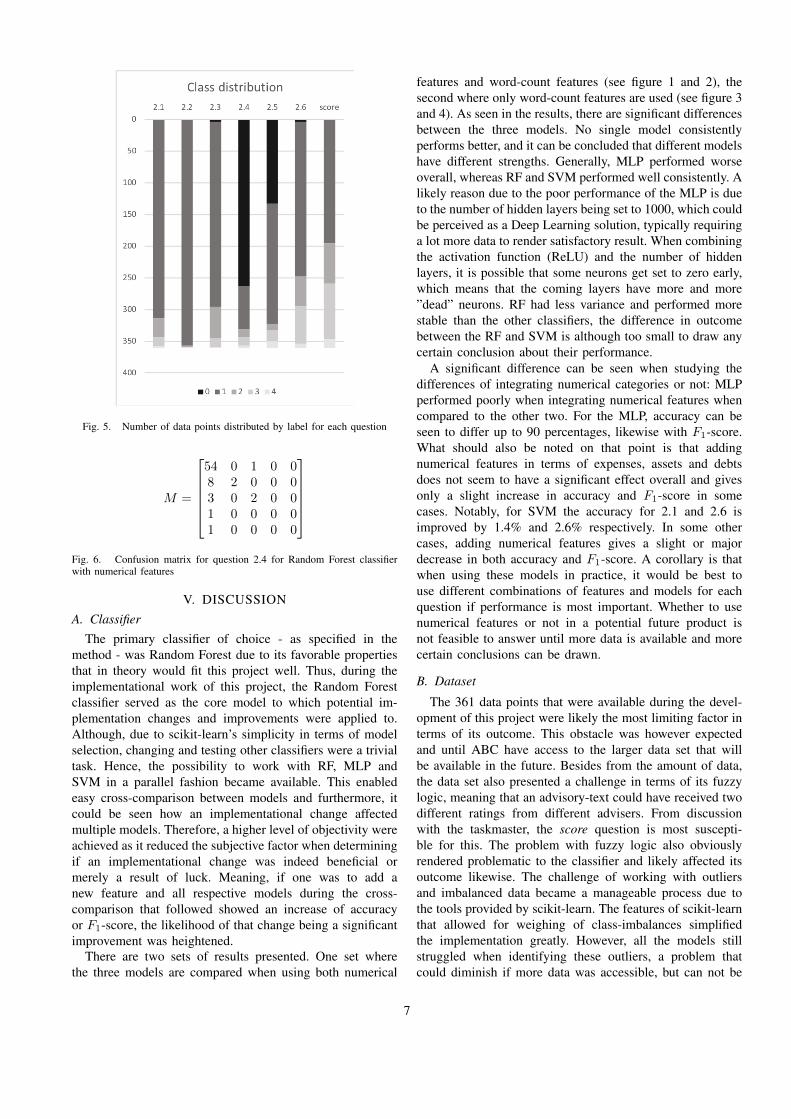
Fig. 5. Number of data points distributed by label for each question
M =
2
66664
54 0 1 0 08 2 0 0 03 0 2 0 01 0 0 0 01 0 0 0 0
3
77775
Fig. 6. Confusion matrix for question 2.4 for Random Forest classifierwith numerical features
V. DISCUSSIONA. Classifier
The primary classifier of choice - as specified in themethod - was Random Forest due to its favorable propertiesthat in theory would fit this project well. Thus, during theimplementational work of this project, the Random Forestclassifier served as the core model to which potential im-plementation changes and improvements were applied to.Although, due to scikit-learn’s simplicity in terms of modelselection, changing and testing other classifiers were a trivialtask. Hence, the possibility to work with RF, MLP andSVM in a parallel fashion became available. This enabledeasy cross-comparison between models and furthermore, itcould be seen how an implementational change affectedmultiple models. Therefore, a higher level of objectivity wereachieved as it reduced the subjective factor when determiningif an implementational change was indeed beneficial ormerely a result of luck. Meaning, if one was to add anew feature and all respective models during the cross-comparison that followed showed an increase of accuracyor F1-score, the likelihood of that change being a significantimprovement was heightened.
There are two sets of results presented. One set wherethe three models are compared when using both numerical
features and word-count features (see figure 1 and 2), thesecond where only word-count features are used (see figure 3and 4). As seen in the results, there are significant differencesbetween the three models. No single model consistentlyperforms better, and it can be concluded that different modelshave different strengths. Generally, MLP performed worseoverall, whereas RF and SVM performed well consistently. Alikely reason due to the poor performance of the MLP is dueto the number of hidden layers being set to 1000, which couldbe perceived as a Deep Learning solution, typically requiringa lot more data to render satisfactory result. When combiningthe activation function (ReLU) and the number of hiddenlayers, it is possible that some neurons get set to zero early,which means that the coming layers have more and more”dead” neurons. RF had less variance and performed morestable than the other classifiers, the difference in outcomebetween the RF and SVM is although too small to draw anycertain conclusion about their performance.
A significant difference can be seen when studying thedifferences of integrating numerical categories or not: MLPperformed poorly when integrating numerical features whencompared to the other two. For the MLP, accuracy can beseen to differ up to 90 percentages, likewise with F1-score.What should also be noted on that point is that addingnumerical features in terms of expenses, assets and debtsdoes not seem to have a significant effect overall and givesonly a slight increase in accuracy and F1-score in somecases. Notably, for SVM the accuracy for 2.1 and 2.6 isimproved by 1.4% and 2.6% respectively. In some othercases, adding numerical features gives a slight or majordecrease in both accuracy and F1-score. A corollary is thatwhen using these models in practice, it would be best touse different combinations of features and models for eachquestion if performance is most important. Whether to usenumerical features or not in a potential future product isnot feasible to answer until more data is available and morecertain conclusions can be drawn.
B. Dataset
The 361 data points that were available during the devel-opment of this project were likely the most limiting factor interms of its outcome. This obstacle was however expectedand until ABC have access to the larger data set that willbe available in the future. Besides from the amount of data,the data set also presented a challenge in terms of its fuzzylogic, meaning that an advisory-text could have received twodifferent ratings from different advisers. From discussionwith the taskmaster, the score question is most suscepti-ble for this. The problem with fuzzy logic also obviouslyrendered problematic to the classifier and likely affected itsoutcome likewise. The challenge of working with outliersand imbalanced data became a manageable process due tothe tools provided by scikit-learn. The features of scikit-learnthat allowed for weighing of class-imbalances simplifiedthe implementation greatly. However, all the models stillstruggled when identifying these outliers, a problem thatcould diminish if more data was accessible, but can not be
7
resolved at this state.Figure 5 shows the composition of classes in the dataset
used for training and testing for one of the questions. Inmany of the cases, most of the labels adhere to one singleclass. This is especially evident in question 2.2. The mainissue regarding this model is that even though accuracy andF1-score is satisfactory for some questions, the model tendsto predict towards the class with most occurrences. Eventhough this is correct for most of the cases, it also meansthat the model is only slightly better at anomaly-detectionthan randomly guessing on the class with most occurrencesevery time. See figure 5 for the distribution of classes foreach question.
Figure 6 shows the confusion matrix for one of thequestions to demonstrate how the model tends to bias towardthe label with the highest frequency in the data. Hopefully,this issue can be solved as more data becomes availableas there then will be more possibility to find objectivedifferences among the labels.
Next, a possible solution that might improve anomaly-detection is to reduce the amount of fuzzy logic involved:the ratings 1, 2 are similar and hard to distinguish from oneanother, as are 3 and 4. By also integrating the 0 rating with 1and 2, the problem in essence becomes a binary classificationproblem where it might be easier to find distinct features inthe data that correlate to a specific label and deliver evenbetter results. Corollary, one possible reason for the hardshipwith anomaly detection at the current stage is that it is hard tofind objective differences between the labels that the modelaim to predict. This is further magnified by the sparsity ofthe dataset.
C. MethodThe method of choice in hindsight turned out to be a good
fit for the project and challenge at hand. It allowed for easychanges of implementation and through trial and error testand vary features, pre-processing methodology, classifiersand hyper-parameters. Qualities that were highly desirableduring the development of the classifier. With regard tovectorizers, an alternate vectorizer was also used for featureextraction before settling for TFIDF. Said vectorizer is calledCountVectorizer and is part of the scikit-learn toolbox anddiffers in that it does not apply the Term Frequency InverseDocument Frequency normalization. It was concluded thatthe TFIDF yielded better performance overall and was there-fore the choice for the final implementation.
D. Pre-processingThe majority of the information found in the data set were
in the form of free text, hence the pre-processing part ofthe classifier became important. Furthermore, the free texthad to be sanitized from a wide variety of symbols andquirks. Stop words were removed using the nltk library.Attempts were made to implement the Swedish Snowballstemmer provided by nltk although this affected the resultsin a negative fashion. The reason for this likely being defectsin the overall functionality of the nltk Snowball stemmer. A
mere glance at the stemmer’s output was enough to classifythe stemmer as highly error prone and in need of furthertuning. The use of a lemmatizer would likely have renderedfavorable with regard to this project, although no Swedishlemmatizer was accesible during the time of developmentwith the classifier. Lemmatization is the means where wordsare reduced to their lemma format, and the reasoning as towhy this could be effective is that most features are extractedfrom text in word format and counted. This means that inthe current implementation, different inflections of the samewords are treated differently, which means that the word-count bag of words might get biased either to better or worseand could be researched further.[14] By applying commonsense, being able to put all inflections under the same wordwould impact the TfidfVectorizor output which may or maynot impact the overall performance.
E. Feature Selection
The data set consisted of 365 metadata tags that wereavailable for use, although many of the tags did not containmuch information and hence were not eligible to be usedas features. There was one major tag that contained theadvisory-text itself, and the majority of the useful informa-tion were found in this free text tag. The other tags consistedof supplementary information that served complementaryto the advisory-text. ABC provided help to decide whichcomplementary tags that would most likely affect the out-come and more specific, which tags or features that likelywould be most appropriate for each individual assessmentquestion to be answered. The large majority of features thatwere implemented in attempt to improve the result rendereduseless but a few features did significantly improve theresult over all three models, and thus, they were decided tobe incorporated into the implementation. While scikit-learnmade the task of implementing new features an easy task,due to limitations in time not all 365 metadata tags could betested and evaluated.
The data used for feature extraction was the advisory-text,information about risk, tax-status and tags related to expensesand savings. These features shown significant improvementwhen implemented on all different models, thus, the likeli-hood of these features being beneficial could be assumed tobe high.
F. Hyper-parameter optimization
As mentioned previously, a grid search was executed tooptimize the hyper-parameters. To conduct further researchwith different kernels would be suggested for future work.However, when optimizing the Random Forest classifier, itwas found that the TfidfVectorizer gave the most impact onthe overall results and that the classifier optimization onlymarginally improved results.
The grid search went through a myriad of carefullyselected values in order to find a good fit. It should benoted that hyper-parameter optimization is a topic in andout of itself and how to do it optimally is outside the scopeof this paper. Further, if the result of this paper is put
8
to practice, optimization should be done more exhaustivelyto try to squeeze every possible percentage gain in bothaccuracy and F1-score. Parameters that could be optimizedfor the TfidfVectorizer was thresholds for removing wordsfrom the corpus based on frequency, adjusting n-gram sizeand maximum feature count.
Furthermore, future work towards the end-stage of thedevelopment-stage would involve running a large-scale gridsearch to optimize and tweak the final values. However,doing this before a minimum satisfactory outcome has beenachieved may not be a priority. Having access to morepowerful hardware would indeed make this process moreefficient since as of currently, the process of running even aminor grid search is heavily time-consuming.
G. EvaluationAs mentioned, the data was split 80/20 in training set and
test set by first randomly shuffling the dataset in order totry minimize the variance. However, since the shuffling wasdone randomly, no account has been taken to ensure that theproportion of different labels are the same on both trainingand test set, which means that the results might be somewhatbiased.
K-fold cross validation was attempted in a smaller scalein order to try to see possible effects. The k-fold averagedaccuracy and F1-score would not differ significantly fromthe results given by the 80/20 split. Which indicates that theperformed 80/20 split gives a sufficient view of the modelwith regard to the current amount of data. A corollary is thatthere is bias from how the split was done. Possible furtherwork would hence be to use cross validation with differentnumber of folds in order to try minimize the bias.
Next, as suggested by Forman and Scholz, there is possi-bility of bias in the output as a result of setting the F1-scoreto 0.0 where there is no label. This bias can be minimizedby adding more data to avoid the situation where there is nolabel.
H. Black-box effectAs mentioned, in order for the model to be able to be
put into practical use, the model needs to be sufficientlytransparent so that the use can be cleared by Finansinspektio-nen. Although, as of the current implementation, none of themodels would be classified as transparent. The reasoning be-hind why the authors chose to not aim for high transparencyfrom the outset because the primary objective was to achievea satisfactory result, or in other words, a classifier thatwould significantly perform better than ABC’s current rule-based systems. Since this was not the case, further imposinganother obstacle - meaning high transparency - would likelyonly lead to increased difficulty and worse outcome.
One of the possible improvements with the current imple-mentation is to add more transparency to how predictions aremade, as currently, it is non-trivial to deduce why a particularprediction was made. A possible further work would be todevelop a tool that can create visualizations over featureimportance and use that to interactively display precisely why
a certain prediction has been made such as the aggregation ofdecision trees mentioned in section II-C. Another approachthat also could be used in order to explain the predictionsis to use the algorithm that was presented by Ribeiroet al. called LIME or Local Interpretable Model-AgnosticExplanations. The idea is to approximate the model locallyusing an interpretable model and then use the approximationto make understand the prediction and minimize the black-boxing effect.[17]
I. Change managementThe idea with the project was to determine if there is
a possibility to introduce a level of screening to ABC’sadvisory-text assessment process in order to increase qualityand to increase the resource efficiency of the firm. While thecurrent implementation would render insufficient to be set inproduction-stage it has been shown that with more data andwith more development-time, there is a high likelihood ofachieving an implementation that could fulfill ABC’s pursuitto improve the assessment process with artificial intelligence(AI) and machine learning. Furthermore, the taskmaster hasstressed that this pilot project have opened the opportunity tostart developing and implementing AI-based solutions withinthe firm. A major concern for many of the actors within ABChave been whether the time and costs spent developing AIsolutions is indeed worth the effort and resources, howeverthis project aims to illustrate that there indeed is a possibilityto achieve worthwhile result even with relatively very littleresources.
A semi-structured interview was conducted with a groupthat works with digitalization and innovation at ABC. Fromthe conducted interview, it was evident that ABC sharedthe same view with regard to some challenges with AI:it was mentioned that the business sector is filled withcomplex rules and a corollary is that enterprise solutionsoften are behind the open source community. These rulescan be related to how consumer data can be used, whichsignificantly limits the possibility of machine learning-basedsolutions. [18] This particular project has been impacted bythese rules as an inhibitor to the amount of data availablefor use.
The process of assessing advisory-texts is only one pos-sible business area of many that could be improved byAI within financial corporations. There are near infinitepossibilities where AI can be used to make firms moreefficient and decrease the use of resources. Although today,the current infrastructure and data management within theselarge corporations constitutes a major challenge since thefirms cores were developed in an age where advancedcomputing and AI were inconceivable. Thus, the internalprocesses and how data are handled are in a sense developedfor a different technological age. Patience must be practicedwith respect to this fact since a large complex system sucha financial institute does not allow for the possibility tochange overnight. While change over time is inevitable, thecurrent state of the system must be taken into account asfirms and developers aim to provide new solutions with this
9
relatively new technology. Meaning, planning to revolution-ize the whole bank-system in a single project might be aheroic pursuit, but unfeasible at the time being. A moreprogressive approach would be suggested in order to developsolutions that span sub-systems - as attempted in this project- and as results are achieved more complex tasks could beaccomplished with a higher success rate as the whole systemslowly adapts to the new technology. In the interview, itwas mentioned that the aforementioned reasoning based onsystem theory is part of how major transformation in thefinancial sector often takes place. Initiatives are started thatrange from smaller to larger scale and each success is anopportunity to progressively fixate, figuratively speaking, thetechnology to the work design and eventually become fullyintegrated in the working environment.[18]
An important question to ask is whether AI based solutionscan be trusted on a major scale, especially when it involvesmoney and sensitive data. As with the example of ABC, theaim was to implement a level of screening, helping assessorsclassify faulty advisory-text, the aim was not to replace theassessment process itself. This largely resembles the overalltrust-level to AI when dealing with these issues, which in turnlimits the gains to be made from AI solutions. However, thisis a necessary step since AI and especially domains with highpotential such as Deep Learning still resides in a rudimentarystage and may be error-prone. This is an important aspect tokeep in mind, since on the short-term, AI implementationscould actually increase costs, while its long-term potentialhas the possibility to truly revolutionize the entire systemand improve the use of resources greatly. Hence, as theexample with ABC confirms, early implementations wouldneed to be more transparent to provide the basis for trustto be built towards these automated systems. It is crucialthat this information is shared and comprehended amongthe different actors within the firm, so that resources mayinvested short-term to truly achieve these long-term benefitsthat may render a great competitive advantage to the firmversus its competitors. Meaning, to increase the knowledgewithin the firm in turn reduces the perceived level of riskwhich may heighten the likelihood of AI projects beingundertaken.
Finally, the interviewees were asked how they think AIas a field will develop within the firm in the future. Funda-mentally, ABC wants to use AI as a tool to enhance humanabilities and thus see a bright future for the field in terms ofthis pursuit. ABC illustrated this point by using a model ofa spectrum. On the far right end there are those who wantsto use AI to reduce human labor and maintain quality, hencesaving costs. In contrast, on the far left end there are thosewho wants to use AI to raise quality and maintain humanlabor. ABC find themselves on the far left end, being anenterprise where better customer interaction, human relationsand service are of great importance.[18]
J. Further AnalysisMoving onward, this project has served as a pilot-study
of what could be achieved in terms of ABC’s assessment
process. While it is incomplete in its current state, it hasthe potential to be further developed and set into production-stage. As previously mentioned, as summer approaches ABCshould have access to a large amount of advisory-texts thatwould greatly exceed the mere 361 text that are availablecurrently. A first step would simply be to train the currentmodel with the increased number of advisory-texts and ana-lyze the results. While the outcome may not be perfect, thereis a high likelihood that the classifier would be improvedgreatly. If this would not be the case, the assessment processwould need to be audited if the case is that it is simply tomany inconsistencies and human faults such as the fuzzylogic issue that makes the project an impossible pursuit.Furthermore, the model would need to be revised to confirmthere are not any issues with regards to the implementation.The former would likely pose a huge challenge and if theprocess would be improved, once again huge amounts of datawould need to be collected anew. And the latter could onlybe done if the former is false. Doing an even more exhaustivehyper-parameter optimization will also be of importance toensure the highest possible performance.
VI. CONCLUSIONWhether a machine learning based solution to ABC’s
predicament is possible that would render satisfactory resultsstill remains unknown. However, this project have shownpromising results and will likely serve its purpose as an ice-breaker for ABC to pursue further ventures within the AIdomain with greater confidence and from a larger knowledge-base to draw upon. Furthermore, the scientific question posedin the introduction is worth a revisit: How can machinelearning be applied to classify advisory-texts on a scalebetween 0-4? The project have made an attempt to answerthis question, and its ultimate implementation is an exampleof a solution. With the largest obstacle being scarce amountsof data, to answer whether this implementation is sufficientto be implemented in production-stage within ABC’s assess-ment process is not possible. If more data would not be thesolution, the next course of action would be to examine theadvisory-texts, the case could be that there are not enoughobjective differences between the texts to train a successfulclassifier.
Regardless of whether this particular projects succeedmassively or not, ABC should capitalize on the opportunityto use the project as an example of what could be done toconvince hesitant actors within the firm to invest resourcesinto similar projects. Furthermore, this project has revealedseveral improvement-areas within the overall infrastructureand communication within the firm. The most prevalent onebeing the fact that how data are handled and classified.Meaning, in order to efficiently and successfully implementAI solutions to these types of problems data would have tobe readily accessible and correctly label data from the get-go to alleviate many of the struggles that arise from solvingproblems in reverse. The industry is facing massive changesin the future, and this project is part of the technological pushto transition ABC into more digitalization and innovation.
10
REFERENCES
[1] ABC Bank. (2018) Informal conversation with IT-architects. Transcrip-tion was not available due to secrecy.
[2] Wang, X. (2014), Multi-Class Support Vector Machine.[3] Mathworks. (n.d.) ”Quadratic Programming” [Online] Available at:
https://se.mathworks.com/discovery/quadratic-programming.html. Ac-cessed at 2018-04-23
[4] Peng, W et al. (n.d.) An Implementation of ID3 — Decision TreeLearning Algorithm. University of New South Wales: Sydney.
[5] Breiman, L. (2001) Random Forests. University of California: Berke-ley.
[6] Saabas, A. (2014) Interpreting Random Forests. [Online] Available athttp://blog.datadive.net/interpreting-random-forests. Accessed at 2018-02-20
[7] Goldberg, Y. (2017) Neural Network Methods in Natural LanguageProcessing Morgan & Claypool Publishers. ISBN: 9781627052955.
[8] Guobin, O., Murphey, Y. L. (2007) Multi-class pattern classificationusing neural networks. The University of Michigan-Dearborn: Dear-born. Pattern Recognition 40 (2007):4-18.
[9] Pal, M., Mather, P.M. (2006) Support vector machines for classifica-tion in remote sensing. International Journal of Remote Sensing 26(2005):1007-1011.
[10] Madzarov, G et al. (2009) A Multi-class SVM Classifier Utilizing Bi-nary Decision Tree. Faculty of Electrical Engineering and InformationTechnology: Macedonia. Informatica 33 (2009):233-241
[11] Daz-Uriarte, R., Alvarez de Andres, S. (2006) Gene selection and clas-sification of microarray data using random forest. BMC Bioinformatics7:3 (2006). [Online]
[12] Rostamizadeh A. et al. (2017) ”Efficient Hyperparameter Optimizationand Infinitely Many Armed Bandits”. 5th International Conference onLearning Representations.
[13] Katsuna, T. (2018) ”Linearly Constrained Weights: Resolving theVanishing Gradient Problem by Reducing Angle Bias”. ICLR 2018Conference Blind Submission.
[14] D. Manning, C et al. (2009) ”Introduction to Information Retrieval”.Cambridge University Press: England.
[15] Van Asch, V. (2013) ”Macro- and micro-averaged evaluation mea-sures”. CLiPS. University of Antwerp.
[16] Forman, G., Scholz, M. (2009) ”Apples-to-Apples in Cross-ValidationStudies: Pitfalls in Classifier Performance Measurement”. HP Labora-tories. ACM SIGKDD Explorations Newsletter (2010 Volume 12 Issue1)
[17] Ribeiro, M. T. et al. (2016) ”Why Should I Trust You? Explaining thePredictions of Any Classifier”. arXiv:1602.04938v3 [cs.LG] 9 Aug2016.
[18] ABC Bank. (2018) Semi-structured interview with a group workingwith digitalization and innovation. Transcription was not available dueto secrecy.
11

TRITA EECS-EX-2018:426
www.kth.se


![A Framework for Transient Rendering - unizar.eswebdiis.unizar.es/~ajarabo/pubs/transientSIGA14/...Raskar and Davis [2008] introduce the basic theoretical frame-work in light transport](https://img.pdfslide.net/doc/110x75/5ec0aaf5aabe2214c1142a79/a-framework-for-transient-rendering-ajarabopubstransientsiga14-raskar-and.jpg)


![Instant Volume Visualization using Maximum Intensity ......ume rendering technique inspired by ghosted views. Rezk-Salama and Kolb [RSK06] introduce opacity peeling for the extraction](https://img.pdfslide.net/doc/110x75/5f9d34c0b9180e2dfa04029e/instant-volume-visualization-using-maximum-intensity-ume-rendering-technique.jpg)